Zip Codes with the Highest Percentage of Population Employed in Legal Services & Support in Grass Valley, CA
RELATED REPORTS & OPTIONS
Legal Services & Support
Grass Valley
Compare Zip Codes
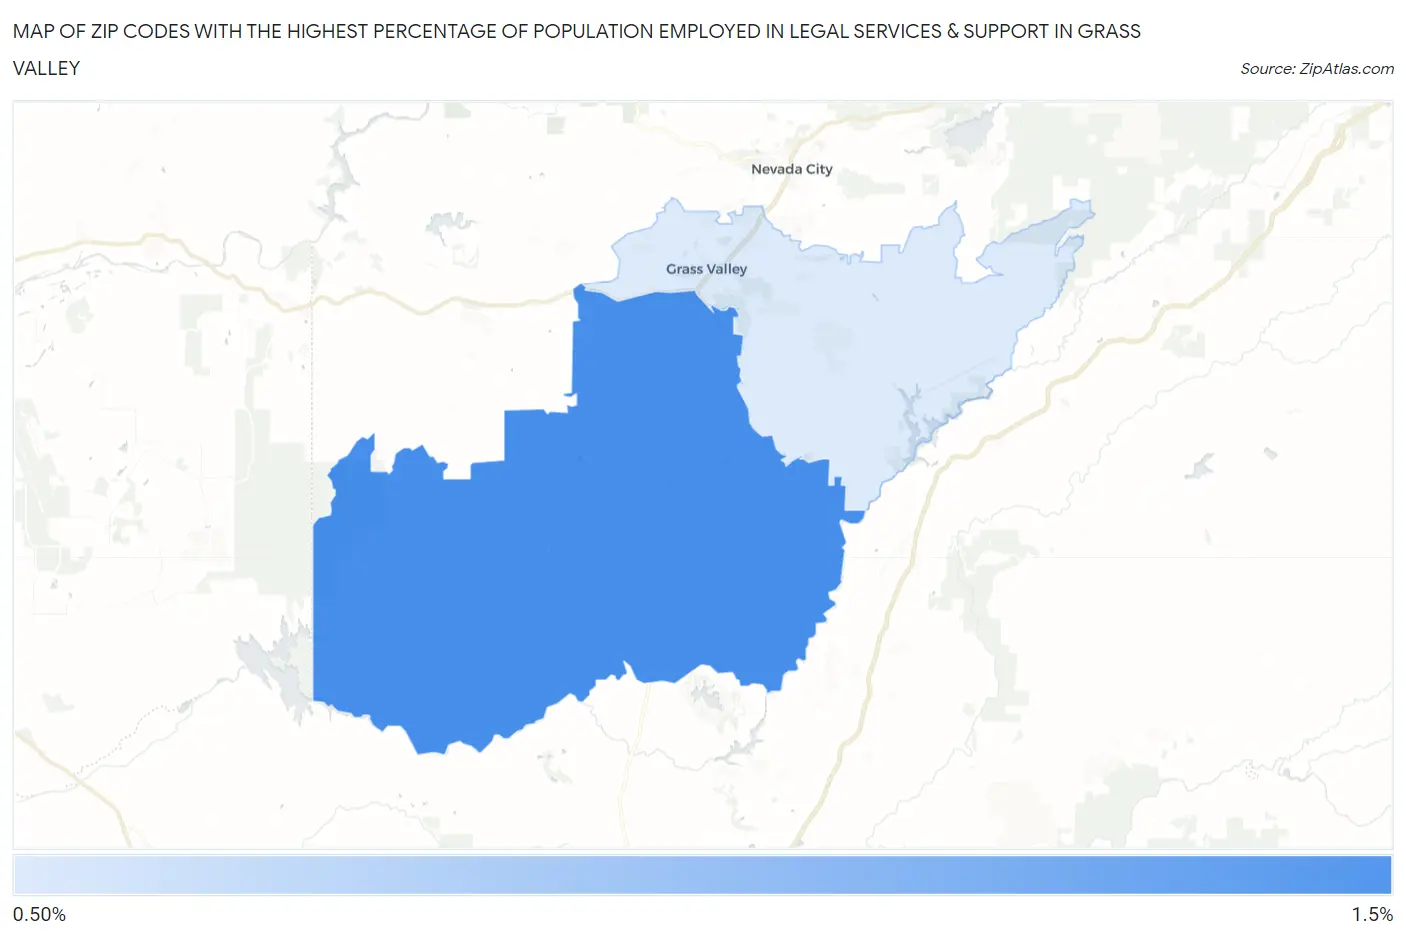
Map of Zip Codes with the Highest Percentage of Population Employed in Legal Services & Support in Grass Valley
0.57%
1.0%
Zip Codes with the Highest Percentage of Population Employed in Legal Services & Support in Grass Valley, CA
| Zip Code | % Employed | vs State | vs National | |
| 1. | 95949 | 1.0% | 1.3%(-0.219)#616 | 1.2%(-0.145)#7,552 |
| 2. | 95945 | 0.57% | 1.3%(-0.687)#879 | 1.2%(-0.613)#11,805 |
1
Common Questions
What are the Top Zip Codes with the Highest Percentage of Population Employed in Legal Services & Support in Grass Valley, CA?
Top Zip Codes with the Highest Percentage of Population Employed in Legal Services & Support in Grass Valley, CA are:
What zip code has the Highest Percentage of Population Employed in Legal Services & Support in Grass Valley, CA?
95949 has the Highest Percentage of Population Employed in Legal Services & Support in Grass Valley, CA with 1.0%.
What is the Percentage of Population Employed in Legal Services & Support in Grass Valley, CA?
Percentage of Population Employed in Legal Services & Support in Grass Valley is 0.42%.
What is the Percentage of Population Employed in Legal Services & Support in California?
Percentage of Population Employed in Legal Services & Support in California is 1.3%.
What is the Percentage of Population Employed in Legal Services & Support in the United States?
Percentage of Population Employed in Legal Services & Support in the United States is 1.2%.