Zip Codes with the Highest Percentage of Population Employed in Legal Services & Support in Monterey Park, CA
RELATED REPORTS & OPTIONS
Legal Services & Support
Monterey Park
Compare Zip Codes
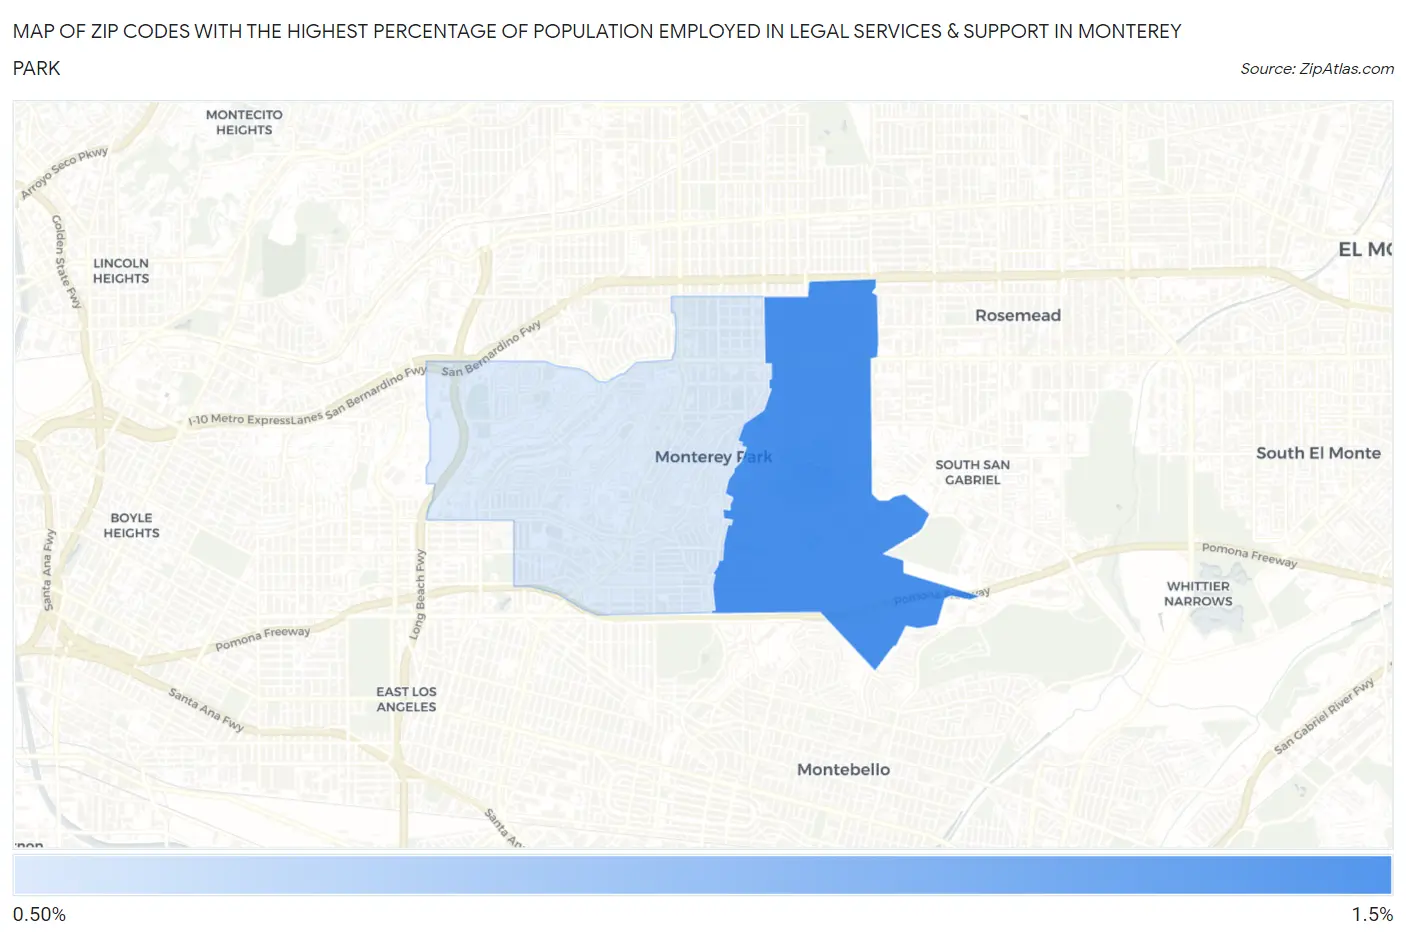
Map of Zip Codes with the Highest Percentage of Population Employed in Legal Services & Support in Monterey Park
1.2%
1.2%
Zip Codes with the Highest Percentage of Population Employed in Legal Services & Support in Monterey Park, CA
| Zip Code | % Employed | vs State | vs National | |
| 1. | 91755 | 1.2% | 1.3%(-0.082)#550 | 1.2%(-0.008)#6,673 |
| 2. | 91754 | 1.2% | 1.3%(-0.102)#557 | 1.2%(-0.028)#6,787 |
1
Common Questions
What are the Top Zip Codes with the Highest Percentage of Population Employed in Legal Services & Support in Monterey Park, CA?
Top Zip Codes with the Highest Percentage of Population Employed in Legal Services & Support in Monterey Park, CA are:
What zip code has the Highest Percentage of Population Employed in Legal Services & Support in Monterey Park, CA?
91755 has the Highest Percentage of Population Employed in Legal Services & Support in Monterey Park, CA with 1.2%.
What is the Percentage of Population Employed in Legal Services & Support in Monterey Park, CA?
Percentage of Population Employed in Legal Services & Support in Monterey Park is 1.2%.
What is the Percentage of Population Employed in Legal Services & Support in California?
Percentage of Population Employed in Legal Services & Support in California is 1.3%.
What is the Percentage of Population Employed in Legal Services & Support in the United States?
Percentage of Population Employed in Legal Services & Support in the United States is 1.2%.