Cities with the Highest Percentage of Population Employed in Legal Services & Support in North Carolina
RELATED REPORTS & OPTIONS
Legal Services & Support
North Carolina
Compare Cities
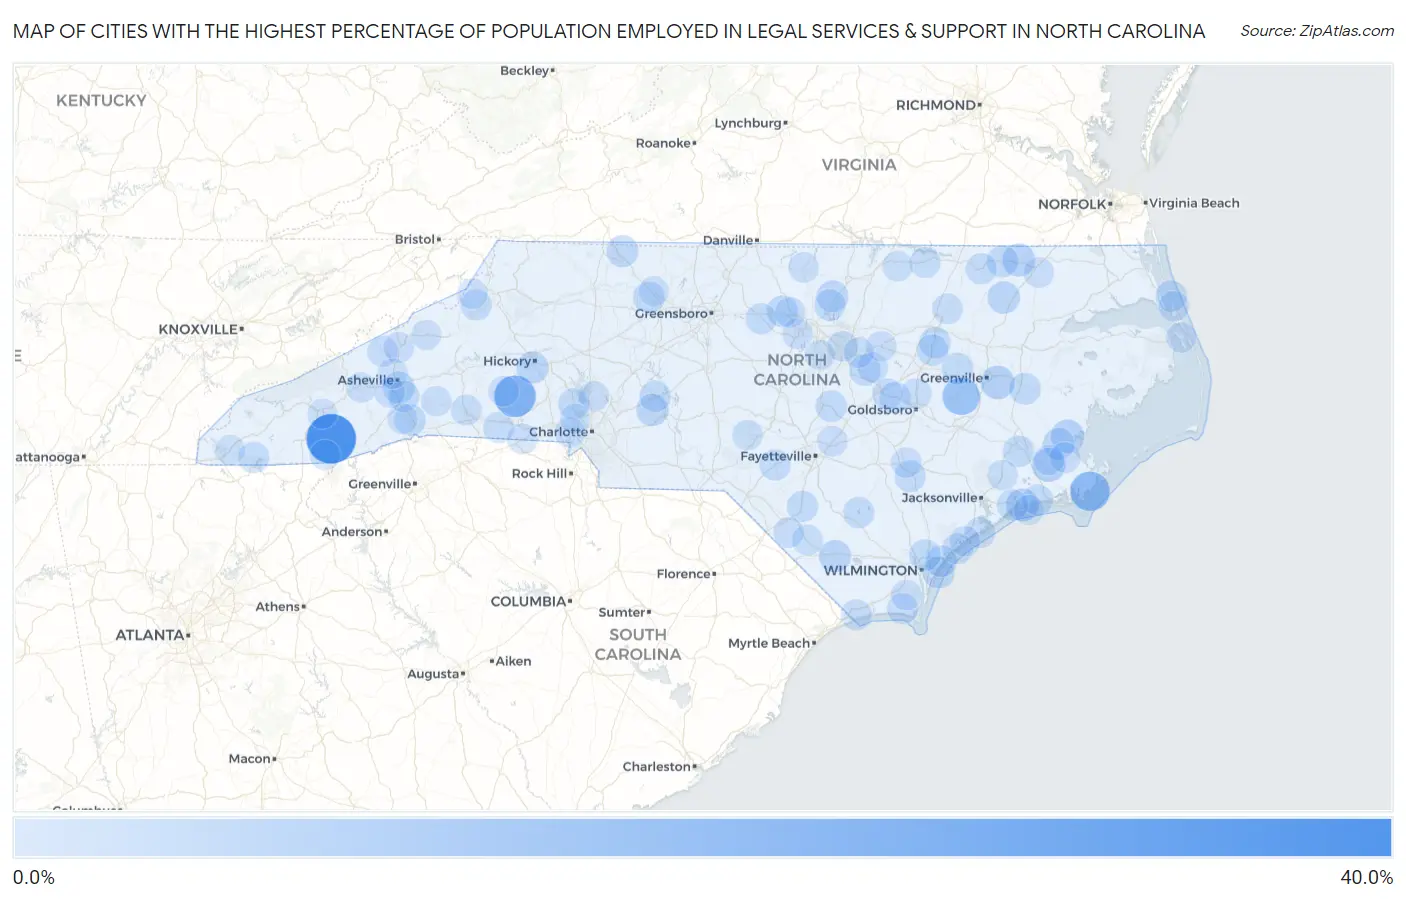
Map of Cities with the Highest Percentage of Population Employed in Legal Services & Support in North Carolina
0.0%
40.0%
Cities with the Highest Percentage of Population Employed in Legal Services & Support in North Carolina
| City | % Employed | vs State | vs National | |
| 1. | Glenville | 34.2% | 0.86%(+33.4)#1 | 1.2%(+33.1)#21 |
| 2. | Belwood | 20.3% | 0.86%(+19.5)#2 | 1.2%(+19.2)#54 |
| 3. | Davis | 16.9% | 0.86%(+16.0)#3 | 1.2%(+15.7)#82 |
| 4. | Maury | 13.5% | 0.86%(+12.7)#4 | 1.2%(+12.4)#128 |
| 5. | Minnesott Beach | 7.1% | 0.86%(+6.19)#5 | 1.2%(+5.87)#436 |
| 6. | Simpson | 7.0% | 0.86%(+6.14)#6 | 1.2%(+5.82)#442 |
| 7. | Vandemere | 6.7% | 0.86%(+5.80)#7 | 1.2%(+5.48)#480 |
| 8. | Murfreesboro | 5.9% | 0.86%(+5.08)#8 | 1.2%(+4.76)#615 |
| 9. | Cape Carteret | 5.6% | 0.86%(+4.74)#9 | 1.2%(+4.42)#684 |
| 10. | Kelford | 5.2% | 0.86%(+4.31)#10 | 1.2%(+3.99)#800 |
| 11. | Whiteville | 5.0% | 0.86%(+4.12)#11 | 1.2%(+3.80)#846 |
| 12. | Millingport | 4.9% | 0.86%(+4.04)#12 | 1.2%(+3.72)#867 |
| 13. | Mountain View | 4.6% | 0.86%(+3.71)#13 | 1.2%(+3.39)#992 |
| 14. | Biltmore Forest | 4.4% | 0.86%(+3.57)#14 | 1.2%(+3.25)#1,038 |
| 15. | Flat Rock | 4.2% | 0.86%(+3.36)#15 | 1.2%(+3.04)#1,118 |
| 16. | Wrightsville Beach | 4.2% | 0.86%(+3.29)#16 | 1.2%(+2.97)#1,155 |
| 17. | Stonewall | 4.1% | 0.86%(+3.25)#17 | 1.2%(+2.93)#1,173 |
| 18. | Stem | 4.0% | 0.86%(+3.17)#18 | 1.2%(+2.85)#1,212 |
| 19. | Porters Neck | 3.9% | 0.86%(+3.03)#19 | 1.2%(+2.71)#1,284 |
| 20. | Conway | 3.9% | 0.86%(+3.03)#20 | 1.2%(+2.71)#1,285 |
| 21. | Bethania | 3.9% | 0.86%(+3.01)#21 | 1.2%(+2.69)#1,293 |
| 22. | Washington Park | 3.9% | 0.86%(+3.00)#22 | 1.2%(+2.68)#1,297 |
| 23. | Fountain | 3.8% | 0.86%(+2.98)#23 | 1.2%(+2.66)#1,307 |
| 24. | Buies Creek | 3.8% | 0.86%(+2.95)#24 | 1.2%(+2.63)#1,318 |
| 25. | Skippers Corner | 3.8% | 0.86%(+2.91)#25 | 1.2%(+2.59)#1,335 |
| 26. | Trent Woods | 3.7% | 0.86%(+2.80)#26 | 1.2%(+2.48)#1,423 |
| 27. | Butner | 3.6% | 0.86%(+2.76)#27 | 1.2%(+2.45)#1,446 |
| 28. | Magnolia | 3.6% | 0.86%(+2.73)#28 | 1.2%(+2.41)#1,464 |
| 29. | Barker Heights | 3.6% | 0.86%(+2.72)#29 | 1.2%(+2.40)#1,472 |
| 30. | Misenheimer | 3.6% | 0.86%(+2.71)#30 | 1.2%(+2.39)#1,479 |
| 31. | Clayton | 3.6% | 0.86%(+2.70)#31 | 1.2%(+2.38)#1,490 |
| 32. | Briar Chapel | 3.5% | 0.86%(+2.67)#32 | 1.2%(+2.35)#1,510 |
| 33. | Sharpsburg | 3.5% | 0.86%(+2.66)#33 | 1.2%(+2.34)#1,516 |
| 34. | Duck | 3.5% | 0.86%(+2.66)#34 | 1.2%(+2.34)#1,518 |
| 35. | Efland | 3.5% | 0.86%(+2.64)#35 | 1.2%(+2.32)#1,530 |
| 36. | Elm City | 3.4% | 0.86%(+2.58)#36 | 1.2%(+2.26)#1,571 |
| 37. | Swepsonville | 3.2% | 0.86%(+2.37)#37 | 1.2%(+2.05)#1,731 |
| 38. | White Lake | 3.2% | 0.86%(+2.32)#38 | 1.2%(+2.00)#1,767 |
| 39. | Royal Pines | 3.2% | 0.86%(+2.32)#39 | 1.2%(+2.00)#1,774 |
| 40. | Princeton | 3.1% | 0.86%(+2.25)#40 | 1.2%(+1.93)#1,830 |
| 41. | Lowesville | 3.1% | 0.86%(+2.22)#41 | 1.2%(+1.90)#1,847 |
| 42. | Sugar Mountain | 3.1% | 0.86%(+2.19)#42 | 1.2%(+1.87)#1,873 |
| 43. | Broad Creek | 3.0% | 0.86%(+2.18)#43 | 1.2%(+1.86)#1,884 |
| 44. | Swansboro | 3.0% | 0.86%(+2.17)#44 | 1.2%(+1.85)#1,889 |
| 45. | Jackson | 3.0% | 0.86%(+2.16)#45 | 1.2%(+1.84)#1,908 |
| 46. | Raeford | 3.0% | 0.86%(+2.12)#46 | 1.2%(+1.80)#1,948 |
| 47. | Barker Ten Mile | 3.0% | 0.86%(+2.12)#47 | 1.2%(+1.80)#1,951 |
| 48. | Hayesville | 2.9% | 0.86%(+2.08)#48 | 1.2%(+1.76)#1,994 |
| 49. | Sunset Beach | 2.8% | 0.86%(+1.98)#49 | 1.2%(+1.66)#2,079 |
| 50. | St James | 2.8% | 0.86%(+1.92)#50 | 1.2%(+1.60)#2,144 |
| 51. | Boiling Springs | 2.7% | 0.86%(+1.88)#51 | 1.2%(+1.57)#2,188 |
| 52. | Littleton | 2.7% | 0.86%(+1.82)#52 | 1.2%(+1.50)#2,249 |
| 53. | North Topsail Beach | 2.6% | 0.86%(+1.78)#53 | 1.2%(+1.46)#2,293 |
| 54. | Topsail Beach | 2.6% | 0.86%(+1.74)#54 | 1.2%(+1.42)#2,345 |
| 55. | Marshall | 2.4% | 0.86%(+1.57)#55 | 1.2%(+1.26)#2,520 |
| 56. | Whitakers | 2.4% | 0.86%(+1.53)#56 | 1.2%(+1.21)#2,594 |
| 57. | Ruth | 2.4% | 0.86%(+1.49)#57 | 1.2%(+1.17)#2,647 |
| 58. | Boardman | 2.3% | 0.86%(+1.44)#58 | 1.2%(+1.12)#2,710 |
| 59. | Archer Lodge | 2.3% | 0.86%(+1.41)#59 | 1.2%(+1.09)#2,747 |
| 60. | Chapel Hill | 2.3% | 0.86%(+1.41)#60 | 1.2%(+1.09)#2,753 |
| 61. | Pikeville | 2.2% | 0.86%(+1.38)#61 | 1.2%(+1.06)#2,801 |
| 62. | Arapahoe | 2.2% | 0.86%(+1.36)#62 | 1.2%(+1.04)#2,844 |
| 63. | Casar | 2.2% | 0.86%(+1.31)#63 | 1.2%(+0.990)#2,917 |
| 64. | Pine Level | 2.1% | 0.86%(+1.27)#64 | 1.2%(+0.950)#2,982 |
| 65. | Oriental | 2.1% | 0.86%(+1.25)#65 | 1.2%(+0.926)#3,019 |
| 66. | Davidson | 2.1% | 0.86%(+1.22)#66 | 1.2%(+0.905)#3,061 |
| 67. | Grover | 2.1% | 0.86%(+1.21)#67 | 1.2%(+0.889)#3,088 |
| 68. | Mars Hill | 2.1% | 0.86%(+1.19)#68 | 1.2%(+0.874)#3,115 |
| 69. | Fairmont | 2.0% | 0.86%(+1.16)#69 | 1.2%(+0.839)#3,169 |
| 70. | Hillsborough | 2.0% | 0.86%(+1.14)#70 | 1.2%(+0.824)#3,202 |
| 71. | Southern Shores | 2.0% | 0.86%(+1.14)#71 | 1.2%(+0.823)#3,204 |
| 72. | Wade | 2.0% | 0.86%(+1.12)#72 | 1.2%(+0.796)#3,255 |
| 73. | Pinehurst | 2.0% | 0.86%(+1.10)#73 | 1.2%(+0.780)#3,281 |
| 74. | Surf City | 1.9% | 0.86%(+1.09)#74 | 1.2%(+0.765)#3,311 |
| 75. | Zebulon | 1.9% | 0.86%(+1.08)#75 | 1.2%(+0.762)#3,317 |
| 76. | Warsaw | 1.9% | 0.86%(+1.08)#76 | 1.2%(+0.759)#3,322 |
| 77. | Bent Creek | 1.9% | 0.86%(+1.06)#77 | 1.2%(+0.744)#3,347 |
| 78. | Roxboro | 1.9% | 0.86%(+1.05)#78 | 1.2%(+0.731)#3,371 |
| 79. | Boiling Spring Lakes | 1.9% | 0.86%(+1.02)#79 | 1.2%(+0.697)#3,450 |
| 80. | Cofield | 1.9% | 0.86%(+1.01)#80 | 1.2%(+0.691)#3,469 |
| 81. | Raleigh | 1.9% | 0.86%(+0.991)#81 | 1.2%(+0.671)#3,499 |
| 82. | Belmont | 1.9% | 0.86%(+0.989)#82 | 1.2%(+0.669)#3,504 |
| 83. | Warrenton | 1.9% | 0.86%(+0.988)#83 | 1.2%(+0.668)#3,506 |
| 84. | Maysville | 1.8% | 0.86%(+0.982)#84 | 1.2%(+0.662)#3,524 |
| 85. | Lake Lure | 1.8% | 0.86%(+0.966)#85 | 1.2%(+0.646)#3,566 |
| 86. | Knightdale | 1.8% | 0.86%(+0.963)#86 | 1.2%(+0.644)#3,575 |
| 87. | Manteo | 1.8% | 0.86%(+0.932)#87 | 1.2%(+0.613)#3,653 |
| 88. | West Canton | 1.7% | 0.86%(+0.884)#88 | 1.2%(+0.564)#3,757 |
| 89. | Highlands | 1.7% | 0.86%(+0.863)#89 | 1.2%(+0.544)#3,804 |
| 90. | Beech Mountain | 1.7% | 0.86%(+0.854)#90 | 1.2%(+0.534)#3,838 |
| 91. | Woodfin | 1.7% | 0.86%(+0.846)#91 | 1.2%(+0.526)#3,862 |
| 92. | Laurel Park | 1.6% | 0.86%(+0.755)#92 | 1.2%(+0.435)#4,067 |
| 93. | Rural Hall | 1.6% | 0.86%(+0.747)#93 | 1.2%(+0.427)#4,090 |
| 94. | Murphy | 1.6% | 0.86%(+0.740)#94 | 1.2%(+0.420)#4,113 |
| 95. | Governors | 1.6% | 0.86%(+0.702)#95 | 1.2%(+0.382)#4,208 |
| 96. | Burnsville | 1.6% | 0.86%(+0.690)#96 | 1.2%(+0.370)#4,241 |
| 97. | Emerald Isle | 1.5% | 0.86%(+0.670)#97 | 1.2%(+0.351)#4,300 |
| 98. | Cary | 1.5% | 0.86%(+0.642)#98 | 1.2%(+0.323)#4,391 |
| 99. | Mount Holly | 1.5% | 0.86%(+0.639)#99 | 1.2%(+0.319)#4,400 |
| 100. | Webster | 1.5% | 0.86%(+0.628)#100 | 1.2%(+0.309)#4,429 |
Common Questions
What are the Top 10 Cities with the Highest Percentage of Population Employed in Legal Services & Support in North Carolina?
Top 10 Cities with the Highest Percentage of Population Employed in Legal Services & Support in North Carolina are:
#1
34.2%
#2
20.3%
#3
16.9%
#4
13.5%
#5
7.1%
#6
7.0%
#7
6.7%
#8
5.9%
#9
5.6%
#10
5.2%
What city has the Highest Percentage of Population Employed in Legal Services & Support in North Carolina?
Glenville has the Highest Percentage of Population Employed in Legal Services & Support in North Carolina with 34.2%.
What is the Percentage of Population Employed in Legal Services & Support in the State of North Carolina?
Percentage of Population Employed in Legal Services & Support in North Carolina is 0.86%.
What is the Percentage of Population Employed in Legal Services & Support in the United States?
Percentage of Population Employed in Legal Services & Support in the United States is 1.2%.