Stevinson, CA Map & Demographics
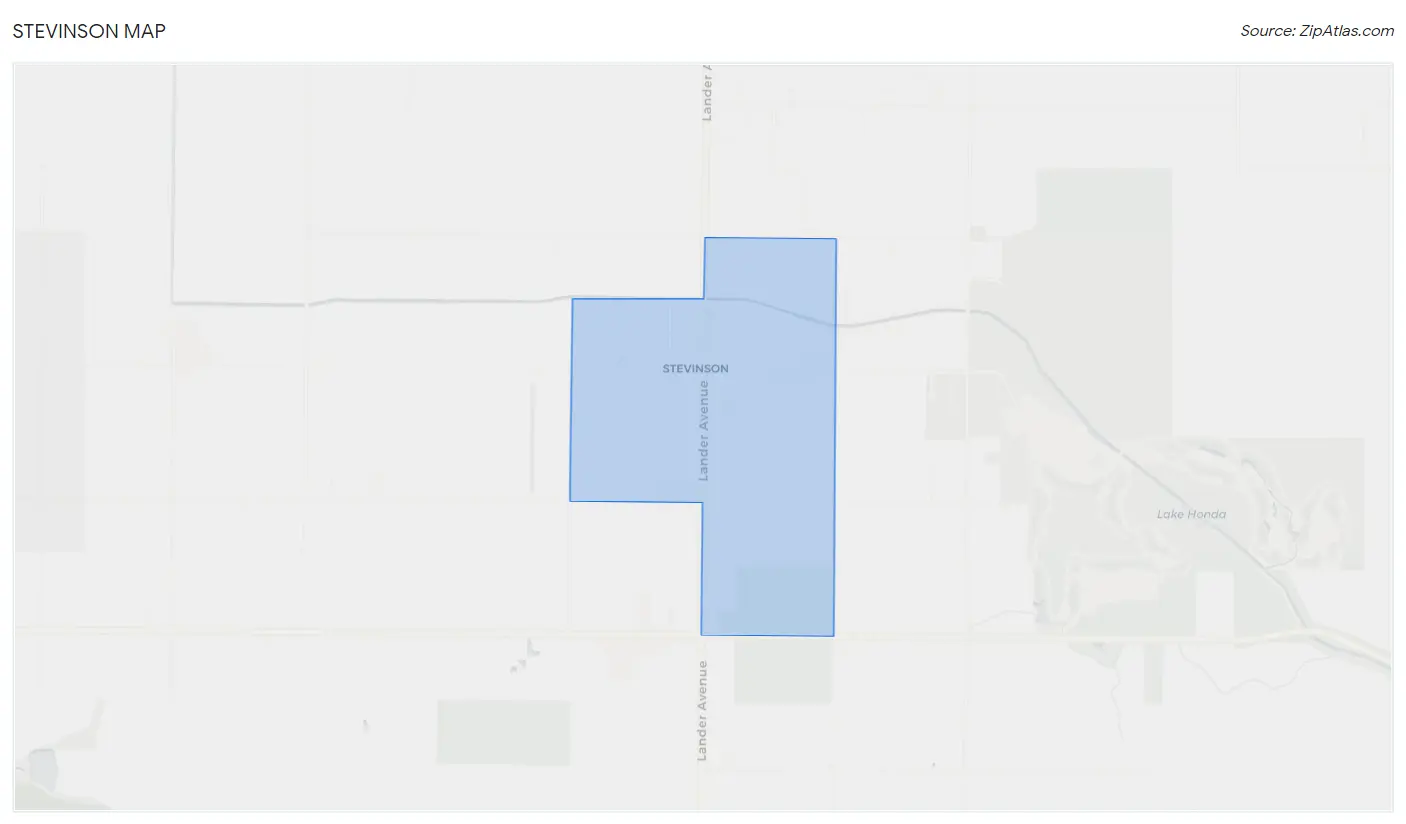
Stevinson Map
Stevinson Overview
$52,736
PER CAPITA INCOME
$118,667
AVG HOUSEHOLD INCOME
0.34
INEQUALITY / GINI INDEX
132
TOTAL POPULATION
72
MALE POPULATION
60
FEMALE POPULATION
120.00
MALES / 100 FEMALES
83.33
FEMALES / 100 MALES
38.9
MEDIAN AGE
3.8
AVG FAMILY SIZE
3.3
AVG HOUSEHOLD SIZE
54
LABOR FORCE [ PEOPLE ]
57.4%
PERCENT IN LABOR FORCE
3.7%
UNEMPLOYMENT RATE
Stevinson Zip Codes
Stevinson Area Codes
Income in Stevinson
Income Overview in Stevinson
| Characteristic | Number | Measure |
| Per Capita Income | 132 | $52,736 |
| Median Family Income | 33 | $0 |
| Mean Family Income | 33 | $159,324 |
| Median Household Income | 40 | $118,667 |
| Mean Household Income | 40 | $141,998 |
| Income Deficit | 33 | $0 |
| Wage / Income Gap (%) | 132 | 0.00% |
| Wage / Income Gap ($) | 132 | 100.00¢ per $1 |
| Gini / Inequality Index | 132 | 0.34 |
Earnings by Sex in Stevinson
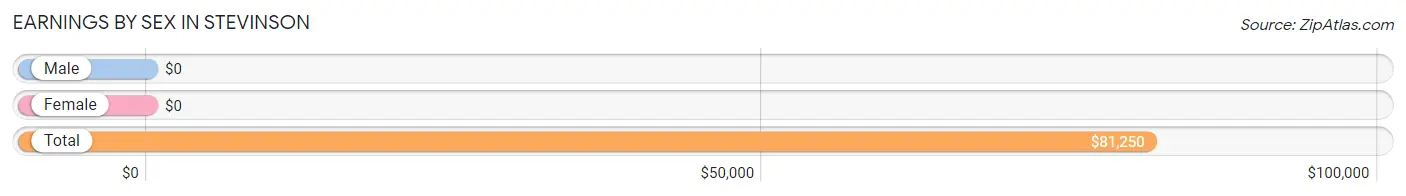
| Sex | Number | Average Earnings |
| Male | 28 (51.8%) | $0 |
| Female | 26 (48.1%) | $0 |
| Total | 54 (100.0%) | $81,250 |
Earnings by Sex by Income Bracket in Stevinson
The most common earnings brackets in Stevinson are $100,000+ for men (27 | 96.4%) and $7,500 to $9,999 for women (15 | 57.7%).
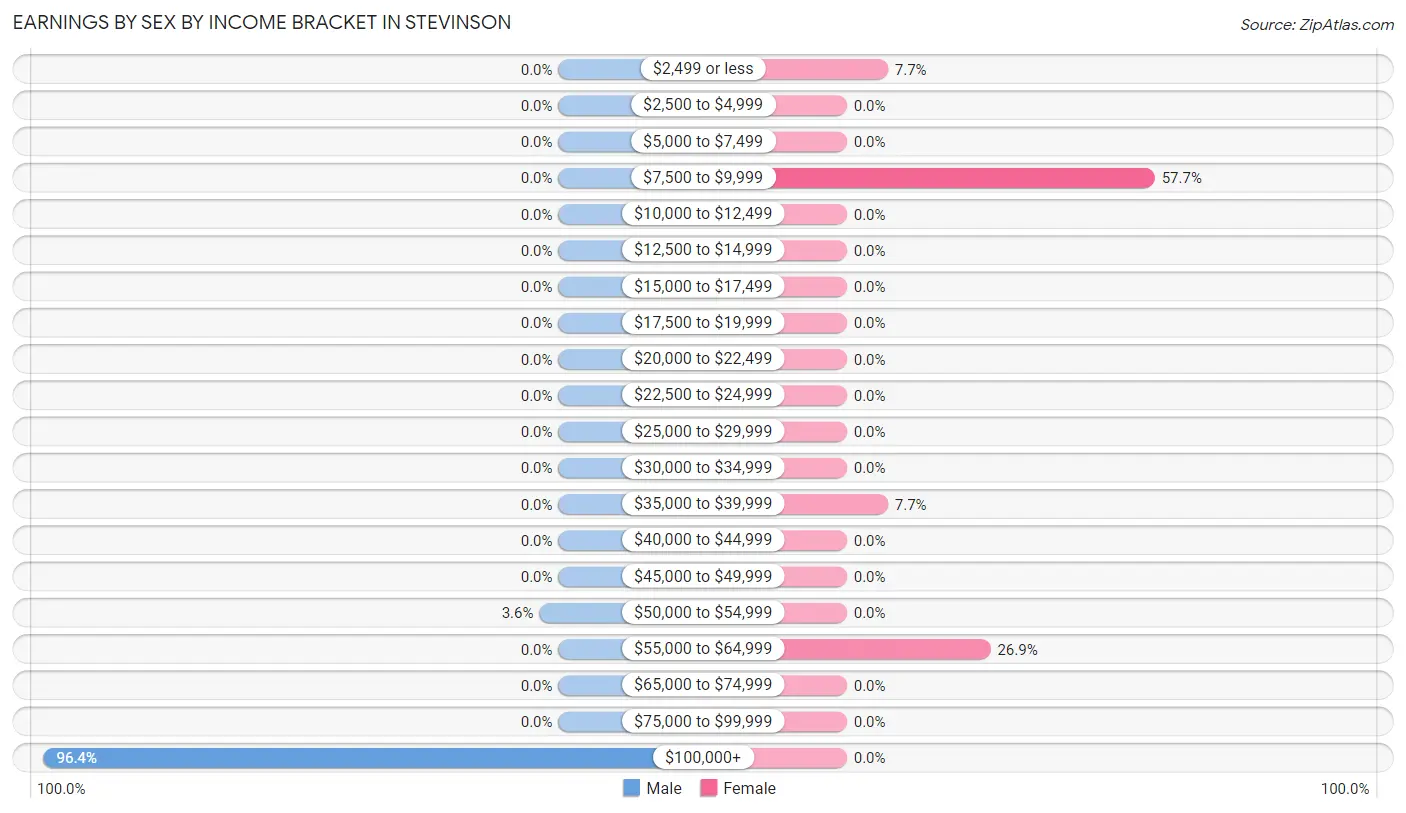
| Income | Male | Female |
| $2,499 or less | 0 (0.0%) | 2 (7.7%) |
| $2,500 to $4,999 | 0 (0.0%) | 0 (0.0%) |
| $5,000 to $7,499 | 0 (0.0%) | 0 (0.0%) |
| $7,500 to $9,999 | 0 (0.0%) | 15 (57.7%) |
| $10,000 to $12,499 | 0 (0.0%) | 0 (0.0%) |
| $12,500 to $14,999 | 0 (0.0%) | 0 (0.0%) |
| $15,000 to $17,499 | 0 (0.0%) | 0 (0.0%) |
| $17,500 to $19,999 | 0 (0.0%) | 0 (0.0%) |
| $20,000 to $22,499 | 0 (0.0%) | 0 (0.0%) |
| $22,500 to $24,999 | 0 (0.0%) | 0 (0.0%) |
| $25,000 to $29,999 | 0 (0.0%) | 0 (0.0%) |
| $30,000 to $34,999 | 0 (0.0%) | 0 (0.0%) |
| $35,000 to $39,999 | 0 (0.0%) | 2 (7.7%) |
| $40,000 to $44,999 | 0 (0.0%) | 0 (0.0%) |
| $45,000 to $49,999 | 0 (0.0%) | 0 (0.0%) |
| $50,000 to $54,999 | 1 (3.6%) | 0 (0.0%) |
| $55,000 to $64,999 | 0 (0.0%) | 7 (26.9%) |
| $65,000 to $74,999 | 0 (0.0%) | 0 (0.0%) |
| $75,000 to $99,999 | 0 (0.0%) | 0 (0.0%) |
| $100,000+ | 27 (96.4%) | 0 (0.0%) |
| Total | 28 (100.0%) | 26 (100.0%) |
Earnings by Sex by Educational Attainment in Stevinson
| Educational Attainment | Male Income | Female Income |
| Less than High School | - | - |
| High School Diploma | - | - |
| College or Associate's Degree | - | - |
| Bachelor's Degree | - | - |
| Graduate Degree | - | - |
| Total | - | - |
Family Income in Stevinson
Family Income Brackets in Stevinson
According to the Stevinson family income data, there are 15 families falling into the $100,000 to $149,999 income range, which is the most common income bracket and makes up 45.5% of all families.
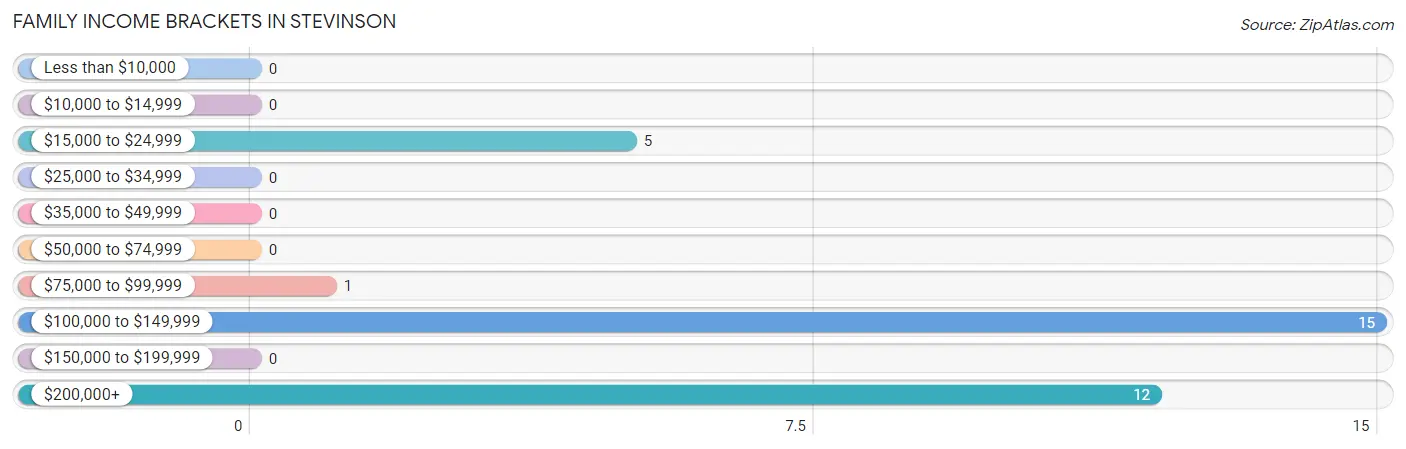
| Income Bracket | # Families | % Families |
| Less than $10,000 | 0 | 0.0% |
| $10,000 to $14,999 | 0 | 0.0% |
| $15,000 to $24,999 | 5 | 15.2% |
| $25,000 to $34,999 | 0 | 0.0% |
| $35,000 to $49,999 | 0 | 0.0% |
| $50,000 to $74,999 | 0 | 0.0% |
| $75,000 to $99,999 | 1 | 3.0% |
| $100,000 to $149,999 | 15 | 45.5% |
| $150,000 to $199,999 | 0 | 0.0% |
| $200,000+ | 12 | 36.4% |
Family Income by Famaliy Size in Stevinson
| Income Bracket | # Families | Median Income |
| 2-Person Families | 17 (51.5%) | $0 |
| 3-Person Families | 0 (0.0%) | $0 |
| 4-Person Families | 15 (45.5%) | $0 |
| 5-Person Families | 0 (0.0%) | $0 |
| 6-Person Families | 0 (0.0%) | $0 |
| 7+ Person Families | 1 (3.0%) | $0 |
| Total | 33 (100.0%) | $0 |
Family Income by Number of Earners in Stevinson
| Number of Earners | # Families | Median Income |
| No Earners | 17 (51.5%) | $0 |
| 1 Earner | 0 (0.0%) | $0 |
| 2 Earners | 15 (45.5%) | $0 |
| 3+ Earners | 1 (3.0%) | $0 |
| Total | 33 (100.0%) | $0 |
Household Income in Stevinson
Household Income Brackets in Stevinson
With 15 households falling in the category, the $100,000 to $149,999 income range is the most frequent in Stevinson, accounting for 37.5% of all households.
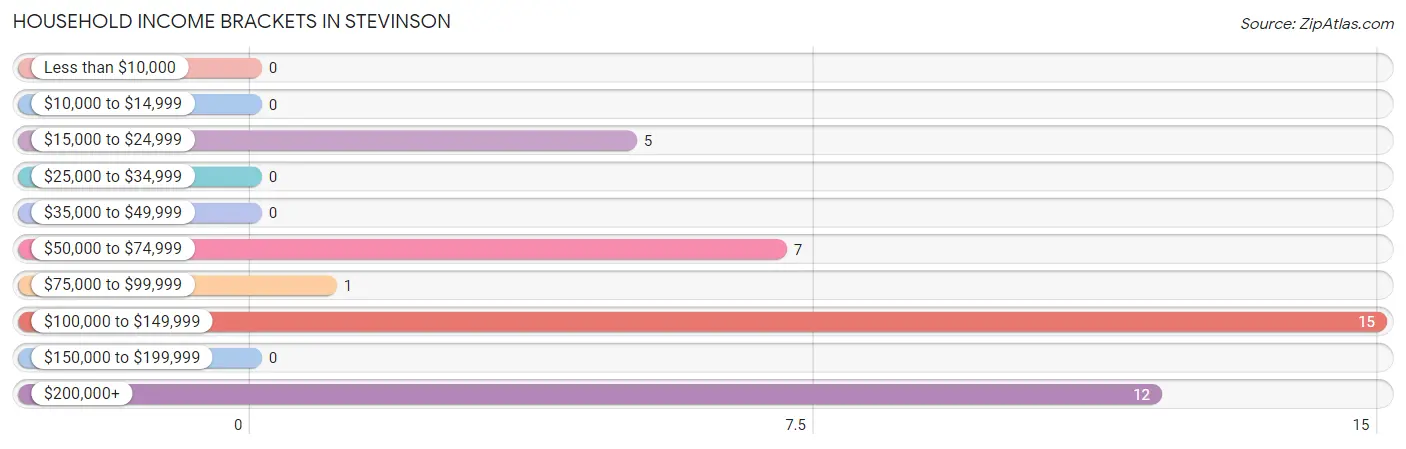
| Income Bracket | # Households | % Households |
| Less than $10,000 | 0 | 0.0% |
| $10,000 to $14,999 | 0 | 0.0% |
| $15,000 to $24,999 | 5 | 12.5% |
| $25,000 to $34,999 | 0 | 0.0% |
| $35,000 to $49,999 | 0 | 0.0% |
| $50,000 to $74,999 | 7 | 17.5% |
| $75,000 to $99,999 | 1 | 2.5% |
| $100,000 to $149,999 | 15 | 37.5% |
| $150,000 to $199,999 | 0 | 0.0% |
| $200,000+ | 12 | 30.0% |
Household Income by Householder Age in Stevinson
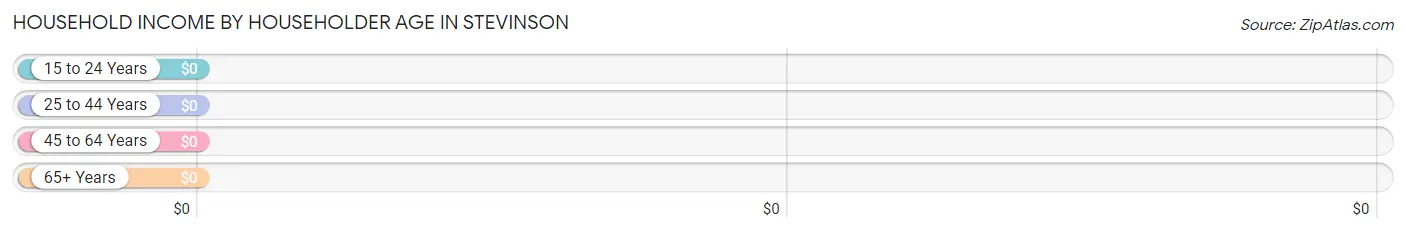
| Income Bracket | # Households | Median Income |
| 15 to 24 Years | 0 (0.0%) | $0 |
| 25 to 44 Years | 15 (37.5%) | $0 |
| 45 to 64 Years | 13 (32.5%) | $0 |
| 65+ Years | 12 (30.0%) | $0 |
| Total | 40 (100.0%) | $118,667 |
Poverty in Stevinson
Income Below Poverty by Sex and Age in Stevinson
| Age Bracket | Male | Female |
| Under 5 Years | 0 (0.0%) | 0 (0.0%) |
| 5 Years | 0 (0.0%) | 0 (0.0%) |
| 6 to 11 Years | 0 (0.0%) | 0 (0.0%) |
| 12 to 14 Years | 0 (0.0%) | 0 (0.0%) |
| 15 Years | 0 (0.0%) | 0 (0.0%) |
| 16 and 17 Years | 0 (0.0%) | 0 (0.0%) |
| 18 to 24 Years | 0 (0.0%) | 0 (0.0%) |
| 25 to 34 Years | 0 (0.0%) | 0 (0.0%) |
| 35 to 44 Years | 0 (0.0%) | 0 (0.0%) |
| 45 to 54 Years | 0 (0.0%) | 0 (0.0%) |
| 55 to 64 Years | 0 (0.0%) | 0 (0.0%) |
| 65 to 74 Years | 0 (0.0%) | 0 (0.0%) |
| 75 Years and over | 0 (0.0%) | 0 (0.0%) |
| Total | 0 (0.0%) | 0 (0.0%) |
Income Above Poverty by Sex and Age in Stevinson
According to the poverty statistics in Stevinson, males aged 6 to 11 years and females aged 6 to 11 years are the age groups that are most secure financially, with 100.0% of males and 100.0% of females in these age groups living above the poverty line.
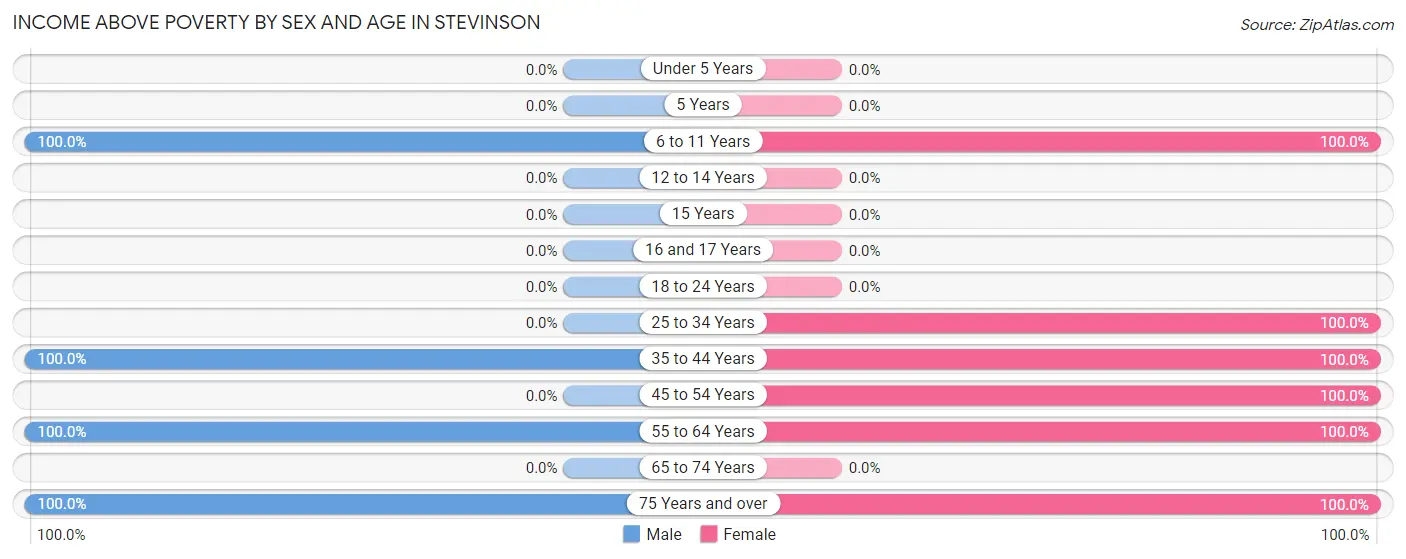
| Age Bracket | Male | Female |
| Under 5 Years | 0 (0.0%) | 0 (0.0%) |
| 5 Years | 0 (0.0%) | 0 (0.0%) |
| 6 to 11 Years | 24 (100.0%) | 14 (100.0%) |
| 12 to 14 Years | 0 (0.0%) | 0 (0.0%) |
| 15 Years | 0 (0.0%) | 0 (0.0%) |
| 16 and 17 Years | 0 (0.0%) | 0 (0.0%) |
| 18 to 24 Years | 0 (0.0%) | 0 (0.0%) |
| 25 to 34 Years | 0 (0.0%) | 4 (100.0%) |
| 35 to 44 Years | 27 (100.0%) | 15 (100.0%) |
| 45 to 54 Years | 0 (0.0%) | 1 (100.0%) |
| 55 to 64 Years | 6 (100.0%) | 11 (100.0%) |
| 65 to 74 Years | 0 (0.0%) | 0 (0.0%) |
| 75 Years and over | 15 (100.0%) | 15 (100.0%) |
| Total | 72 (100.0%) | 60 (100.0%) |
Income Below Poverty Among Married-Couple Families in Stevinson
| Children | Above Poverty | Below Poverty |
| No Children | 17 (100.0%) | 0 (0.0%) |
| 1 or 2 Children | 16 (100.0%) | 0 (0.0%) |
| 3 or 4 Children | 0 (0.0%) | 0 (0.0%) |
| 5 or more Children | 0 (0.0%) | 0 (0.0%) |
| Total | 33 (100.0%) | 0 (0.0%) |
Income Below Poverty Among Single-Parent Households in Stevinson
| Children | Single Father | Single Mother |
| No Children | 0 (0.0%) | 0 (0.0%) |
| 1 or 2 Children | 0 (0.0%) | 0 (0.0%) |
| 3 or 4 Children | 0 (0.0%) | 0 (0.0%) |
| 5 or more Children | 0 (0.0%) | 0 (0.0%) |
| Total | 0 (0.0%) | 0 (0.0%) |
Income Below Poverty Among Married-Couple vs Single-Parent Households in Stevinson
| Children | Married-Couple Families | Single-Parent Households |
| No Children | 0 (0.0%) | 0 (0.0%) |
| 1 or 2 Children | 0 (0.0%) | 0 (0.0%) |
| 3 or 4 Children | 0 (0.0%) | 0 (0.0%) |
| 5 or more Children | 0 (0.0%) | 0 (0.0%) |
| Total | 0 (0.0%) | 0 (0.0%) |
Race in Stevinson
The most populous races in Stevinson are White / Caucasian (119 | 90.1%), Hispanic or Latino (22 | 16.7%), and Some other Race (13 | 9.9%).
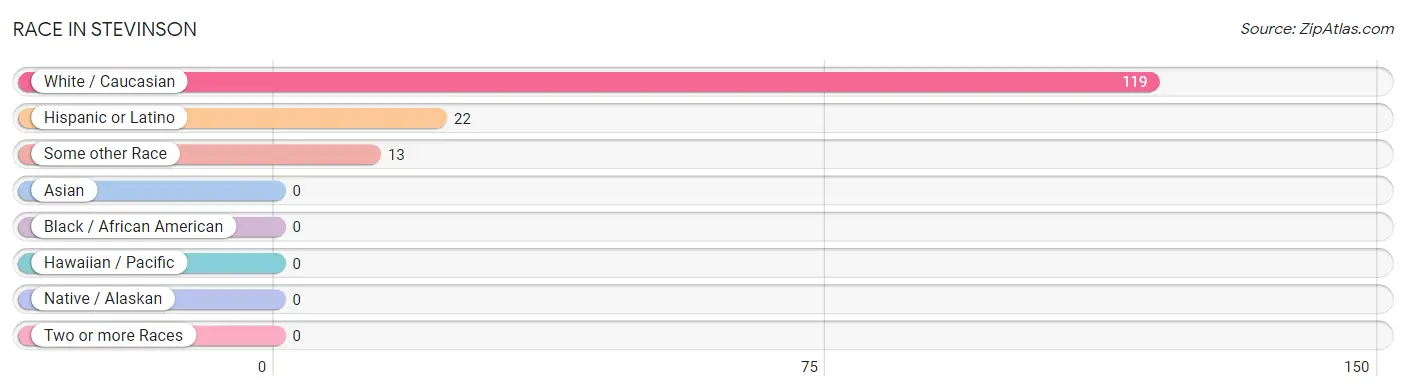
| Race | # Population | % Population |
| Asian | 0 | 0.0% |
| Black / African American | 0 | 0.0% |
| Hawaiian / Pacific | 0 | 0.0% |
| Hispanic or Latino | 22 | 16.7% |
| Native / Alaskan | 0 | 0.0% |
| White / Caucasian | 119 | 90.1% |
| Two or more Races | 0 | 0.0% |
| Some other Race | 13 | 9.9% |
| Total | 132 | 100.0% |
Ancestry in Stevinson
The most populous ancestries reported in Stevinson are Portuguese (91 | 68.9%), Irish (52 | 39.4%), Mexican (22 | 16.7%), German (12 | 9.1%), and Italian (12 | 9.1%), together accounting for 143.2% of all Stevinson residents.
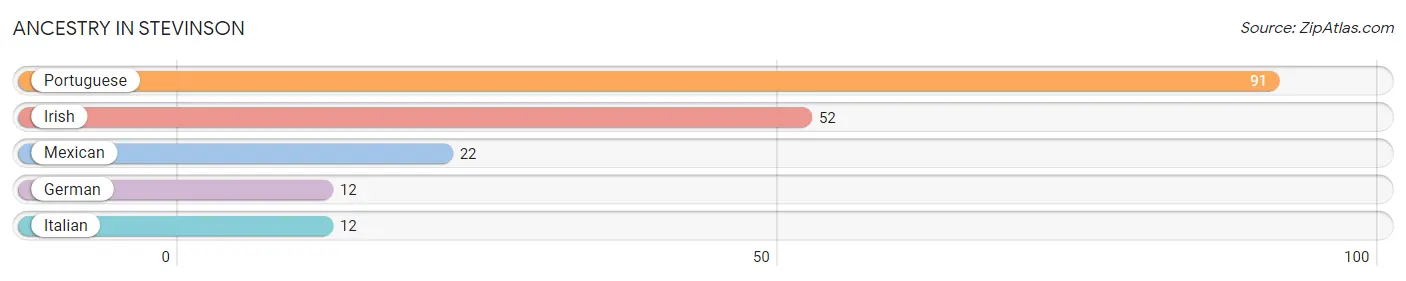
| Ancestry | # Population | % Population |
| German | 12 | 9.1% |
| Irish | 52 | 39.4% |
| Italian | 12 | 9.1% |
| Mexican | 22 | 16.7% |
| Portuguese | 91 | 68.9% | View All 5 Rows |
Immigrants in Stevinson
The most numerous immigrant groups reported in Stevinson came from Central America (17 | 12.9%), Latin America (17 | 12.9%), Mexico (17 | 12.9%), Azores (12 | 9.1%), and Europe (12 | 9.1%), together accounting for 56.8% of all Stevinson residents.
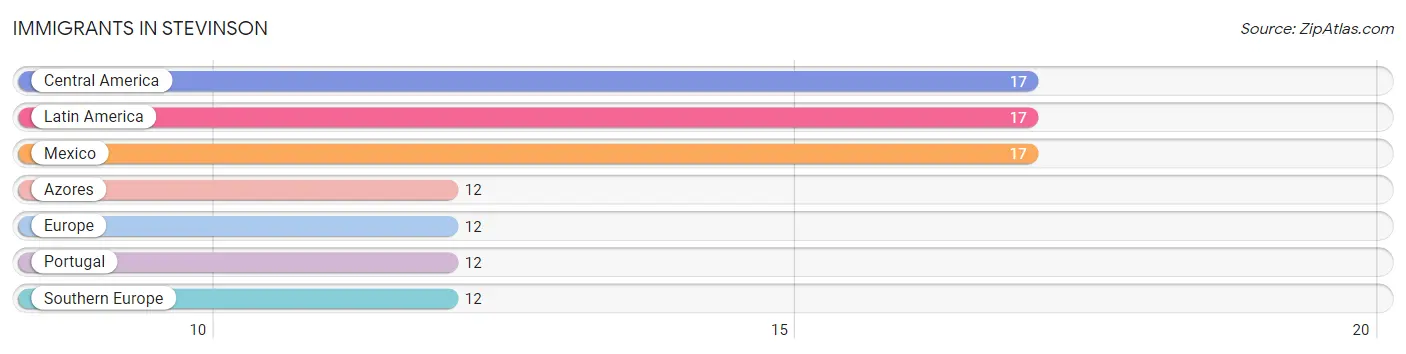
| Immigration Origin | # Population | % Population |
| Azores | 12 | 9.1% |
| Central America | 17 | 12.9% |
| Europe | 12 | 9.1% |
| Latin America | 17 | 12.9% |
| Mexico | 17 | 12.9% |
| Portugal | 12 | 9.1% |
| Southern Europe | 12 | 9.1% | View All 7 Rows |
Sex and Age in Stevinson
Sex and Age in Stevinson
The most populous age groups in Stevinson are 35 to 39 Years (27 | 37.5%) for men and 35 to 39 Years (15 | 25.0%) for women.
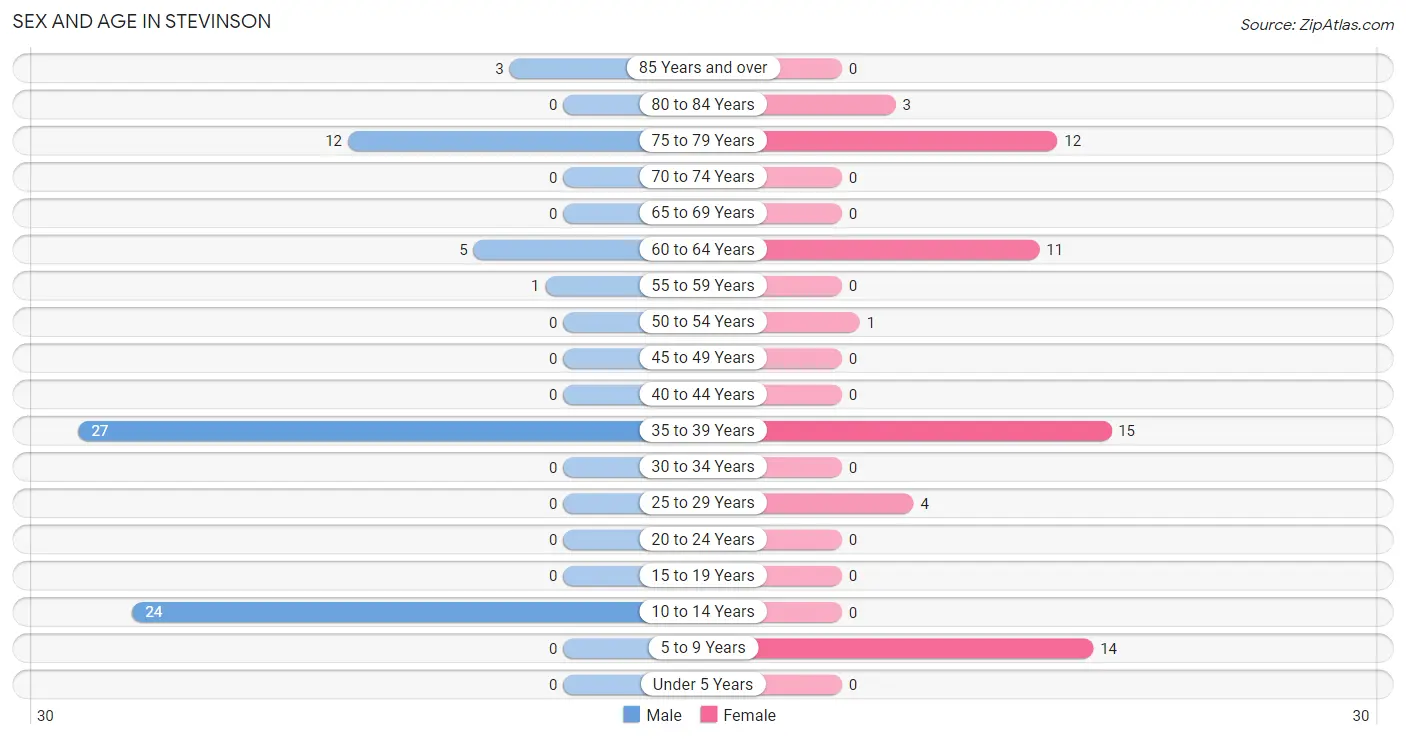
| Age Bracket | Male | Female |
| Under 5 Years | 0 (0.0%) | 0 (0.0%) |
| 5 to 9 Years | 0 (0.0%) | 14 (23.3%) |
| 10 to 14 Years | 24 (33.3%) | 0 (0.0%) |
| 15 to 19 Years | 0 (0.0%) | 0 (0.0%) |
| 20 to 24 Years | 0 (0.0%) | 0 (0.0%) |
| 25 to 29 Years | 0 (0.0%) | 4 (6.7%) |
| 30 to 34 Years | 0 (0.0%) | 0 (0.0%) |
| 35 to 39 Years | 27 (37.5%) | 15 (25.0%) |
| 40 to 44 Years | 0 (0.0%) | 0 (0.0%) |
| 45 to 49 Years | 0 (0.0%) | 0 (0.0%) |
| 50 to 54 Years | 0 (0.0%) | 1 (1.7%) |
| 55 to 59 Years | 1 (1.4%) | 0 (0.0%) |
| 60 to 64 Years | 5 (6.9%) | 11 (18.3%) |
| 65 to 69 Years | 0 (0.0%) | 0 (0.0%) |
| 70 to 74 Years | 0 (0.0%) | 0 (0.0%) |
| 75 to 79 Years | 12 (16.7%) | 12 (20.0%) |
| 80 to 84 Years | 0 (0.0%) | 3 (5.0%) |
| 85 Years and over | 3 (4.2%) | 0 (0.0%) |
| Total | 72 (100.0%) | 60 (100.0%) |
Families and Households in Stevinson
Median Family Size in Stevinson
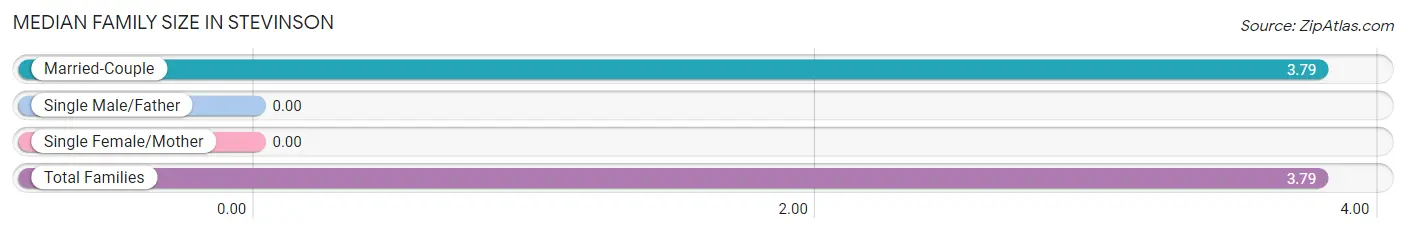
| Family Type | # Families | Family Size |
| Married-Couple | 33 (100.0%) | 3.79 |
| Single Male/Father | 0 (0.0%) | - |
| Single Female/Mother | 0 (0.0%) | - |
| Total Families | 33 (100.0%) | 3.79 |
Median Household Size in Stevinson
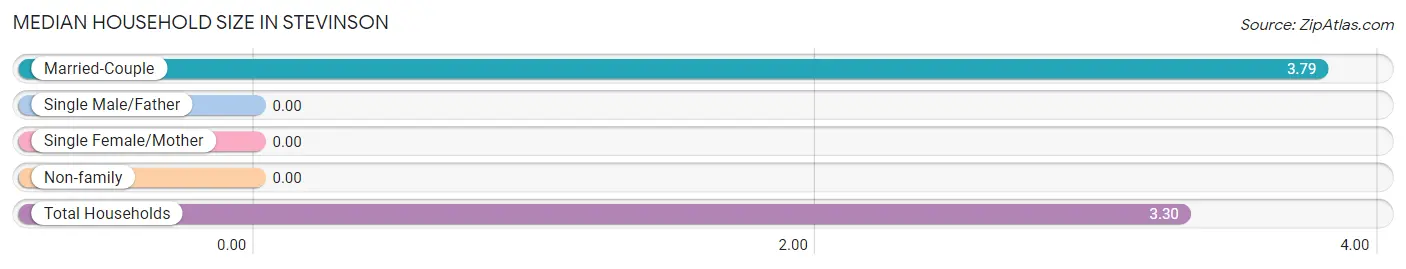
| Household Type | # Households | Household Size |
| Married-Couple | 33 (82.5%) | 3.79 |
| Single Male/Father | 0 (0.0%) | - |
| Single Female/Mother | 0 (0.0%) | - |
| Non-family | 7 (17.5%) | - |
| Total Households | 40 (100.0%) | 3.30 |
Household Size by Marriage Status in Stevinson
Out of a total of 40 households in Stevinson, 33 (82.5%) are family households, while 7 (17.5%) are nonfamily households. The most numerous type of family households are 2-person households, comprising 17, and the most common type of nonfamily households are 1-person households, comprising 7.
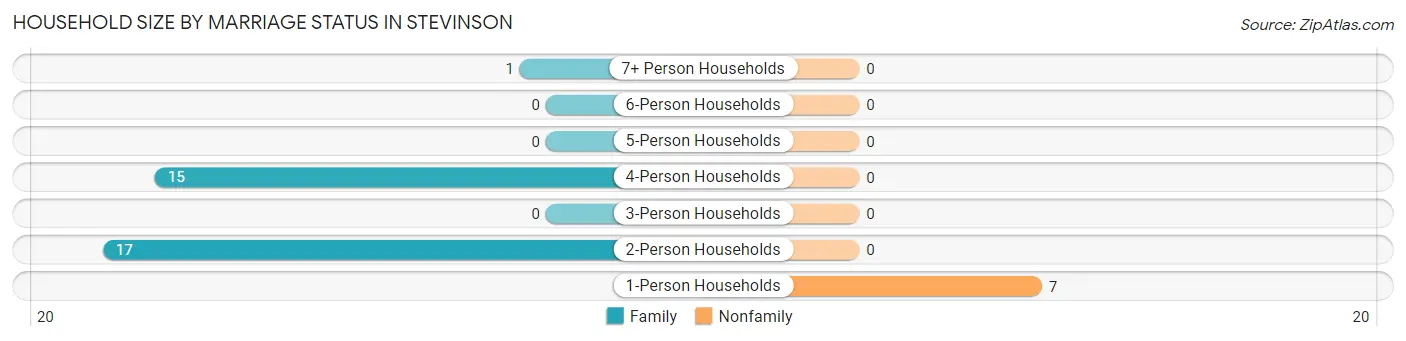
| Household Size | Family Households | Nonfamily Households |
| 1-Person Households | - | 7 (17.5%) |
| 2-Person Households | 17 (42.5%) | 0 (0.0%) |
| 3-Person Households | 0 (0.0%) | 0 (0.0%) |
| 4-Person Households | 15 (37.5%) | 0 (0.0%) |
| 5-Person Households | 0 (0.0%) | 0 (0.0%) |
| 6-Person Households | 0 (0.0%) | 0 (0.0%) |
| 7+ Person Households | 1 (2.5%) | 0 (0.0%) |
| Total | 33 (82.5%) | 7 (17.5%) |
Female Fertility in Stevinson
Fertility by Age in Stevinson
| Age Bracket | Women with Births | Births / 1,000 Women |
| 15 to 19 years | 0 (0.0%) | 0.0 |
| 20 to 34 years | 0 (0.0%) | 0.0 |
| 35 to 50 years | 0 (0.0%) | 0.0 |
| Total | 0 (0.0%) | 0.0 |
Fertility by Age by Marriage Status in Stevinson
| Age Bracket | Married | Unmarried |
| 15 to 19 years | 0 (0.0%) | 0 (0.0%) |
| 20 to 34 years | 0 (0.0%) | 0 (0.0%) |
| 35 to 50 years | 0 (0.0%) | 0 (0.0%) |
| Total | 0 (0.0%) | 0 (0.0%) |
Fertility by Education in Stevinson
| Educational Attainment | Women with Births | Births / 1,000 Women |
| Less than High School | 0 (0.0%) | 0.0 |
| High School Diploma | 0 (0.0%) | 0.0 |
| College or Associate's Degree | 0 (0.0%) | 0.0 |
| Bachelor's Degree | 0 (0.0%) | 0.0 |
| Graduate Degree | 0 (0.0%) | 0.0 |
| Total | 0 (0.0%) | 0.0 |
Fertility by Education by Marriage Status in Stevinson
| Educational Attainment | Married | Unmarried |
| Less than High School | 0 (0.0%) | 0 (0.0%) |
| High School Diploma | 0 (0.0%) | 0 (0.0%) |
| College or Associate's Degree | 0 (0.0%) | 0 (0.0%) |
| Bachelor's Degree | 0 (0.0%) | 0 (0.0%) |
| Graduate Degree | 0 (0.0%) | 0 (0.0%) |
| Total | 0 (0.0%) | 0 (0.0%) |
Employment Characteristics in Stevinson
Employment by Class of Employer in Stevinson
Among the 52 employed individuals in Stevinson, private company employees (37 | 71.2%), and not-for-profit organizations (15 | 28.8%) make up the most common classes of employment.
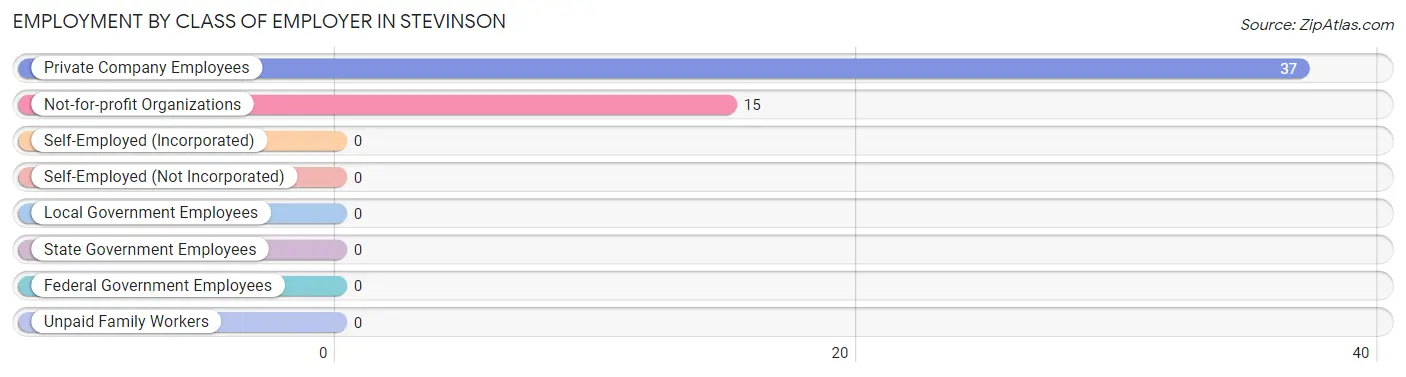
| Employer Class | # Employees | % Employees |
| Private Company Employees | 37 | 71.2% |
| Self-Employed (Incorporated) | 0 | 0.0% |
| Self-Employed (Not Incorporated) | 0 | 0.0% |
| Not-for-profit Organizations | 15 | 28.8% |
| Local Government Employees | 0 | 0.0% |
| State Government Employees | 0 | 0.0% |
| Federal Government Employees | 0 | 0.0% |
| Unpaid Family Workers | 0 | 0.0% |
| Total | 52 | 100.0% |
Employment Status by Age in Stevinson
According to the labor force statistics for Stevinson, out of the total population over 16 years of age (94), 57.4% or 54 individuals are in the labor force, with 3.7% or 2 of them unemployed. The age group with the highest labor force participation rate is 25 to 29 years, with 100.0% or 4 individuals in the labor force. Within the labor force, the 25 to 29 years age range has the highest percentage of unemployed individuals, with 50.0% or 2 of them being unemployed.
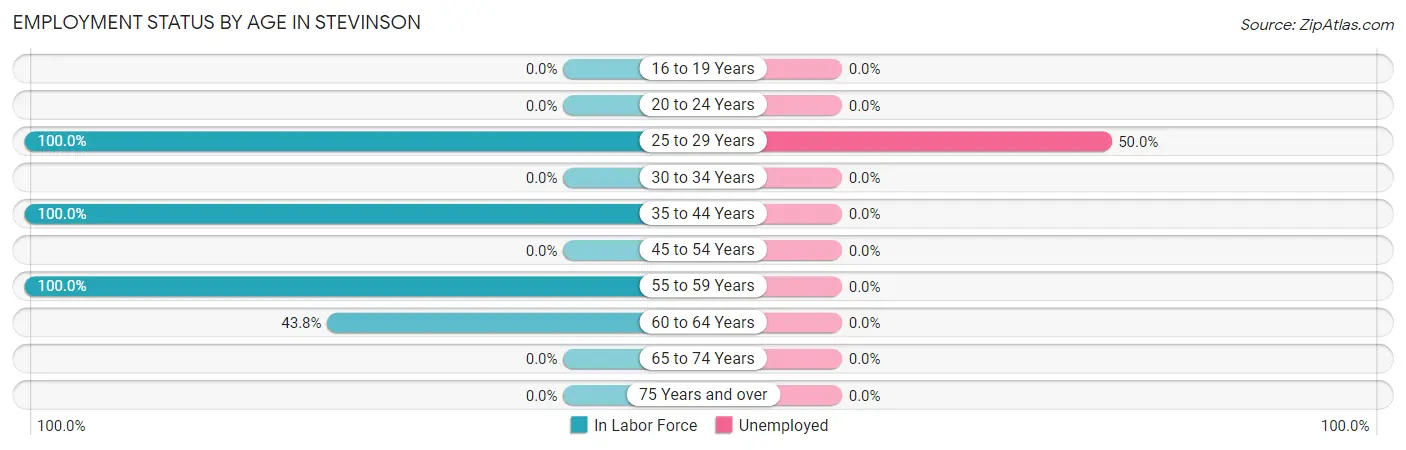
| Age Bracket | In Labor Force | Unemployed |
| 16 to 19 Years | 0 (0.0%) | 0 (0.0%) |
| 20 to 24 Years | 0 (0.0%) | 0 (0.0%) |
| 25 to 29 Years | 4 (100.0%) | 2 (50.0%) |
| 30 to 34 Years | 0 (0.0%) | 0 (0.0%) |
| 35 to 44 Years | 42 (100.0%) | 0 (0.0%) |
| 45 to 54 Years | 0 (0.0%) | 0 (0.0%) |
| 55 to 59 Years | 1 (100.0%) | 0 (0.0%) |
| 60 to 64 Years | 7 (43.8%) | 0 (0.0%) |
| 65 to 74 Years | 0 (0.0%) | 0 (0.0%) |
| 75 Years and over | 0 (0.0%) | 0 (0.0%) |
| Total | 54 (57.4%) | 2 (3.7%) |
Employment Status by Educational Attainment in Stevinson
According to labor force statistics for Stevinson, 84.4% of individuals (54) out of the total population between 25 and 64 years of age (64) are in the labor force, with 3.7% or 2 of them being unemployed. The group with the highest labor force participation rate are those with the educational attainment of college / associate degree, with 100.0% or 24 individuals in the labor force. Within the labor force, individuals with college / associate degree education have the highest percentage of unemployment, with 8.3% or 2 of them being unemployed.
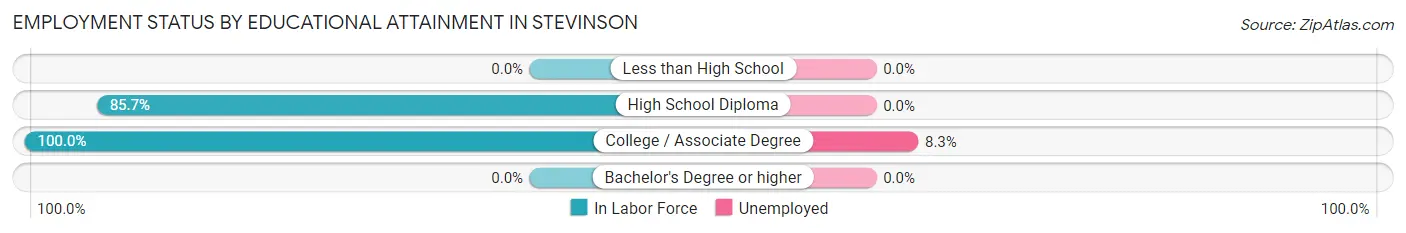
| Educational Attainment | In Labor Force | Unemployed |
| Less than High School | 0 (0.0%) | 0 (0.0%) |
| High School Diploma | 30 (85.7%) | 0 (0.0%) |
| College / Associate Degree | 24 (100.0%) | 2 (8.3%) |
| Bachelor's Degree or higher | 0 (0.0%) | 0 (0.0%) |
| Total | 54 (84.4%) | 2 (3.7%) |
Employment Occupations by Sex in Stevinson
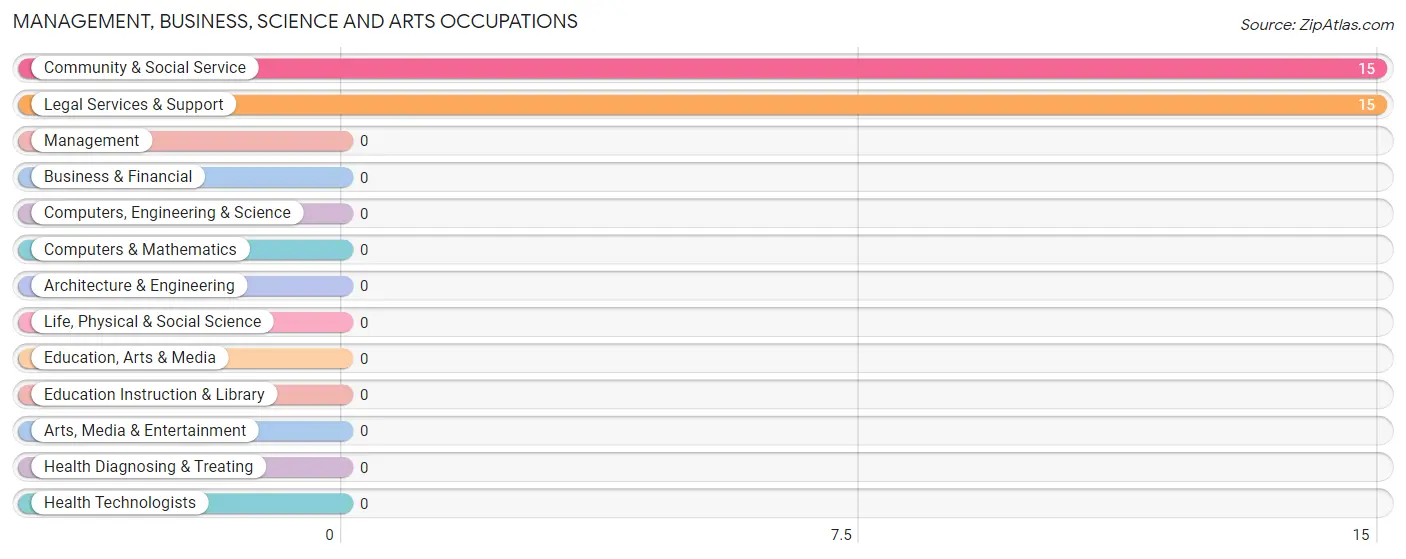
Management, Business, Science and Arts Occupations
The most common Management, Business, Science and Arts occupations in Stevinson are Community & Social Service (15 | 28.8%), and Legal Services & Support (15 | 28.8%).
Management, Business, Science and Arts Occupations by Sex
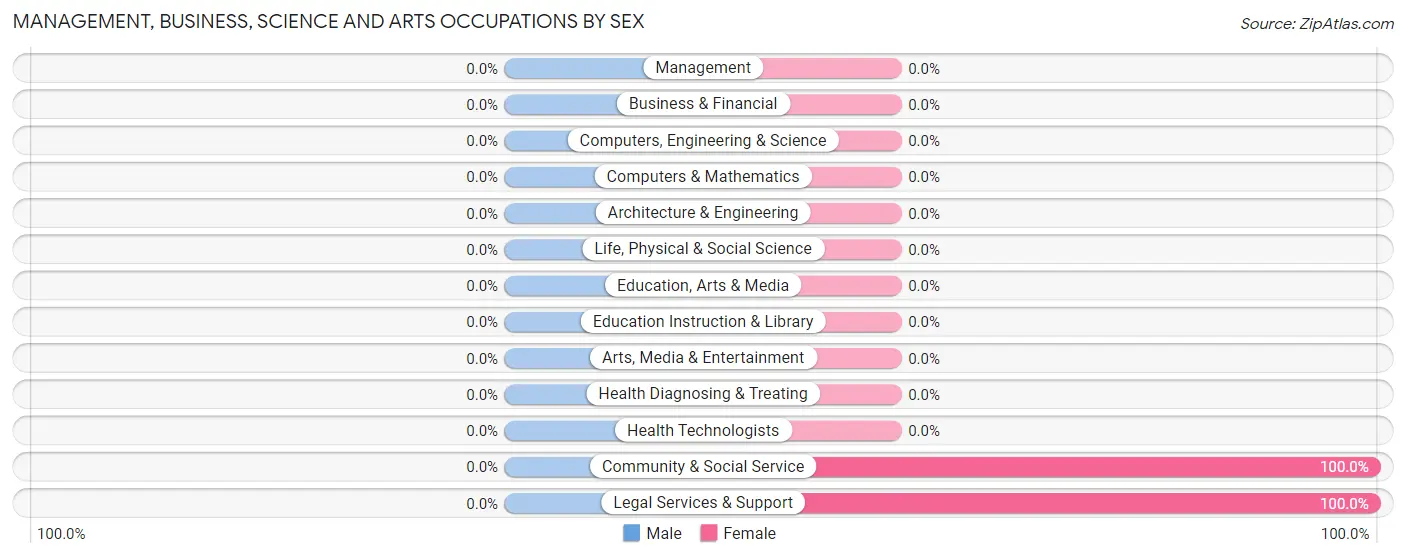
| Occupation | Male | Female |
| Management | 0 (0.0%) | 0 (0.0%) |
| Business & Financial | 0 (0.0%) | 0 (0.0%) |
| Computers, Engineering & Science | 0 (0.0%) | 0 (0.0%) |
| Computers & Mathematics | 0 (0.0%) | 0 (0.0%) |
| Architecture & Engineering | 0 (0.0%) | 0 (0.0%) |
| Life, Physical & Social Science | 0 (0.0%) | 0 (0.0%) |
| Community & Social Service | 0 (0.0%) | 15 (100.0%) |
| Education, Arts & Media | 0 (0.0%) | 0 (0.0%) |
| Legal Services & Support | 0 (0.0%) | 15 (100.0%) |
| Education Instruction & Library | 0 (0.0%) | 0 (0.0%) |
| Arts, Media & Entertainment | 0 (0.0%) | 0 (0.0%) |
| Health Diagnosing & Treating | 0 (0.0%) | 0 (0.0%) |
| Health Technologists | 0 (0.0%) | 0 (0.0%) |
| Total (Category) | 0 (0.0%) | 15 (100.0%) |
| Total (Overall) | 28 (53.8%) | 24 (46.2%) |
Services Occupations
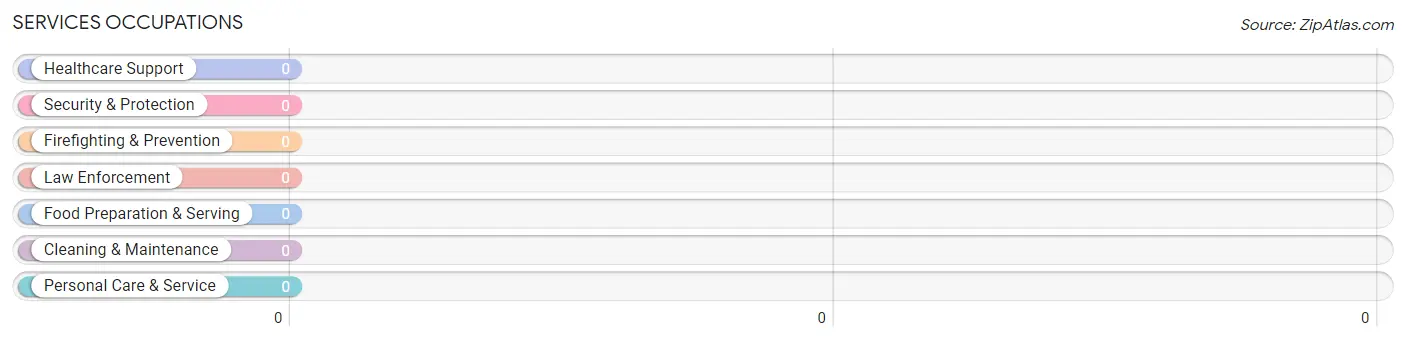
Services Occupations by Sex
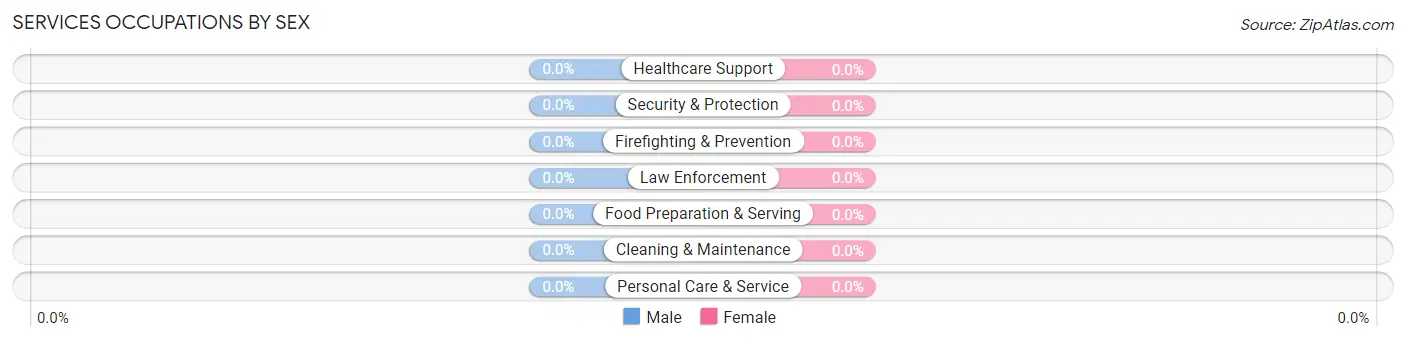
| Occupation | Male | Female |
| Healthcare Support | 0 (0.0%) | 0 (0.0%) |
| Security & Protection | 0 (0.0%) | 0 (0.0%) |
| Firefighting & Prevention | 0 (0.0%) | 0 (0.0%) |
| Law Enforcement | 0 (0.0%) | 0 (0.0%) |
| Food Preparation & Serving | 0 (0.0%) | 0 (0.0%) |
| Cleaning & Maintenance | 0 (0.0%) | 0 (0.0%) |
| Personal Care & Service | 0 (0.0%) | 0 (0.0%) |
| Total (Category) | 0 (0.0%) | 0 (0.0%) |
| Total (Overall) | 28 (53.8%) | 24 (46.2%) |
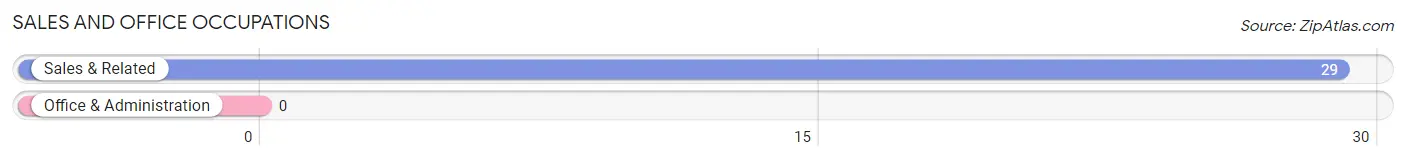
Sales and Office Occupations
The most common Sales and Office occupations in Stevinson are , and Sales & Related (29 | 55.8%).
Sales and Office Occupations by Sex
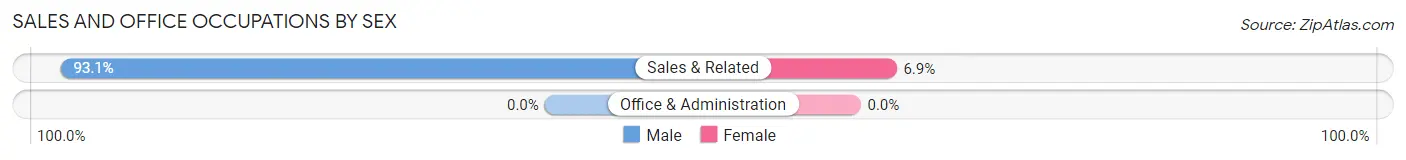
| Occupation | Male | Female |
| Sales & Related | 27 (93.1%) | 2 (6.9%) |
| Office & Administration | 0 (0.0%) | 0 (0.0%) |
| Total (Category) | 27 (93.1%) | 2 (6.9%) |
| Total (Overall) | 28 (53.8%) | 24 (46.2%) |
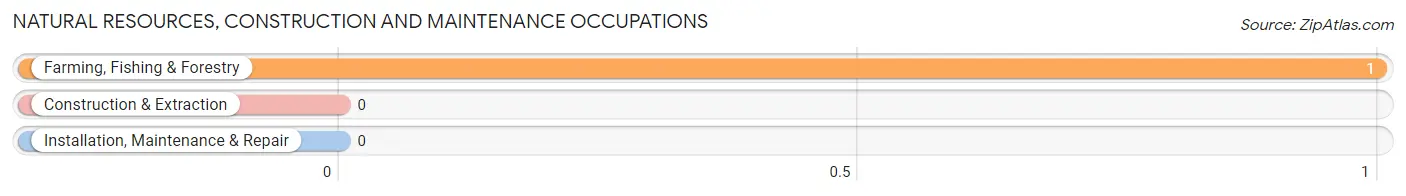
Natural Resources, Construction and Maintenance Occupations
The most common Natural Resources, Construction and Maintenance occupations in Stevinson are , and Farming, Fishing & Forestry (1 | 1.9%).
Natural Resources, Construction and Maintenance Occupations by Sex
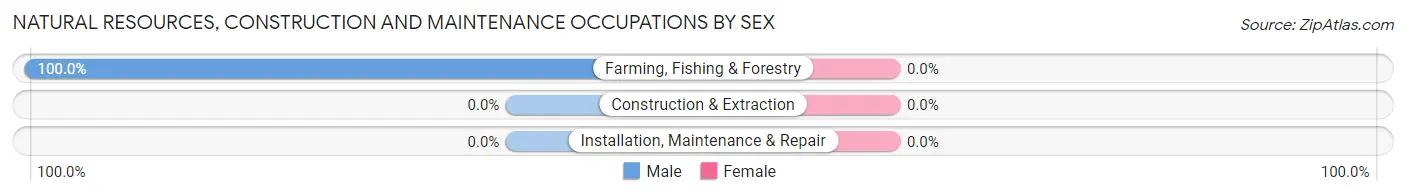
| Occupation | Male | Female |
| Farming, Fishing & Forestry | 1 (100.0%) | 0 (0.0%) |
| Construction & Extraction | 0 (0.0%) | 0 (0.0%) |
| Installation, Maintenance & Repair | 0 (0.0%) | 0 (0.0%) |
| Total (Category) | 1 (100.0%) | 0 (0.0%) |
| Total (Overall) | 28 (53.8%) | 24 (46.2%) |
Production, Transportation and Moving Occupations
The most common Production, Transportation and Moving occupations in Stevinson are , and Production (7 | 13.5%).
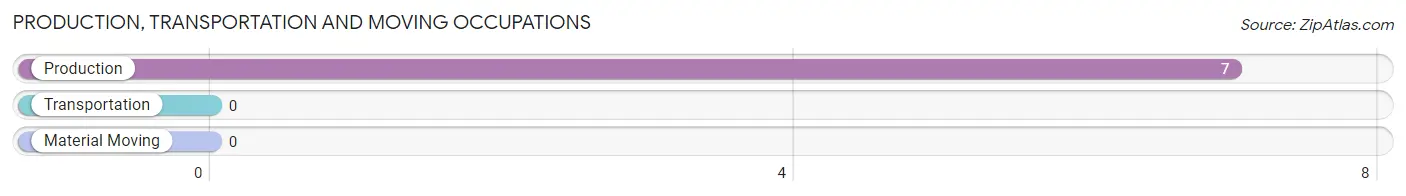
Production, Transportation and Moving Occupations by Sex
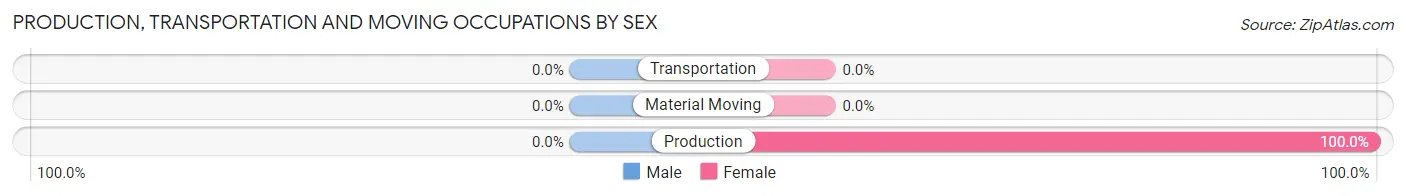
| Occupation | Male | Female |
| Production | 0 (0.0%) | 7 (100.0%) |
| Transportation | 0 (0.0%) | 0 (0.0%) |
| Material Moving | 0 (0.0%) | 0 (0.0%) |
| Total (Category) | 0 (0.0%) | 7 (100.0%) |
| Total (Overall) | 28 (53.8%) | 24 (46.2%) |
Employment Industries by Sex in Stevinson
Employment Industries in Stevinson
The major employment industries in Stevinson include Professional & Scientific (15 | 28.8%), Manufacturing (7 | 13.5%), Real Estate, Rental & Leasing (2 | 3.8%), and Agriculture, Fishing & Hunting (1 | 1.9%).
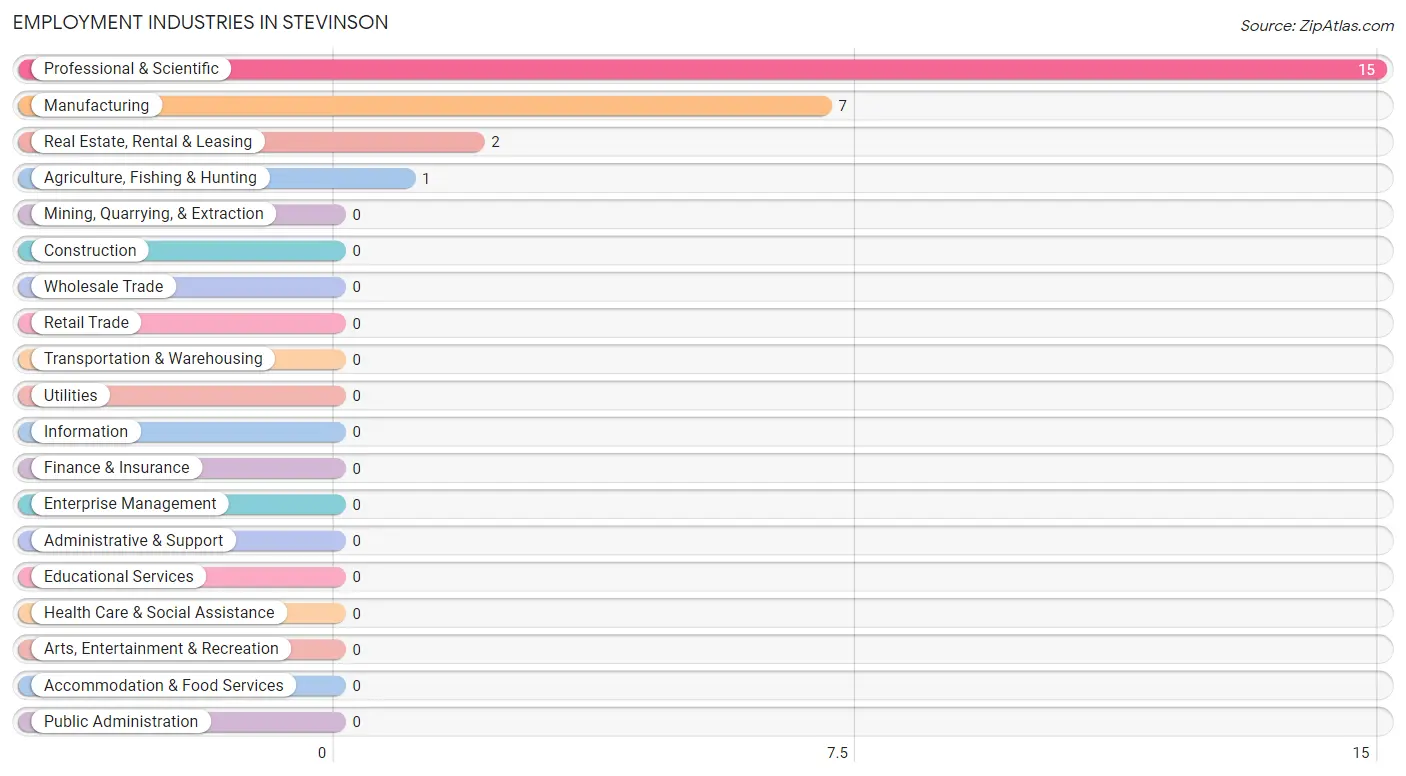
Employment Industries by Sex in Stevinson
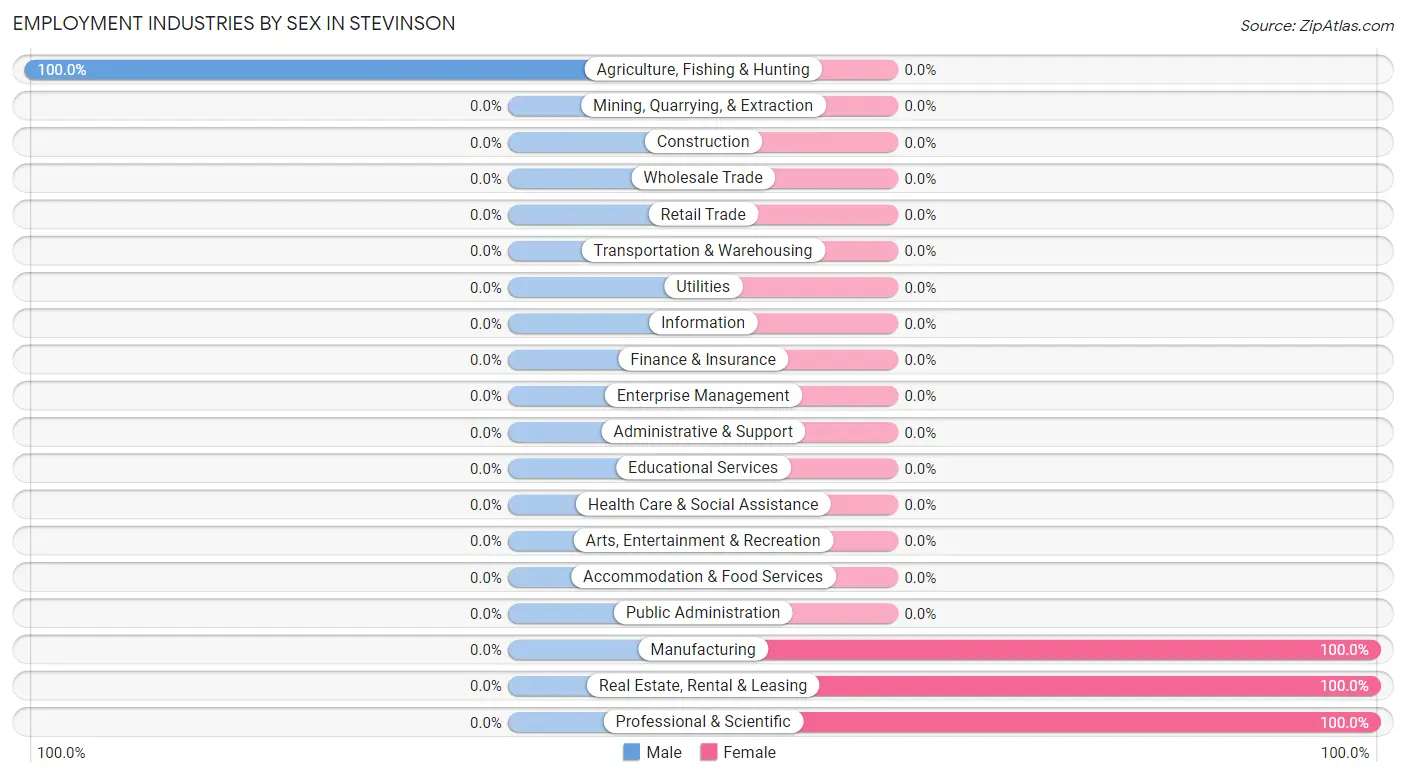
| Industry | Male | Female |
| Agriculture, Fishing & Hunting | 1 (100.0%) | 0 (0.0%) |
| Mining, Quarrying, & Extraction | 0 (0.0%) | 0 (0.0%) |
| Construction | 0 (0.0%) | 0 (0.0%) |
| Manufacturing | 0 (0.0%) | 7 (100.0%) |
| Wholesale Trade | 0 (0.0%) | 0 (0.0%) |
| Retail Trade | 0 (0.0%) | 0 (0.0%) |
| Transportation & Warehousing | 0 (0.0%) | 0 (0.0%) |
| Utilities | 0 (0.0%) | 0 (0.0%) |
| Information | 0 (0.0%) | 0 (0.0%) |
| Finance & Insurance | 0 (0.0%) | 0 (0.0%) |
| Real Estate, Rental & Leasing | 0 (0.0%) | 2 (100.0%) |
| Professional & Scientific | 0 (0.0%) | 15 (100.0%) |
| Enterprise Management | 0 (0.0%) | 0 (0.0%) |
| Administrative & Support | 0 (0.0%) | 0 (0.0%) |
| Educational Services | 0 (0.0%) | 0 (0.0%) |
| Health Care & Social Assistance | 0 (0.0%) | 0 (0.0%) |
| Arts, Entertainment & Recreation | 0 (0.0%) | 0 (0.0%) |
| Accommodation & Food Services | 0 (0.0%) | 0 (0.0%) |
| Public Administration | 0 (0.0%) | 0 (0.0%) |
| Total | 28 (53.8%) | 24 (46.2%) |
Education in Stevinson
School Enrollment in Stevinson
The most common levels of schooling among the 42 students in Stevinson are middle school (24 | 57.1%), elementary school (14 | 33.3%), and college / undergraduate (4 | 9.5%).
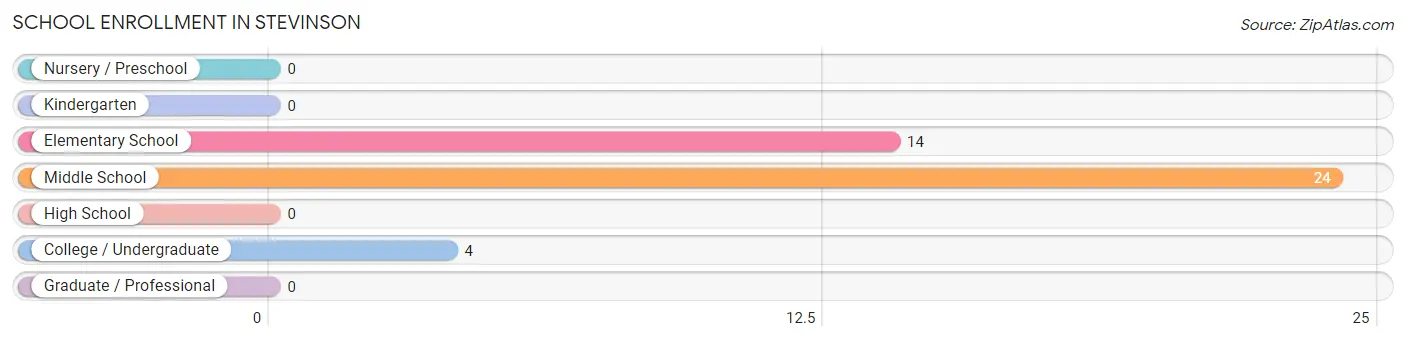
| School Level | # Students | % Students |
| Nursery / Preschool | 0 | 0.0% |
| Kindergarten | 0 | 0.0% |
| Elementary School | 14 | 33.3% |
| Middle School | 24 | 57.1% |
| High School | 0 | 0.0% |
| College / Undergraduate | 4 | 9.5% |
| Graduate / Professional | 0 | 0.0% |
| Total | 42 | 100.0% |
School Enrollment by Age by Funding Source in Stevinson
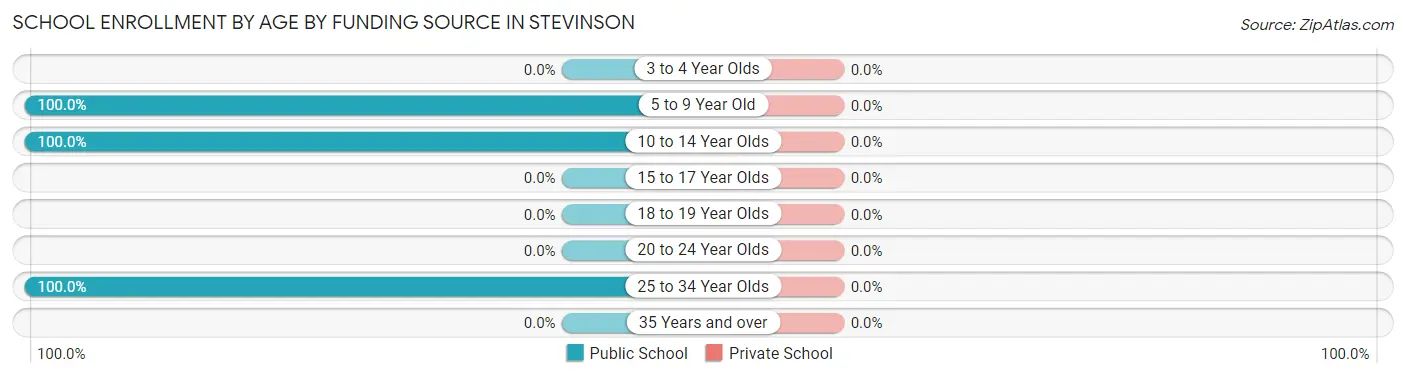
| Age Bracket | Public School | Private School |
| 3 to 4 Year Olds | 0 (0.0%) | 0 (0.0%) |
| 5 to 9 Year Old | 14 (100.0%) | 0 (0.0%) |
| 10 to 14 Year Olds | 24 (100.0%) | 0 (0.0%) |
| 15 to 17 Year Olds | 0 (0.0%) | 0 (0.0%) |
| 18 to 19 Year Olds | 0 (0.0%) | 0 (0.0%) |
| 20 to 24 Year Olds | 0 (0.0%) | 0 (0.0%) |
| 25 to 34 Year Olds | 4 (100.0%) | 0 (0.0%) |
| 35 Years and over | 0 (0.0%) | 0 (0.0%) |
| Total | 42 (100.0%) | 0 (0.0%) |
Educational Attainment by Field of Study in Stevinson
, and science & technology (12 | 100.0%) are the most common fields of study among 12 individuals in Stevinson who have obtained a bachelor's degree or higher.
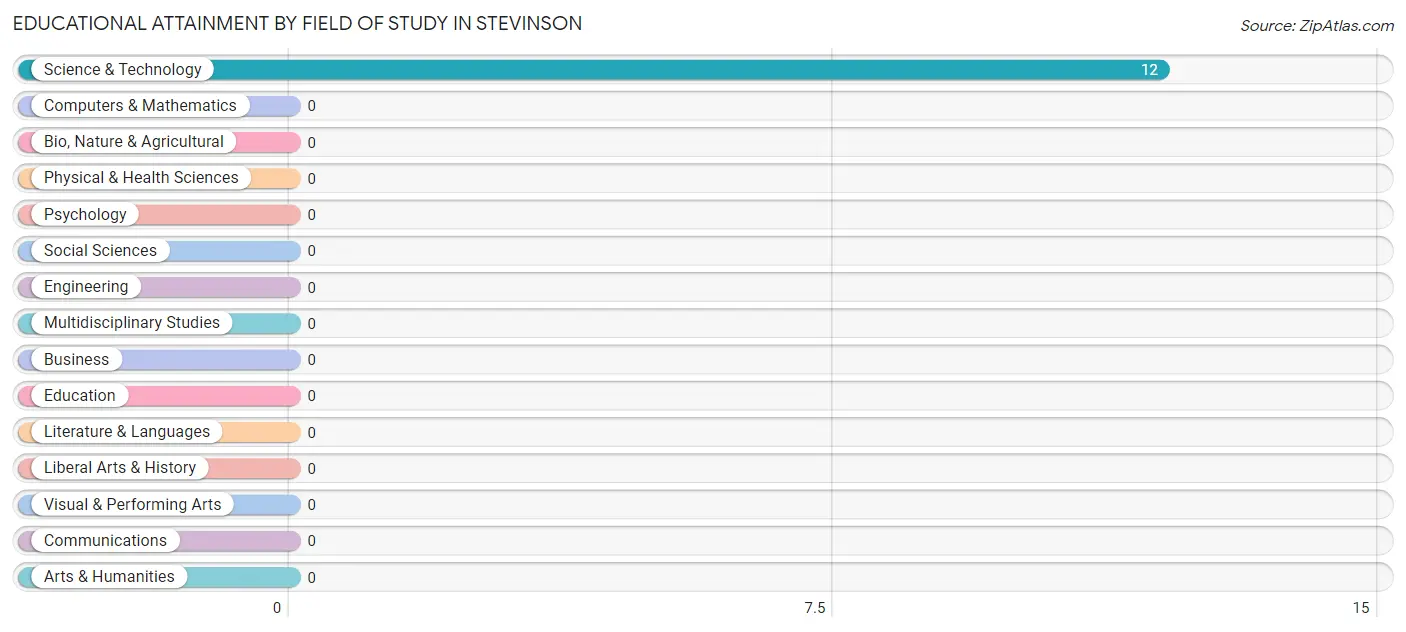
| Field of Study | # Graduates | % Graduates |
| Computers & Mathematics | 0 | 0.0% |
| Bio, Nature & Agricultural | 0 | 0.0% |
| Physical & Health Sciences | 0 | 0.0% |
| Psychology | 0 | 0.0% |
| Social Sciences | 0 | 0.0% |
| Engineering | 0 | 0.0% |
| Multidisciplinary Studies | 0 | 0.0% |
| Science & Technology | 12 | 100.0% |
| Business | 0 | 0.0% |
| Education | 0 | 0.0% |
| Literature & Languages | 0 | 0.0% |
| Liberal Arts & History | 0 | 0.0% |
| Visual & Performing Arts | 0 | 0.0% |
| Communications | 0 | 0.0% |
| Arts & Humanities | 0 | 0.0% |
| Total | 12 | 100.0% |
Transportation & Commute in Stevinson
Vehicle Availability by Sex in Stevinson
The most prevalent vehicle ownership categories in Stevinson are males with 4 vehicles (27, accounting for 96.4%) and females with 4 vehicles (15, making up 112.5%).
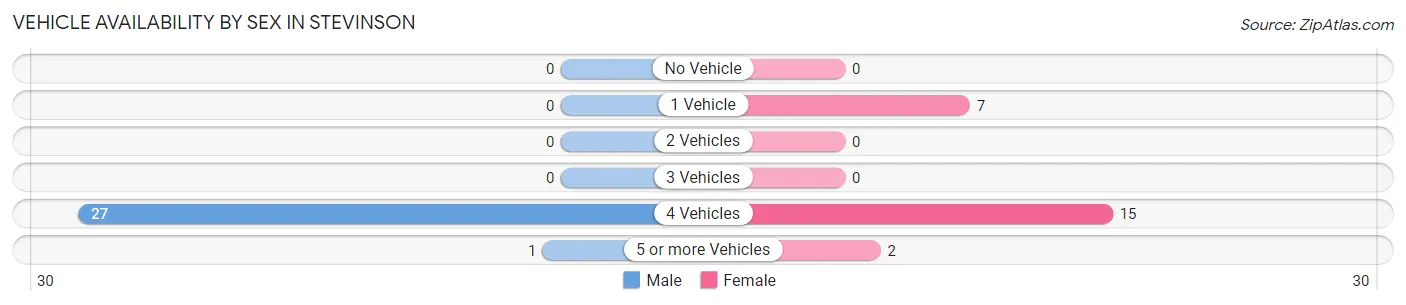
| Vehicles Available | Male | Female |
| No Vehicle | 0 (0.0%) | 0 (0.0%) |
| 1 Vehicle | 0 (0.0%) | 7 (29.2%) |
| 2 Vehicles | 0 (0.0%) | 0 (0.0%) |
| 3 Vehicles | 0 (0.0%) | 0 (0.0%) |
| 4 Vehicles | 27 (96.4%) | 15 (62.5%) |
| 5 or more Vehicles | 1 (3.6%) | 2 (8.3%) |
| Total | 28 (100.0%) | 24 (100.0%) |
Commute Time in Stevinson
The most frequently occuring commute durations in Stevinson are 10 to 14 minutes (27 commuters, 73.0%), 45 to 59 minutes (7 commuters, 18.9%), and 30 to 34 minutes (2 commuters, 5.4%).
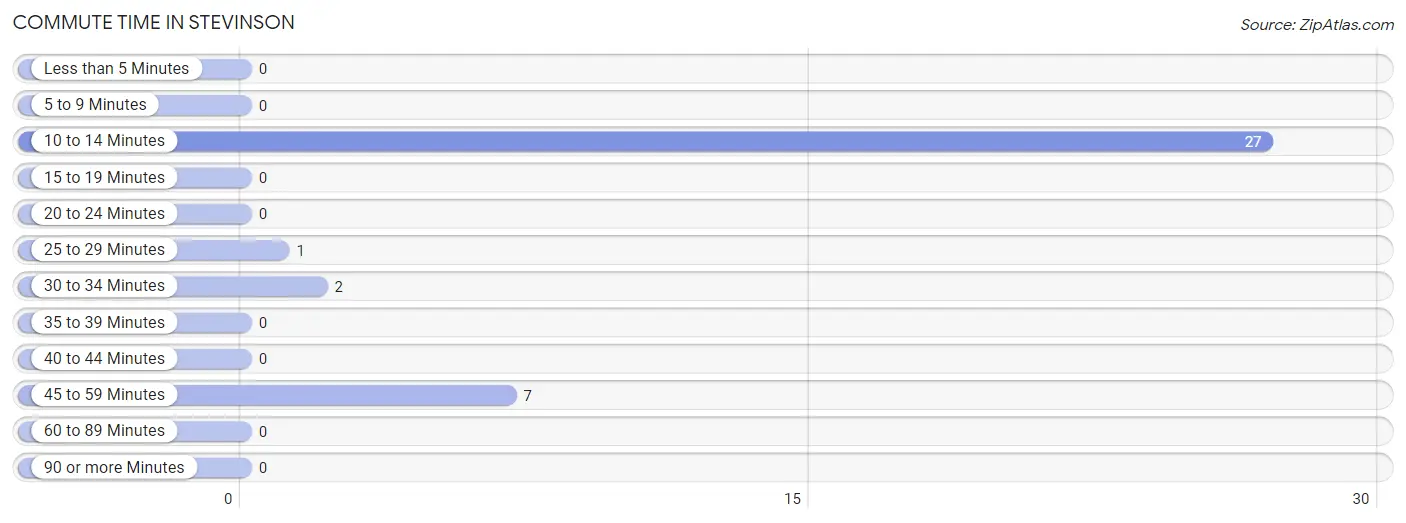
| Commute Time | # Commuters | % Commuters |
| Less than 5 Minutes | 0 | 0.0% |
| 5 to 9 Minutes | 0 | 0.0% |
| 10 to 14 Minutes | 27 | 73.0% |
| 15 to 19 Minutes | 0 | 0.0% |
| 20 to 24 Minutes | 0 | 0.0% |
| 25 to 29 Minutes | 1 | 2.7% |
| 30 to 34 Minutes | 2 | 5.4% |
| 35 to 39 Minutes | 0 | 0.0% |
| 40 to 44 Minutes | 0 | 0.0% |
| 45 to 59 Minutes | 7 | 18.9% |
| 60 to 89 Minutes | 0 | 0.0% |
| 90 or more Minutes | 0 | 0.0% |
Commute Time by Sex in Stevinson
The most common commute times in Stevinson are 10 to 14 minutes (27 commuters, 96.4%) for males and 45 to 59 minutes (7 commuters, 77.8%) for females.
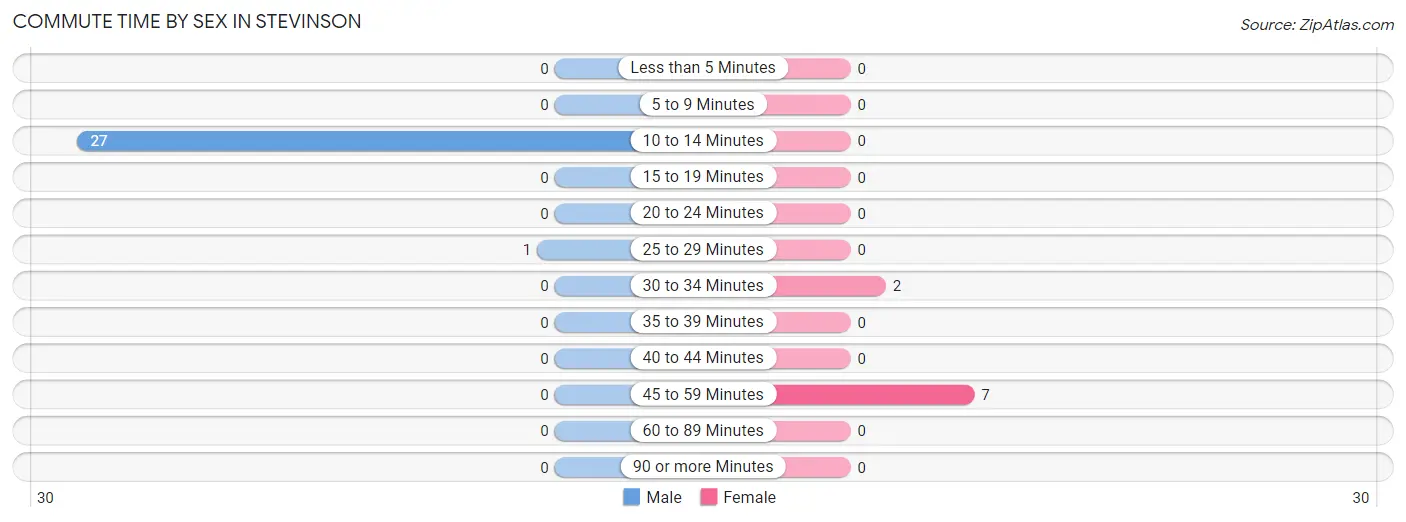
| Commute Time | Male | Female |
| Less than 5 Minutes | 0 (0.0%) | 0 (0.0%) |
| 5 to 9 Minutes | 0 (0.0%) | 0 (0.0%) |
| 10 to 14 Minutes | 27 (96.4%) | 0 (0.0%) |
| 15 to 19 Minutes | 0 (0.0%) | 0 (0.0%) |
| 20 to 24 Minutes | 0 (0.0%) | 0 (0.0%) |
| 25 to 29 Minutes | 1 (3.6%) | 0 (0.0%) |
| 30 to 34 Minutes | 0 (0.0%) | 2 (22.2%) |
| 35 to 39 Minutes | 0 (0.0%) | 0 (0.0%) |
| 40 to 44 Minutes | 0 (0.0%) | 0 (0.0%) |
| 45 to 59 Minutes | 0 (0.0%) | 7 (77.8%) |
| 60 to 89 Minutes | 0 (0.0%) | 0 (0.0%) |
| 90 or more Minutes | 0 (0.0%) | 0 (0.0%) |
Time of Departure to Work by Sex in Stevinson
The most frequent times of departure to work in Stevinson are 5:30 AM to 5:59 AM (27, 96.4%) for males and 5:00 AM to 5:29 AM (7, 77.8%) for females.
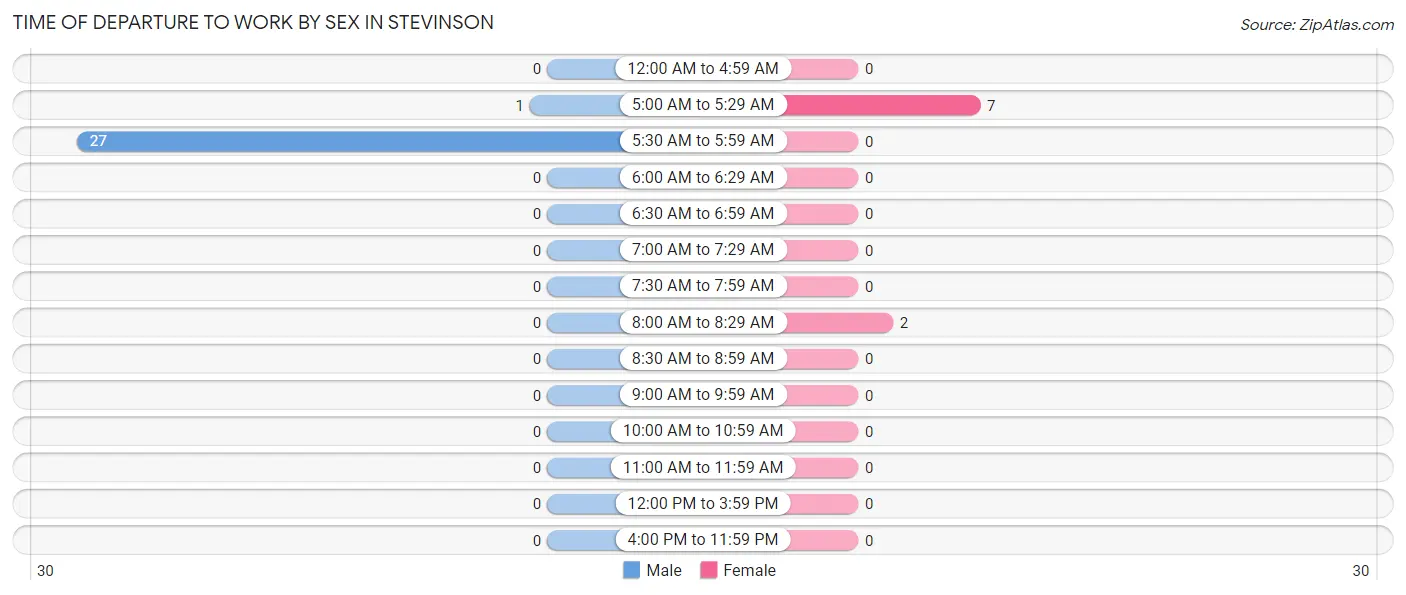
| Time of Departure | Male | Female |
| 12:00 AM to 4:59 AM | 0 (0.0%) | 0 (0.0%) |
| 5:00 AM to 5:29 AM | 1 (3.6%) | 7 (77.8%) |
| 5:30 AM to 5:59 AM | 27 (96.4%) | 0 (0.0%) |
| 6:00 AM to 6:29 AM | 0 (0.0%) | 0 (0.0%) |
| 6:30 AM to 6:59 AM | 0 (0.0%) | 0 (0.0%) |
| 7:00 AM to 7:29 AM | 0 (0.0%) | 0 (0.0%) |
| 7:30 AM to 7:59 AM | 0 (0.0%) | 0 (0.0%) |
| 8:00 AM to 8:29 AM | 0 (0.0%) | 2 (22.2%) |
| 8:30 AM to 8:59 AM | 0 (0.0%) | 0 (0.0%) |
| 9:00 AM to 9:59 AM | 0 (0.0%) | 0 (0.0%) |
| 10:00 AM to 10:59 AM | 0 (0.0%) | 0 (0.0%) |
| 11:00 AM to 11:59 AM | 0 (0.0%) | 0 (0.0%) |
| 12:00 PM to 3:59 PM | 0 (0.0%) | 0 (0.0%) |
| 4:00 PM to 11:59 PM | 0 (0.0%) | 0 (0.0%) |
| Total | 28 (100.0%) | 9 (100.0%) |
Housing Occupancy in Stevinson
Occupancy by Ownership in Stevinson
Of the total 40 dwellings in Stevinson, owner-occupied units account for 33 (82.5%), while renter-occupied units make up 7 (17.5%).
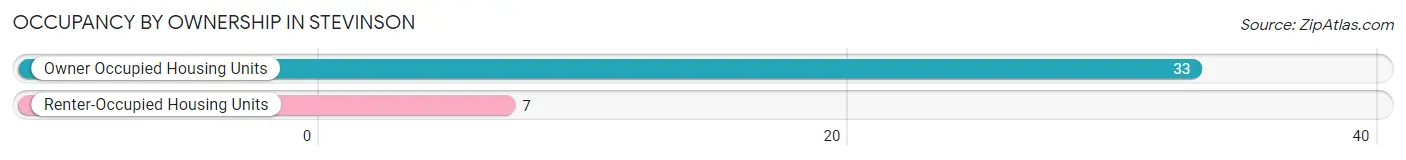
| Occupancy | # Housing Units | % Housing Units |
| Owner Occupied Housing Units | 33 | 82.5% |
| Renter-Occupied Housing Units | 7 | 17.5% |
| Total Occupied Housing Units | 40 | 100.0% |
Occupancy by Household Size in Stevinson
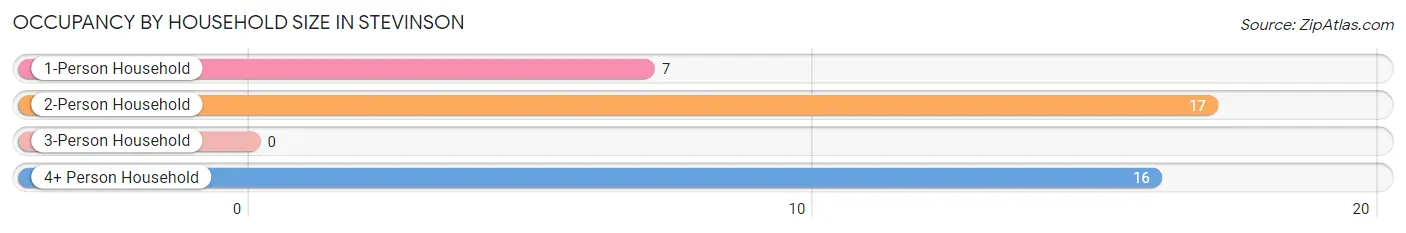
| Household Size | # Housing Units | % Housing Units |
| 1-Person Household | 7 | 17.5% |
| 2-Person Household | 17 | 42.5% |
| 3-Person Household | 0 | 0.0% |
| 4+ Person Household | 16 | 40.0% |
| Total Housing Units | 40 | 100.0% |
Occupancy by Ownership by Household Size in Stevinson
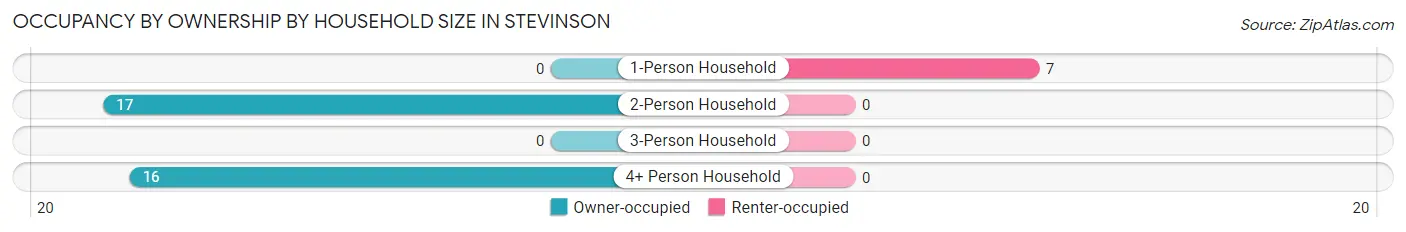
| Household Size | Owner-occupied | Renter-occupied |
| 1-Person Household | 0 (0.0%) | 7 (100.0%) |
| 2-Person Household | 17 (100.0%) | 0 (0.0%) |
| 3-Person Household | 0 (0.0%) | 0 (0.0%) |
| 4+ Person Household | 16 (100.0%) | 0 (0.0%) |
| Total Housing Units | 33 (82.5%) | 7 (17.5%) |
Occupancy by Educational Attainment in Stevinson
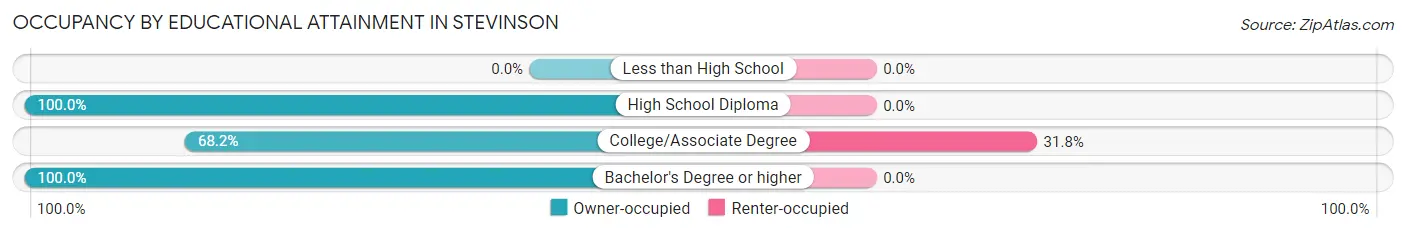
| Household Size | Owner-occupied | Renter-occupied |
| Less than High School | 0 (0.0%) | 0 (0.0%) |
| High School Diploma | 6 (100.0%) | 0 (0.0%) |
| College/Associate Degree | 15 (68.2%) | 7 (31.8%) |
| Bachelor's Degree or higher | 12 (100.0%) | 0 (0.0%) |
Occupancy by Age of Householder in Stevinson
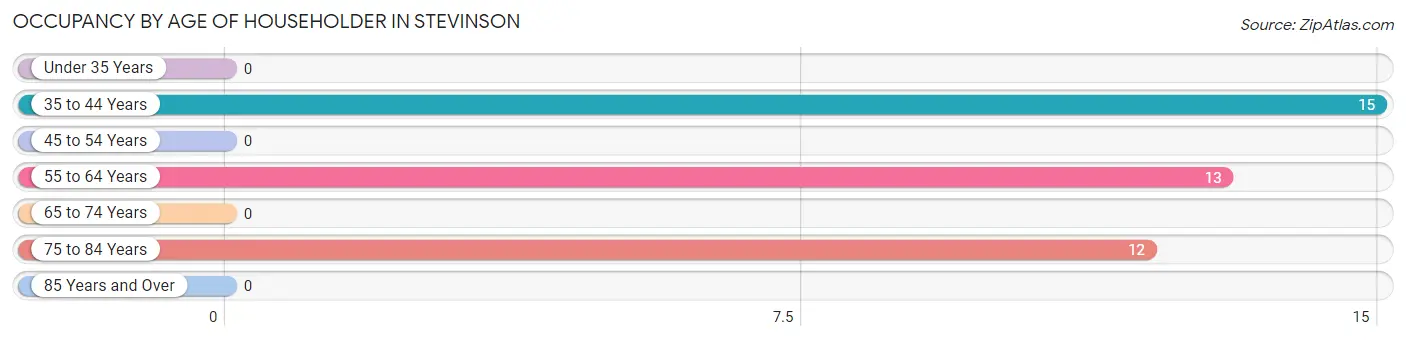
| Age Bracket | # Households | % Households |
| Under 35 Years | 0 | 0.0% |
| 35 to 44 Years | 15 | 37.5% |
| 45 to 54 Years | 0 | 0.0% |
| 55 to 64 Years | 13 | 32.5% |
| 65 to 74 Years | 0 | 0.0% |
| 75 to 84 Years | 12 | 30.0% |
| 85 Years and Over | 0 | 0.0% |
| Total | 40 | 100.0% |
Housing Finances in Stevinson
Median Income by Occupancy in Stevinson
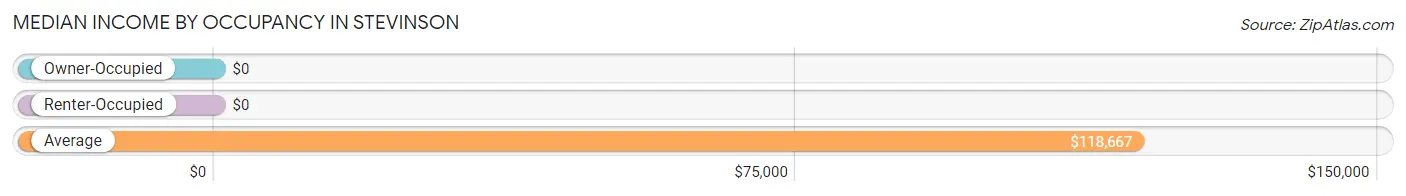
| Occupancy Type | # Households | Median Income |
| Owner-Occupied | 33 (82.5%) | $0 |
| Renter-Occupied | 7 (17.5%) | $0 |
| Average | 40 (100.0%) | $118,667 |
Occupancy by Householder Income Bracket in Stevinson
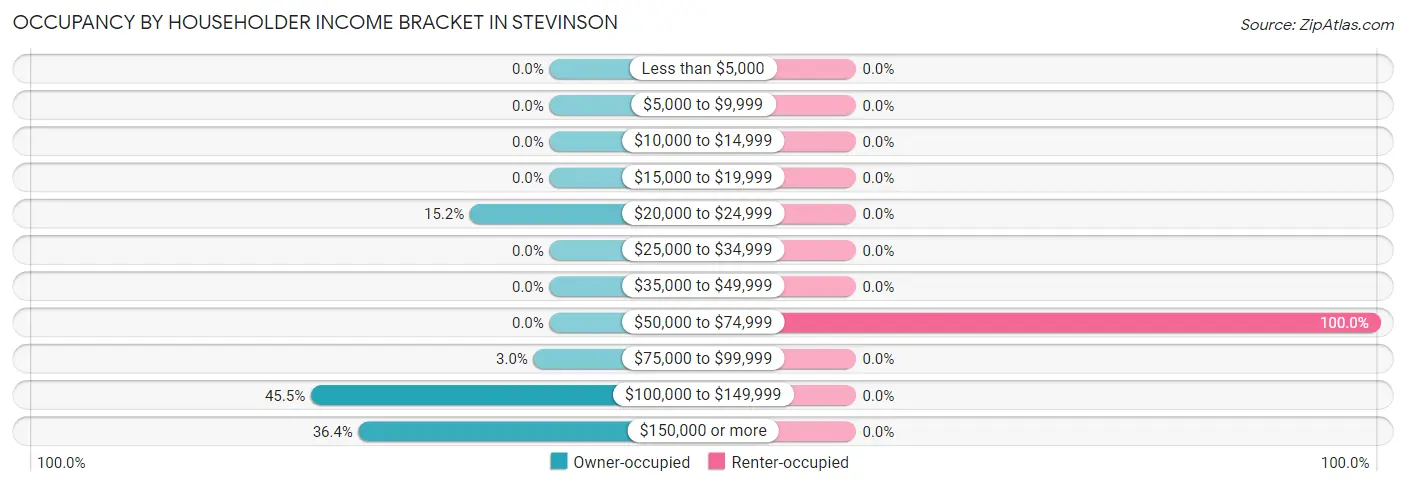
| Income Bracket | Owner-occupied | Renter-occupied |
| Less than $5,000 | 0 (0.0%) | 0 (0.0%) |
| $5,000 to $9,999 | 0 (0.0%) | 0 (0.0%) |
| $10,000 to $14,999 | 0 (0.0%) | 0 (0.0%) |
| $15,000 to $19,999 | 0 (0.0%) | 0 (0.0%) |
| $20,000 to $24,999 | 5 (15.1%) | 0 (0.0%) |
| $25,000 to $34,999 | 0 (0.0%) | 0 (0.0%) |
| $35,000 to $49,999 | 0 (0.0%) | 0 (0.0%) |
| $50,000 to $74,999 | 0 (0.0%) | 7 (100.0%) |
| $75,000 to $99,999 | 1 (3.0%) | 0 (0.0%) |
| $100,000 to $149,999 | 15 (45.5%) | 0 (0.0%) |
| $150,000 or more | 12 (36.4%) | 0 (0.0%) |
| Total | 33 (100.0%) | 7 (100.0%) |
Monthly Housing Cost Tiers in Stevinson
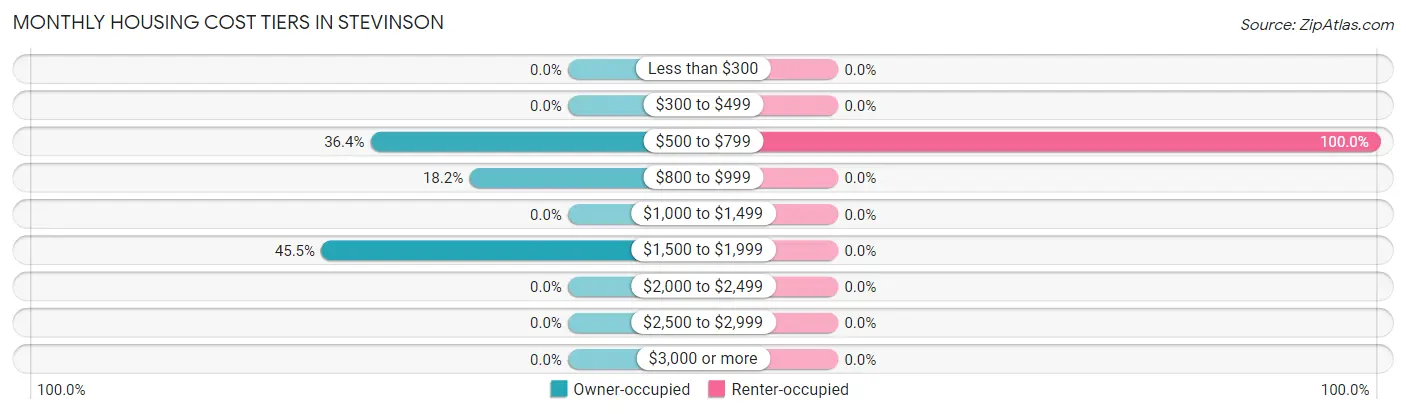
| Monthly Cost | Owner-occupied | Renter-occupied |
| Less than $300 | 0 (0.0%) | 0 (0.0%) |
| $300 to $499 | 0 (0.0%) | 0 (0.0%) |
| $500 to $799 | 12 (36.4%) | 7 (100.0%) |
| $800 to $999 | 6 (18.2%) | 0 (0.0%) |
| $1,000 to $1,499 | 0 (0.0%) | 0 (0.0%) |
| $1,500 to $1,999 | 15 (45.5%) | 0 (0.0%) |
| $2,000 to $2,499 | 0 (0.0%) | 0 (0.0%) |
| $2,500 to $2,999 | 0 (0.0%) | 0 (0.0%) |
| $3,000 or more | 0 (0.0%) | 0 (0.0%) |
| Total | 33 (100.0%) | 7 (100.0%) |
Physical Housing Characteristics in Stevinson
Housing Structures in Stevinson
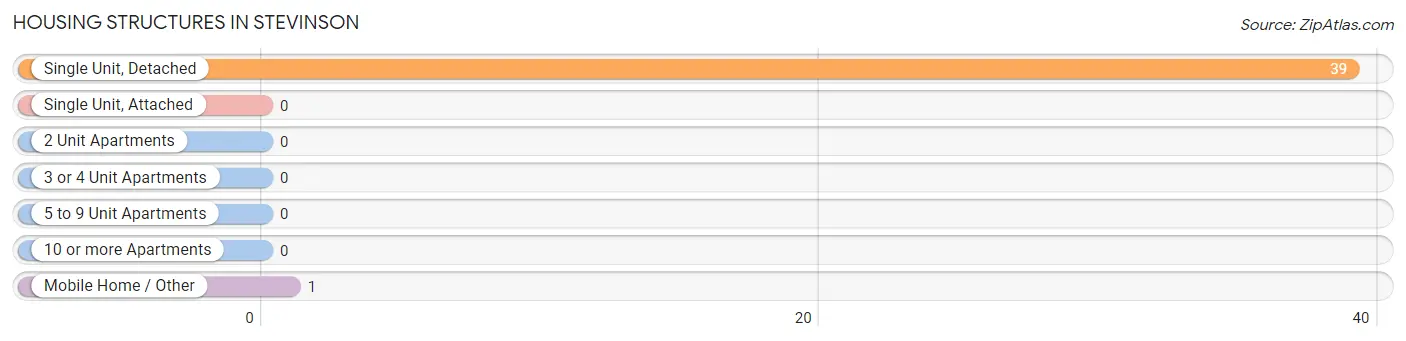
| Structure Type | # Housing Units | % Housing Units |
| Single Unit, Detached | 39 | 97.5% |
| Single Unit, Attached | 0 | 0.0% |
| 2 Unit Apartments | 0 | 0.0% |
| 3 or 4 Unit Apartments | 0 | 0.0% |
| 5 to 9 Unit Apartments | 0 | 0.0% |
| 10 or more Apartments | 0 | 0.0% |
| Mobile Home / Other | 1 | 2.5% |
| Total | 40 | 100.0% |
Housing Structures by Occupancy in Stevinson
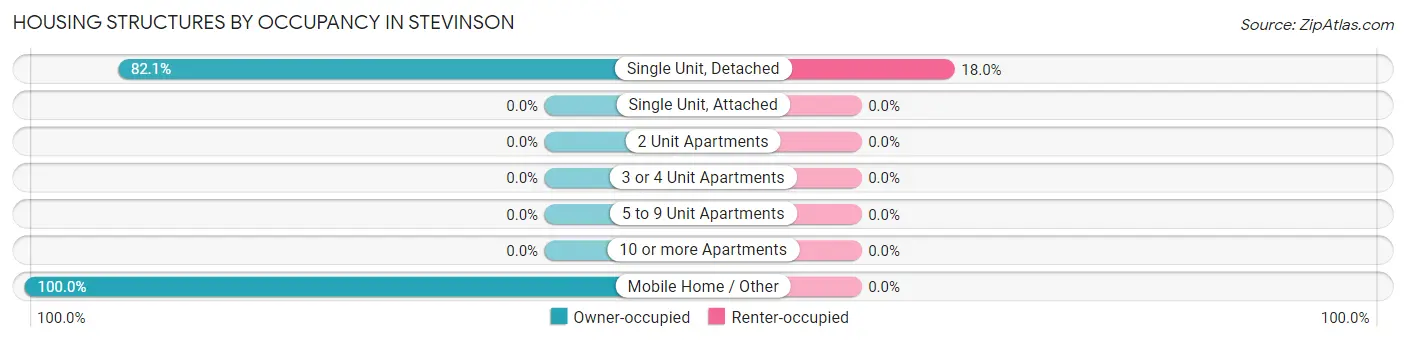
| Structure Type | Owner-occupied | Renter-occupied |
| Single Unit, Detached | 32 (82.1%) | 7 (17.9%) |
| Single Unit, Attached | 0 (0.0%) | 0 (0.0%) |
| 2 Unit Apartments | 0 (0.0%) | 0 (0.0%) |
| 3 or 4 Unit Apartments | 0 (0.0%) | 0 (0.0%) |
| 5 to 9 Unit Apartments | 0 (0.0%) | 0 (0.0%) |
| 10 or more Apartments | 0 (0.0%) | 0 (0.0%) |
| Mobile Home / Other | 1 (100.0%) | 0 (0.0%) |
| Total | 33 (82.5%) | 7 (17.5%) |
Housing Structures by Number of Rooms in Stevinson
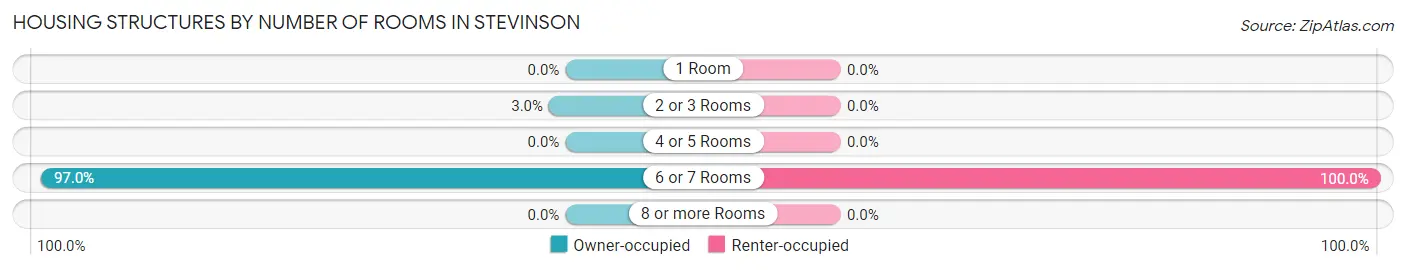
| Number of Rooms | Owner-occupied | Renter-occupied |
| 1 Room | 0 (0.0%) | 0 (0.0%) |
| 2 or 3 Rooms | 1 (3.0%) | 0 (0.0%) |
| 4 or 5 Rooms | 0 (0.0%) | 0 (0.0%) |
| 6 or 7 Rooms | 32 (97.0%) | 7 (100.0%) |
| 8 or more Rooms | 0 (0.0%) | 0 (0.0%) |
| Total | 33 (100.0%) | 7 (100.0%) |
Housing Structure by Heating Type in Stevinson
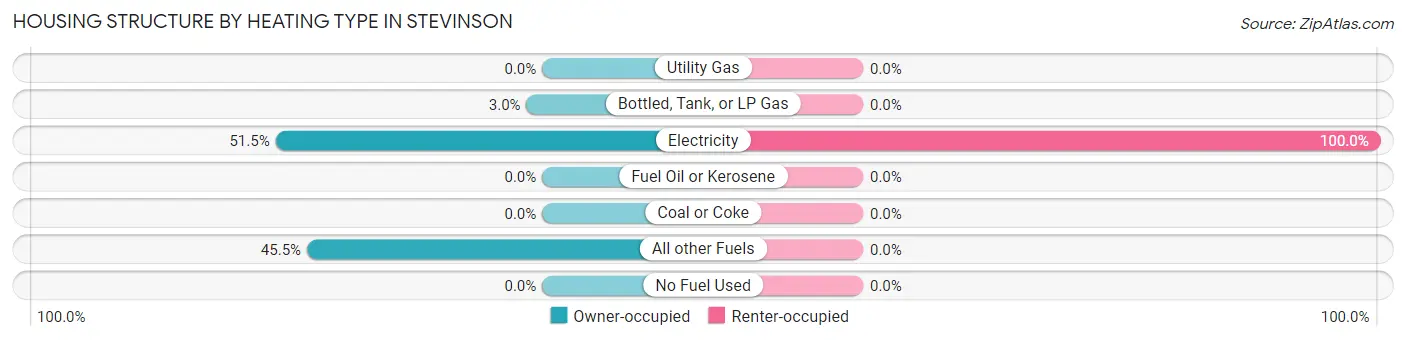
| Heating Type | Owner-occupied | Renter-occupied |
| Utility Gas | 0 (0.0%) | 0 (0.0%) |
| Bottled, Tank, or LP Gas | 1 (3.0%) | 0 (0.0%) |
| Electricity | 17 (51.5%) | 7 (100.0%) |
| Fuel Oil or Kerosene | 0 (0.0%) | 0 (0.0%) |
| Coal or Coke | 0 (0.0%) | 0 (0.0%) |
| All other Fuels | 15 (45.5%) | 0 (0.0%) |
| No Fuel Used | 0 (0.0%) | 0 (0.0%) |
| Total | 33 (100.0%) | 7 (100.0%) |
Household Vehicle Usage in Stevinson
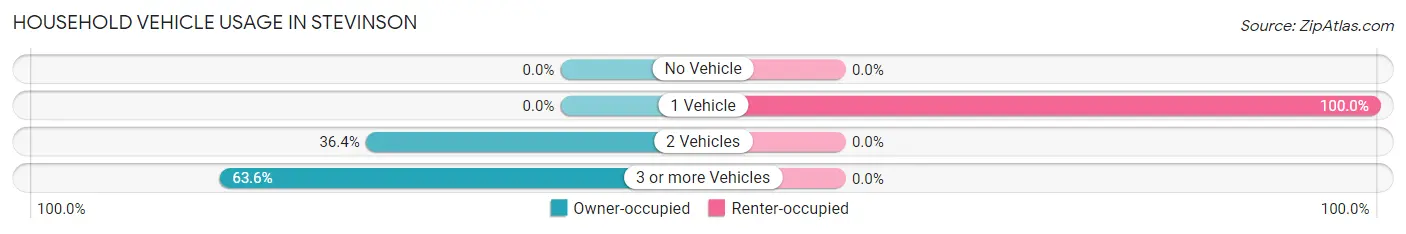
| Vehicles per Household | Owner-occupied | Renter-occupied |
| No Vehicle | 0 (0.0%) | 0 (0.0%) |
| 1 Vehicle | 0 (0.0%) | 7 (100.0%) |
| 2 Vehicles | 12 (36.4%) | 0 (0.0%) |
| 3 or more Vehicles | 21 (63.6%) | 0 (0.0%) |
| Total | 33 (100.0%) | 7 (100.0%) |
Real Estate & Mortgages in Stevinson
Real Estate and Mortgage Overview in Stevinson
| Characteristic | Without Mortgage | With Mortgage |
| Housing Units | 18 | 15 |
| Median Property Value | $1,117,600 | $0 |
| Median Household Income | $250,001 | $0 |
| Monthly Housing Costs | $675 | $0 |
| Real Estate Taxes | $4,667 | $0 |
Property Value by Mortgage Status in Stevinson
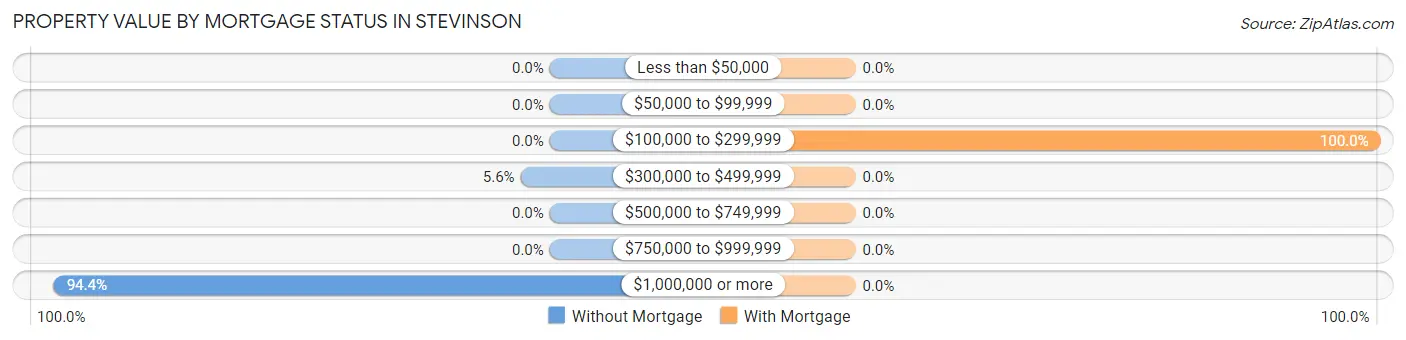
| Property Value | Without Mortgage | With Mortgage |
| Less than $50,000 | 0 (0.0%) | 0 (0.0%) |
| $50,000 to $99,999 | 0 (0.0%) | 0 (0.0%) |
| $100,000 to $299,999 | 0 (0.0%) | 15 (100.0%) |
| $300,000 to $499,999 | 1 (5.6%) | 0 (0.0%) |
| $500,000 to $749,999 | 0 (0.0%) | 0 (0.0%) |
| $750,000 to $999,999 | 0 (0.0%) | 0 (0.0%) |
| $1,000,000 or more | 17 (94.4%) | 0 (0.0%) |
| Total | 18 (100.0%) | 15 (100.0%) |
Household Income by Mortgage Status in Stevinson
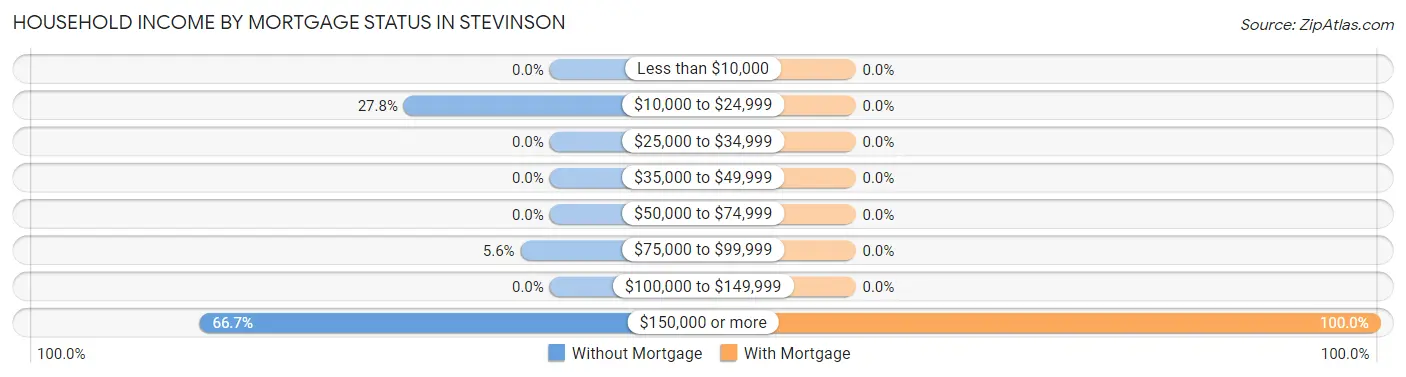
| Household Income | Without Mortgage | With Mortgage |
| Less than $10,000 | 0 (0.0%) | 0 (0.0%) |
| $10,000 to $24,999 | 5 (27.8%) | 0 (0.0%) |
| $25,000 to $34,999 | 0 (0.0%) | 0 (0.0%) |
| $35,000 to $49,999 | 0 (0.0%) | 0 (0.0%) |
| $50,000 to $74,999 | 0 (0.0%) | 0 (0.0%) |
| $75,000 to $99,999 | 1 (5.6%) | 0 (0.0%) |
| $100,000 to $149,999 | 0 (0.0%) | 0 (0.0%) |
| $150,000 or more | 12 (66.7%) | 15 (100.0%) |
| Total | 18 (100.0%) | 15 (100.0%) |
Property Value to Household Income Ratio in Stevinson
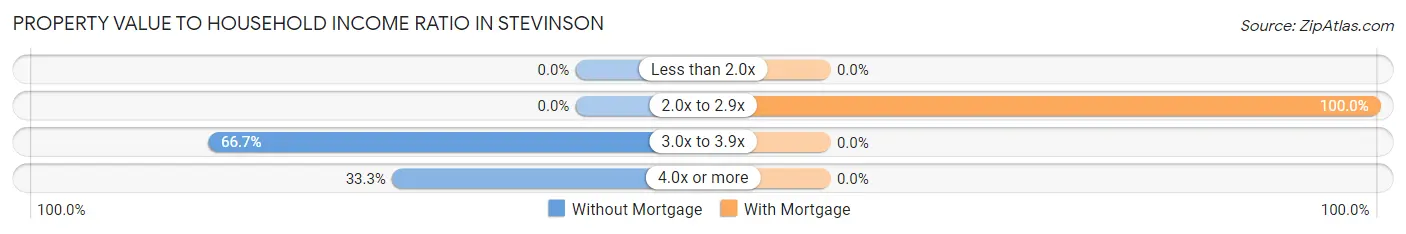
| Value-to-Income Ratio | Without Mortgage | With Mortgage |
| Less than 2.0x | 0 (0.0%) | 0 (0.0%) |
| 2.0x to 2.9x | 0 (0.0%) | 15 (100.0%) |
| 3.0x to 3.9x | 12 (66.7%) | 0 (0.0%) |
| 4.0x or more | 6 (33.3%) | 0 (0.0%) |
| Total | 18 (100.0%) | 15 (100.0%) |
Real Estate Taxes by Mortgage Status in Stevinson
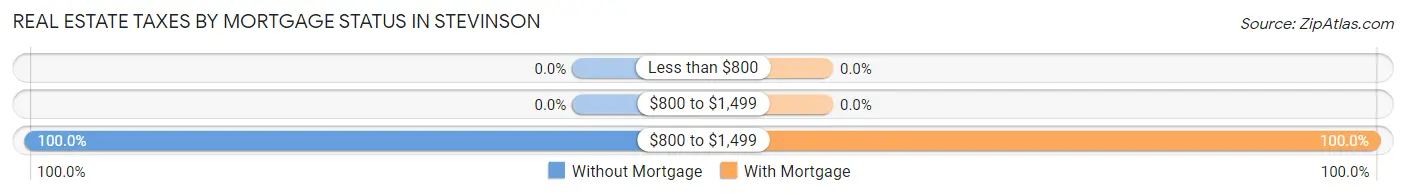
| Property Taxes | Without Mortgage | With Mortgage |
| Less than $800 | 0 (0.0%) | 0 (0.0%) |
| $800 to $1,499 | 0 (0.0%) | 0 (0.0%) |
| $800 to $1,499 | 18 (100.0%) | 15 (100.0%) |
| Total | 18 (100.0%) | 15 (100.0%) |
Health & Disability in Stevinson
Health Insurance Coverage by Age in Stevinson
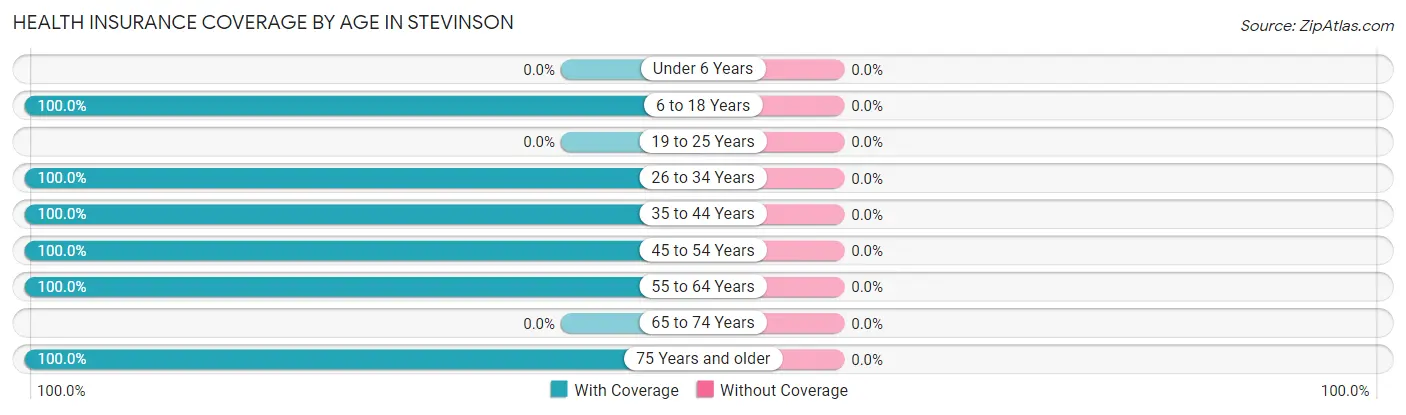
| Age Bracket | With Coverage | Without Coverage |
| Under 6 Years | 0 (0.0%) | 0 (0.0%) |
| 6 to 18 Years | 38 (100.0%) | 0 (0.0%) |
| 19 to 25 Years | 0 (0.0%) | 0 (0.0%) |
| 26 to 34 Years | 4 (100.0%) | 0 (0.0%) |
| 35 to 44 Years | 42 (100.0%) | 0 (0.0%) |
| 45 to 54 Years | 1 (100.0%) | 0 (0.0%) |
| 55 to 64 Years | 17 (100.0%) | 0 (0.0%) |
| 65 to 74 Years | 0 (0.0%) | 0 (0.0%) |
| 75 Years and older | 30 (100.0%) | 0 (0.0%) |
| Total | 132 (100.0%) | 0 (0.0%) |
Health Insurance Coverage by Citizenship Status in Stevinson
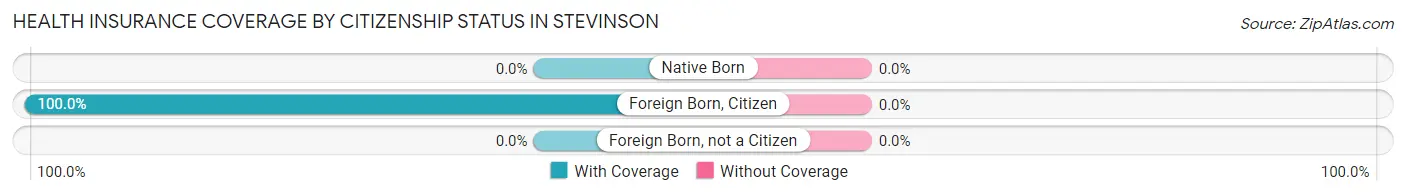
| Citizenship Status | With Coverage | Without Coverage |
| Native Born | 0 (0.0%) | 0 (0.0%) |
| Foreign Born, Citizen | 38 (100.0%) | 0 (0.0%) |
| Foreign Born, not a Citizen | 0 (0.0%) | 0 (0.0%) |
Health Insurance Coverage by Household Income in Stevinson
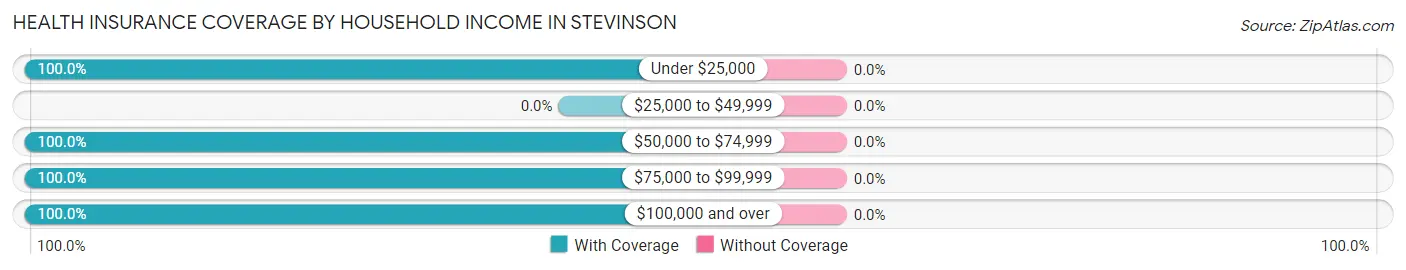
| Household Income | With Coverage | Without Coverage |
| Under $25,000 | 9 (100.0%) | 0 (0.0%) |
| $25,000 to $49,999 | 0 (0.0%) | 0 (0.0%) |
| $50,000 to $74,999 | 7 (100.0%) | 0 (0.0%) |
| $75,000 to $99,999 | 13 (100.0%) | 0 (0.0%) |
| $100,000 and over | 103 (100.0%) | 0 (0.0%) |
Public vs Private Health Insurance Coverage by Age in Stevinson
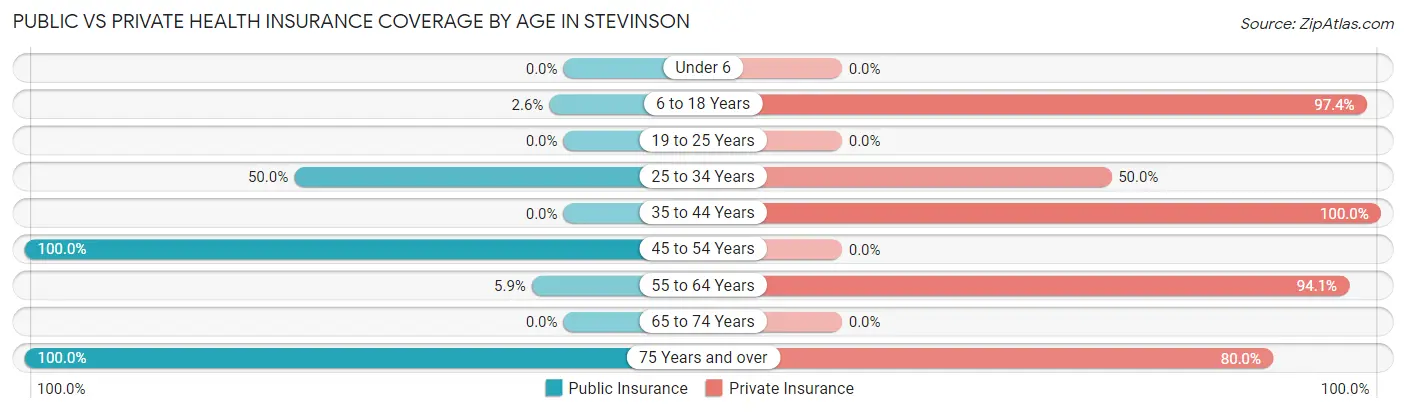
| Age Bracket | Public Insurance | Private Insurance |
| Under 6 | 0 (0.0%) | 0 (0.0%) |
| 6 to 18 Years | 1 (2.6%) | 37 (97.4%) |
| 19 to 25 Years | 0 (0.0%) | 0 (0.0%) |
| 25 to 34 Years | 2 (50.0%) | 2 (50.0%) |
| 35 to 44 Years | 0 (0.0%) | 42 (100.0%) |
| 45 to 54 Years | 1 (100.0%) | 0 (0.0%) |
| 55 to 64 Years | 1 (5.9%) | 16 (94.1%) |
| 65 to 74 Years | 0 (0.0%) | 0 (0.0%) |
| 75 Years and over | 30 (100.0%) | 24 (80.0%) |
| Total | 35 (26.5%) | 121 (91.7%) |
Disability Status by Sex by Age in Stevinson
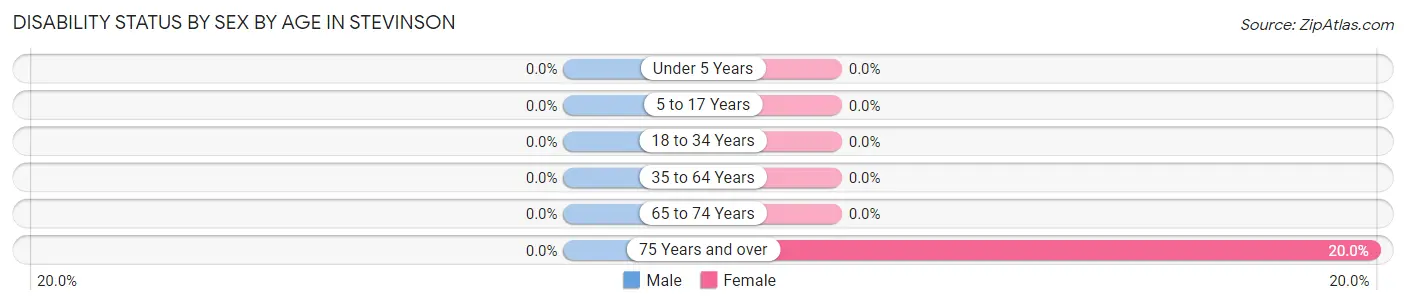
| Age Bracket | Male | Female |
| Under 5 Years | 0 (0.0%) | 0 (0.0%) |
| 5 to 17 Years | 0 (0.0%) | 0 (0.0%) |
| 18 to 34 Years | 0 (0.0%) | 0 (0.0%) |
| 35 to 64 Years | 0 (0.0%) | 0 (0.0%) |
| 65 to 74 Years | 0 (0.0%) | 0 (0.0%) |
| 75 Years and over | 0 (0.0%) | 3 (20.0%) |
Disability Class by Sex by Age in Stevinson
Disability Class: Hearing Difficulty
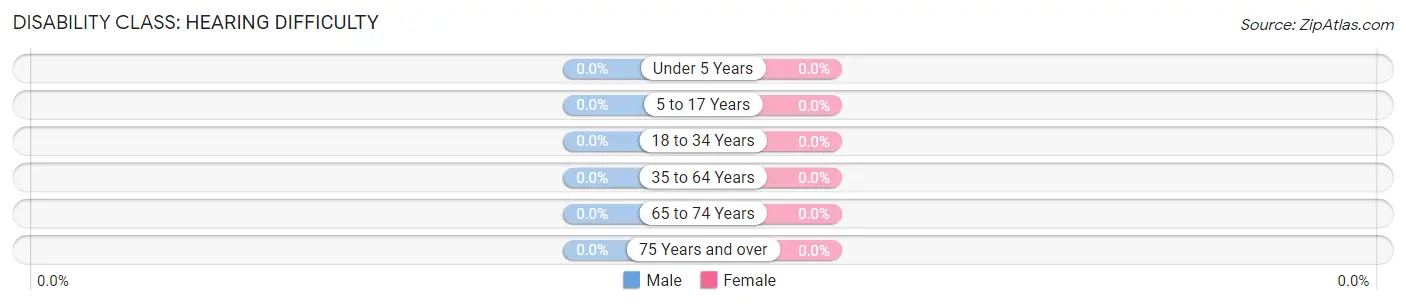
| Age Bracket | Male | Female |
| Under 5 Years | 0 (0.0%) | 0 (0.0%) |
| 5 to 17 Years | 0 (0.0%) | 0 (0.0%) |
| 18 to 34 Years | 0 (0.0%) | 0 (0.0%) |
| 35 to 64 Years | 0 (0.0%) | 0 (0.0%) |
| 65 to 74 Years | 0 (0.0%) | 0 (0.0%) |
| 75 Years and over | 0 (0.0%) | 0 (0.0%) |
Disability Class: Vision Difficulty
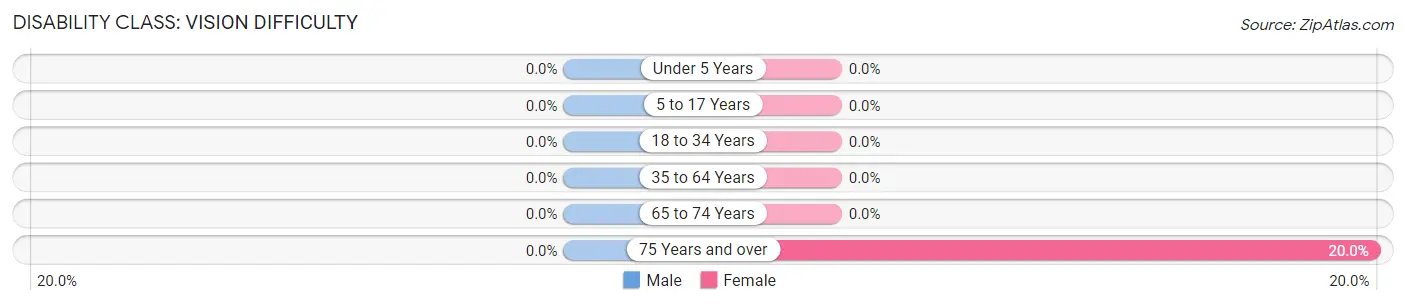
| Age Bracket | Male | Female |
| Under 5 Years | 0 (0.0%) | 0 (0.0%) |
| 5 to 17 Years | 0 (0.0%) | 0 (0.0%) |
| 18 to 34 Years | 0 (0.0%) | 0 (0.0%) |
| 35 to 64 Years | 0 (0.0%) | 0 (0.0%) |
| 65 to 74 Years | 0 (0.0%) | 0 (0.0%) |
| 75 Years and over | 0 (0.0%) | 3 (20.0%) |
Disability Class: Cognitive Difficulty
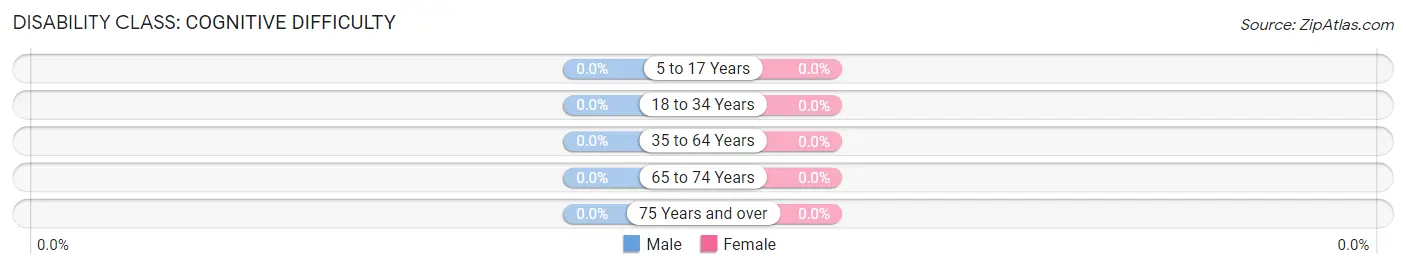
| Age Bracket | Male | Female |
| 5 to 17 Years | 0 (0.0%) | 0 (0.0%) |
| 18 to 34 Years | 0 (0.0%) | 0 (0.0%) |
| 35 to 64 Years | 0 (0.0%) | 0 (0.0%) |
| 65 to 74 Years | 0 (0.0%) | 0 (0.0%) |
| 75 Years and over | 0 (0.0%) | 0 (0.0%) |
Disability Class: Ambulatory Difficulty
| Age Bracket | Male | Female |
| 5 to 17 Years | 0 (0.0%) | 0 (0.0%) |
| 18 to 34 Years | 0 (0.0%) | 0 (0.0%) |
| 35 to 64 Years | 0 (0.0%) | 0 (0.0%) |
| 65 to 74 Years | 0 (0.0%) | 0 (0.0%) |
| 75 Years and over | 0 (0.0%) | 0 (0.0%) |
Disability Class: Self-Care Difficulty
| Age Bracket | Male | Female |
| 5 to 17 Years | 0 (0.0%) | 0 (0.0%) |
| 18 to 34 Years | 0 (0.0%) | 0 (0.0%) |
| 35 to 64 Years | 0 (0.0%) | 0 (0.0%) |
| 65 to 74 Years | 0 (0.0%) | 0 (0.0%) |
| 75 Years and over | 0 (0.0%) | 0 (0.0%) |
Technology Access in Stevinson
Computing Device Access in Stevinson
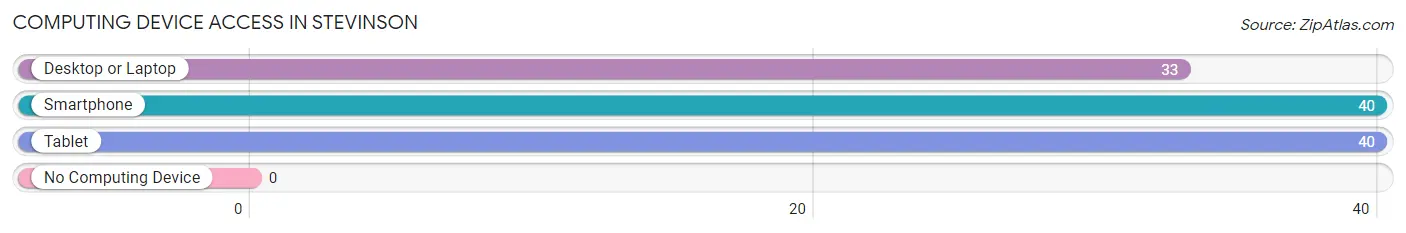
| Device Type | # Households | % Households |
| Desktop or Laptop | 33 | 82.5% |
| Smartphone | 40 | 100.0% |
| Tablet | 40 | 100.0% |
| No Computing Device | 0 | 0.0% |
| Total | 40 | 100.0% |
Internet Access in Stevinson
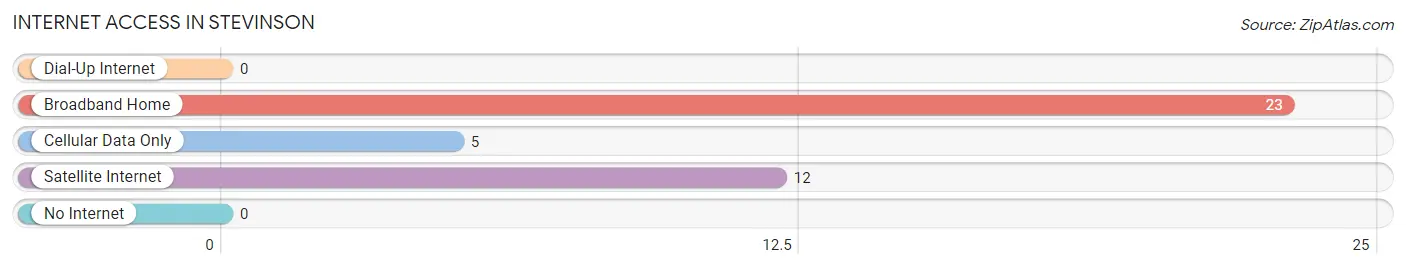
| Internet Type | # Households | % Households |
| Dial-Up Internet | 0 | 0.0% |
| Broadband Home | 23 | 57.5% |
| Cellular Data Only | 5 | 12.5% |
| Satellite Internet | 12 | 30.0% |
| No Internet | 0 | 0.0% |
| Total | 40 | 100.0% |
Stevinson Summary
Stevinson is a small unincorporated community located in Merced County, California. It is situated in the San Joaquin Valley, approximately 10 miles east of the city of Merced. The population of Stevinson was estimated to be around 1,000 in 2020.
History
The area that is now Stevinson was originally inhabited by the Yokuts Native American tribe. The first European settlers arrived in the area in the late 1800s, and the town was officially founded in 1891. The town was named after the Stevinson family, who were among the first settlers in the area.
The town was initially a farming community, with the main crops being wheat, barley, and alfalfa. In the early 1900s, the town began to grow as more people moved to the area. The town was home to a number of businesses, including a general store, a blacksmith shop, and a hotel.
In the 1950s, the town began to decline as many of the businesses closed and the population decreased. In the 1970s, the town was revitalized with the opening of a new school and the construction of a new highway.
Geography
Stevinson is located in the San Joaquin Valley, approximately 10 miles east of the city of Merced. The town is situated on the banks of the Merced River, which flows through the area. The town is surrounded by agricultural land, with the main crops being wheat, barley, and alfalfa.
The climate in Stevinson is hot and dry in the summer, with temperatures reaching up to 100 degrees Fahrenheit. In the winter, temperatures can drop to freezing.
Economy
The economy of Stevinson is largely based on agriculture. The main crops grown in the area are wheat, barley, and alfalfa. The town is also home to a number of small businesses, including a general store, a blacksmith shop, and a hotel.
Demographics
The population of Stevinson was estimated to be around 1,000 in 2020. The town is predominantly white, with a small Hispanic population. The median household income in the town is $45,000, and the median home value is $200,000. The town has a high rate of poverty, with nearly 30% of the population living below the poverty line.
Common Questions
What is Per Capita Income in Stevinson?
Per Capita income in Stevinson is $52,736.
What is the Median Household income in Stevinson?
Median Household Income in Stevinson is $118,667.
What is Inequality or Gini Index in Stevinson?
Inequality or Gini Index in Stevinson is 0.34.
What is the Total Population of Stevinson?
Total Population of Stevinson is 132.
What is the Total Male Population of Stevinson?
Total Male Population of Stevinson is 72.
What is the Total Female Population of Stevinson?
Total Female Population of Stevinson is 60.
What is the Ratio of Males per 100 Females in Stevinson?
There are 120.00 Males per 100 Females in Stevinson.
What is the Ratio of Females per 100 Males in Stevinson?
There are 83.33 Females per 100 Males in Stevinson.
What is the Median Population Age in Stevinson?
Median Population Age in Stevinson is 38.9 Years.
What is the Average Family Size in Stevinson
Average Family Size in Stevinson is 3.8 People.
What is the Average Household Size in Stevinson
Average Household Size in Stevinson is 3.3 People.
How Large is the Labor Force in Stevinson?
There are 54 People in the Labor Forcein in Stevinson.
What is the Percentage of People in the Labor Force in Stevinson?
57.4% of People are in the Labor Force in Stevinson.
What is the Unemployment Rate in Stevinson?
Unemployment Rate in Stevinson is 3.7%.