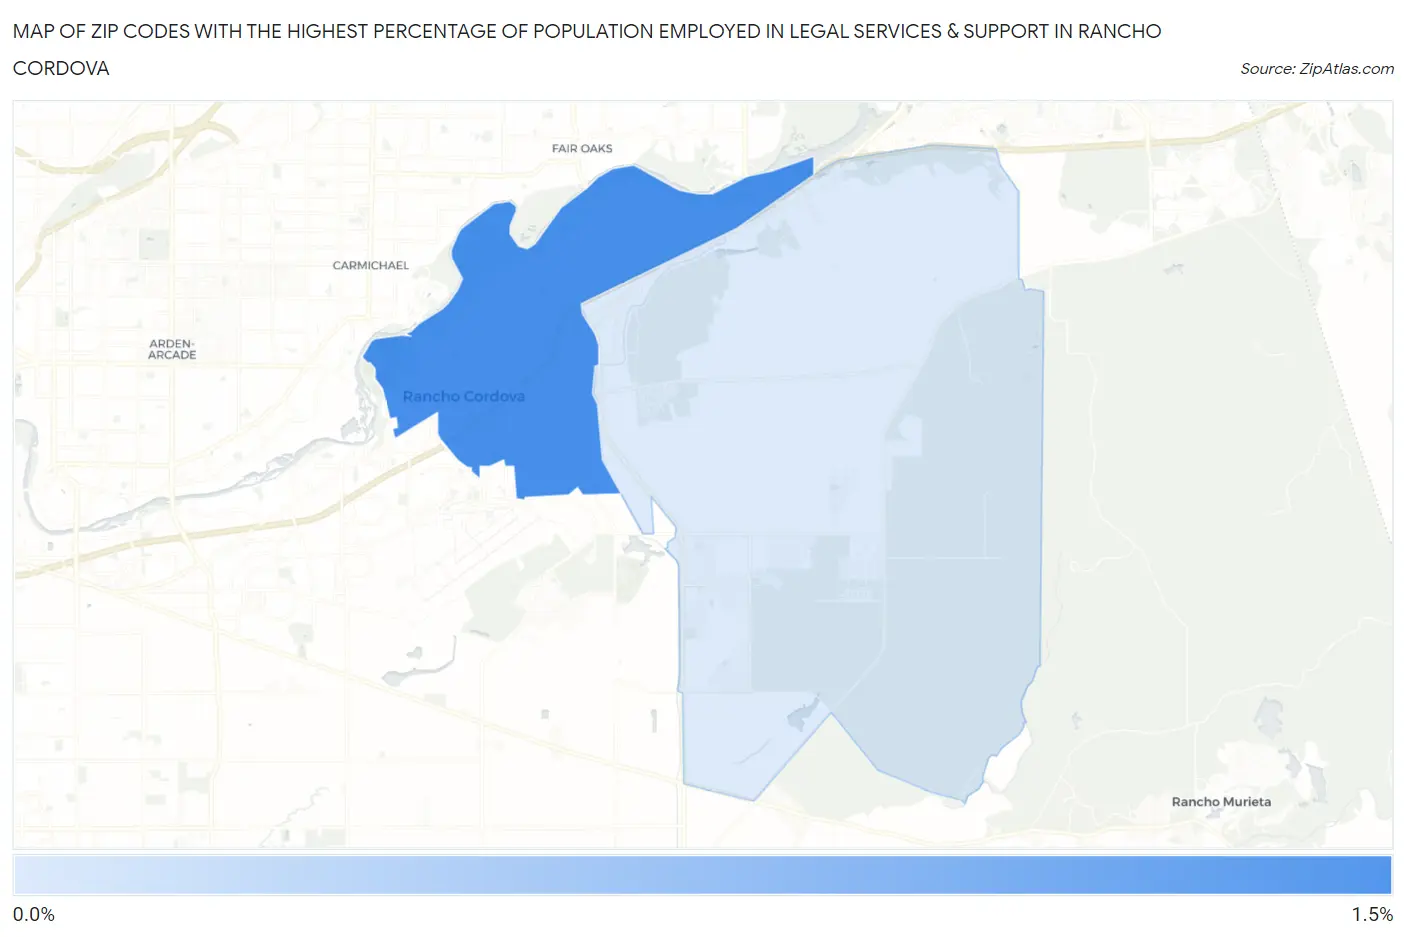
Zip Codes with the Highest Percentage of Population Employed in Legal Services & Support in Rancho Cordova, CA
RELATED REPORTS & OPTIONS
Legal Services & Support
Rancho Cordova
Compare Zip Codes
Map of Zip Codes with the Highest Percentage of Population Employed in Legal Services & Support in Rancho Cordova
0.0%
1.5%
Zip Codes with the Highest Percentage of Population Employed in Legal Services & Support in Rancho Cordova, CA
| Zip Code | % Employed | vs State | vs National | |
| 1. | 95670 | 1.2% | 1.3%(-0.078)#546 | 1.2%(-0.004)#6,645 |
| 2. | 95742 | 0.41% | 1.3%(-0.848)#1,002 | 1.2%(-0.774)#13,731 |
1
Common Questions
What are the Top Zip Codes with the Highest Percentage of Population Employed in Legal Services & Support in Rancho Cordova, CA?
Top Zip Codes with the Highest Percentage of Population Employed in Legal Services & Support in Rancho Cordova, CA are:
What zip code has the Highest Percentage of Population Employed in Legal Services & Support in Rancho Cordova, CA?
95670 has the Highest Percentage of Population Employed in Legal Services & Support in Rancho Cordova, CA with 1.2%.
What is the Percentage of Population Employed in Legal Services & Support in Rancho Cordova, CA?
Percentage of Population Employed in Legal Services & Support in Rancho Cordova is 0.62%.
What is the Percentage of Population Employed in Legal Services & Support in California?
Percentage of Population Employed in Legal Services & Support in California is 1.3%.
What is the Percentage of Population Employed in Legal Services & Support in the United States?
Percentage of Population Employed in Legal Services & Support in the United States is 1.2%.