Gold River, CA Map & Demographics
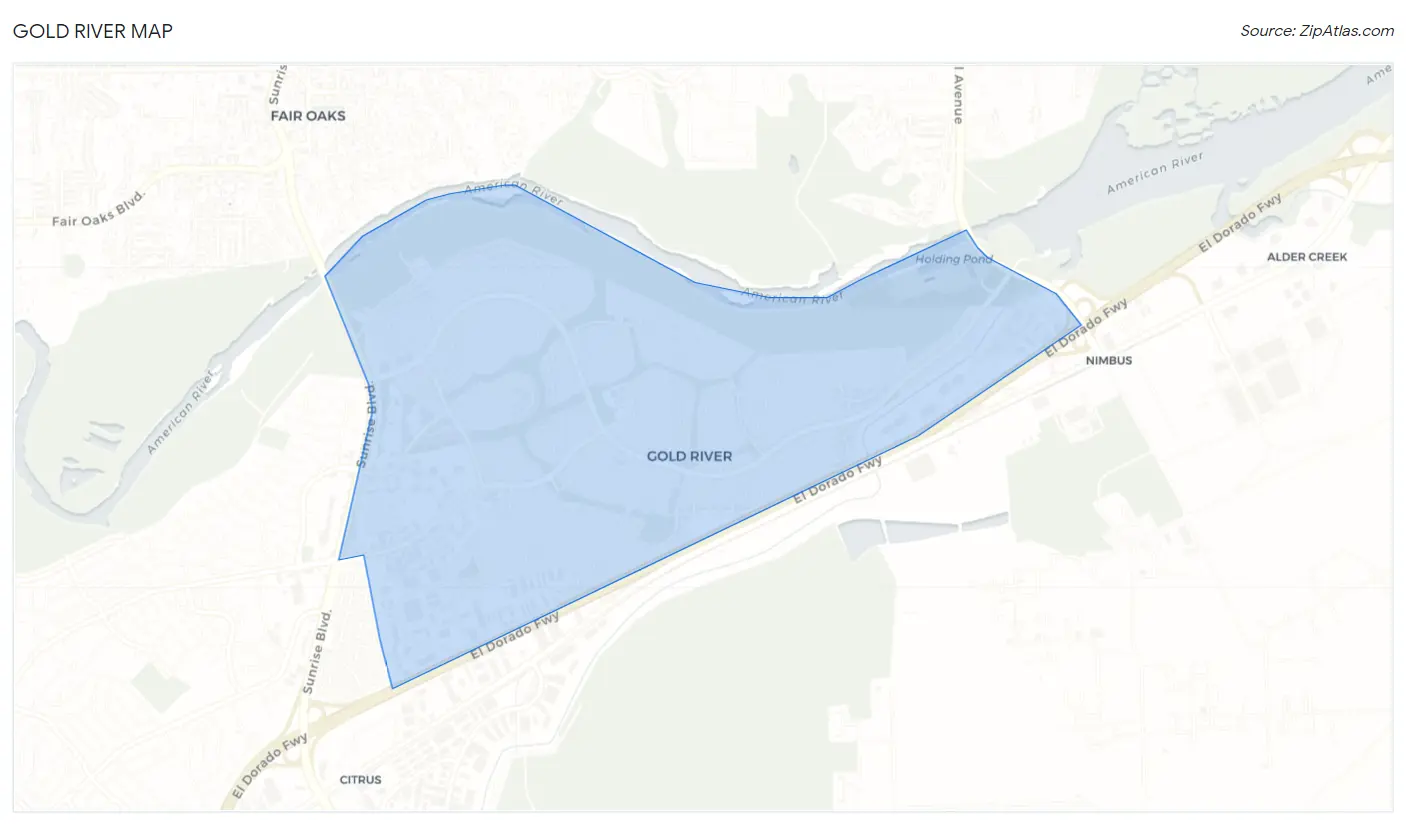
Gold River Map
Gold River Overview
$81,209
PER CAPITA INCOME
$164,986
AVG FAMILY INCOME
$153,438
AVG HOUSEHOLD INCOME
39.1%
WAGE / INCOME GAP [ % ]
60.9¢/ $1
WAGE / INCOME GAP [ $ ]
0.41
INEQUALITY / GINI INDEX
7,910
TOTAL POPULATION
3,972
MALE POPULATION
3,938
FEMALE POPULATION
100.86
MALES / 100 FEMALES
99.14
FEMALES / 100 MALES
52.2
MEDIAN AGE
2.7
AVG FAMILY SIZE
2.3
AVG HOUSEHOLD SIZE
3,867
LABOR FORCE [ PEOPLE ]
58.2%
PERCENT IN LABOR FORCE
3.5%
UNEMPLOYMENT RATE
Gold River Area Codes
Income in Gold River
Income Overview in Gold River
Per Capita Income in Gold River is $81,209, while median incomes of families and households are $164,986 and $153,438 respectively.
| Characteristic | Number | Measure |
| Per Capita Income | 7,910 | $81,209 |
| Median Family Income | 2,519 | $164,986 |
| Mean Family Income | 2,519 | $208,989 |
| Median Household Income | 3,459 | $153,438 |
| Mean Household Income | 3,459 | $184,429 |
| Income Deficit | 2,519 | $0 |
| Wage / Income Gap (%) | 7,910 | 39.14% |
| Wage / Income Gap ($) | 7,910 | 60.86¢ per $1 |
| Gini / Inequality Index | 7,910 | 0.41 |
Earnings by Sex in Gold River
Average Earnings in Gold River are $85,707, $104,338 for men and $63,504 for women, a difference of 39.1%.
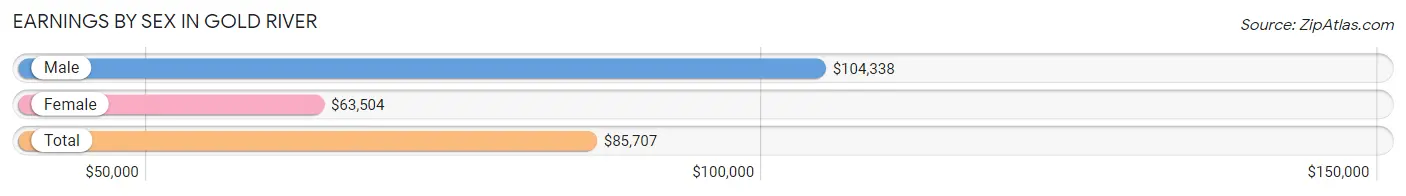
| Sex | Number | Average Earnings |
| Male | 2,172 (54.1%) | $104,338 |
| Female | 1,845 (45.9%) | $63,504 |
| Total | 4,017 (100.0%) | $85,707 |
Earnings by Sex by Income Bracket in Gold River
The most common earnings brackets in Gold River are $100,000+ for men (1,127 | 51.9%) and $100,000+ for women (624 | 33.8%).
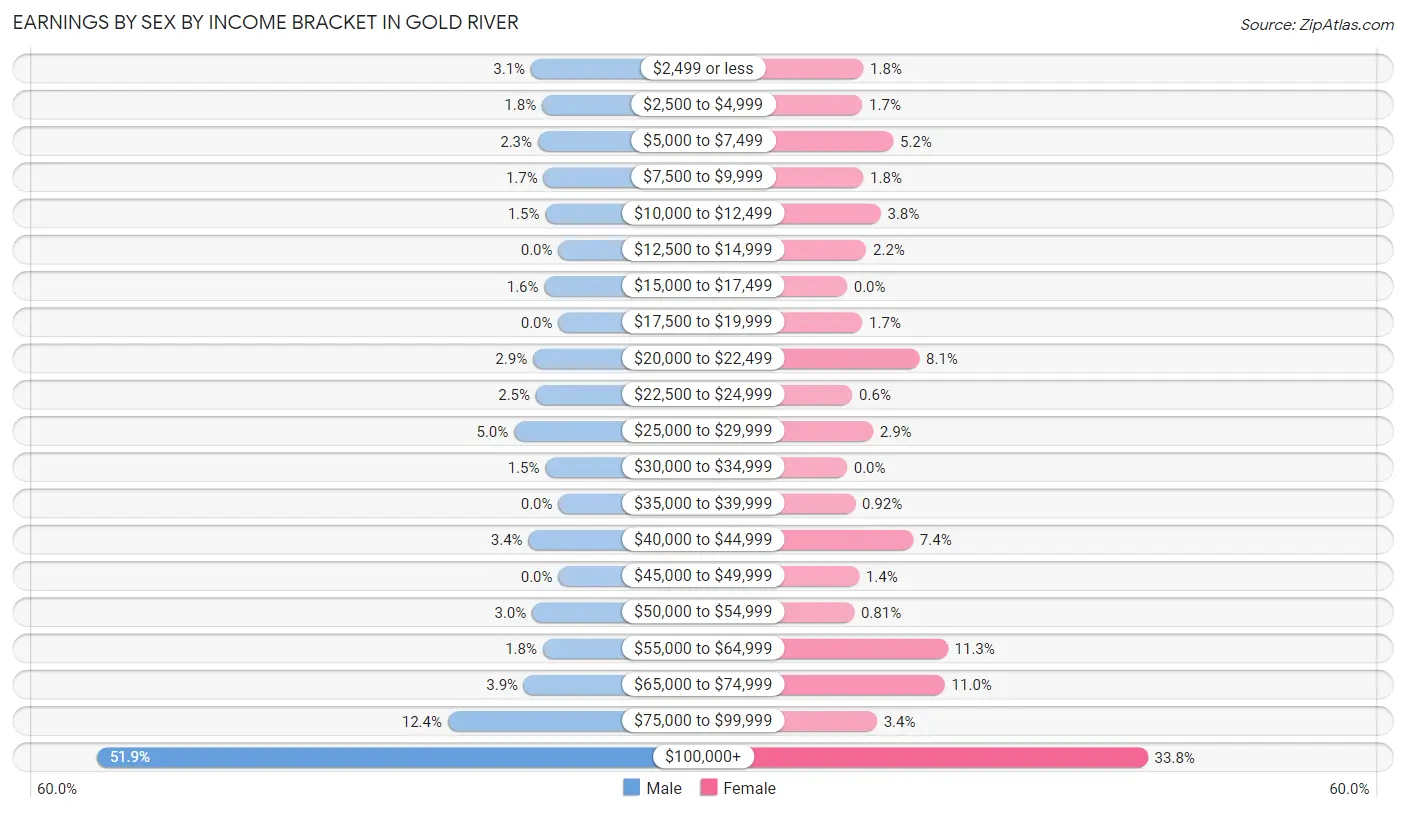
| Income | Male | Female |
| $2,499 or less | 67 (3.1%) | 34 (1.8%) |
| $2,500 to $4,999 | 40 (1.8%) | 32 (1.7%) |
| $5,000 to $7,499 | 50 (2.3%) | 96 (5.2%) |
| $7,500 to $9,999 | 36 (1.7%) | 34 (1.8%) |
| $10,000 to $12,499 | 32 (1.5%) | 70 (3.8%) |
| $12,500 to $14,999 | 0 (0.0%) | 40 (2.2%) |
| $15,000 to $17,499 | 34 (1.6%) | 0 (0.0%) |
| $17,500 to $19,999 | 0 (0.0%) | 32 (1.7%) |
| $20,000 to $22,499 | 62 (2.9%) | 150 (8.1%) |
| $22,500 to $24,999 | 55 (2.5%) | 11 (0.6%) |
| $25,000 to $29,999 | 108 (5.0%) | 54 (2.9%) |
| $30,000 to $34,999 | 32 (1.5%) | 0 (0.0%) |
| $35,000 to $39,999 | 0 (0.0%) | 17 (0.9%) |
| $40,000 to $44,999 | 73 (3.4%) | 137 (7.4%) |
| $45,000 to $49,999 | 0 (0.0%) | 25 (1.4%) |
| $50,000 to $54,999 | 64 (2.9%) | 15 (0.8%) |
| $55,000 to $64,999 | 38 (1.8%) | 209 (11.3%) |
| $65,000 to $74,999 | 84 (3.9%) | 203 (11.0%) |
| $75,000 to $99,999 | 270 (12.4%) | 62 (3.4%) |
| $100,000+ | 1,127 (51.9%) | 624 (33.8%) |
| Total | 2,172 (100.0%) | 1,845 (100.0%) |
Earnings by Sex by Educational Attainment in Gold River
Average earnings in Gold River are $106,992 for men and $65,357 for women, a difference of 38.9%. Men with an educational attainment of graduate degree enjoy the highest average annual earnings of $125,938, while those with bachelor's degree education earn the least with $106,058. Women with an educational attainment of graduate degree earn the most with the average annual earnings of $102,975, while those with bachelor's degree education have the smallest earnings of $58,713.
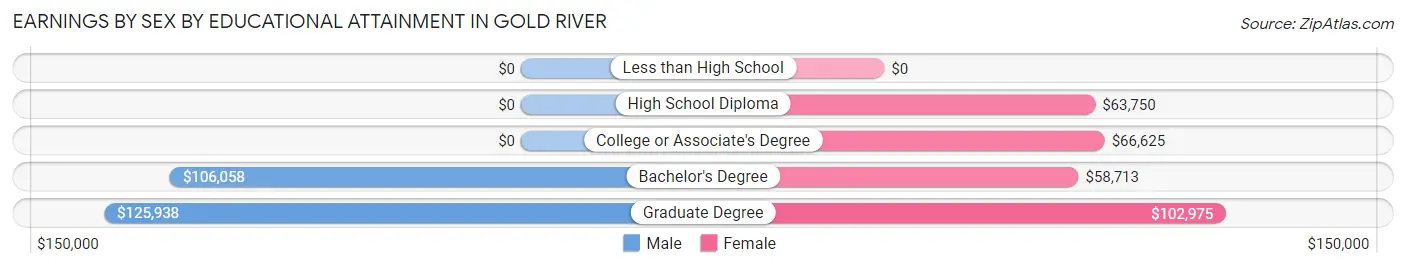
| Educational Attainment | Male Income | Female Income |
| Less than High School | - | - |
| High School Diploma | - | - |
| College or Associate's Degree | - | - |
| Bachelor's Degree | $106,058 | $58,713 |
| Graduate Degree | $125,938 | $102,975 |
| Total | $106,992 | $65,357 |
Family Income in Gold River
Family Income Brackets in Gold River
According to the Gold River family income data, there are 982 families falling into the $200,000+ income range, which is the most common income bracket and makes up 39.0% of all families.
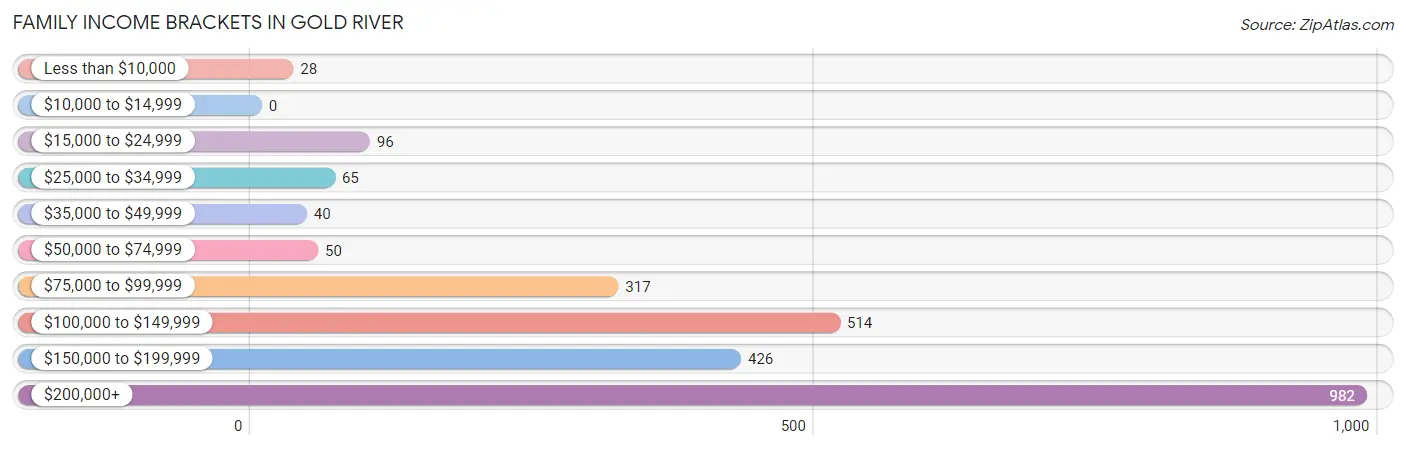
| Income Bracket | # Families | % Families |
| Less than $10,000 | 28 | 1.1% |
| $10,000 to $14,999 | 0 | 0.0% |
| $15,000 to $24,999 | 96 | 3.8% |
| $25,000 to $34,999 | 65 | 2.6% |
| $35,000 to $49,999 | 40 | 1.6% |
| $50,000 to $74,999 | 50 | 2.0% |
| $75,000 to $99,999 | 317 | 12.6% |
| $100,000 to $149,999 | 514 | 20.4% |
| $150,000 to $199,999 | 426 | 16.9% |
| $200,000+ | 982 | 39.0% |
Family Income by Famaliy Size in Gold River
5-person families (111 | 4.4%) account for the highest median family income in Gold River with $250,001 per family, while 2-person families (1,527 | 60.6%) have the highest median income of $81,614 per family member.
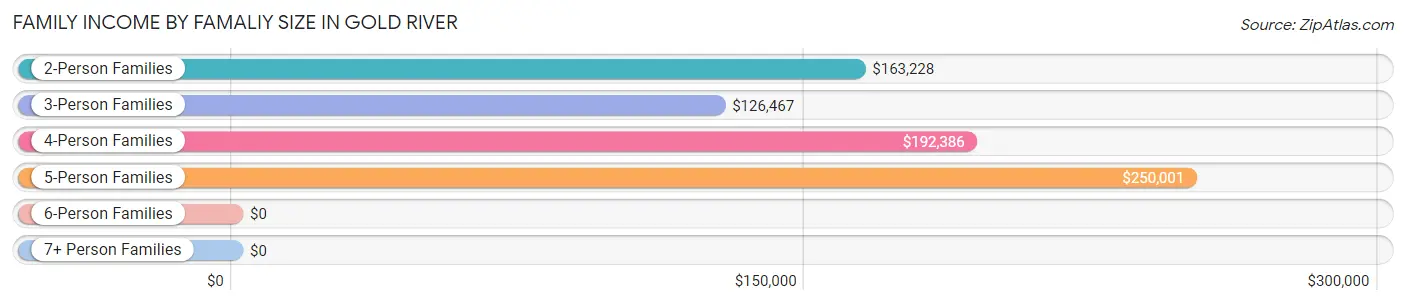
| Income Bracket | # Families | Median Income |
| 2-Person Families | 1,527 (60.6%) | $163,228 |
| 3-Person Families | 437 (17.3%) | $126,467 |
| 4-Person Families | 431 (17.1%) | $192,386 |
| 5-Person Families | 111 (4.4%) | $250,001 |
| 6-Person Families | 13 (0.5%) | $0 |
| 7+ Person Families | 0 (0.0%) | $0 |
| Total | 2,519 (100.0%) | $164,986 |
Family Income by Number of Earners in Gold River
The median family income in Gold River is $164,986, with families comprising 3+ earners (202) having the highest median family income of $250,001, while families with no earners (520) have the lowest median family income of $129,750, accounting for 8.0% and 20.6% of families, respectively.
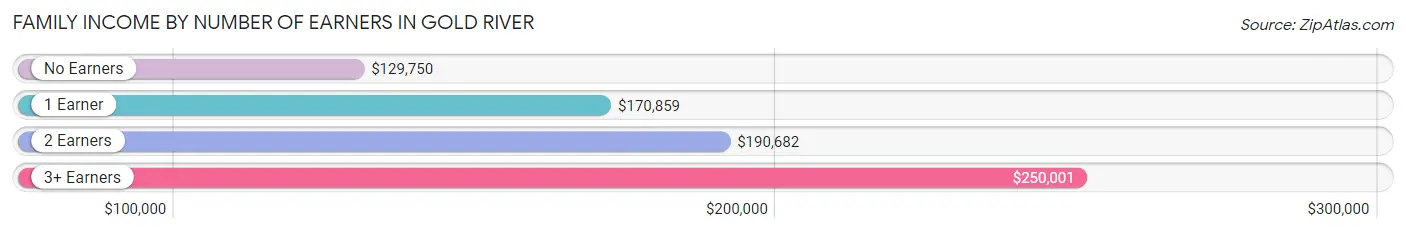
| Number of Earners | # Families | Median Income |
| No Earners | 520 (20.6%) | $129,750 |
| 1 Earner | 809 (32.1%) | $170,859 |
| 2 Earners | 988 (39.2%) | $190,682 |
| 3+ Earners | 202 (8.0%) | $250,001 |
| Total | 2,519 (100.0%) | $164,986 |
Household Income in Gold River
Household Income Brackets in Gold River
With 1,124 households falling in the category, the $200,000+ income range is the most frequent in Gold River, accounting for 32.5% of all households. In contrast, only 35 households (1.0%) fall into the $10,000 to $14,999 income bracket, making it the least populous group.
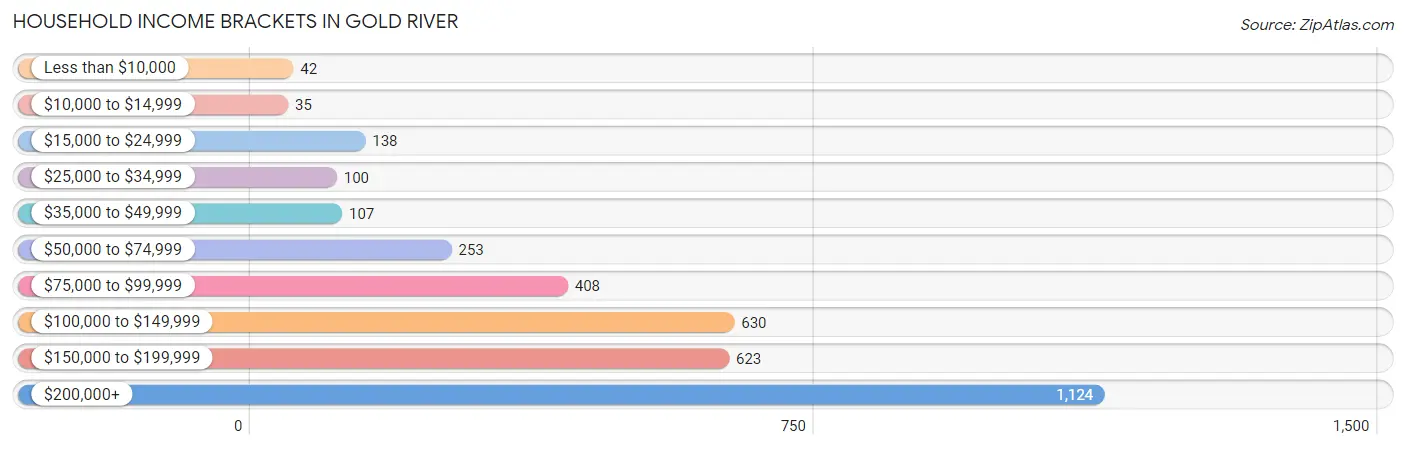
| Income Bracket | # Households | % Households |
| Less than $10,000 | 42 | 1.2% |
| $10,000 to $14,999 | 35 | 1.0% |
| $15,000 to $24,999 | 138 | 4.0% |
| $25,000 to $34,999 | 100 | 2.9% |
| $35,000 to $49,999 | 107 | 3.1% |
| $50,000 to $74,999 | 253 | 7.3% |
| $75,000 to $99,999 | 408 | 11.8% |
| $100,000 to $149,999 | 630 | 18.2% |
| $150,000 to $199,999 | 623 | 18.0% |
| $200,000+ | 1,124 | 32.5% |
Household Income by Householder Age in Gold River
The median household income in Gold River is $153,438, with the highest median household income of $167,737 found in the 45 to 64 years age bracket for the primary householder. A total of 1,363 households (39.4%) fall into this category. Meanwhile, the 15 to 24 years age bracket for the primary householder has the lowest median household income of $0, with 33 households (0.9%) in this group.
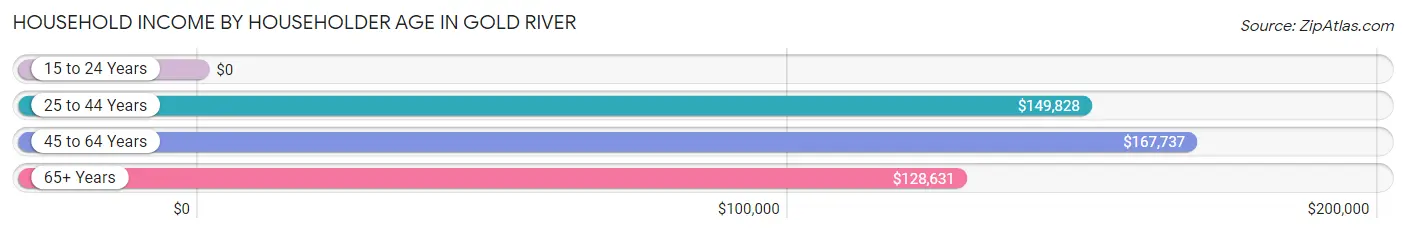
| Income Bracket | # Households | Median Income |
| 15 to 24 Years | 33 (0.9%) | $0 |
| 25 to 44 Years | 488 (14.1%) | $149,828 |
| 45 to 64 Years | 1,363 (39.4%) | $167,737 |
| 65+ Years | 1,575 (45.5%) | $128,631 |
| Total | 3,459 (100.0%) | $153,438 |
Poverty in Gold River
Income Below Poverty by Sex and Age in Gold River
With 2.8% poverty level for males and 2.3% for females among the residents of Gold River, 18 to 24 year old males and 18 to 24 year old females are the most vulnerable to poverty, with 41 males (24.1%) and 42 females (47.7%) in their respective age groups living below the poverty level.
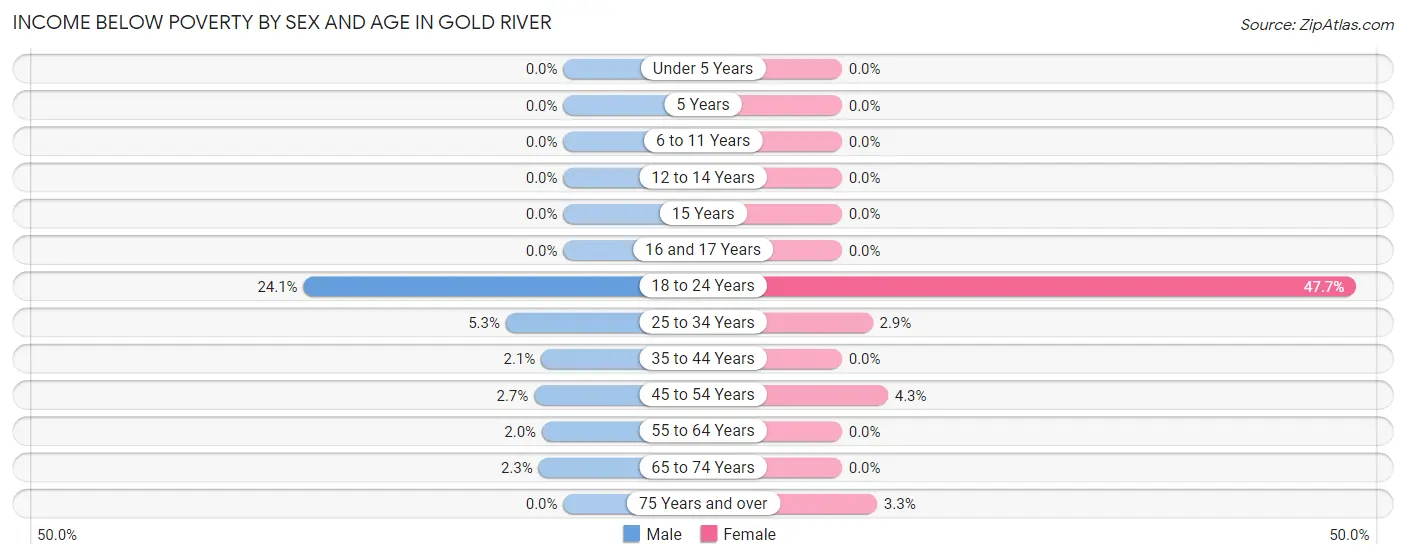
| Age Bracket | Male | Female |
| Under 5 Years | 0 (0.0%) | 0 (0.0%) |
| 5 Years | 0 (0.0%) | 0 (0.0%) |
| 6 to 11 Years | 0 (0.0%) | 0 (0.0%) |
| 12 to 14 Years | 0 (0.0%) | 0 (0.0%) |
| 15 Years | 0 (0.0%) | 0 (0.0%) |
| 16 and 17 Years | 0 (0.0%) | 0 (0.0%) |
| 18 to 24 Years | 41 (24.1%) | 42 (47.7%) |
| 25 to 34 Years | 14 (5.3%) | 9 (2.9%) |
| 35 to 44 Years | 8 (2.1%) | 0 (0.0%) |
| 45 to 54 Years | 15 (2.7%) | 26 (4.3%) |
| 55 to 64 Years | 14 (2.0%) | 0 (0.0%) |
| 65 to 74 Years | 19 (2.3%) | 0 (0.0%) |
| 75 Years and over | 0 (0.0%) | 14 (3.3%) |
| Total | 111 (2.8%) | 91 (2.3%) |
Income Above Poverty by Sex and Age in Gold River
According to the poverty statistics in Gold River, males aged under 5 years and females aged under 5 years are the age groups that are most secure financially, with 100.0% of males and 100.0% of females in these age groups living above the poverty line.
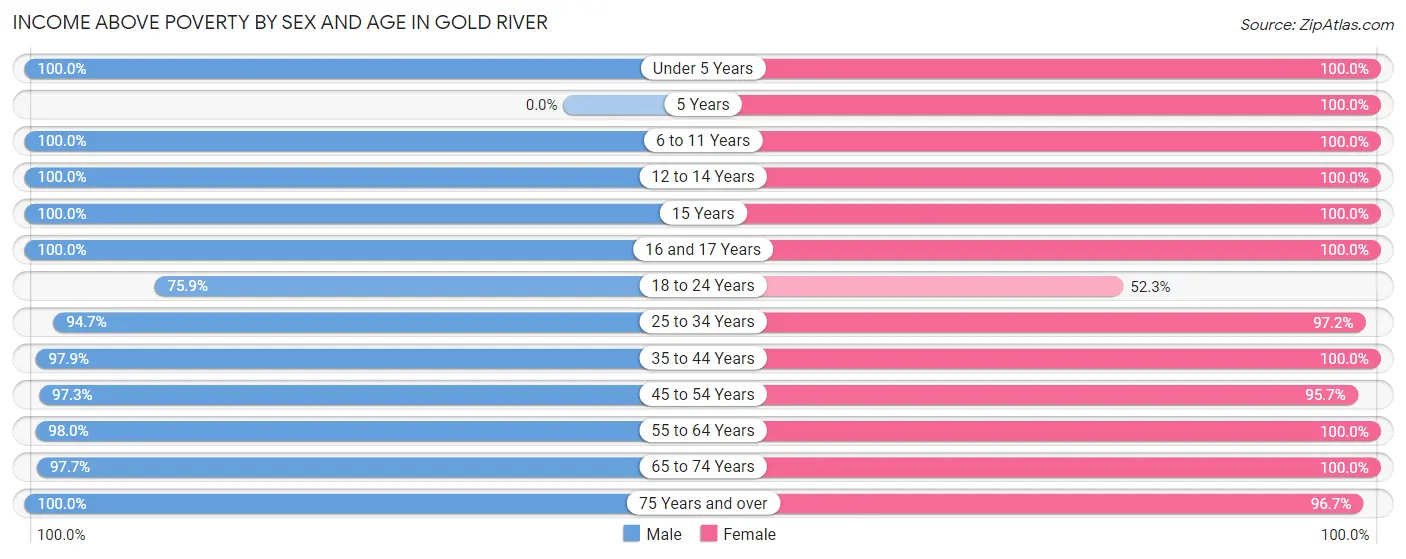
| Age Bracket | Male | Female |
| Under 5 Years | 73 (100.0%) | 231 (100.0%) |
| 5 Years | 0 (0.0%) | 94 (100.0%) |
| 6 to 11 Years | 277 (100.0%) | 181 (100.0%) |
| 12 to 14 Years | 201 (100.0%) | 127 (100.0%) |
| 15 Years | 9 (100.0%) | 56 (100.0%) |
| 16 and 17 Years | 81 (100.0%) | 94 (100.0%) |
| 18 to 24 Years | 129 (75.9%) | 46 (52.3%) |
| 25 to 34 Years | 248 (94.7%) | 307 (97.2%) |
| 35 to 44 Years | 380 (97.9%) | 412 (100.0%) |
| 45 to 54 Years | 539 (97.3%) | 583 (95.7%) |
| 55 to 64 Years | 689 (98.0%) | 478 (100.0%) |
| 65 to 74 Years | 808 (97.7%) | 822 (100.0%) |
| 75 Years and over | 410 (100.0%) | 416 (96.7%) |
| Total | 3,844 (97.2%) | 3,847 (97.7%) |
Income Below Poverty Among Married-Couple Families in Gold River
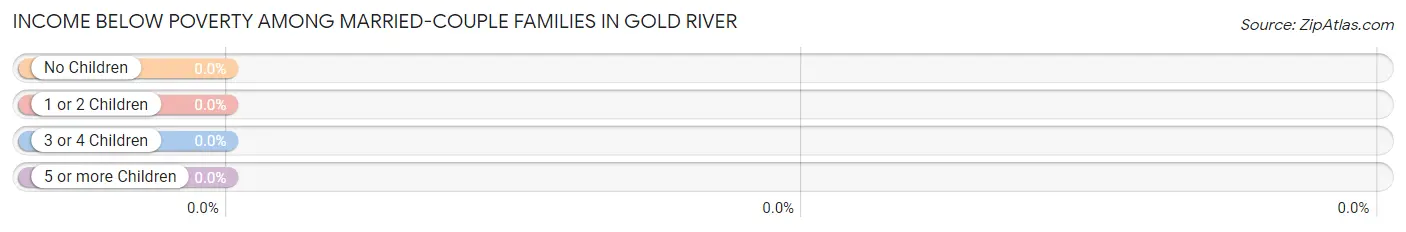
| Children | Above Poverty | Below Poverty |
| No Children | 1,516 (100.0%) | 0 (0.0%) |
| 1 or 2 Children | 631 (100.0%) | 0 (0.0%) |
| 3 or 4 Children | 31 (100.0%) | 0 (0.0%) |
| 5 or more Children | 0 (0.0%) | 0 (0.0%) |
| Total | 2,178 (100.0%) | 0 (0.0%) |
Income Below Poverty Among Single-Parent Households in Gold River
According to the poverty data in Gold River, 8.2% or 14 single-father households and 8.2% or 14 single-mother households are living below the poverty line. Among single-father households, those with no children have the highest poverty rate, with 14 households (28.0%) experiencing poverty. Likewise, among single-mother households, those with no children have the highest poverty rate, with 14 households (10.4%) falling below the poverty line.
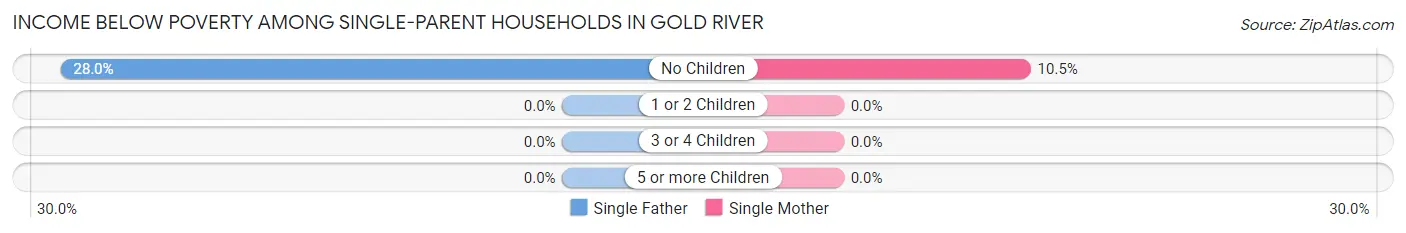
| Children | Single Father | Single Mother |
| No Children | 14 (28.0%) | 14 (10.4%) |
| 1 or 2 Children | 0 (0.0%) | 0 (0.0%) |
| 3 or 4 Children | 0 (0.0%) | 0 (0.0%) |
| 5 or more Children | 0 (0.0%) | 0 (0.0%) |
| Total | 14 (8.2%) | 14 (8.2%) |
Income Below Poverty Among Married-Couple vs Single-Parent Households in Gold River
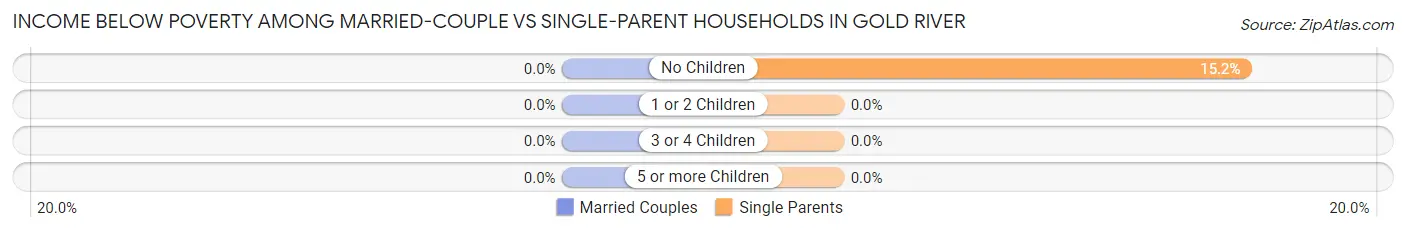
| Children | Married-Couple Families | Single-Parent Households |
| No Children | 0 (0.0%) | 28 (15.2%) |
| 1 or 2 Children | 0 (0.0%) | 0 (0.0%) |
| 3 or 4 Children | 0 (0.0%) | 0 (0.0%) |
| 5 or more Children | 0 (0.0%) | 0 (0.0%) |
| Total | 0 (0.0%) | 28 (8.2%) |
Race in Gold River
The most populous races in Gold River are White / Caucasian (5,679 | 71.8%), Asian (1,500 | 19.0%), and Hispanic or Latino (401 | 5.1%).
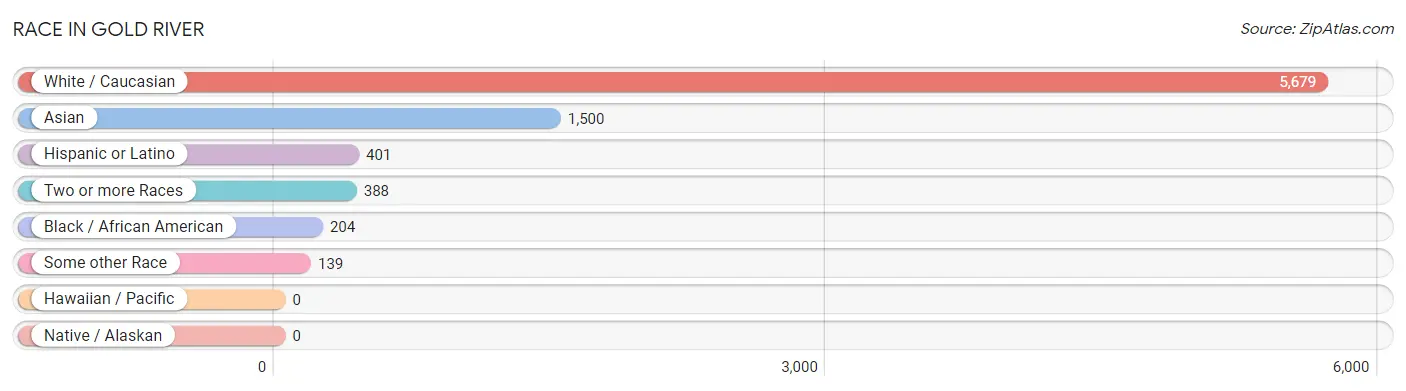
| Race | # Population | % Population |
| Asian | 1,500 | 19.0% |
| Black / African American | 204 | 2.6% |
| Hawaiian / Pacific | 0 | 0.0% |
| Hispanic or Latino | 401 | 5.1% |
| Native / Alaskan | 0 | 0.0% |
| White / Caucasian | 5,679 | 71.8% |
| Two or more Races | 388 | 4.9% |
| Some other Race | 139 | 1.8% |
| Total | 7,910 | 100.0% |
Ancestry in Gold River
The most populous ancestries reported in Gold River are German (1,256 | 15.9%), English (1,219 | 15.4%), Irish (1,002 | 12.7%), Italian (489 | 6.2%), and Burmese (428 | 5.4%), together accounting for 55.5% of all Gold River residents.
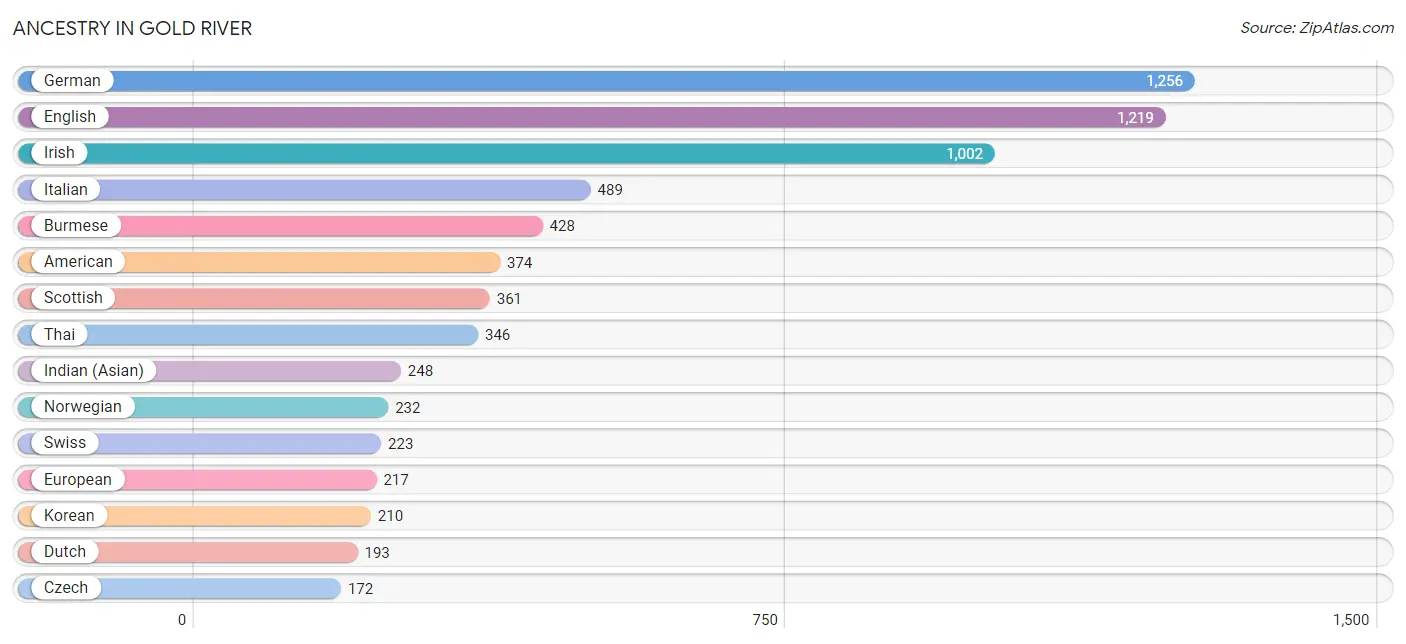
| Ancestry | # Population | % Population |
| American | 374 | 4.7% |
| Arab | 82 | 1.0% |
| Argentinean | 8 | 0.1% |
| Assyrian / Chaldean / Syriac | 12 | 0.2% |
| Austrian | 23 | 0.3% |
| Basque | 18 | 0.2% |
| Bhutanese | 148 | 1.9% |
| British | 62 | 0.8% |
| Burmese | 428 | 5.4% |
| Canadian | 11 | 0.1% |
| Central American | 25 | 0.3% |
| Chilean | 27 | 0.3% |
| Choctaw | 25 | 0.3% |
| Colombian | 93 | 1.2% |
| Croatian | 36 | 0.5% |
| Cuban | 33 | 0.4% |
| Czech | 172 | 2.2% |
| Danish | 74 | 0.9% |
| Dutch | 193 | 2.4% |
| Eastern European | 19 | 0.2% |
| English | 1,219 | 15.4% |
| European | 217 | 2.7% |
| Finnish | 7 | 0.1% |
| French | 135 | 1.7% |
| French Canadian | 22 | 0.3% |
| German | 1,256 | 15.9% |
| Greek | 48 | 0.6% |
| Indian (Asian) | 248 | 3.1% |
| Iranian | 172 | 2.2% |
| Irish | 1,002 | 12.7% |
| Italian | 489 | 6.2% |
| Korean | 210 | 2.6% |
| Latvian | 10 | 0.1% |
| Lithuanian | 71 | 0.9% |
| Mexican | 137 | 1.7% |
| Moroccan | 68 | 0.9% |
| Nicaraguan | 25 | 0.3% |
| Northern European | 35 | 0.4% |
| Norwegian | 232 | 2.9% |
| Pakistani | 59 | 0.7% |
| Polish | 66 | 0.8% |
| Portuguese | 129 | 1.6% |
| Romanian | 122 | 1.5% |
| Russian | 97 | 1.2% |
| Scandinavian | 55 | 0.7% |
| Scotch-Irish | 81 | 1.0% |
| Scottish | 361 | 4.6% |
| Slovene | 11 | 0.1% |
| South American | 128 | 1.6% |
| South American Indian | 8 | 0.1% |
| Spaniard | 78 | 1.0% |
| Sri Lankan | 76 | 1.0% |
| Swedish | 158 | 2.0% |
| Swiss | 223 | 2.8% |
| Thai | 346 | 4.4% |
| Ukrainian | 137 | 1.7% |
| Welsh | 103 | 1.3% |
| Yugoslavian | 22 | 0.3% | View All 58 Rows |
Immigrants in Gold River
The most numerous immigrant groups reported in Gold River came from Asia (1,060 | 13.4%), South Central Asia (495 | 6.3%), Eastern Asia (349 | 4.4%), India (237 | 3.0%), and South Eastern Asia (202 | 2.5%), together accounting for 29.6% of all Gold River residents.
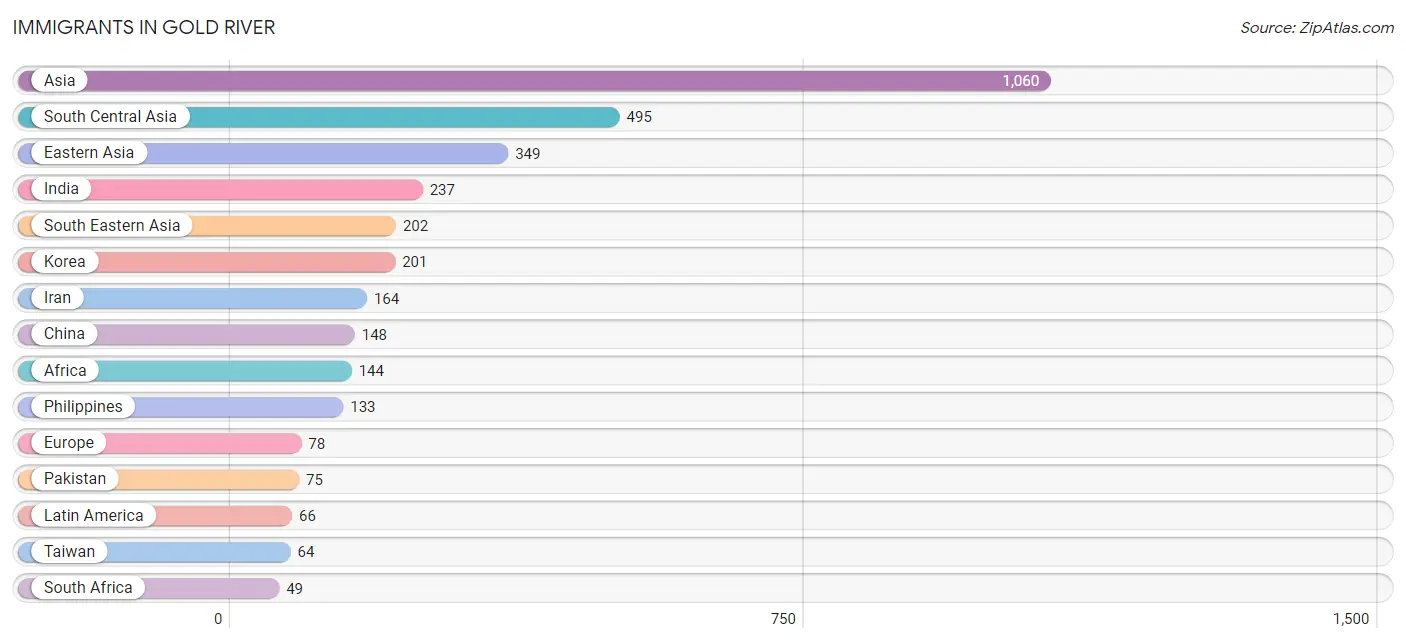
| Immigration Origin | # Population | % Population |
| Africa | 144 | 1.8% |
| Asia | 1,060 | 13.4% |
| Canada | 44 | 0.6% |
| Central America | 34 | 0.4% |
| China | 148 | 1.9% |
| Colombia | 32 | 0.4% |
| Eastern Africa | 48 | 0.6% |
| Eastern Asia | 349 | 4.4% |
| Eastern Europe | 6 | 0.1% |
| England | 14 | 0.2% |
| Europe | 78 | 1.0% |
| Hong Kong | 27 | 0.3% |
| India | 237 | 3.0% |
| Iran | 164 | 2.1% |
| Ireland | 25 | 0.3% |
| Kenya | 48 | 0.6% |
| Korea | 201 | 2.5% |
| Latin America | 66 | 0.8% |
| Mexico | 34 | 0.4% |
| Morocco | 47 | 0.6% |
| Netherlands | 10 | 0.1% |
| Northern Africa | 47 | 0.6% |
| Northern Europe | 47 | 0.6% |
| Pakistan | 75 | 0.9% |
| Philippines | 133 | 1.7% |
| South Africa | 49 | 0.6% |
| South America | 32 | 0.4% |
| South Central Asia | 495 | 6.3% |
| South Eastern Asia | 202 | 2.5% |
| Southern Europe | 7 | 0.1% |
| Spain | 7 | 0.1% |
| Sri Lanka | 19 | 0.2% |
| Switzerland | 8 | 0.1% |
| Taiwan | 64 | 0.8% |
| Thailand | 26 | 0.3% |
| Vietnam | 43 | 0.5% |
| Western Europe | 18 | 0.2% | View All 37 Rows |
Sex and Age in Gold River
Sex and Age in Gold River
The most populous age groups in Gold River are 55 to 59 Years (481 | 12.1%) for men and 65 to 69 Years (533 | 13.5%) for women.
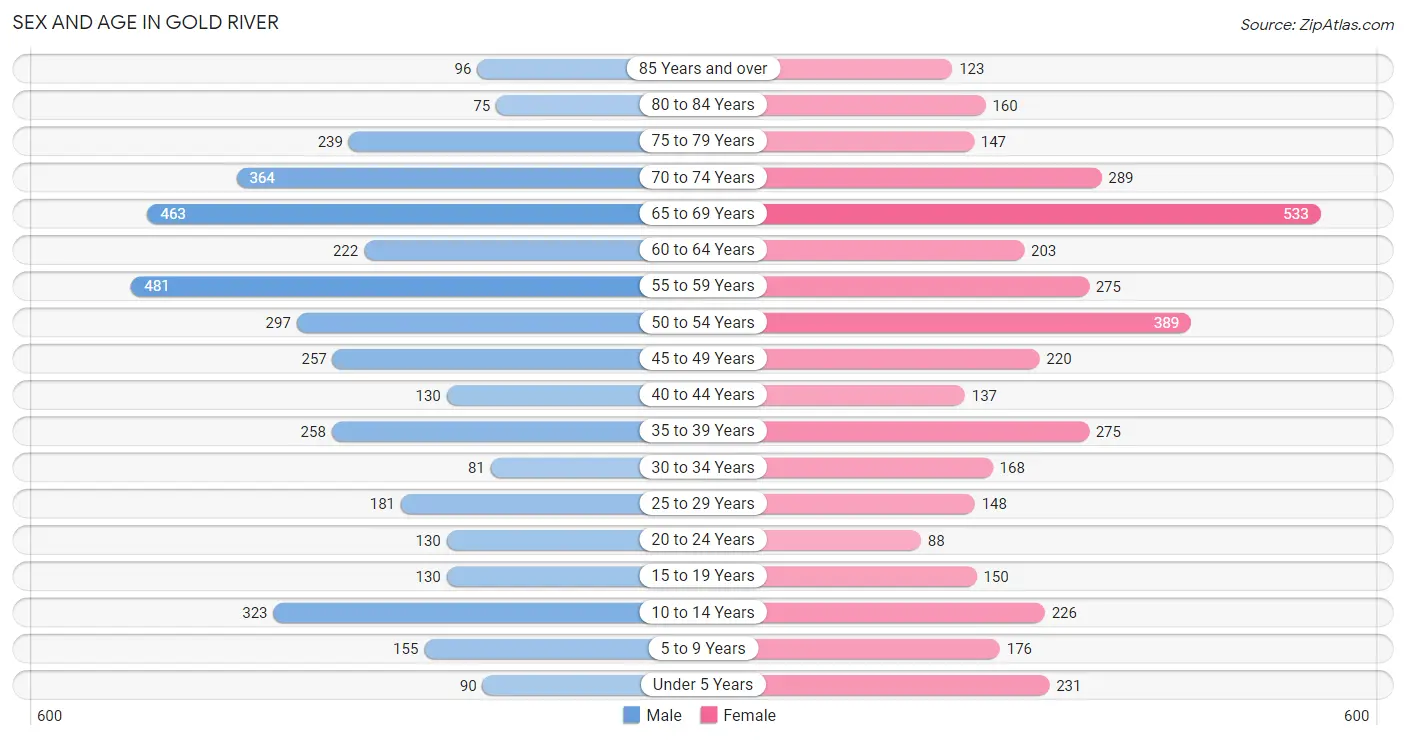
| Age Bracket | Male | Female |
| Under 5 Years | 90 (2.3%) | 231 (5.9%) |
| 5 to 9 Years | 155 (3.9%) | 176 (4.5%) |
| 10 to 14 Years | 323 (8.1%) | 226 (5.7%) |
| 15 to 19 Years | 130 (3.3%) | 150 (3.8%) |
| 20 to 24 Years | 130 (3.3%) | 88 (2.2%) |
| 25 to 29 Years | 181 (4.6%) | 148 (3.8%) |
| 30 to 34 Years | 81 (2.0%) | 168 (4.3%) |
| 35 to 39 Years | 258 (6.5%) | 275 (7.0%) |
| 40 to 44 Years | 130 (3.3%) | 137 (3.5%) |
| 45 to 49 Years | 257 (6.5%) | 220 (5.6%) |
| 50 to 54 Years | 297 (7.5%) | 389 (9.9%) |
| 55 to 59 Years | 481 (12.1%) | 275 (7.0%) |
| 60 to 64 Years | 222 (5.6%) | 203 (5.1%) |
| 65 to 69 Years | 463 (11.7%) | 533 (13.5%) |
| 70 to 74 Years | 364 (9.2%) | 289 (7.3%) |
| 75 to 79 Years | 239 (6.0%) | 147 (3.7%) |
| 80 to 84 Years | 75 (1.9%) | 160 (4.1%) |
| 85 Years and over | 96 (2.4%) | 123 (3.1%) |
| Total | 3,972 (100.0%) | 3,938 (100.0%) |
Families and Households in Gold River
Median Family Size in Gold River
The median family size in Gold River is 2.69 persons per family, with single male/father families (170 | 6.8%) accounting for the largest median family size of 2.92 persons per family. On the other hand, single female/mother families (171 | 6.8%) represent the smallest median family size with 2.11 persons per family.
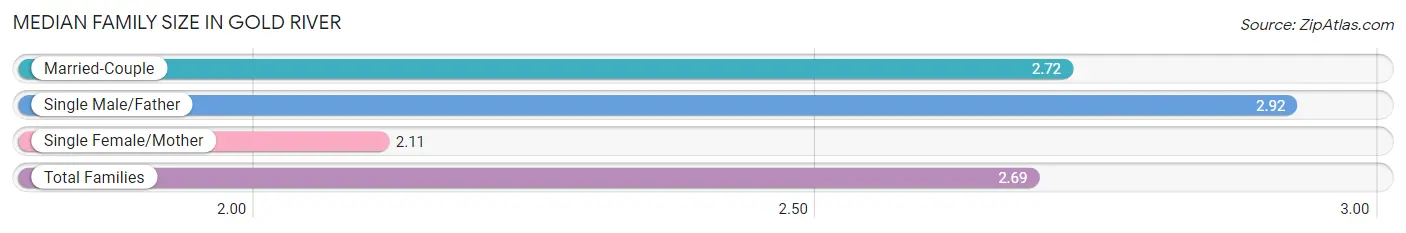
| Family Type | # Families | Family Size |
| Married-Couple | 2,178 (86.5%) | 2.72 |
| Single Male/Father | 170 (6.8%) | 2.92 |
| Single Female/Mother | 171 (6.8%) | 2.11 |
| Total Families | 2,519 (100.0%) | 2.69 |
Median Household Size in Gold River
The median household size in Gold River is 2.29 persons per household, with single male/father households (170 | 4.9%) accounting for the largest median household size of 3.11 persons per household. non-family households (940 | 27.2%) represent the smallest median household size with 1.13 persons per household.
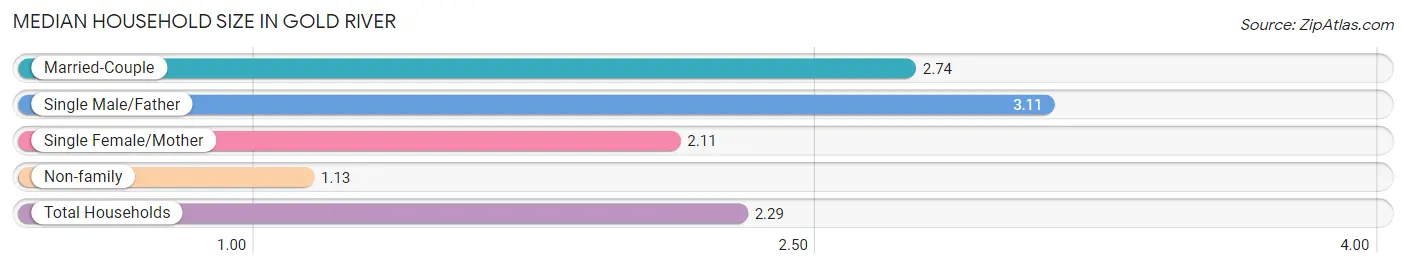
| Household Type | # Households | Household Size |
| Married-Couple | 2,178 (63.0%) | 2.74 |
| Single Male/Father | 170 (4.9%) | 3.11 |
| Single Female/Mother | 171 (4.9%) | 2.11 |
| Non-family | 940 (27.2%) | 1.13 |
| Total Households | 3,459 (100.0%) | 2.29 |
Household Size by Marriage Status in Gold River
Out of a total of 3,459 households in Gold River, 2,519 (72.8%) are family households, while 940 (27.2%) are nonfamily households. The most numerous type of family households are 2-person households, comprising 1,483, and the most common type of nonfamily households are 1-person households, comprising 837.
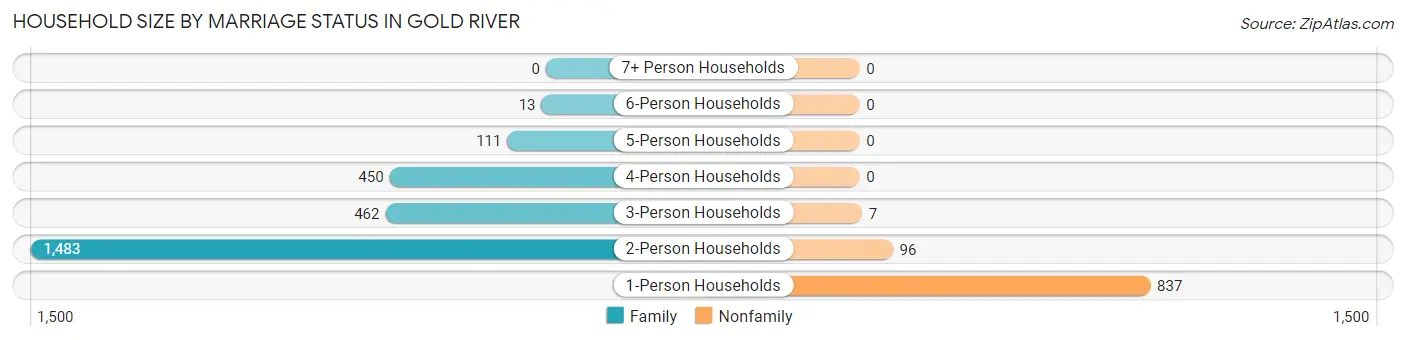
| Household Size | Family Households | Nonfamily Households |
| 1-Person Households | - | 837 (24.2%) |
| 2-Person Households | 1,483 (42.9%) | 96 (2.8%) |
| 3-Person Households | 462 (13.4%) | 7 (0.2%) |
| 4-Person Households | 450 (13.0%) | 0 (0.0%) |
| 5-Person Households | 111 (3.2%) | 0 (0.0%) |
| 6-Person Households | 13 (0.4%) | 0 (0.0%) |
| 7+ Person Households | 0 (0.0%) | 0 (0.0%) |
| Total | 2,519 (72.8%) | 940 (27.2%) |
Female Fertility in Gold River
Fertility by Age in Gold River
Average fertility rate in Gold River is 22.0 births per 1,000 women. Women in the age bracket of 35 to 50 years have the highest fertility rate with 37.0 births per 1,000 women. Women in the age bracket of 35 to 50 years acount for 100.0% of all women with births.
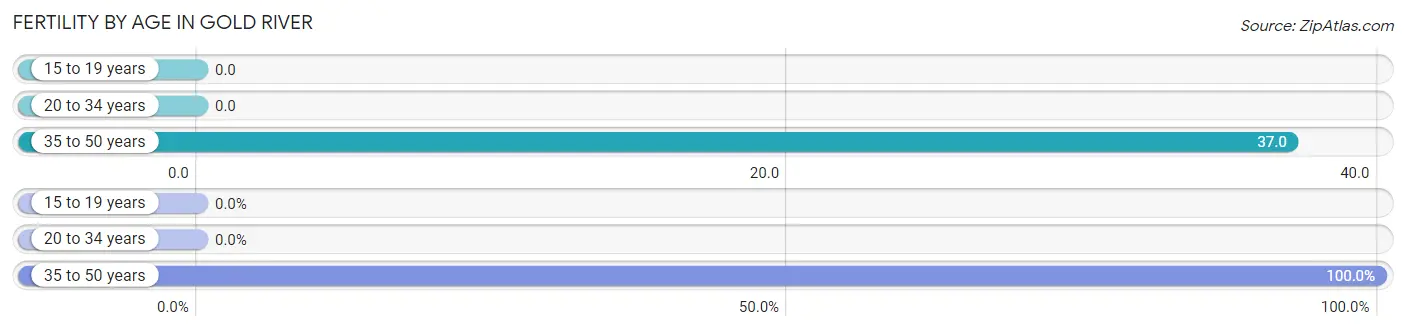
| Age Bracket | Women with Births | Births / 1,000 Women |
| 15 to 19 years | 0 (0.0%) | 0.0 |
| 20 to 34 years | 0 (0.0%) | 0.0 |
| 35 to 50 years | 29 (100.0%) | 37.0 |
| Total | 29 (100.0%) | 22.0 |
Fertility by Age by Marriage Status in Gold River
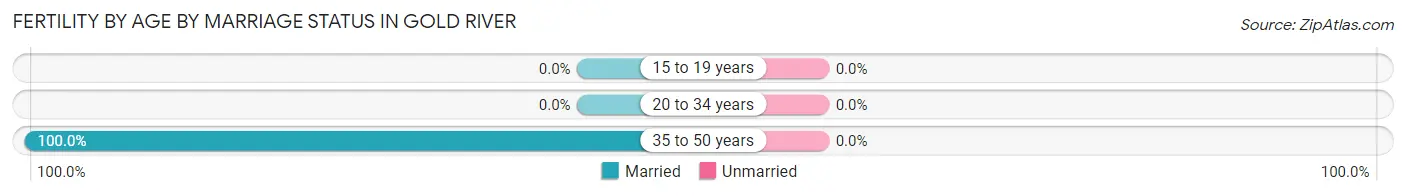
| Age Bracket | Married | Unmarried |
| 15 to 19 years | 0 (0.0%) | 0 (0.0%) |
| 20 to 34 years | 0 (0.0%) | 0 (0.0%) |
| 35 to 50 years | 29 (100.0%) | 0 (0.0%) |
| Total | 29 (100.0%) | 0 (0.0%) |
Fertility by Education in Gold River
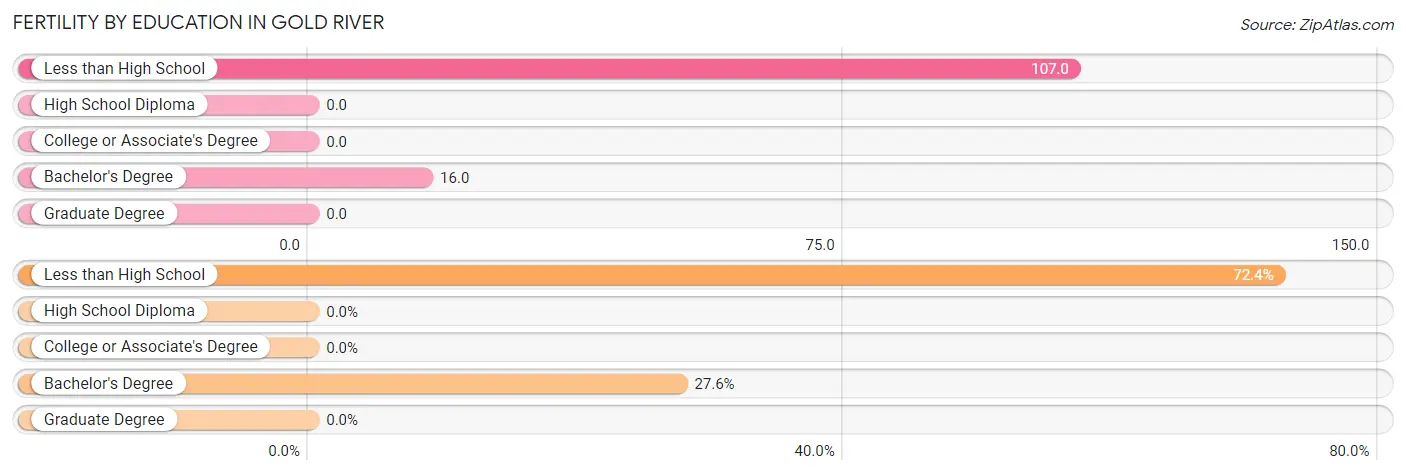
| Educational Attainment | Women with Births | Births / 1,000 Women |
| Less than High School | 21 (72.4%) | 107.0 |
| High School Diploma | 0 (0.0%) | 0.0 |
| College or Associate's Degree | 0 (0.0%) | 0.0 |
| Bachelor's Degree | 8 (27.6%) | 16.0 |
| Graduate Degree | 0 (0.0%) | 0.0 |
| Total | 29 (100.0%) | 22.0 |
Fertility by Education by Marriage Status in Gold River
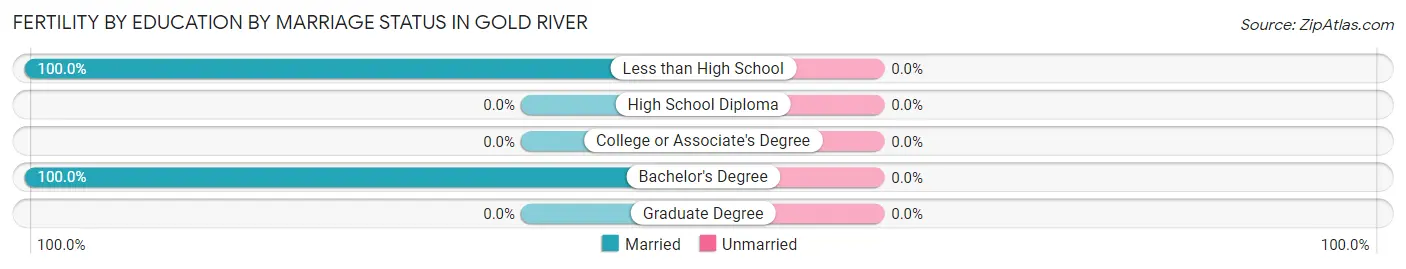
| Educational Attainment | Married | Unmarried |
| Less than High School | 21 (100.0%) | 0 (0.0%) |
| High School Diploma | 0 (0.0%) | 0 (0.0%) |
| College or Associate's Degree | 0 (0.0%) | 0 (0.0%) |
| Bachelor's Degree | 8 (100.0%) | 0 (0.0%) |
| Graduate Degree | 0 (0.0%) | 0 (0.0%) |
| Total | 29 (100.0%) | 0 (0.0%) |
Employment Characteristics in Gold River
Employment by Class of Employer in Gold River
Among the 3,638 employed individuals in Gold River, private company employees (1,686 | 46.3%), state government employees (592 | 16.3%), and self-employed (not incorporated) (364 | 10.0%) make up the most common classes of employment.
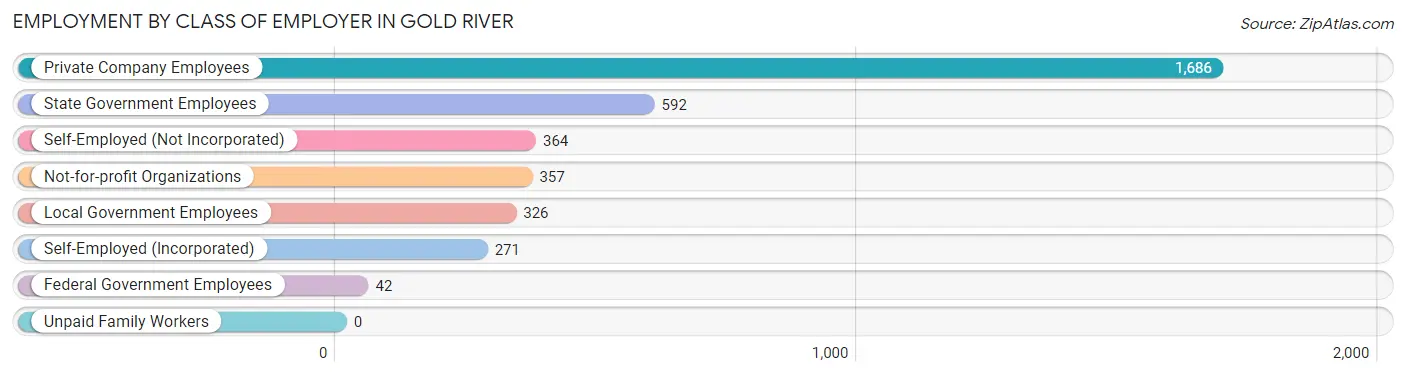
| Employer Class | # Employees | % Employees |
| Private Company Employees | 1,686 | 46.3% |
| Self-Employed (Incorporated) | 271 | 7.4% |
| Self-Employed (Not Incorporated) | 364 | 10.0% |
| Not-for-profit Organizations | 357 | 9.8% |
| Local Government Employees | 326 | 9.0% |
| State Government Employees | 592 | 16.3% |
| Federal Government Employees | 42 | 1.1% |
| Unpaid Family Workers | 0 | 0.0% |
| Total | 3,638 | 100.0% |
Employment Status by Age in Gold River
According to the labor force statistics for Gold River, out of the total population over 16 years of age (6,644), 58.2% or 3,867 individuals are in the labor force, with 3.5% or 135 of them unemployed. The age group with the highest labor force participation rate is 25 to 29 years, with 97.0% or 319 individuals in the labor force. Within the labor force, the 16 to 19 years age range has the highest percentage of unemployed individuals, with 63.5% or 33 of them being unemployed.
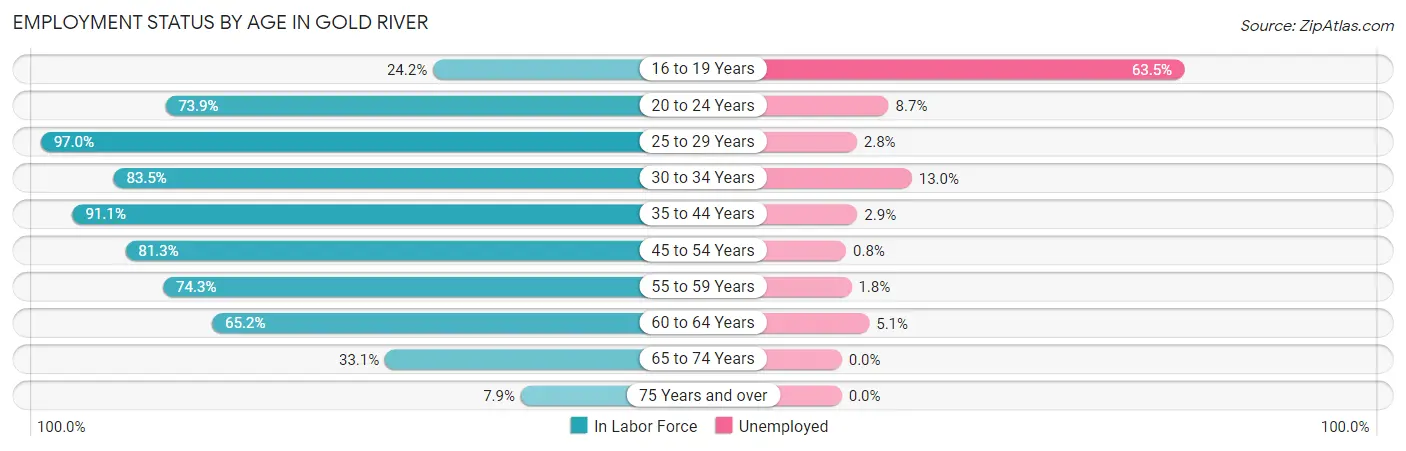
| Age Bracket | In Labor Force | Unemployed |
| 16 to 19 Years | 52 (24.2%) | 33 (63.5%) |
| 20 to 24 Years | 161 (73.9%) | 14 (8.7%) |
| 25 to 29 Years | 319 (97.0%) | 9 (2.8%) |
| 30 to 34 Years | 208 (83.5%) | 27 (13.0%) |
| 35 to 44 Years | 729 (91.1%) | 21 (2.9%) |
| 45 to 54 Years | 946 (81.3%) | 8 (0.8%) |
| 55 to 59 Years | 562 (74.3%) | 10 (1.8%) |
| 60 to 64 Years | 277 (65.2%) | 14 (5.1%) |
| 65 to 74 Years | 546 (33.1%) | 0 (0.0%) |
| 75 Years and over | 66 (7.9%) | 0 (0.0%) |
| Total | 3,867 (58.2%) | 135 (3.5%) |
Employment Status by Educational Attainment in Gold River
According to labor force statistics for Gold River, 81.7% of individuals (3,041) out of the total population between 25 and 64 years of age (3,722) are in the labor force, with 2.9% or 88 of them being unemployed. The group with the highest labor force participation rate are those with the educational attainment of bachelor's degree or higher, with 88.1% or 2,319 individuals in the labor force. Within the labor force, individuals with college / associate degree education have the highest percentage of unemployment, with 6.0% or 36 of them being unemployed.
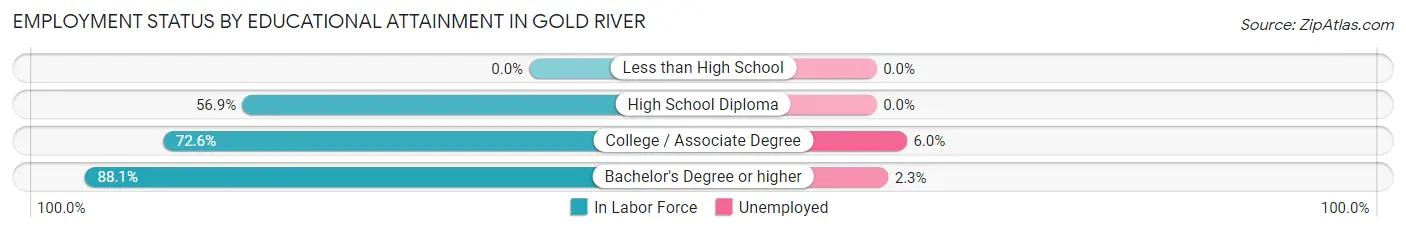
| Educational Attainment | In Labor Force | Unemployed |
| Less than High School | 0 (0.0%) | 0 (0.0%) |
| High School Diploma | 115 (56.9%) | 0 (0.0%) |
| College / Associate Degree | 605 (72.6%) | 50 (6.0%) |
| Bachelor's Degree or higher | 2,319 (88.1%) | 61 (2.3%) |
| Total | 3,041 (81.7%) | 108 (2.9%) |
Employment Occupations by Sex in Gold River
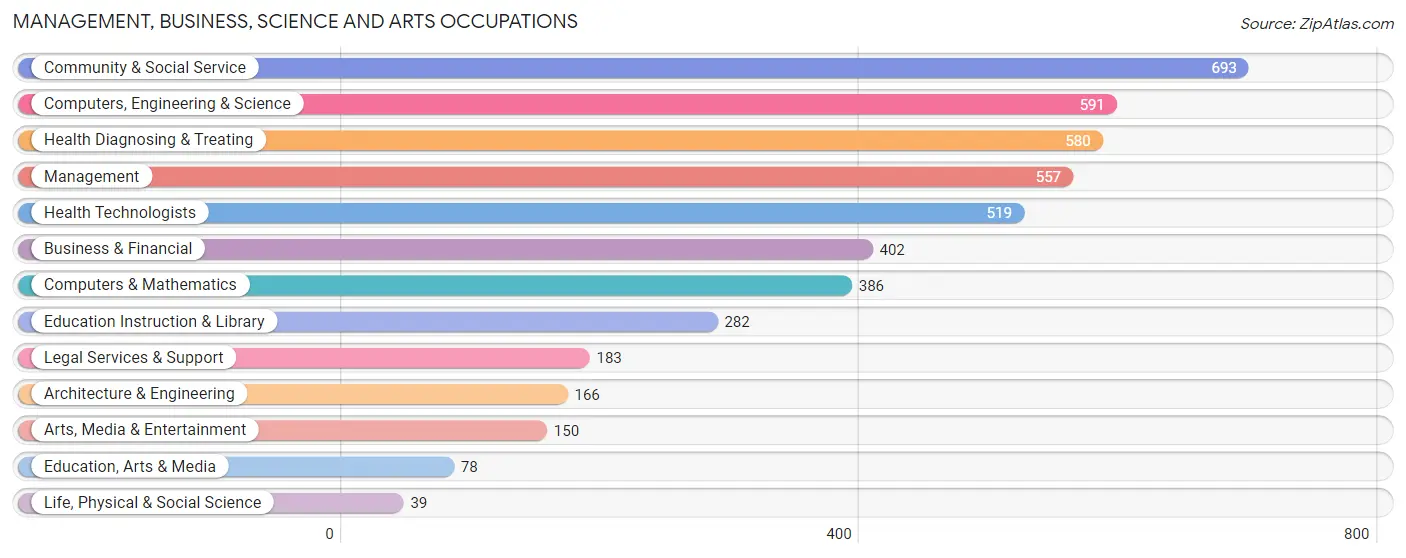
Management, Business, Science and Arts Occupations
The most common Management, Business, Science and Arts occupations in Gold River are Community & Social Service (693 | 18.6%), Computers, Engineering & Science (591 | 15.9%), Health Diagnosing & Treating (580 | 15.5%), Management (557 | 14.9%), and Health Technologists (519 | 13.9%).
Management, Business, Science and Arts Occupations by Sex
Within the Management, Business, Science and Arts occupations in Gold River, the most male-oriented occupations are Arts, Media & Entertainment (85.3%), Computers & Mathematics (83.2%), and Architecture & Engineering (80.7%), while the most female-oriented occupations are Life, Physical & Social Science (100.0%), Health Technologists (72.6%), and Health Diagnosing & Treating (71.2%).
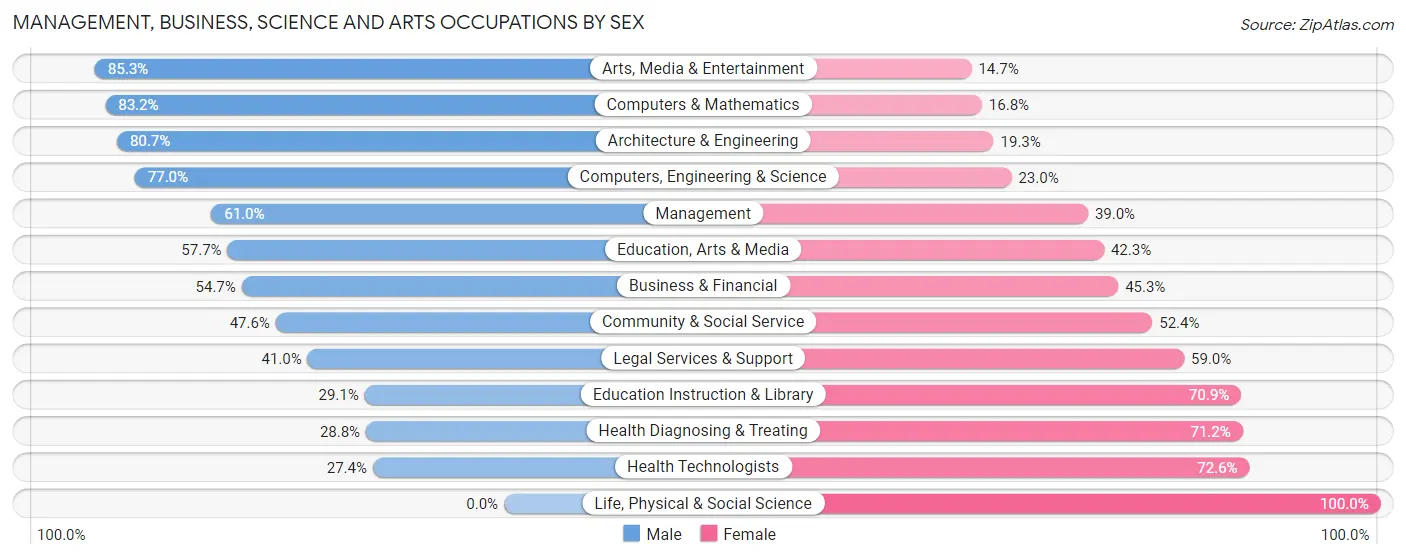
| Occupation | Male | Female |
| Management | 340 (61.0%) | 217 (39.0%) |
| Business & Financial | 220 (54.7%) | 182 (45.3%) |
| Computers, Engineering & Science | 455 (77.0%) | 136 (23.0%) |
| Computers & Mathematics | 321 (83.2%) | 65 (16.8%) |
| Architecture & Engineering | 134 (80.7%) | 32 (19.3%) |
| Life, Physical & Social Science | 0 (0.0%) | 39 (100.0%) |
| Community & Social Service | 330 (47.6%) | 363 (52.4%) |
| Education, Arts & Media | 45 (57.7%) | 33 (42.3%) |
| Legal Services & Support | 75 (41.0%) | 108 (59.0%) |
| Education Instruction & Library | 82 (29.1%) | 200 (70.9%) |
| Arts, Media & Entertainment | 128 (85.3%) | 22 (14.7%) |
| Health Diagnosing & Treating | 167 (28.8%) | 413 (71.2%) |
| Health Technologists | 142 (27.4%) | 377 (72.6%) |
| Total (Category) | 1,512 (53.6%) | 1,311 (46.4%) |
| Total (Overall) | 2,010 (53.9%) | 1,719 (46.1%) |
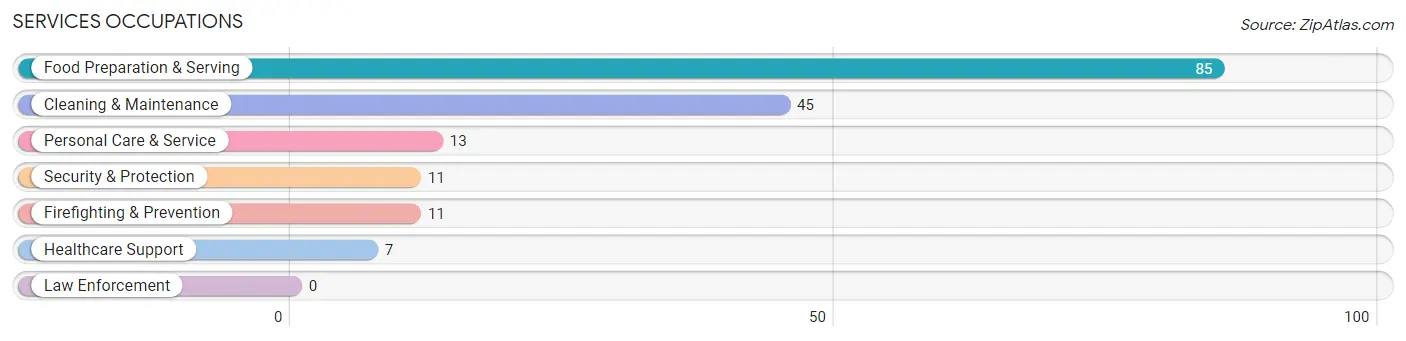
Services Occupations
The most common Services occupations in Gold River are Food Preparation & Serving (85 | 2.3%), Cleaning & Maintenance (45 | 1.2%), Personal Care & Service (13 | 0.4%), Security & Protection (11 | 0.3%), and Firefighting & Prevention (11 | 0.3%).
Services Occupations by Sex
Within the Services occupations in Gold River, the most male-oriented occupations are Security & Protection (100.0%), Firefighting & Prevention (100.0%), and Food Preparation & Serving (83.5%), while the most female-oriented occupations are Healthcare Support (100.0%), Personal Care & Service (100.0%), and Cleaning & Maintenance (26.7%).
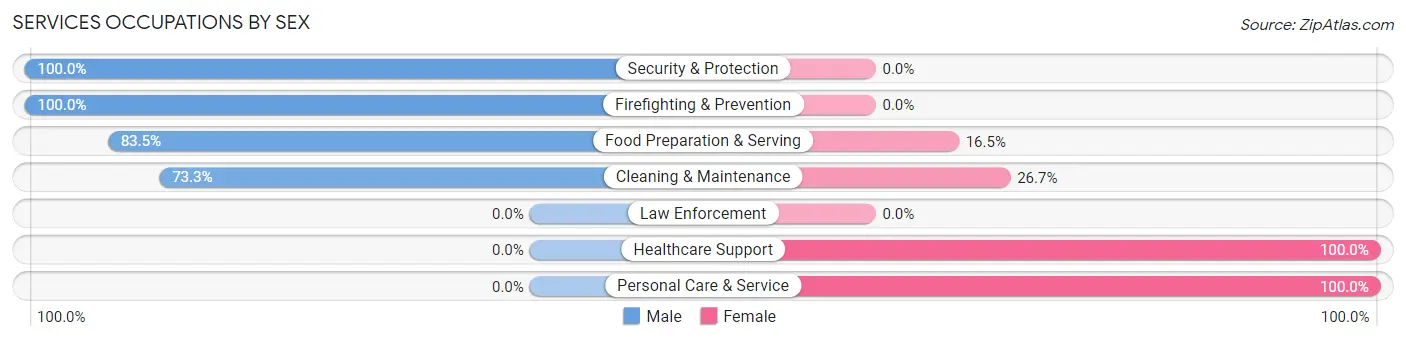
| Occupation | Male | Female |
| Healthcare Support | 0 (0.0%) | 7 (100.0%) |
| Security & Protection | 11 (100.0%) | 0 (0.0%) |
| Firefighting & Prevention | 11 (100.0%) | 0 (0.0%) |
| Law Enforcement | 0 (0.0%) | 0 (0.0%) |
| Food Preparation & Serving | 71 (83.5%) | 14 (16.5%) |
| Cleaning & Maintenance | 33 (73.3%) | 12 (26.7%) |
| Personal Care & Service | 0 (0.0%) | 13 (100.0%) |
| Total (Category) | 115 (71.4%) | 46 (28.6%) |
| Total (Overall) | 2,010 (53.9%) | 1,719 (46.1%) |
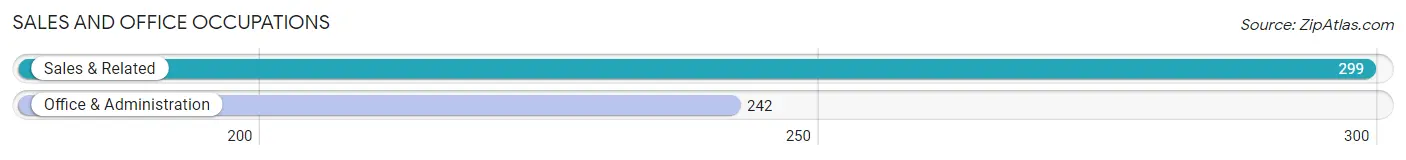
Sales and Office Occupations
The most common Sales and Office occupations in Gold River are Sales & Related (299 | 8.0%), and Office & Administration (242 | 6.5%).
Sales and Office Occupations by Sex
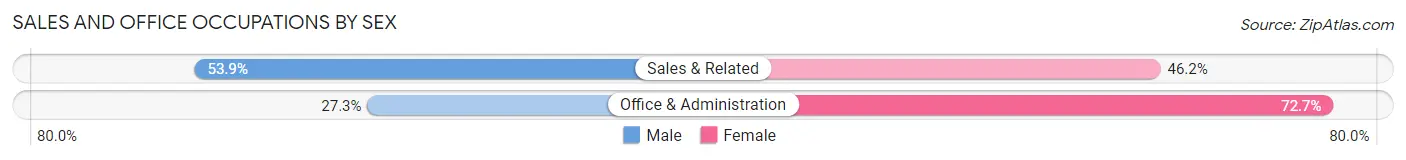
| Occupation | Male | Female |
| Sales & Related | 161 (53.8%) | 138 (46.2%) |
| Office & Administration | 66 (27.3%) | 176 (72.7%) |
| Total (Category) | 227 (42.0%) | 314 (58.0%) |
| Total (Overall) | 2,010 (53.9%) | 1,719 (46.1%) |
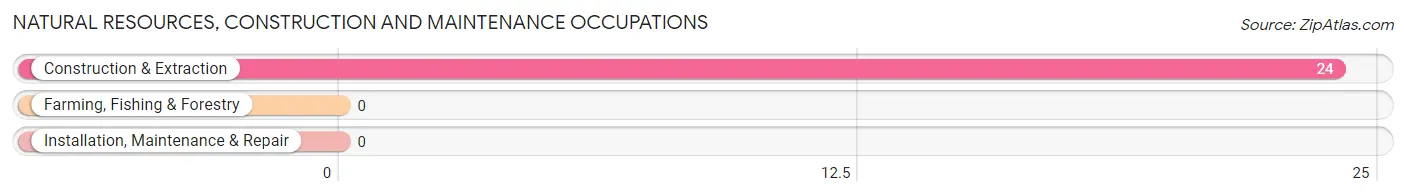
Natural Resources, Construction and Maintenance Occupations
The most common Natural Resources, Construction and Maintenance occupations in Gold River are , and Construction & Extraction (24 | 0.6%).
Natural Resources, Construction and Maintenance Occupations by Sex
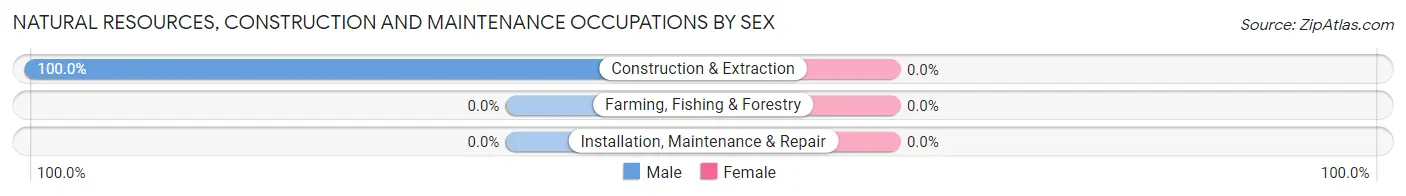
| Occupation | Male | Female |
| Farming, Fishing & Forestry | 0 (0.0%) | 0 (0.0%) |
| Construction & Extraction | 24 (100.0%) | 0 (0.0%) |
| Installation, Maintenance & Repair | 0 (0.0%) | 0 (0.0%) |
| Total (Category) | 24 (100.0%) | 0 (0.0%) |
| Total (Overall) | 2,010 (53.9%) | 1,719 (46.1%) |
Production, Transportation and Moving Occupations
The most common Production, Transportation and Moving occupations in Gold River are Material Moving (98 | 2.6%), Production (67 | 1.8%), and Transportation (15 | 0.4%).
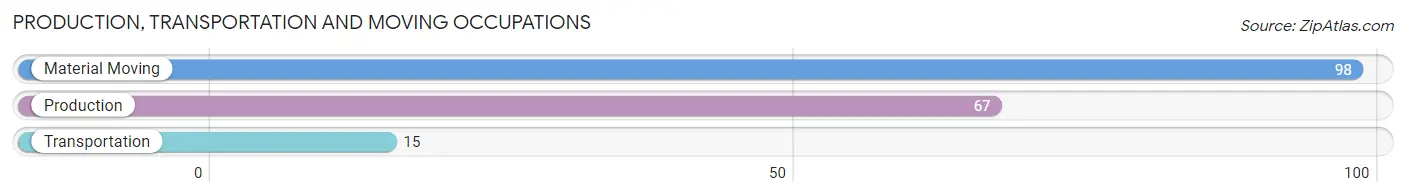
Production, Transportation and Moving Occupations by Sex
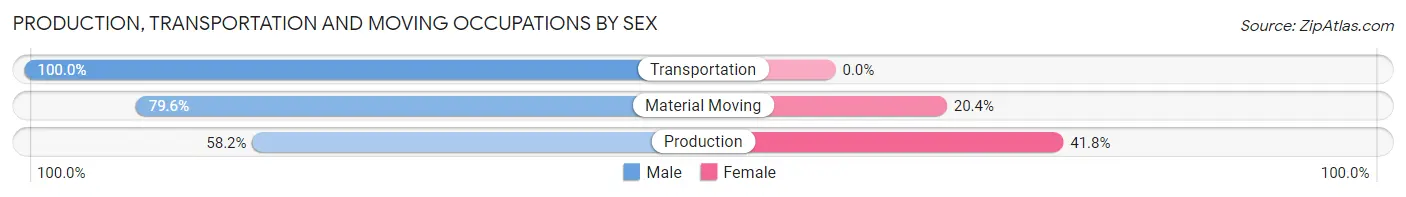
| Occupation | Male | Female |
| Production | 39 (58.2%) | 28 (41.8%) |
| Transportation | 15 (100.0%) | 0 (0.0%) |
| Material Moving | 78 (79.6%) | 20 (20.4%) |
| Total (Category) | 132 (73.3%) | 48 (26.7%) |
| Total (Overall) | 2,010 (53.9%) | 1,719 (46.1%) |
Employment Industries by Sex in Gold River
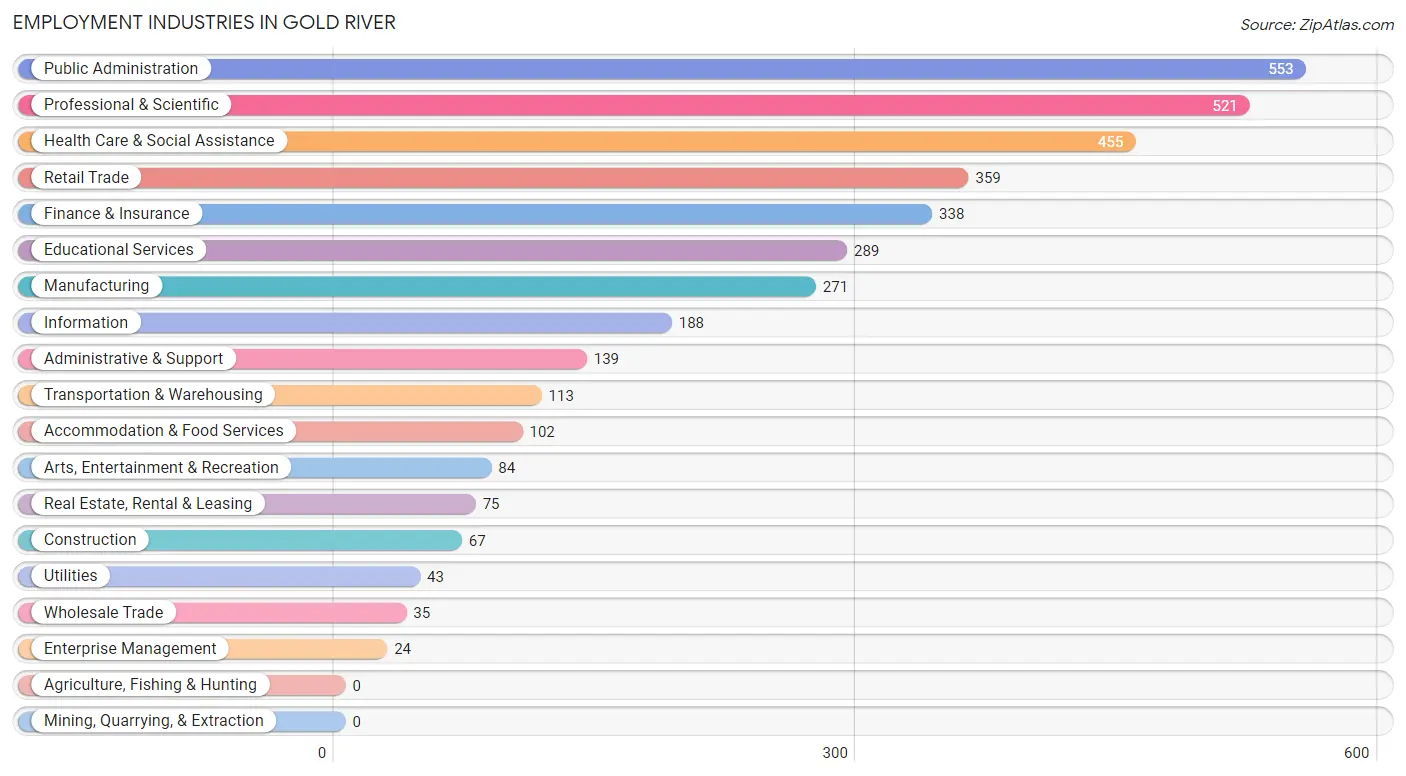
Employment Industries in Gold River
The major employment industries in Gold River include Public Administration (553 | 14.8%), Professional & Scientific (521 | 14.0%), Health Care & Social Assistance (455 | 12.2%), Retail Trade (359 | 9.6%), and Finance & Insurance (338 | 9.1%).
Employment Industries by Sex in Gold River
The Gold River industries that see more men than women are Construction (100.0%), Utilities (100.0%), and Accommodation & Food Services (86.3%), whereas the industries that tend to have a higher number of women are Educational Services (72.7%), Finance & Insurance (67.2%), and Health Care & Social Assistance (58.5%).
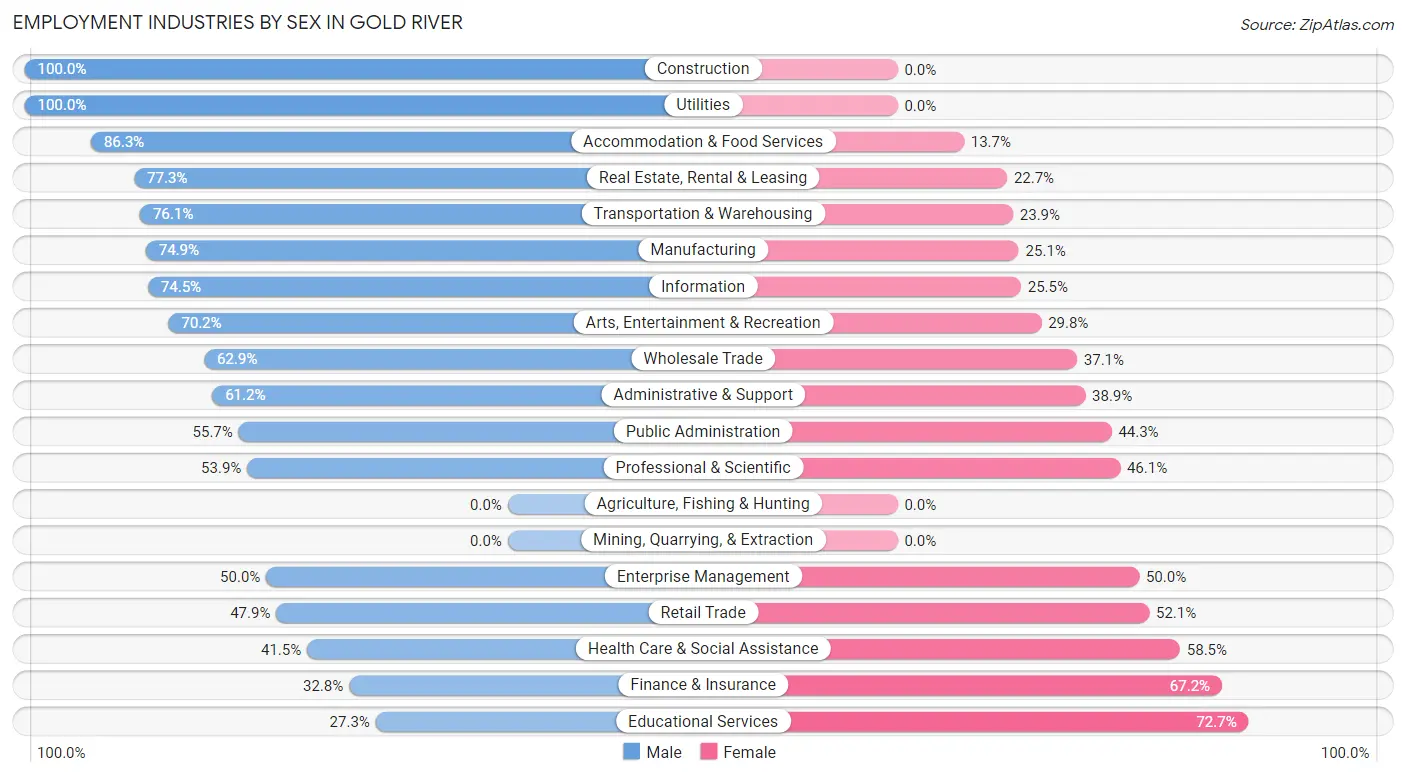
| Industry | Male | Female |
| Agriculture, Fishing & Hunting | 0 (0.0%) | 0 (0.0%) |
| Mining, Quarrying, & Extraction | 0 (0.0%) | 0 (0.0%) |
| Construction | 67 (100.0%) | 0 (0.0%) |
| Manufacturing | 203 (74.9%) | 68 (25.1%) |
| Wholesale Trade | 22 (62.9%) | 13 (37.1%) |
| Retail Trade | 172 (47.9%) | 187 (52.1%) |
| Transportation & Warehousing | 86 (76.1%) | 27 (23.9%) |
| Utilities | 43 (100.0%) | 0 (0.0%) |
| Information | 140 (74.5%) | 48 (25.5%) |
| Finance & Insurance | 111 (32.8%) | 227 (67.2%) |
| Real Estate, Rental & Leasing | 58 (77.3%) | 17 (22.7%) |
| Professional & Scientific | 281 (53.9%) | 240 (46.1%) |
| Enterprise Management | 12 (50.0%) | 12 (50.0%) |
| Administrative & Support | 85 (61.2%) | 54 (38.9%) |
| Educational Services | 79 (27.3%) | 210 (72.7%) |
| Health Care & Social Assistance | 189 (41.5%) | 266 (58.5%) |
| Arts, Entertainment & Recreation | 59 (70.2%) | 25 (29.8%) |
| Accommodation & Food Services | 88 (86.3%) | 14 (13.7%) |
| Public Administration | 308 (55.7%) | 245 (44.3%) |
| Total | 2,010 (53.9%) | 1,719 (46.1%) |
Education in Gold River
School Enrollment in Gold River
The most common levels of schooling among the 1,468 students in Gold River are middle school (384 | 26.2%), high school (318 | 21.7%), and elementary school (292 | 19.9%).
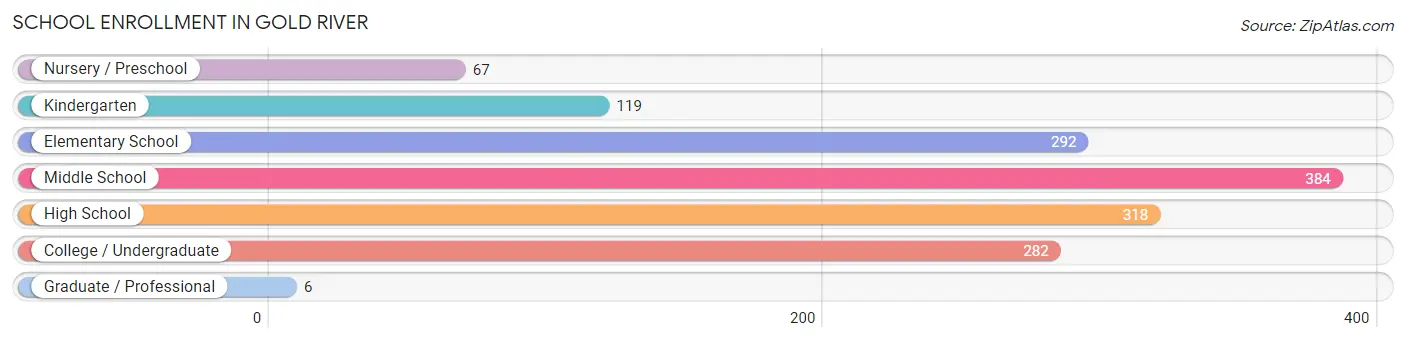
| School Level | # Students | % Students |
| Nursery / Preschool | 67 | 4.6% |
| Kindergarten | 119 | 8.1% |
| Elementary School | 292 | 19.9% |
| Middle School | 384 | 26.2% |
| High School | 318 | 21.7% |
| College / Undergraduate | 282 | 19.2% |
| Graduate / Professional | 6 | 0.4% |
| Total | 1,468 | 100.0% |
School Enrollment by Age by Funding Source in Gold River
Out of a total of 1,468 students who are enrolled in schools in Gold River, 252 (17.2%) attend a private institution, while the remaining 1,216 (82.8%) are enrolled in public schools. The age group of 15 to 17 year olds has the highest likelihood of being enrolled in private schools, with 86 (35.8% in the age bracket) enrolled. Conversely, the age group of 18 to 19 year olds has the lowest likelihood of being enrolled in a private school, with 40 (100.0% in the age bracket) attending a public institution.
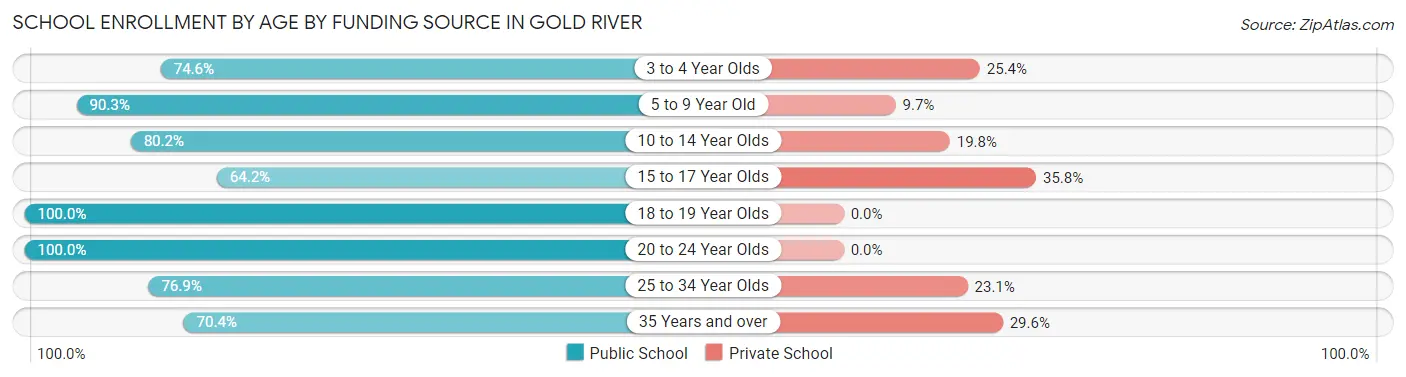
| Age Bracket | Public School | Private School |
| 3 to 4 Year Olds | 50 (74.6%) | 17 (25.4%) |
| 5 to 9 Year Old | 299 (90.3%) | 32 (9.7%) |
| 10 to 14 Year Olds | 422 (80.2%) | 104 (19.8%) |
| 15 to 17 Year Olds | 154 (64.2%) | 86 (35.8%) |
| 18 to 19 Year Olds | 40 (100.0%) | 0 (0.0%) |
| 20 to 24 Year Olds | 211 (100.0%) | 0 (0.0%) |
| 25 to 34 Year Olds | 20 (76.9%) | 6 (23.1%) |
| 35 Years and over | 19 (70.4%) | 8 (29.6%) |
| Total | 1,216 (82.8%) | 252 (17.2%) |
Educational Attainment by Field of Study in Gold River
Business (1,009 | 20.8%), engineering (653 | 13.5%), bio, nature & agricultural (476 | 9.8%), social sciences (401 | 8.3%), and education (362 | 7.5%) are the most common fields of study among 4,854 individuals in Gold River who have obtained a bachelor's degree or higher.
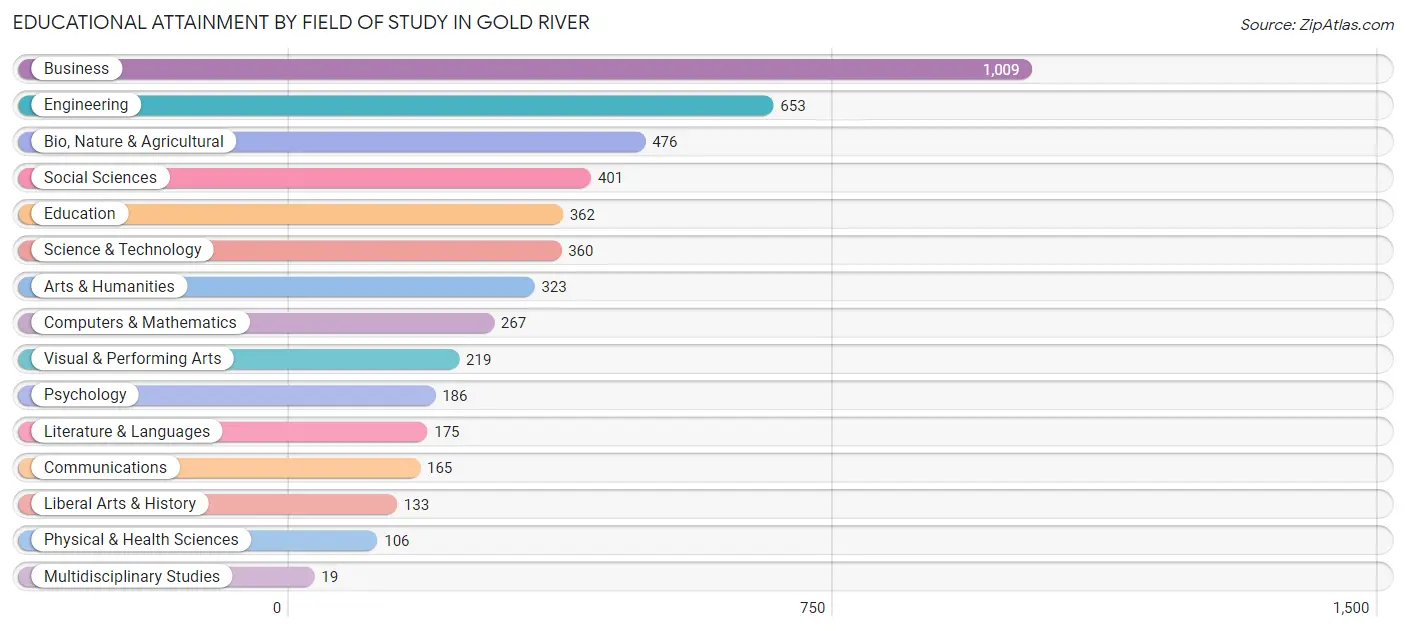
| Field of Study | # Graduates | % Graduates |
| Computers & Mathematics | 267 | 5.5% |
| Bio, Nature & Agricultural | 476 | 9.8% |
| Physical & Health Sciences | 106 | 2.2% |
| Psychology | 186 | 3.8% |
| Social Sciences | 401 | 8.3% |
| Engineering | 653 | 13.5% |
| Multidisciplinary Studies | 19 | 0.4% |
| Science & Technology | 360 | 7.4% |
| Business | 1,009 | 20.8% |
| Education | 362 | 7.5% |
| Literature & Languages | 175 | 3.6% |
| Liberal Arts & History | 133 | 2.7% |
| Visual & Performing Arts | 219 | 4.5% |
| Communications | 165 | 3.4% |
| Arts & Humanities | 323 | 6.7% |
| Total | 4,854 | 100.0% |
Transportation & Commute in Gold River
Vehicle Availability by Sex in Gold River
The most prevalent vehicle ownership categories in Gold River are males with 2 vehicles (1,093, accounting for 54.6%) and females with 2 vehicles (957, making up 66.7%).
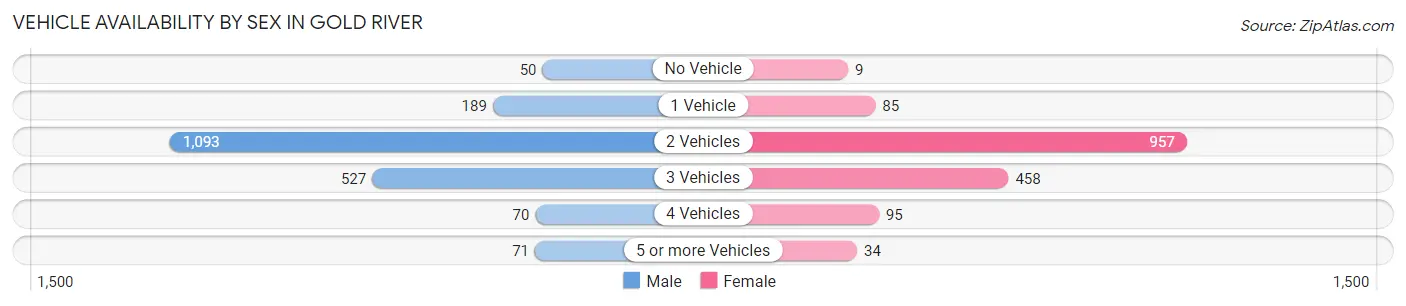
| Vehicles Available | Male | Female |
| No Vehicle | 50 (2.5%) | 9 (0.5%) |
| 1 Vehicle | 189 (9.5%) | 85 (5.2%) |
| 2 Vehicles | 1,093 (54.6%) | 957 (58.4%) |
| 3 Vehicles | 527 (26.4%) | 458 (28.0%) |
| 4 Vehicles | 70 (3.5%) | 95 (5.8%) |
| 5 or more Vehicles | 71 (3.5%) | 34 (2.1%) |
| Total | 2,000 (100.0%) | 1,638 (100.0%) |
Commute Time in Gold River
The most frequently occuring commute durations in Gold River are 20 to 24 minutes (627 commuters, 22.0%), 30 to 34 minutes (508 commuters, 17.8%), and 15 to 19 minutes (497 commuters, 17.4%).
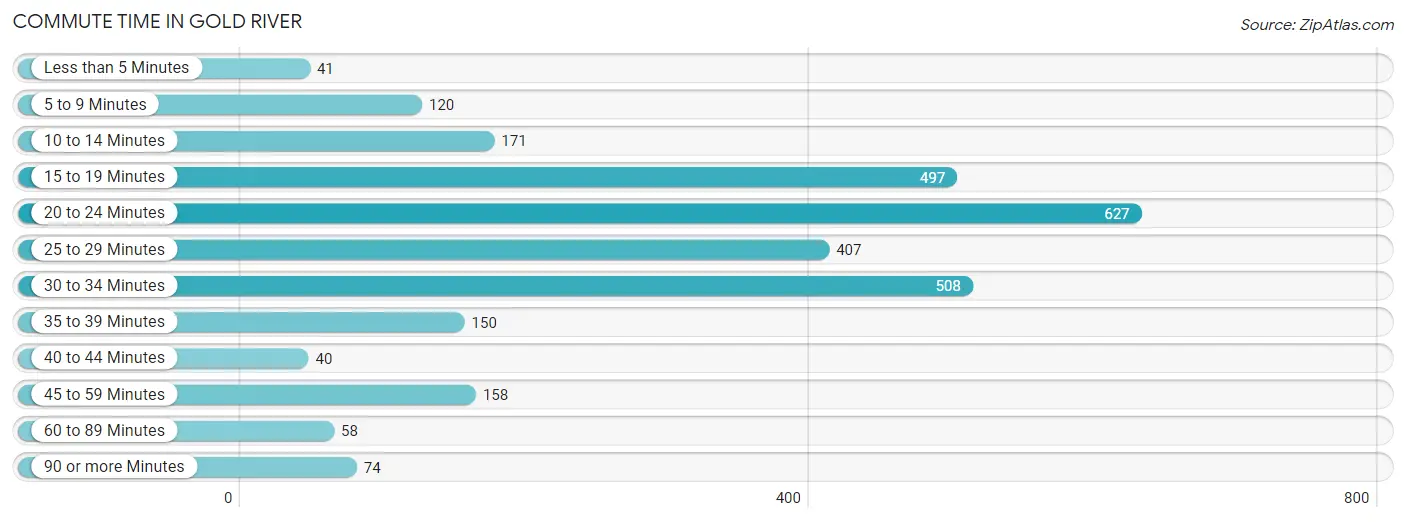
| Commute Time | # Commuters | % Commuters |
| Less than 5 Minutes | 41 | 1.4% |
| 5 to 9 Minutes | 120 | 4.2% |
| 10 to 14 Minutes | 171 | 6.0% |
| 15 to 19 Minutes | 497 | 17.4% |
| 20 to 24 Minutes | 627 | 22.0% |
| 25 to 29 Minutes | 407 | 14.3% |
| 30 to 34 Minutes | 508 | 17.8% |
| 35 to 39 Minutes | 150 | 5.3% |
| 40 to 44 Minutes | 40 | 1.4% |
| 45 to 59 Minutes | 158 | 5.5% |
| 60 to 89 Minutes | 58 | 2.0% |
| 90 or more Minutes | 74 | 2.6% |
Commute Time by Sex in Gold River
The most common commute times in Gold River are 30 to 34 minutes (320 commuters, 20.1%) for males and 20 to 24 minutes (351 commuters, 27.8%) for females.
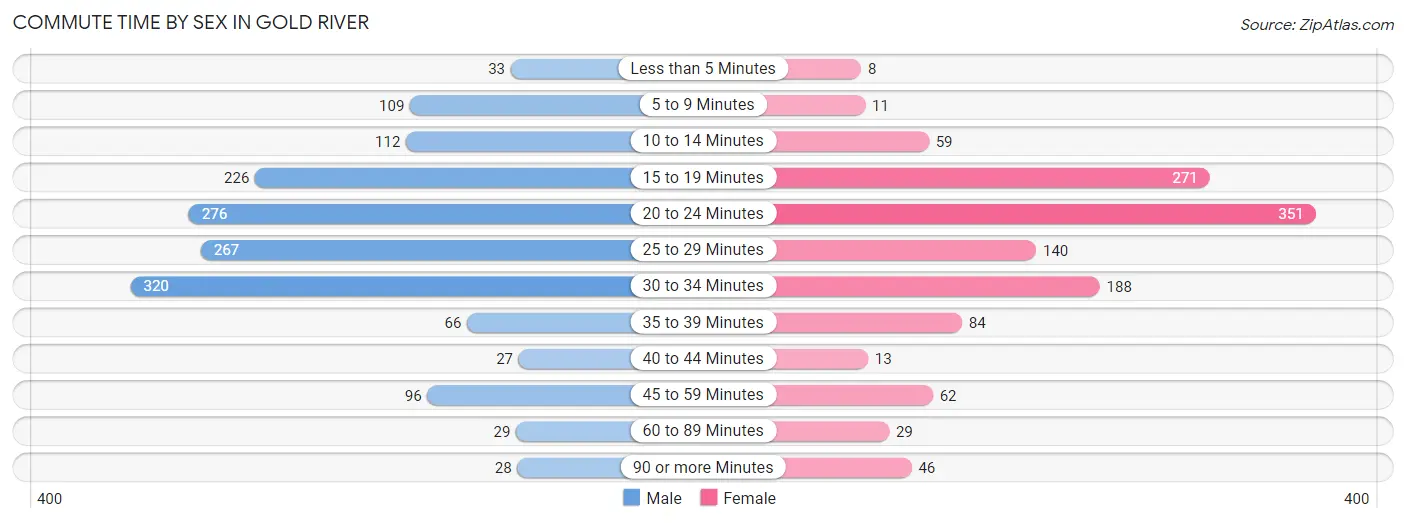
| Commute Time | Male | Female |
| Less than 5 Minutes | 33 (2.1%) | 8 (0.6%) |
| 5 to 9 Minutes | 109 (6.9%) | 11 (0.9%) |
| 10 to 14 Minutes | 112 (7.0%) | 59 (4.7%) |
| 15 to 19 Minutes | 226 (14.2%) | 271 (21.5%) |
| 20 to 24 Minutes | 276 (17.4%) | 351 (27.8%) |
| 25 to 29 Minutes | 267 (16.8%) | 140 (11.1%) |
| 30 to 34 Minutes | 320 (20.1%) | 188 (14.9%) |
| 35 to 39 Minutes | 66 (4.2%) | 84 (6.7%) |
| 40 to 44 Minutes | 27 (1.7%) | 13 (1.0%) |
| 45 to 59 Minutes | 96 (6.0%) | 62 (4.9%) |
| 60 to 89 Minutes | 29 (1.8%) | 29 (2.3%) |
| 90 or more Minutes | 28 (1.8%) | 46 (3.6%) |
Time of Departure to Work by Sex in Gold River
The most frequent times of departure to work in Gold River are 7:00 AM to 7:29 AM (360, 22.7%) for males and 6:30 AM to 6:59 AM (279, 22.1%) for females.
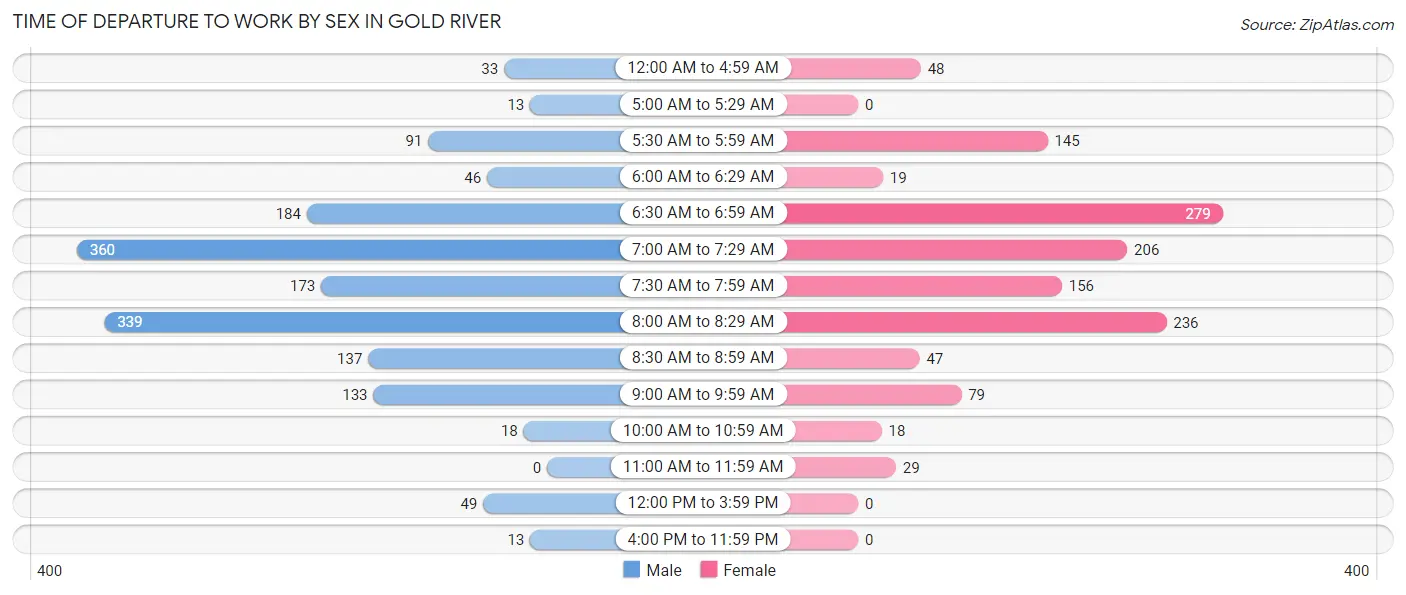
| Time of Departure | Male | Female |
| 12:00 AM to 4:59 AM | 33 (2.1%) | 48 (3.8%) |
| 5:00 AM to 5:29 AM | 13 (0.8%) | 0 (0.0%) |
| 5:30 AM to 5:59 AM | 91 (5.7%) | 145 (11.5%) |
| 6:00 AM to 6:29 AM | 46 (2.9%) | 19 (1.5%) |
| 6:30 AM to 6:59 AM | 184 (11.6%) | 279 (22.1%) |
| 7:00 AM to 7:29 AM | 360 (22.7%) | 206 (16.3%) |
| 7:30 AM to 7:59 AM | 173 (10.9%) | 156 (12.4%) |
| 8:00 AM to 8:29 AM | 339 (21.3%) | 236 (18.7%) |
| 8:30 AM to 8:59 AM | 137 (8.6%) | 47 (3.7%) |
| 9:00 AM to 9:59 AM | 133 (8.4%) | 79 (6.3%) |
| 10:00 AM to 10:59 AM | 18 (1.1%) | 18 (1.4%) |
| 11:00 AM to 11:59 AM | 0 (0.0%) | 29 (2.3%) |
| 12:00 PM to 3:59 PM | 49 (3.1%) | 0 (0.0%) |
| 4:00 PM to 11:59 PM | 13 (0.8%) | 0 (0.0%) |
| Total | 1,589 (100.0%) | 1,262 (100.0%) |
Housing Occupancy in Gold River
Occupancy by Ownership in Gold River
Of the total 3,459 dwellings in Gold River, owner-occupied units account for 3,032 (87.7%), while renter-occupied units make up 427 (12.3%).
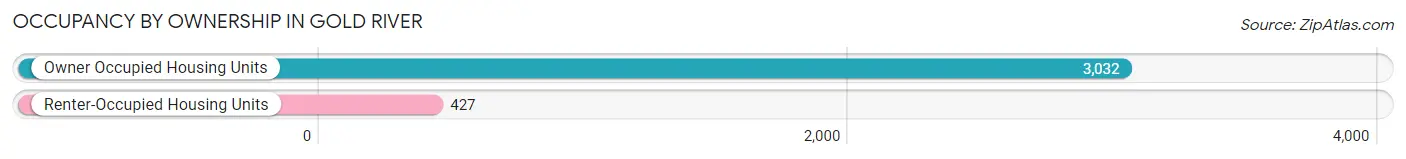
| Occupancy | # Housing Units | % Housing Units |
| Owner Occupied Housing Units | 3,032 | 87.7% |
| Renter-Occupied Housing Units | 427 | 12.3% |
| Total Occupied Housing Units | 3,459 | 100.0% |
Occupancy by Household Size in Gold River
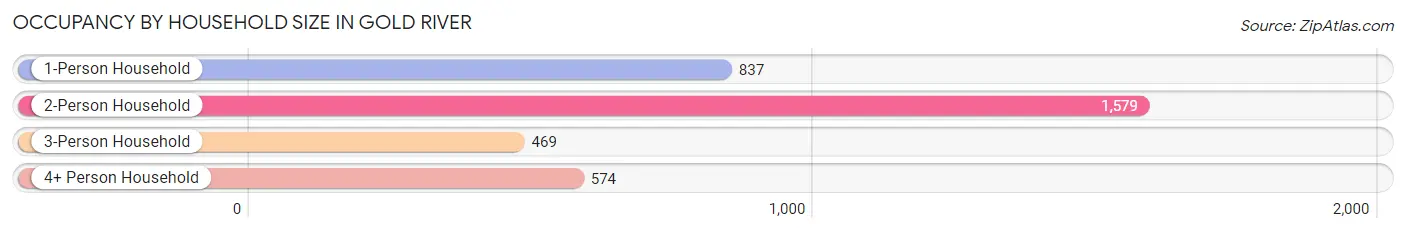
| Household Size | # Housing Units | % Housing Units |
| 1-Person Household | 837 | 24.2% |
| 2-Person Household | 1,579 | 45.7% |
| 3-Person Household | 469 | 13.6% |
| 4+ Person Household | 574 | 16.6% |
| Total Housing Units | 3,459 | 100.0% |
Occupancy by Ownership by Household Size in Gold River
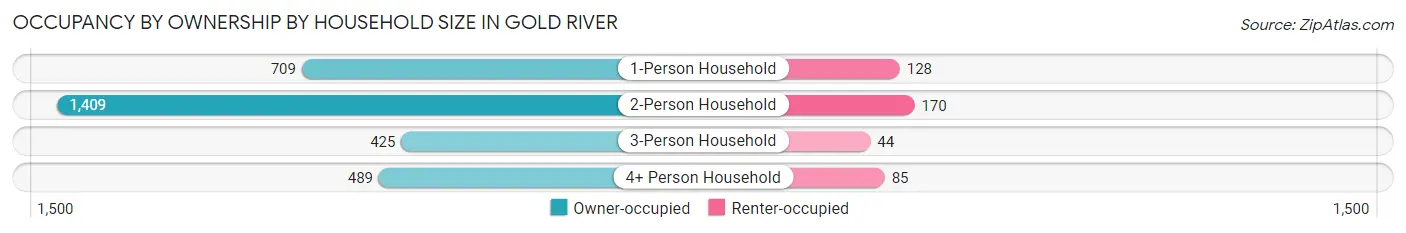
| Household Size | Owner-occupied | Renter-occupied |
| 1-Person Household | 709 (84.7%) | 128 (15.3%) |
| 2-Person Household | 1,409 (89.2%) | 170 (10.8%) |
| 3-Person Household | 425 (90.6%) | 44 (9.4%) |
| 4+ Person Household | 489 (85.2%) | 85 (14.8%) |
| Total Housing Units | 3,032 (87.7%) | 427 (12.3%) |
Occupancy by Educational Attainment in Gold River
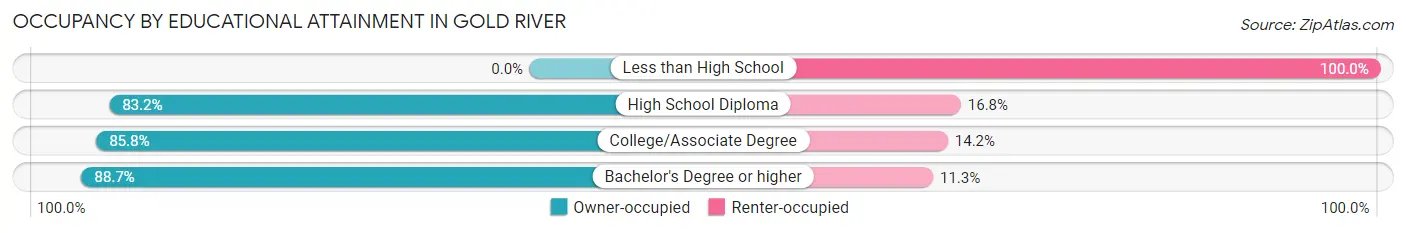
| Household Size | Owner-occupied | Renter-occupied |
| Less than High School | 0 (0.0%) | 8 (100.0%) |
| High School Diploma | 114 (83.2%) | 23 (16.8%) |
| College/Associate Degree | 658 (85.8%) | 109 (14.2%) |
| Bachelor's Degree or higher | 2,260 (88.7%) | 287 (11.3%) |
Occupancy by Age of Householder in Gold River
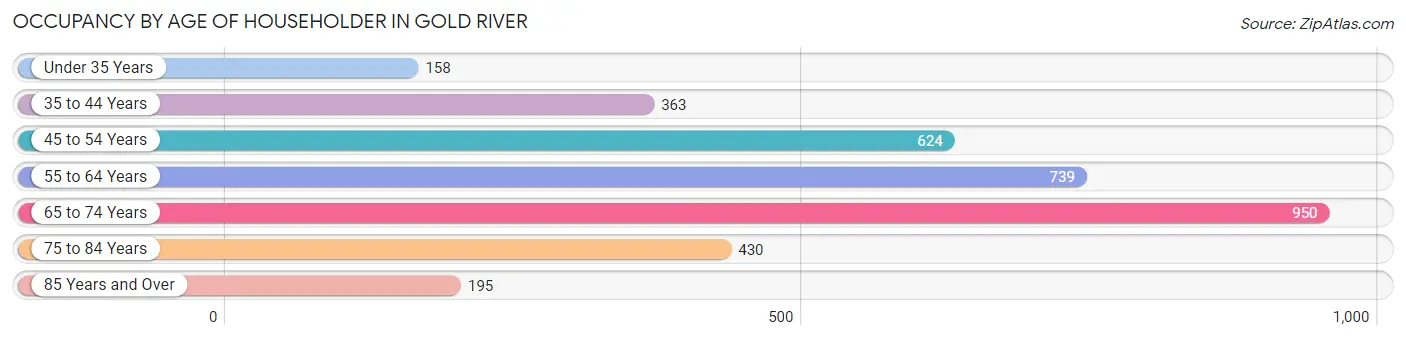
| Age Bracket | # Households | % Households |
| Under 35 Years | 158 | 4.6% |
| 35 to 44 Years | 363 | 10.5% |
| 45 to 54 Years | 624 | 18.0% |
| 55 to 64 Years | 739 | 21.4% |
| 65 to 74 Years | 950 | 27.5% |
| 75 to 84 Years | 430 | 12.4% |
| 85 Years and Over | 195 | 5.6% |
| Total | 3,459 | 100.0% |
Housing Finances in Gold River
Median Income by Occupancy in Gold River
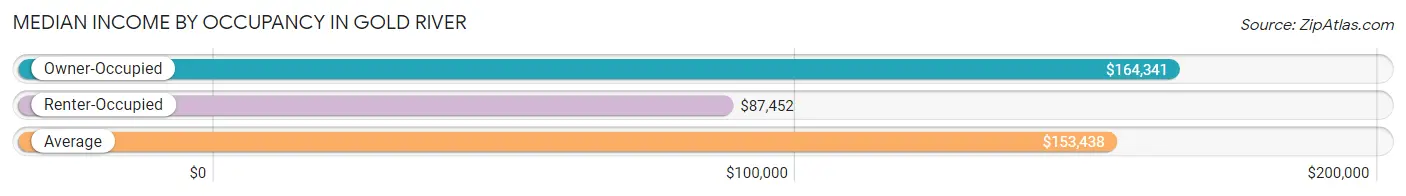
| Occupancy Type | # Households | Median Income |
| Owner-Occupied | 3,032 (87.7%) | $164,341 |
| Renter-Occupied | 427 (12.3%) | $87,452 |
| Average | 3,459 (100.0%) | $153,438 |
Occupancy by Householder Income Bracket in Gold River
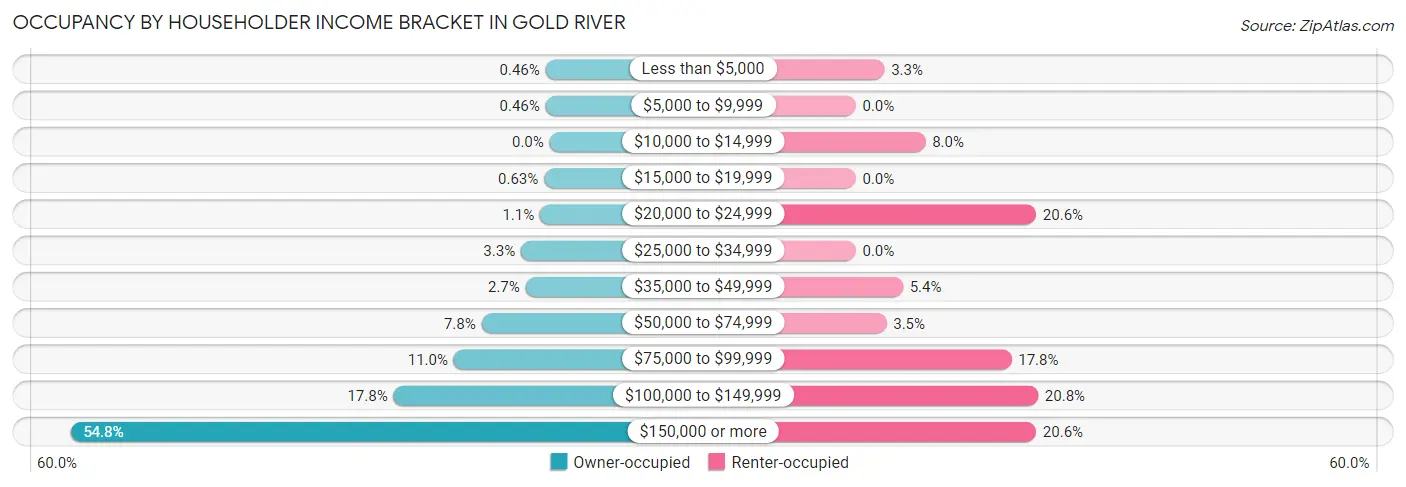
| Income Bracket | Owner-occupied | Renter-occupied |
| Less than $5,000 | 14 (0.5%) | 14 (3.3%) |
| $5,000 to $9,999 | 14 (0.5%) | 0 (0.0%) |
| $10,000 to $14,999 | 0 (0.0%) | 34 (8.0%) |
| $15,000 to $19,999 | 19 (0.6%) | 0 (0.0%) |
| $20,000 to $24,999 | 33 (1.1%) | 88 (20.6%) |
| $25,000 to $34,999 | 99 (3.3%) | 0 (0.0%) |
| $35,000 to $49,999 | 83 (2.7%) | 23 (5.4%) |
| $50,000 to $74,999 | 236 (7.8%) | 15 (3.5%) |
| $75,000 to $99,999 | 332 (11.0%) | 76 (17.8%) |
| $100,000 to $149,999 | 541 (17.8%) | 89 (20.8%) |
| $150,000 or more | 1,661 (54.8%) | 88 (20.6%) |
| Total | 3,032 (100.0%) | 427 (100.0%) |
Monthly Housing Cost Tiers in Gold River
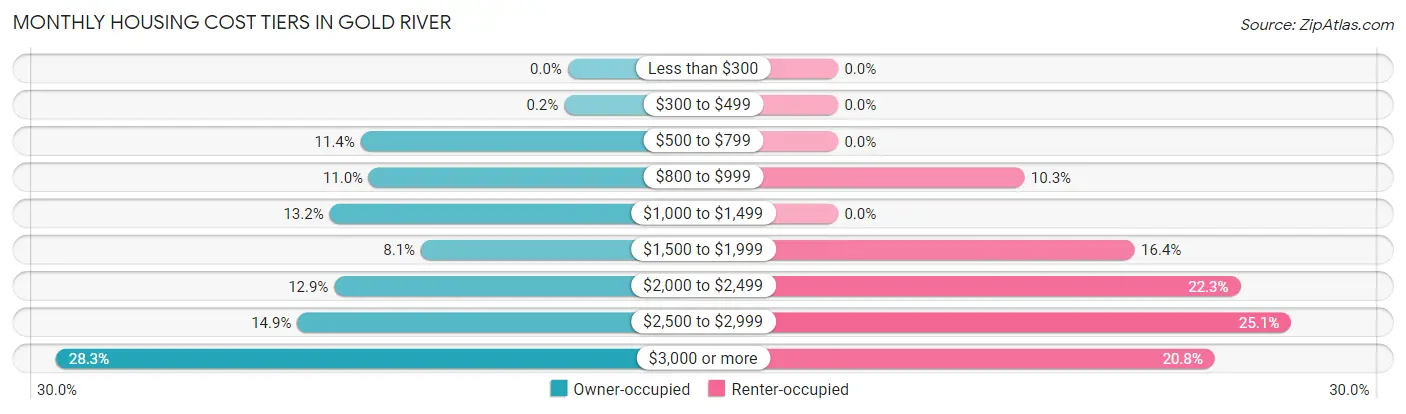
| Monthly Cost | Owner-occupied | Renter-occupied |
| Less than $300 | 0 (0.0%) | 0 (0.0%) |
| $300 to $499 | 6 (0.2%) | 0 (0.0%) |
| $500 to $799 | 347 (11.4%) | 0 (0.0%) |
| $800 to $999 | 333 (11.0%) | 44 (10.3%) |
| $1,000 to $1,499 | 399 (13.2%) | 0 (0.0%) |
| $1,500 to $1,999 | 246 (8.1%) | 70 (16.4%) |
| $2,000 to $2,499 | 391 (12.9%) | 95 (22.3%) |
| $2,500 to $2,999 | 453 (14.9%) | 107 (25.1%) |
| $3,000 or more | 857 (28.3%) | 89 (20.8%) |
| Total | 3,032 (100.0%) | 427 (100.0%) |
Physical Housing Characteristics in Gold River
Housing Structures in Gold River
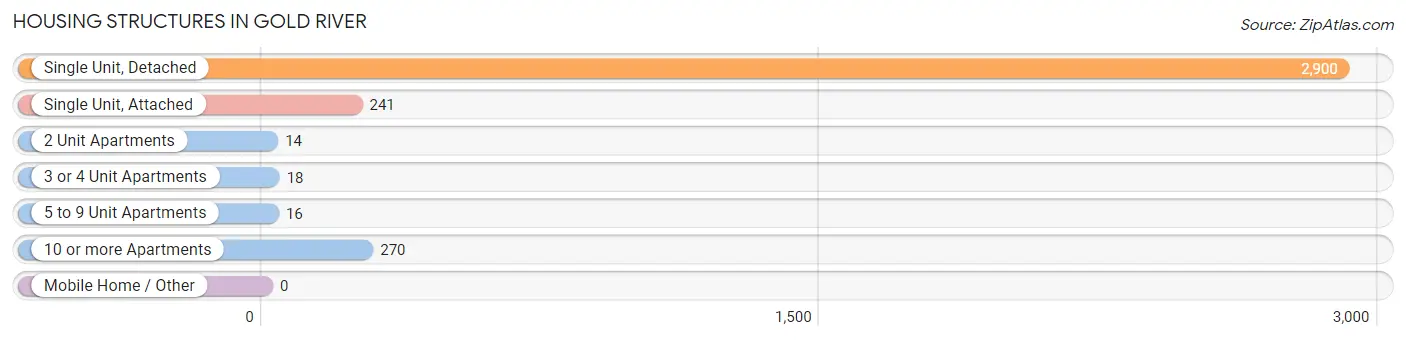
| Structure Type | # Housing Units | % Housing Units |
| Single Unit, Detached | 2,900 | 83.8% |
| Single Unit, Attached | 241 | 7.0% |
| 2 Unit Apartments | 14 | 0.4% |
| 3 or 4 Unit Apartments | 18 | 0.5% |
| 5 to 9 Unit Apartments | 16 | 0.5% |
| 10 or more Apartments | 270 | 7.8% |
| Mobile Home / Other | 0 | 0.0% |
| Total | 3,459 | 100.0% |
Housing Structures by Occupancy in Gold River
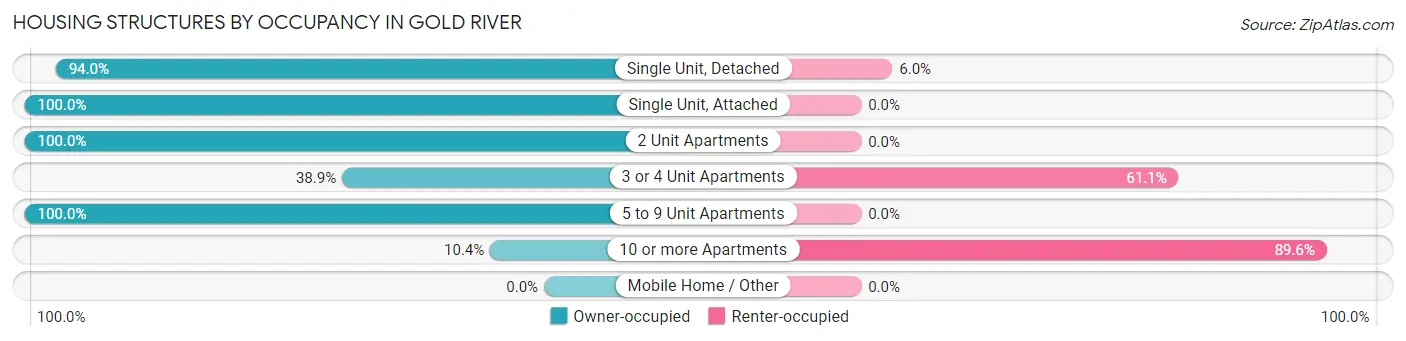
| Structure Type | Owner-occupied | Renter-occupied |
| Single Unit, Detached | 2,726 (94.0%) | 174 (6.0%) |
| Single Unit, Attached | 241 (100.0%) | 0 (0.0%) |
| 2 Unit Apartments | 14 (100.0%) | 0 (0.0%) |
| 3 or 4 Unit Apartments | 7 (38.9%) | 11 (61.1%) |
| 5 to 9 Unit Apartments | 16 (100.0%) | 0 (0.0%) |
| 10 or more Apartments | 28 (10.4%) | 242 (89.6%) |
| Mobile Home / Other | 0 (0.0%) | 0 (0.0%) |
| Total | 3,032 (87.7%) | 427 (12.3%) |
Housing Structures by Number of Rooms in Gold River
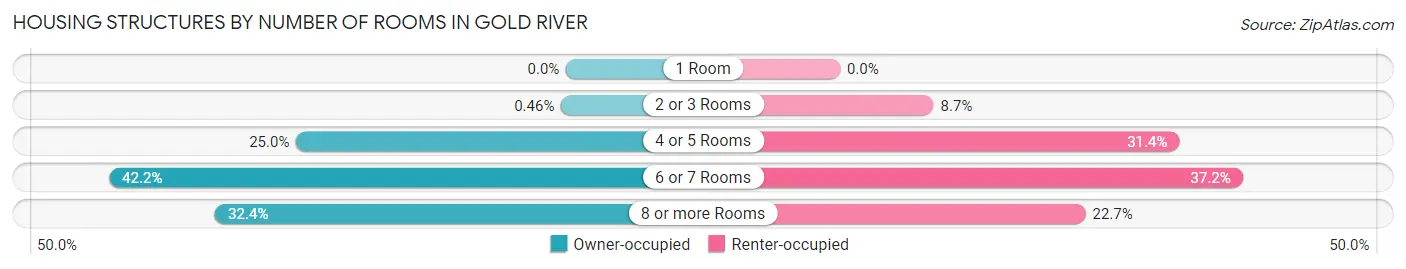
| Number of Rooms | Owner-occupied | Renter-occupied |
| 1 Room | 0 (0.0%) | 0 (0.0%) |
| 2 or 3 Rooms | 14 (0.5%) | 37 (8.7%) |
| 4 or 5 Rooms | 757 (25.0%) | 134 (31.4%) |
| 6 or 7 Rooms | 1,279 (42.2%) | 159 (37.2%) |
| 8 or more Rooms | 982 (32.4%) | 97 (22.7%) |
| Total | 3,032 (100.0%) | 427 (100.0%) |
Housing Structure by Heating Type in Gold River
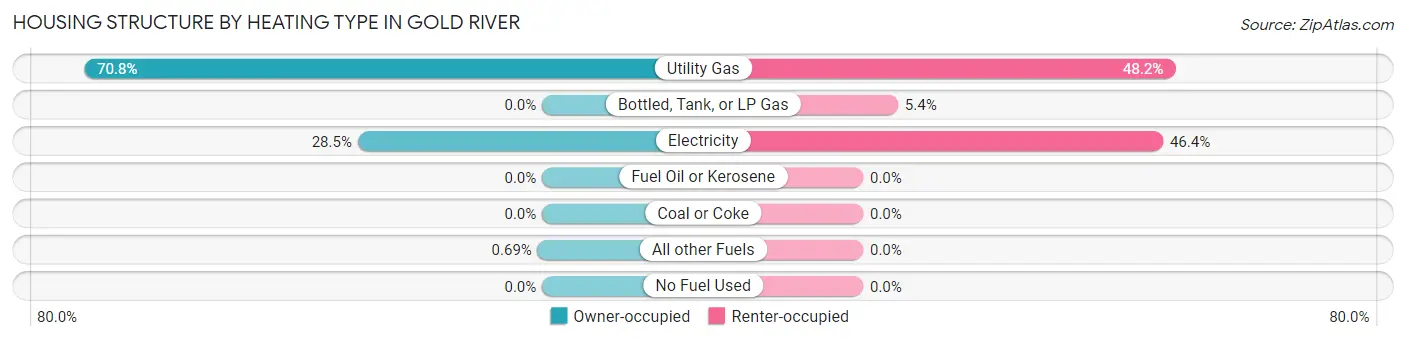
| Heating Type | Owner-occupied | Renter-occupied |
| Utility Gas | 2,147 (70.8%) | 206 (48.2%) |
| Bottled, Tank, or LP Gas | 0 (0.0%) | 23 (5.4%) |
| Electricity | 864 (28.5%) | 198 (46.4%) |
| Fuel Oil or Kerosene | 0 (0.0%) | 0 (0.0%) |
| Coal or Coke | 0 (0.0%) | 0 (0.0%) |
| All other Fuels | 21 (0.7%) | 0 (0.0%) |
| No Fuel Used | 0 (0.0%) | 0 (0.0%) |
| Total | 3,032 (100.0%) | 427 (100.0%) |
Household Vehicle Usage in Gold River
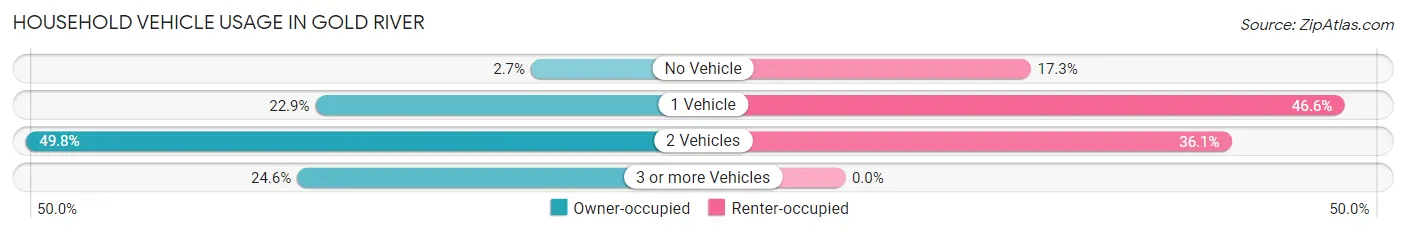
| Vehicles per Household | Owner-occupied | Renter-occupied |
| No Vehicle | 83 (2.7%) | 74 (17.3%) |
| 1 Vehicle | 693 (22.9%) | 199 (46.6%) |
| 2 Vehicles | 1,511 (49.8%) | 154 (36.1%) |
| 3 or more Vehicles | 745 (24.6%) | 0 (0.0%) |
| Total | 3,032 (100.0%) | 427 (100.0%) |
Real Estate & Mortgages in Gold River
Real Estate and Mortgage Overview in Gold River
| Characteristic | Without Mortgage | With Mortgage |
| Housing Units | 1,101 | 1,931 |
| Median Property Value | $631,000 | $653,100 |
| Median Household Income | $142,125 | $1,126 |
| Monthly Housing Costs | $902 | $857 |
| Real Estate Taxes | $4,920 | $0 |
Property Value by Mortgage Status in Gold River
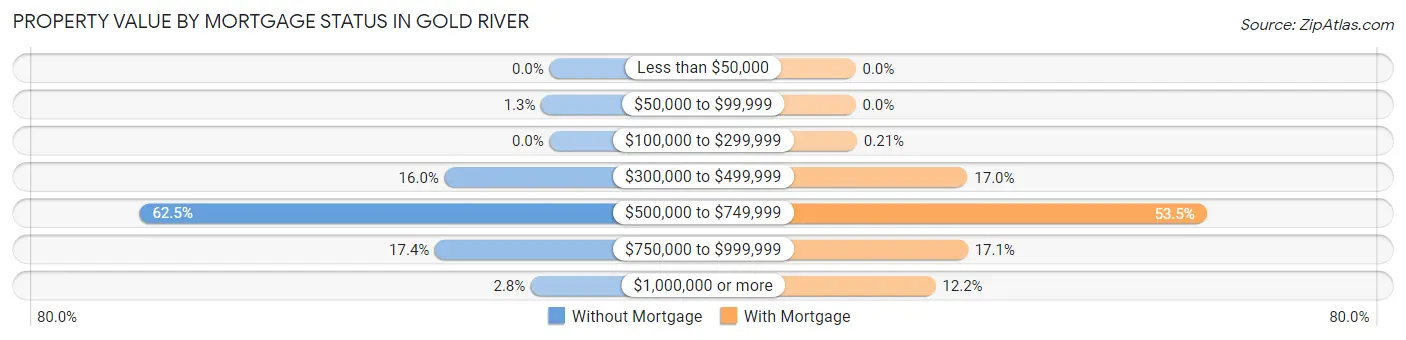
| Property Value | Without Mortgage | With Mortgage |
| Less than $50,000 | 0 (0.0%) | 0 (0.0%) |
| $50,000 to $99,999 | 14 (1.3%) | 0 (0.0%) |
| $100,000 to $299,999 | 0 (0.0%) | 4 (0.2%) |
| $300,000 to $499,999 | 176 (16.0%) | 329 (17.0%) |
| $500,000 to $749,999 | 688 (62.5%) | 1,033 (53.5%) |
| $750,000 to $999,999 | 192 (17.4%) | 330 (17.1%) |
| $1,000,000 or more | 31 (2.8%) | 235 (12.2%) |
| Total | 1,101 (100.0%) | 1,931 (100.0%) |
Household Income by Mortgage Status in Gold River
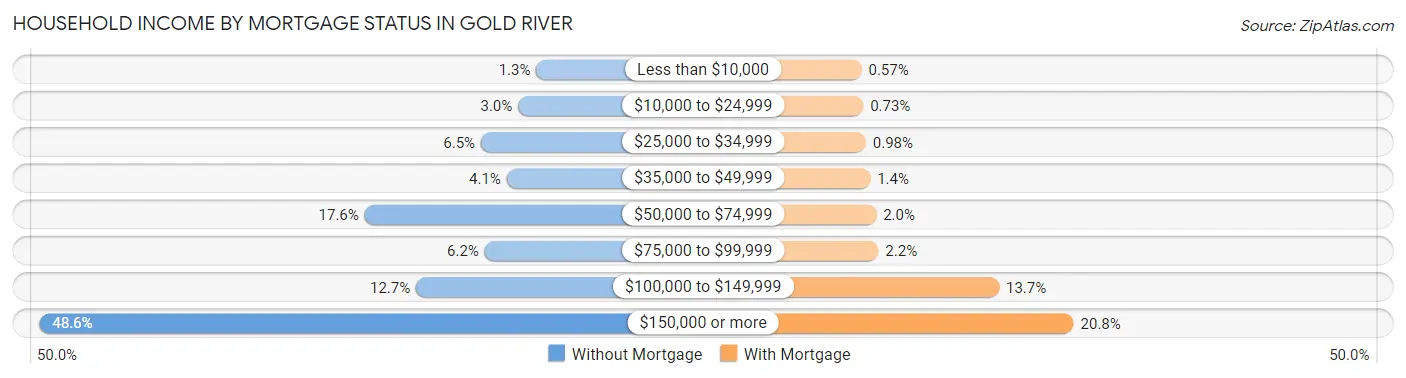
| Household Income | Without Mortgage | With Mortgage |
| Less than $10,000 | 14 (1.3%) | 11 (0.6%) |
| $10,000 to $24,999 | 33 (3.0%) | 14 (0.7%) |
| $25,000 to $34,999 | 72 (6.5%) | 19 (1.0%) |
| $35,000 to $49,999 | 45 (4.1%) | 27 (1.4%) |
| $50,000 to $74,999 | 194 (17.6%) | 38 (2.0%) |
| $75,000 to $99,999 | 68 (6.2%) | 42 (2.2%) |
| $100,000 to $149,999 | 140 (12.7%) | 264 (13.7%) |
| $150,000 or more | 535 (48.6%) | 401 (20.8%) |
| Total | 1,101 (100.0%) | 1,931 (100.0%) |
Property Value to Household Income Ratio in Gold River
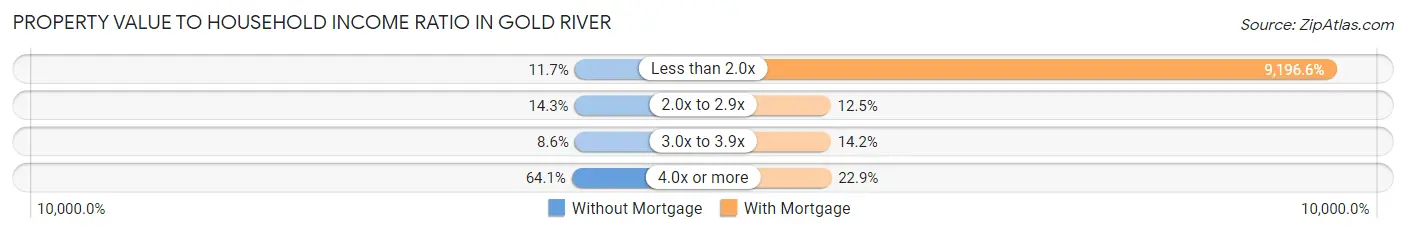
| Value-to-Income Ratio | Without Mortgage | With Mortgage |
| Less than 2.0x | 129 (11.7%) | 177,587 (9,196.6%) |
| 2.0x to 2.9x | 157 (14.3%) | 242 (12.5%) |
| 3.0x to 3.9x | 95 (8.6%) | 275 (14.2%) |
| 4.0x or more | 706 (64.1%) | 442 (22.9%) |
| Total | 1,101 (100.0%) | 1,931 (100.0%) |
Real Estate Taxes by Mortgage Status in Gold River
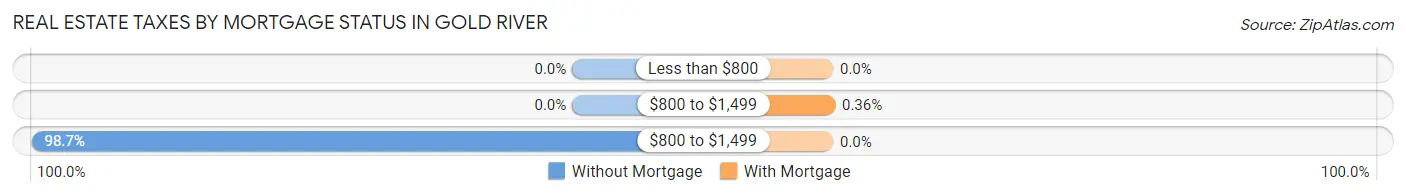
| Property Taxes | Without Mortgage | With Mortgage |
| Less than $800 | 0 (0.0%) | 0 (0.0%) |
| $800 to $1,499 | 0 (0.0%) | 7 (0.4%) |
| $800 to $1,499 | 1,087 (98.7%) | 0 (0.0%) |
| Total | 1,101 (100.0%) | 1,931 (100.0%) |
Health & Disability in Gold River
Health Insurance Coverage by Age in Gold River
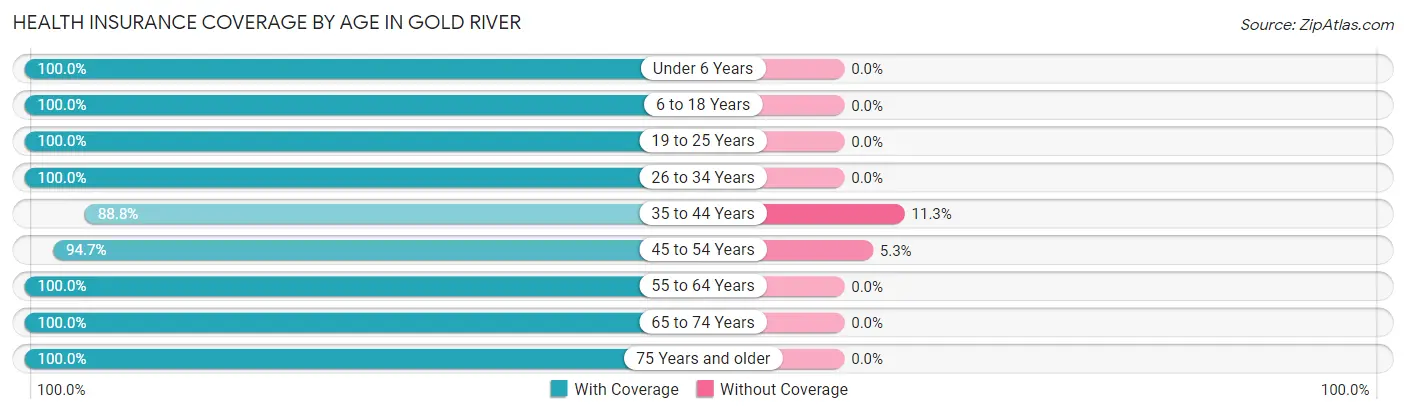
| Age Bracket | With Coverage | Without Coverage |
| Under 6 Years | 415 (100.0%) | 0 (0.0%) |
| 6 to 18 Years | 1,042 (100.0%) | 0 (0.0%) |
| 19 to 25 Years | 428 (100.0%) | 0 (0.0%) |
| 26 to 34 Years | 392 (100.0%) | 0 (0.0%) |
| 35 to 44 Years | 710 (88.7%) | 90 (11.3%) |
| 45 to 54 Years | 1,101 (94.7%) | 62 (5.3%) |
| 55 to 64 Years | 1,181 (100.0%) | 0 (0.0%) |
| 65 to 74 Years | 1,649 (100.0%) | 0 (0.0%) |
| 75 Years and older | 840 (100.0%) | 0 (0.0%) |
| Total | 7,758 (98.1%) | 152 (1.9%) |
Health Insurance Coverage by Citizenship Status in Gold River
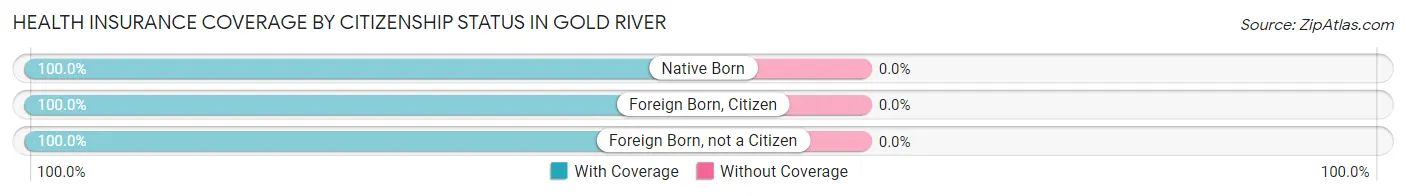
| Citizenship Status | With Coverage | Without Coverage |
| Native Born | 415 (100.0%) | 0 (0.0%) |
| Foreign Born, Citizen | 1,042 (100.0%) | 0 (0.0%) |
| Foreign Born, not a Citizen | 428 (100.0%) | 0 (0.0%) |
Health Insurance Coverage by Household Income in Gold River
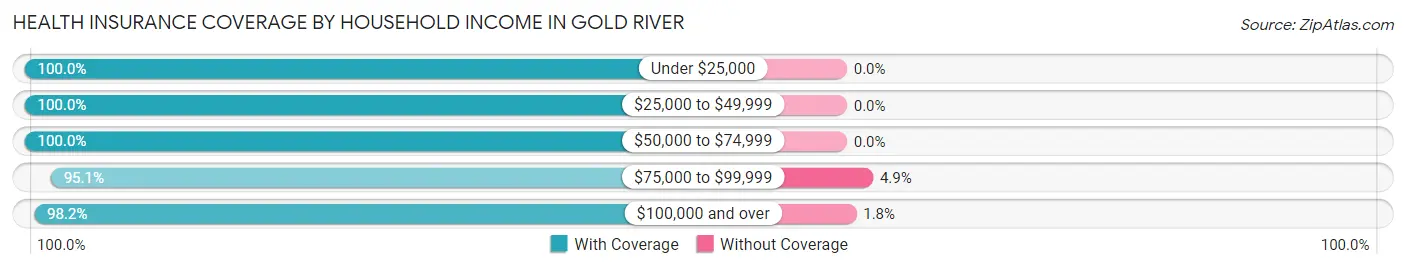
| Household Income | With Coverage | Without Coverage |
| Under $25,000 | 421 (100.0%) | 0 (0.0%) |
| $25,000 to $49,999 | 309 (100.0%) | 0 (0.0%) |
| $50,000 to $74,999 | 333 (100.0%) | 0 (0.0%) |
| $75,000 to $99,999 | 913 (95.1%) | 47 (4.9%) |
| $100,000 and over | 5,782 (98.2%) | 105 (1.8%) |
Public vs Private Health Insurance Coverage by Age in Gold River
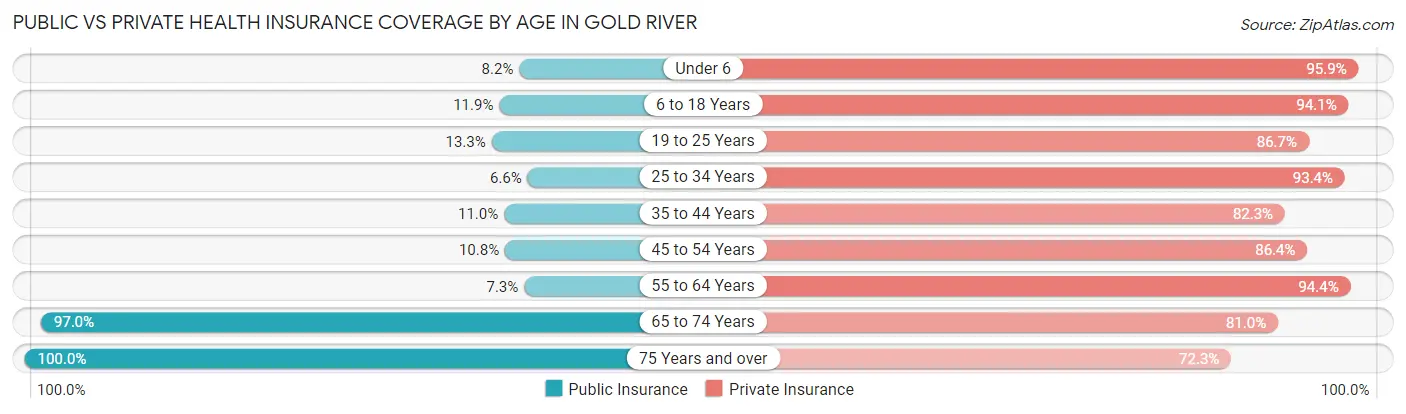
| Age Bracket | Public Insurance | Private Insurance |
| Under 6 | 34 (8.2%) | 398 (95.9%) |
| 6 to 18 Years | 124 (11.9%) | 980 (94.1%) |
| 19 to 25 Years | 57 (13.3%) | 371 (86.7%) |
| 25 to 34 Years | 26 (6.6%) | 366 (93.4%) |
| 35 to 44 Years | 88 (11.0%) | 658 (82.3%) |
| 45 to 54 Years | 126 (10.8%) | 1,005 (86.4%) |
| 55 to 64 Years | 86 (7.3%) | 1,115 (94.4%) |
| 65 to 74 Years | 1,599 (97.0%) | 1,335 (81.0%) |
| 75 Years and over | 840 (100.0%) | 607 (72.3%) |
| Total | 2,980 (37.7%) | 6,835 (86.4%) |
Disability Status by Sex by Age in Gold River
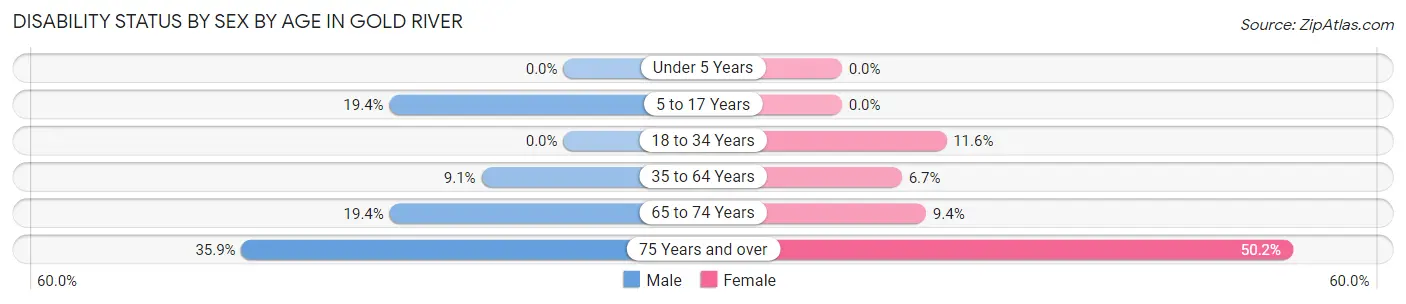
| Age Bracket | Male | Female |
| Under 5 Years | 0 (0.0%) | 0 (0.0%) |
| 5 to 17 Years | 110 (19.4%) | 0 (0.0%) |
| 18 to 34 Years | 0 (0.0%) | 47 (11.6%) |
| 35 to 64 Years | 150 (9.1%) | 100 (6.7%) |
| 65 to 74 Years | 160 (19.4%) | 77 (9.4%) |
| 75 Years and over | 147 (35.8%) | 216 (50.2%) |
Disability Class by Sex by Age in Gold River
Disability Class: Hearing Difficulty
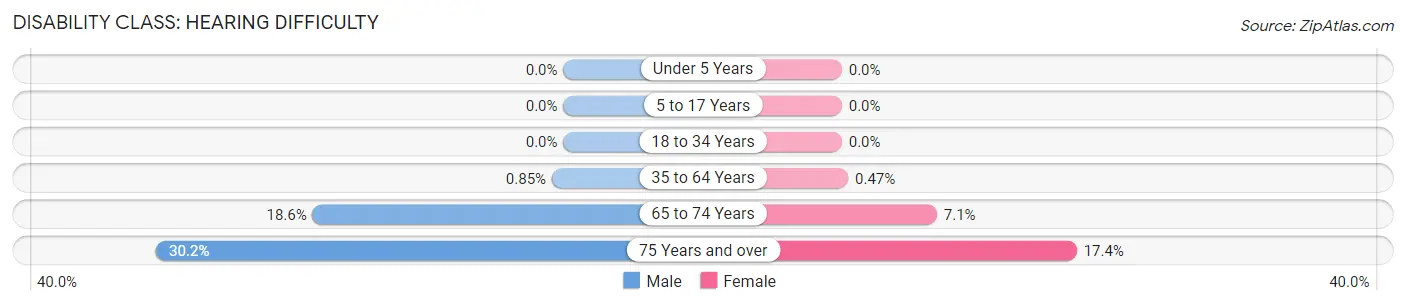
| Age Bracket | Male | Female |
| Under 5 Years | 0 (0.0%) | 0 (0.0%) |
| 5 to 17 Years | 0 (0.0%) | 0 (0.0%) |
| 18 to 34 Years | 0 (0.0%) | 0 (0.0%) |
| 35 to 64 Years | 14 (0.9%) | 7 (0.5%) |
| 65 to 74 Years | 154 (18.6%) | 58 (7.1%) |
| 75 Years and over | 124 (30.2%) | 75 (17.4%) |
Disability Class: Vision Difficulty
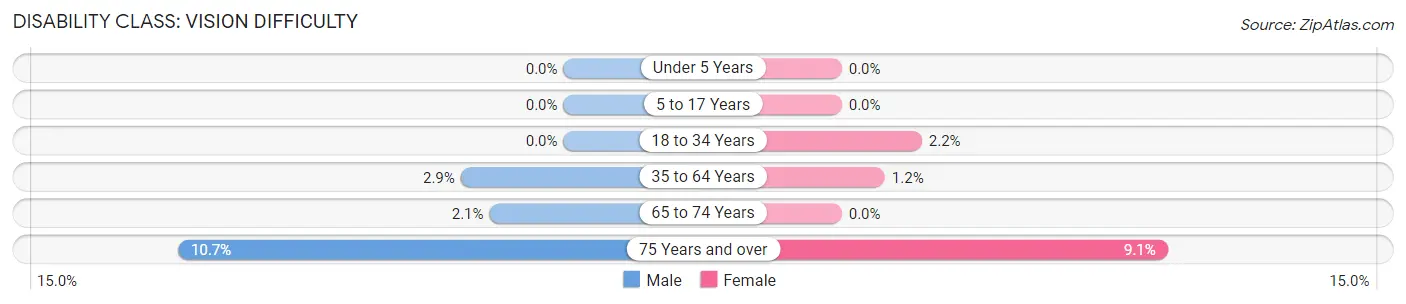
| Age Bracket | Male | Female |
| Under 5 Years | 0 (0.0%) | 0 (0.0%) |
| 5 to 17 Years | 0 (0.0%) | 0 (0.0%) |
| 18 to 34 Years | 0 (0.0%) | 9 (2.2%) |
| 35 to 64 Years | 47 (2.9%) | 18 (1.2%) |
| 65 to 74 Years | 17 (2.1%) | 0 (0.0%) |
| 75 Years and over | 44 (10.7%) | 39 (9.1%) |
Disability Class: Cognitive Difficulty
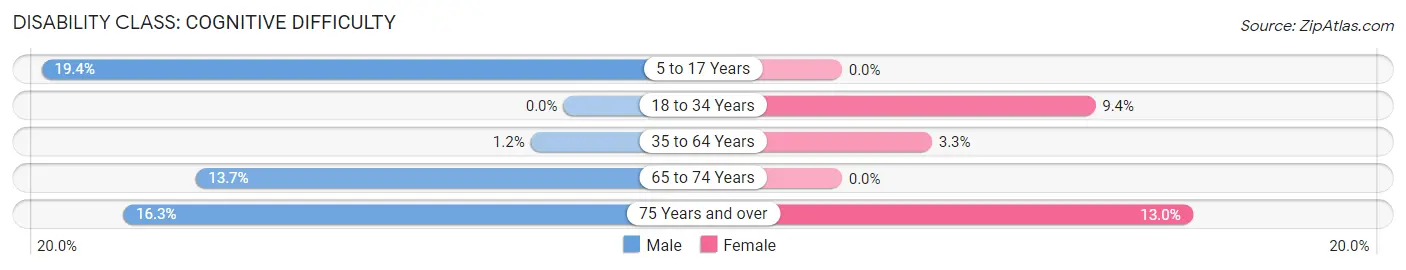
| Age Bracket | Male | Female |
| 5 to 17 Years | 110 (19.4%) | 0 (0.0%) |
| 18 to 34 Years | 0 (0.0%) | 38 (9.4%) |
| 35 to 64 Years | 20 (1.2%) | 50 (3.3%) |
| 65 to 74 Years | 113 (13.7%) | 0 (0.0%) |
| 75 Years and over | 67 (16.3%) | 56 (13.0%) |
Disability Class: Ambulatory Difficulty
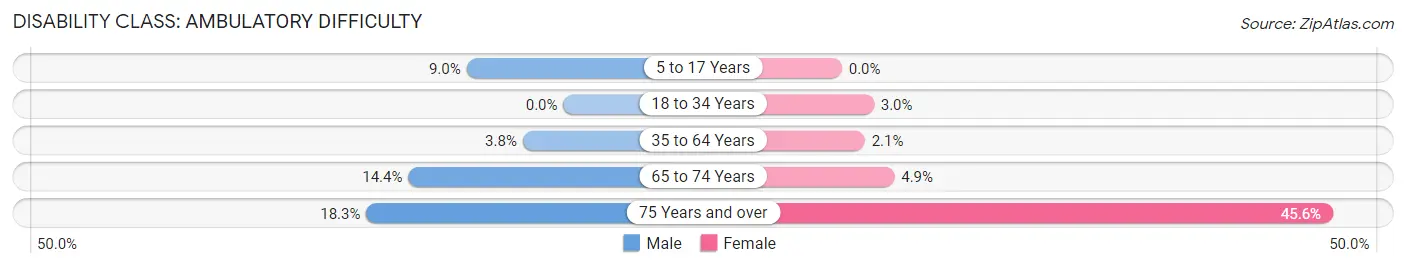
| Age Bracket | Male | Female |
| 5 to 17 Years | 51 (9.0%) | 0 (0.0%) |
| 18 to 34 Years | 0 (0.0%) | 12 (3.0%) |
| 35 to 64 Years | 62 (3.8%) | 32 (2.1%) |
| 65 to 74 Years | 119 (14.4%) | 40 (4.9%) |
| 75 Years and over | 75 (18.3%) | 196 (45.6%) |
Disability Class: Self-Care Difficulty
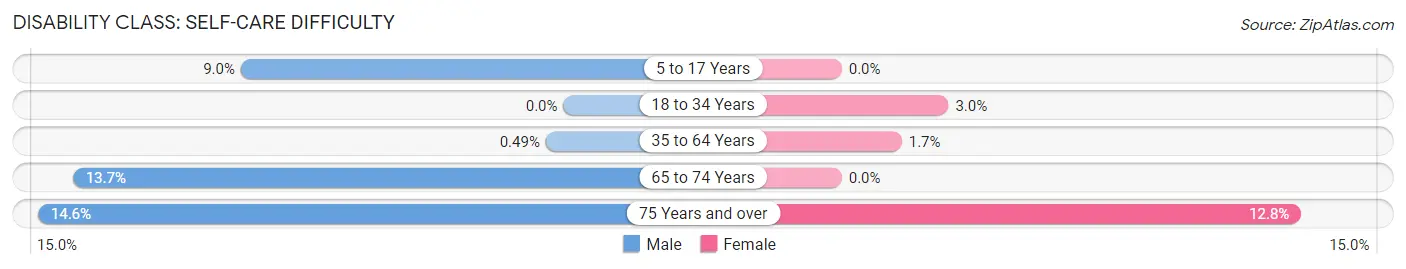
| Age Bracket | Male | Female |
| 5 to 17 Years | 51 (9.0%) | 0 (0.0%) |
| 18 to 34 Years | 0 (0.0%) | 12 (3.0%) |
| 35 to 64 Years | 8 (0.5%) | 25 (1.7%) |
| 65 to 74 Years | 113 (13.7%) | 0 (0.0%) |
| 75 Years and over | 60 (14.6%) | 55 (12.8%) |
Technology Access in Gold River
Computing Device Access in Gold River
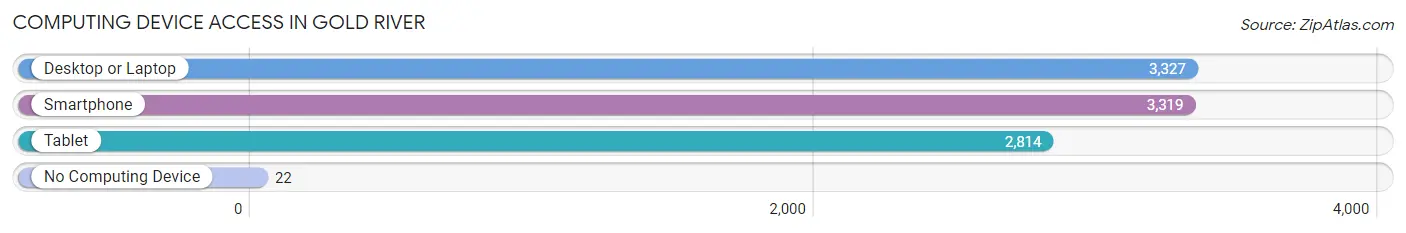
| Device Type | # Households | % Households |
| Desktop or Laptop | 3,327 | 96.2% |
| Smartphone | 3,319 | 96.0% |
| Tablet | 2,814 | 81.4% |
| No Computing Device | 22 | 0.6% |
| Total | 3,459 | 100.0% |
Internet Access in Gold River
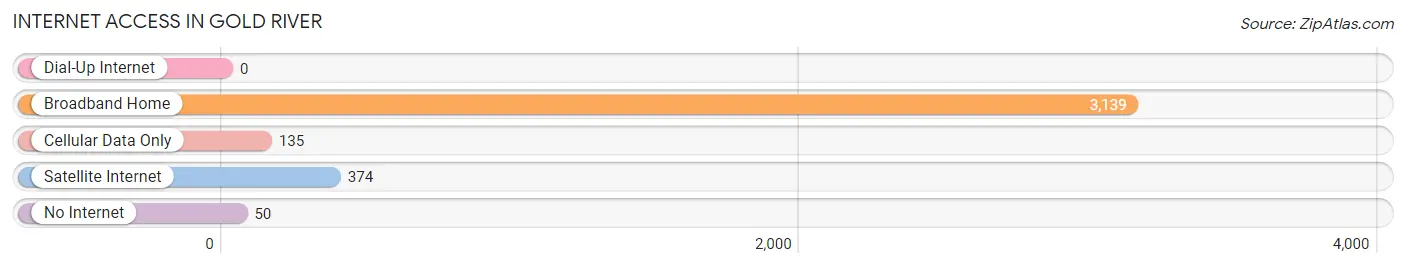
| Internet Type | # Households | % Households |
| Dial-Up Internet | 0 | 0.0% |
| Broadband Home | 3,139 | 90.7% |
| Cellular Data Only | 135 | 3.9% |
| Satellite Internet | 374 | 10.8% |
| No Internet | 50 | 1.5% |
| Total | 3,459 | 100.0% |
Gold River Summary
History
Gold River, California is a small, unincorporated community located in Sacramento County, California. It is situated along the American River, approximately 20 miles northeast of downtown Sacramento. The area was originally inhabited by the Nisenan Native Americans, who were part of the Maidu tribe. The first European settlers arrived in the area in the early 1850s, and the town was officially founded in 1854.
The town was originally named “Gold River” due to the discovery of gold in the area. The gold rush brought a large influx of people to the area, and the town quickly grew. By the late 1800s, Gold River had become a bustling community with a variety of businesses, including a hotel, a general store, a blacksmith, and a post office.
In the early 1900s, the town began to decline as the gold rush ended and the population dwindled. However, the town was revitalized in the 1950s when the nearby Folsom Dam was built, creating Lake Natoma. This provided a new source of water for the area, and the town began to grow again.
Today, Gold River is a small, quiet community with a population of just over 10,000. It is home to a variety of businesses, including restaurants, shops, and a golf course. The town is also home to a number of parks and trails, making it a popular destination for outdoor recreation.
Geography
Gold River is located in Sacramento County, California, approximately 20 miles northeast of downtown Sacramento. It is situated along the American River, and is bordered by the cities of Rancho Cordova and Folsom. The town is located at an elevation of approximately 200 feet above sea level.
The climate in Gold River is classified as Mediterranean, with hot, dry summers and mild, wet winters. The average high temperature in the summer is around 90 degrees Fahrenheit, and the average low temperature in the winter is around 40 degrees Fahrenheit.
Economy
The economy of Gold River is largely based on the service industry. The town is home to a variety of restaurants, shops, and other businesses. The town is also home to a number of parks and trails, making it a popular destination for outdoor recreation.
The town is also home to a number of technology companies, including Intel, which has a large campus in the area. The town is also home to a number of government agencies, including the California Department of Water Resources and the California Department of Fish and Wildlife.
Demographics
As of the 2010 census, the population of Gold River was 10,912. The racial makeup of the town was 75.3% White, 8.2% African American, 0.7% Native American, 8.2% Asian, 0.2% Pacific Islander, and 6.6% from other races. The median household income was $76,945, and the median age was 39.7 years.
Conclusion
Gold River, California is a small, unincorporated community located in Sacramento County, California. It is situated along the American River, approximately 20 miles northeast of downtown Sacramento. The area was originally inhabited by the Nisenan Native Americans, and was officially founded in 1854. The town was originally named “Gold River” due to the discovery of gold in the area. The gold rush brought a large influx of people to the area, and the town quickly grew. In the early 1900s, the town began to decline as the gold rush ended and the population dwindled. However, the town was revitalized in the 1950s when the nearby Folsom Dam was built, creating Lake Natoma. Today, Gold River is a small, quiet community with a population of just over 10,000. The economy of Gold River is largely based on the service industry, and the town is home to a variety of restaurants, shops, and other businesses. The town is also home to a number of technology companies, including Intel, and a number of government agencies. As of the 2010 census, the population of Gold River was 10,912, and the median household income was $76,945.
Common Questions
What is Per Capita Income in Gold River?
Per Capita income in Gold River is $81,209.
What is the Median Family Income in Gold River?
Median Family Income in Gold River is $164,986.
What is the Median Household income in Gold River?
Median Household Income in Gold River is $153,438.
What is Income or Wage Gap in Gold River?
Income or Wage Gap in Gold River is 39.1%.
Women in Gold River earn 60.9 cents for every dollar earned by a man.
What is Inequality or Gini Index in Gold River?
Inequality or Gini Index in Gold River is 0.41.
What is the Total Population of Gold River?
Total Population of Gold River is 7,910.
What is the Total Male Population of Gold River?
Total Male Population of Gold River is 3,972.
What is the Total Female Population of Gold River?
Total Female Population of Gold River is 3,938.
What is the Ratio of Males per 100 Females in Gold River?
There are 100.86 Males per 100 Females in Gold River.
What is the Ratio of Females per 100 Males in Gold River?
There are 99.14 Females per 100 Males in Gold River.
What is the Median Population Age in Gold River?
Median Population Age in Gold River is 52.2 Years.
What is the Average Family Size in Gold River
Average Family Size in Gold River is 2.7 People.
What is the Average Household Size in Gold River
Average Household Size in Gold River is 2.3 People.
How Large is the Labor Force in Gold River?
There are 3,867 People in the Labor Forcein in Gold River.
What is the Percentage of People in the Labor Force in Gold River?
58.2% of People are in the Labor Force in Gold River.
What is the Unemployment Rate in Gold River?
Unemployment Rate in Gold River is 3.5%.