Zip Codes with the Highest Percentage of Population Employed in Legal Services & Support in Chino, CA
RELATED REPORTS & OPTIONS
Legal Services & Support
Chino
Compare Zip Codes
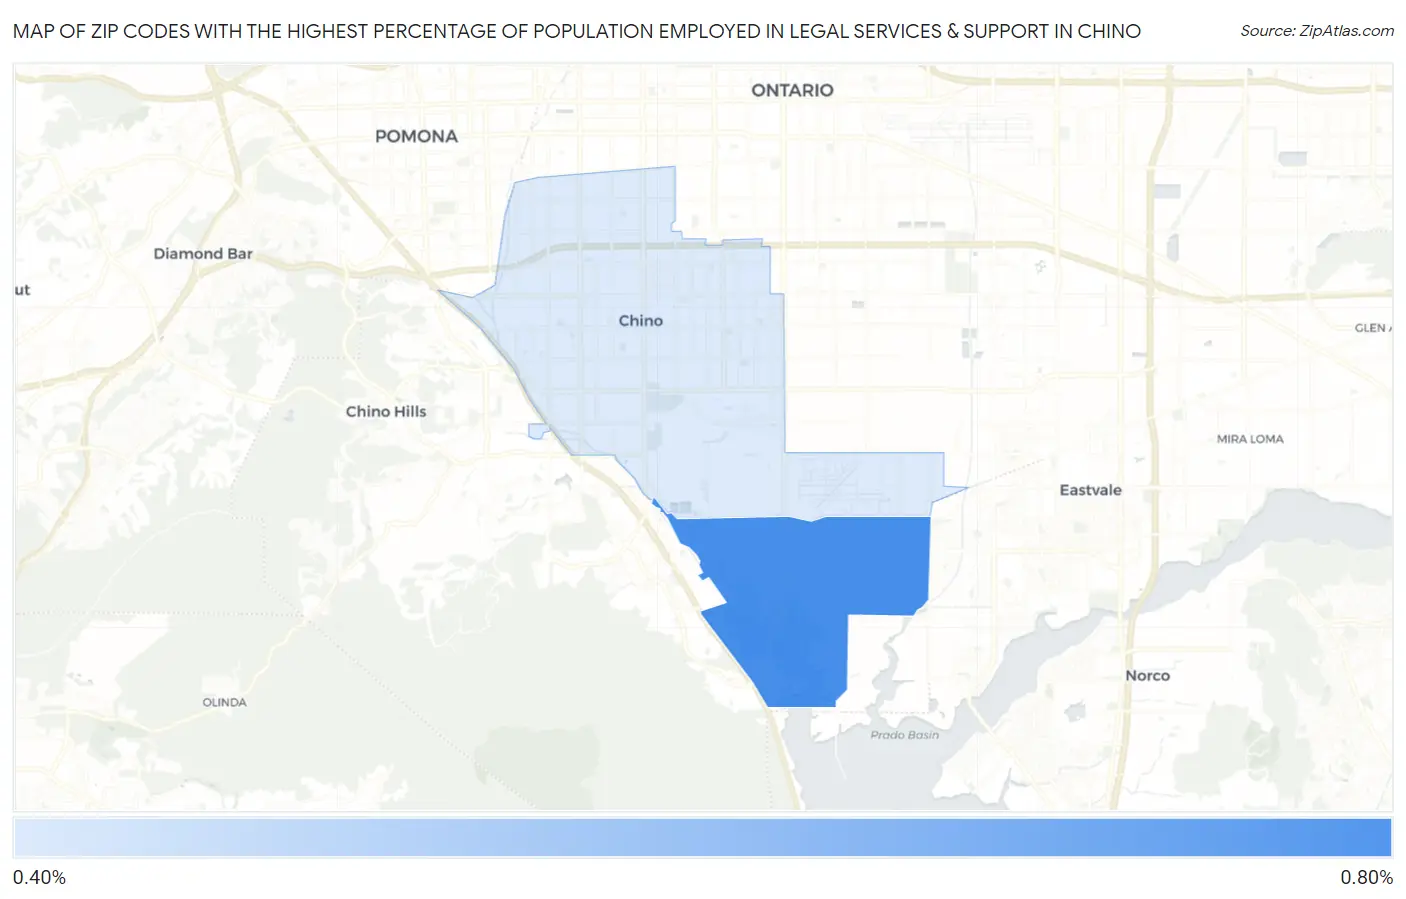
Map of Zip Codes with the Highest Percentage of Population Employed in Legal Services & Support in Chino
0.49%
0.64%
Zip Codes with the Highest Percentage of Population Employed in Legal Services & Support in Chino, CA
| Zip Code | % Employed | vs State | vs National | |
| 1. | 91708 | 0.64% | 1.3%(-0.615)#837 | 1.2%(-0.540)#11,005 |
| 2. | 91710 | 0.49% | 1.3%(-0.771)#945 | 1.2%(-0.697)#12,788 |
1
Common Questions
What are the Top Zip Codes with the Highest Percentage of Population Employed in Legal Services & Support in Chino, CA?
Top Zip Codes with the Highest Percentage of Population Employed in Legal Services & Support in Chino, CA are:
What zip code has the Highest Percentage of Population Employed in Legal Services & Support in Chino, CA?
91708 has the Highest Percentage of Population Employed in Legal Services & Support in Chino, CA with 0.64%.
What is the Percentage of Population Employed in Legal Services & Support in Chino, CA?
Percentage of Population Employed in Legal Services & Support in Chino is 0.52%.
What is the Percentage of Population Employed in Legal Services & Support in California?
Percentage of Population Employed in Legal Services & Support in California is 1.3%.
What is the Percentage of Population Employed in Legal Services & Support in the United States?
Percentage of Population Employed in Legal Services & Support in the United States is 1.2%.