Oak Park, CA Map & Demographics
Oak Park Map
Oak Park Overview
$75,542
PER CAPITA INCOME
$171,250
AVG FAMILY INCOME
$150,898
AVG HOUSEHOLD INCOME
35.8%
WAGE / INCOME GAP [ % ]
64.2¢/ $1
WAGE / INCOME GAP [ $ ]
0.47
INEQUALITY / GINI INDEX
13,627
TOTAL POPULATION
6,489
MALE POPULATION
7,138
FEMALE POPULATION
90.91
MALES / 100 FEMALES
110.00
FEMALES / 100 MALES
42.1
MEDIAN AGE
3.2
AVG FAMILY SIZE
2.7
AVG HOUSEHOLD SIZE
6,625
LABOR FORCE [ PEOPLE ]
61.4%
PERCENT IN LABOR FORCE
5.3%
UNEMPLOYMENT RATE
Oak Park Zip Codes
Income in Oak Park
Income Overview in Oak Park
Per Capita Income in Oak Park is $75,542, while median incomes of families and households are $171,250 and $150,898 respectively.
| Characteristic | Number | Measure |
| Per Capita Income | 13,627 | $75,542 |
| Median Family Income | 3,710 | $171,250 |
| Mean Family Income | 3,710 | $234,441 |
| Median Household Income | 5,015 | $150,898 |
| Mean Household Income | 5,015 | $202,375 |
| Income Deficit | 3,710 | $0 |
| Wage / Income Gap (%) | 13,627 | 35.80% |
| Wage / Income Gap ($) | 13,627 | 64.20¢ per $1 |
| Gini / Inequality Index | 13,627 | 0.47 |
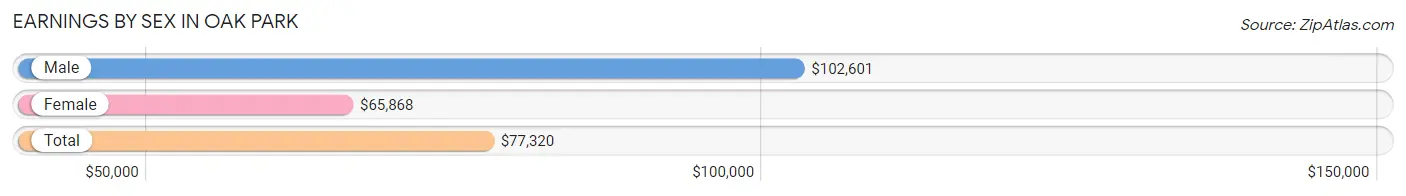
Earnings by Sex in Oak Park
Average Earnings in Oak Park are $77,320, $102,601 for men and $65,868 for women, a difference of 35.8%.
| Sex | Number | Average Earnings |
| Male | 3,603 (51.5%) | $102,601 |
| Female | 3,391 (48.5%) | $65,868 |
| Total | 6,994 (100.0%) | $77,320 |
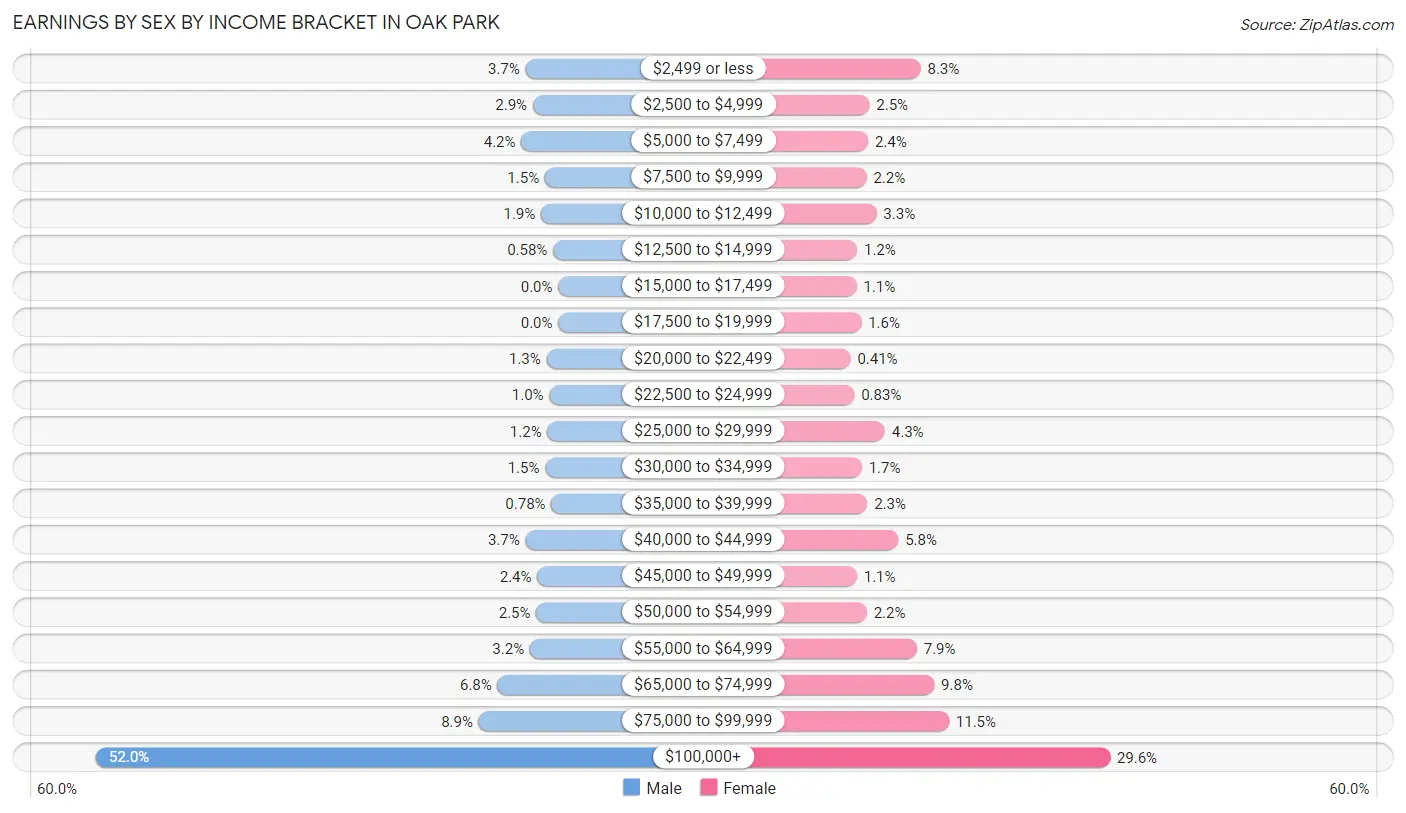
Earnings by Sex by Income Bracket in Oak Park
The most common earnings brackets in Oak Park are $100,000+ for men (1,873 | 52.0%) and $100,000+ for women (1,003 | 29.6%).
| Income | Male | Female |
| $2,499 or less | 133 (3.7%) | 281 (8.3%) |
| $2,500 to $4,999 | 103 (2.9%) | 86 (2.5%) |
| $5,000 to $7,499 | 150 (4.2%) | 81 (2.4%) |
| $7,500 to $9,999 | 54 (1.5%) | 75 (2.2%) |
| $10,000 to $12,499 | 70 (1.9%) | 113 (3.3%) |
| $12,500 to $14,999 | 21 (0.6%) | 39 (1.1%) |
| $15,000 to $17,499 | 0 (0.0%) | 37 (1.1%) |
| $17,500 to $19,999 | 0 (0.0%) | 55 (1.6%) |
| $20,000 to $22,499 | 48 (1.3%) | 14 (0.4%) |
| $22,500 to $24,999 | 36 (1.0%) | 28 (0.8%) |
| $25,000 to $29,999 | 44 (1.2%) | 145 (4.3%) |
| $30,000 to $34,999 | 53 (1.5%) | 57 (1.7%) |
| $35,000 to $39,999 | 28 (0.8%) | 78 (2.3%) |
| $40,000 to $44,999 | 133 (3.7%) | 196 (5.8%) |
| $45,000 to $49,999 | 85 (2.4%) | 38 (1.1%) |
| $50,000 to $54,999 | 89 (2.5%) | 76 (2.2%) |
| $55,000 to $64,999 | 115 (3.2%) | 267 (7.9%) |
| $65,000 to $74,999 | 246 (6.8%) | 333 (9.8%) |
| $75,000 to $99,999 | 322 (8.9%) | 389 (11.5%) |
| $100,000+ | 1,873 (52.0%) | 1,003 (29.6%) |
| Total | 3,603 (100.0%) | 3,391 (100.0%) |
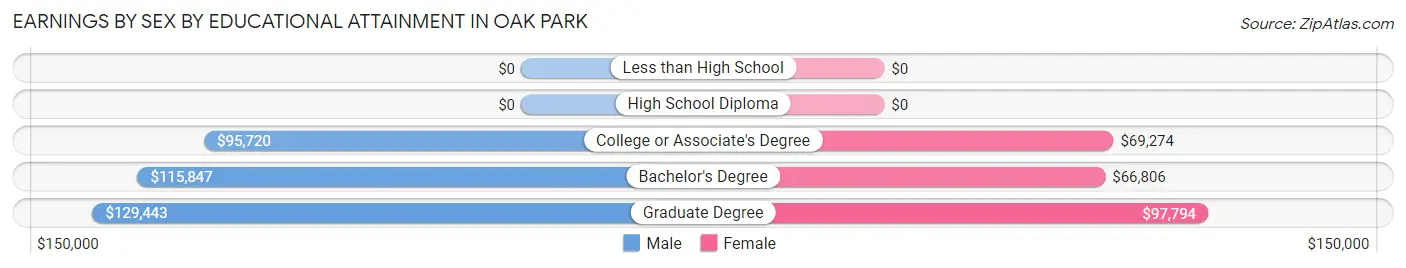
Earnings by Sex by Educational Attainment in Oak Park
Average earnings in Oak Park are $113,041 for men and $69,509 for women, a difference of 38.5%. Men with an educational attainment of graduate degree enjoy the highest average annual earnings of $129,443, while those with college or associate's degree education earn the least with $95,720. Women with an educational attainment of graduate degree earn the most with the average annual earnings of $97,794, while those with bachelor's degree education have the smallest earnings of $66,806.
| Educational Attainment | Male Income | Female Income |
| Less than High School | - | - |
| High School Diploma | - | - |
| College or Associate's Degree | $95,720 | $69,274 |
| Bachelor's Degree | $115,847 | $66,806 |
| Graduate Degree | $129,443 | $97,794 |
| Total | $113,041 | $69,509 |
Family Income in Oak Park
Family Income Brackets in Oak Park
According to the Oak Park family income data, there are 1,503 families falling into the $200,000+ income range, which is the most common income bracket and makes up 40.5% of all families. Conversely, the $10,000 to $14,999 income bracket is the least frequent group with only 11 families (0.3%) belonging to this category.
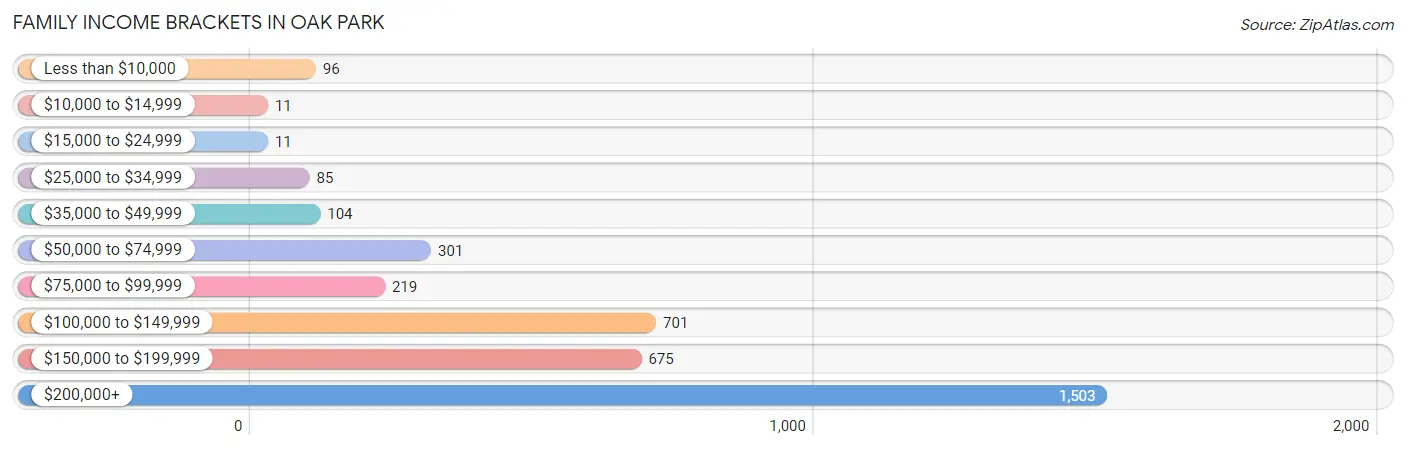
| Income Bracket | # Families | % Families |
| Less than $10,000 | 96 | 2.6% |
| $10,000 to $14,999 | 11 | 0.3% |
| $15,000 to $24,999 | 11 | 0.3% |
| $25,000 to $34,999 | 85 | 2.3% |
| $35,000 to $49,999 | 104 | 2.8% |
| $50,000 to $74,999 | 301 | 8.1% |
| $75,000 to $99,999 | 219 | 5.9% |
| $100,000 to $149,999 | 701 | 18.9% |
| $150,000 to $199,999 | 675 | 18.2% |
| $200,000+ | 1,503 | 40.5% |
Family Income by Famaliy Size in Oak Park
5-person families (337 | 9.1%) account for the highest median family income in Oak Park with $250,001 per family, while 2-person families (1,452 | 39.1%) have the highest median income of $69,834 per family member.
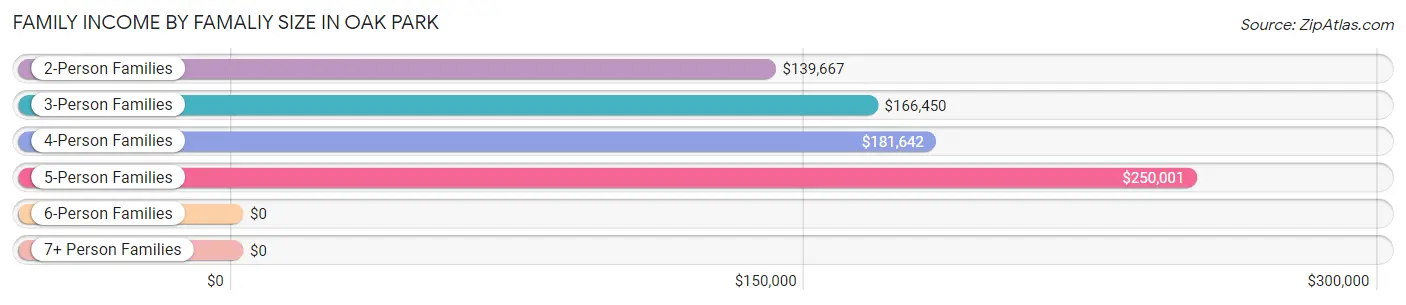
| Income Bracket | # Families | Median Income |
| 2-Person Families | 1,452 (39.1%) | $139,667 |
| 3-Person Families | 921 (24.8%) | $166,450 |
| 4-Person Families | 985 (26.6%) | $181,642 |
| 5-Person Families | 337 (9.1%) | $250,001 |
| 6-Person Families | 15 (0.4%) | $0 |
| 7+ Person Families | 0 (0.0%) | $0 |
| Total | 3,710 (100.0%) | $171,250 |
Family Income by Number of Earners in Oak Park
The median family income in Oak Park is $171,250, with families comprising 2 earners (1,751) having the highest median family income of $207,361, while families with no earners (408) have the lowest median family income of $91,149, accounting for 47.2% and 11.0% of families, respectively.
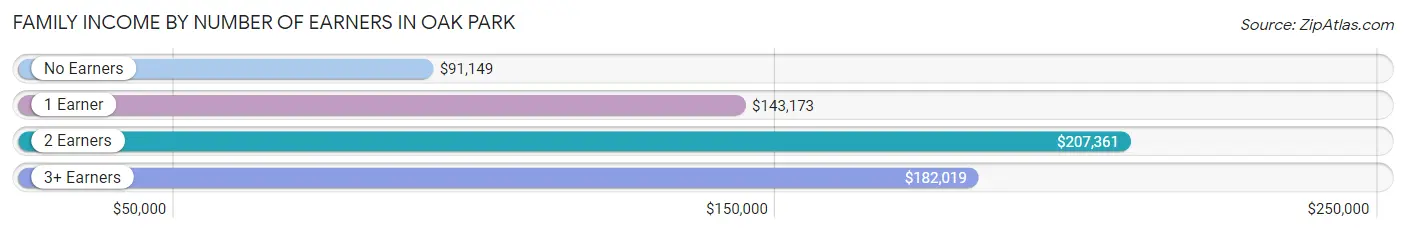
| Number of Earners | # Families | Median Income |
| No Earners | 408 (11.0%) | $91,149 |
| 1 Earner | 1,237 (33.3%) | $143,173 |
| 2 Earners | 1,751 (47.2%) | $207,361 |
| 3+ Earners | 314 (8.5%) | $182,019 |
| Total | 3,710 (100.0%) | $171,250 |
Household Income in Oak Park
Household Income Brackets in Oak Park
With 1,705 households falling in the category, the $200,000+ income range is the most frequent in Oak Park, accounting for 34.0% of all households. In contrast, only 55 households (1.1%) fall into the $10,000 to $14,999 income bracket, making it the least populous group.
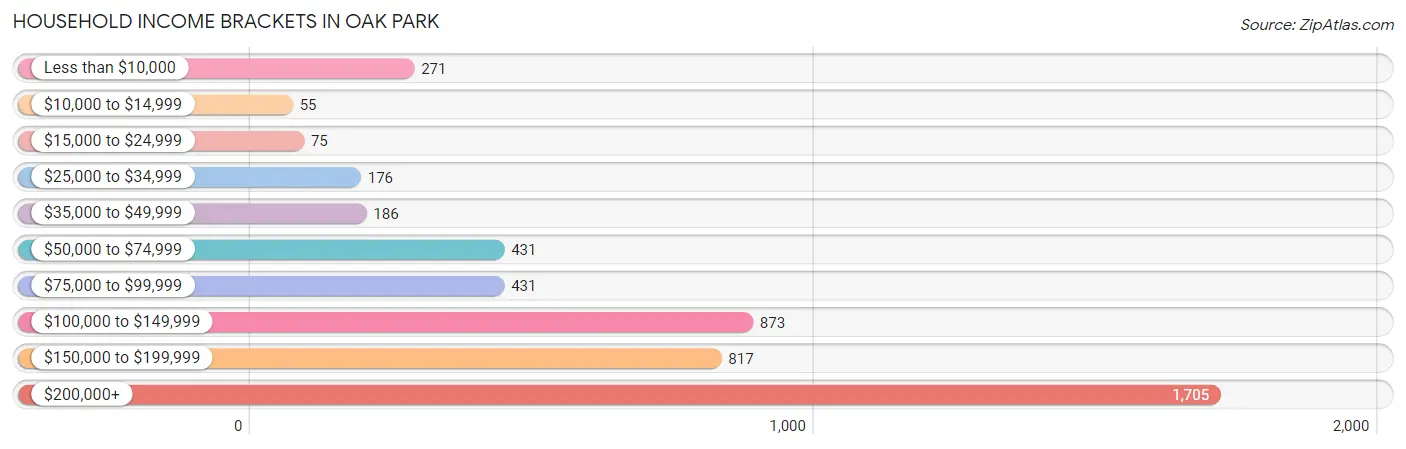
| Income Bracket | # Households | % Households |
| Less than $10,000 | 271 | 5.4% |
| $10,000 to $14,999 | 55 | 1.1% |
| $15,000 to $24,999 | 75 | 1.5% |
| $25,000 to $34,999 | 176 | 3.5% |
| $35,000 to $49,999 | 186 | 3.7% |
| $50,000 to $74,999 | 431 | 8.6% |
| $75,000 to $99,999 | 431 | 8.6% |
| $100,000 to $149,999 | 873 | 17.4% |
| $150,000 to $199,999 | 817 | 16.3% |
| $200,000+ | 1,705 | 34.0% |
Household Income by Householder Age in Oak Park
The median household income in Oak Park is $150,898, with the highest median household income of $175,335 found in the 45 to 64 years age bracket for the primary householder. A total of 2,283 households (45.5%) fall into this category. Meanwhile, the 15 to 24 years age bracket for the primary householder has the lowest median household income of $0, with 5 households (0.1%) in this group.
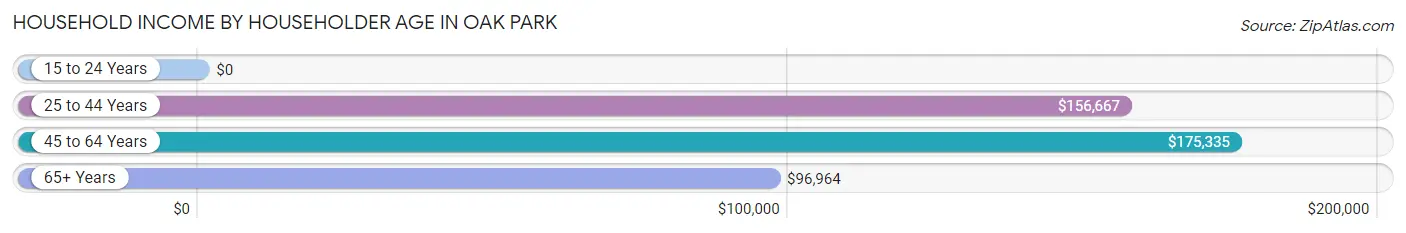
| Income Bracket | # Households | Median Income |
| 15 to 24 Years | 5 (0.1%) | $0 |
| 25 to 44 Years | 1,410 (28.1%) | $156,667 |
| 45 to 64 Years | 2,283 (45.5%) | $175,335 |
| 65+ Years | 1,317 (26.3%) | $96,964 |
| Total | 5,015 (100.0%) | $150,898 |
Poverty in Oak Park
Income Below Poverty by Sex and Age in Oak Park
With 3.8% poverty level for males and 7.2% for females among the residents of Oak Park, 16 and 17 year old males and 75 year old and over females are the most vulnerable to poverty, with 45 males (15.7%) and 199 females (42.5%) in their respective age groups living below the poverty level.
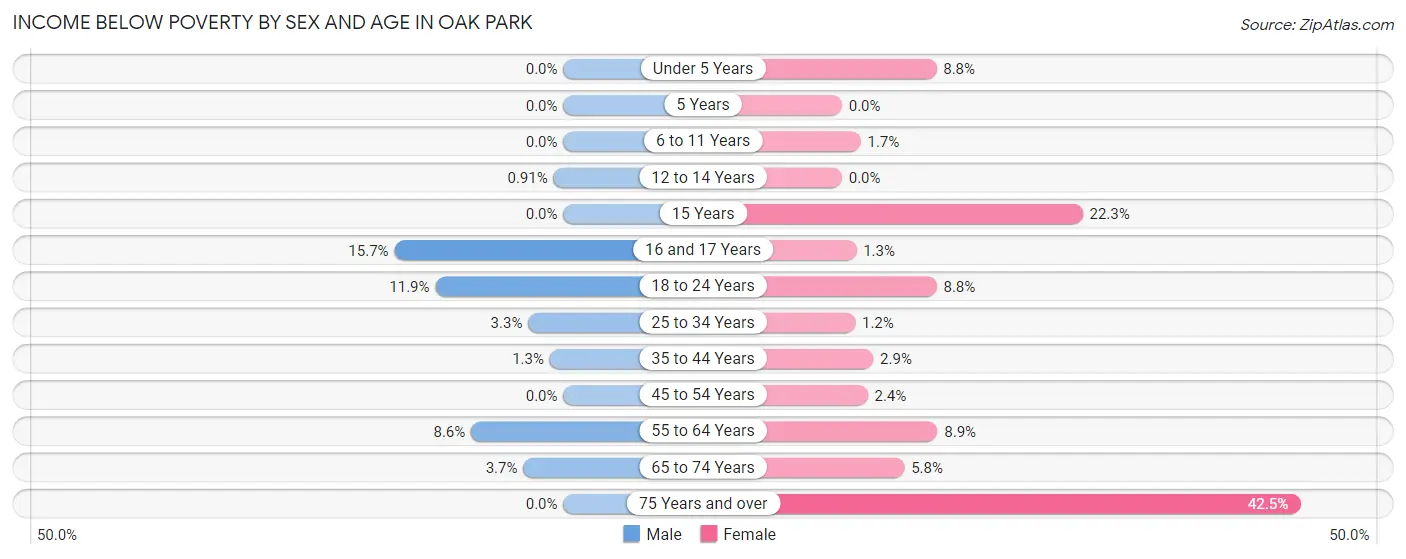
| Age Bracket | Male | Female |
| Under 5 Years | 0 (0.0%) | 35 (8.8%) |
| 5 Years | 0 (0.0%) | 0 (0.0%) |
| 6 to 11 Years | 0 (0.0%) | 7 (1.7%) |
| 12 to 14 Years | 5 (0.9%) | 0 (0.0%) |
| 15 Years | 0 (0.0%) | 21 (22.3%) |
| 16 and 17 Years | 45 (15.7%) | 4 (1.3%) |
| 18 to 24 Years | 48 (11.9%) | 40 (8.8%) |
| 25 to 34 Years | 18 (3.3%) | 6 (1.2%) |
| 35 to 44 Years | 12 (1.3%) | 32 (2.9%) |
| 45 to 54 Years | 0 (0.0%) | 29 (2.4%) |
| 55 to 64 Years | 93 (8.6%) | 84 (8.9%) |
| 65 to 74 Years | 24 (3.7%) | 50 (5.8%) |
| 75 Years and over | 0 (0.0%) | 199 (42.5%) |
| Total | 245 (3.8%) | 507 (7.2%) |
Income Above Poverty by Sex and Age in Oak Park
According to the poverty statistics in Oak Park, males aged under 5 years and females aged 5 years are the age groups that are most secure financially, with 100.0% of males and 100.0% of females in these age groups living above the poverty line.
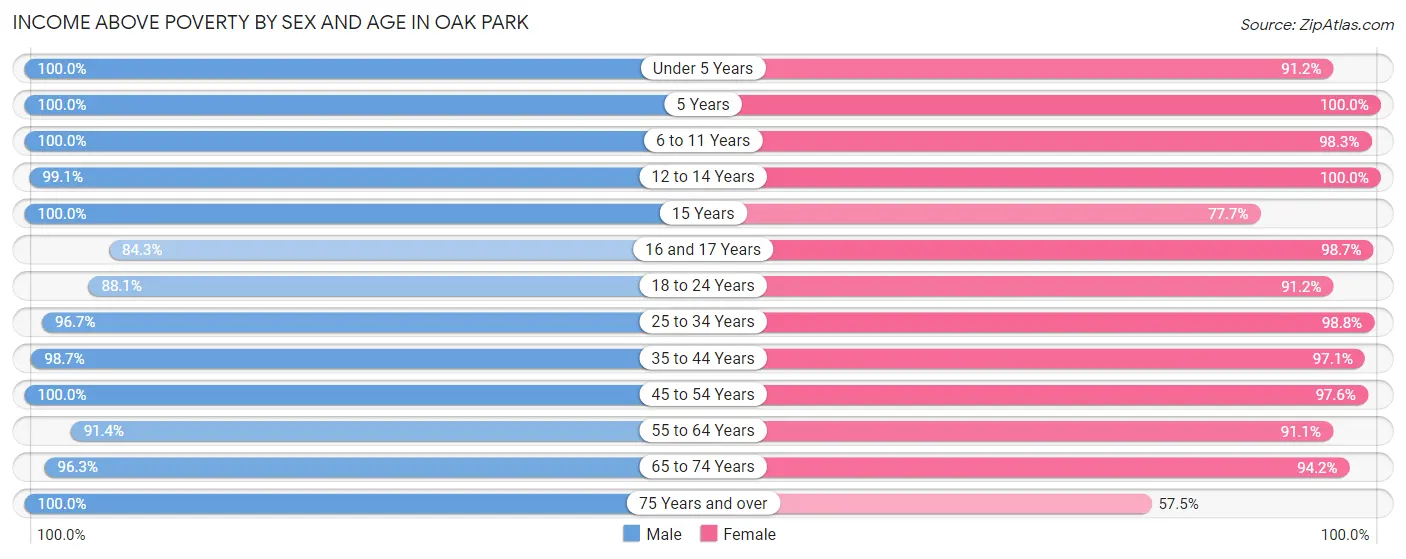
| Age Bracket | Male | Female |
| Under 5 Years | 411 (100.0%) | 364 (91.2%) |
| 5 Years | 65 (100.0%) | 39 (100.0%) |
| 6 to 11 Years | 419 (100.0%) | 396 (98.3%) |
| 12 to 14 Years | 543 (99.1%) | 285 (100.0%) |
| 15 Years | 88 (100.0%) | 73 (77.7%) |
| 16 and 17 Years | 242 (84.3%) | 295 (98.7%) |
| 18 to 24 Years | 356 (88.1%) | 415 (91.2%) |
| 25 to 34 Years | 534 (96.7%) | 482 (98.8%) |
| 35 to 44 Years | 938 (98.7%) | 1,067 (97.1%) |
| 45 to 54 Years | 852 (100.0%) | 1,183 (97.6%) |
| 55 to 64 Years | 994 (91.4%) | 863 (91.1%) |
| 65 to 74 Years | 622 (96.3%) | 814 (94.2%) |
| 75 Years and over | 180 (100.0%) | 269 (57.5%) |
| Total | 6,244 (96.2%) | 6,545 (92.8%) |
Income Below Poverty Among Married-Couple Families in Oak Park
The poverty statistics for married-couple families in Oak Park show that 3.4% or 108 of the total 3,218 families live below the poverty line. Families with 1 or 2 children have the highest poverty rate of 4.3%, comprising of 64 families. On the other hand, families with 3 or 4 children have the lowest poverty rate of 0.0%, which includes 0 families.
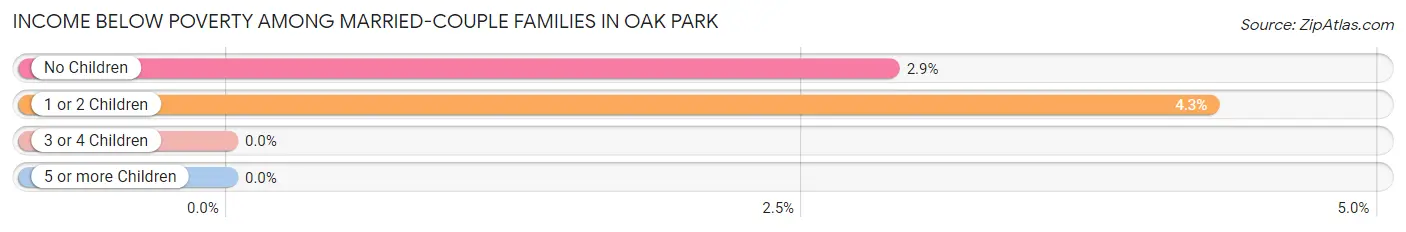
| Children | Above Poverty | Below Poverty |
| No Children | 1,482 (97.1%) | 44 (2.9%) |
| 1 or 2 Children | 1,436 (95.7%) | 64 (4.3%) |
| 3 or 4 Children | 192 (100.0%) | 0 (0.0%) |
| 5 or more Children | 0 (0.0%) | 0 (0.0%) |
| Total | 3,110 (96.6%) | 108 (3.4%) |
Income Below Poverty Among Single-Parent Households in Oak Park
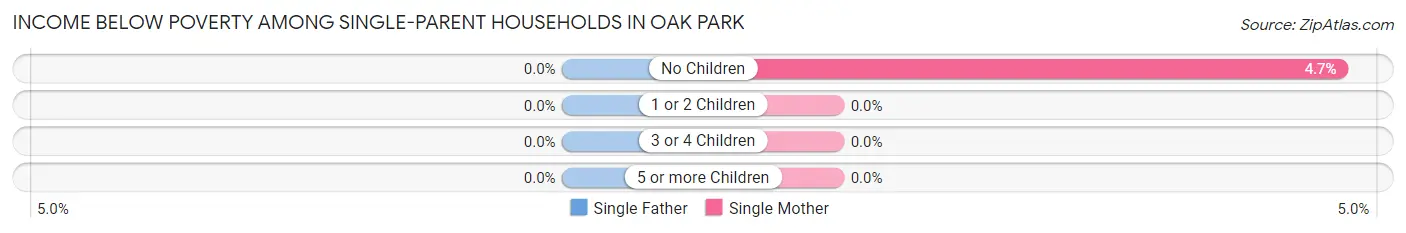
| Children | Single Father | Single Mother |
| No Children | 0 (0.0%) | 11 (4.7%) |
| 1 or 2 Children | 0 (0.0%) | 0 (0.0%) |
| 3 or 4 Children | 0 (0.0%) | 0 (0.0%) |
| 5 or more Children | 0 (0.0%) | 0 (0.0%) |
| Total | 0 (0.0%) | 11 (2.8%) |
Income Below Poverty Among Married-Couple vs Single-Parent Households in Oak Park
The poverty data for Oak Park shows that 108 of the married-couple family households (3.4%) and 11 of the single-parent households (2.2%) are living below the poverty level. Within the married-couple family households, those with 1 or 2 children have the highest poverty rate, with 64 households (4.3%) falling below the poverty line. Among the single-parent households, those with no children have the highest poverty rate, with 11 household (3.6%) living below poverty.
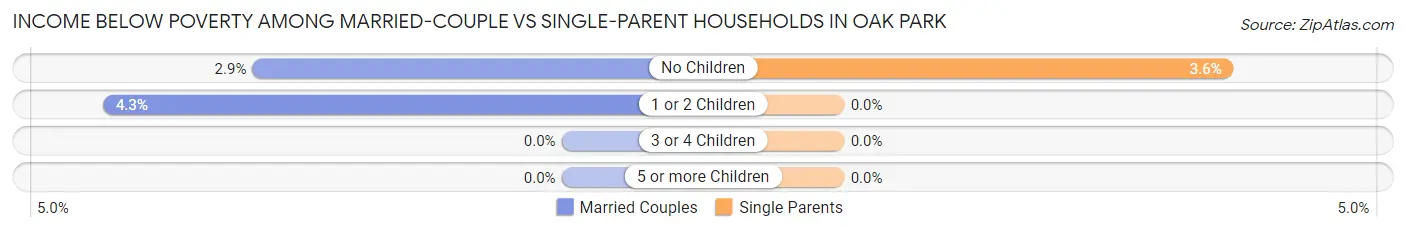
| Children | Married-Couple Families | Single-Parent Households |
| No Children | 44 (2.9%) | 11 (3.6%) |
| 1 or 2 Children | 64 (4.3%) | 0 (0.0%) |
| 3 or 4 Children | 0 (0.0%) | 0 (0.0%) |
| 5 or more Children | 0 (0.0%) | 0 (0.0%) |
| Total | 108 (3.4%) | 11 (2.2%) |
Race in Oak Park
The most populous races in Oak Park are White / Caucasian (10,172 | 74.7%), Asian (2,547 | 18.7%), and Hispanic or Latino (1,141 | 8.4%).
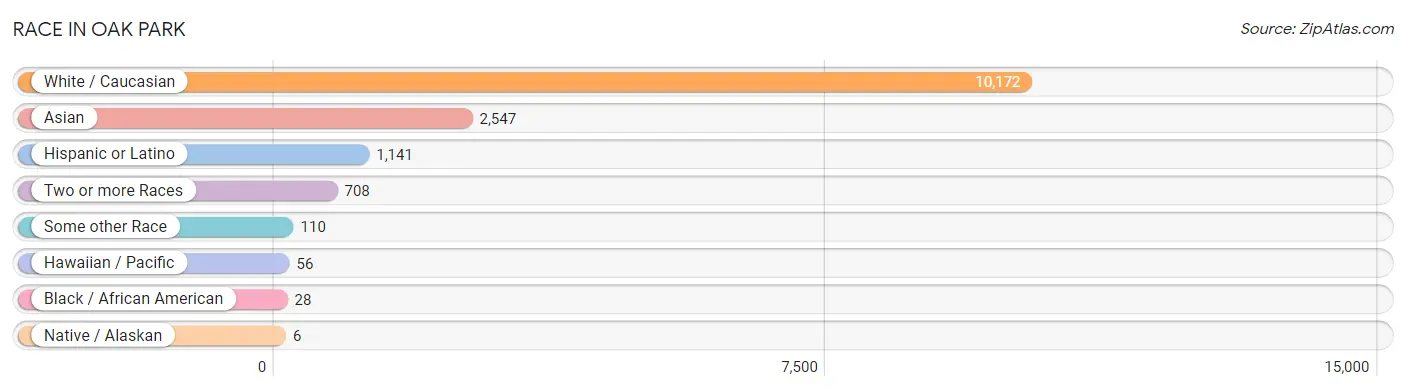
| Race | # Population | % Population |
| Asian | 2,547 | 18.7% |
| Black / African American | 28 | 0.2% |
| Hawaiian / Pacific | 56 | 0.4% |
| Hispanic or Latino | 1,141 | 8.4% |
| Native / Alaskan | 6 | 0.0% |
| White / Caucasian | 10,172 | 74.7% |
| Two or more Races | 708 | 5.2% |
| Some other Race | 110 | 0.8% |
| Total | 13,627 | 100.0% |
Ancestry in Oak Park
The most populous ancestries reported in Oak Park are German (1,220 | 8.9%), Polish (1,121 | 8.2%), English (1,086 | 8.0%), Thai (954 | 7.0%), and Indian (Asian) (827 | 6.1%), together accounting for 38.2% of all Oak Park residents.
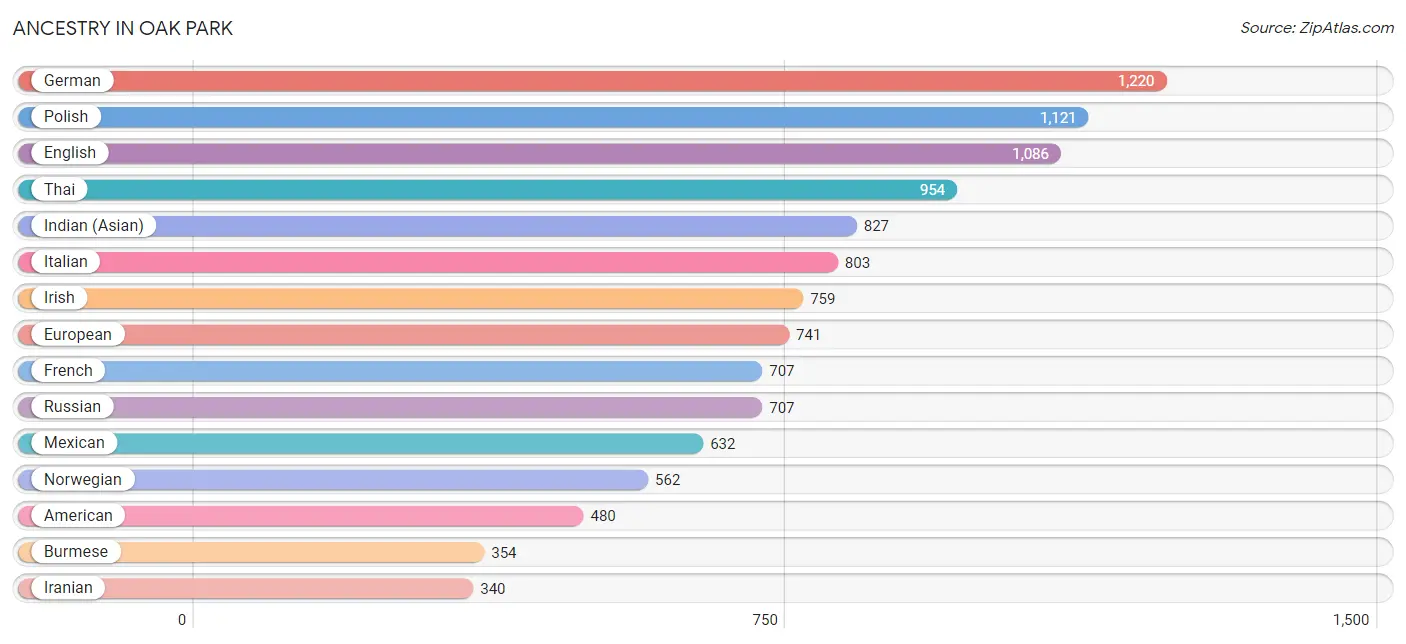
| Ancestry | # Population | % Population |
| American | 480 | 3.5% |
| Arab | 202 | 1.5% |
| Argentinean | 17 | 0.1% |
| Armenian | 27 | 0.2% |
| Austrian | 130 | 0.9% |
| Bhutanese | 289 | 2.1% |
| British | 33 | 0.2% |
| Burmese | 354 | 2.6% |
| Central American | 293 | 2.1% |
| Chilean | 46 | 0.3% |
| Croatian | 17 | 0.1% |
| Cuban | 14 | 0.1% |
| Czech | 42 | 0.3% |
| Danish | 24 | 0.2% |
| Dutch | 207 | 1.5% |
| Eastern European | 326 | 2.4% |
| Ecuadorian | 22 | 0.2% |
| Egyptian | 63 | 0.5% |
| English | 1,086 | 8.0% |
| European | 741 | 5.4% |
| Filipino | 124 | 0.9% |
| Finnish | 15 | 0.1% |
| French | 707 | 5.2% |
| French Canadian | 30 | 0.2% |
| German | 1,220 | 8.9% |
| Greek | 208 | 1.5% |
| Hungarian | 67 | 0.5% |
| Indian (Asian) | 827 | 6.1% |
| Iranian | 340 | 2.5% |
| Irish | 759 | 5.6% |
| Israeli | 59 | 0.4% |
| Italian | 803 | 5.9% |
| Kenyan | 26 | 0.2% |
| Korean | 196 | 1.4% |
| Lebanese | 64 | 0.5% |
| Lithuanian | 22 | 0.2% |
| Mexican | 632 | 4.6% |
| Mexican American Indian | 6 | 0.0% |
| Native Hawaiian | 44 | 0.3% |
| Nicaraguan | 11 | 0.1% |
| Norwegian | 562 | 4.1% |
| Peruvian | 24 | 0.2% |
| Polish | 1,121 | 8.2% |
| Portuguese | 76 | 0.6% |
| Romanian | 37 | 0.3% |
| Russian | 707 | 5.2% |
| Salvadoran | 282 | 2.1% |
| Scandinavian | 94 | 0.7% |
| Scotch-Irish | 92 | 0.7% |
| Scottish | 330 | 2.4% |
| South African | 12 | 0.1% |
| South American | 124 | 0.9% |
| Spaniard | 39 | 0.3% |
| Spanish | 25 | 0.2% |
| Sri Lankan | 21 | 0.2% |
| Subsaharan African | 38 | 0.3% |
| Swedish | 163 | 1.2% |
| Syrian | 12 | 0.1% |
| Thai | 954 | 7.0% |
| Tongan | 30 | 0.2% |
| Ukrainian | 72 | 0.5% |
| Uruguayan | 7 | 0.1% |
| Welsh | 56 | 0.4% | View All 63 Rows |
Immigrants in Oak Park
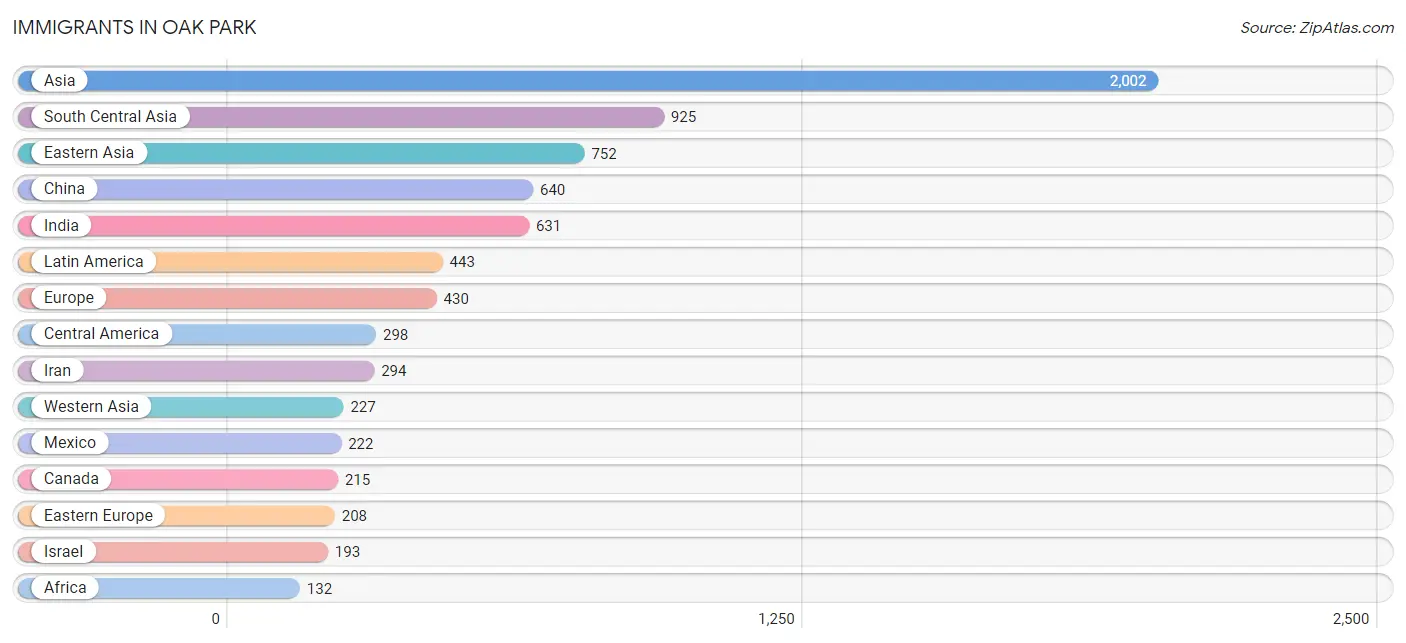
The most numerous immigrant groups reported in Oak Park came from Asia (2,002 | 14.7%), South Central Asia (925 | 6.8%), Eastern Asia (752 | 5.5%), China (640 | 4.7%), and India (631 | 4.6%), together accounting for 36.3% of all Oak Park residents.
| Immigration Origin | # Population | % Population |
| Africa | 132 | 1.0% |
| Argentina | 51 | 0.4% |
| Armenia | 23 | 0.2% |
| Asia | 2,002 | 14.7% |
| Brazil | 27 | 0.2% |
| Canada | 215 | 1.6% |
| Caribbean | 14 | 0.1% |
| Central America | 298 | 2.2% |
| China | 640 | 4.7% |
| Costa Rica | 6 | 0.0% |
| Cuba | 14 | 0.1% |
| Denmark | 7 | 0.1% |
| Eastern Africa | 15 | 0.1% |
| Eastern Asia | 752 | 5.5% |
| Eastern Europe | 208 | 1.5% |
| Ecuador | 22 | 0.2% |
| Egypt | 11 | 0.1% |
| El Salvador | 59 | 0.4% |
| England | 5 | 0.0% |
| Europe | 430 | 3.2% |
| France | 22 | 0.2% |
| Germany | 43 | 0.3% |
| Greece | 29 | 0.2% |
| Guyana | 15 | 0.1% |
| Hong Kong | 66 | 0.5% |
| India | 631 | 4.6% |
| Indonesia | 35 | 0.3% |
| Iran | 294 | 2.2% |
| Ireland | 7 | 0.1% |
| Israel | 193 | 1.4% |
| Italy | 47 | 0.3% |
| Japan | 33 | 0.2% |
| Kenya | 15 | 0.1% |
| Korea | 79 | 0.6% |
| Latin America | 443 | 3.3% |
| Lebanon | 11 | 0.1% |
| Lithuania | 17 | 0.1% |
| Mexico | 222 | 1.6% |
| Nicaragua | 11 | 0.1% |
| Northern Africa | 43 | 0.3% |
| Northern Europe | 81 | 0.6% |
| Philippines | 21 | 0.2% |
| Romania | 14 | 0.1% |
| Russia | 130 | 0.9% |
| South Africa | 74 | 0.5% |
| South America | 131 | 1.0% |
| South Central Asia | 925 | 6.8% |
| South Eastern Asia | 98 | 0.7% |
| Southern Europe | 76 | 0.6% |
| Sweden | 14 | 0.1% |
| Taiwan | 71 | 0.5% |
| Ukraine | 47 | 0.3% |
| Uruguay | 7 | 0.1% |
| Vietnam | 4 | 0.0% |
| Western Asia | 227 | 1.7% |
| Western Europe | 65 | 0.5% | View All 56 Rows |
Sex and Age in Oak Park
Sex and Age in Oak Park
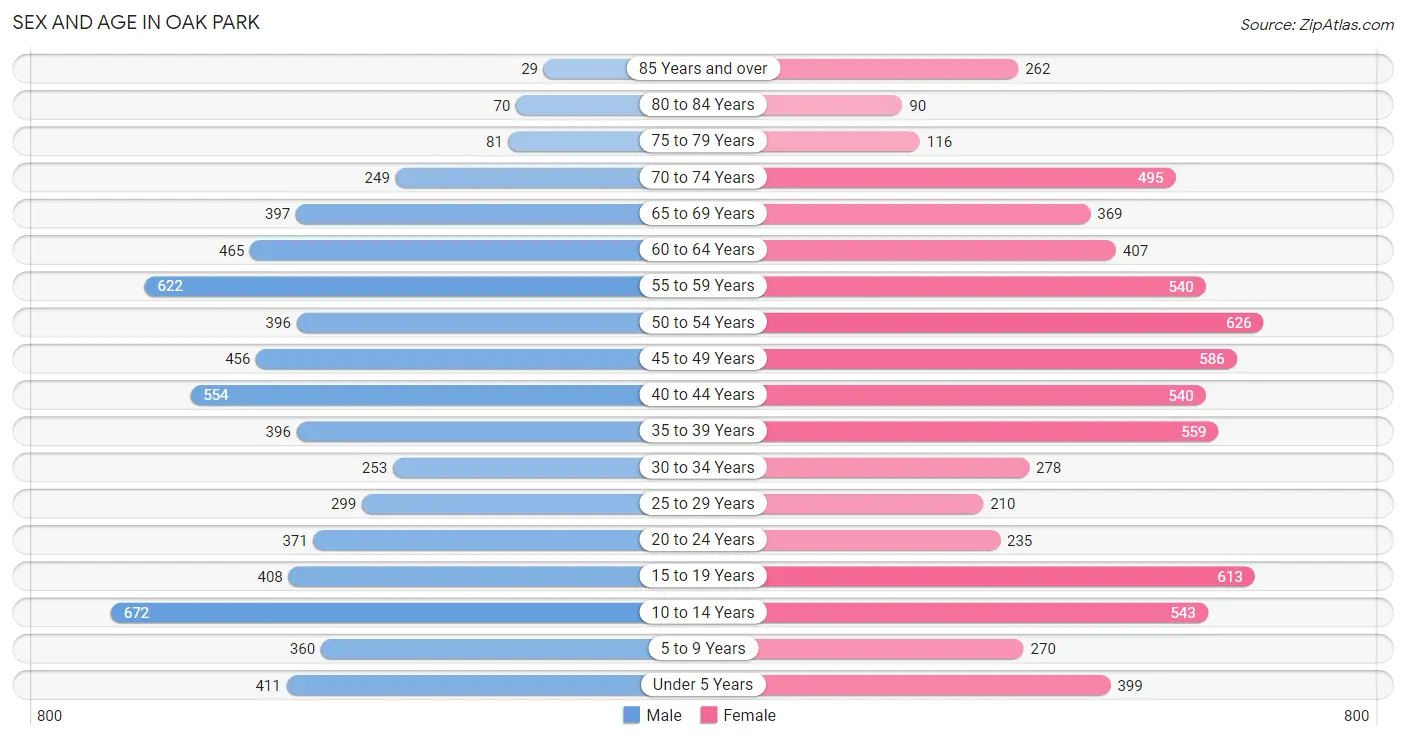
The most populous age groups in Oak Park are 10 to 14 Years (672 | 10.4%) for men and 50 to 54 Years (626 | 8.8%) for women.
| Age Bracket | Male | Female |
| Under 5 Years | 411 (6.3%) | 399 (5.6%) |
| 5 to 9 Years | 360 (5.6%) | 270 (3.8%) |
| 10 to 14 Years | 672 (10.4%) | 543 (7.6%) |
| 15 to 19 Years | 408 (6.3%) | 613 (8.6%) |
| 20 to 24 Years | 371 (5.7%) | 235 (3.3%) |
| 25 to 29 Years | 299 (4.6%) | 210 (2.9%) |
| 30 to 34 Years | 253 (3.9%) | 278 (3.9%) |
| 35 to 39 Years | 396 (6.1%) | 559 (7.8%) |
| 40 to 44 Years | 554 (8.5%) | 540 (7.6%) |
| 45 to 49 Years | 456 (7.0%) | 586 (8.2%) |
| 50 to 54 Years | 396 (6.1%) | 626 (8.8%) |
| 55 to 59 Years | 622 (9.6%) | 540 (7.6%) |
| 60 to 64 Years | 465 (7.2%) | 407 (5.7%) |
| 65 to 69 Years | 397 (6.1%) | 369 (5.2%) |
| 70 to 74 Years | 249 (3.8%) | 495 (6.9%) |
| 75 to 79 Years | 81 (1.3%) | 116 (1.6%) |
| 80 to 84 Years | 70 (1.1%) | 90 (1.3%) |
| 85 Years and over | 29 (0.4%) | 262 (3.7%) |
| Total | 6,489 (100.0%) | 7,138 (100.0%) |
Families and Households in Oak Park
Median Family Size in Oak Park
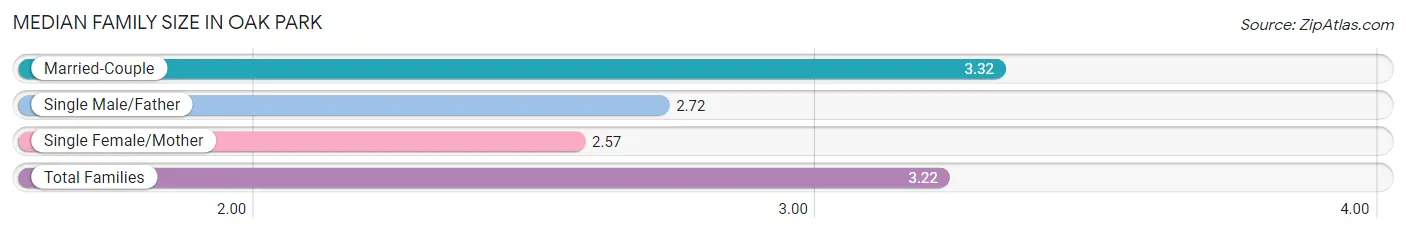
The median family size in Oak Park is 3.22 persons per family, with married-couple families (3,218 | 86.7%) accounting for the largest median family size of 3.32 persons per family. On the other hand, single female/mother families (392 | 10.6%) represent the smallest median family size with 2.57 persons per family.
| Family Type | # Families | Family Size |
| Married-Couple | 3,218 (86.7%) | 3.32 |
| Single Male/Father | 100 (2.7%) | 2.72 |
| Single Female/Mother | 392 (10.6%) | 2.57 |
| Total Families | 3,710 (100.0%) | 3.22 |
Median Household Size in Oak Park
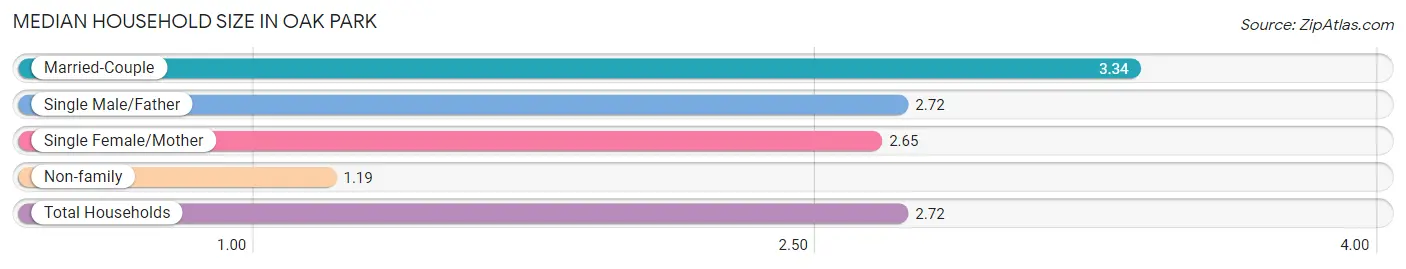
The median household size in Oak Park is 2.72 persons per household, with married-couple households (3,218 | 64.2%) accounting for the largest median household size of 3.34 persons per household. non-family households (1,305 | 26.0%) represent the smallest median household size with 1.19 persons per household.
| Household Type | # Households | Household Size |
| Married-Couple | 3,218 (64.2%) | 3.34 |
| Single Male/Father | 100 (2.0%) | 2.72 |
| Single Female/Mother | 392 (7.8%) | 2.65 |
| Non-family | 1,305 (26.0%) | 1.19 |
| Total Households | 5,015 (100.0%) | 2.72 |
Household Size by Marriage Status in Oak Park
Out of a total of 5,015 households in Oak Park, 3,710 (74.0%) are family households, while 1,305 (26.0%) are nonfamily households. The most numerous type of family households are 2-person households, comprising 1,440, and the most common type of nonfamily households are 1-person households, comprising 1,121.
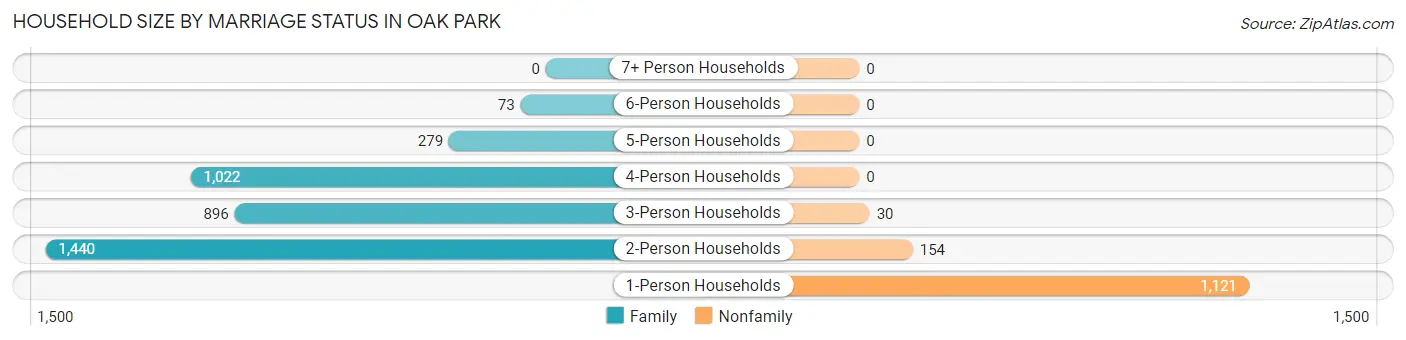
| Household Size | Family Households | Nonfamily Households |
| 1-Person Households | - | 1,121 (22.4%) |
| 2-Person Households | 1,440 (28.7%) | 154 (3.1%) |
| 3-Person Households | 896 (17.9%) | 30 (0.6%) |
| 4-Person Households | 1,022 (20.4%) | 0 (0.0%) |
| 5-Person Households | 279 (5.6%) | 0 (0.0%) |
| 6-Person Households | 73 (1.5%) | 0 (0.0%) |
| 7+ Person Households | 0 (0.0%) | 0 (0.0%) |
| Total | 3,710 (74.0%) | 1,305 (26.0%) |
Female Fertility in Oak Park
Fertility by Age in Oak Park
Average fertility rate in Oak Park is 24.0 births per 1,000 women. Women in the age bracket of 35 to 50 years have the highest fertility rate with 30.0 births per 1,000 women. Women in the age bracket of 35 to 50 years acount for 71.2% of all women with births.
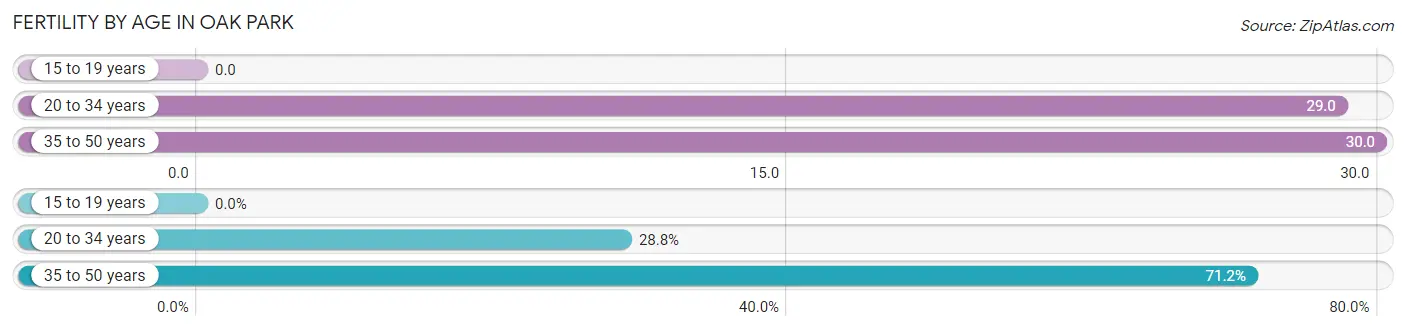
| Age Bracket | Women with Births | Births / 1,000 Women |
| 15 to 19 years | 0 (0.0%) | 0.0 |
| 20 to 34 years | 21 (28.8%) | 29.0 |
| 35 to 50 years | 52 (71.2%) | 30.0 |
| Total | 73 (100.0%) | 24.0 |
Fertility by Age by Marriage Status in Oak Park
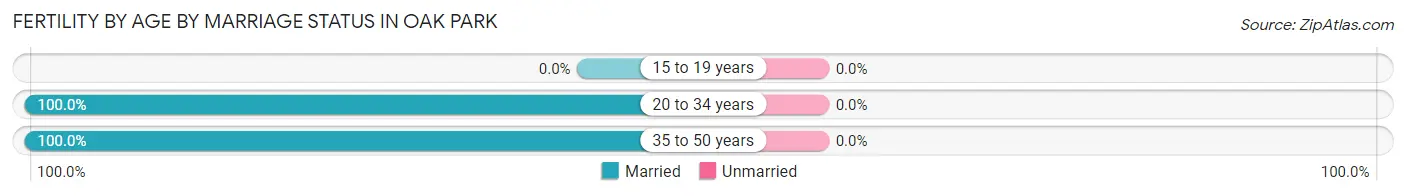
| Age Bracket | Married | Unmarried |
| 15 to 19 years | 0 (0.0%) | 0 (0.0%) |
| 20 to 34 years | 21 (100.0%) | 0 (0.0%) |
| 35 to 50 years | 52 (100.0%) | 0 (0.0%) |
| Total | 73 (100.0%) | 0 (0.0%) |
Fertility by Education in Oak Park
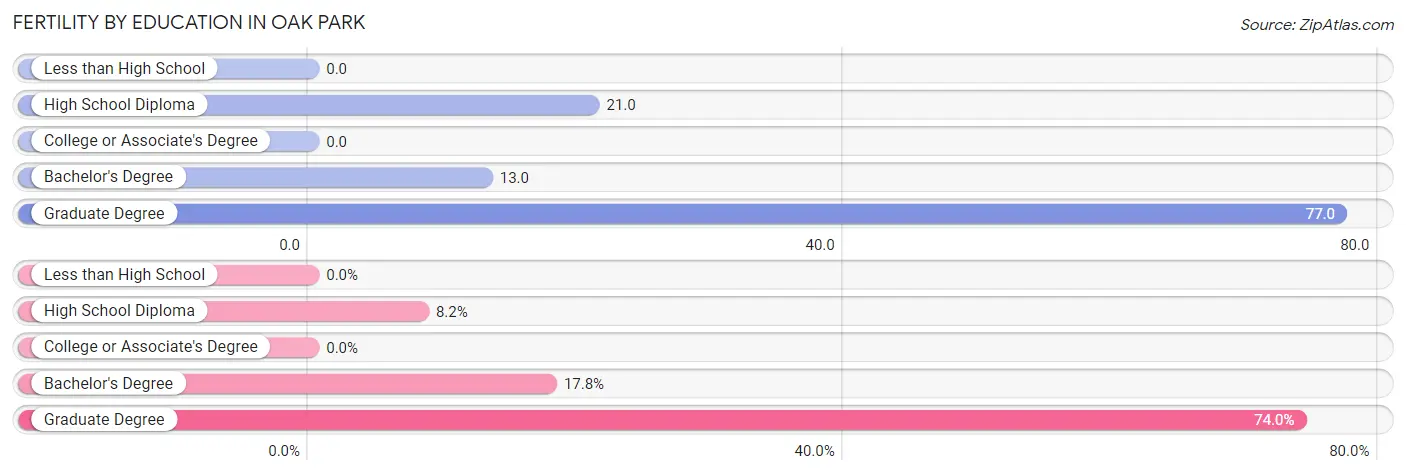
| Educational Attainment | Women with Births | Births / 1,000 Women |
| Less than High School | 0 (0.0%) | 0.0 |
| High School Diploma | 6 (8.2%) | 21.0 |
| College or Associate's Degree | 0 (0.0%) | 0.0 |
| Bachelor's Degree | 13 (17.8%) | 13.0 |
| Graduate Degree | 54 (74.0%) | 77.0 |
| Total | 73 (100.0%) | 24.0 |
Fertility by Education by Marriage Status in Oak Park
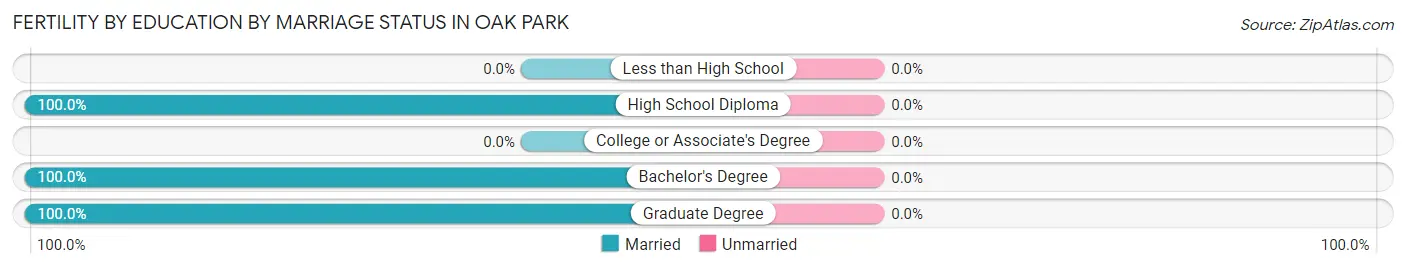
| Educational Attainment | Married | Unmarried |
| Less than High School | 0 (0.0%) | 0 (0.0%) |
| High School Diploma | 6 (100.0%) | 0 (0.0%) |
| College or Associate's Degree | 0 (0.0%) | 0 (0.0%) |
| Bachelor's Degree | 13 (100.0%) | 0 (0.0%) |
| Graduate Degree | 54 (100.0%) | 0 (0.0%) |
| Total | 73 (100.0%) | 0 (0.0%) |
Employment Characteristics in Oak Park
Employment by Class of Employer in Oak Park
Among the 6,243 employed individuals in Oak Park, private company employees (4,309 | 69.0%), self-employed (not incorporated) (520 | 8.3%), and self-employed (incorporated) (425 | 6.8%) make up the most common classes of employment.
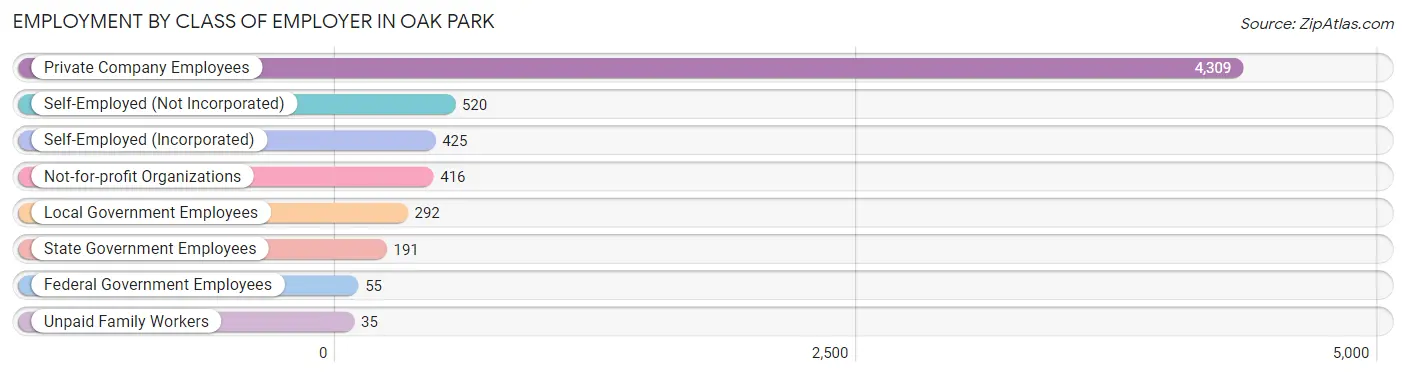
| Employer Class | # Employees | % Employees |
| Private Company Employees | 4,309 | 69.0% |
| Self-Employed (Incorporated) | 425 | 6.8% |
| Self-Employed (Not Incorporated) | 520 | 8.3% |
| Not-for-profit Organizations | 416 | 6.7% |
| Local Government Employees | 292 | 4.7% |
| State Government Employees | 191 | 3.1% |
| Federal Government Employees | 55 | 0.9% |
| Unpaid Family Workers | 35 | 0.6% |
| Total | 6,243 | 100.0% |
Employment Status by Age in Oak Park
According to the labor force statistics for Oak Park, out of the total population over 16 years of age (10,790), 61.4% or 6,625 individuals are in the labor force, with 5.3% or 351 of them unemployed. The age group with the highest labor force participation rate is 55 to 59 years, with 80.2% or 932 individuals in the labor force. Within the labor force, the 75 years and over age range has the highest percentage of unemployed individuals, with 26.5% or 13 of them being unemployed.
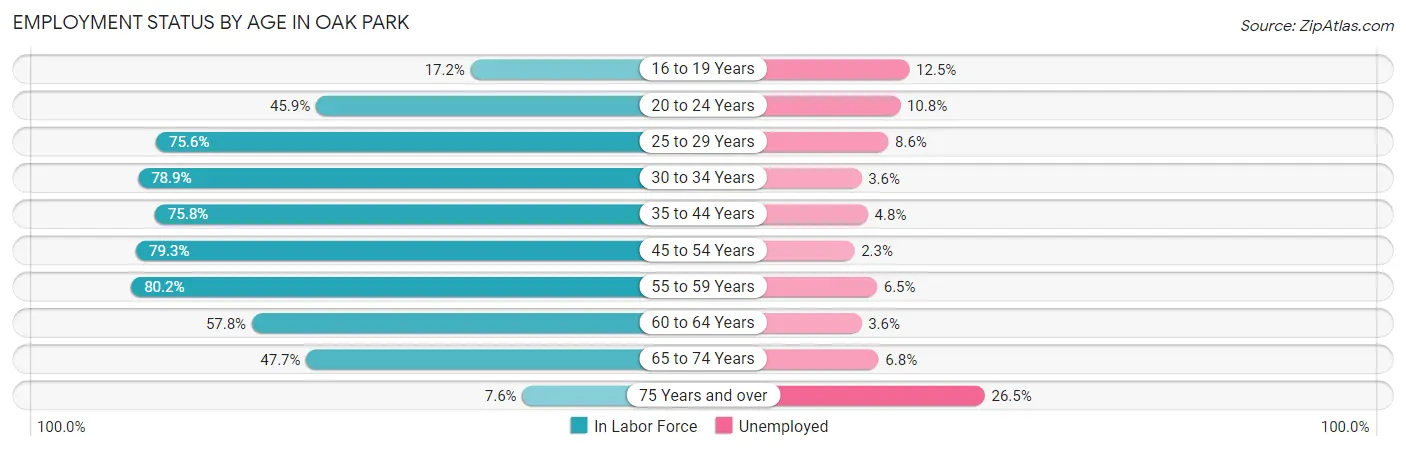
| Age Bracket | In Labor Force | Unemployed |
| 16 to 19 Years | 144 (17.2%) | 18 (12.5%) |
| 20 to 24 Years | 278 (45.9%) | 30 (10.8%) |
| 25 to 29 Years | 385 (75.6%) | 33 (8.6%) |
| 30 to 34 Years | 419 (78.9%) | 15 (3.6%) |
| 35 to 44 Years | 1,553 (75.8%) | 75 (4.8%) |
| 45 to 54 Years | 1,637 (79.3%) | 38 (2.3%) |
| 55 to 59 Years | 932 (80.2%) | 61 (6.5%) |
| 60 to 64 Years | 504 (57.8%) | 18 (3.6%) |
| 65 to 74 Years | 720 (47.7%) | 49 (6.8%) |
| 75 Years and over | 49 (7.6%) | 13 (26.5%) |
| Total | 6,625 (61.4%) | 351 (5.3%) |
Employment Status by Educational Attainment in Oak Park
According to labor force statistics for Oak Park, 75.6% of individuals (5,433) out of the total population between 25 and 64 years of age (7,187) are in the labor force, with 4.4% or 239 of them being unemployed. The group with the highest labor force participation rate are those with the educational attainment of bachelor's degree or higher, with 78.7% or 3,614 individuals in the labor force. Within the labor force, individuals with college / associate degree education have the highest percentage of unemployment, with 6.1% or 95 of them being unemployed.
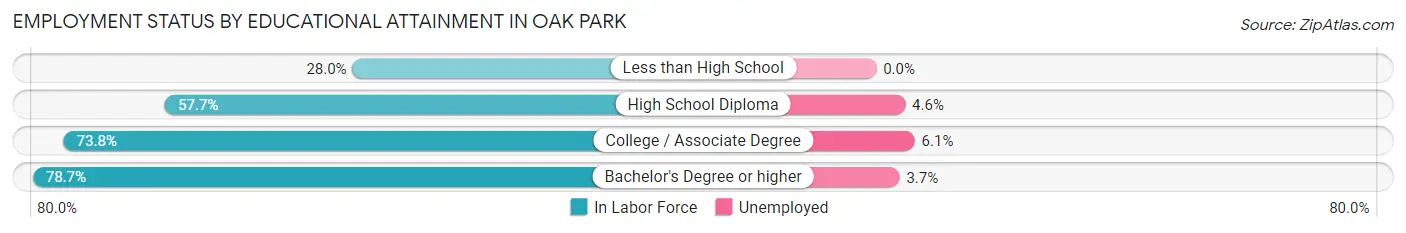
| Educational Attainment | In Labor Force | Unemployed |
| Less than High School | 21 (28.0%) | 0 (0.0%) |
| High School Diploma | 237 (57.7%) | 19 (4.6%) |
| College / Associate Degree | 1,556 (73.8%) | 129 (6.1%) |
| Bachelor's Degree or higher | 3,614 (78.7%) | 170 (3.7%) |
| Total | 5,433 (75.6%) | 316 (4.4%) |
Employment Occupations by Sex in Oak Park
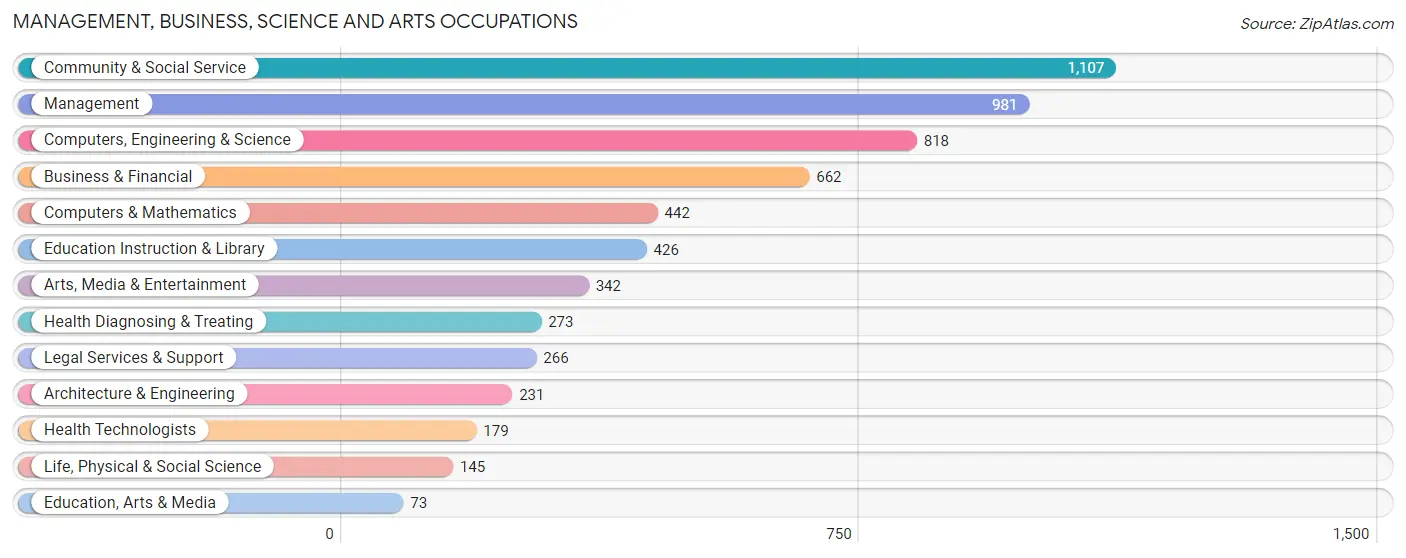
Management, Business, Science and Arts Occupations
The most common Management, Business, Science and Arts occupations in Oak Park are Community & Social Service (1,107 | 17.7%), Management (981 | 15.7%), Computers, Engineering & Science (818 | 13.1%), Business & Financial (662 | 10.6%), and Computers & Mathematics (442 | 7.1%).
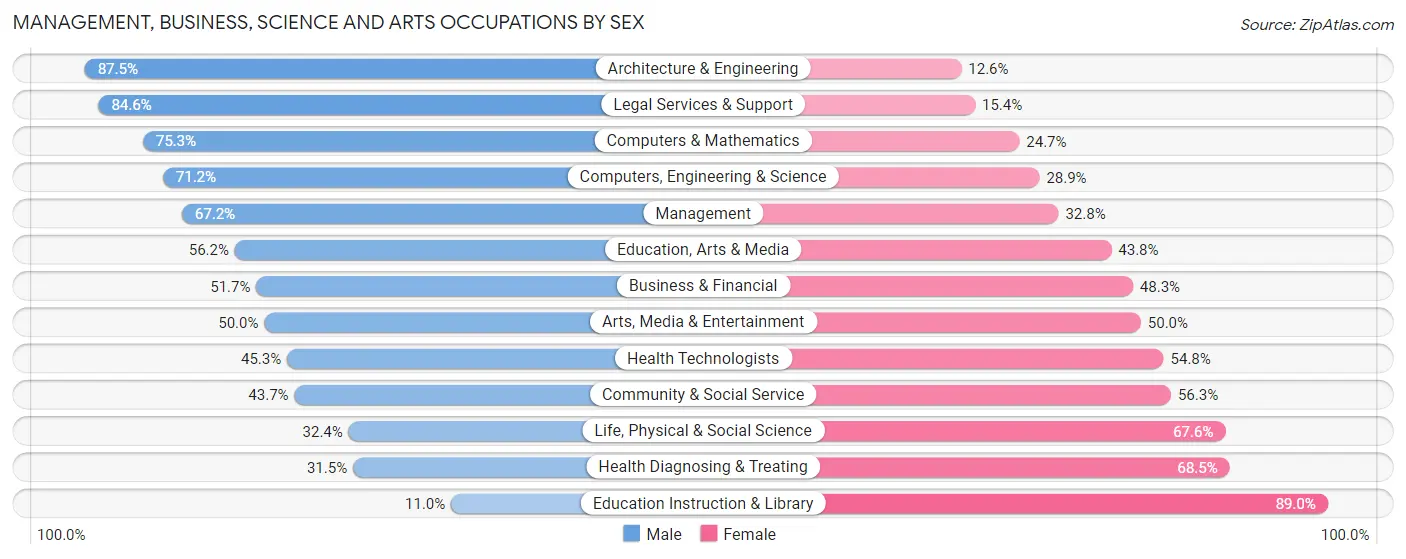
Management, Business, Science and Arts Occupations by Sex
Within the Management, Business, Science and Arts occupations in Oak Park, the most male-oriented occupations are Architecture & Engineering (87.5%), Legal Services & Support (84.6%), and Computers & Mathematics (75.3%), while the most female-oriented occupations are Education Instruction & Library (89.0%), Health Diagnosing & Treating (68.5%), and Life, Physical & Social Science (67.6%).
| Occupation | Male | Female |
| Management | 659 (67.2%) | 322 (32.8%) |
| Business & Financial | 342 (51.7%) | 320 (48.3%) |
| Computers, Engineering & Science | 582 (71.2%) | 236 (28.8%) |
| Computers & Mathematics | 333 (75.3%) | 109 (24.7%) |
| Architecture & Engineering | 202 (87.5%) | 29 (12.6%) |
| Life, Physical & Social Science | 47 (32.4%) | 98 (67.6%) |
| Community & Social Service | 484 (43.7%) | 623 (56.3%) |
| Education, Arts & Media | 41 (56.2%) | 32 (43.8%) |
| Legal Services & Support | 225 (84.6%) | 41 (15.4%) |
| Education Instruction & Library | 47 (11.0%) | 379 (89.0%) |
| Arts, Media & Entertainment | 171 (50.0%) | 171 (50.0%) |
| Health Diagnosing & Treating | 86 (31.5%) | 187 (68.5%) |
| Health Technologists | 81 (45.3%) | 98 (54.7%) |
| Total (Category) | 2,153 (56.0%) | 1,688 (44.0%) |
| Total (Overall) | 3,276 (52.3%) | 2,982 (47.6%) |
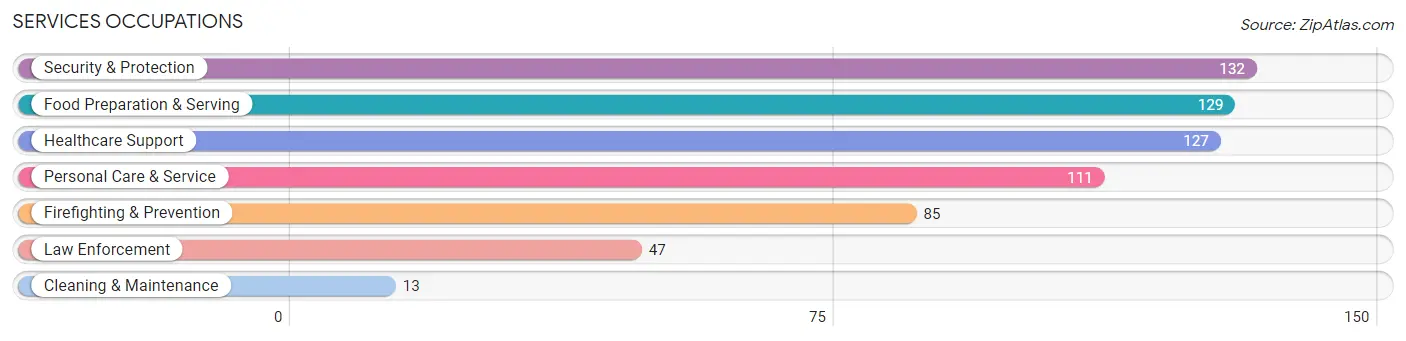
Services Occupations
The most common Services occupations in Oak Park are Security & Protection (132 | 2.1%), Food Preparation & Serving (129 | 2.1%), Healthcare Support (127 | 2.0%), Personal Care & Service (111 | 1.8%), and Firefighting & Prevention (85 | 1.4%).
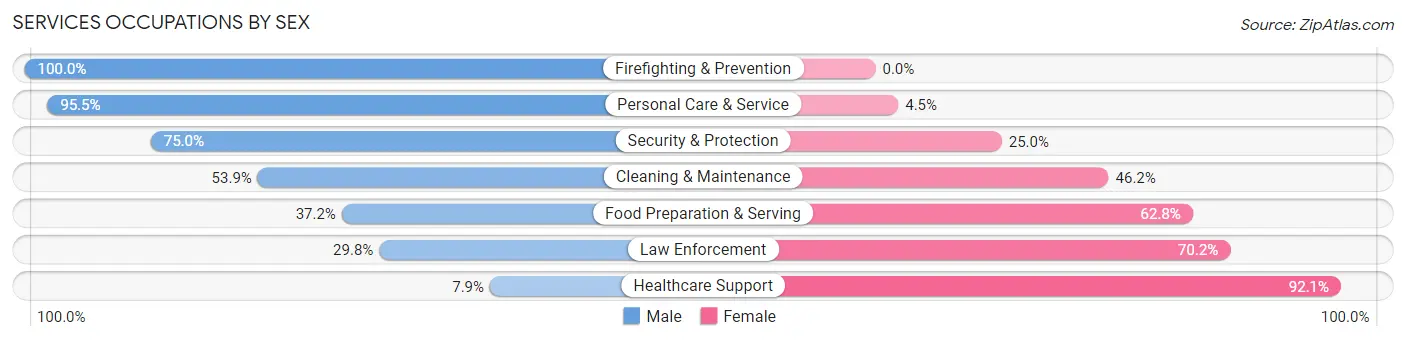
Services Occupations by Sex
Within the Services occupations in Oak Park, the most male-oriented occupations are Firefighting & Prevention (100.0%), Personal Care & Service (95.5%), and Security & Protection (75.0%), while the most female-oriented occupations are Healthcare Support (92.1%), Law Enforcement (70.2%), and Food Preparation & Serving (62.8%).
| Occupation | Male | Female |
| Healthcare Support | 10 (7.9%) | 117 (92.1%) |
| Security & Protection | 99 (75.0%) | 33 (25.0%) |
| Firefighting & Prevention | 85 (100.0%) | 0 (0.0%) |
| Law Enforcement | 14 (29.8%) | 33 (70.2%) |
| Food Preparation & Serving | 48 (37.2%) | 81 (62.8%) |
| Cleaning & Maintenance | 7 (53.8%) | 6 (46.2%) |
| Personal Care & Service | 106 (95.5%) | 5 (4.5%) |
| Total (Category) | 270 (52.7%) | 242 (47.3%) |
| Total (Overall) | 3,276 (52.3%) | 2,982 (47.6%) |
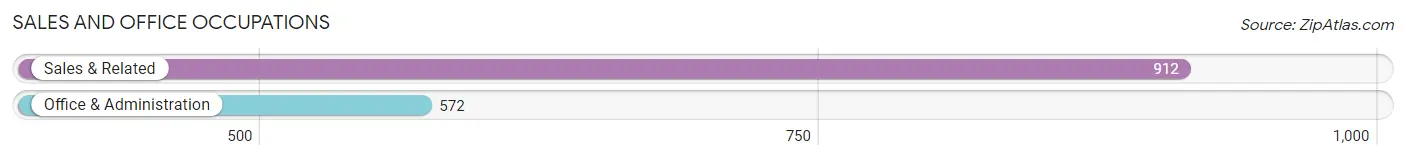
Sales and Office Occupations
The most common Sales and Office occupations in Oak Park are Sales & Related (912 | 14.6%), and Office & Administration (572 | 9.1%).
Sales and Office Occupations by Sex
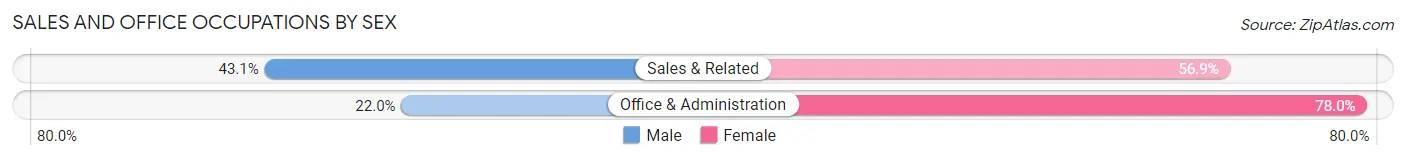
| Occupation | Male | Female |
| Sales & Related | 393 (43.1%) | 519 (56.9%) |
| Office & Administration | 126 (22.0%) | 446 (78.0%) |
| Total (Category) | 519 (35.0%) | 965 (65.0%) |
| Total (Overall) | 3,276 (52.3%) | 2,982 (47.6%) |
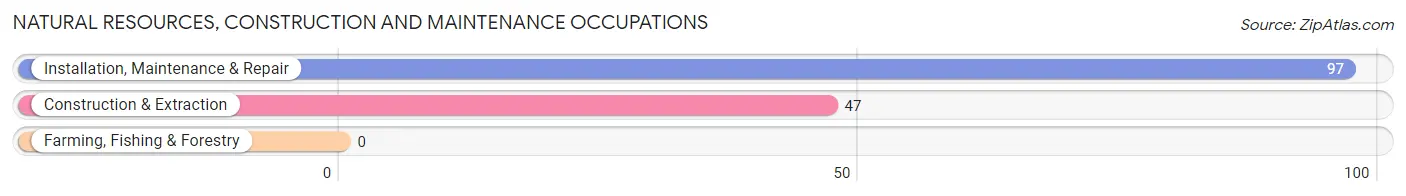
Natural Resources, Construction and Maintenance Occupations
The most common Natural Resources, Construction and Maintenance occupations in Oak Park are Installation, Maintenance & Repair (97 | 1.5%), and Construction & Extraction (47 | 0.7%).
Natural Resources, Construction and Maintenance Occupations by Sex
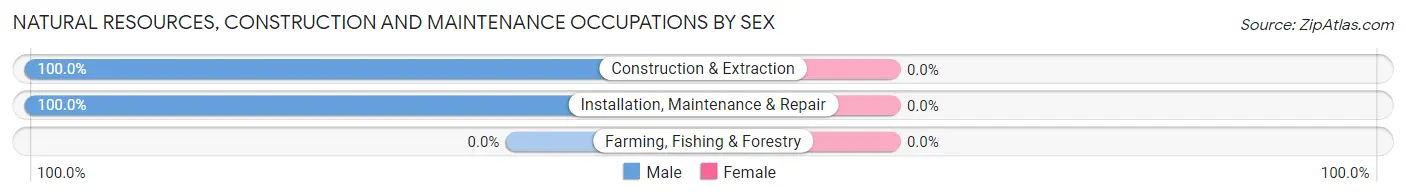
| Occupation | Male | Female |
| Farming, Fishing & Forestry | 0 (0.0%) | 0 (0.0%) |
| Construction & Extraction | 47 (100.0%) | 0 (0.0%) |
| Installation, Maintenance & Repair | 97 (100.0%) | 0 (0.0%) |
| Total (Category) | 144 (100.0%) | 0 (0.0%) |
| Total (Overall) | 3,276 (52.3%) | 2,982 (47.6%) |
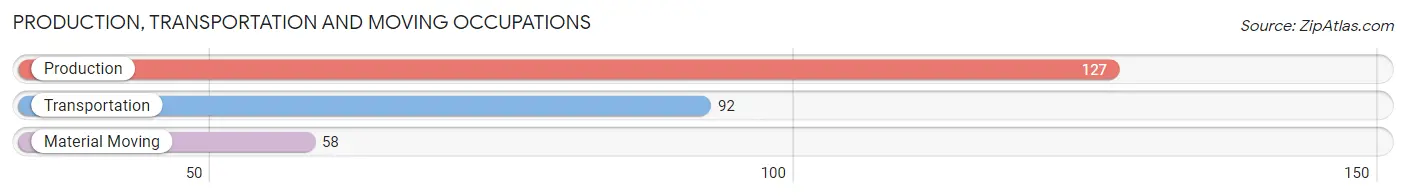
Production, Transportation and Moving Occupations
The most common Production, Transportation and Moving occupations in Oak Park are Production (127 | 2.0%), Transportation (92 | 1.5%), and Material Moving (58 | 0.9%).
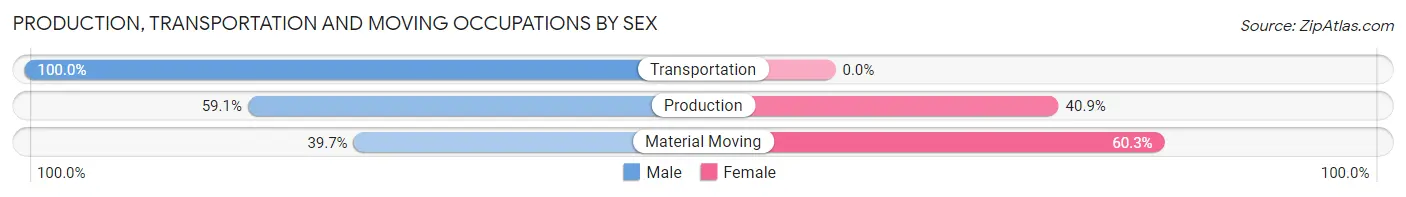
Production, Transportation and Moving Occupations by Sex
| Occupation | Male | Female |
| Production | 75 (59.1%) | 52 (40.9%) |
| Transportation | 92 (100.0%) | 0 (0.0%) |
| Material Moving | 23 (39.7%) | 35 (60.3%) |
| Total (Category) | 190 (68.6%) | 87 (31.4%) |
| Total (Overall) | 3,276 (52.3%) | 2,982 (47.6%) |
Employment Industries by Sex in Oak Park
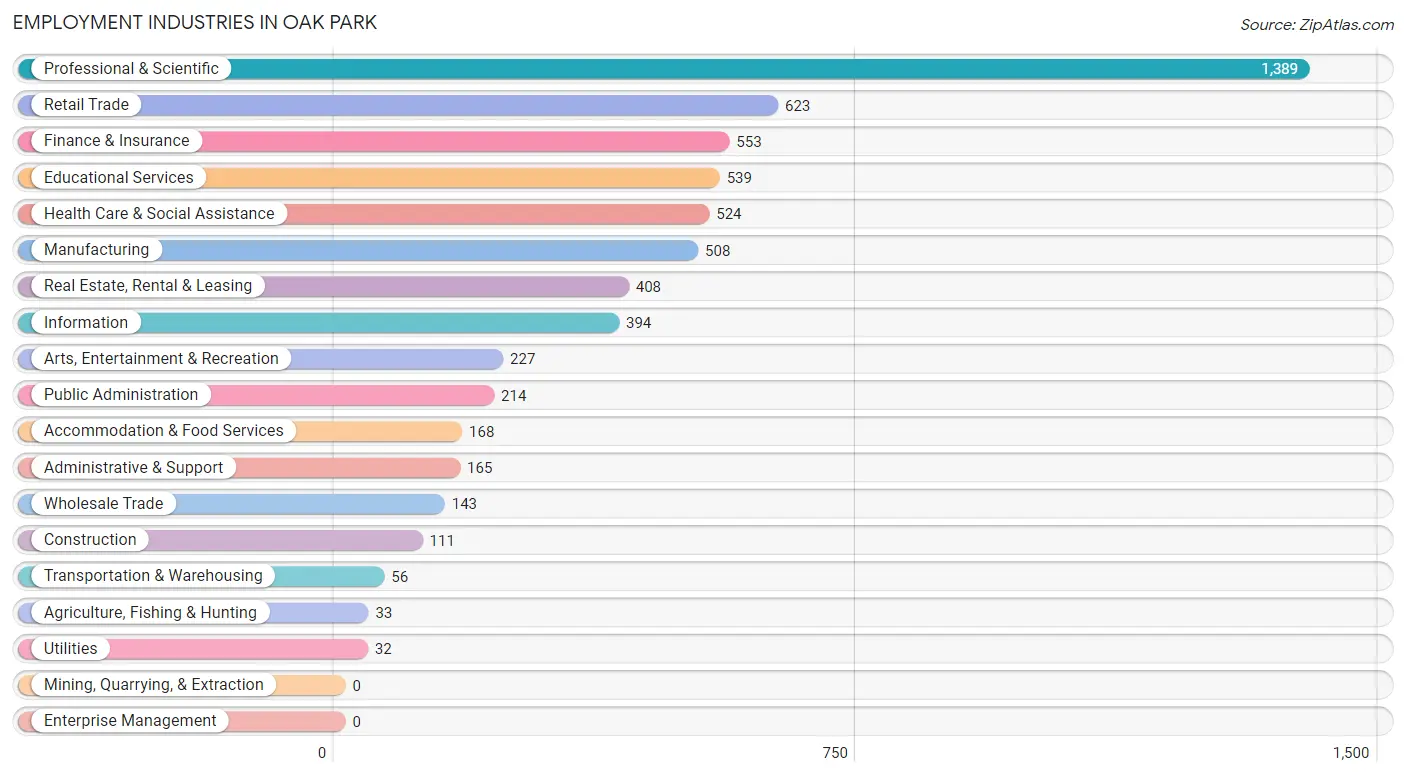
Employment Industries in Oak Park
The major employment industries in Oak Park include Professional & Scientific (1,389 | 22.2%), Retail Trade (623 | 10.0%), Finance & Insurance (553 | 8.8%), Educational Services (539 | 8.6%), and Health Care & Social Assistance (524 | 8.4%).
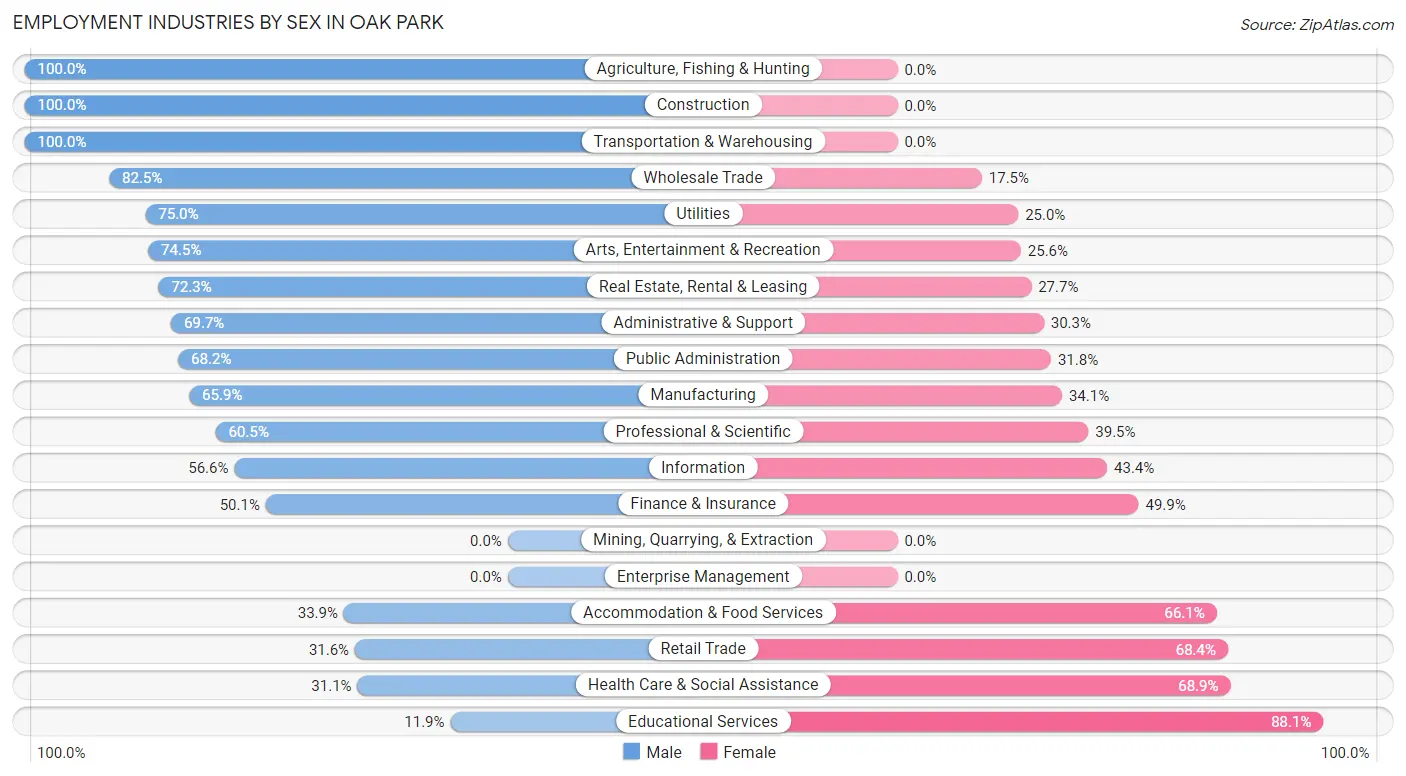
Employment Industries by Sex in Oak Park
The Oak Park industries that see more men than women are Agriculture, Fishing & Hunting (100.0%), Construction (100.0%), and Transportation & Warehousing (100.0%), whereas the industries that tend to have a higher number of women are Educational Services (88.1%), Health Care & Social Assistance (68.9%), and Retail Trade (68.4%).
| Industry | Male | Female |
| Agriculture, Fishing & Hunting | 33 (100.0%) | 0 (0.0%) |
| Mining, Quarrying, & Extraction | 0 (0.0%) | 0 (0.0%) |
| Construction | 111 (100.0%) | 0 (0.0%) |
| Manufacturing | 335 (65.9%) | 173 (34.1%) |
| Wholesale Trade | 118 (82.5%) | 25 (17.5%) |
| Retail Trade | 197 (31.6%) | 426 (68.4%) |
| Transportation & Warehousing | 56 (100.0%) | 0 (0.0%) |
| Utilities | 24 (75.0%) | 8 (25.0%) |
| Information | 223 (56.6%) | 171 (43.4%) |
| Finance & Insurance | 277 (50.1%) | 276 (49.9%) |
| Real Estate, Rental & Leasing | 295 (72.3%) | 113 (27.7%) |
| Professional & Scientific | 840 (60.5%) | 549 (39.5%) |
| Enterprise Management | 0 (0.0%) | 0 (0.0%) |
| Administrative & Support | 115 (69.7%) | 50 (30.3%) |
| Educational Services | 64 (11.9%) | 475 (88.1%) |
| Health Care & Social Assistance | 163 (31.1%) | 361 (68.9%) |
| Arts, Entertainment & Recreation | 169 (74.5%) | 58 (25.6%) |
| Accommodation & Food Services | 57 (33.9%) | 111 (66.1%) |
| Public Administration | 146 (68.2%) | 68 (31.8%) |
| Total | 3,276 (52.3%) | 2,982 (47.6%) |
Education in Oak Park
School Enrollment in Oak Park
The most common levels of schooling among the 3,556 students in Oak Park are high school (1,081 | 30.4%), middle school (763 | 21.5%), and college / undergraduate (619 | 17.4%).
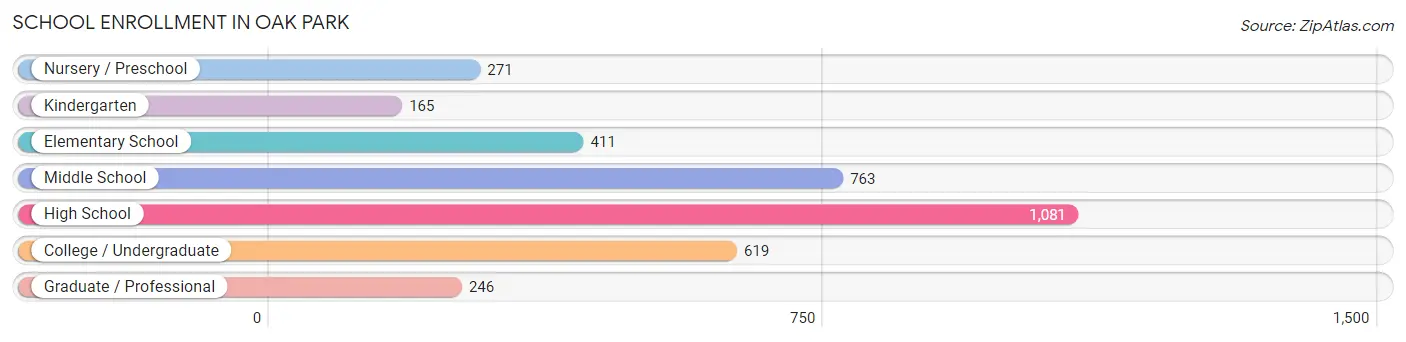
| School Level | # Students | % Students |
| Nursery / Preschool | 271 | 7.6% |
| Kindergarten | 165 | 4.6% |
| Elementary School | 411 | 11.6% |
| Middle School | 763 | 21.5% |
| High School | 1,081 | 30.4% |
| College / Undergraduate | 619 | 17.4% |
| Graduate / Professional | 246 | 6.9% |
| Total | 3,556 | 100.0% |
School Enrollment by Age by Funding Source in Oak Park
Out of a total of 3,556 students who are enrolled in schools in Oak Park, 935 (26.3%) attend a private institution, while the remaining 2,621 (73.7%) are enrolled in public schools. The age group of 3 to 4 year olds has the highest likelihood of being enrolled in private schools, with 132 (54.5% in the age bracket) enrolled. Conversely, the age group of 18 to 19 year olds has the lowest likelihood of being enrolled in a private school, with 203 (100.0% in the age bracket) attending a public institution.
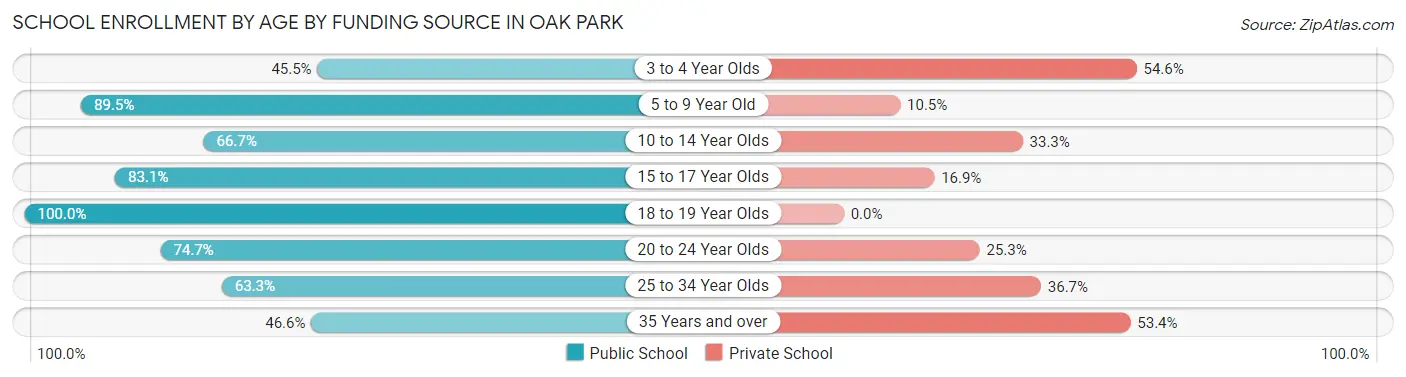
| Age Bracket | Public School | Private School |
| 3 to 4 Year Olds | 110 (45.5%) | 132 (54.5%) |
| 5 to 9 Year Old | 494 (89.5%) | 58 (10.5%) |
| 10 to 14 Year Olds | 666 (66.7%) | 333 (33.3%) |
| 15 to 17 Year Olds | 631 (83.1%) | 128 (16.9%) |
| 18 to 19 Year Olds | 203 (100.0%) | 0 (0.0%) |
| 20 to 24 Year Olds | 298 (74.7%) | 101 (25.3%) |
| 25 to 34 Year Olds | 124 (63.3%) | 72 (36.7%) |
| 35 Years and over | 96 (46.6%) | 110 (53.4%) |
| Total | 2,621 (73.7%) | 935 (26.3%) |
Educational Attainment by Field of Study in Oak Park
Business (1,345 | 22.4%), engineering (684 | 11.4%), social sciences (542 | 9.0%), computers & mathematics (491 | 8.2%), and communications (470 | 7.8%) are the most common fields of study among 6,017 individuals in Oak Park who have obtained a bachelor's degree or higher.
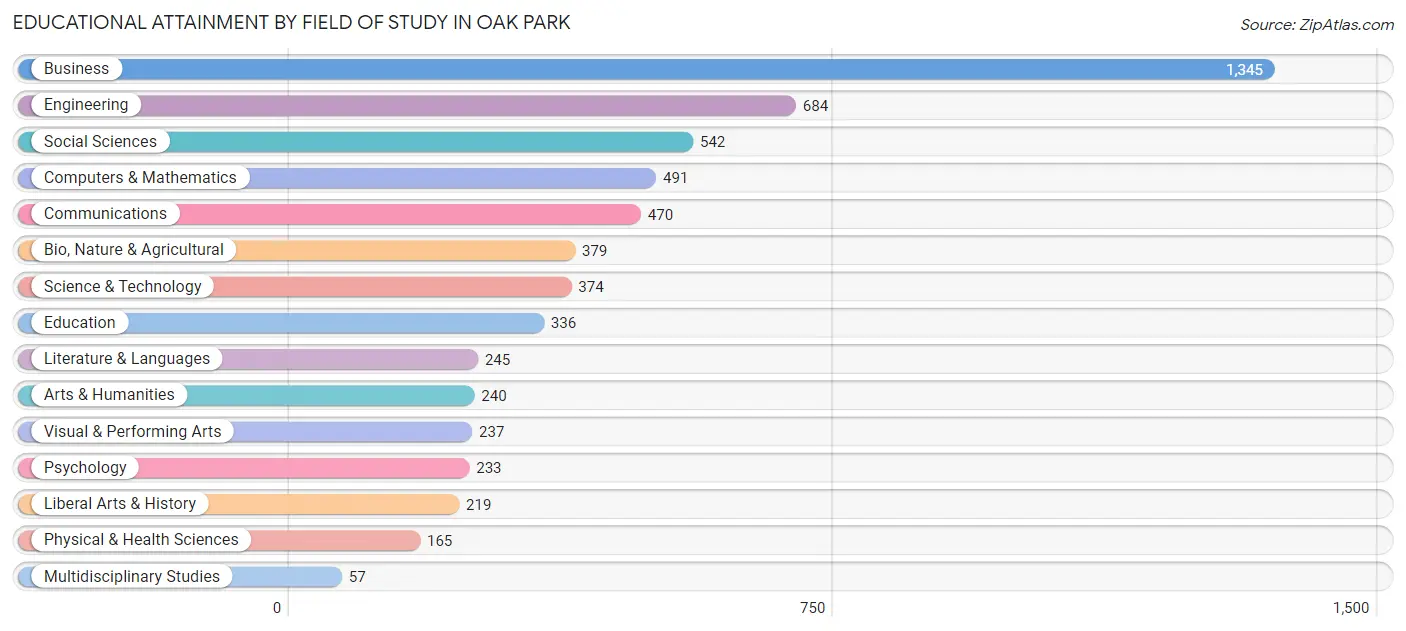
| Field of Study | # Graduates | % Graduates |
| Computers & Mathematics | 491 | 8.2% |
| Bio, Nature & Agricultural | 379 | 6.3% |
| Physical & Health Sciences | 165 | 2.7% |
| Psychology | 233 | 3.9% |
| Social Sciences | 542 | 9.0% |
| Engineering | 684 | 11.4% |
| Multidisciplinary Studies | 57 | 0.9% |
| Science & Technology | 374 | 6.2% |
| Business | 1,345 | 22.4% |
| Education | 336 | 5.6% |
| Literature & Languages | 245 | 4.1% |
| Liberal Arts & History | 219 | 3.6% |
| Visual & Performing Arts | 237 | 3.9% |
| Communications | 470 | 7.8% |
| Arts & Humanities | 240 | 4.0% |
| Total | 6,017 | 100.0% |
Transportation & Commute in Oak Park
Vehicle Availability by Sex in Oak Park
The most prevalent vehicle ownership categories in Oak Park are males with 2 vehicles (1,680, accounting for 51.1%) and females with 2 vehicles (1,375, making up 56.9%).
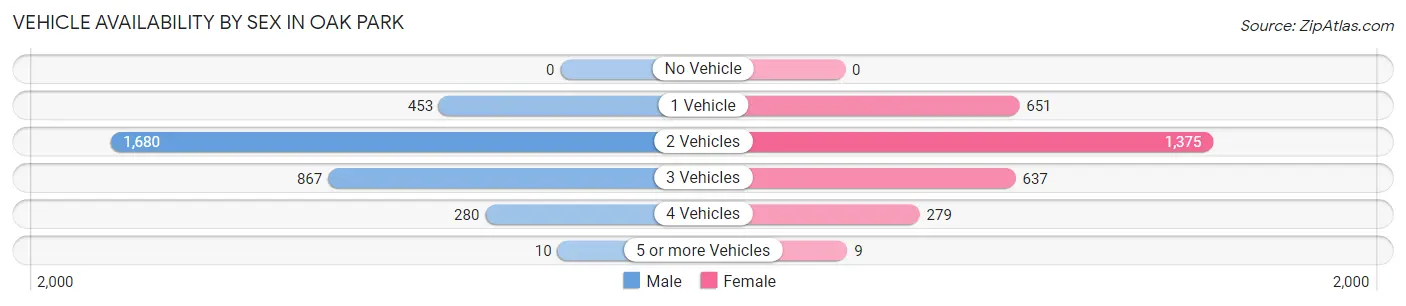
| Vehicles Available | Male | Female |
| No Vehicle | 0 (0.0%) | 0 (0.0%) |
| 1 Vehicle | 453 (13.8%) | 651 (22.1%) |
| 2 Vehicles | 1,680 (51.1%) | 1,375 (46.6%) |
| 3 Vehicles | 867 (26.4%) | 637 (21.6%) |
| 4 Vehicles | 280 (8.5%) | 279 (9.5%) |
| 5 or more Vehicles | 10 (0.3%) | 9 (0.3%) |
| Total | 3,290 (100.0%) | 2,951 (100.0%) |
Commute Time in Oak Park
The most frequently occuring commute durations in Oak Park are 60 to 89 minutes (913 commuters, 19.6%), 20 to 24 minutes (699 commuters, 15.0%), and 10 to 14 minutes (562 commuters, 12.0%).
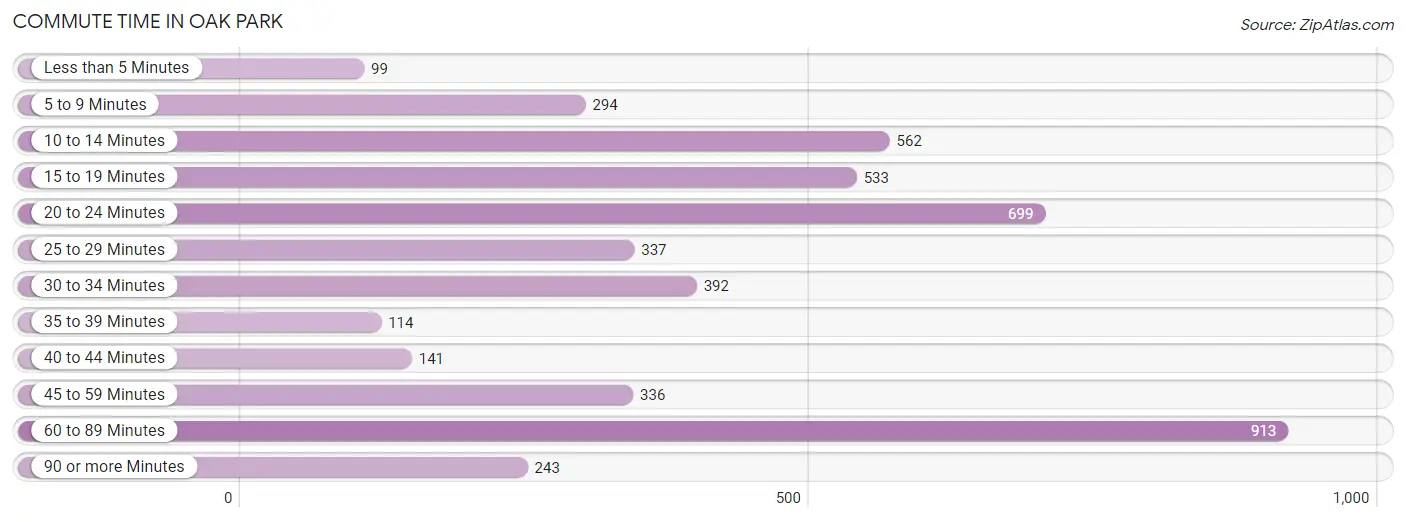
| Commute Time | # Commuters | % Commuters |
| Less than 5 Minutes | 99 | 2.1% |
| 5 to 9 Minutes | 294 | 6.3% |
| 10 to 14 Minutes | 562 | 12.0% |
| 15 to 19 Minutes | 533 | 11.4% |
| 20 to 24 Minutes | 699 | 15.0% |
| 25 to 29 Minutes | 337 | 7.2% |
| 30 to 34 Minutes | 392 | 8.4% |
| 35 to 39 Minutes | 114 | 2.4% |
| 40 to 44 Minutes | 141 | 3.0% |
| 45 to 59 Minutes | 336 | 7.2% |
| 60 to 89 Minutes | 913 | 19.6% |
| 90 or more Minutes | 243 | 5.2% |
Commute Time by Sex in Oak Park
The most common commute times in Oak Park are 60 to 89 minutes (612 commuters, 24.4%) for males and 20 to 24 minutes (479 commuters, 22.2%) for females.
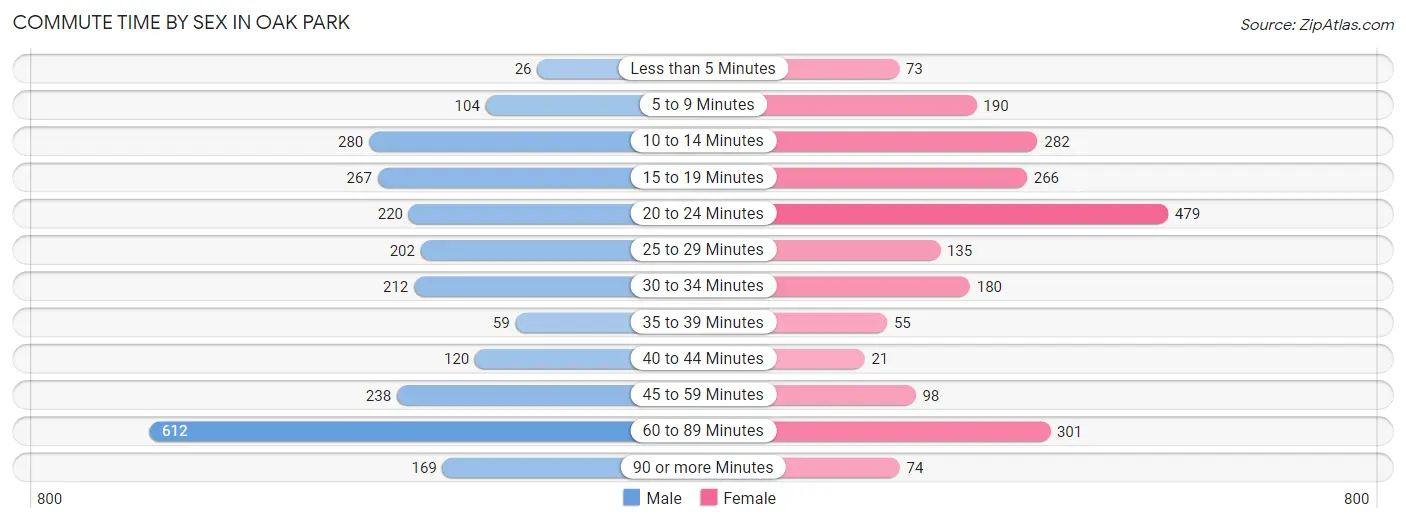
| Commute Time | Male | Female |
| Less than 5 Minutes | 26 (1.0%) | 73 (3.4%) |
| 5 to 9 Minutes | 104 (4.2%) | 190 (8.8%) |
| 10 to 14 Minutes | 280 (11.2%) | 282 (13.1%) |
| 15 to 19 Minutes | 267 (10.6%) | 266 (12.3%) |
| 20 to 24 Minutes | 220 (8.8%) | 479 (22.2%) |
| 25 to 29 Minutes | 202 (8.1%) | 135 (6.3%) |
| 30 to 34 Minutes | 212 (8.5%) | 180 (8.4%) |
| 35 to 39 Minutes | 59 (2.4%) | 55 (2.5%) |
| 40 to 44 Minutes | 120 (4.8%) | 21 (1.0%) |
| 45 to 59 Minutes | 238 (9.5%) | 98 (4.5%) |
| 60 to 89 Minutes | 612 (24.4%) | 301 (14.0%) |
| 90 or more Minutes | 169 (6.7%) | 74 (3.4%) |
Time of Departure to Work by Sex in Oak Park
The most frequent times of departure to work in Oak Park are 8:00 AM to 8:29 AM (556, 22.2%) for males and 7:00 AM to 7:29 AM (440, 20.4%) for females.
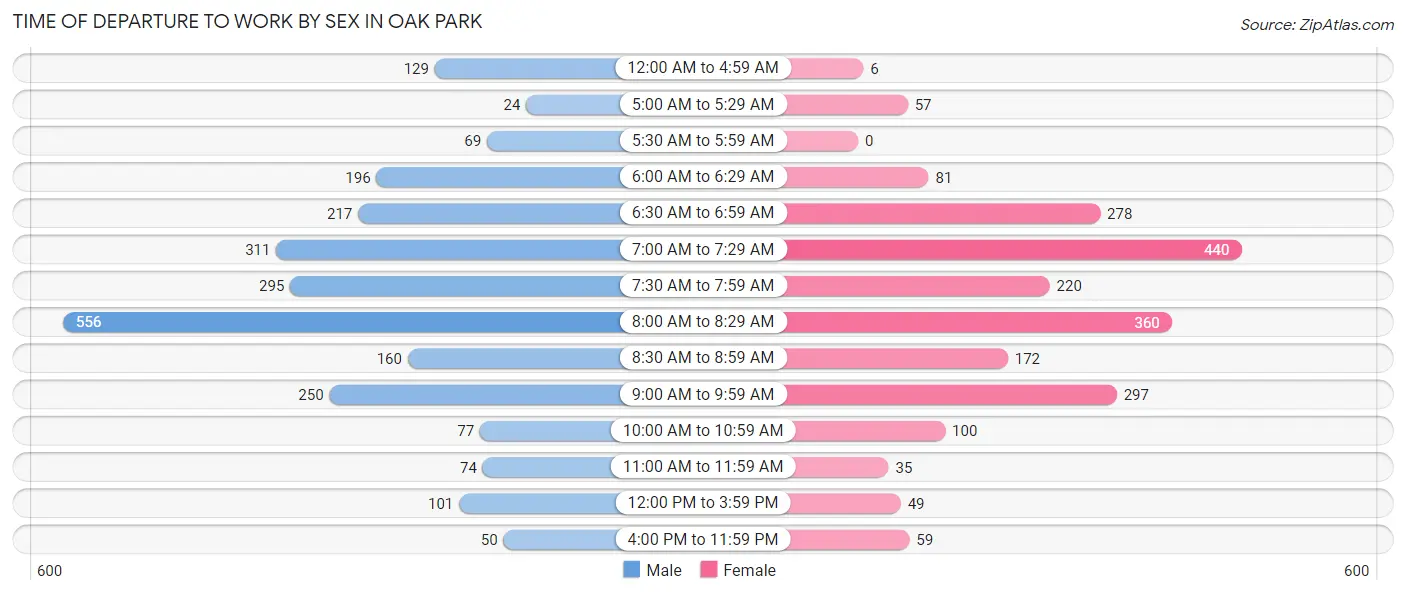
| Time of Departure | Male | Female |
| 12:00 AM to 4:59 AM | 129 (5.1%) | 6 (0.3%) |
| 5:00 AM to 5:29 AM | 24 (1.0%) | 57 (2.6%) |
| 5:30 AM to 5:59 AM | 69 (2.8%) | 0 (0.0%) |
| 6:00 AM to 6:29 AM | 196 (7.8%) | 81 (3.8%) |
| 6:30 AM to 6:59 AM | 217 (8.6%) | 278 (12.9%) |
| 7:00 AM to 7:29 AM | 311 (12.4%) | 440 (20.4%) |
| 7:30 AM to 7:59 AM | 295 (11.8%) | 220 (10.2%) |
| 8:00 AM to 8:29 AM | 556 (22.2%) | 360 (16.7%) |
| 8:30 AM to 8:59 AM | 160 (6.4%) | 172 (8.0%) |
| 9:00 AM to 9:59 AM | 250 (10.0%) | 297 (13.8%) |
| 10:00 AM to 10:59 AM | 77 (3.1%) | 100 (4.6%) |
| 11:00 AM to 11:59 AM | 74 (2.9%) | 35 (1.6%) |
| 12:00 PM to 3:59 PM | 101 (4.0%) | 49 (2.3%) |
| 4:00 PM to 11:59 PM | 50 (2.0%) | 59 (2.7%) |
| Total | 2,509 (100.0%) | 2,154 (100.0%) |
Housing Occupancy in Oak Park
Occupancy by Ownership in Oak Park
Of the total 5,015 dwellings in Oak Park, owner-occupied units account for 3,577 (71.3%), while renter-occupied units make up 1,438 (28.7%).
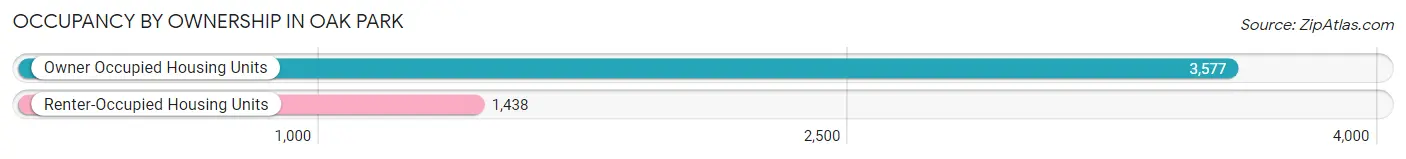
| Occupancy | # Housing Units | % Housing Units |
| Owner Occupied Housing Units | 3,577 | 71.3% |
| Renter-Occupied Housing Units | 1,438 | 28.7% |
| Total Occupied Housing Units | 5,015 | 100.0% |
Occupancy by Household Size in Oak Park
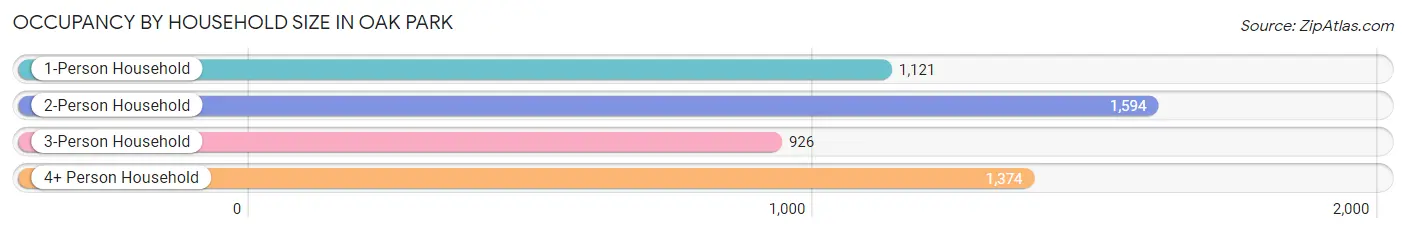
| Household Size | # Housing Units | % Housing Units |
| 1-Person Household | 1,121 | 22.4% |
| 2-Person Household | 1,594 | 31.8% |
| 3-Person Household | 926 | 18.5% |
| 4+ Person Household | 1,374 | 27.4% |
| Total Housing Units | 5,015 | 100.0% |
Occupancy by Ownership by Household Size in Oak Park
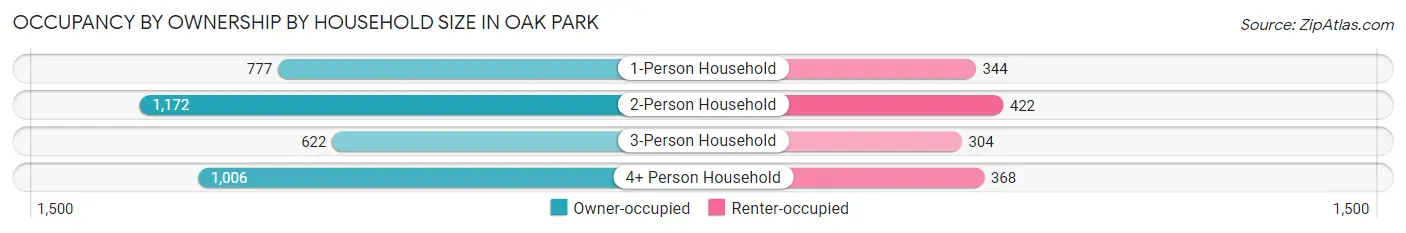
| Household Size | Owner-occupied | Renter-occupied |
| 1-Person Household | 777 (69.3%) | 344 (30.7%) |
| 2-Person Household | 1,172 (73.5%) | 422 (26.5%) |
| 3-Person Household | 622 (67.2%) | 304 (32.8%) |
| 4+ Person Household | 1,006 (73.2%) | 368 (26.8%) |
| Total Housing Units | 3,577 (71.3%) | 1,438 (28.7%) |
Occupancy by Educational Attainment in Oak Park
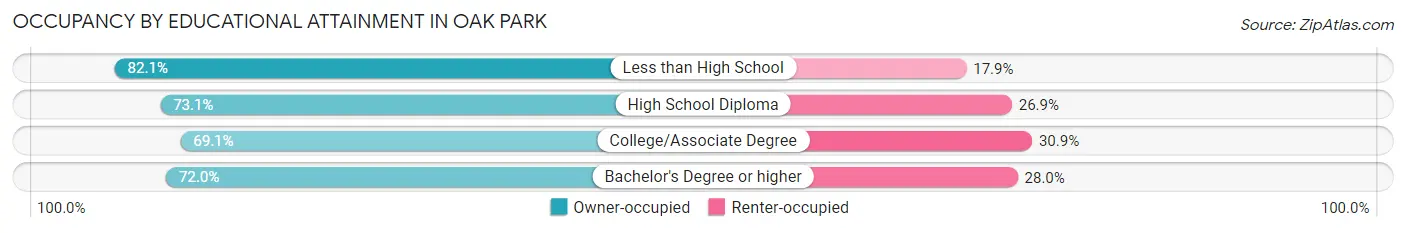
| Household Size | Owner-occupied | Renter-occupied |
| Less than High School | 23 (82.1%) | 5 (17.9%) |
| High School Diploma | 280 (73.1%) | 103 (26.9%) |
| College/Associate Degree | 951 (69.1%) | 425 (30.9%) |
| Bachelor's Degree or higher | 2,323 (72.0%) | 905 (28.0%) |
Occupancy by Age of Householder in Oak Park
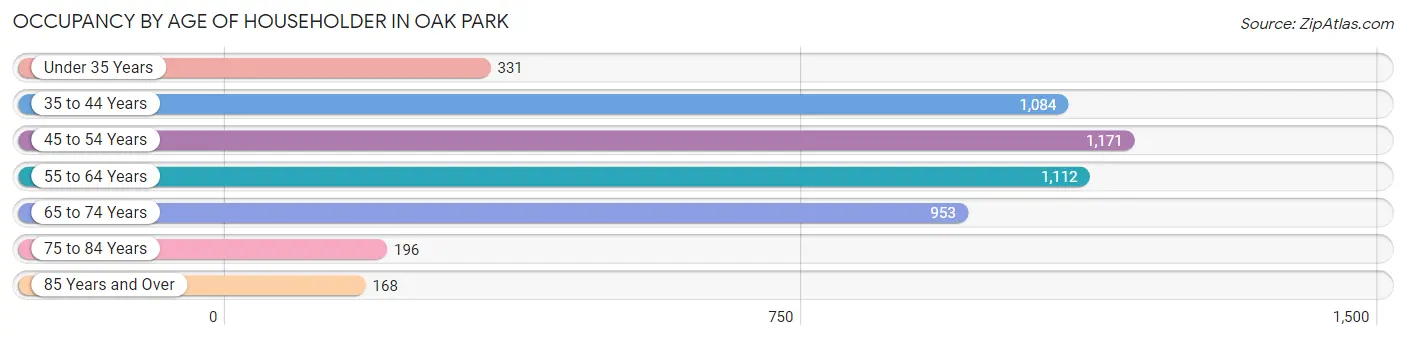
| Age Bracket | # Households | % Households |
| Under 35 Years | 331 | 6.6% |
| 35 to 44 Years | 1,084 | 21.6% |
| 45 to 54 Years | 1,171 | 23.4% |
| 55 to 64 Years | 1,112 | 22.2% |
| 65 to 74 Years | 953 | 19.0% |
| 75 to 84 Years | 196 | 3.9% |
| 85 Years and Over | 168 | 3.4% |
| Total | 5,015 | 100.0% |
Housing Finances in Oak Park
Median Income by Occupancy in Oak Park
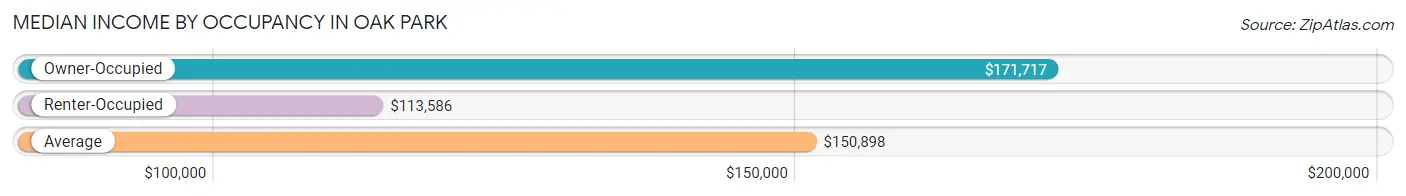
| Occupancy Type | # Households | Median Income |
| Owner-Occupied | 3,577 (71.3%) | $171,717 |
| Renter-Occupied | 1,438 (28.7%) | $113,586 |
| Average | 5,015 (100.0%) | $150,898 |
Occupancy by Householder Income Bracket in Oak Park
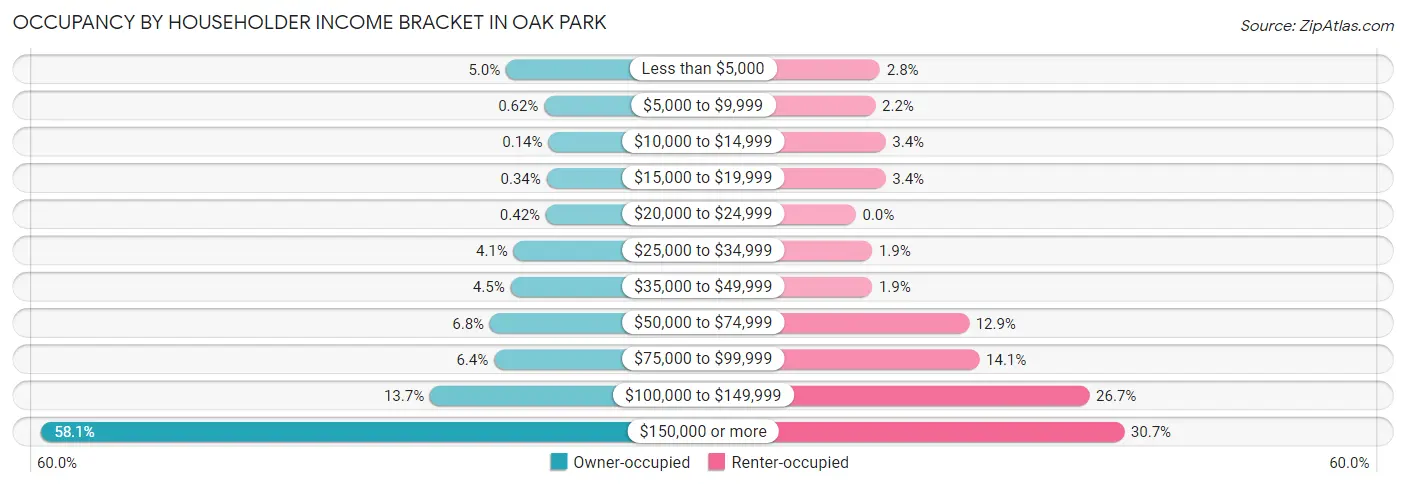
| Income Bracket | Owner-occupied | Renter-occupied |
| Less than $5,000 | 178 (5.0%) | 40 (2.8%) |
| $5,000 to $9,999 | 22 (0.6%) | 32 (2.2%) |
| $10,000 to $14,999 | 5 (0.1%) | 49 (3.4%) |
| $15,000 to $19,999 | 12 (0.3%) | 49 (3.4%) |
| $20,000 to $24,999 | 15 (0.4%) | 0 (0.0%) |
| $25,000 to $34,999 | 147 (4.1%) | 27 (1.9%) |
| $35,000 to $49,999 | 160 (4.5%) | 27 (1.9%) |
| $50,000 to $74,999 | 244 (6.8%) | 186 (12.9%) |
| $75,000 to $99,999 | 227 (6.4%) | 203 (14.1%) |
| $100,000 to $149,999 | 489 (13.7%) | 384 (26.7%) |
| $150,000 or more | 2,078 (58.1%) | 441 (30.7%) |
| Total | 3,577 (100.0%) | 1,438 (100.0%) |
Monthly Housing Cost Tiers in Oak Park
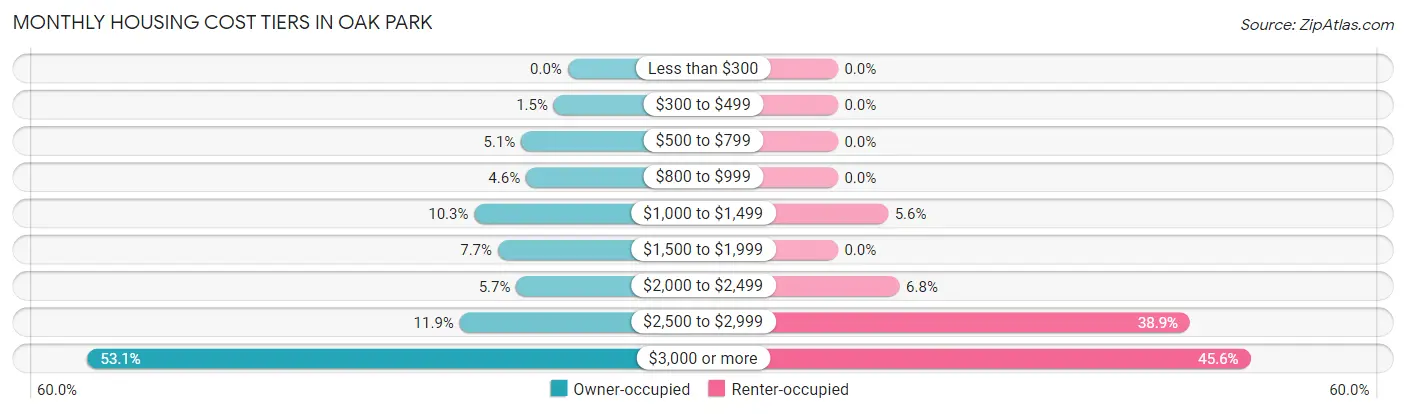
| Monthly Cost | Owner-occupied | Renter-occupied |
| Less than $300 | 0 (0.0%) | 0 (0.0%) |
| $300 to $499 | 55 (1.5%) | 0 (0.0%) |
| $500 to $799 | 184 (5.1%) | 0 (0.0%) |
| $800 to $999 | 165 (4.6%) | 0 (0.0%) |
| $1,000 to $1,499 | 369 (10.3%) | 80 (5.6%) |
| $1,500 to $1,999 | 276 (7.7%) | 0 (0.0%) |
| $2,000 to $2,499 | 203 (5.7%) | 98 (6.8%) |
| $2,500 to $2,999 | 427 (11.9%) | 560 (38.9%) |
| $3,000 or more | 1,898 (53.1%) | 656 (45.6%) |
| Total | 3,577 (100.0%) | 1,438 (100.0%) |
Physical Housing Characteristics in Oak Park
Housing Structures in Oak Park
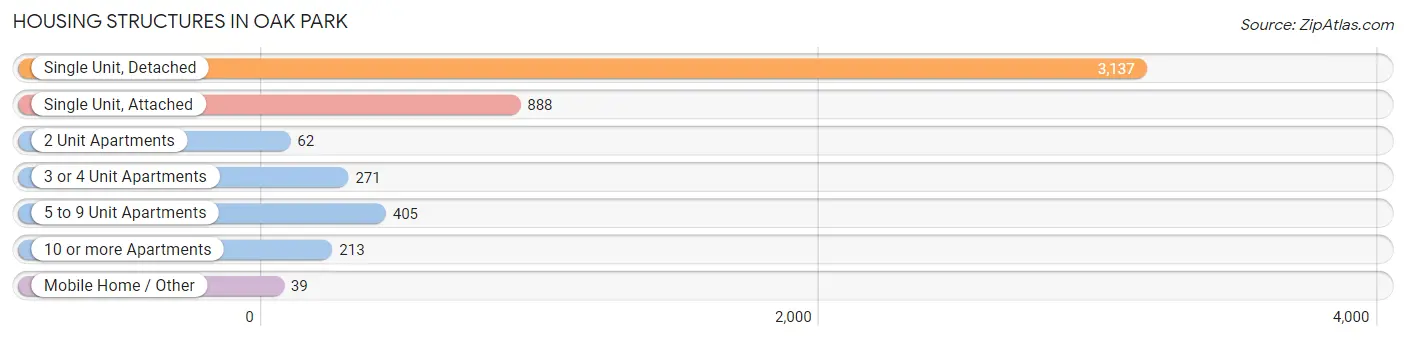
| Structure Type | # Housing Units | % Housing Units |
| Single Unit, Detached | 3,137 | 62.5% |
| Single Unit, Attached | 888 | 17.7% |
| 2 Unit Apartments | 62 | 1.2% |
| 3 or 4 Unit Apartments | 271 | 5.4% |
| 5 to 9 Unit Apartments | 405 | 8.1% |
| 10 or more Apartments | 213 | 4.3% |
| Mobile Home / Other | 39 | 0.8% |
| Total | 5,015 | 100.0% |
Housing Structures by Occupancy in Oak Park
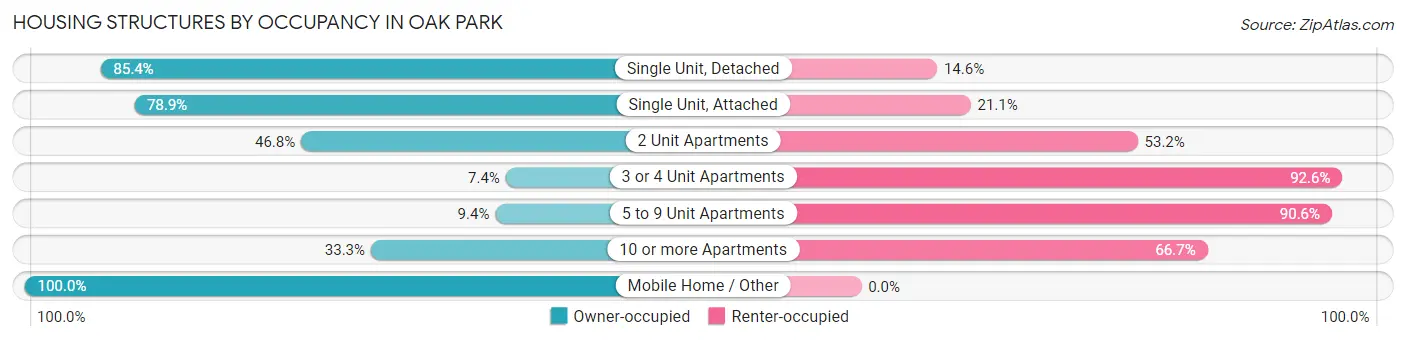
| Structure Type | Owner-occupied | Renter-occupied |
| Single Unit, Detached | 2,679 (85.4%) | 458 (14.6%) |
| Single Unit, Attached | 701 (78.9%) | 187 (21.1%) |
| 2 Unit Apartments | 29 (46.8%) | 33 (53.2%) |
| 3 or 4 Unit Apartments | 20 (7.4%) | 251 (92.6%) |
| 5 to 9 Unit Apartments | 38 (9.4%) | 367 (90.6%) |
| 10 or more Apartments | 71 (33.3%) | 142 (66.7%) |
| Mobile Home / Other | 39 (100.0%) | 0 (0.0%) |
| Total | 3,577 (71.3%) | 1,438 (28.7%) |
Housing Structures by Number of Rooms in Oak Park
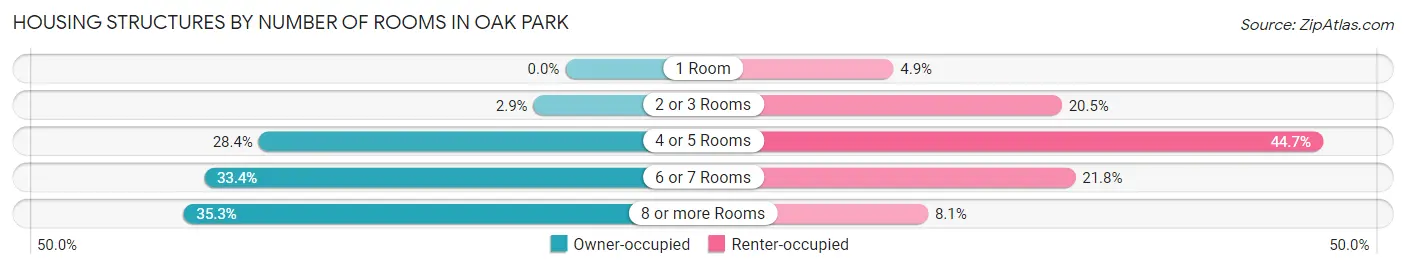
| Number of Rooms | Owner-occupied | Renter-occupied |
| 1 Room | 0 (0.0%) | 71 (4.9%) |
| 2 or 3 Rooms | 105 (2.9%) | 295 (20.5%) |
| 4 or 5 Rooms | 1,014 (28.3%) | 642 (44.7%) |
| 6 or 7 Rooms | 1,195 (33.4%) | 313 (21.8%) |
| 8 or more Rooms | 1,263 (35.3%) | 117 (8.1%) |
| Total | 3,577 (100.0%) | 1,438 (100.0%) |
Housing Structure by Heating Type in Oak Park
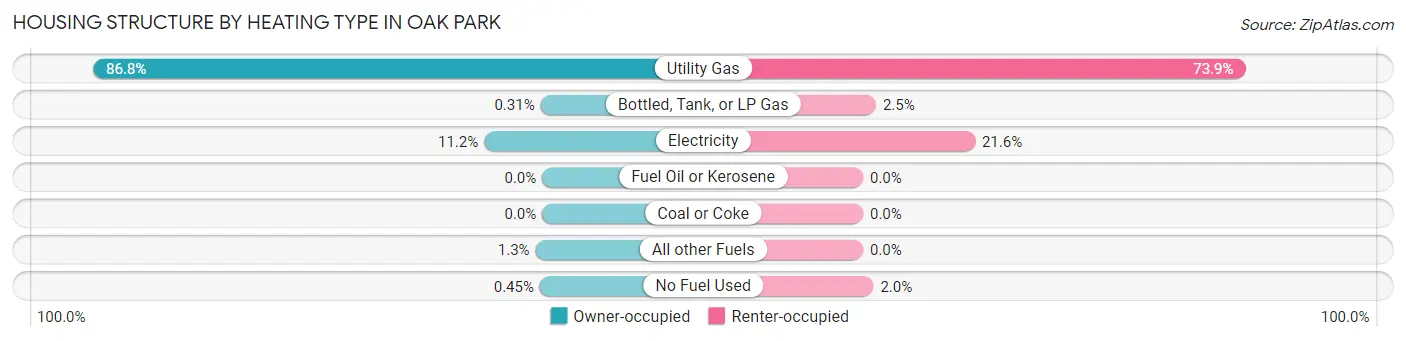
| Heating Type | Owner-occupied | Renter-occupied |
| Utility Gas | 3,103 (86.8%) | 1,062 (73.9%) |
| Bottled, Tank, or LP Gas | 11 (0.3%) | 36 (2.5%) |
| Electricity | 401 (11.2%) | 311 (21.6%) |
| Fuel Oil or Kerosene | 0 (0.0%) | 0 (0.0%) |
| Coal or Coke | 0 (0.0%) | 0 (0.0%) |
| All other Fuels | 46 (1.3%) | 0 (0.0%) |
| No Fuel Used | 16 (0.4%) | 29 (2.0%) |
| Total | 3,577 (100.0%) | 1,438 (100.0%) |
Household Vehicle Usage in Oak Park
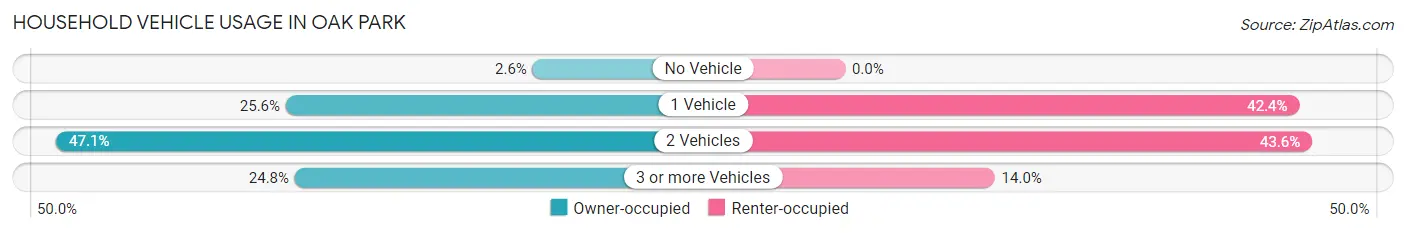
| Vehicles per Household | Owner-occupied | Renter-occupied |
| No Vehicle | 92 (2.6%) | 0 (0.0%) |
| 1 Vehicle | 916 (25.6%) | 610 (42.4%) |
| 2 Vehicles | 1,683 (47.0%) | 627 (43.6%) |
| 3 or more Vehicles | 886 (24.8%) | 201 (14.0%) |
| Total | 3,577 (100.0%) | 1,438 (100.0%) |
Real Estate & Mortgages in Oak Park
Real Estate and Mortgage Overview in Oak Park
| Characteristic | Without Mortgage | With Mortgage |
| Housing Units | 865 | 2,712 |
| Median Property Value | $902,800 | $932,900 |
| Median Household Income | $102,358 | $1,764 |
| Monthly Housing Costs | $1,107 | $1,888 |
| Real Estate Taxes | $6,653 | $0 |
Property Value by Mortgage Status in Oak Park
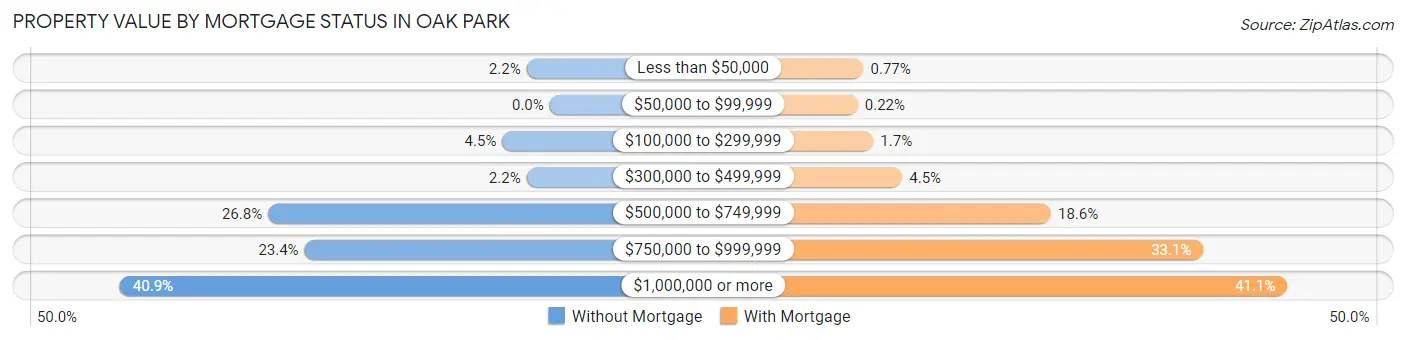
| Property Value | Without Mortgage | With Mortgage |
| Less than $50,000 | 19 (2.2%) | 21 (0.8%) |
| $50,000 to $99,999 | 0 (0.0%) | 6 (0.2%) |
| $100,000 to $299,999 | 39 (4.5%) | 46 (1.7%) |
| $300,000 to $499,999 | 19 (2.2%) | 121 (4.5%) |
| $500,000 to $749,999 | 232 (26.8%) | 505 (18.6%) |
| $750,000 to $999,999 | 202 (23.4%) | 898 (33.1%) |
| $1,000,000 or more | 354 (40.9%) | 1,115 (41.1%) |
| Total | 865 (100.0%) | 2,712 (100.0%) |
Household Income by Mortgage Status in Oak Park
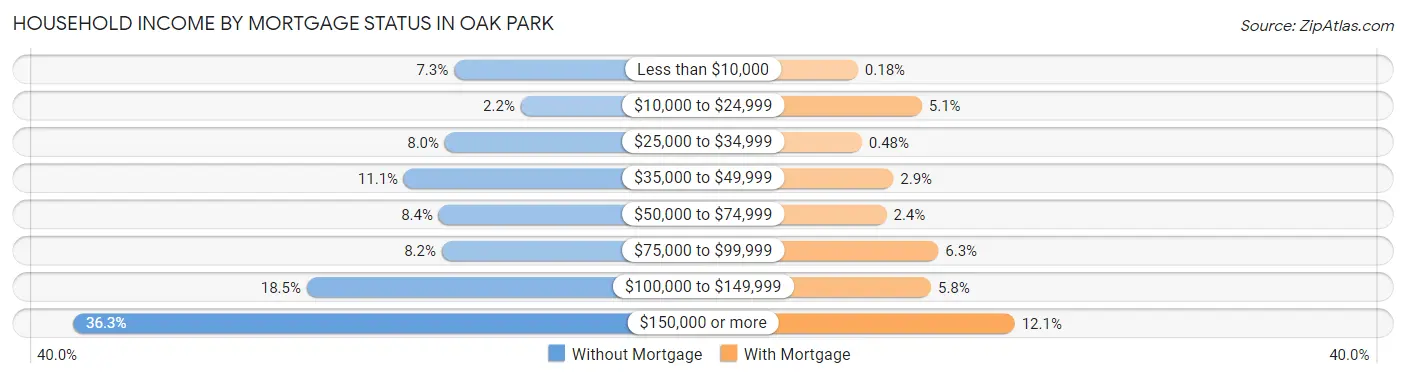
| Household Income | Without Mortgage | With Mortgage |
| Less than $10,000 | 63 (7.3%) | 5 (0.2%) |
| $10,000 to $24,999 | 19 (2.2%) | 137 (5.1%) |
| $25,000 to $34,999 | 69 (8.0%) | 13 (0.5%) |
| $35,000 to $49,999 | 96 (11.1%) | 78 (2.9%) |
| $50,000 to $74,999 | 73 (8.4%) | 64 (2.4%) |
| $75,000 to $99,999 | 71 (8.2%) | 171 (6.3%) |
| $100,000 to $149,999 | 160 (18.5%) | 156 (5.8%) |
| $150,000 or more | 314 (36.3%) | 329 (12.1%) |
| Total | 865 (100.0%) | 2,712 (100.0%) |
Property Value to Household Income Ratio in Oak Park
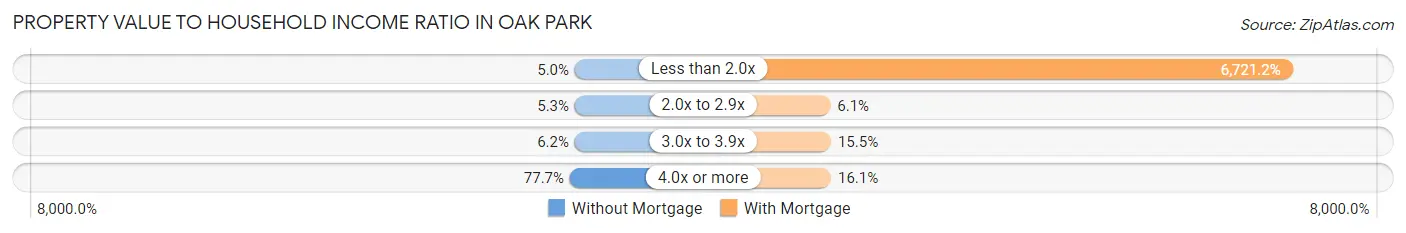
| Value-to-Income Ratio | Without Mortgage | With Mortgage |
| Less than 2.0x | 43 (5.0%) | 182,280 (6,721.2%) |
| 2.0x to 2.9x | 46 (5.3%) | 166 (6.1%) |
| 3.0x to 3.9x | 54 (6.2%) | 420 (15.5%) |
| 4.0x or more | 672 (77.7%) | 437 (16.1%) |
| Total | 865 (100.0%) | 2,712 (100.0%) |
Real Estate Taxes by Mortgage Status in Oak Park
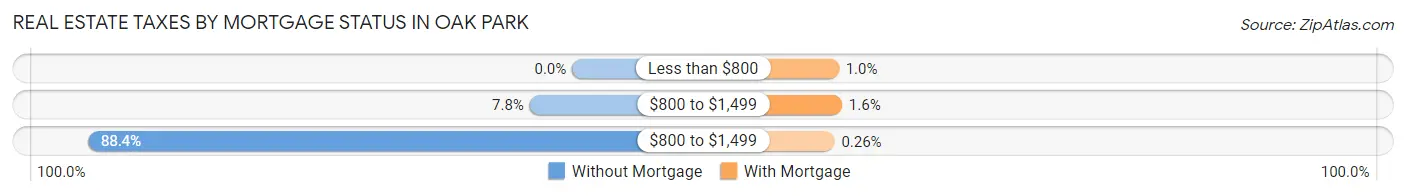
| Property Taxes | Without Mortgage | With Mortgage |
| Less than $800 | 0 (0.0%) | 28 (1.0%) |
| $800 to $1,499 | 67 (7.7%) | 44 (1.6%) |
| $800 to $1,499 | 765 (88.4%) | 7 (0.3%) |
| Total | 865 (100.0%) | 2,712 (100.0%) |
Health & Disability in Oak Park
Health Insurance Coverage by Age in Oak Park
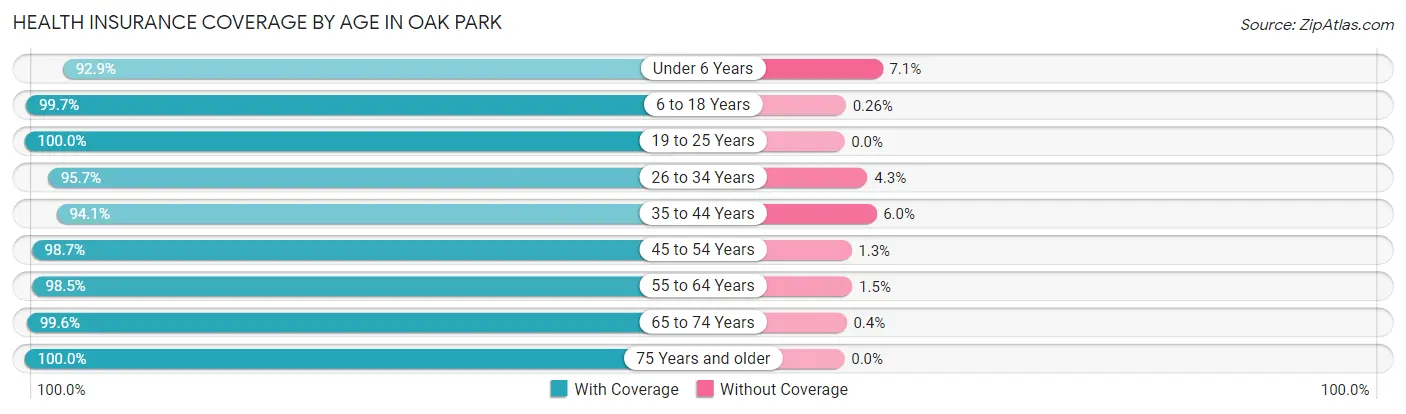
| Age Bracket | With Coverage | Without Coverage |
| Under 6 Years | 849 (92.9%) | 65 (7.1%) |
| 6 to 18 Years | 2,687 (99.7%) | 7 (0.3%) |
| 19 to 25 Years | 786 (100.0%) | 0 (0.0%) |
| 26 to 34 Years | 888 (95.7%) | 40 (4.3%) |
| 35 to 44 Years | 1,927 (94.1%) | 122 (5.9%) |
| 45 to 54 Years | 2,023 (98.7%) | 27 (1.3%) |
| 55 to 64 Years | 2,004 (98.5%) | 30 (1.5%) |
| 65 to 74 Years | 1,504 (99.6%) | 6 (0.4%) |
| 75 Years and older | 648 (100.0%) | 0 (0.0%) |
| Total | 13,316 (97.8%) | 297 (2.2%) |
Health Insurance Coverage by Citizenship Status in Oak Park
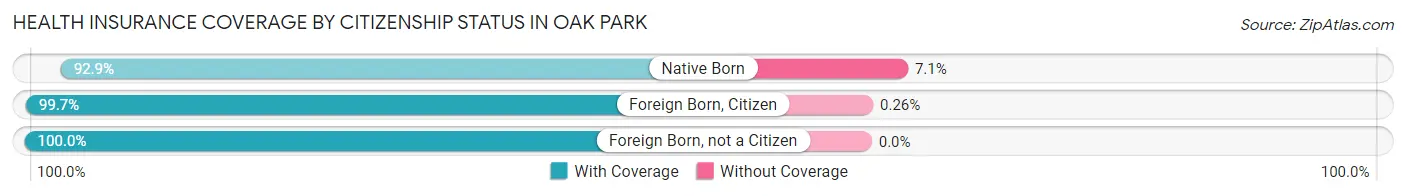
| Citizenship Status | With Coverage | Without Coverage |
| Native Born | 849 (92.9%) | 65 (7.1%) |
| Foreign Born, Citizen | 2,687 (99.7%) | 7 (0.3%) |
| Foreign Born, not a Citizen | 786 (100.0%) | 0 (0.0%) |
Health Insurance Coverage by Household Income in Oak Park
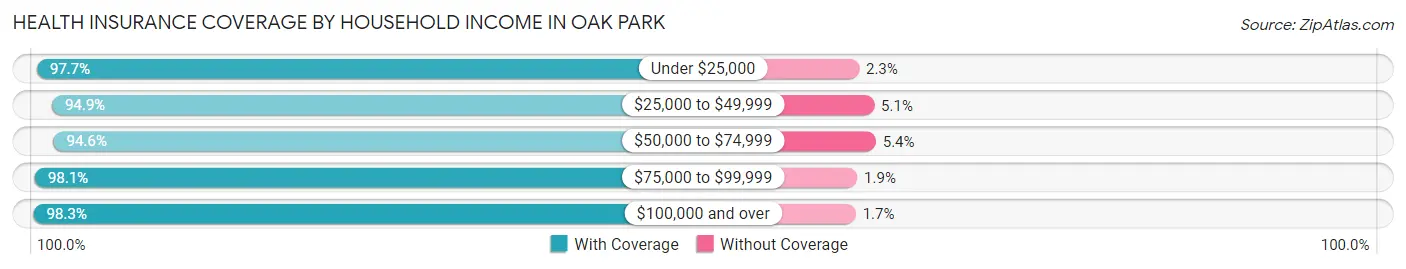
| Household Income | With Coverage | Without Coverage |
| Under $25,000 | 725 (97.7%) | 17 (2.3%) |
| $25,000 to $49,999 | 666 (94.9%) | 36 (5.1%) |
| $50,000 to $74,999 | 958 (94.6%) | 55 (5.4%) |
| $75,000 to $99,999 | 958 (98.1%) | 19 (1.9%) |
| $100,000 and over | 10,003 (98.3%) | 170 (1.7%) |
Public vs Private Health Insurance Coverage by Age in Oak Park
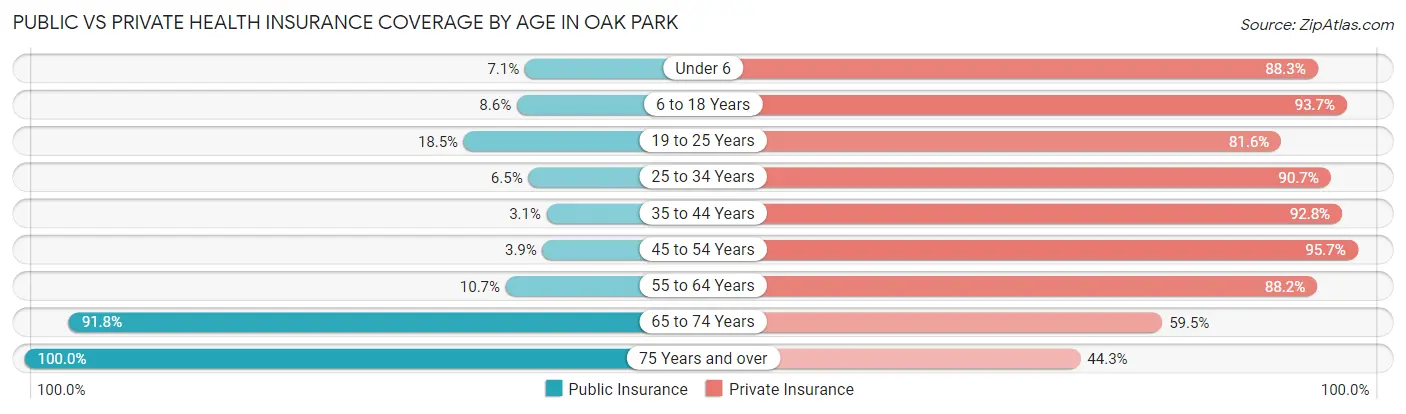
| Age Bracket | Public Insurance | Private Insurance |
| Under 6 | 65 (7.1%) | 807 (88.3%) |
| 6 to 18 Years | 232 (8.6%) | 2,525 (93.7%) |
| 19 to 25 Years | 145 (18.4%) | 641 (81.6%) |
| 25 to 34 Years | 60 (6.5%) | 842 (90.7%) |
| 35 to 44 Years | 63 (3.1%) | 1,902 (92.8%) |
| 45 to 54 Years | 79 (3.8%) | 1,962 (95.7%) |
| 55 to 64 Years | 217 (10.7%) | 1,794 (88.2%) |
| 65 to 74 Years | 1,386 (91.8%) | 898 (59.5%) |
| 75 Years and over | 648 (100.0%) | 287 (44.3%) |
| Total | 2,895 (21.3%) | 11,658 (85.6%) |
Disability Status by Sex by Age in Oak Park
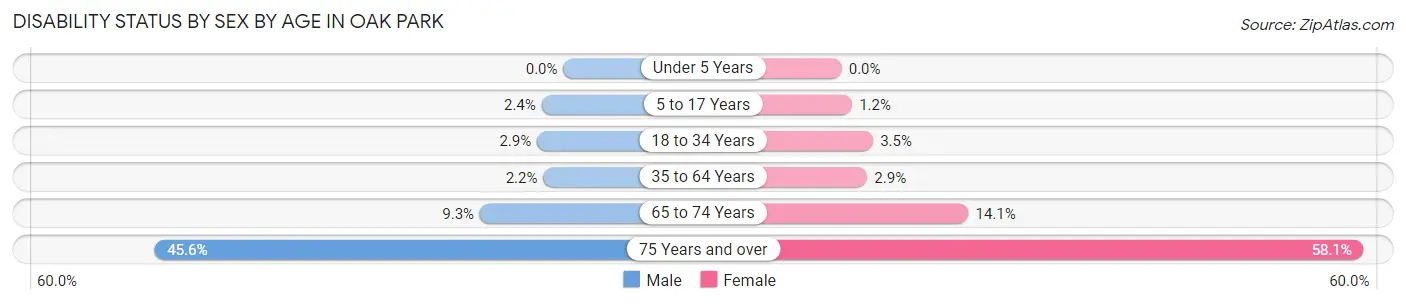
| Age Bracket | Male | Female |
| Under 5 Years | 0 (0.0%) | 0 (0.0%) |
| 5 to 17 Years | 34 (2.4%) | 14 (1.2%) |
| 18 to 34 Years | 28 (2.9%) | 33 (3.5%) |
| 35 to 64 Years | 64 (2.2%) | 93 (2.9%) |
| 65 to 74 Years | 60 (9.3%) | 122 (14.1%) |
| 75 Years and over | 82 (45.6%) | 272 (58.1%) |
Disability Class by Sex by Age in Oak Park
Disability Class: Hearing Difficulty
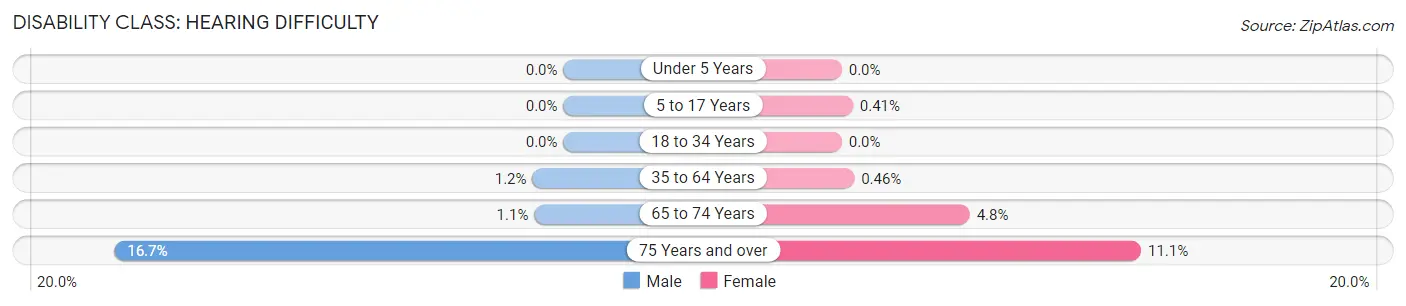
| Age Bracket | Male | Female |
| Under 5 Years | 0 (0.0%) | 0 (0.0%) |
| 5 to 17 Years | 0 (0.0%) | 5 (0.4%) |
| 18 to 34 Years | 0 (0.0%) | 0 (0.0%) |
| 35 to 64 Years | 33 (1.1%) | 15 (0.5%) |
| 65 to 74 Years | 7 (1.1%) | 41 (4.8%) |
| 75 Years and over | 30 (16.7%) | 52 (11.1%) |
Disability Class: Vision Difficulty
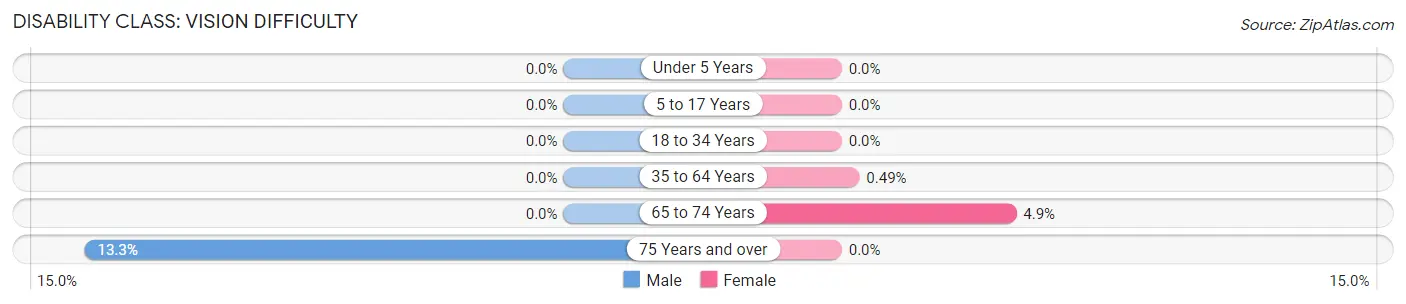
| Age Bracket | Male | Female |
| Under 5 Years | 0 (0.0%) | 0 (0.0%) |
| 5 to 17 Years | 0 (0.0%) | 0 (0.0%) |
| 18 to 34 Years | 0 (0.0%) | 0 (0.0%) |
| 35 to 64 Years | 0 (0.0%) | 16 (0.5%) |
| 65 to 74 Years | 0 (0.0%) | 42 (4.9%) |
| 75 Years and over | 24 (13.3%) | 0 (0.0%) |
Disability Class: Cognitive Difficulty
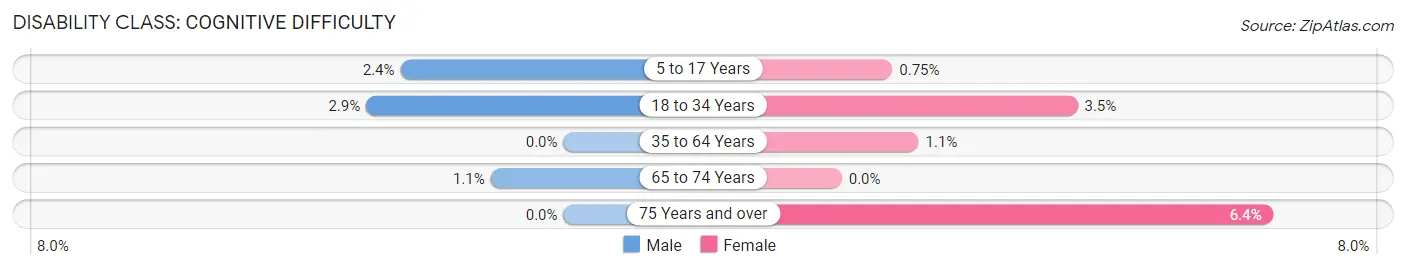
| Age Bracket | Male | Female |
| 5 to 17 Years | 34 (2.4%) | 9 (0.7%) |
| 18 to 34 Years | 28 (2.9%) | 33 (3.5%) |
| 35 to 64 Years | 0 (0.0%) | 37 (1.1%) |
| 65 to 74 Years | 7 (1.1%) | 0 (0.0%) |
| 75 Years and over | 0 (0.0%) | 30 (6.4%) |
Disability Class: Ambulatory Difficulty
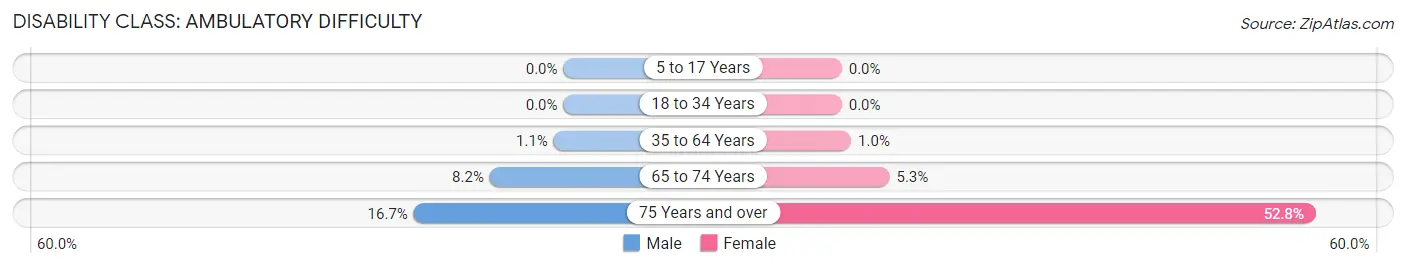
| Age Bracket | Male | Female |
| 5 to 17 Years | 0 (0.0%) | 0 (0.0%) |
| 18 to 34 Years | 0 (0.0%) | 0 (0.0%) |
| 35 to 64 Years | 31 (1.1%) | 34 (1.0%) |
| 65 to 74 Years | 53 (8.2%) | 46 (5.3%) |
| 75 Years and over | 30 (16.7%) | 247 (52.8%) |
Disability Class: Self-Care Difficulty
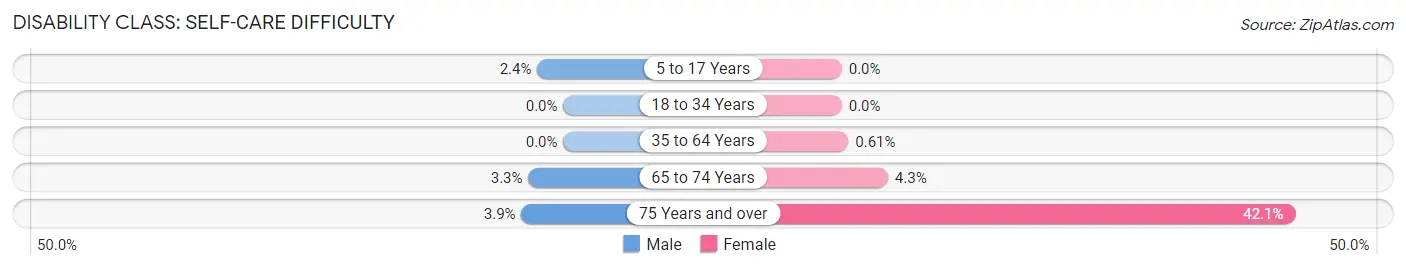
| Age Bracket | Male | Female |
| 5 to 17 Years | 34 (2.4%) | 0 (0.0%) |
| 18 to 34 Years | 0 (0.0%) | 0 (0.0%) |
| 35 to 64 Years | 0 (0.0%) | 20 (0.6%) |
| 65 to 74 Years | 21 (3.3%) | 37 (4.3%) |
| 75 Years and over | 7 (3.9%) | 197 (42.1%) |
Technology Access in Oak Park
Computing Device Access in Oak Park
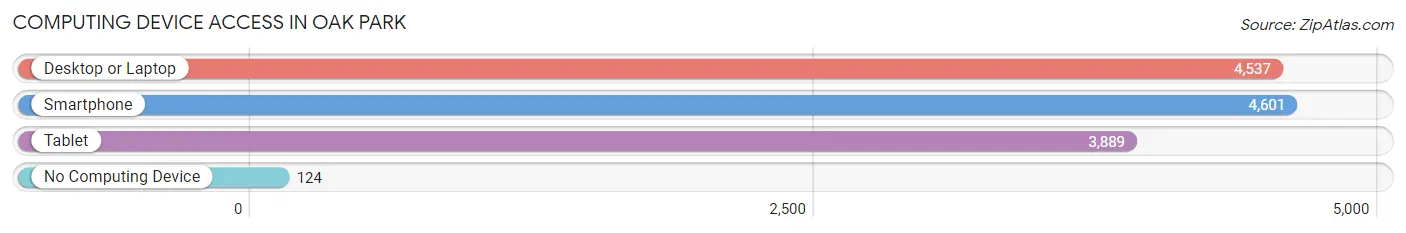
| Device Type | # Households | % Households |
| Desktop or Laptop | 4,537 | 90.5% |
| Smartphone | 4,601 | 91.7% |
| Tablet | 3,889 | 77.5% |
| No Computing Device | 124 | 2.5% |
| Total | 5,015 | 100.0% |
Internet Access in Oak Park
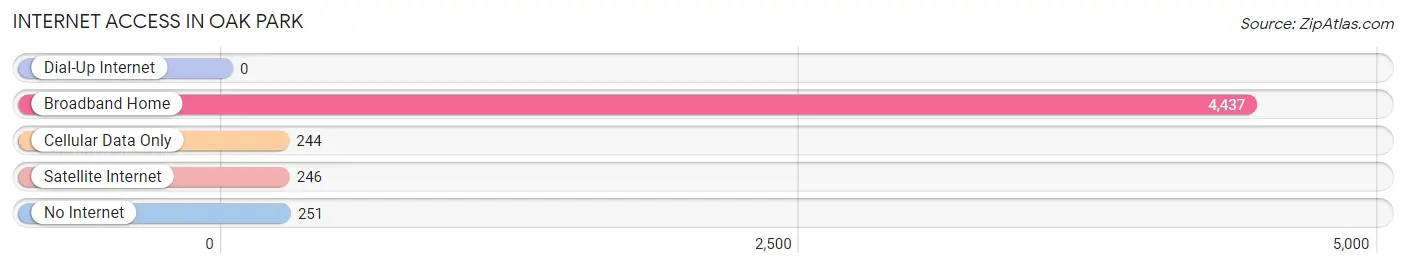
| Internet Type | # Households | % Households |
| Dial-Up Internet | 0 | 0.0% |
| Broadband Home | 4,437 | 88.5% |
| Cellular Data Only | 244 | 4.9% |
| Satellite Internet | 246 | 4.9% |
| No Internet | 251 | 5.0% |
| Total | 5,015 | 100.0% |
Oak Park Summary
Oak Park is a census-designated place located in Ventura County, California. It is located in the Simi Valley, and is part of the Greater Los Angeles Area. As of the 2010 census, the population of Oak Park was 14,266.
Geography
Oak Park is located at 34°14'25" North, 118°44'17" West (34.240278, -118.737917). It is situated in the Simi Hills, and is bordered by the cities of Simi Valley to the north, Thousand Oaks to the east, Agoura Hills to the south, and Westlake Village to the west. The Santa Monica Mountains are located to the south of Oak Park.
Oak Park is located in the Conejo Valley, and is part of the Greater Los Angeles Area. The area is characterized by rolling hills and valleys, and is home to numerous parks and open spaces. The climate is Mediterranean, with hot, dry summers and mild, wet winters.
History
Oak Park was originally inhabited by the Chumash people, who lived in the area for thousands of years. The area was first explored by Europeans in 1769, when Spanish explorers led by Gaspar de Portola passed through the area. The area was later settled by ranchers in the late 19th century.
In the early 20th century, the area was developed as a residential community. The first homes were built in the 1920s, and the community was officially incorporated as a census-designated place in the 1950s.
Economy
Oak Park is primarily a residential community, and the economy is largely based on the service industry. The largest employers in the area are the local school district, the county government, and the local hospital. Other major employers include retail stores, restaurants, and professional services.
Demographics
As of the 2010 census, the population of Oak Park was 14,266. The racial makeup of the community was 79.2% White, 8.2% Asian, 6.3% Hispanic or Latino, 4.2% African American, and 2.1% other. The median household income was $90,845, and the median family income was $103,844.
Conclusion
Oak Park is a census-designated place located in Ventura County, California. It is situated in the Simi Hills, and is part of the Greater Los Angeles Area. The area is characterized by rolling hills and valleys, and is home to numerous parks and open spaces. The economy is largely based on the service industry, and the largest employers in the area are the local school district, the county government, and the local hospital. As of the 2010 census, the population of Oak Park was 14,266, and the racial makeup of the community was 79.2% White, 8.2% Asian, 6.3% Hispanic or Latino, 4.2% African American, and 2.1% other.
Common Questions
What is Per Capita Income in Oak Park?
Per Capita income in Oak Park is $75,542.
What is the Median Family Income in Oak Park?
Median Family Income in Oak Park is $171,250.
What is the Median Household income in Oak Park?
Median Household Income in Oak Park is $150,898.
What is Income or Wage Gap in Oak Park?
Income or Wage Gap in Oak Park is 35.8%.
Women in Oak Park earn 64.2 cents for every dollar earned by a man.
What is Inequality or Gini Index in Oak Park?
Inequality or Gini Index in Oak Park is 0.47.
What is the Total Population of Oak Park?
Total Population of Oak Park is 13,627.
What is the Total Male Population of Oak Park?
Total Male Population of Oak Park is 6,489.
What is the Total Female Population of Oak Park?
Total Female Population of Oak Park is 7,138.
What is the Ratio of Males per 100 Females in Oak Park?
There are 90.91 Males per 100 Females in Oak Park.
What is the Ratio of Females per 100 Males in Oak Park?
There are 110.00 Females per 100 Males in Oak Park.
What is the Median Population Age in Oak Park?
Median Population Age in Oak Park is 42.1 Years.
What is the Average Family Size in Oak Park
Average Family Size in Oak Park is 3.2 People.
What is the Average Household Size in Oak Park
Average Household Size in Oak Park is 2.7 People.
How Large is the Labor Force in Oak Park?
There are 6,625 People in the Labor Forcein in Oak Park.
What is the Percentage of People in the Labor Force in Oak Park?
61.4% of People are in the Labor Force in Oak Park.
What is the Unemployment Rate in Oak Park?
Unemployment Rate in Oak Park is 5.3%.