Cities with the Highest Percentage of Population Employed in Legal Services & Support in Arkansas
RELATED REPORTS & OPTIONS
Legal Services & Support
Arkansas
Compare Cities
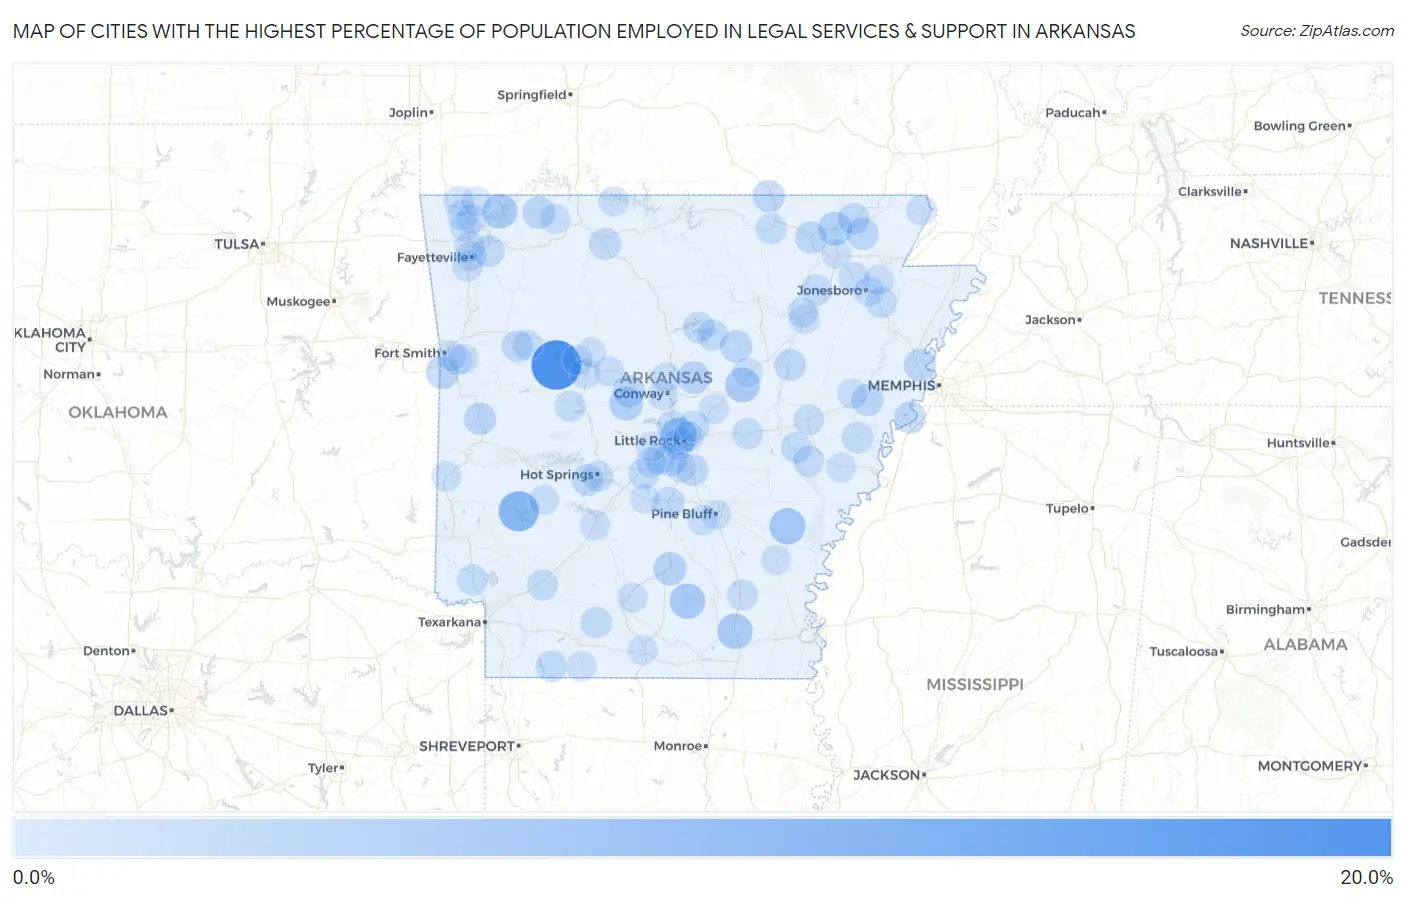
Map of Cities with the Highest Percentage of Population Employed in Legal Services & Support in Arkansas
0.0%
20.0%
Cities with the Highest Percentage of Population Employed in Legal Services & Support in Arkansas
| City | % Employed | vs State | vs National | |
| 1. | New Blaine | 19.9% | 0.79%(+19.1)#1 | 1.2%(+18.7)#58 |
| 2. | Daisy | 10.5% | 0.79%(+9.68)#2 | 1.2%(+9.28)#201 |
| 3. | Wilburn | 9.2% | 0.79%(+8.43)#3 | 1.2%(+8.03)#262 |
| 4. | Cammack Village | 7.1% | 0.79%(+6.34)#4 | 1.2%(+5.94)#430 |
| 5. | Gillett | 6.4% | 0.79%(+5.61)#5 | 1.2%(+5.21)#531 |
| 6. | Banks | 5.6% | 0.79%(+4.85)#6 | 1.2%(+4.45)#673 |
| 7. | Fountain Hill | 5.5% | 0.79%(+4.69)#7 | 1.2%(+4.30)#712 |
| 8. | Garner | 5.1% | 0.79%(+4.36)#8 | 1.2%(+3.96)#808 |
| 9. | Lost Bridge Village | 5.0% | 0.79%(+4.26)#9 | 1.2%(+3.86)#833 |
| 10. | Pocahontas | 4.3% | 0.79%(+3.50)#10 | 1.2%(+3.10)#1,096 |
| 11. | Perryville | 4.1% | 0.79%(+3.29)#11 | 1.2%(+2.89)#1,196 |
| 12. | Fordyce | 3.6% | 0.79%(+2.84)#12 | 1.2%(+2.44)#1,447 |
| 13. | Bonanza | 3.2% | 0.79%(+2.43)#13 | 1.2%(+2.03)#1,747 |
| 14. | Enola | 3.1% | 0.79%(+2.34)#14 | 1.2%(+1.94)#1,823 |
| 15. | Berryville | 3.0% | 0.79%(+2.22)#15 | 1.2%(+1.82)#1,923 |
| 16. | Clarkedale | 2.9% | 0.79%(+2.08)#16 | 1.2%(+1.69)#2,052 |
| 17. | Waldron | 2.8% | 0.79%(+2.05)#17 | 1.2%(+1.65)#2,086 |
| 18. | Shannon Hills | 2.8% | 0.79%(+2.03)#18 | 1.2%(+1.63)#2,113 |
| 19. | Mammoth Spring | 2.8% | 0.79%(+1.99)#19 | 1.2%(+1.59)#2,150 |
| 20. | Pangburn | 2.6% | 0.79%(+1.81)#20 | 1.2%(+1.41)#2,358 |
| 21. | Oppelo | 2.6% | 0.79%(+1.78)#21 | 1.2%(+1.38)#2,386 |
| 22. | Delaplaine | 2.6% | 0.79%(+1.78)#22 | 1.2%(+1.38)#2,389 |
| 23. | Imboden | 2.5% | 0.79%(+1.76)#23 | 1.2%(+1.36)#2,403 |
| 24. | Widener | 2.5% | 0.79%(+1.75)#24 | 1.2%(+1.35)#2,417 |
| 25. | Horseshoe Lake | 2.4% | 0.79%(+1.65)#25 | 1.2%(+1.26)#2,522 |
| 26. | Woodson | 2.4% | 0.79%(+1.60)#26 | 1.2%(+1.20)#2,608 |
| 27. | Little Rock | 2.4% | 0.79%(+1.59)#27 | 1.2%(+1.19)#2,613 |
| 28. | Rockwell | 2.4% | 0.79%(+1.58)#28 | 1.2%(+1.18)#2,636 |
| 29. | Augusta | 2.3% | 0.79%(+1.47)#29 | 1.2%(+1.07)#2,786 |
| 30. | Valley Springs | 2.2% | 0.79%(+1.45)#30 | 1.2%(+1.05)#2,812 |
| 31. | Biggers | 2.2% | 0.79%(+1.45)#31 | 1.2%(+1.05)#2,821 |
| 32. | Denning | 2.1% | 0.79%(+1.32)#32 | 1.2%(+0.921)#3,026 |
| 33. | Goshen | 2.1% | 0.79%(+1.30)#33 | 1.2%(+0.905)#3,059 |
| 34. | Taylor | 2.0% | 0.79%(+1.22)#34 | 1.2%(+0.824)#3,201 |
| 35. | Marianna | 2.0% | 0.79%(+1.21)#35 | 1.2%(+0.816)#3,217 |
| 36. | Greers Ferry | 2.0% | 0.79%(+1.21)#36 | 1.2%(+0.810)#3,223 |
| 37. | Swifton | 1.9% | 0.79%(+1.14)#37 | 1.2%(+0.744)#3,348 |
| 38. | Sheridan | 1.9% | 0.79%(+1.13)#38 | 1.2%(+0.730)#3,377 |
| 39. | Stephens | 1.8% | 0.79%(+1.05)#39 | 1.2%(+0.651)#3,546 |
| 40. | Maumelle | 1.8% | 0.79%(+1.04)#40 | 1.2%(+0.637)#3,593 |
| 41. | Sherwood | 1.8% | 0.79%(+1.00)#41 | 1.2%(+0.603)#3,669 |
| 42. | Heber Springs | 1.8% | 0.79%(+0.999)#42 | 1.2%(+0.600)#3,676 |
| 43. | Bay | 1.8% | 0.79%(+0.988)#43 | 1.2%(+0.589)#3,708 |
| 44. | Clarendon | 1.8% | 0.79%(+0.974)#44 | 1.2%(+0.576)#3,729 |
| 45. | Haskell | 1.7% | 0.79%(+0.961)#45 | 1.2%(+0.563)#3,759 |
| 46. | Bryant | 1.7% | 0.79%(+0.936)#46 | 1.2%(+0.537)#3,830 |
| 47. | Hot Springs | 1.7% | 0.79%(+0.883)#47 | 1.2%(+0.484)#3,968 |
| 48. | Plainview | 1.6% | 0.79%(+0.854)#48 | 1.2%(+0.456)#4,030 |
| 49. | Wilton | 1.6% | 0.79%(+0.854)#49 | 1.2%(+0.456)#4,032 |
| 50. | Holly Grove | 1.6% | 0.79%(+0.845)#50 | 1.2%(+0.447)#4,048 |
| 51. | Carlisle | 1.6% | 0.79%(+0.804)#51 | 1.2%(+0.405)#4,146 |
| 52. | Perrytown | 1.6% | 0.79%(+0.777)#52 | 1.2%(+0.379)#4,224 |
| 53. | Bono | 1.5% | 0.79%(+0.736)#53 | 1.2%(+0.337)#4,344 |
| 54. | Highland | 1.5% | 0.79%(+0.670)#54 | 1.2%(+0.271)#4,558 |
| 55. | Monticello | 1.4% | 0.79%(+0.640)#55 | 1.2%(+0.241)#4,659 |
| 56. | Johnson | 1.3% | 0.79%(+0.475)#56 | 1.2%(+0.076)#5,207 |
| 57. | Brinkley | 1.3% | 0.79%(+0.475)#57 | 1.2%(+0.076)#5,208 |
| 58. | Greenland | 1.2% | 0.79%(+0.426)#58 | 1.2%(+0.027)#5,420 |
| 59. | Bentonville | 1.1% | 0.79%(+0.340)#59 | 1.2%(-0.059)#5,753 |
| 60. | Fayetteville | 1.1% | 0.79%(+0.335)#60 | 1.2%(-0.063)#5,778 |
| 61. | Cave Springs | 1.1% | 0.79%(+0.319)#61 | 1.2%(-0.080)#5,857 |
| 62. | Arkadelphia | 1.1% | 0.79%(+0.311)#62 | 1.2%(-0.088)#5,888 |
| 63. | Caldwell | 1.1% | 0.79%(+0.308)#63 | 1.2%(-0.091)#5,907 |
| 64. | Avilla | 1.1% | 0.79%(+0.295)#64 | 1.2%(-0.103)#5,964 |
| 65. | Bella Vista | 1.1% | 0.79%(+0.292)#65 | 1.2%(-0.107)#5,974 |
| 66. | Diamond City | 1.1% | 0.79%(+0.287)#66 | 1.2%(-0.111)#5,998 |
| 67. | Dardanelle | 1.0% | 0.79%(+0.255)#67 | 1.2%(-0.144)#6,166 |
| 68. | London | 1.0% | 0.79%(+0.240)#68 | 1.2%(-0.159)#6,234 |
| 69. | Newport | 1.0% | 0.79%(+0.234)#69 | 1.2%(-0.165)#6,275 |
| 70. | Jonesboro | 1.0% | 0.79%(+0.224)#70 | 1.2%(-0.175)#6,333 |
| 71. | Sulphur Springs | 1.0% | 0.79%(+0.215)#71 | 1.2%(-0.184)#6,371 |
| 72. | Conway | 0.98% | 0.79%(+0.193)#72 | 1.2%(-0.206)#6,484 |
| 73. | Brookland | 0.97% | 0.79%(+0.187)#73 | 1.2%(-0.212)#6,503 |
| 74. | Campbell Station | 0.97% | 0.79%(+0.181)#74 | 1.2%(-0.218)#6,530 |
| 75. | Piggott | 0.94% | 0.79%(+0.154)#75 | 1.2%(-0.245)#6,685 |
| 76. | Benton | 0.93% | 0.79%(+0.149)#76 | 1.2%(-0.250)#6,715 |
| 77. | Barling | 0.92% | 0.79%(+0.133)#77 | 1.2%(-0.265)#6,786 |
| 78. | Green Forest | 0.92% | 0.79%(+0.131)#78 | 1.2%(-0.268)#6,803 |
| 79. | Atkins | 0.91% | 0.79%(+0.126)#79 | 1.2%(-0.273)#6,825 |
| 80. | Glenwood | 0.89% | 0.79%(+0.101)#80 | 1.2%(-0.298)#6,941 |
| 81. | North Little Rock | 0.87% | 0.79%(+0.086)#81 | 1.2%(-0.313)#7,034 |
| 82. | Coal Hill | 0.85% | 0.79%(+0.070)#82 | 1.2%(-0.329)#7,123 |
| 83. | Cabot | 0.83% | 0.79%(+0.046)#83 | 1.2%(-0.353)#7,233 |
| 84. | Wooster | 0.82% | 0.79%(+0.038)#84 | 1.2%(-0.361)#7,287 |
| 85. | East Camden | 0.80% | 0.79%(+0.020)#85 | 1.2%(-0.379)#7,389 |
| 86. | Hatfield | 0.80% | 0.79%(+0.012)#86 | 1.2%(-0.387)#7,443 |
| 87. | Emerson | 0.78% | 0.79%(-0.004)#87 | 1.2%(-0.403)#7,543 |
| 88. | El Dorado | 0.78% | 0.79%(-0.007)#88 | 1.2%(-0.406)#7,573 |
| 89. | Searcy | 0.78% | 0.79%(-0.010)#89 | 1.2%(-0.408)#7,582 |
| 90. | Marvell | 0.77% | 0.79%(-0.016)#90 | 1.2%(-0.415)#7,620 |
| 91. | Fort Smith | 0.77% | 0.79%(-0.016)#91 | 1.2%(-0.415)#7,622 |
| 92. | Central City | 0.76% | 0.79%(-0.026)#92 | 1.2%(-0.424)#7,682 |
| 93. | East End | 0.76% | 0.79%(-0.027)#93 | 1.2%(-0.426)#7,689 |
| 94. | Poyen | 0.76% | 0.79%(-0.028)#94 | 1.2%(-0.426)#7,697 |
| 95. | Dover | 0.73% | 0.79%(-0.056)#95 | 1.2%(-0.455)#7,874 |
| 96. | Dumas | 0.69% | 0.79%(-0.093)#96 | 1.2%(-0.491)#8,120 |
| 97. | Walnut Ridge | 0.69% | 0.79%(-0.095)#97 | 1.2%(-0.493)#8,141 |
| 98. | Rogers | 0.68% | 0.79%(-0.101)#98 | 1.2%(-0.499)#8,193 |
| 99. | Pea Ridge | 0.64% | 0.79%(-0.146)#99 | 1.2%(-0.545)#8,494 |
| 100. | Pine Bluff | 0.63% | 0.79%(-0.151)#100 | 1.2%(-0.550)#8,536 |
Common Questions
What are the Top 10 Cities with the Highest Percentage of Population Employed in Legal Services & Support in Arkansas?
Top 10 Cities with the Highest Percentage of Population Employed in Legal Services & Support in Arkansas are:
#1
19.9%
#2
10.5%
#3
7.1%
#4
6.4%
#5
5.6%
#6
5.5%
#7
5.1%
#8
5.0%
#9
4.3%
#10
4.1%
What city has the Highest Percentage of Population Employed in Legal Services & Support in Arkansas?
New Blaine has the Highest Percentage of Population Employed in Legal Services & Support in Arkansas with 19.9%.
What is the Percentage of Population Employed in Legal Services & Support in the State of Arkansas?
Percentage of Population Employed in Legal Services & Support in Arkansas is 0.79%.
What is the Percentage of Population Employed in Legal Services & Support in the United States?
Percentage of Population Employed in Legal Services & Support in the United States is 1.2%.