Cities with the Highest Percentage of Population Employed in Legal Services & Support in Minnesota
RELATED REPORTS & OPTIONS
Legal Services & Support
Minnesota
Compare Cities
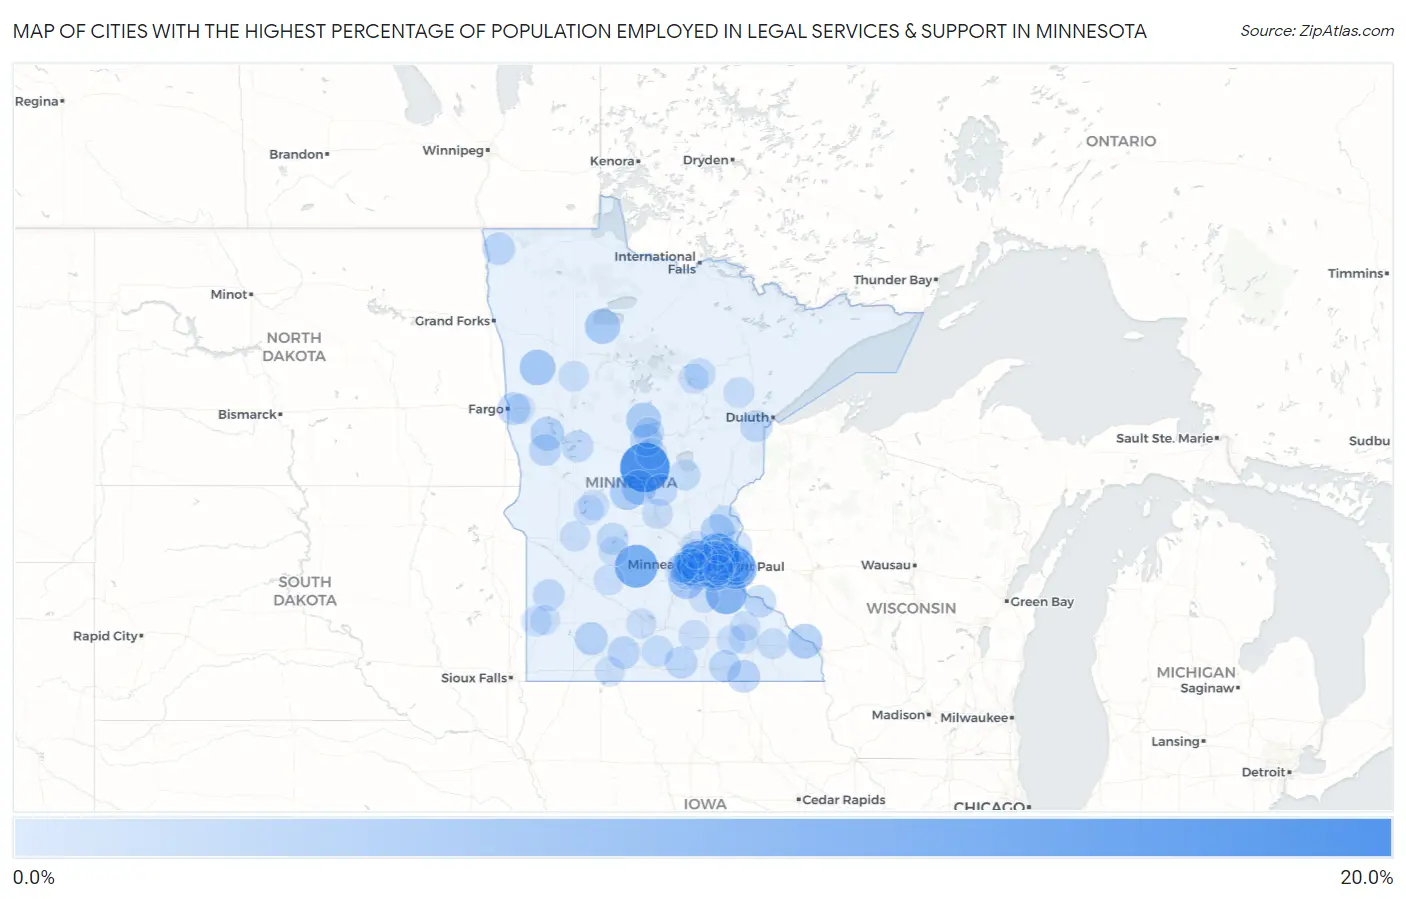
Map of Cities with the Highest Percentage of Population Employed in Legal Services & Support in Minnesota
0.0%
20.0%
Cities with the Highest Percentage of Population Employed in Legal Services & Support in Minnesota
| City | % Employed | vs State | vs National | |
| 1. | Fort Ripley | 15.6% | 1.0%(+14.6)#1 | 1.2%(+14.4)#98 |
| 2. | Medicine Lake | 10.7% | 1.0%(+9.68)#2 | 1.2%(+9.53)#191 |
| 3. | Cedar Mills | 10.5% | 1.0%(+9.50)#3 | 1.2%(+9.34)#198 |
| 4. | North Oaks | 9.8% | 1.0%(+8.79)#4 | 1.2%(+8.64)#234 |
| 5. | New Trier | 9.1% | 1.0%(+8.06)#5 | 1.2%(+7.91)#267 |
| 6. | St Marys Point | 9.0% | 1.0%(+8.02)#6 | 1.2%(+7.87)#270 |
| 7. | Deephaven | 6.9% | 1.0%(+5.85)#7 | 1.2%(+5.70)#452 |
| 8. | Lakeland Shores | 6.7% | 1.0%(+5.64)#8 | 1.2%(+5.48)#478 |
| 9. | Lilydale | 5.6% | 1.0%(+4.55)#9 | 1.2%(+4.40)#692 |
| 10. | Minnetonka Beach | 5.4% | 1.0%(+4.39)#10 | 1.2%(+4.23)#728 |
| 11. | Gary | 5.4% | 1.0%(+4.34)#11 | 1.2%(+4.19)#741 |
| 12. | Carver | 5.3% | 1.0%(+4.26)#12 | 1.2%(+4.10)#756 |
| 13. | Little Rock | 5.1% | 1.0%(+4.07)#13 | 1.2%(+3.92)#818 |
| 14. | Sunfish Lake | 5.0% | 1.0%(+3.93)#14 | 1.2%(+3.78)#852 |
| 15. | Chickamaw Beach | 4.8% | 1.0%(+3.73)#15 | 1.2%(+3.58)#923 |
| 16. | Homer | 4.8% | 1.0%(+3.73)#16 | 1.2%(+3.58)#924 |
| 17. | Burtrum | 4.8% | 1.0%(+3.73)#17 | 1.2%(+3.58)#926 |
| 18. | Sobieski | 4.7% | 1.0%(+3.69)#18 | 1.2%(+3.53)#942 |
| 19. | Gem Lake | 4.2% | 1.0%(+3.15)#19 | 1.2%(+3.00)#1,143 |
| 20. | Pelican Rapids | 4.1% | 1.0%(+3.09)#20 | 1.2%(+2.94)#1,164 |
| 21. | Edina | 4.1% | 1.0%(+3.08)#21 | 1.2%(+2.92)#1,176 |
| 22. | Martin Lake | 4.0% | 1.0%(+3.01)#22 | 1.2%(+2.86)#1,208 |
| 23. | Woodland | 3.7% | 1.0%(+2.70)#23 | 1.2%(+2.55)#1,368 |
| 24. | Storden | 3.6% | 1.0%(+2.54)#24 | 1.2%(+2.39)#1,483 |
| 25. | Taopi | 3.3% | 1.0%(+2.30)#25 | 1.2%(+2.15)#1,656 |
| 26. | Mendota Heights | 3.3% | 1.0%(+2.30)#26 | 1.2%(+2.14)#1,664 |
| 27. | Dilworth | 3.3% | 1.0%(+2.29)#27 | 1.2%(+2.13)#1,673 |
| 28. | Lake Shore | 3.2% | 1.0%(+2.16)#28 | 1.2%(+2.01)#1,764 |
| 29. | Orono | 3.2% | 1.0%(+2.12)#29 | 1.2%(+1.97)#1,809 |
| 30. | Hallock | 3.1% | 1.0%(+2.09)#30 | 1.2%(+1.93)#1,827 |
| 31. | Odin | 3.1% | 1.0%(+2.05)#31 | 1.2%(+1.89)#1,853 |
| 32. | Wells | 3.0% | 1.0%(+1.98)#32 | 1.2%(+1.83)#1,914 |
| 33. | Oak Park Heights | 3.0% | 1.0%(+1.93)#33 | 1.2%(+1.77)#1,974 |
| 34. | Frontenac | 2.8% | 1.0%(+1.79)#34 | 1.2%(+1.63)#2,108 |
| 35. | Carlton | 2.8% | 1.0%(+1.78)#35 | 1.2%(+1.63)#2,120 |
| 36. | Elizabeth | 2.8% | 1.0%(+1.75)#36 | 1.2%(+1.59)#2,160 |
| 37. | Mapleview | 2.8% | 1.0%(+1.75)#37 | 1.2%(+1.59)#2,161 |
| 38. | Dellwood | 2.7% | 1.0%(+1.72)#38 | 1.2%(+1.57)#2,186 |
| 39. | New London | 2.7% | 1.0%(+1.70)#39 | 1.2%(+1.54)#2,212 |
| 40. | Ottertail | 2.7% | 1.0%(+1.66)#40 | 1.2%(+1.51)#2,244 |
| 41. | Afton | 2.7% | 1.0%(+1.65)#41 | 1.2%(+1.50)#2,258 |
| 42. | Taunton | 2.6% | 1.0%(+1.60)#42 | 1.2%(+1.45)#2,304 |
| 43. | Buckman | 2.6% | 1.0%(+1.58)#43 | 1.2%(+1.43)#2,329 |
| 44. | Medina | 2.6% | 1.0%(+1.57)#44 | 1.2%(+1.42)#2,341 |
| 45. | Lake Elmo | 2.6% | 1.0%(+1.56)#45 | 1.2%(+1.40)#2,361 |
| 46. | Birchwood Village | 2.5% | 1.0%(+1.50)#46 | 1.2%(+1.35)#2,420 |
| 47. | Marine On St Croix | 2.5% | 1.0%(+1.47)#47 | 1.2%(+1.32)#2,440 |
| 48. | North Branch | 2.4% | 1.0%(+1.33)#48 | 1.2%(+1.17)#2,640 |
| 49. | St Anthony City Hennepin And Ramsey Counties | 2.3% | 1.0%(+1.32)#49 | 1.2%(+1.17)#2,654 |
| 50. | Amboy | 2.3% | 1.0%(+1.31)#50 | 1.2%(+1.16)#2,662 |
| 51. | Victoria | 2.3% | 1.0%(+1.23)#51 | 1.2%(+1.08)#2,773 |
| 52. | Excelsior | 2.2% | 1.0%(+1.19)#52 | 1.2%(+1.03)#2,853 |
| 53. | Bovey | 2.2% | 1.0%(+1.15)#53 | 1.2%(+1.00)#2,896 |
| 54. | Minneapolis | 2.1% | 1.0%(+1.09)#54 | 1.2%(+0.937)#2,999 |
| 55. | Plymouth | 2.1% | 1.0%(+1.07)#55 | 1.2%(+0.921)#3,028 |
| 56. | Golden Valley | 2.1% | 1.0%(+1.05)#56 | 1.2%(+0.902)#3,069 |
| 57. | Baxter | 2.1% | 1.0%(+1.03)#57 | 1.2%(+0.881)#3,103 |
| 58. | Robbinsdale | 2.1% | 1.0%(+1.02)#58 | 1.2%(+0.871)#3,121 |
| 59. | Onamia | 2.0% | 1.0%(+1.01)#59 | 1.2%(+0.857)#3,138 |
| 60. | Pine Springs | 2.0% | 1.0%(+0.999)#60 | 1.2%(+0.847)#3,159 |
| 61. | Shoreview | 2.0% | 1.0%(+0.978)#61 | 1.2%(+0.826)#3,198 |
| 62. | New Brighton | 2.0% | 1.0%(+0.951)#62 | 1.2%(+0.798)#3,248 |
| 63. | Eden Prairie | 2.0% | 1.0%(+0.948)#63 | 1.2%(+0.795)#3,260 |
| 64. | Roseville | 1.9% | 1.0%(+0.900)#64 | 1.2%(+0.747)#3,341 |
| 65. | Naytahwaush | 1.9% | 1.0%(+0.874)#65 | 1.2%(+0.721)#3,395 |
| 66. | Lakeland | 1.9% | 1.0%(+0.831)#66 | 1.2%(+0.678)#3,491 |
| 67. | Meadowlands | 1.9% | 1.0%(+0.821)#67 | 1.2%(+0.668)#3,512 |
| 68. | St Paul | 1.8% | 1.0%(+0.808)#68 | 1.2%(+0.655)#3,536 |
| 69. | Pequot Lakes | 1.8% | 1.0%(+0.807)#69 | 1.2%(+0.654)#3,539 |
| 70. | Arden Hills | 1.8% | 1.0%(+0.801)#70 | 1.2%(+0.648)#3,560 |
| 71. | Dover | 1.8% | 1.0%(+0.795)#71 | 1.2%(+0.643)#3,579 |
| 72. | Benson | 1.8% | 1.0%(+0.781)#72 | 1.2%(+0.629)#3,613 |
| 73. | Maplewood | 1.8% | 1.0%(+0.768)#73 | 1.2%(+0.615)#3,646 |
| 74. | Sauk Rapids | 1.8% | 1.0%(+0.768)#74 | 1.2%(+0.615)#3,648 |
| 75. | Lake Benton | 1.8% | 1.0%(+0.765)#75 | 1.2%(+0.613)#3,654 |
| 76. | Olivia | 1.8% | 1.0%(+0.736)#76 | 1.2%(+0.584)#3,716 |
| 77. | St Louis Park | 1.7% | 1.0%(+0.718)#77 | 1.2%(+0.565)#3,755 |
| 78. | Dayton | 1.7% | 1.0%(+0.714)#78 | 1.2%(+0.561)#3,763 |
| 79. | Crystal | 1.7% | 1.0%(+0.707)#79 | 1.2%(+0.554)#3,785 |
| 80. | Elko New Market | 1.7% | 1.0%(+0.701)#80 | 1.2%(+0.548)#3,796 |
| 81. | Waseca | 1.7% | 1.0%(+0.684)#81 | 1.2%(+0.531)#3,844 |
| 82. | Searles | 1.7% | 1.0%(+0.678)#82 | 1.2%(+0.526)#3,865 |
| 83. | Villard | 1.7% | 1.0%(+0.678)#83 | 1.2%(+0.526)#3,866 |
| 84. | St Bonifacius | 1.7% | 1.0%(+0.647)#84 | 1.2%(+0.495)#3,944 |
| 85. | Glenwood | 1.7% | 1.0%(+0.638)#85 | 1.2%(+0.485)#3,964 |
| 86. | Grand Rapids | 1.7% | 1.0%(+0.624)#86 | 1.2%(+0.471)#3,990 |
| 87. | Byron | 1.6% | 1.0%(+0.588)#87 | 1.2%(+0.436)#4,064 |
| 88. | Long Lake | 1.6% | 1.0%(+0.558)#88 | 1.2%(+0.405)#4,147 |
| 89. | Jackson | 1.6% | 1.0%(+0.528)#89 | 1.2%(+0.375)#4,229 |
| 90. | Minnetonka | 1.6% | 1.0%(+0.524)#90 | 1.2%(+0.372)#4,239 |
| 91. | Dodge Center | 1.5% | 1.0%(+0.512)#91 | 1.2%(+0.359)#4,276 |
| 92. | Minnetrista | 1.5% | 1.0%(+0.499)#92 | 1.2%(+0.346)#4,320 |
| 93. | Eagan | 1.5% | 1.0%(+0.486)#93 | 1.2%(+0.333)#4,357 |
| 94. | Tyler | 1.5% | 1.0%(+0.467)#94 | 1.2%(+0.314)#4,413 |
| 95. | Pine Island | 1.5% | 1.0%(+0.460)#95 | 1.2%(+0.307)#4,438 |
| 96. | Glyndon | 1.5% | 1.0%(+0.459)#96 | 1.2%(+0.306)#4,442 |
| 97. | Lino Lakes | 1.5% | 1.0%(+0.433)#97 | 1.2%(+0.280)#4,533 |
| 98. | West St Paul | 1.5% | 1.0%(+0.432)#98 | 1.2%(+0.280)#4,539 |
| 99. | Maple Grove | 1.4% | 1.0%(+0.417)#99 | 1.2%(+0.264)#4,579 |
| 100. | Kandiyohi | 1.4% | 1.0%(+0.413)#100 | 1.2%(+0.260)#4,598 |
Common Questions
What are the Top 10 Cities with the Highest Percentage of Population Employed in Legal Services & Support in Minnesota?
Top 10 Cities with the Highest Percentage of Population Employed in Legal Services & Support in Minnesota are:
#1
15.6%
#2
10.7%
#3
10.5%
#4
9.8%
#5
9.1%
#6
9.0%
#7
6.9%
#8
6.7%
#9
5.6%
#10
5.4%
What city has the Highest Percentage of Population Employed in Legal Services & Support in Minnesota?
Fort Ripley has the Highest Percentage of Population Employed in Legal Services & Support in Minnesota with 15.6%.
What is the Percentage of Population Employed in Legal Services & Support in the State of Minnesota?
Percentage of Population Employed in Legal Services & Support in Minnesota is 1.0%.
What is the Percentage of Population Employed in Legal Services & Support in the United States?
Percentage of Population Employed in Legal Services & Support in the United States is 1.2%.