Malibu, CA Map & Demographics
Malibu Map
Malibu Overview
$120,795
PER CAPITA INCOME
$223,088
AVG FAMILY INCOME
$186,905
AVG HOUSEHOLD INCOME
54.3%
WAGE / INCOME GAP [ % ]
45.7¢/ $1
WAGE / INCOME GAP [ $ ]
0.54
INEQUALITY / GINI INDEX
10,698
TOTAL POPULATION
5,363
MALE POPULATION
5,335
FEMALE POPULATION
100.52
MALES / 100 FEMALES
99.48
FEMALES / 100 MALES
50.2
MEDIAN AGE
3.0
AVG FAMILY SIZE
2.4
AVG HOUSEHOLD SIZE
5,040
LABOR FORCE [ PEOPLE ]
56.7%
PERCENT IN LABOR FORCE
5.5%
UNEMPLOYMENT RATE
Income in Malibu
Income Overview in Malibu
Per Capita Income in Malibu is $120,795, while median incomes of families and households are $223,088 and $186,905 respectively.
| Characteristic | Number | Measure |
| Per Capita Income | 10,698 | $120,795 |
| Median Family Income | 2,784 | $223,088 |
| Mean Family Income | 2,784 | $347,507 |
| Median Household Income | 4,401 | $186,905 |
| Mean Household Income | 4,401 | $288,162 |
| Income Deficit | 2,784 | $0 |
| Wage / Income Gap (%) | 10,698 | 54.25% |
| Wage / Income Gap ($) | 10,698 | 45.75¢ per $1 |
| Gini / Inequality Index | 10,698 | 0.54 |
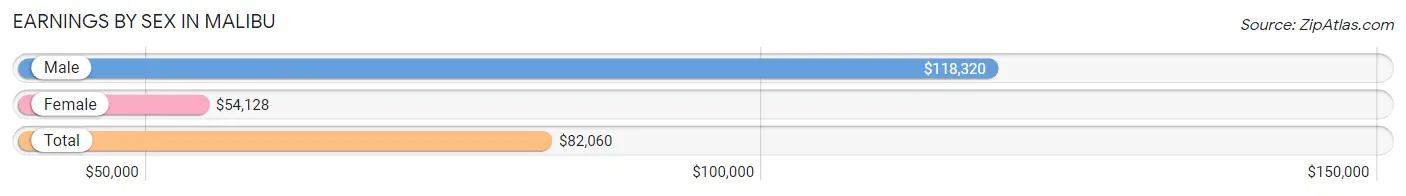
Earnings by Sex in Malibu
Average Earnings in Malibu are $82,060, $118,320 for men and $54,128 for women, a difference of 54.2%.
| Sex | Number | Average Earnings |
| Male | 3,016 (56.1%) | $118,320 |
| Female | 2,358 (43.9%) | $54,128 |
| Total | 5,374 (100.0%) | $82,060 |
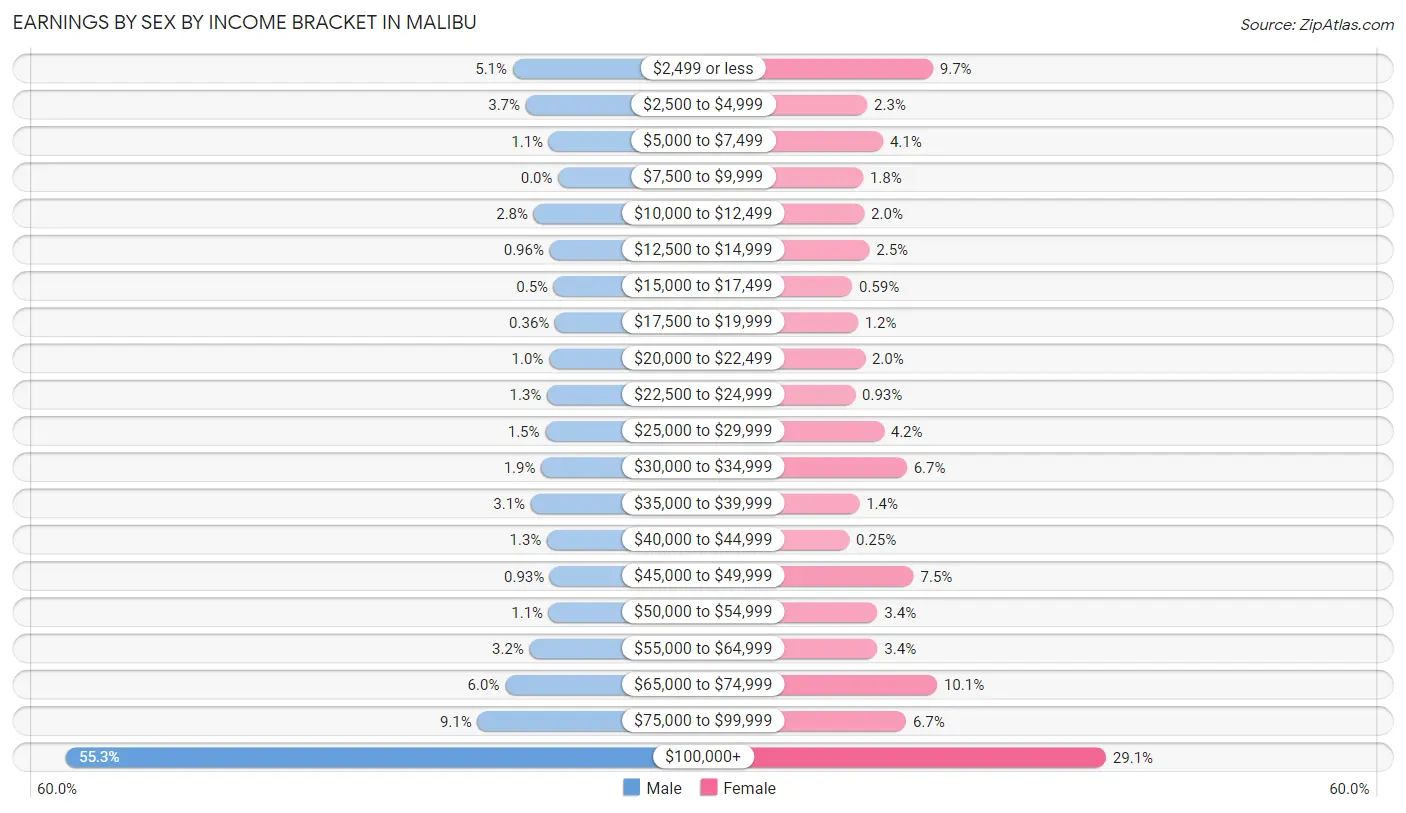
Earnings by Sex by Income Bracket in Malibu
The most common earnings brackets in Malibu are $100,000+ for men (1,669 | 55.3%) and $100,000+ for women (687 | 29.1%).
| Income | Male | Female |
| $2,499 or less | 154 (5.1%) | 228 (9.7%) |
| $2,500 to $4,999 | 110 (3.6%) | 54 (2.3%) |
| $5,000 to $7,499 | 32 (1.1%) | 96 (4.1%) |
| $7,500 to $9,999 | 0 (0.0%) | 43 (1.8%) |
| $10,000 to $12,499 | 83 (2.8%) | 46 (1.9%) |
| $12,500 to $14,999 | 29 (1.0%) | 60 (2.5%) |
| $15,000 to $17,499 | 15 (0.5%) | 14 (0.6%) |
| $17,500 to $19,999 | 11 (0.4%) | 29 (1.2%) |
| $20,000 to $22,499 | 31 (1.0%) | 48 (2.0%) |
| $22,500 to $24,999 | 38 (1.3%) | 22 (0.9%) |
| $25,000 to $29,999 | 44 (1.5%) | 98 (4.2%) |
| $30,000 to $34,999 | 58 (1.9%) | 159 (6.7%) |
| $35,000 to $39,999 | 93 (3.1%) | 33 (1.4%) |
| $40,000 to $44,999 | 38 (1.3%) | 6 (0.3%) |
| $45,000 to $49,999 | 28 (0.9%) | 177 (7.5%) |
| $50,000 to $54,999 | 32 (1.1%) | 81 (3.4%) |
| $55,000 to $64,999 | 97 (3.2%) | 81 (3.4%) |
| $65,000 to $74,999 | 180 (6.0%) | 239 (10.1%) |
| $75,000 to $99,999 | 274 (9.1%) | 157 (6.7%) |
| $100,000+ | 1,669 (55.3%) | 687 (29.1%) |
| Total | 3,016 (100.0%) | 2,358 (100.0%) |
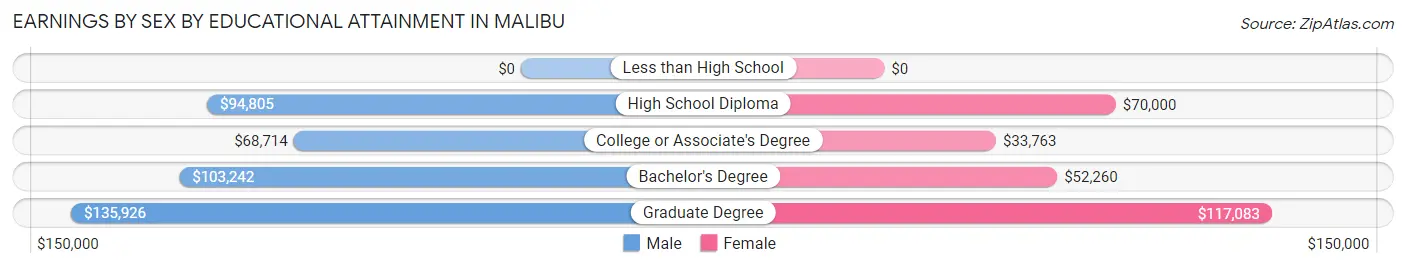
Earnings by Sex by Educational Attainment in Malibu
Average earnings in Malibu are $119,023 for men and $57,159 for women, a difference of 52.0%. Men with an educational attainment of graduate degree enjoy the highest average annual earnings of $135,926, while those with college or associate's degree education earn the least with $68,714. Women with an educational attainment of graduate degree earn the most with the average annual earnings of $117,083, while those with college or associate's degree education have the smallest earnings of $33,763.
| Educational Attainment | Male Income | Female Income |
| Less than High School | - | - |
| High School Diploma | $94,805 | $70,000 |
| College or Associate's Degree | $68,714 | $33,763 |
| Bachelor's Degree | $103,242 | $52,260 |
| Graduate Degree | $135,926 | $117,083 |
| Total | $119,023 | $57,159 |
Family Income in Malibu
Family Income Brackets in Malibu
According to the Malibu family income data, there are 1,606 families falling into the $200,000+ income range, which is the most common income bracket and makes up 57.7% of all families.
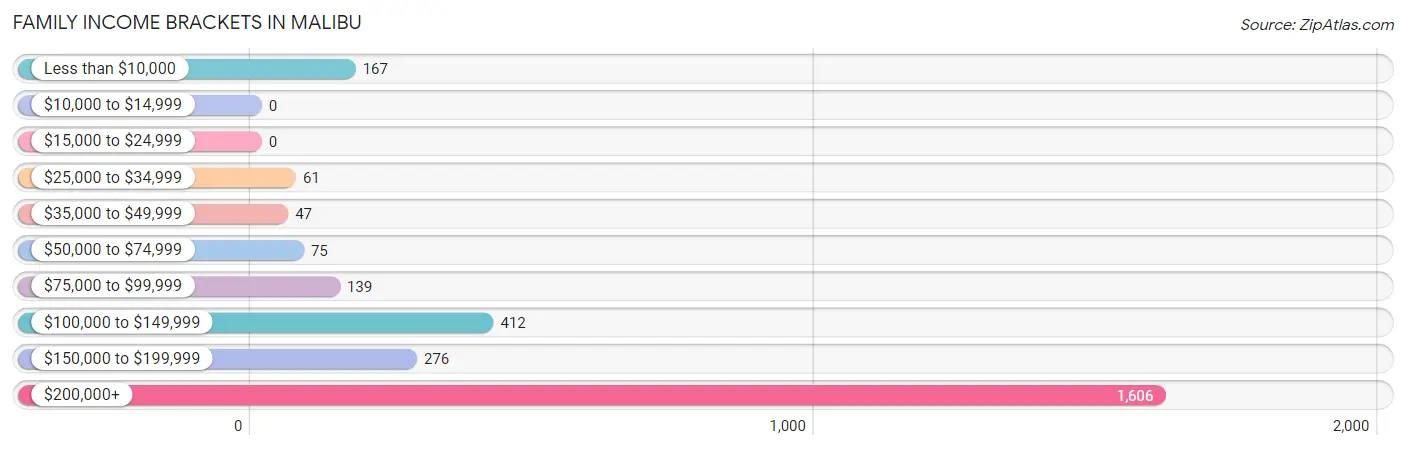
| Income Bracket | # Families | % Families |
| Less than $10,000 | 167 | 6.0% |
| $10,000 to $14,999 | 0 | 0.0% |
| $15,000 to $24,999 | 0 | 0.0% |
| $25,000 to $34,999 | 61 | 2.2% |
| $35,000 to $49,999 | 47 | 1.7% |
| $50,000 to $74,999 | 75 | 2.7% |
| $75,000 to $99,999 | 139 | 5.0% |
| $100,000 to $149,999 | 412 | 14.8% |
| $150,000 to $199,999 | 276 | 9.9% |
| $200,000+ | 1,606 | 57.7% |
Family Income by Famaliy Size in Malibu
3-person families (470 | 16.9%) account for the highest median family income in Malibu with $250,001 per family, while 2-person families (1,445 | 51.9%) have the highest median income of $104,246 per family member.
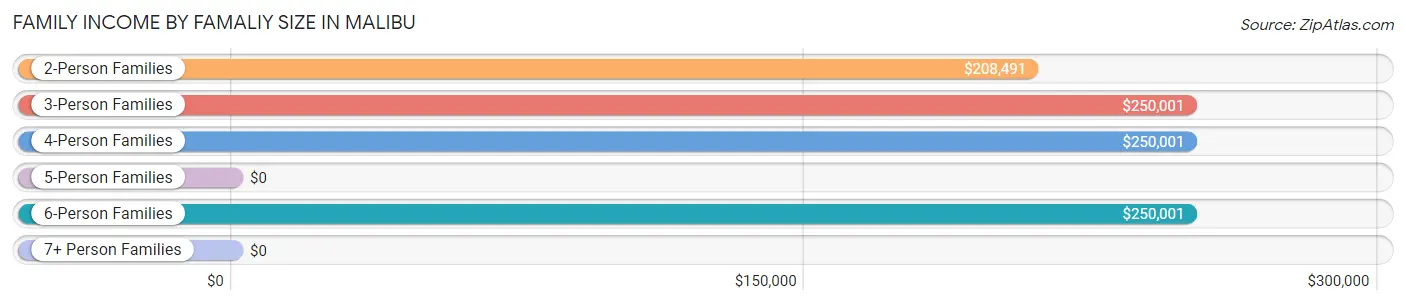
| Income Bracket | # Families | Median Income |
| 2-Person Families | 1,445 (51.9%) | $208,491 |
| 3-Person Families | 470 (16.9%) | $250,001 |
| 4-Person Families | 507 (18.2%) | $250,001 |
| 5-Person Families | 299 (10.7%) | $0 |
| 6-Person Families | 51 (1.8%) | $250,001 |
| 7+ Person Families | 12 (0.4%) | $0 |
| Total | 2,784 (100.0%) | $223,088 |
Family Income by Number of Earners in Malibu
The median family income in Malibu is $223,088, with families comprising 3+ earners (194) having the highest median family income of $250,001, while families with no earners (391) have the lowest median family income of $189,250, accounting for 7.0% and 14.0% of families, respectively.
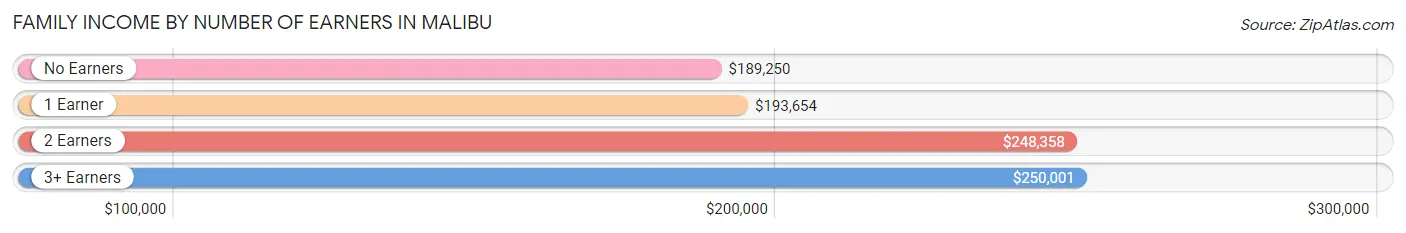
| Number of Earners | # Families | Median Income |
| No Earners | 391 (14.0%) | $189,250 |
| 1 Earner | 1,236 (44.4%) | $193,654 |
| 2 Earners | 963 (34.6%) | $248,358 |
| 3+ Earners | 194 (7.0%) | $250,001 |
| Total | 2,784 (100.0%) | $223,088 |
Household Income in Malibu
Household Income Brackets in Malibu
With 2,020 households falling in the category, the $200,000+ income range is the most frequent in Malibu, accounting for 45.9% of all households. In contrast, only 9 households (0.2%) fall into the $10,000 to $14,999 income bracket, making it the least populous group.
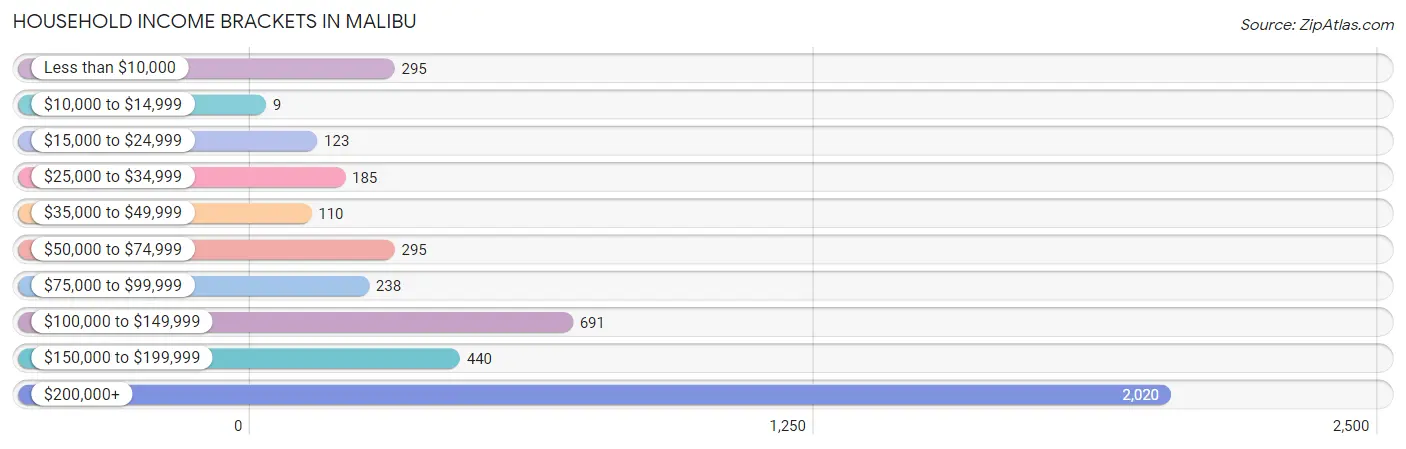
| Income Bracket | # Households | % Households |
| Less than $10,000 | 295 | 6.7% |
| $10,000 to $14,999 | 9 | 0.2% |
| $15,000 to $24,999 | 123 | 2.8% |
| $25,000 to $34,999 | 185 | 4.2% |
| $35,000 to $49,999 | 110 | 2.5% |
| $50,000 to $74,999 | 295 | 6.7% |
| $75,000 to $99,999 | 238 | 5.4% |
| $100,000 to $149,999 | 691 | 15.7% |
| $150,000 to $199,999 | 440 | 10.0% |
| $200,000+ | 2,020 | 45.9% |
Household Income by Householder Age in Malibu
The median household income in Malibu is $186,905, with the highest median household income of $215,670 found in the 45 to 64 years age bracket for the primary householder. A total of 1,739 households (39.5%) fall into this category. Meanwhile, the 15 to 24 years age bracket for the primary householder has the lowest median household income of $0, with 65 households (1.5%) in this group.
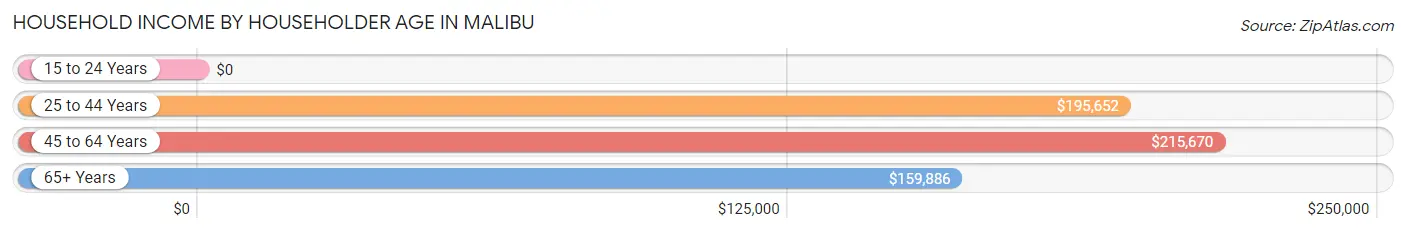
| Income Bracket | # Households | Median Income |
| 15 to 24 Years | 65 (1.5%) | $0 |
| 25 to 44 Years | 614 (14.0%) | $195,652 |
| 45 to 64 Years | 1,739 (39.5%) | $215,670 |
| 65+ Years | 1,983 (45.1%) | $159,886 |
| Total | 4,401 (100.0%) | $186,905 |
Poverty in Malibu
Income Below Poverty by Sex and Age in Malibu
With 8.5% poverty level for males and 8.5% for females among the residents of Malibu, 6 to 11 year old males and 35 to 44 year old females are the most vulnerable to poverty, with 217 males (38.7%) and 123 females (23.0%) in their respective age groups living below the poverty level.
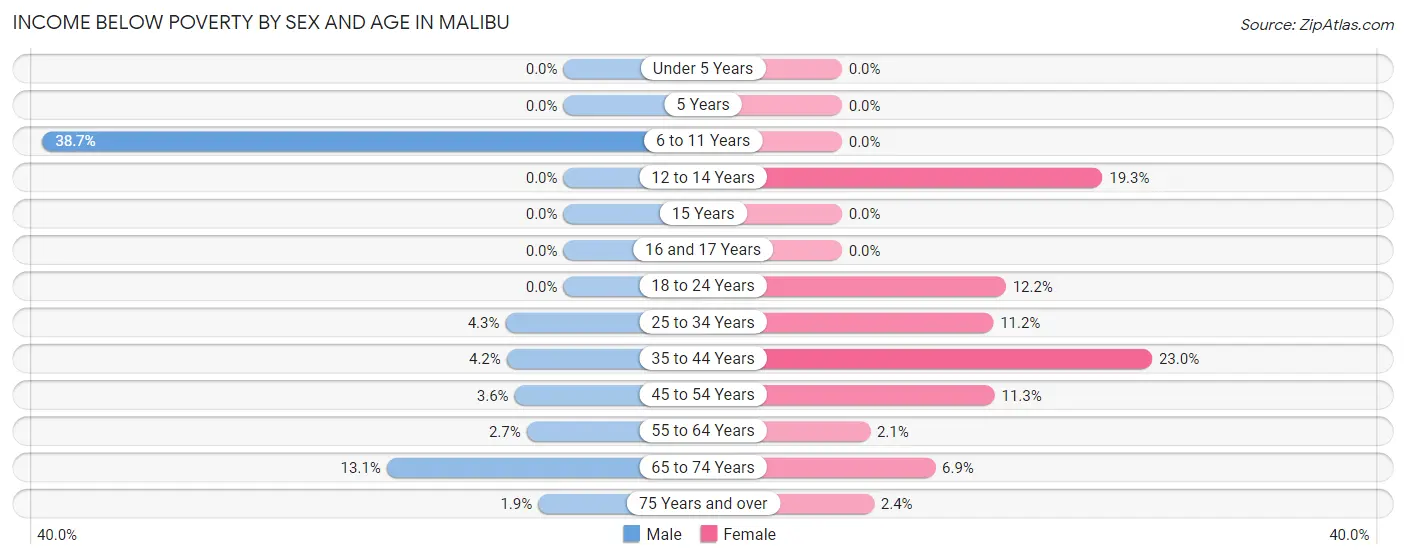
| Age Bracket | Male | Female |
| Under 5 Years | 0 (0.0%) | 0 (0.0%) |
| 5 Years | 0 (0.0%) | 0 (0.0%) |
| 6 to 11 Years | 217 (38.7%) | 0 (0.0%) |
| 12 to 14 Years | 0 (0.0%) | 53 (19.3%) |
| 15 Years | 0 (0.0%) | 0 (0.0%) |
| 16 and 17 Years | 0 (0.0%) | 0 (0.0%) |
| 18 to 24 Years | 0 (0.0%) | 42 (12.2%) |
| 25 to 34 Years | 15 (4.3%) | 70 (11.2%) |
| 35 to 44 Years | 17 (4.2%) | 123 (23.0%) |
| 45 to 54 Years | 21 (3.6%) | 73 (11.3%) |
| 55 to 64 Years | 23 (2.7%) | 19 (2.1%) |
| 65 to 74 Years | 149 (13.1%) | 64 (6.9%) |
| 75 Years and over | 12 (1.9%) | 11 (2.4%) |
| Total | 454 (8.5%) | 455 (8.5%) |
Income Above Poverty by Sex and Age in Malibu
According to the poverty statistics in Malibu, males aged under 5 years and females aged under 5 years are the age groups that are most secure financially, with 100.0% of males and 100.0% of females in these age groups living above the poverty line.
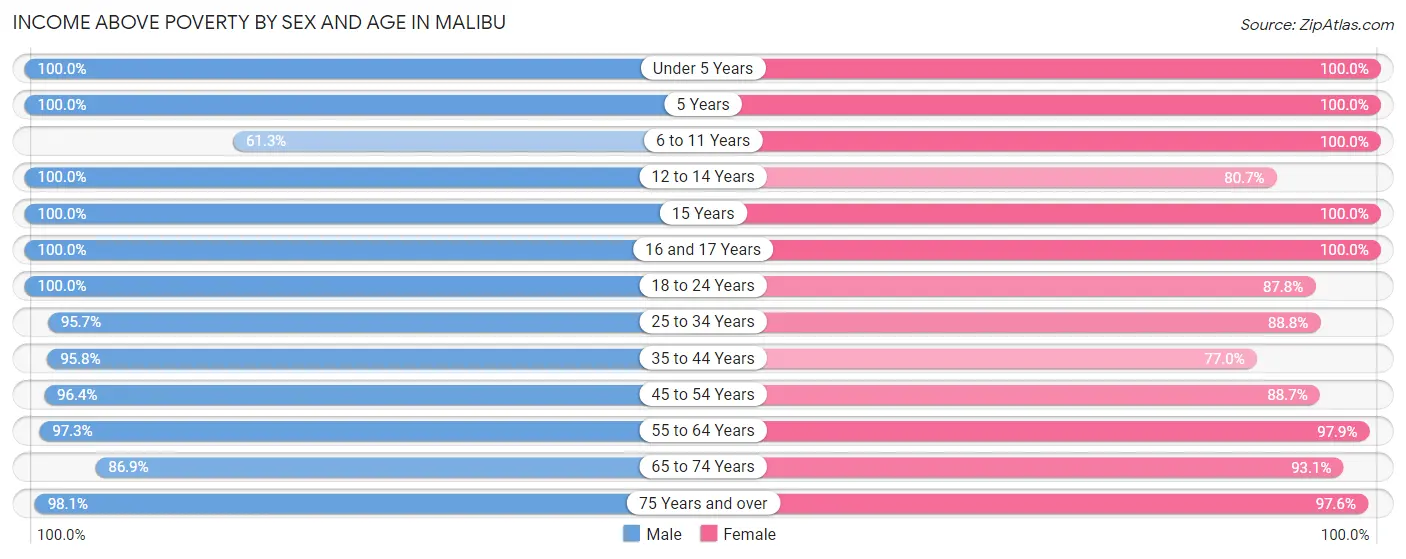
| Age Bracket | Male | Female |
| Under 5 Years | 157 (100.0%) | 98 (100.0%) |
| 5 Years | 55 (100.0%) | 12 (100.0%) |
| 6 to 11 Years | 344 (61.3%) | 276 (100.0%) |
| 12 to 14 Years | 184 (100.0%) | 221 (80.7%) |
| 15 Years | 136 (100.0%) | 54 (100.0%) |
| 16 and 17 Years | 170 (100.0%) | 182 (100.0%) |
| 18 to 24 Years | 151 (100.0%) | 303 (87.8%) |
| 25 to 34 Years | 333 (95.7%) | 553 (88.8%) |
| 35 to 44 Years | 387 (95.8%) | 411 (77.0%) |
| 45 to 54 Years | 557 (96.4%) | 571 (88.7%) |
| 55 to 64 Years | 819 (97.3%) | 889 (97.9%) |
| 65 to 74 Years | 987 (86.9%) | 859 (93.1%) |
| 75 Years and over | 625 (98.1%) | 451 (97.6%) |
| Total | 4,905 (91.5%) | 4,880 (91.5%) |
Income Below Poverty Among Married-Couple Families in Malibu
The poverty statistics for married-couple families in Malibu show that 5.2% or 120 of the total 2,322 families live below the poverty line. Families with 1 or 2 children have the highest poverty rate of 18.6%, comprising of 112 families. On the other hand, families with 3 or 4 children have the lowest poverty rate of 0.0%, which includes 0 families.
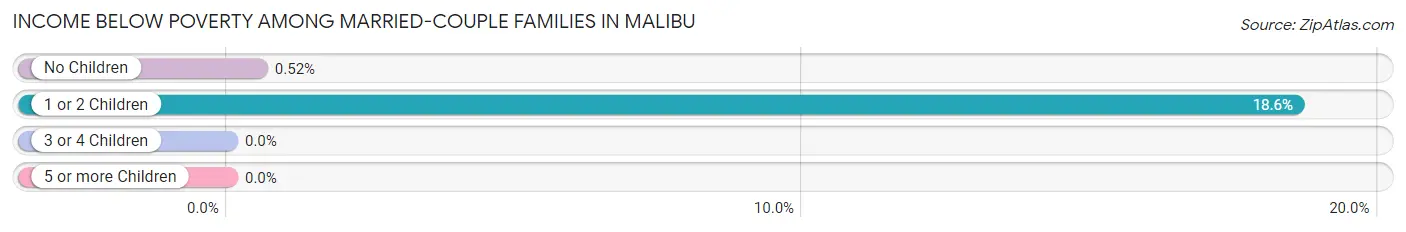
| Children | Above Poverty | Below Poverty |
| No Children | 1,525 (99.5%) | 8 (0.5%) |
| 1 or 2 Children | 491 (81.4%) | 112 (18.6%) |
| 3 or 4 Children | 174 (100.0%) | 0 (0.0%) |
| 5 or more Children | 12 (100.0%) | 0 (0.0%) |
| Total | 2,202 (94.8%) | 120 (5.2%) |
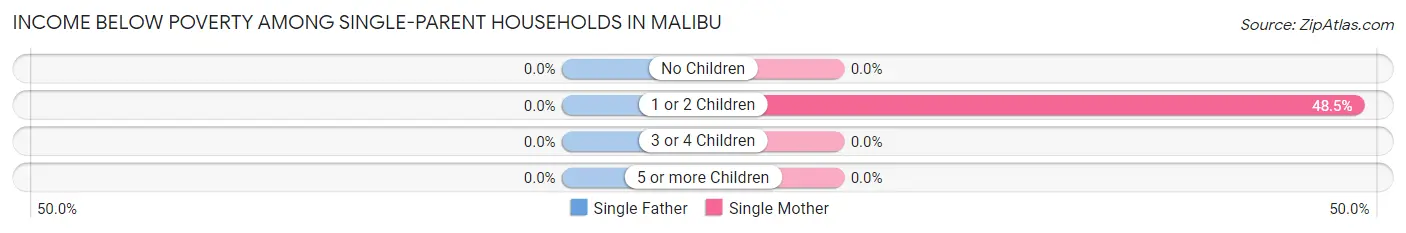
Income Below Poverty Among Single-Parent Households in Malibu
| Children | Single Father | Single Mother |
| No Children | 0 (0.0%) | 0 (0.0%) |
| 1 or 2 Children | 0 (0.0%) | 48 (48.5%) |
| 3 or 4 Children | 0 (0.0%) | 0 (0.0%) |
| 5 or more Children | 0 (0.0%) | 0 (0.0%) |
| Total | 0 (0.0%) | 48 (18.0%) |
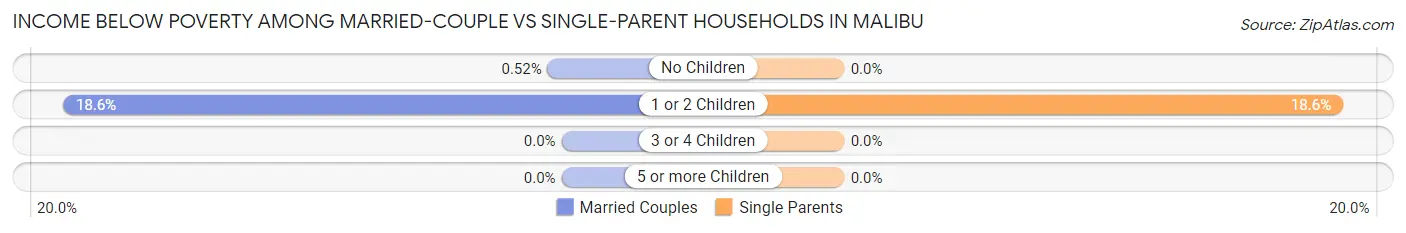
Income Below Poverty Among Married-Couple vs Single-Parent Households in Malibu
The poverty data for Malibu shows that 120 of the married-couple family households (5.2%) and 48 of the single-parent households (10.4%) are living below the poverty level. Within the married-couple family households, those with 1 or 2 children have the highest poverty rate, with 112 households (18.6%) falling below the poverty line. Among the single-parent households, those with 1 or 2 children have the highest poverty rate, with 48 household (18.6%) living below poverty.
| Children | Married-Couple Families | Single-Parent Households |
| No Children | 8 (0.5%) | 0 (0.0%) |
| 1 or 2 Children | 112 (18.6%) | 48 (18.6%) |
| 3 or 4 Children | 0 (0.0%) | 0 (0.0%) |
| 5 or more Children | 0 (0.0%) | 0 (0.0%) |
| Total | 120 (5.2%) | 48 (10.4%) |
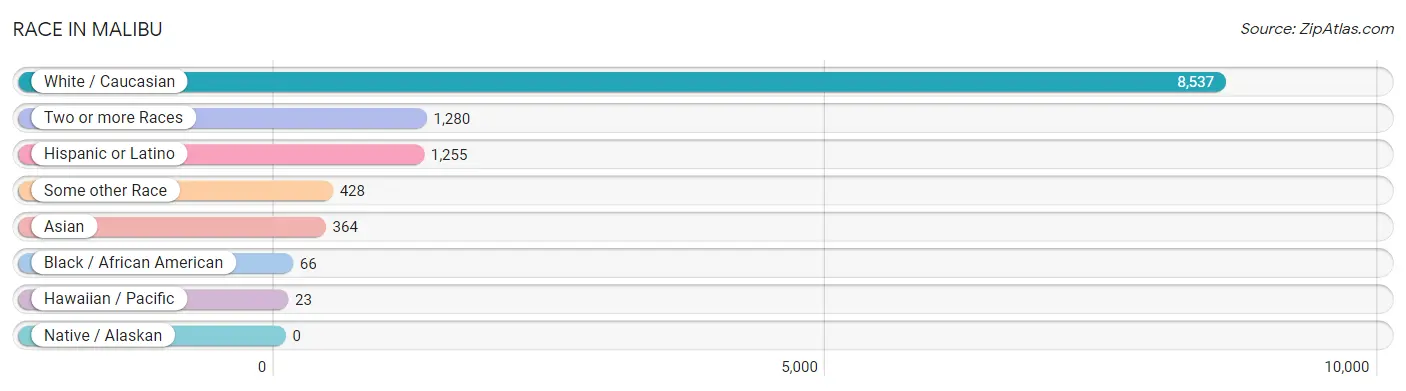
Race in Malibu
The most populous races in Malibu are White / Caucasian (8,537 | 79.8%), Two or more Races (1,280 | 12.0%), and Hispanic or Latino (1,255 | 11.7%).
| Race | # Population | % Population |
| Asian | 364 | 3.4% |
| Black / African American | 66 | 0.6% |
| Hawaiian / Pacific | 23 | 0.2% |
| Hispanic or Latino | 1,255 | 11.7% |
| Native / Alaskan | 0 | 0.0% |
| White / Caucasian | 8,537 | 79.8% |
| Two or more Races | 1,280 | 12.0% |
| Some other Race | 428 | 4.0% |
| Total | 10,698 | 100.0% |
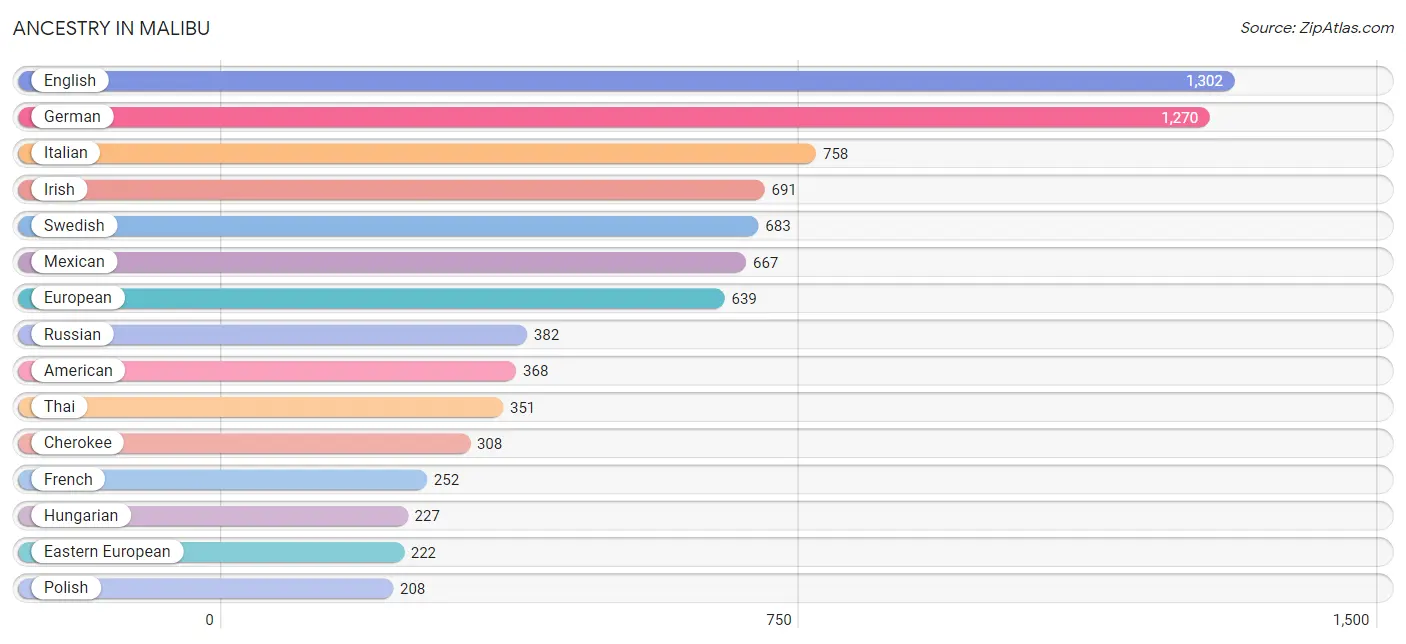
Ancestry in Malibu
The most populous ancestries reported in Malibu are English (1,302 | 12.2%), German (1,270 | 11.9%), Italian (758 | 7.1%), Irish (691 | 6.5%), and Swedish (683 | 6.4%), together accounting for 44.0% of all Malibu residents.
| Ancestry | # Population | % Population |
| American | 368 | 3.4% |
| Argentinean | 110 | 1.0% |
| Armenian | 89 | 0.8% |
| Australian | 35 | 0.3% |
| Belgian | 67 | 0.6% |
| Belizean | 26 | 0.2% |
| Bhutanese | 165 | 1.5% |
| British | 165 | 1.5% |
| Burmese | 89 | 0.8% |
| Canadian | 17 | 0.2% |
| Central American | 191 | 1.8% |
| Cherokee | 308 | 2.9% |
| Chilean | 9 | 0.1% |
| Colombian | 36 | 0.3% |
| Cuban | 56 | 0.5% |
| Czech | 48 | 0.4% |
| Danish | 72 | 0.7% |
| Dutch | 158 | 1.5% |
| Eastern European | 222 | 2.1% |
| Ecuadorian | 29 | 0.3% |
| English | 1,302 | 12.2% |
| European | 639 | 6.0% |
| French | 252 | 2.4% |
| French Canadian | 25 | 0.2% |
| German | 1,270 | 11.9% |
| Greek | 31 | 0.3% |
| Guatemalan | 188 | 1.8% |
| Hungarian | 227 | 2.1% |
| Indian (Asian) | 133 | 1.2% |
| Iranian | 128 | 1.2% |
| Irish | 691 | 6.5% |
| Iroquois | 35 | 0.3% |
| Israeli | 7 | 0.1% |
| Italian | 758 | 7.1% |
| Korean | 50 | 0.5% |
| Lithuanian | 138 | 1.3% |
| Malaysian | 1 | 0.0% |
| Mexican | 667 | 6.2% |
| Native Hawaiian | 19 | 0.2% |
| Northern European | 69 | 0.6% |
| Norwegian | 98 | 0.9% |
| Okinawan | 12 | 0.1% |
| Polish | 208 | 1.9% |
| Portuguese | 20 | 0.2% |
| Puerto Rican | 43 | 0.4% |
| Romanian | 71 | 0.7% |
| Russian | 382 | 3.6% |
| Salvadoran | 3 | 0.0% |
| Samoan | 23 | 0.2% |
| Scandinavian | 41 | 0.4% |
| Scotch-Irish | 118 | 1.1% |
| Scottish | 151 | 1.4% |
| Slavic | 24 | 0.2% |
| Slovak | 7 | 0.1% |
| South African | 11 | 0.1% |
| South American | 184 | 1.7% |
| Spaniard | 60 | 0.6% |
| Spanish | 22 | 0.2% |
| Sri Lankan | 16 | 0.2% |
| Subsaharan African | 28 | 0.3% |
| Swedish | 683 | 6.4% |
| Swiss | 30 | 0.3% |
| Thai | 351 | 3.3% |
| Ukrainian | 11 | 0.1% |
| Welsh | 17 | 0.2% |
| Yugoslavian | 17 | 0.2% | View All 66 Rows |
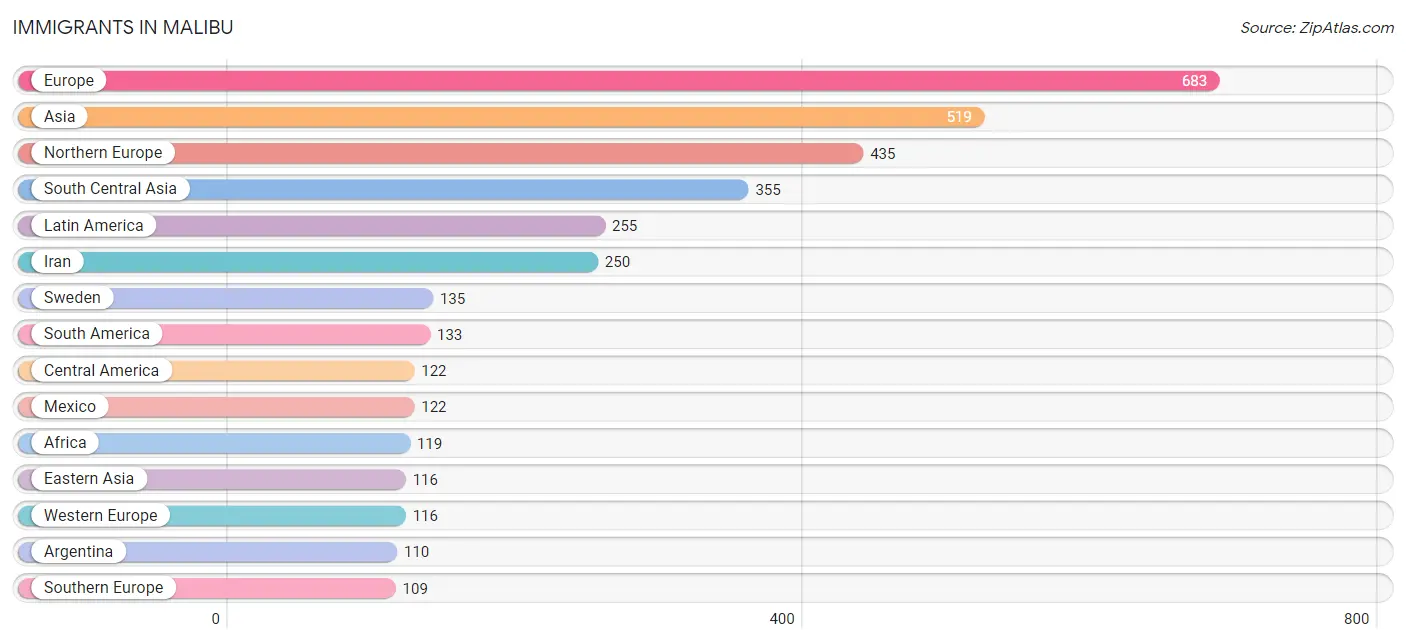
Immigrants in Malibu
The most numerous immigrant groups reported in Malibu came from Europe (683 | 6.4%), Asia (519 | 4.9%), Northern Europe (435 | 4.1%), South Central Asia (355 | 3.3%), and Latin America (255 | 2.4%), together accounting for 21.0% of all Malibu residents.
| Immigration Origin | # Population | % Population |
| Afghanistan | 40 | 0.4% |
| Africa | 119 | 1.1% |
| Argentina | 110 | 1.0% |
| Asia | 519 | 4.9% |
| Australia | 41 | 0.4% |
| Canada | 35 | 0.3% |
| Central America | 122 | 1.1% |
| Chile | 5 | 0.1% |
| China | 61 | 0.6% |
| Colombia | 18 | 0.2% |
| Denmark | 3 | 0.0% |
| Eastern Africa | 9 | 0.1% |
| Eastern Asia | 116 | 1.1% |
| Eastern Europe | 23 | 0.2% |
| Egypt | 15 | 0.1% |
| England | 103 | 1.0% |
| Europe | 683 | 6.4% |
| France | 66 | 0.6% |
| Germany | 40 | 0.4% |
| Hungary | 23 | 0.2% |
| India | 51 | 0.5% |
| Iran | 250 | 2.3% |
| Israel | 9 | 0.1% |
| Italy | 70 | 0.6% |
| Japan | 24 | 0.2% |
| Kazakhstan | 14 | 0.1% |
| Kenya | 9 | 0.1% |
| Korea | 31 | 0.3% |
| Latin America | 255 | 2.4% |
| Mexico | 122 | 1.1% |
| Netherlands | 10 | 0.1% |
| Northern Africa | 47 | 0.4% |
| Northern Europe | 435 | 4.1% |
| Oceania | 49 | 0.5% |
| Philippines | 27 | 0.3% |
| Portugal | 24 | 0.2% |
| Scotland | 10 | 0.1% |
| Singapore | 12 | 0.1% |
| South Africa | 63 | 0.6% |
| South America | 133 | 1.2% |
| South Central Asia | 355 | 3.3% |
| South Eastern Asia | 39 | 0.4% |
| Southern Europe | 109 | 1.0% |
| Spain | 15 | 0.1% |
| Sweden | 135 | 1.3% |
| Taiwan | 9 | 0.1% |
| Western Asia | 9 | 0.1% |
| Western Europe | 116 | 1.1% | View All 48 Rows |
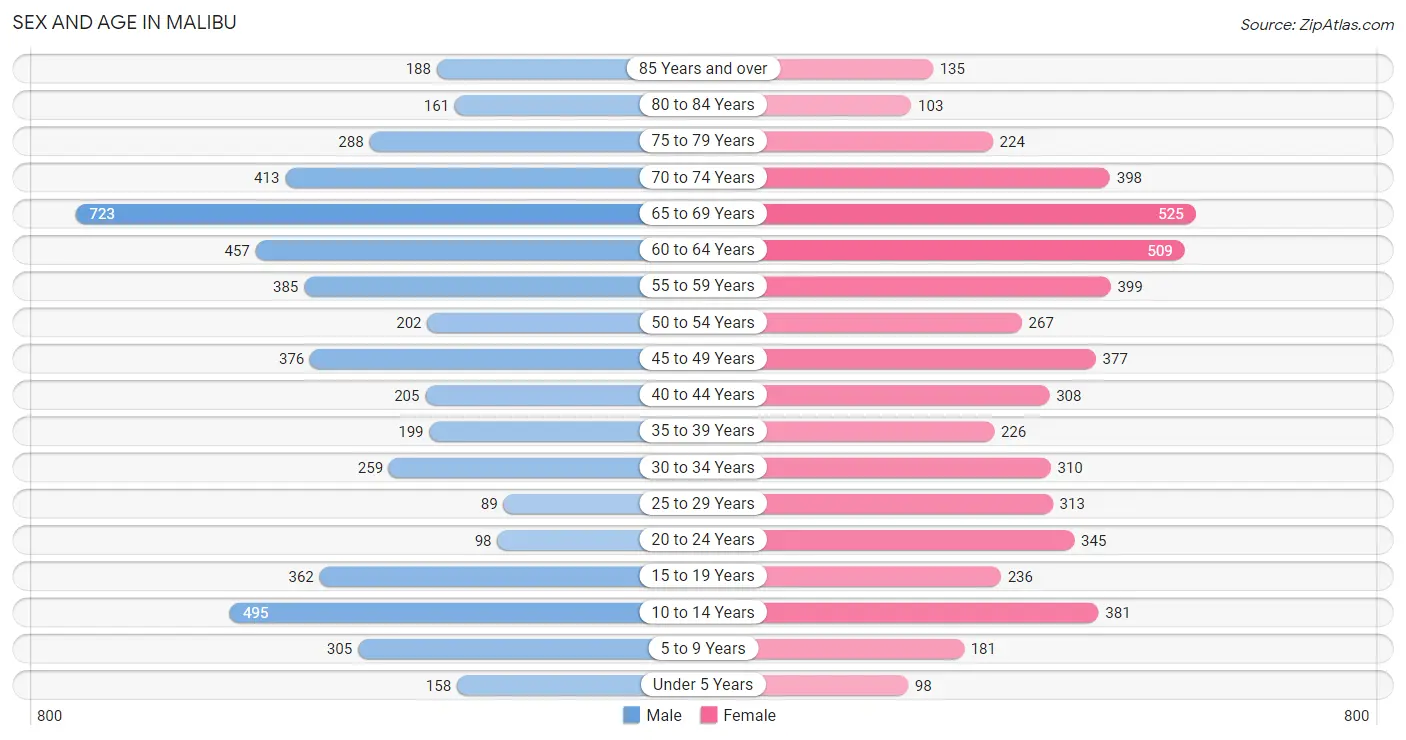
Sex and Age in Malibu
Sex and Age in Malibu
The most populous age groups in Malibu are 65 to 69 Years (723 | 13.5%) for men and 65 to 69 Years (525 | 9.8%) for women.
| Age Bracket | Male | Female |
| Under 5 Years | 158 (2.9%) | 98 (1.8%) |
| 5 to 9 Years | 305 (5.7%) | 181 (3.4%) |
| 10 to 14 Years | 495 (9.2%) | 381 (7.1%) |
| 15 to 19 Years | 362 (6.8%) | 236 (4.4%) |
| 20 to 24 Years | 98 (1.8%) | 345 (6.5%) |
| 25 to 29 Years | 89 (1.7%) | 313 (5.9%) |
| 30 to 34 Years | 259 (4.8%) | 310 (5.8%) |
| 35 to 39 Years | 199 (3.7%) | 226 (4.2%) |
| 40 to 44 Years | 205 (3.8%) | 308 (5.8%) |
| 45 to 49 Years | 376 (7.0%) | 377 (7.1%) |
| 50 to 54 Years | 202 (3.8%) | 267 (5.0%) |
| 55 to 59 Years | 385 (7.2%) | 399 (7.5%) |
| 60 to 64 Years | 457 (8.5%) | 509 (9.5%) |
| 65 to 69 Years | 723 (13.5%) | 525 (9.8%) |
| 70 to 74 Years | 413 (7.7%) | 398 (7.5%) |
| 75 to 79 Years | 288 (5.4%) | 224 (4.2%) |
| 80 to 84 Years | 161 (3.0%) | 103 (1.9%) |
| 85 Years and over | 188 (3.5%) | 135 (2.5%) |
| Total | 5,363 (100.0%) | 5,335 (100.0%) |
Families and Households in Malibu
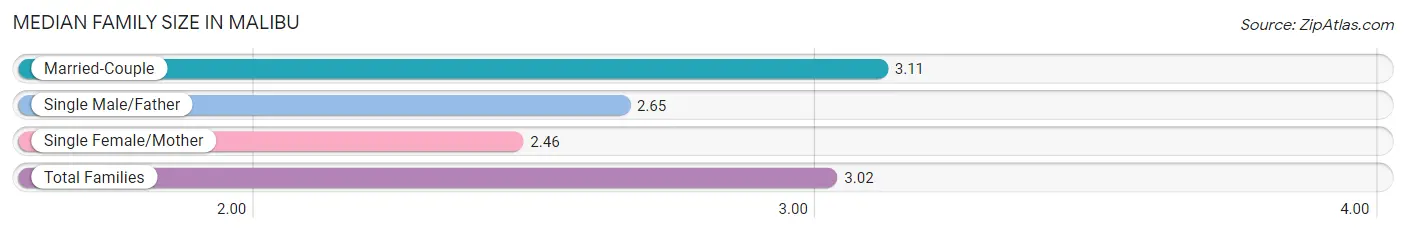
Median Family Size in Malibu
The median family size in Malibu is 3.02 persons per family, with married-couple families (2,322 | 83.4%) accounting for the largest median family size of 3.11 persons per family. On the other hand, single female/mother families (266 | 9.6%) represent the smallest median family size with 2.46 persons per family.
| Family Type | # Families | Family Size |
| Married-Couple | 2,322 (83.4%) | 3.11 |
| Single Male/Father | 196 (7.0%) | 2.65 |
| Single Female/Mother | 266 (9.6%) | 2.46 |
| Total Families | 2,784 (100.0%) | 3.02 |
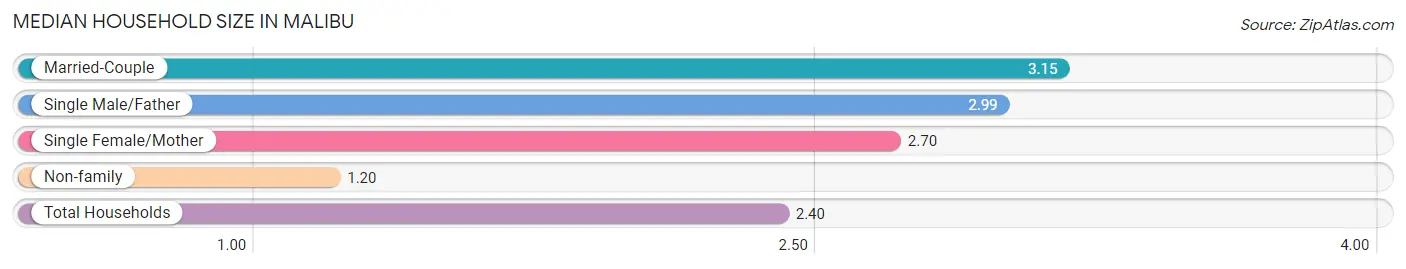
Median Household Size in Malibu
The median household size in Malibu is 2.40 persons per household, with married-couple households (2,322 | 52.8%) accounting for the largest median household size of 3.15 persons per household. non-family households (1,617 | 36.7%) represent the smallest median household size with 1.20 persons per household.
| Household Type | # Households | Household Size |
| Married-Couple | 2,322 (52.8%) | 3.15 |
| Single Male/Father | 196 (4.4%) | 2.99 |
| Single Female/Mother | 266 (6.0%) | 2.70 |
| Non-family | 1,617 (36.7%) | 1.20 |
| Total Households | 4,401 (100.0%) | 2.40 |
Household Size by Marriage Status in Malibu
Out of a total of 4,401 households in Malibu, 2,784 (63.3%) are family households, while 1,617 (36.7%) are nonfamily households. The most numerous type of family households are 2-person households, comprising 1,321, and the most common type of nonfamily households are 1-person households, comprising 1,357.
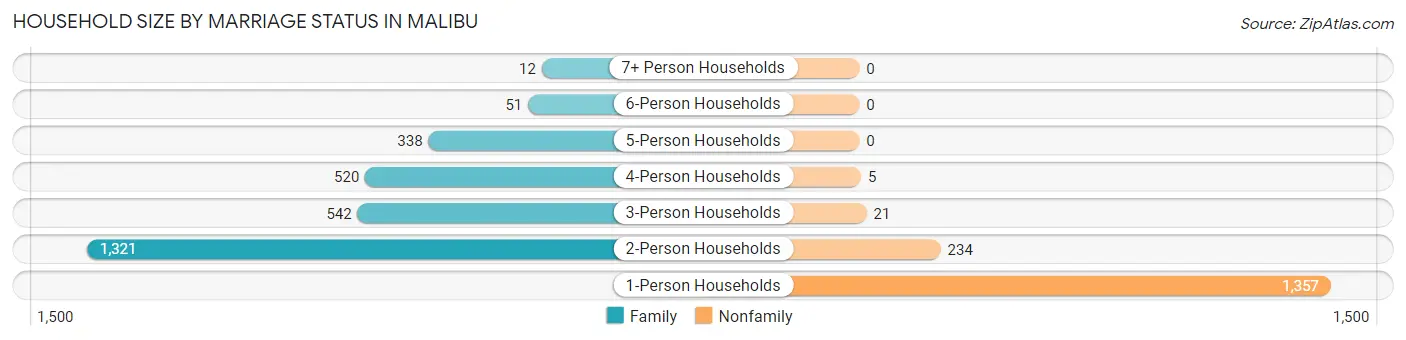
| Household Size | Family Households | Nonfamily Households |
| 1-Person Households | - | 1,357 (30.8%) |
| 2-Person Households | 1,321 (30.0%) | 234 (5.3%) |
| 3-Person Households | 542 (12.3%) | 21 (0.5%) |
| 4-Person Households | 520 (11.8%) | 5 (0.1%) |
| 5-Person Households | 338 (7.7%) | 0 (0.0%) |
| 6-Person Households | 51 (1.2%) | 0 (0.0%) |
| 7+ Person Households | 12 (0.3%) | 0 (0.0%) |
| Total | 2,784 (63.3%) | 1,617 (36.7%) |
Female Fertility in Malibu
Fertility by Age in Malibu
Average fertility rate in Malibu is 32.0 births per 1,000 women. Women in the age bracket of 35 to 50 years have the highest fertility rate with 66.0 births per 1,000 women. Women in the age bracket of 35 to 50 years acount for 92.9% of all women with births.
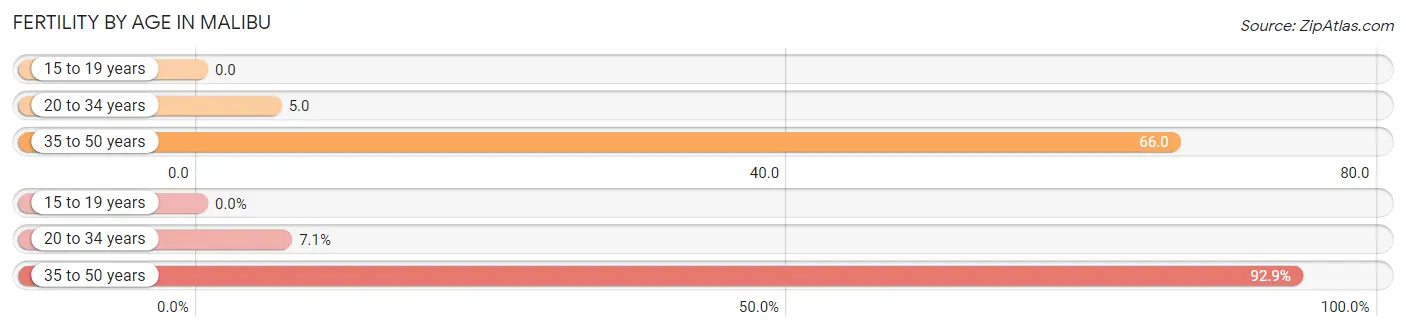
| Age Bracket | Women with Births | Births / 1,000 Women |
| 15 to 19 years | 0 (0.0%) | 0.0 |
| 20 to 34 years | 5 (7.1%) | 5.0 |
| 35 to 50 years | 65 (92.9%) | 66.0 |
| Total | 70 (100.0%) | 32.0 |
Fertility by Age by Marriage Status in Malibu
24.3% of women with births (70) in Malibu are married. The highest percentage of unmarried women with births falls into 35 to 50 years age bracket with 81.5% of them unmarried at the time of birth, while the lowest percentage of unmarried women with births belong to 20 to 34 years age bracket with 0.0% of them unmarried.
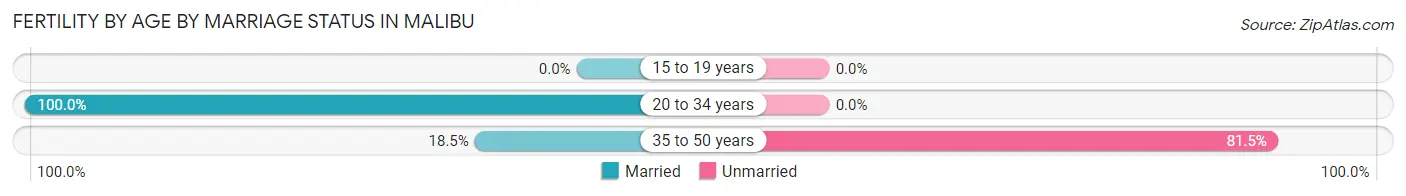
| Age Bracket | Married | Unmarried |
| 15 to 19 years | 0 (0.0%) | 0 (0.0%) |
| 20 to 34 years | 5 (100.0%) | 0 (0.0%) |
| 35 to 50 years | 12 (18.5%) | 53 (81.5%) |
| Total | 17 (24.3%) | 53 (75.7%) |
Fertility by Education in Malibu
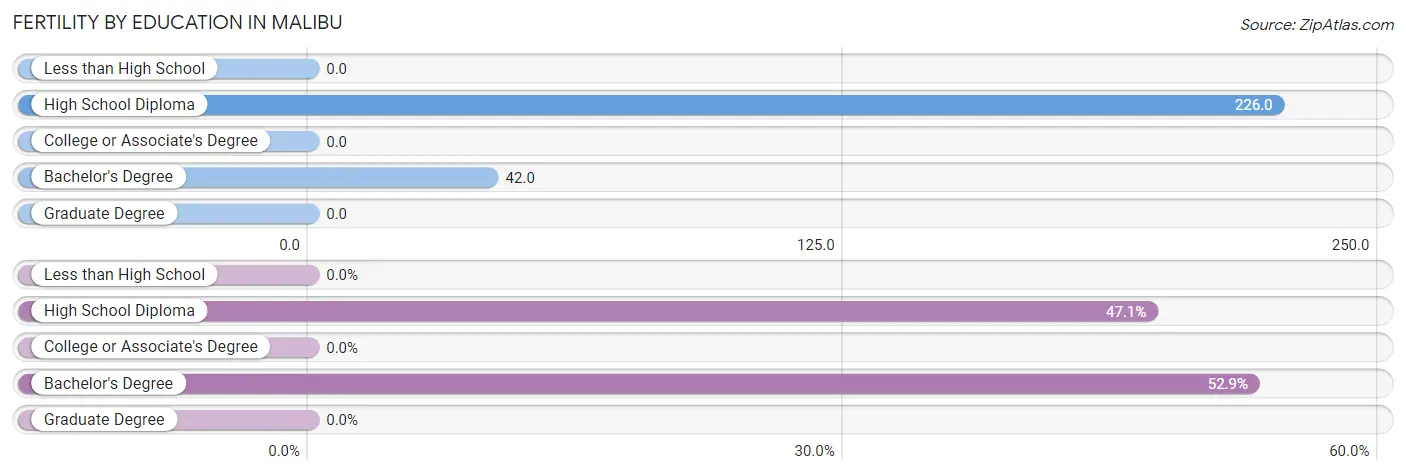
| Educational Attainment | Women with Births | Births / 1,000 Women |
| Less than High School | 0 (0.0%) | 0.0 |
| High School Diploma | 33 (47.1%) | 226.0 |
| College or Associate's Degree | 0 (0.0%) | 0.0 |
| Bachelor's Degree | 37 (52.9%) | 42.0 |
| Graduate Degree | 0 (0.0%) | 0.0 |
| Total | 70 (100.0%) | 32.0 |
Fertility by Education by Marriage Status in Malibu
75.7% of women with births in Malibu are unmarried. Women with the educational attainment of bachelor's degree are most likely to be married with 32.4% of them married at childbirth, while women with the educational attainment of high school diploma are least likely to be married with 84.9% of them unmarried at childbirth.
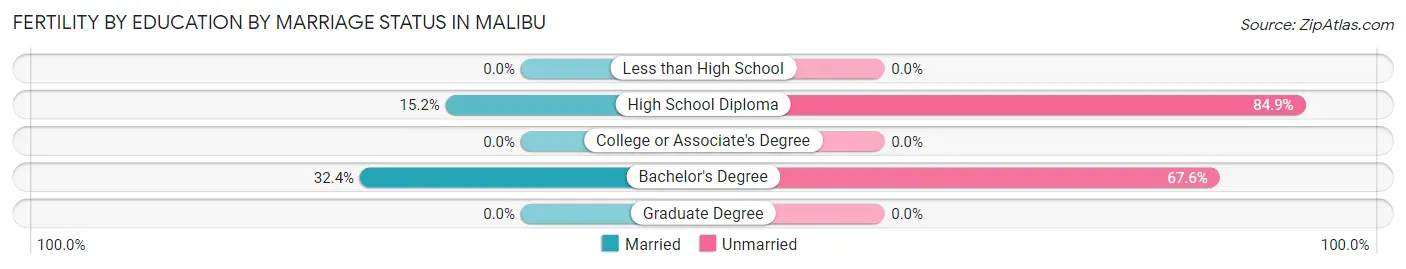
| Educational Attainment | Married | Unmarried |
| Less than High School | 0 (0.0%) | 0 (0.0%) |
| High School Diploma | 5 (15.1%) | 28 (84.9%) |
| College or Associate's Degree | 0 (0.0%) | 0 (0.0%) |
| Bachelor's Degree | 12 (32.4%) | 25 (67.6%) |
| Graduate Degree | 0 (0.0%) | 0 (0.0%) |
| Total | 17 (24.3%) | 53 (75.7%) |
Employment Characteristics in Malibu
Employment by Class of Employer in Malibu
Among the 4,585 employed individuals in Malibu, private company employees (2,087 | 45.5%), self-employed (not incorporated) (937 | 20.4%), and self-employed (incorporated) (898 | 19.6%) make up the most common classes of employment.
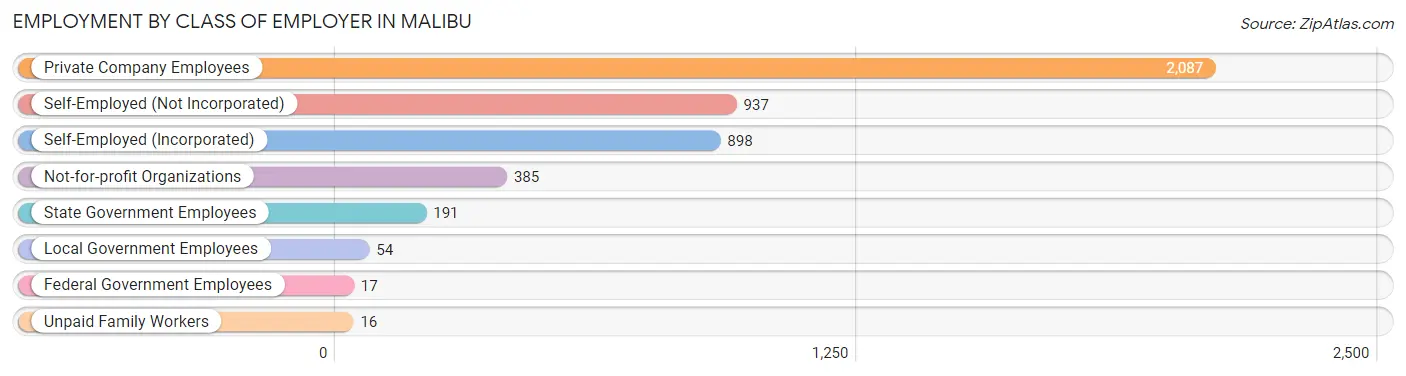
| Employer Class | # Employees | % Employees |
| Private Company Employees | 2,087 | 45.5% |
| Self-Employed (Incorporated) | 898 | 19.6% |
| Self-Employed (Not Incorporated) | 937 | 20.4% |
| Not-for-profit Organizations | 385 | 8.4% |
| Local Government Employees | 54 | 1.2% |
| State Government Employees | 191 | 4.2% |
| Federal Government Employees | 17 | 0.4% |
| Unpaid Family Workers | 16 | 0.4% |
| Total | 4,585 | 100.0% |
Employment Status by Age in Malibu
According to the labor force statistics for Malibu, out of the total population over 16 years of age (8,889), 56.7% or 5,040 individuals are in the labor force, with 5.5% or 277 of them unemployed. The age group with the highest labor force participation rate is 45 to 54 years, with 79.6% or 973 individuals in the labor force. Within the labor force, the 20 to 24 years age range has the highest percentage of unemployed individuals, with 20.4% or 45 of them being unemployed.
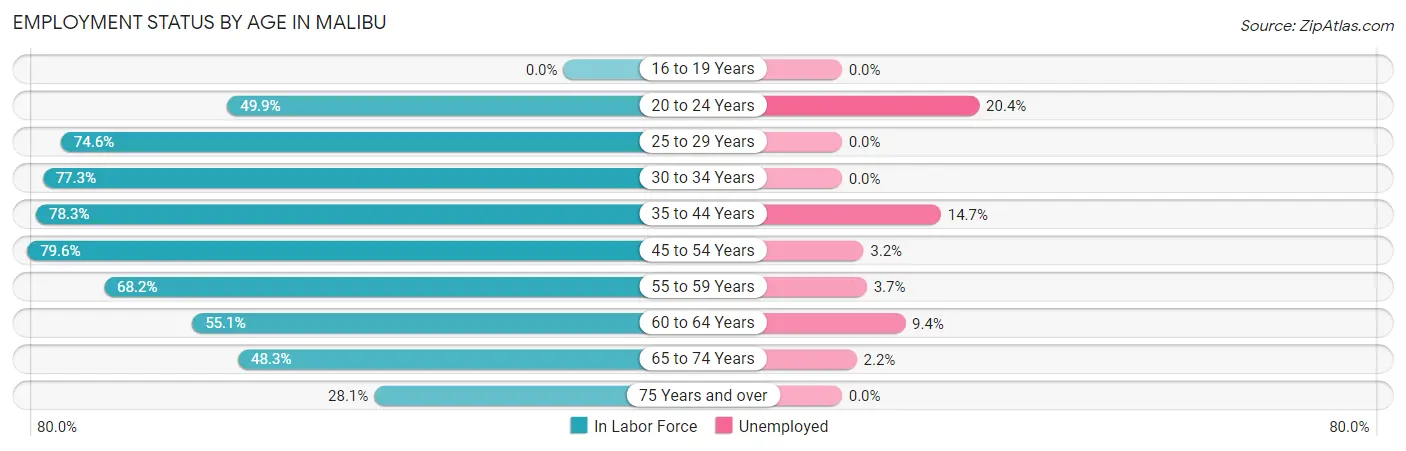
| Age Bracket | In Labor Force | Unemployed |
| 16 to 19 Years | 0 (0.0%) | 0 (0.0%) |
| 20 to 24 Years | 221 (49.9%) | 45 (20.4%) |
| 25 to 29 Years | 300 (74.6%) | 0 (0.0%) |
| 30 to 34 Years | 440 (77.3%) | 0 (0.0%) |
| 35 to 44 Years | 734 (78.3%) | 108 (14.7%) |
| 45 to 54 Years | 973 (79.6%) | 31 (3.2%) |
| 55 to 59 Years | 535 (68.2%) | 20 (3.7%) |
| 60 to 64 Years | 532 (55.1%) | 50 (9.4%) |
| 65 to 74 Years | 994 (48.3%) | 22 (2.2%) |
| 75 Years and over | 309 (28.1%) | 0 (0.0%) |
| Total | 5,040 (56.7%) | 277 (5.5%) |
Employment Status by Educational Attainment in Malibu
According to labor force statistics for Malibu, 72.0% of individuals (3,514) out of the total population between 25 and 64 years of age (4,881) are in the labor force, with 5.9% or 207 of them being unemployed. The group with the highest labor force participation rate are those with the educational attainment of bachelor's degree or higher, with 74.3% or 2,548 individuals in the labor force. Within the labor force, individuals with high school diploma education have the highest percentage of unemployment, with 16.3% or 51 of them being unemployed.
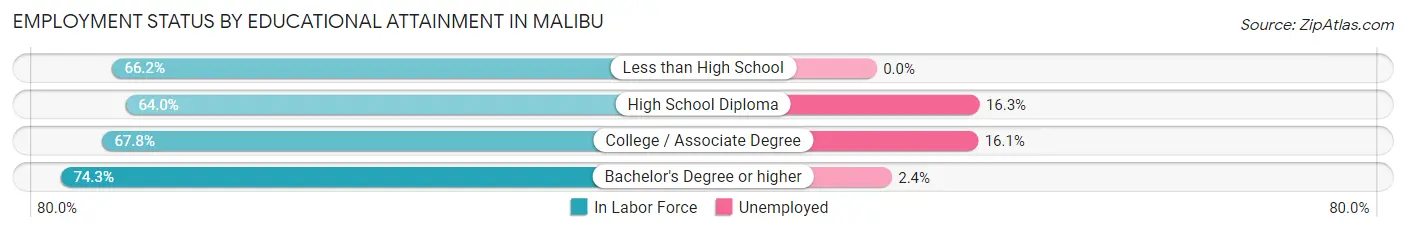
| Educational Attainment | In Labor Force | Unemployed |
| Less than High School | 43 (66.2%) | 0 (0.0%) |
| High School Diploma | 313 (64.0%) | 80 (16.3%) |
| College / Associate Degree | 609 (67.8%) | 145 (16.1%) |
| Bachelor's Degree or higher | 2,548 (74.3%) | 82 (2.4%) |
| Total | 3,514 (72.0%) | 288 (5.9%) |
Employment Occupations by Sex in Malibu
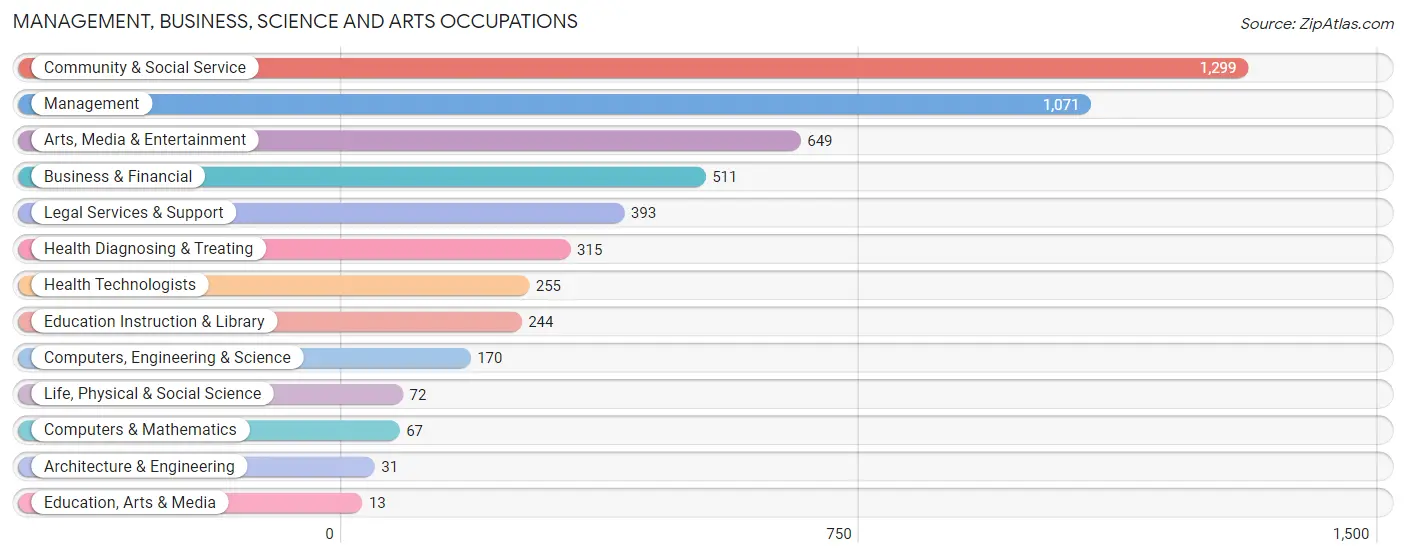
Management, Business, Science and Arts Occupations
The most common Management, Business, Science and Arts occupations in Malibu are Community & Social Service (1,299 | 27.3%), Management (1,071 | 22.5%), Arts, Media & Entertainment (649 | 13.6%), Business & Financial (511 | 10.7%), and Legal Services & Support (393 | 8.3%).
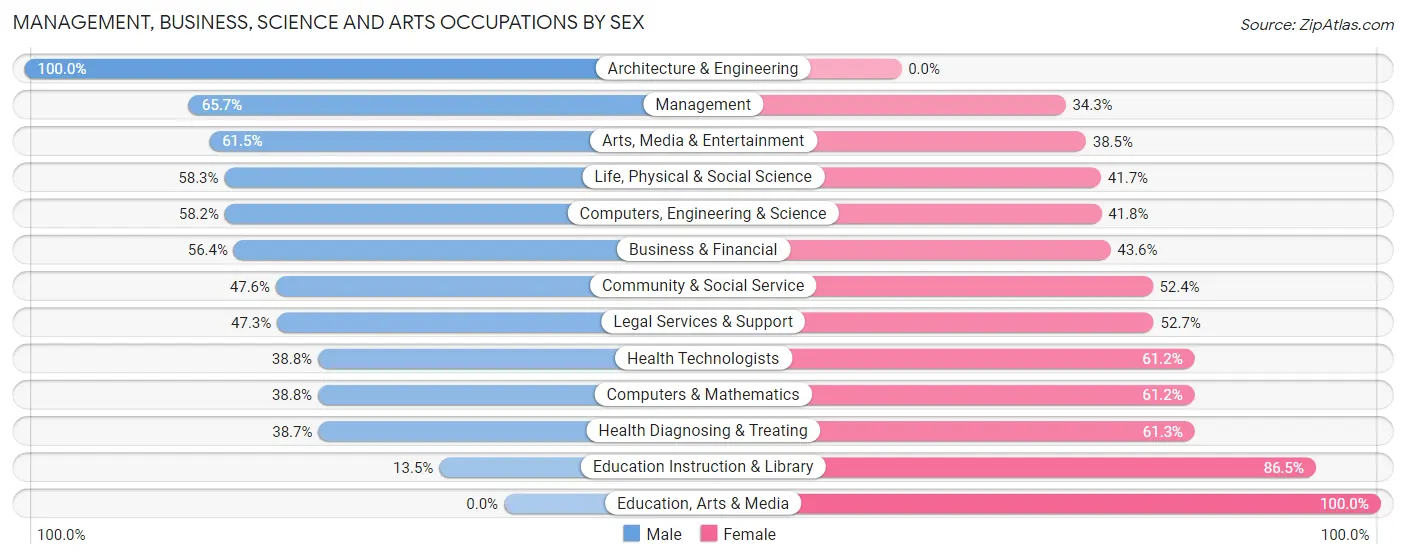
Management, Business, Science and Arts Occupations by Sex
Within the Management, Business, Science and Arts occupations in Malibu, the most male-oriented occupations are Architecture & Engineering (100.0%), Management (65.7%), and Arts, Media & Entertainment (61.5%), while the most female-oriented occupations are Education, Arts & Media (100.0%), Education Instruction & Library (86.5%), and Health Diagnosing & Treating (61.3%).
| Occupation | Male | Female |
| Management | 704 (65.7%) | 367 (34.3%) |
| Business & Financial | 288 (56.4%) | 223 (43.6%) |
| Computers, Engineering & Science | 99 (58.2%) | 71 (41.8%) |
| Computers & Mathematics | 26 (38.8%) | 41 (61.2%) |
| Architecture & Engineering | 31 (100.0%) | 0 (0.0%) |
| Life, Physical & Social Science | 42 (58.3%) | 30 (41.7%) |
| Community & Social Service | 618 (47.6%) | 681 (52.4%) |
| Education, Arts & Media | 0 (0.0%) | 13 (100.0%) |
| Legal Services & Support | 186 (47.3%) | 207 (52.7%) |
| Education Instruction & Library | 33 (13.5%) | 211 (86.5%) |
| Arts, Media & Entertainment | 399 (61.5%) | 250 (38.5%) |
| Health Diagnosing & Treating | 122 (38.7%) | 193 (61.3%) |
| Health Technologists | 99 (38.8%) | 156 (61.2%) |
| Total (Category) | 1,831 (54.4%) | 1,535 (45.6%) |
| Total (Overall) | 2,760 (58.0%) | 2,003 (42.0%) |
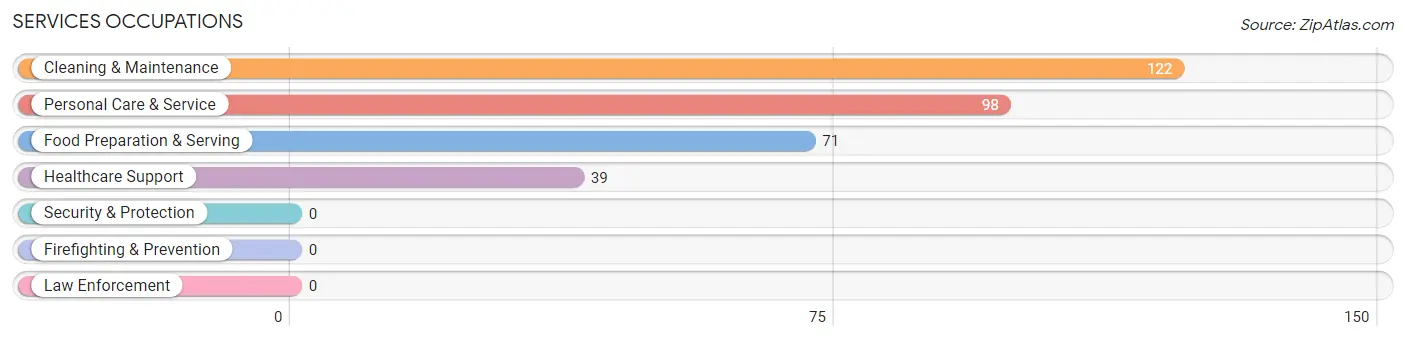
Services Occupations
The most common Services occupations in Malibu are Cleaning & Maintenance (122 | 2.6%), Personal Care & Service (98 | 2.1%), Food Preparation & Serving (71 | 1.5%), and Healthcare Support (39 | 0.8%).
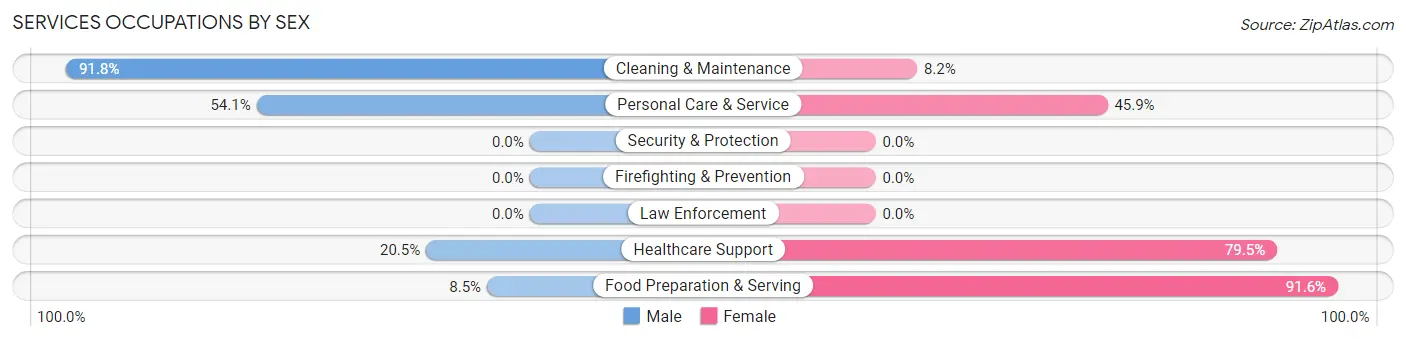
Services Occupations by Sex
Within the Services occupations in Malibu, the most male-oriented occupations are Cleaning & Maintenance (91.8%), Personal Care & Service (54.1%), and Healthcare Support (20.5%), while the most female-oriented occupations are Food Preparation & Serving (91.5%), Healthcare Support (79.5%), and Personal Care & Service (45.9%).
| Occupation | Male | Female |
| Healthcare Support | 8 (20.5%) | 31 (79.5%) |
| Security & Protection | 0 (0.0%) | 0 (0.0%) |
| Firefighting & Prevention | 0 (0.0%) | 0 (0.0%) |
| Law Enforcement | 0 (0.0%) | 0 (0.0%) |
| Food Preparation & Serving | 6 (8.5%) | 65 (91.5%) |
| Cleaning & Maintenance | 112 (91.8%) | 10 (8.2%) |
| Personal Care & Service | 53 (54.1%) | 45 (45.9%) |
| Total (Category) | 179 (54.2%) | 151 (45.8%) |
| Total (Overall) | 2,760 (58.0%) | 2,003 (42.0%) |
Sales and Office Occupations
The most common Sales and Office occupations in Malibu are Sales & Related (637 | 13.4%), and Office & Administration (145 | 3.0%).
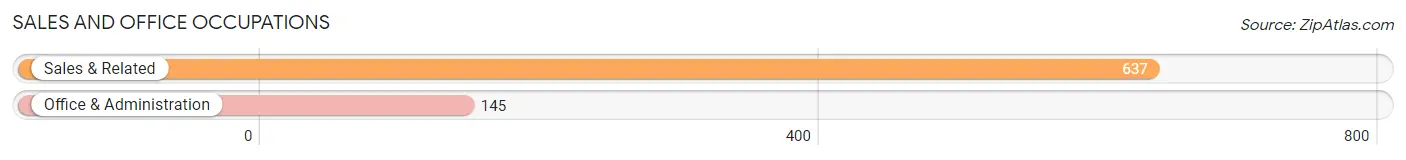
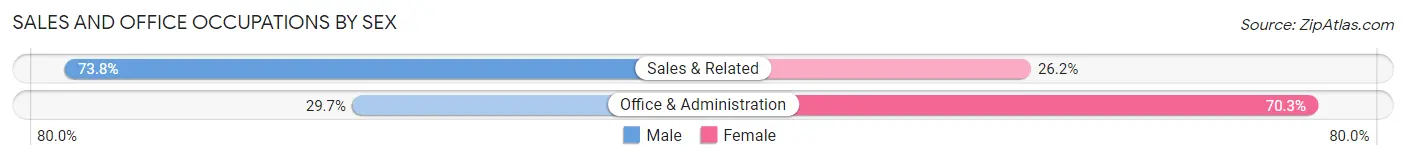
Sales and Office Occupations by Sex
| Occupation | Male | Female |
| Sales & Related | 470 (73.8%) | 167 (26.2%) |
| Office & Administration | 43 (29.7%) | 102 (70.3%) |
| Total (Category) | 513 (65.6%) | 269 (34.4%) |
| Total (Overall) | 2,760 (58.0%) | 2,003 (42.0%) |
Natural Resources, Construction and Maintenance Occupations
The most common Natural Resources, Construction and Maintenance occupations in Malibu are , and Construction & Extraction (173 | 3.6%).
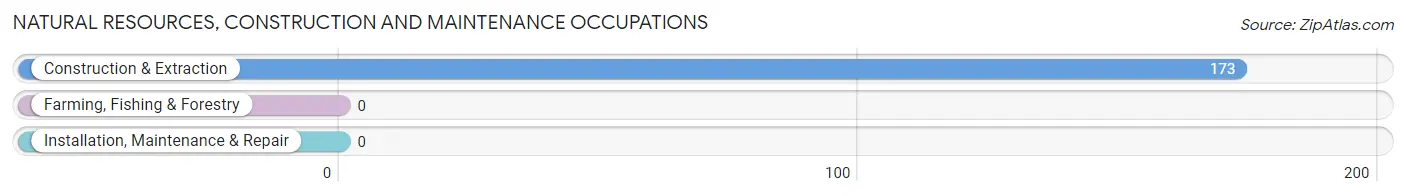
Natural Resources, Construction and Maintenance Occupations by Sex
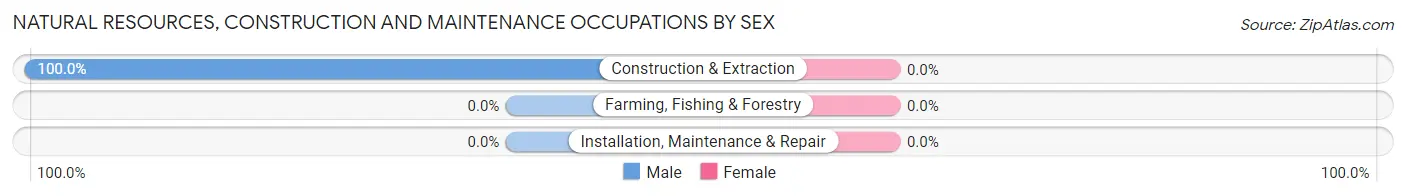
| Occupation | Male | Female |
| Farming, Fishing & Forestry | 0 (0.0%) | 0 (0.0%) |
| Construction & Extraction | 173 (100.0%) | 0 (0.0%) |
| Installation, Maintenance & Repair | 0 (0.0%) | 0 (0.0%) |
| Total (Category) | 173 (100.0%) | 0 (0.0%) |
| Total (Overall) | 2,760 (58.0%) | 2,003 (42.0%) |
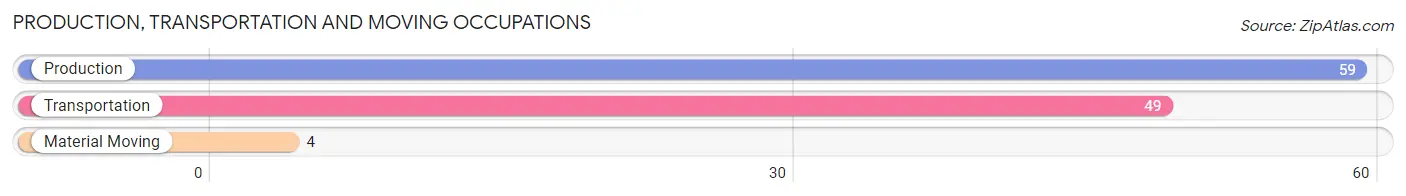
Production, Transportation and Moving Occupations
The most common Production, Transportation and Moving occupations in Malibu are Production (59 | 1.2%), Transportation (49 | 1.0%), and Material Moving (4 | 0.1%).
Production, Transportation and Moving Occupations by Sex
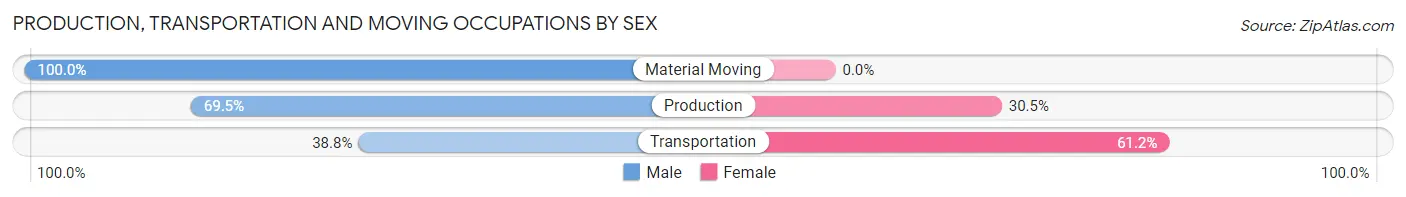
| Occupation | Male | Female |
| Production | 41 (69.5%) | 18 (30.5%) |
| Transportation | 19 (38.8%) | 30 (61.2%) |
| Material Moving | 4 (100.0%) | 0 (0.0%) |
| Total (Category) | 64 (57.1%) | 48 (42.9%) |
| Total (Overall) | 2,760 (58.0%) | 2,003 (42.0%) |
Employment Industries by Sex in Malibu
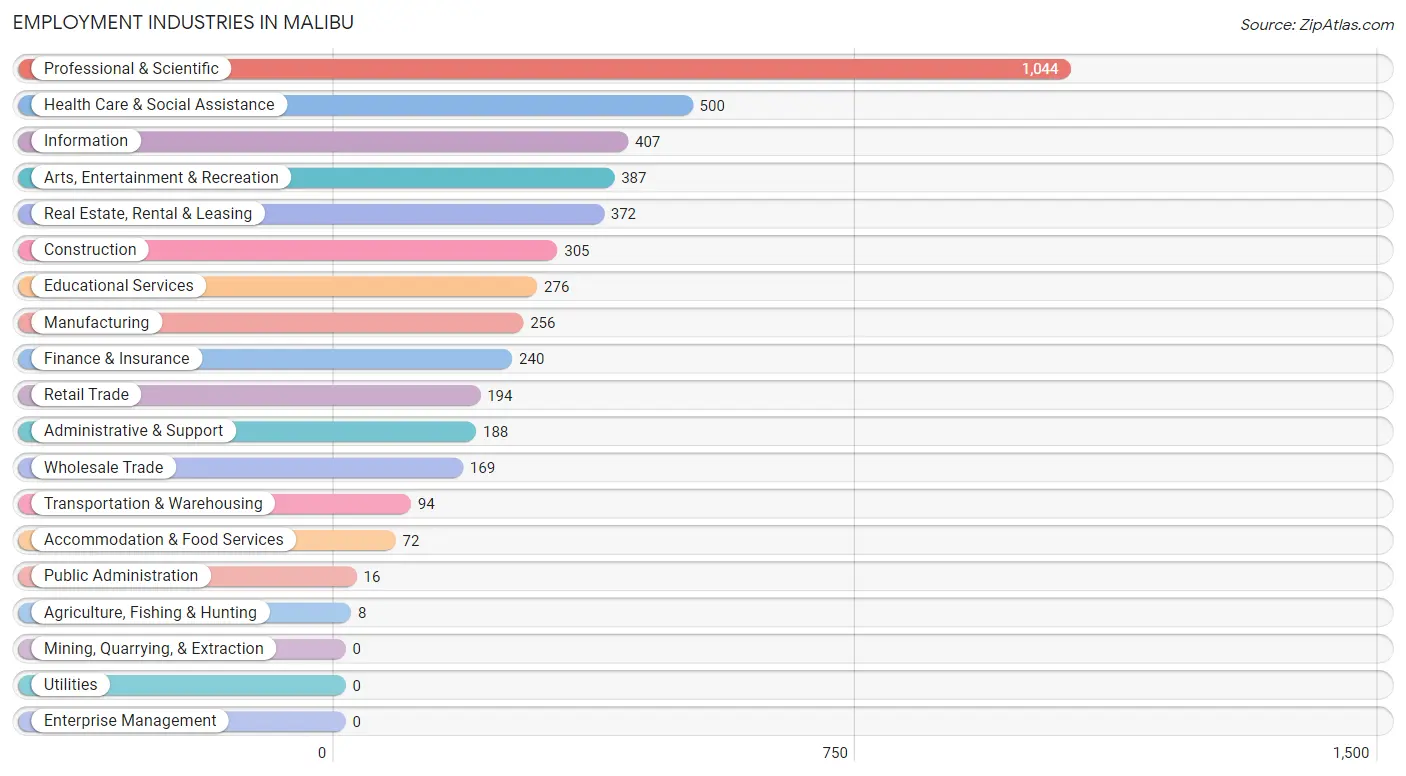
Employment Industries in Malibu
The major employment industries in Malibu include Professional & Scientific (1,044 | 21.9%), Health Care & Social Assistance (500 | 10.5%), Information (407 | 8.6%), Arts, Entertainment & Recreation (387 | 8.1%), and Real Estate, Rental & Leasing (372 | 7.8%).
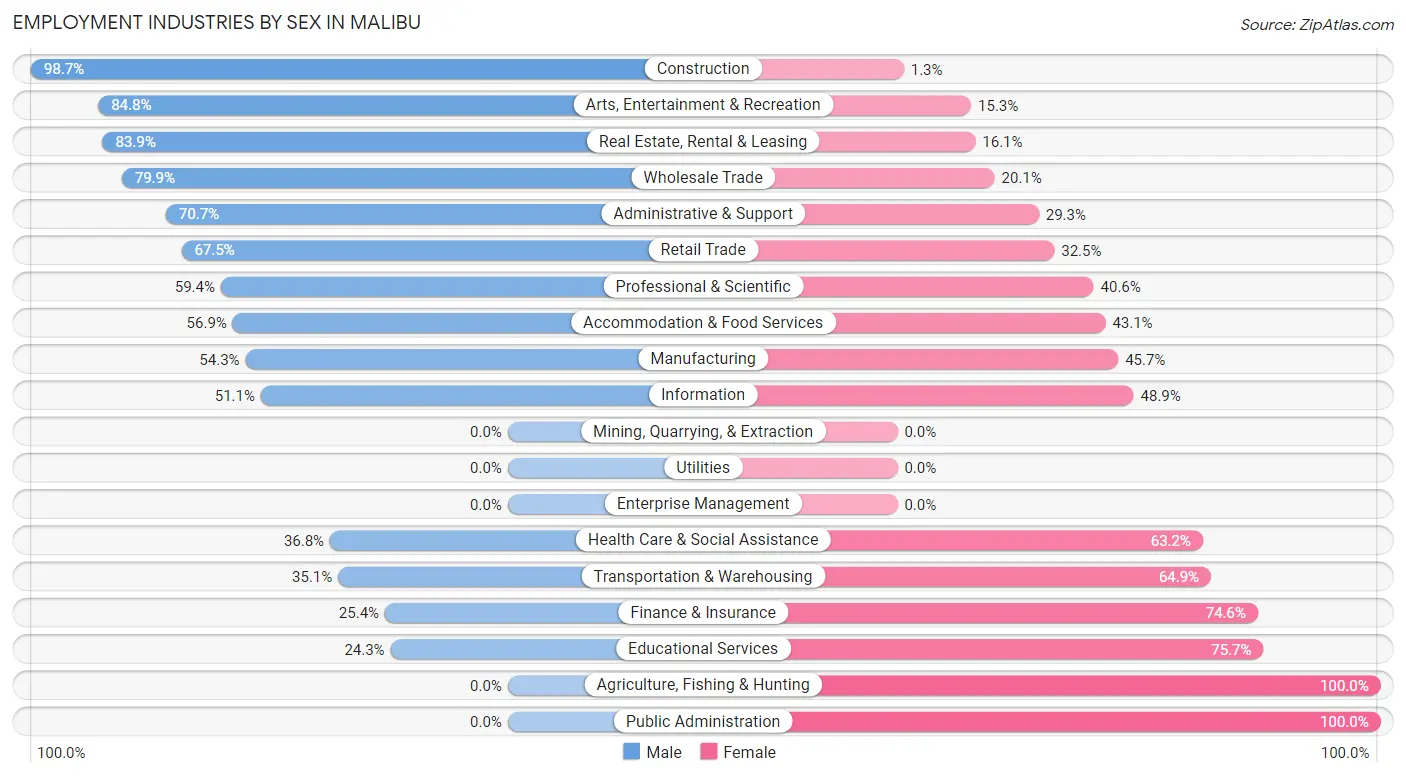
Employment Industries by Sex in Malibu
The Malibu industries that see more men than women are Construction (98.7%), Arts, Entertainment & Recreation (84.8%), and Real Estate, Rental & Leasing (83.9%), whereas the industries that tend to have a higher number of women are Agriculture, Fishing & Hunting (100.0%), Public Administration (100.0%), and Educational Services (75.7%).
| Industry | Male | Female |
| Agriculture, Fishing & Hunting | 0 (0.0%) | 8 (100.0%) |
| Mining, Quarrying, & Extraction | 0 (0.0%) | 0 (0.0%) |
| Construction | 301 (98.7%) | 4 (1.3%) |
| Manufacturing | 139 (54.3%) | 117 (45.7%) |
| Wholesale Trade | 135 (79.9%) | 34 (20.1%) |
| Retail Trade | 131 (67.5%) | 63 (32.5%) |
| Transportation & Warehousing | 33 (35.1%) | 61 (64.9%) |
| Utilities | 0 (0.0%) | 0 (0.0%) |
| Information | 208 (51.1%) | 199 (48.9%) |
| Finance & Insurance | 61 (25.4%) | 179 (74.6%) |
| Real Estate, Rental & Leasing | 312 (83.9%) | 60 (16.1%) |
| Professional & Scientific | 620 (59.4%) | 424 (40.6%) |
| Enterprise Management | 0 (0.0%) | 0 (0.0%) |
| Administrative & Support | 133 (70.7%) | 55 (29.3%) |
| Educational Services | 67 (24.3%) | 209 (75.7%) |
| Health Care & Social Assistance | 184 (36.8%) | 316 (63.2%) |
| Arts, Entertainment & Recreation | 328 (84.8%) | 59 (15.2%) |
| Accommodation & Food Services | 41 (56.9%) | 31 (43.1%) |
| Public Administration | 0 (0.0%) | 16 (100.0%) |
| Total | 2,760 (58.0%) | 2,003 (42.0%) |
Education in Malibu
School Enrollment in Malibu
The most common levels of schooling among the 2,445 students in Malibu are high school (744 | 30.4%), middle school (591 | 24.2%), and elementary school (458 | 18.7%).
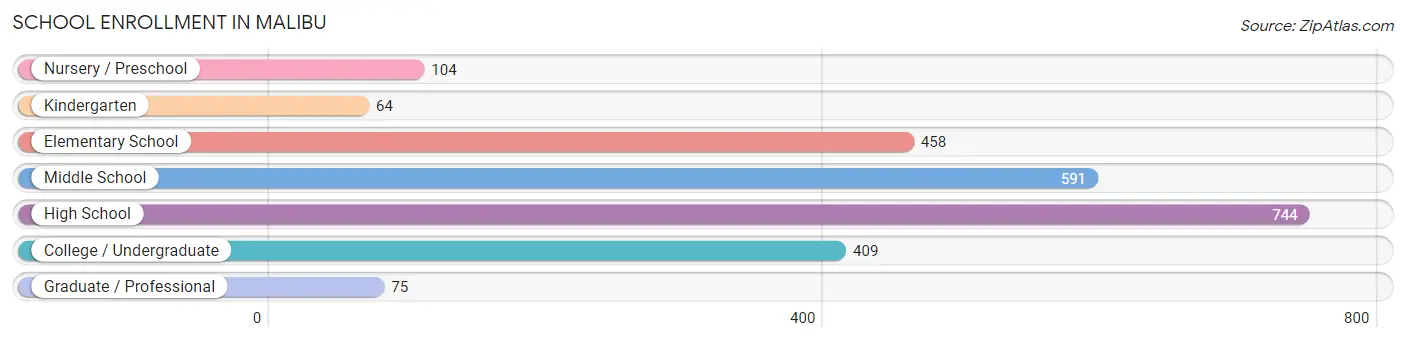
| School Level | # Students | % Students |
| Nursery / Preschool | 104 | 4.3% |
| Kindergarten | 64 | 2.6% |
| Elementary School | 458 | 18.7% |
| Middle School | 591 | 24.2% |
| High School | 744 | 30.4% |
| College / Undergraduate | 409 | 16.7% |
| Graduate / Professional | 75 | 3.1% |
| Total | 2,445 | 100.0% |
School Enrollment by Age by Funding Source in Malibu
Out of a total of 2,445 students who are enrolled in schools in Malibu, 1,144 (46.8%) attend a private institution, while the remaining 1,301 (53.2%) are enrolled in public schools. The age group of 18 to 19 year olds has the highest likelihood of being enrolled in private schools, with 34 (68.0% in the age bracket) enrolled. Conversely, the age group of 35 years and over has the lowest likelihood of being enrolled in a private school, with 76 (74.5% in the age bracket) attending a public institution.
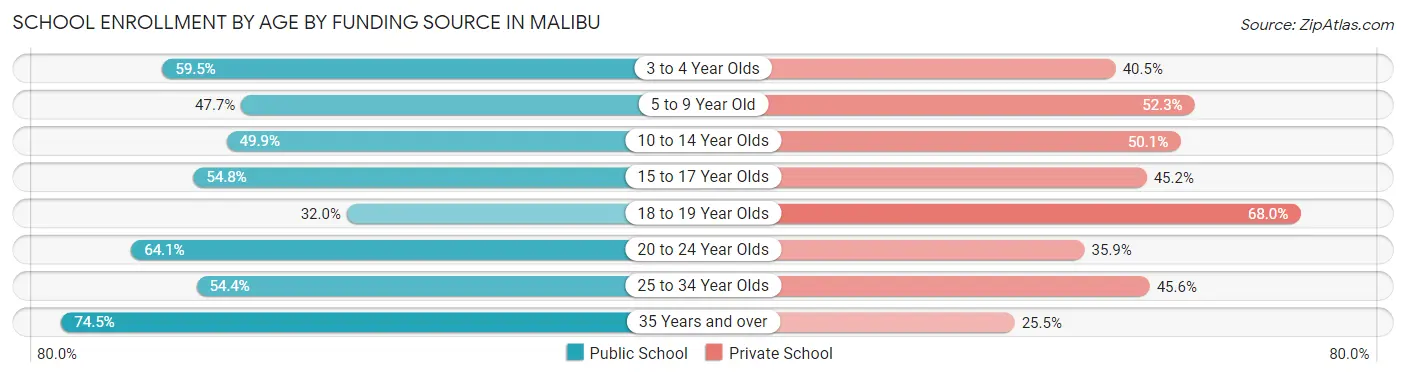
| Age Bracket | Public School | Private School |
| 3 to 4 Year Olds | 44 (59.5%) | 30 (40.5%) |
| 5 to 9 Year Old | 232 (47.7%) | 254 (52.3%) |
| 10 to 14 Year Olds | 437 (49.9%) | 439 (50.1%) |
| 15 to 17 Year Olds | 289 (54.8%) | 238 (45.2%) |
| 18 to 19 Year Olds | 16 (32.0%) | 34 (68.0%) |
| 20 to 24 Year Olds | 175 (64.1%) | 98 (35.9%) |
| 25 to 34 Year Olds | 31 (54.4%) | 26 (45.6%) |
| 35 Years and over | 76 (74.5%) | 26 (25.5%) |
| Total | 1,301 (53.2%) | 1,144 (46.8%) |
Educational Attainment by Field of Study in Malibu
Social sciences (1,108 | 18.0%), business (990 | 16.1%), visual & performing arts (562 | 9.1%), psychology (535 | 8.7%), and communications (501 | 8.1%) are the most common fields of study among 6,159 individuals in Malibu who have obtained a bachelor's degree or higher.
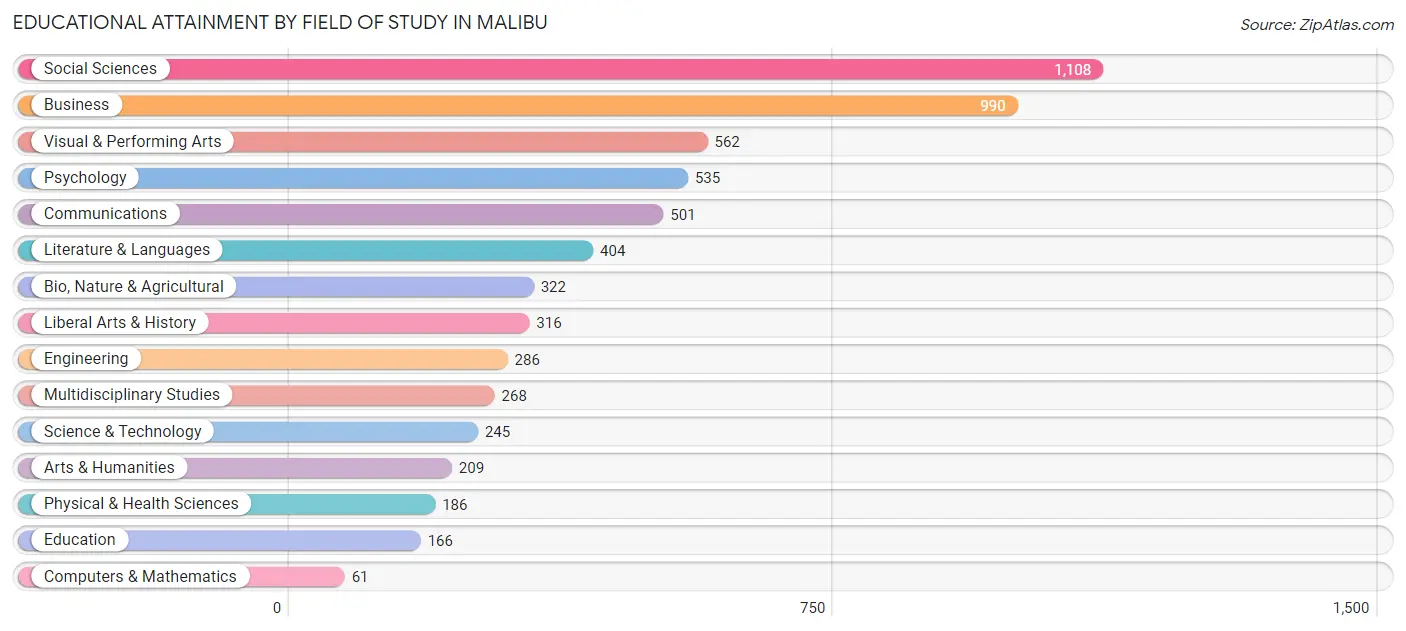
| Field of Study | # Graduates | % Graduates |
| Computers & Mathematics | 61 | 1.0% |
| Bio, Nature & Agricultural | 322 | 5.2% |
| Physical & Health Sciences | 186 | 3.0% |
| Psychology | 535 | 8.7% |
| Social Sciences | 1,108 | 18.0% |
| Engineering | 286 | 4.6% |
| Multidisciplinary Studies | 268 | 4.3% |
| Science & Technology | 245 | 4.0% |
| Business | 990 | 16.1% |
| Education | 166 | 2.7% |
| Literature & Languages | 404 | 6.6% |
| Liberal Arts & History | 316 | 5.1% |
| Visual & Performing Arts | 562 | 9.1% |
| Communications | 501 | 8.1% |
| Arts & Humanities | 209 | 3.4% |
| Total | 6,159 | 100.0% |
Transportation & Commute in Malibu
Vehicle Availability by Sex in Malibu
The most prevalent vehicle ownership categories in Malibu are males with 2 vehicles (1,190, accounting for 45.7%) and females with 2 vehicles (724, making up 60.3%).
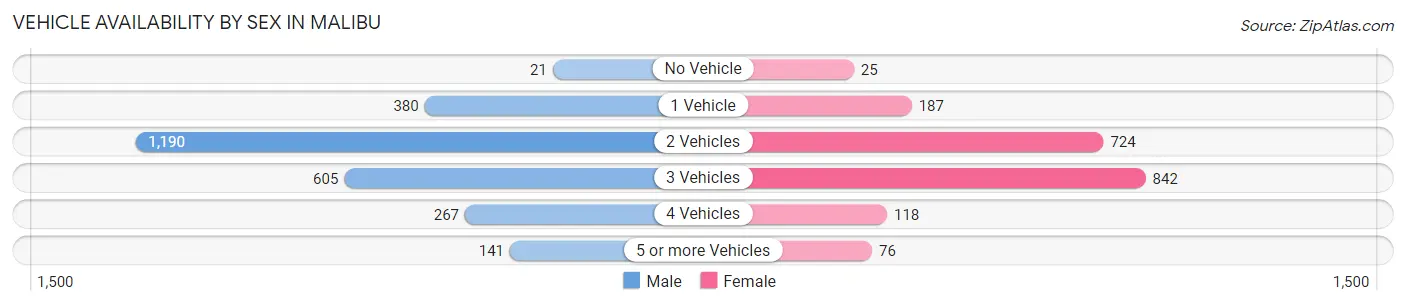
| Vehicles Available | Male | Female |
| No Vehicle | 21 (0.8%) | 25 (1.3%) |
| 1 Vehicle | 380 (14.6%) | 187 (9.5%) |
| 2 Vehicles | 1,190 (45.7%) | 724 (36.7%) |
| 3 Vehicles | 605 (23.2%) | 842 (42.7%) |
| 4 Vehicles | 267 (10.2%) | 118 (6.0%) |
| 5 or more Vehicles | 141 (5.4%) | 76 (3.8%) |
| Total | 2,604 (100.0%) | 1,972 (100.0%) |
Commute Time in Malibu
The most frequently occuring commute durations in Malibu are 45 to 59 minutes (473 commuters, 16.0%), 5 to 9 minutes (434 commuters, 14.7%), and 60 to 89 minutes (359 commuters, 12.2%).
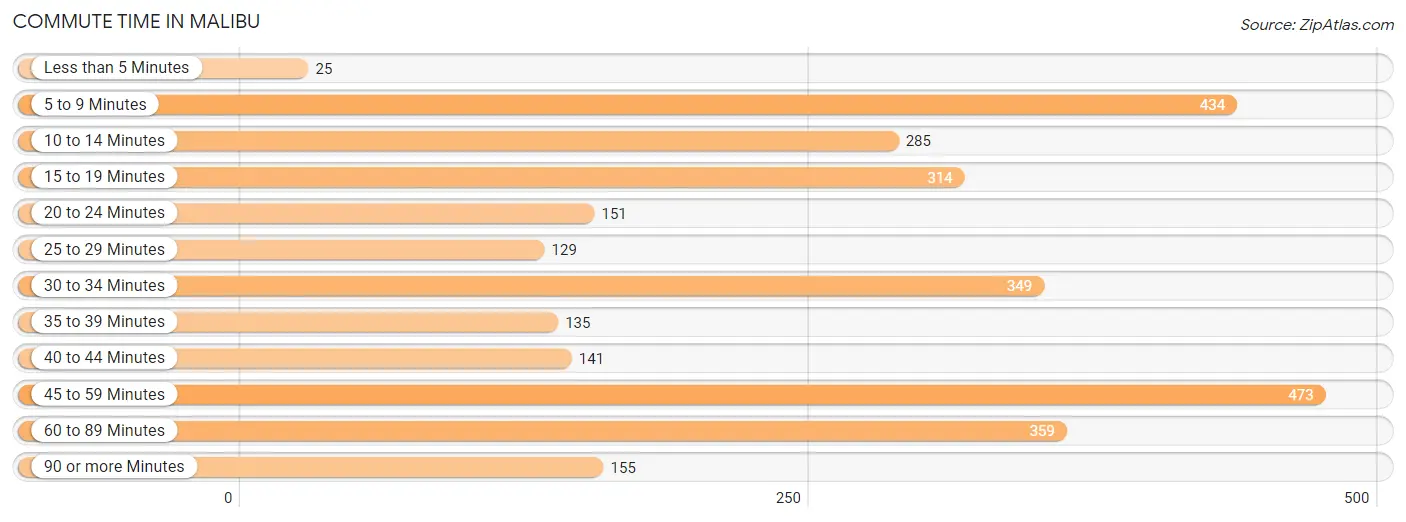
| Commute Time | # Commuters | % Commuters |
| Less than 5 Minutes | 25 | 0.9% |
| 5 to 9 Minutes | 434 | 14.7% |
| 10 to 14 Minutes | 285 | 9.7% |
| 15 to 19 Minutes | 314 | 10.6% |
| 20 to 24 Minutes | 151 | 5.1% |
| 25 to 29 Minutes | 129 | 4.4% |
| 30 to 34 Minutes | 349 | 11.8% |
| 35 to 39 Minutes | 135 | 4.6% |
| 40 to 44 Minutes | 141 | 4.8% |
| 45 to 59 Minutes | 473 | 16.0% |
| 60 to 89 Minutes | 359 | 12.2% |
| 90 or more Minutes | 155 | 5.2% |
Commute Time by Sex in Malibu
The most common commute times in Malibu are 60 to 89 minutes (285 commuters, 18.4%) for males and 5 to 9 minutes (386 commuters, 27.5%) for females.
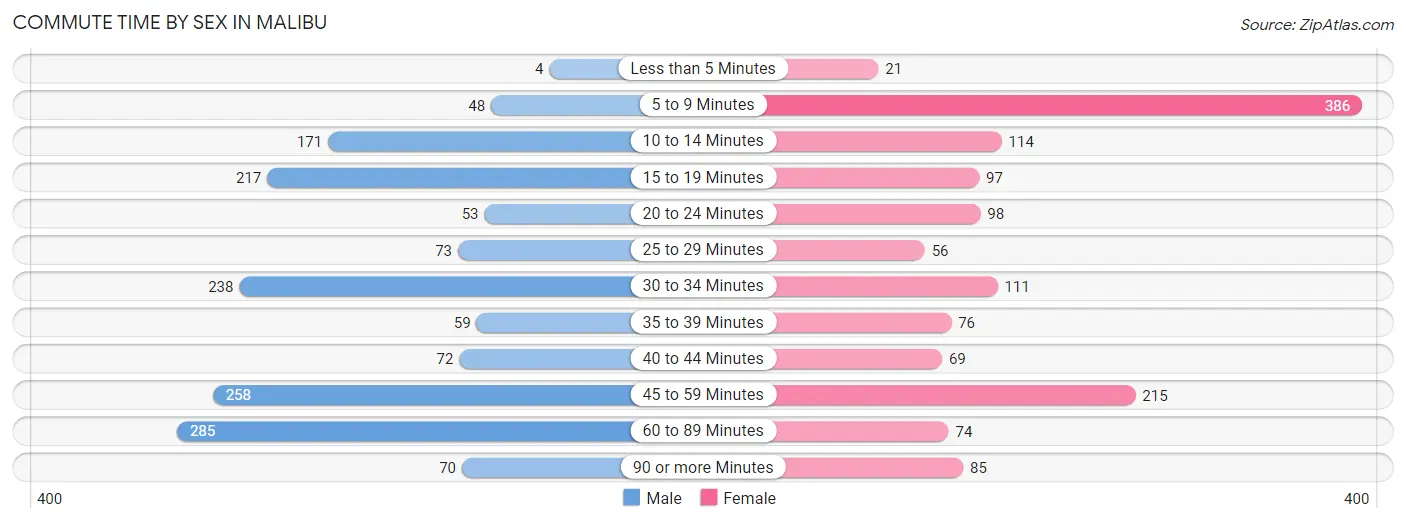
| Commute Time | Male | Female |
| Less than 5 Minutes | 4 (0.3%) | 21 (1.5%) |
| 5 to 9 Minutes | 48 (3.1%) | 386 (27.5%) |
| 10 to 14 Minutes | 171 (11.1%) | 114 (8.1%) |
| 15 to 19 Minutes | 217 (14.0%) | 97 (6.9%) |
| 20 to 24 Minutes | 53 (3.4%) | 98 (7.0%) |
| 25 to 29 Minutes | 73 (4.7%) | 56 (4.0%) |
| 30 to 34 Minutes | 238 (15.4%) | 111 (7.9%) |
| 35 to 39 Minutes | 59 (3.8%) | 76 (5.4%) |
| 40 to 44 Minutes | 72 (4.6%) | 69 (4.9%) |
| 45 to 59 Minutes | 258 (16.7%) | 215 (15.3%) |
| 60 to 89 Minutes | 285 (18.4%) | 74 (5.3%) |
| 90 or more Minutes | 70 (4.5%) | 85 (6.1%) |
Time of Departure to Work by Sex in Malibu
The most frequent times of departure to work in Malibu are 9:00 AM to 9:59 AM (341, 22.0%) for males and 9:00 AM to 9:59 AM (454, 32.4%) for females.
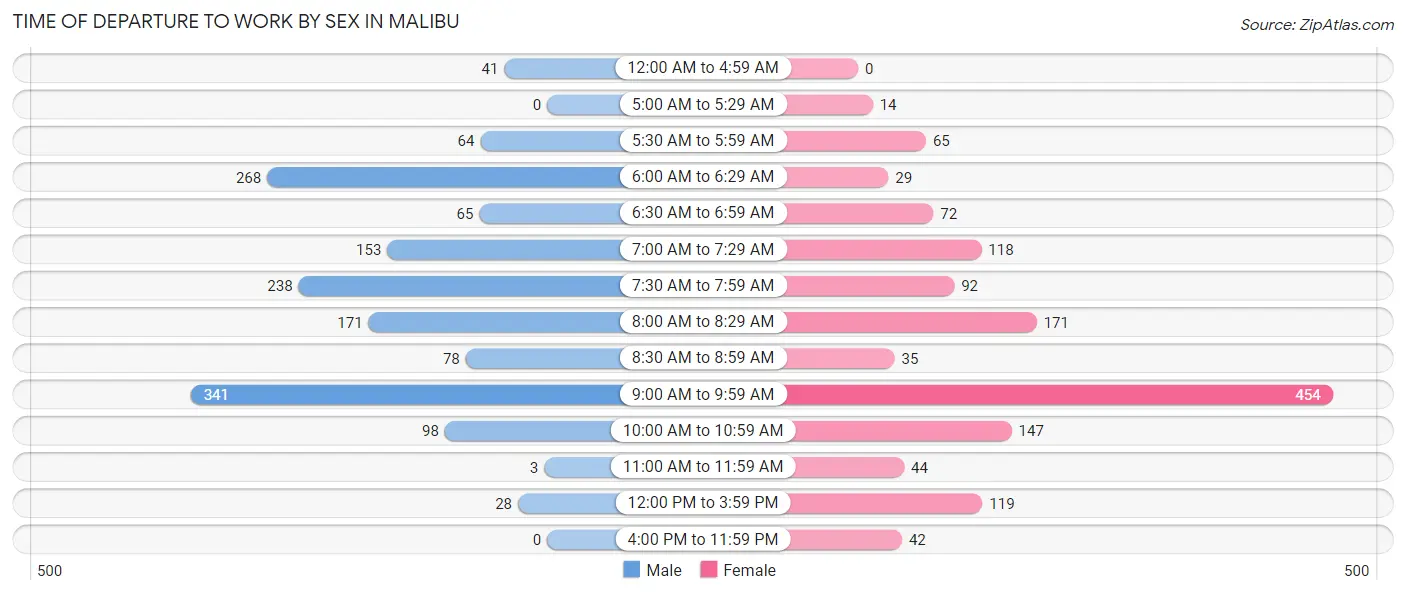
| Time of Departure | Male | Female |
| 12:00 AM to 4:59 AM | 41 (2.6%) | 0 (0.0%) |
| 5:00 AM to 5:29 AM | 0 (0.0%) | 14 (1.0%) |
| 5:30 AM to 5:59 AM | 64 (4.1%) | 65 (4.6%) |
| 6:00 AM to 6:29 AM | 268 (17.3%) | 29 (2.1%) |
| 6:30 AM to 6:59 AM | 65 (4.2%) | 72 (5.1%) |
| 7:00 AM to 7:29 AM | 153 (9.9%) | 118 (8.4%) |
| 7:30 AM to 7:59 AM | 238 (15.4%) | 92 (6.6%) |
| 8:00 AM to 8:29 AM | 171 (11.1%) | 171 (12.2%) |
| 8:30 AM to 8:59 AM | 78 (5.0%) | 35 (2.5%) |
| 9:00 AM to 9:59 AM | 341 (22.0%) | 454 (32.4%) |
| 10:00 AM to 10:59 AM | 98 (6.3%) | 147 (10.5%) |
| 11:00 AM to 11:59 AM | 3 (0.2%) | 44 (3.1%) |
| 12:00 PM to 3:59 PM | 28 (1.8%) | 119 (8.5%) |
| 4:00 PM to 11:59 PM | 0 (0.0%) | 42 (3.0%) |
| Total | 1,548 (100.0%) | 1,402 (100.0%) |
Housing Occupancy in Malibu
Occupancy by Ownership in Malibu
Of the total 4,401 dwellings in Malibu, owner-occupied units account for 3,367 (76.5%), while renter-occupied units make up 1,034 (23.5%).
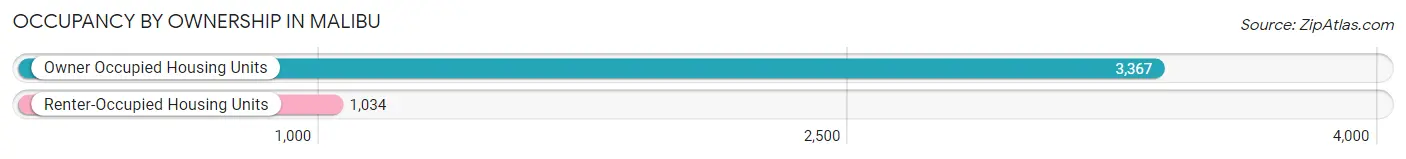
| Occupancy | # Housing Units | % Housing Units |
| Owner Occupied Housing Units | 3,367 | 76.5% |
| Renter-Occupied Housing Units | 1,034 | 23.5% |
| Total Occupied Housing Units | 4,401 | 100.0% |
Occupancy by Household Size in Malibu
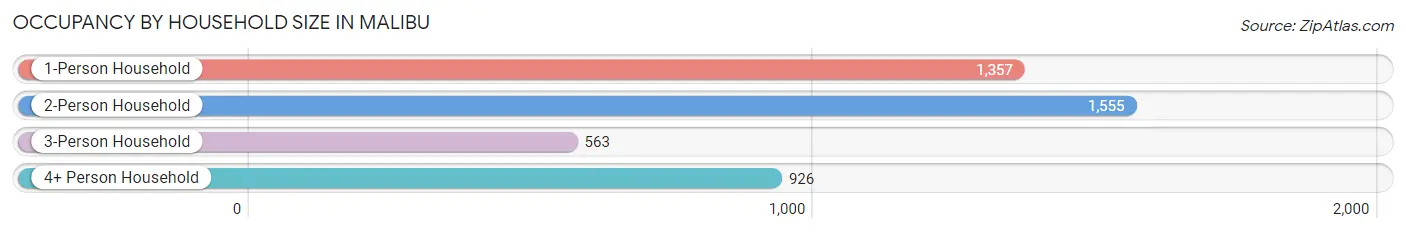
| Household Size | # Housing Units | % Housing Units |
| 1-Person Household | 1,357 | 30.8% |
| 2-Person Household | 1,555 | 35.3% |
| 3-Person Household | 563 | 12.8% |
| 4+ Person Household | 926 | 21.0% |
| Total Housing Units | 4,401 | 100.0% |
Occupancy by Ownership by Household Size in Malibu
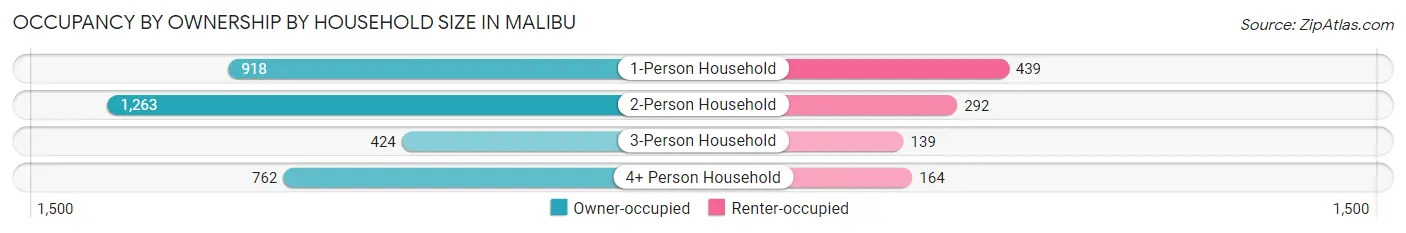
| Household Size | Owner-occupied | Renter-occupied |
| 1-Person Household | 918 (67.6%) | 439 (32.4%) |
| 2-Person Household | 1,263 (81.2%) | 292 (18.8%) |
| 3-Person Household | 424 (75.3%) | 139 (24.7%) |
| 4+ Person Household | 762 (82.3%) | 164 (17.7%) |
| Total Housing Units | 3,367 (76.5%) | 1,034 (23.5%) |
Occupancy by Educational Attainment in Malibu
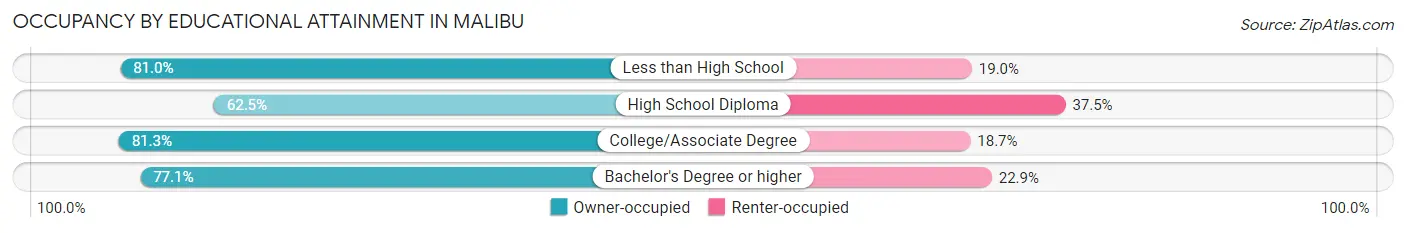
| Household Size | Owner-occupied | Renter-occupied |
| Less than High School | 47 (81.0%) | 11 (19.0%) |
| High School Diploma | 248 (62.5%) | 149 (37.5%) |
| College/Associate Degree | 588 (81.3%) | 135 (18.7%) |
| Bachelor's Degree or higher | 2,484 (77.1%) | 739 (22.9%) |
Occupancy by Age of Householder in Malibu
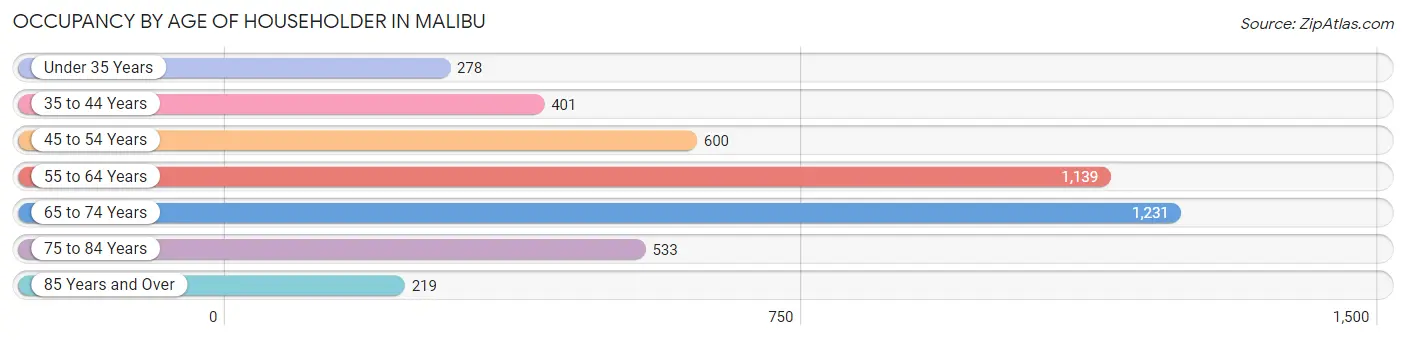
| Age Bracket | # Households | % Households |
| Under 35 Years | 278 | 6.3% |
| 35 to 44 Years | 401 | 9.1% |
| 45 to 54 Years | 600 | 13.6% |
| 55 to 64 Years | 1,139 | 25.9% |
| 65 to 74 Years | 1,231 | 28.0% |
| 75 to 84 Years | 533 | 12.1% |
| 85 Years and Over | 219 | 5.0% |
| Total | 4,401 | 100.0% |
Housing Finances in Malibu
Median Income by Occupancy in Malibu
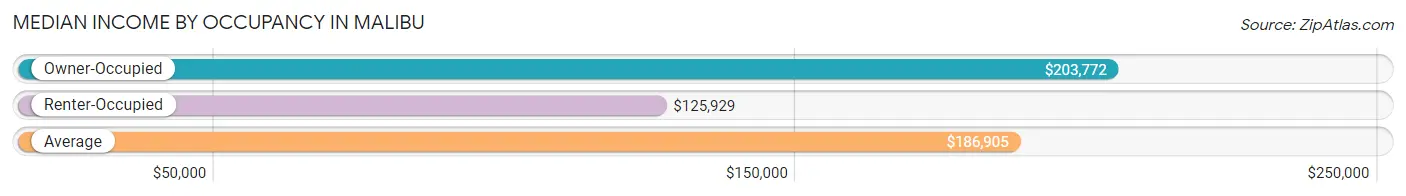
| Occupancy Type | # Households | Median Income |
| Owner-Occupied | 3,367 (76.5%) | $203,772 |
| Renter-Occupied | 1,034 (23.5%) | $125,929 |
| Average | 4,401 (100.0%) | $186,905 |
Occupancy by Householder Income Bracket in Malibu
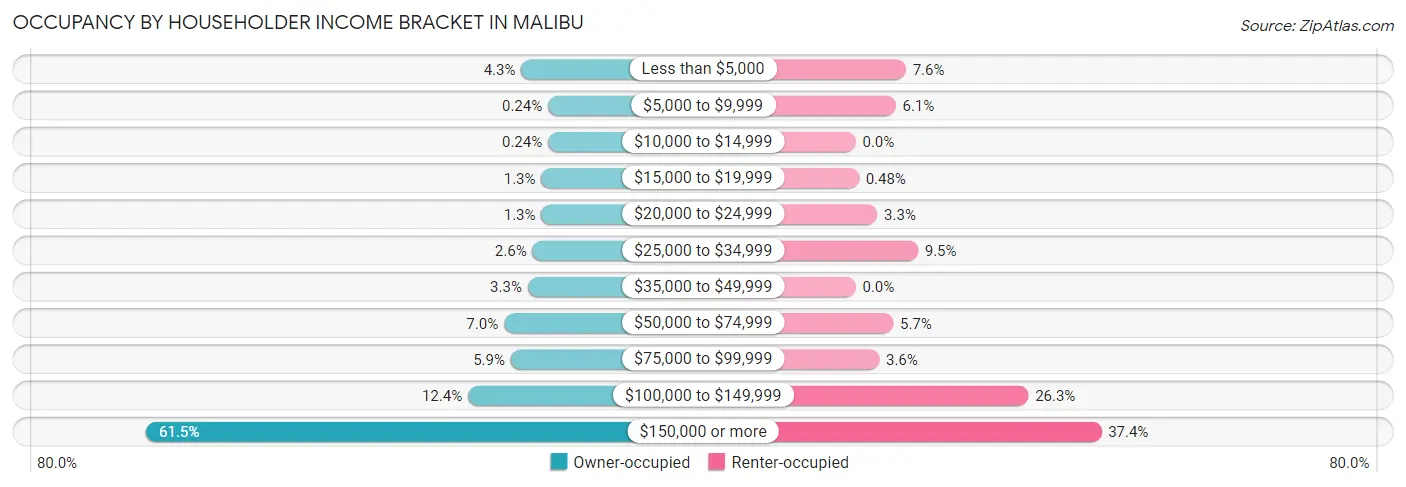
| Income Bracket | Owner-occupied | Renter-occupied |
| Less than $5,000 | 145 (4.3%) | 79 (7.6%) |
| $5,000 to $9,999 | 8 (0.2%) | 63 (6.1%) |
| $10,000 to $14,999 | 8 (0.2%) | 0 (0.0%) |
| $15,000 to $19,999 | 42 (1.3%) | 5 (0.5%) |
| $20,000 to $24,999 | 42 (1.3%) | 34 (3.3%) |
| $25,000 to $34,999 | 88 (2.6%) | 98 (9.5%) |
| $35,000 to $49,999 | 112 (3.3%) | 0 (0.0%) |
| $50,000 to $74,999 | 234 (7.0%) | 59 (5.7%) |
| $75,000 to $99,999 | 199 (5.9%) | 37 (3.6%) |
| $100,000 to $149,999 | 419 (12.4%) | 272 (26.3%) |
| $150,000 or more | 2,070 (61.5%) | 387 (37.4%) |
| Total | 3,367 (100.0%) | 1,034 (100.0%) |
Monthly Housing Cost Tiers in Malibu
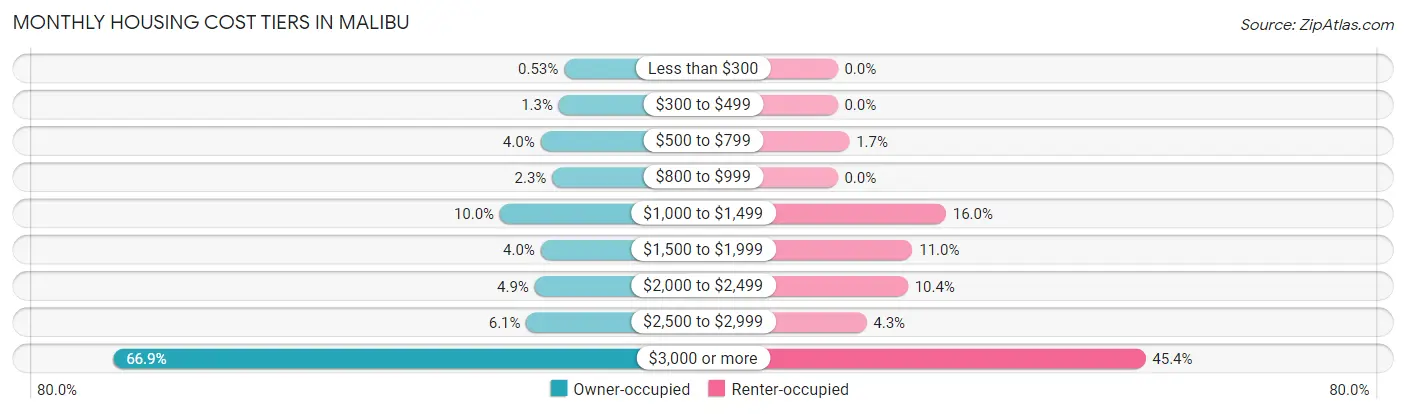
| Monthly Cost | Owner-occupied | Renter-occupied |
| Less than $300 | 18 (0.5%) | 0 (0.0%) |
| $300 to $499 | 44 (1.3%) | 0 (0.0%) |
| $500 to $799 | 135 (4.0%) | 18 (1.7%) |
| $800 to $999 | 77 (2.3%) | 0 (0.0%) |
| $1,000 to $1,499 | 336 (10.0%) | 165 (16.0%) |
| $1,500 to $1,999 | 134 (4.0%) | 114 (11.0%) |
| $2,000 to $2,499 | 164 (4.9%) | 107 (10.3%) |
| $2,500 to $2,999 | 205 (6.1%) | 44 (4.3%) |
| $3,000 or more | 2,254 (66.9%) | 469 (45.4%) |
| Total | 3,367 (100.0%) | 1,034 (100.0%) |
Physical Housing Characteristics in Malibu
Housing Structures in Malibu
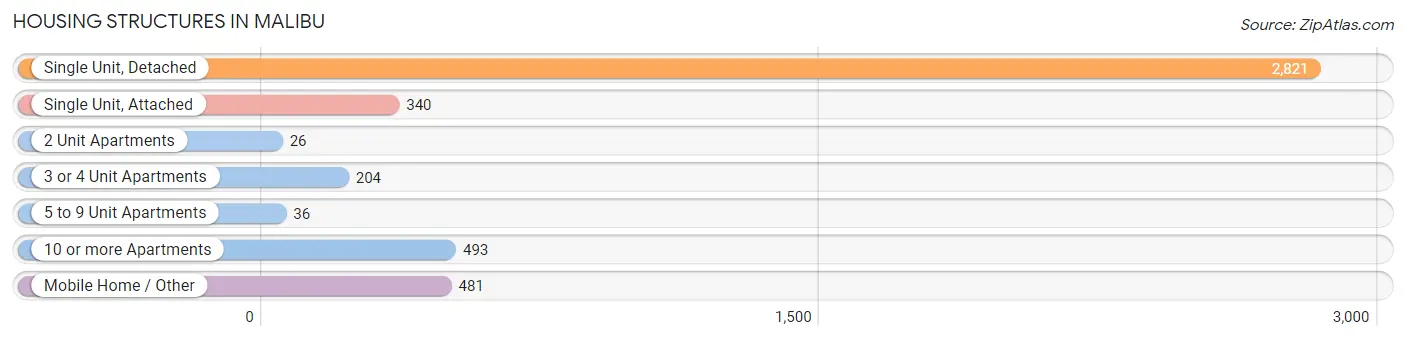
| Structure Type | # Housing Units | % Housing Units |
| Single Unit, Detached | 2,821 | 64.1% |
| Single Unit, Attached | 340 | 7.7% |
| 2 Unit Apartments | 26 | 0.6% |
| 3 or 4 Unit Apartments | 204 | 4.6% |
| 5 to 9 Unit Apartments | 36 | 0.8% |
| 10 or more Apartments | 493 | 11.2% |
| Mobile Home / Other | 481 | 10.9% |
| Total | 4,401 | 100.0% |
Housing Structures by Occupancy in Malibu
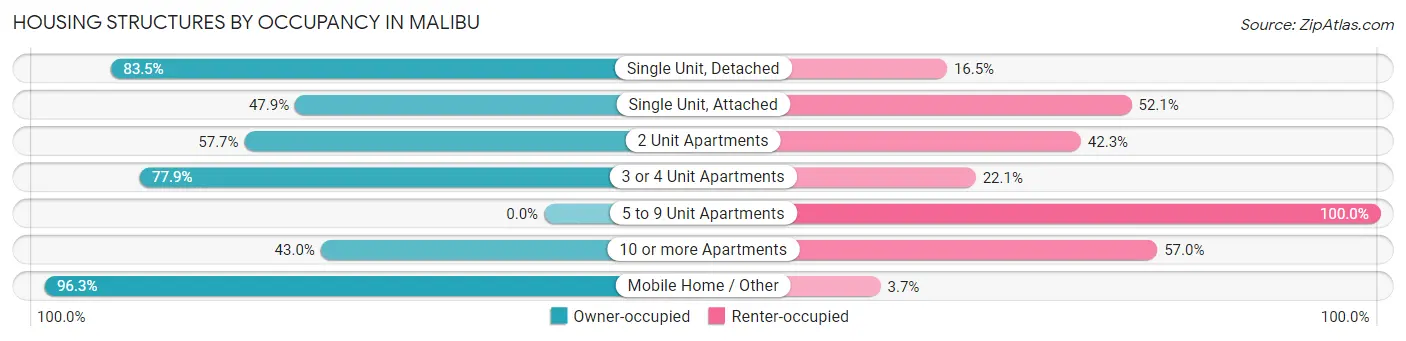
| Structure Type | Owner-occupied | Renter-occupied |
| Single Unit, Detached | 2,355 (83.5%) | 466 (16.5%) |
| Single Unit, Attached | 163 (47.9%) | 177 (52.1%) |
| 2 Unit Apartments | 15 (57.7%) | 11 (42.3%) |
| 3 or 4 Unit Apartments | 159 (77.9%) | 45 (22.1%) |
| 5 to 9 Unit Apartments | 0 (0.0%) | 36 (100.0%) |
| 10 or more Apartments | 212 (43.0%) | 281 (57.0%) |
| Mobile Home / Other | 463 (96.3%) | 18 (3.7%) |
| Total | 3,367 (76.5%) | 1,034 (23.5%) |
Housing Structures by Number of Rooms in Malibu
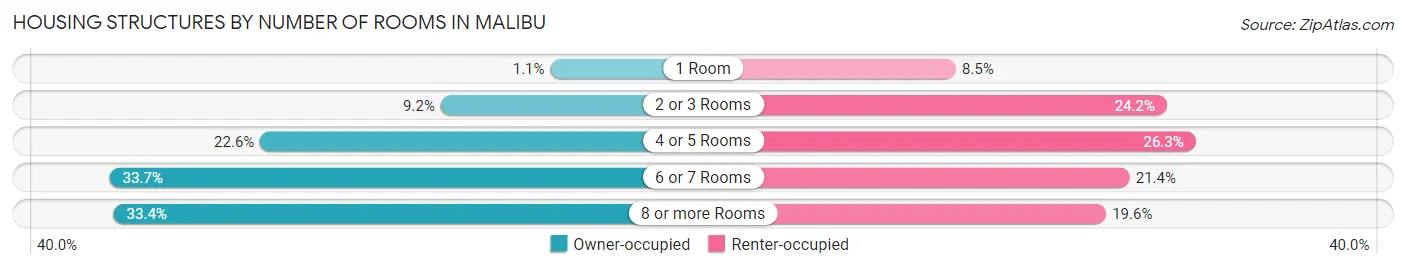
| Number of Rooms | Owner-occupied | Renter-occupied |
| 1 Room | 37 (1.1%) | 88 (8.5%) |
| 2 or 3 Rooms | 310 (9.2%) | 250 (24.2%) |
| 4 or 5 Rooms | 760 (22.6%) | 272 (26.3%) |
| 6 or 7 Rooms | 1,135 (33.7%) | 221 (21.4%) |
| 8 or more Rooms | 1,125 (33.4%) | 203 (19.6%) |
| Total | 3,367 (100.0%) | 1,034 (100.0%) |
Housing Structure by Heating Type in Malibu
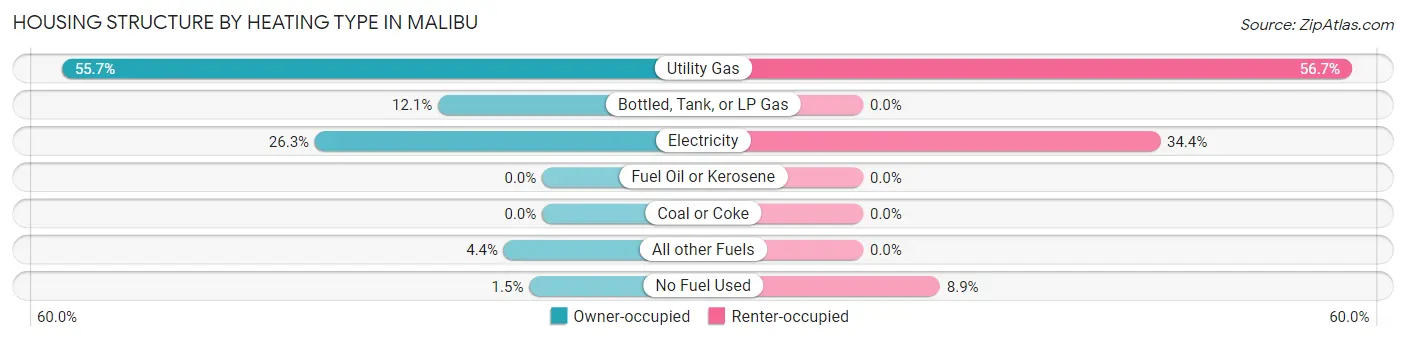
| Heating Type | Owner-occupied | Renter-occupied |
| Utility Gas | 1,875 (55.7%) | 586 (56.7%) |
| Bottled, Tank, or LP Gas | 406 (12.1%) | 0 (0.0%) |
| Electricity | 887 (26.3%) | 356 (34.4%) |
| Fuel Oil or Kerosene | 0 (0.0%) | 0 (0.0%) |
| Coal or Coke | 0 (0.0%) | 0 (0.0%) |
| All other Fuels | 149 (4.4%) | 0 (0.0%) |
| No Fuel Used | 50 (1.5%) | 92 (8.9%) |
| Total | 3,367 (100.0%) | 1,034 (100.0%) |
Household Vehicle Usage in Malibu
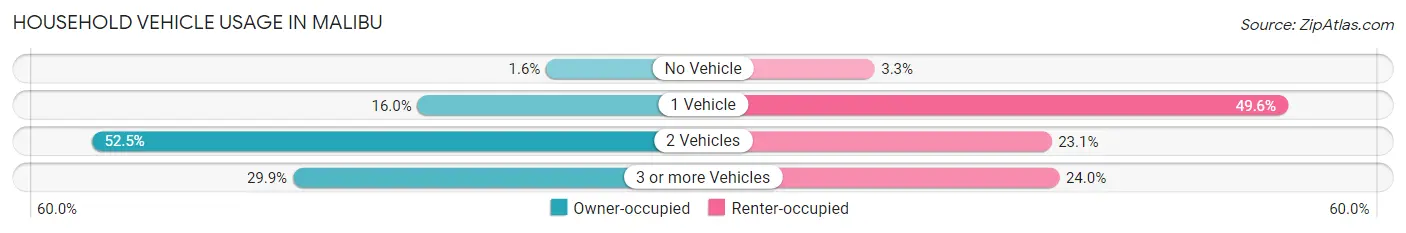
| Vehicles per Household | Owner-occupied | Renter-occupied |
| No Vehicle | 53 (1.6%) | 34 (3.3%) |
| 1 Vehicle | 538 (16.0%) | 513 (49.6%) |
| 2 Vehicles | 1,768 (52.5%) | 239 (23.1%) |
| 3 or more Vehicles | 1,008 (29.9%) | 248 (24.0%) |
| Total | 3,367 (100.0%) | 1,034 (100.0%) |
Real Estate & Mortgages in Malibu
Real Estate and Mortgage Overview in Malibu
| Characteristic | Without Mortgage | With Mortgage |
| Housing Units | 1,330 | 2,037 |
| Median Property Value | $2,000,001 | $2,000,001 |
| Median Household Income | $148,611 | $1,415 |
| Monthly Housing Costs | $1,501 | $1,762 |
| Real Estate Taxes | $10,001 | $78 |
Property Value by Mortgage Status in Malibu
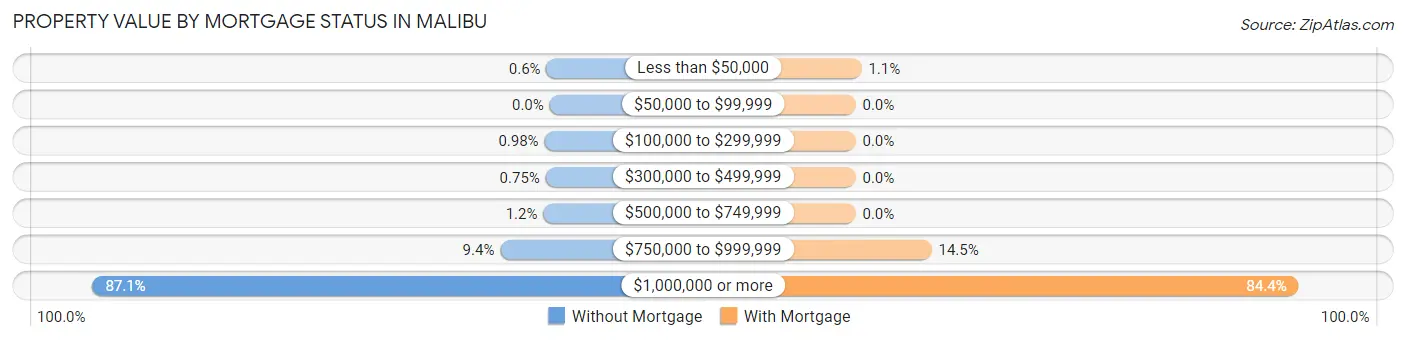
| Property Value | Without Mortgage | With Mortgage |
| Less than $50,000 | 8 (0.6%) | 23 (1.1%) |
| $50,000 to $99,999 | 0 (0.0%) | 0 (0.0%) |
| $100,000 to $299,999 | 13 (1.0%) | 0 (0.0%) |
| $300,000 to $499,999 | 10 (0.7%) | 0 (0.0%) |
| $500,000 to $749,999 | 16 (1.2%) | 0 (0.0%) |
| $750,000 to $999,999 | 125 (9.4%) | 295 (14.5%) |
| $1,000,000 or more | 1,158 (87.1%) | 1,719 (84.4%) |
| Total | 1,330 (100.0%) | 2,037 (100.0%) |
Household Income by Mortgage Status in Malibu
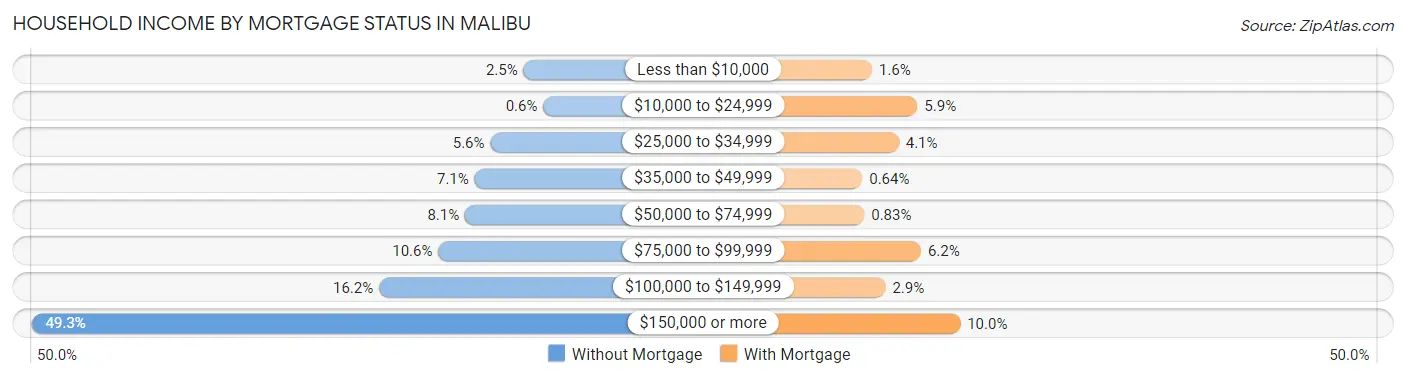
| Household Income | Without Mortgage | With Mortgage |
| Less than $10,000 | 33 (2.5%) | 32 (1.6%) |
| $10,000 to $24,999 | 8 (0.6%) | 120 (5.9%) |
| $25,000 to $34,999 | 75 (5.6%) | 84 (4.1%) |
| $35,000 to $49,999 | 95 (7.1%) | 13 (0.6%) |
| $50,000 to $74,999 | 107 (8.1%) | 17 (0.8%) |
| $75,000 to $99,999 | 141 (10.6%) | 127 (6.2%) |
| $100,000 to $149,999 | 216 (16.2%) | 58 (2.9%) |
| $150,000 or more | 655 (49.2%) | 203 (10.0%) |
| Total | 1,330 (100.0%) | 2,037 (100.0%) |
Property Value to Household Income Ratio in Malibu
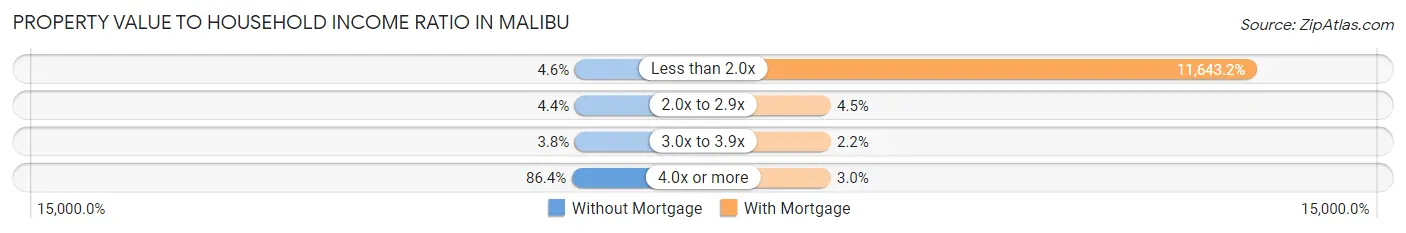
| Value-to-Income Ratio | Without Mortgage | With Mortgage |
| Less than 2.0x | 61 (4.6%) | 237,171 (11,643.1%) |
| 2.0x to 2.9x | 59 (4.4%) | 91 (4.5%) |
| 3.0x to 3.9x | 50 (3.8%) | 44 (2.2%) |
| 4.0x or more | 1,149 (86.4%) | 62 (3.0%) |
| Total | 1,330 (100.0%) | 2,037 (100.0%) |
Real Estate Taxes by Mortgage Status in Malibu
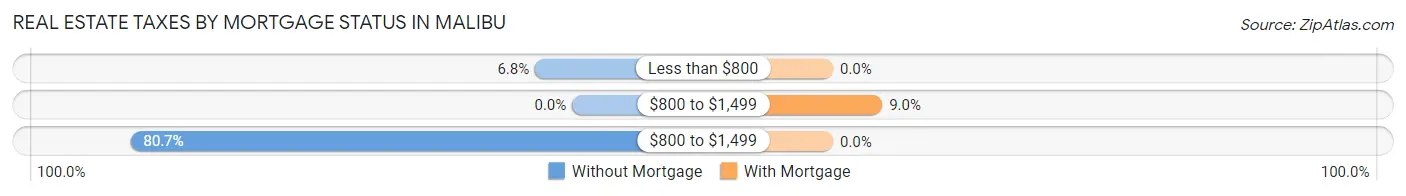
| Property Taxes | Without Mortgage | With Mortgage |
| Less than $800 | 90 (6.8%) | 0 (0.0%) |
| $800 to $1,499 | 0 (0.0%) | 183 (9.0%) |
| $800 to $1,499 | 1,073 (80.7%) | 0 (0.0%) |
| Total | 1,330 (100.0%) | 2,037 (100.0%) |
Health & Disability in Malibu
Health Insurance Coverage by Age in Malibu
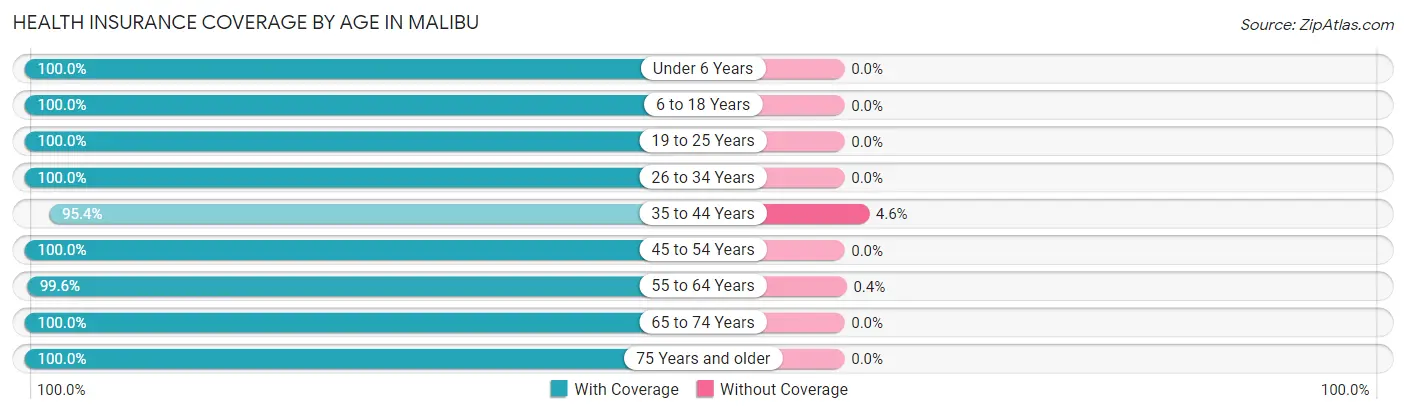
| Age Bracket | With Coverage | Without Coverage |
| Under 6 Years | 322 (100.0%) | 0 (0.0%) |
| 6 to 18 Years | 1,837 (100.0%) | 0 (0.0%) |
| 19 to 25 Years | 590 (100.0%) | 0 (0.0%) |
| 26 to 34 Years | 877 (100.0%) | 0 (0.0%) |
| 35 to 44 Years | 895 (95.4%) | 43 (4.6%) |
| 45 to 54 Years | 1,222 (100.0%) | 0 (0.0%) |
| 55 to 64 Years | 1,743 (99.6%) | 7 (0.4%) |
| 65 to 74 Years | 2,059 (100.0%) | 0 (0.0%) |
| 75 Years and older | 1,099 (100.0%) | 0 (0.0%) |
| Total | 10,644 (99.5%) | 50 (0.5%) |
Health Insurance Coverage by Citizenship Status in Malibu
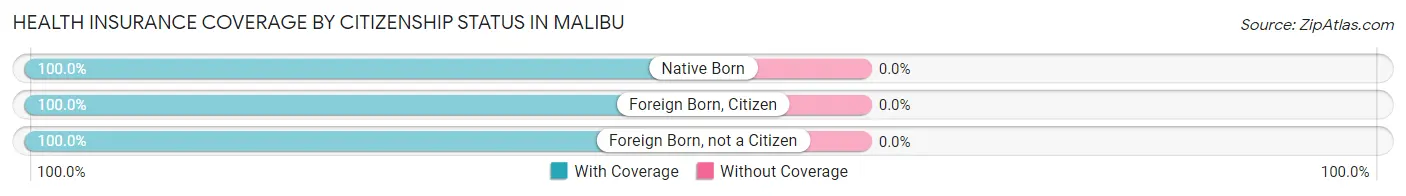
| Citizenship Status | With Coverage | Without Coverage |
| Native Born | 322 (100.0%) | 0 (0.0%) |
| Foreign Born, Citizen | 1,837 (100.0%) | 0 (0.0%) |
| Foreign Born, not a Citizen | 590 (100.0%) | 0 (0.0%) |
Health Insurance Coverage by Household Income in Malibu
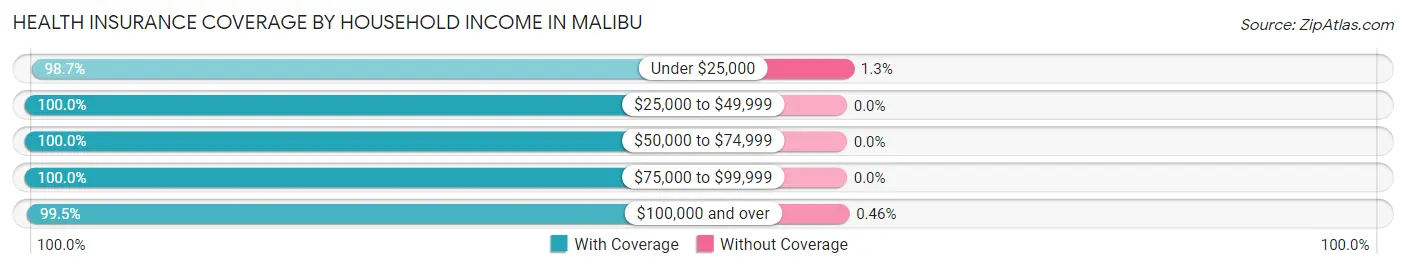
| Household Income | With Coverage | Without Coverage |
| Under $25,000 | 813 (98.7%) | 11 (1.3%) |
| $25,000 to $49,999 | 440 (100.0%) | 0 (0.0%) |
| $50,000 to $74,999 | 460 (100.0%) | 0 (0.0%) |
| $75,000 to $99,999 | 389 (100.0%) | 0 (0.0%) |
| $100,000 and over | 8,413 (99.5%) | 39 (0.5%) |
Public vs Private Health Insurance Coverage by Age in Malibu
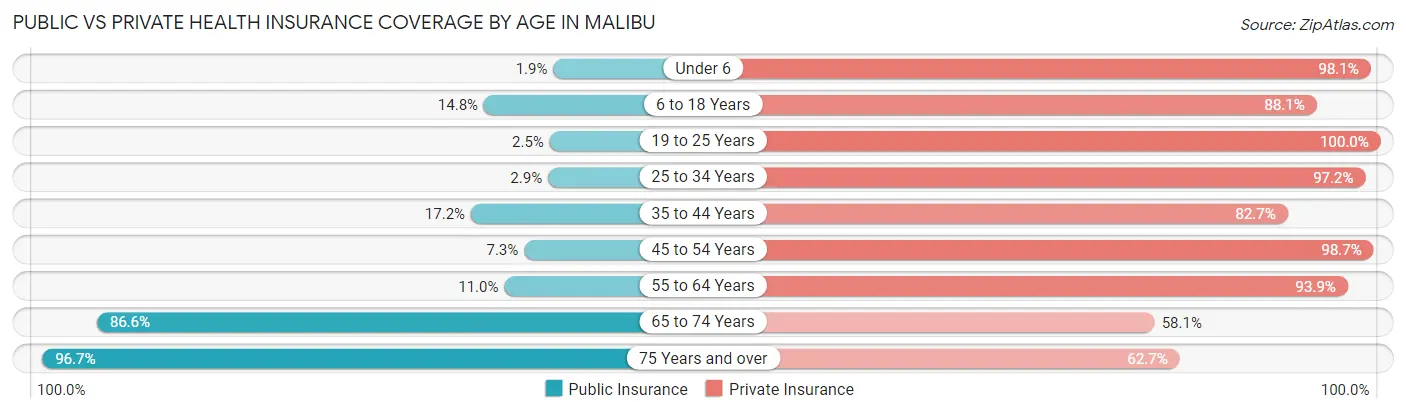
| Age Bracket | Public Insurance | Private Insurance |
| Under 6 | 6 (1.9%) | 316 (98.1%) |
| 6 to 18 Years | 271 (14.7%) | 1,619 (88.1%) |
| 19 to 25 Years | 15 (2.5%) | 590 (100.0%) |
| 25 to 34 Years | 25 (2.9%) | 852 (97.2%) |
| 35 to 44 Years | 161 (17.2%) | 776 (82.7%) |
| 45 to 54 Years | 89 (7.3%) | 1,206 (98.7%) |
| 55 to 64 Years | 192 (11.0%) | 1,643 (93.9%) |
| 65 to 74 Years | 1,783 (86.6%) | 1,196 (58.1%) |
| 75 Years and over | 1,063 (96.7%) | 689 (62.7%) |
| Total | 3,605 (33.7%) | 8,887 (83.1%) |
Disability Status by Sex by Age in Malibu
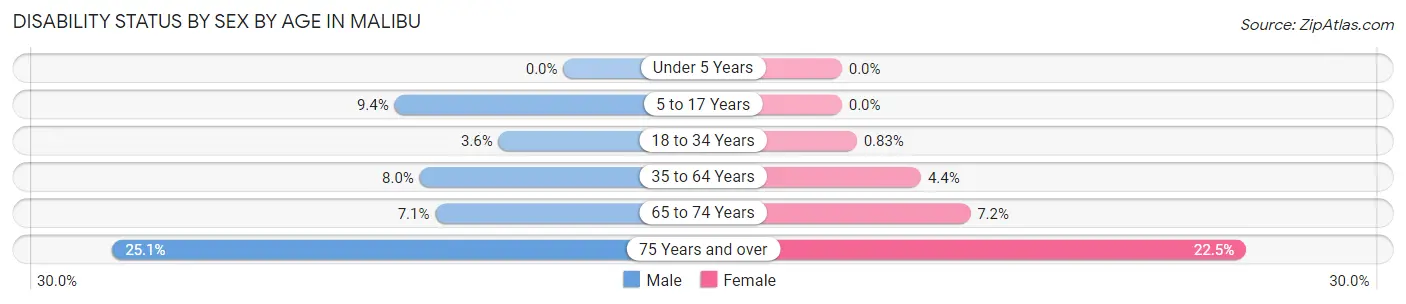
| Age Bracket | Male | Female |
| Under 5 Years | 0 (0.0%) | 0 (0.0%) |
| 5 to 17 Years | 104 (9.4%) | 0 (0.0%) |
| 18 to 34 Years | 18 (3.6%) | 8 (0.8%) |
| 35 to 64 Years | 146 (8.0%) | 92 (4.4%) |
| 65 to 74 Years | 81 (7.1%) | 66 (7.1%) |
| 75 Years and over | 160 (25.1%) | 104 (22.5%) |
Disability Class by Sex by Age in Malibu
Disability Class: Hearing Difficulty
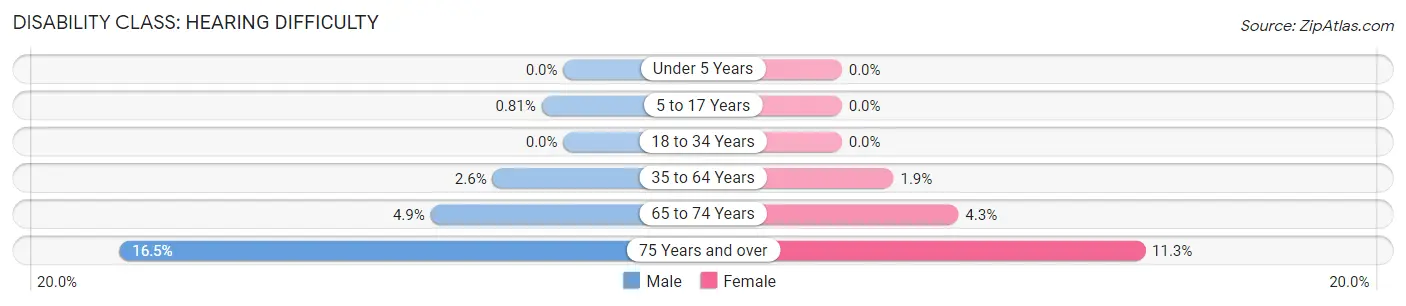
| Age Bracket | Male | Female |
| Under 5 Years | 0 (0.0%) | 0 (0.0%) |
| 5 to 17 Years | 9 (0.8%) | 0 (0.0%) |
| 18 to 34 Years | 0 (0.0%) | 0 (0.0%) |
| 35 to 64 Years | 48 (2.6%) | 40 (1.9%) |
| 65 to 74 Years | 56 (4.9%) | 40 (4.3%) |
| 75 Years and over | 105 (16.5%) | 52 (11.3%) |
Disability Class: Vision Difficulty
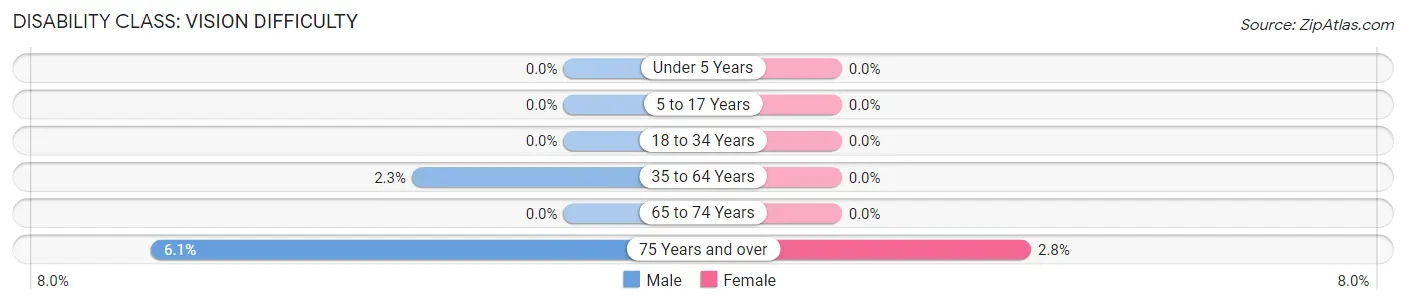
| Age Bracket | Male | Female |
| Under 5 Years | 0 (0.0%) | 0 (0.0%) |
| 5 to 17 Years | 0 (0.0%) | 0 (0.0%) |
| 18 to 34 Years | 0 (0.0%) | 0 (0.0%) |
| 35 to 64 Years | 41 (2.2%) | 0 (0.0%) |
| 65 to 74 Years | 0 (0.0%) | 0 (0.0%) |
| 75 Years and over | 39 (6.1%) | 13 (2.8%) |
Disability Class: Cognitive Difficulty
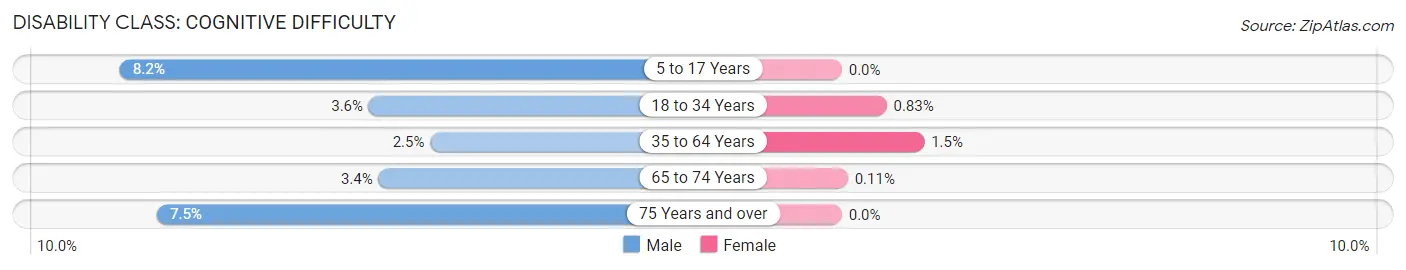
| Age Bracket | Male | Female |
| 5 to 17 Years | 91 (8.2%) | 0 (0.0%) |
| 18 to 34 Years | 18 (3.6%) | 8 (0.8%) |
| 35 to 64 Years | 45 (2.5%) | 32 (1.5%) |
| 65 to 74 Years | 39 (3.4%) | 1 (0.1%) |
| 75 Years and over | 48 (7.5%) | 0 (0.0%) |
Disability Class: Ambulatory Difficulty
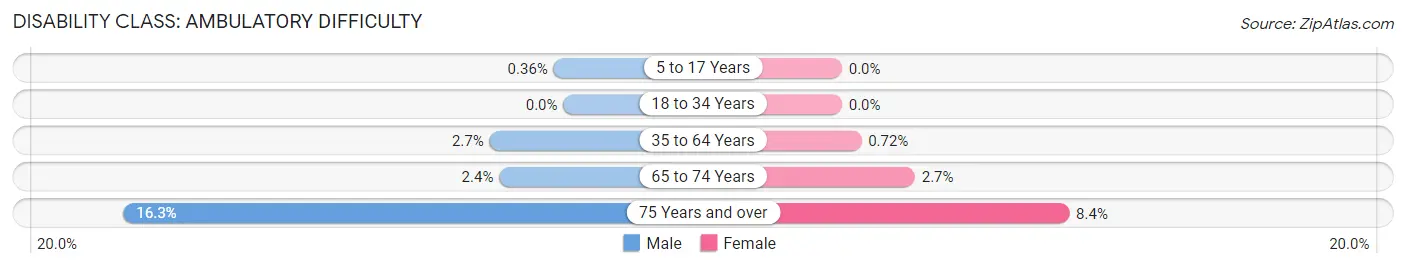
| Age Bracket | Male | Female |
| 5 to 17 Years | 4 (0.4%) | 0 (0.0%) |
| 18 to 34 Years | 0 (0.0%) | 0 (0.0%) |
| 35 to 64 Years | 50 (2.7%) | 15 (0.7%) |
| 65 to 74 Years | 27 (2.4%) | 25 (2.7%) |
| 75 Years and over | 104 (16.3%) | 39 (8.4%) |
Disability Class: Self-Care Difficulty
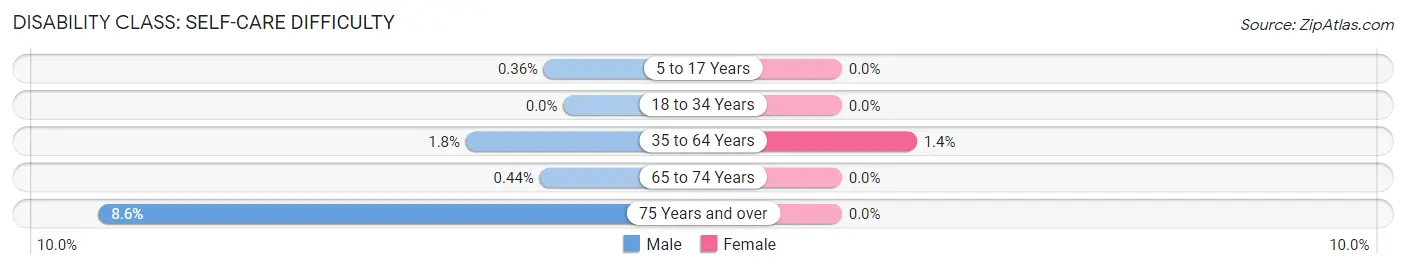
| Age Bracket | Male | Female |
| 5 to 17 Years | 4 (0.4%) | 0 (0.0%) |
| 18 to 34 Years | 0 (0.0%) | 0 (0.0%) |
| 35 to 64 Years | 33 (1.8%) | 29 (1.4%) |
| 65 to 74 Years | 5 (0.4%) | 0 (0.0%) |
| 75 Years and over | 55 (8.6%) | 0 (0.0%) |
Technology Access in Malibu
Computing Device Access in Malibu
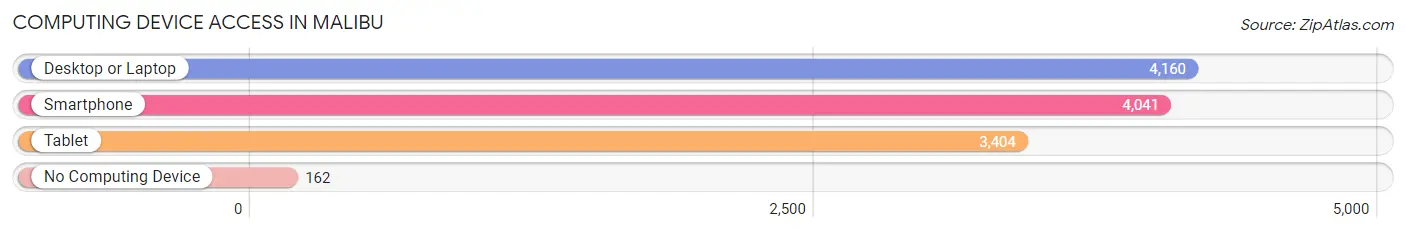
| Device Type | # Households | % Households |
| Desktop or Laptop | 4,160 | 94.5% |
| Smartphone | 4,041 | 91.8% |
| Tablet | 3,404 | 77.3% |
| No Computing Device | 162 | 3.7% |
| Total | 4,401 | 100.0% |
Internet Access in Malibu
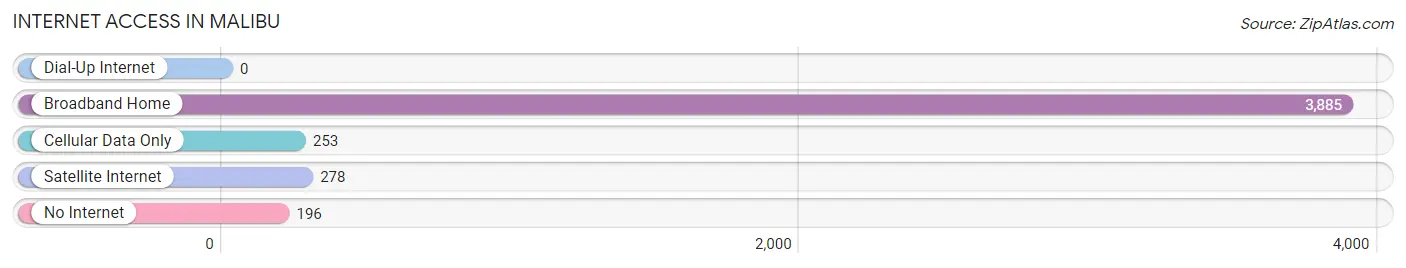
| Internet Type | # Households | % Households |
| Dial-Up Internet | 0 | 0.0% |
| Broadband Home | 3,885 | 88.3% |
| Cellular Data Only | 253 | 5.8% |
| Satellite Internet | 278 | 6.3% |
| No Internet | 196 | 4.4% |
| Total | 4,401 | 100.0% |
Malibu Summary
Malibu, California is a city located in Los Angeles County, California, United States. It is located along the Pacific Coast, approximately 30 miles west of downtown Los Angeles. Malibu is known for its beautiful beaches, celebrity homes, and its laid-back lifestyle.
Geography
Malibu is located on the Pacific Coast of California, approximately 30 miles west of downtown Los Angeles. It is bordered by the Santa Monica Mountains to the north, the Pacific Ocean to the south, and the Los Angeles County line to the east. The city is approximately 21 square miles in size and is divided into two distinct areas: the Malibu coast and the Malibu hills. The Malibu coast is characterized by its beautiful beaches, while the Malibu hills are characterized by their rolling hills and canyons.
History
The area that is now Malibu was originally inhabited by the Chumash people, who lived in the area for thousands of years. The first Europeans to explore the area were Spanish explorers in the late 1700s. In 1802, the Spanish government granted the land to a Spanish soldier, Jose Ignacio de la Torre, who named it Rancho Topanga Malibu Sequit. The land was later sold to Frederick Hastings Rindge in 1892, who established the Malibu Rancho.
Rindge developed the area into a cattle ranch and built a two-lane road, which is now known as Pacific Coast Highway. In the 1920s, the area began to attract Hollywood celebrities, who built homes along the coast. In 1926, the Malibu area was incorporated as a city.
Economy
The economy of Malibu is largely driven by tourism. The city is home to many popular beaches, such as Zuma Beach, Surfrider Beach, and El Matador Beach. These beaches attract visitors from all over the world, who come to enjoy the sun, sand, and surf.
In addition to tourism, Malibu is also home to many businesses, including restaurants, retail stores, and art galleries. The city is also home to many celebrities, who often own homes in the area.
Demographics
As of the 2010 census, the population of Malibu was 12,645. The racial makeup of the city was 87.2% White, 1.2% African American, 0.3% Native American, 5.2% Asian, 0.1% Pacific Islander, 2.7% from other races, and 3.3% from two or more races. The median household income was $107,817, and the median family income was $125,817.
Conclusion
Malibu, California is a beautiful city located along the Pacific Coast, approximately 30 miles west of downtown Los Angeles. It is known for its beautiful beaches, celebrity homes, and its laid-back lifestyle. The economy of Malibu is largely driven by tourism, and the city is home to many businesses, celebrities, and visitors from all over the world. As of the 2010 census, the population of Malibu was 12,645, and the median household income was $107,817.
Common Questions
What is Per Capita Income in Malibu?
Per Capita income in Malibu is $120,795.
What is the Median Family Income in Malibu?
Median Family Income in Malibu is $223,088.
What is the Median Household income in Malibu?
Median Household Income in Malibu is $186,905.
What is Income or Wage Gap in Malibu?
Income or Wage Gap in Malibu is 54.3%.
Women in Malibu earn 45.7 cents for every dollar earned by a man.
What is Inequality or Gini Index in Malibu?
Inequality or Gini Index in Malibu is 0.54.
What is the Total Population of Malibu?
Total Population of Malibu is 10,698.
What is the Total Male Population of Malibu?
Total Male Population of Malibu is 5,363.
What is the Total Female Population of Malibu?
Total Female Population of Malibu is 5,335.
What is the Ratio of Males per 100 Females in Malibu?
There are 100.52 Males per 100 Females in Malibu.
What is the Ratio of Females per 100 Males in Malibu?
There are 99.48 Females per 100 Males in Malibu.
What is the Median Population Age in Malibu?
Median Population Age in Malibu is 50.2 Years.
What is the Average Family Size in Malibu
Average Family Size in Malibu is 3.0 People.
What is the Average Household Size in Malibu
Average Household Size in Malibu is 2.4 People.
How Large is the Labor Force in Malibu?
There are 5,040 People in the Labor Forcein in Malibu.
What is the Percentage of People in the Labor Force in Malibu?
56.7% of People are in the Labor Force in Malibu.
What is the Unemployment Rate in Malibu?
Unemployment Rate in Malibu is 5.5%.