Montecito, CA Map & Demographics
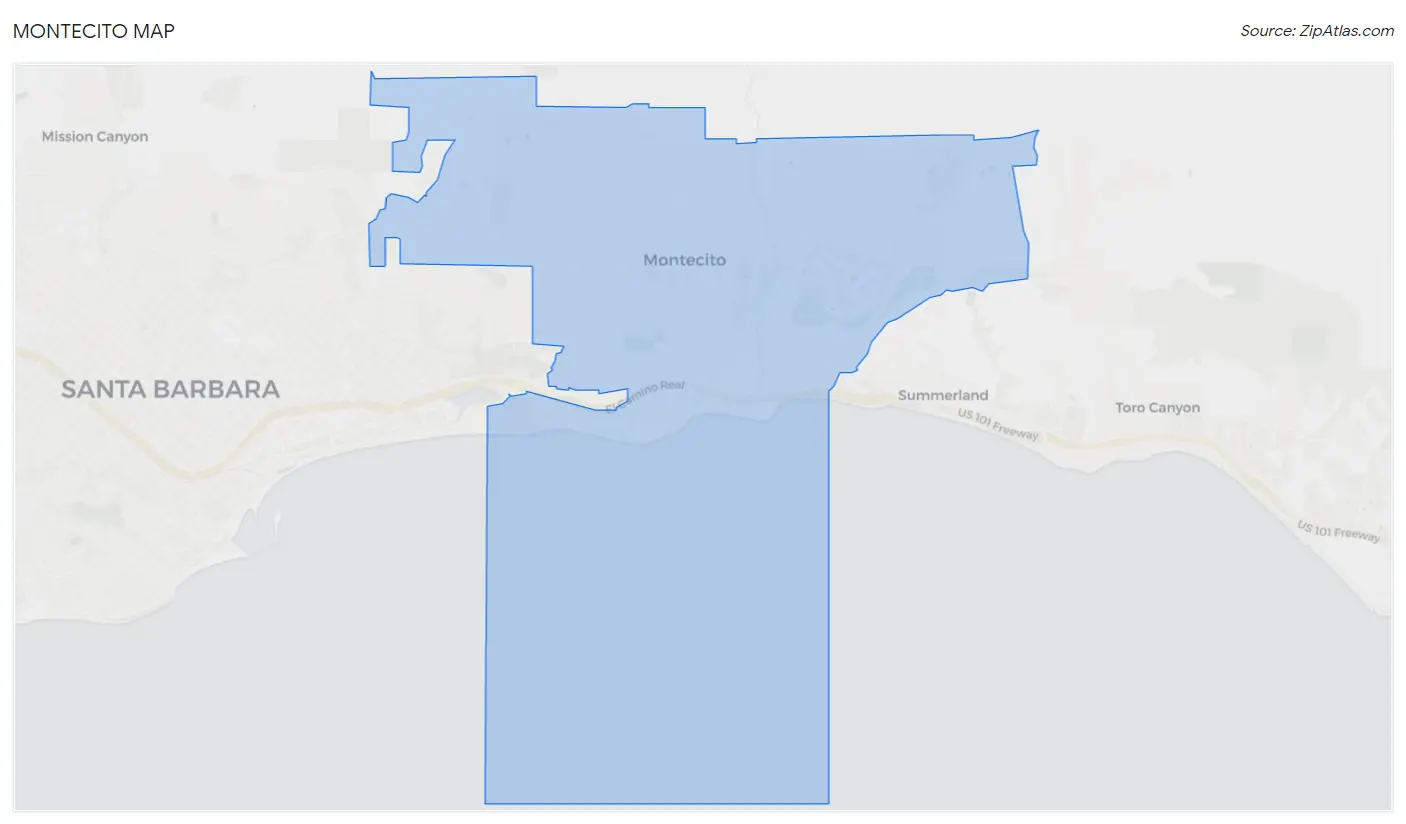
Montecito Map
Montecito Overview
$127,544
PER CAPITA INCOME
$214,444
AVG FAMILY INCOME
$212,154
AVG HOUSEHOLD INCOME
59.7%
WAGE / INCOME GAP [ % ]
40.3¢/ $1
WAGE / INCOME GAP [ $ ]
0.54
INEQUALITY / GINI INDEX
8,529
TOTAL POPULATION
3,812
MALE POPULATION
4,717
FEMALE POPULATION
80.81
MALES / 100 FEMALES
123.74
FEMALES / 100 MALES
50.4
MEDIAN AGE
2.8
AVG FAMILY SIZE
2.3
AVG HOUSEHOLD SIZE
3,216
LABOR FORCE [ PEOPLE ]
43.1%
PERCENT IN LABOR FORCE
5.0%
UNEMPLOYMENT RATE
Montecito Area Codes
Income in Montecito
Income Overview in Montecito
Per Capita Income in Montecito is $127,544, while median incomes of families and households are $214,444 and $212,154 respectively.
| Characteristic | Number | Measure |
| Per Capita Income | 8,529 | $127,544 |
| Median Family Income | 2,098 | $214,444 |
| Mean Family Income | 2,098 | $381,639 |
| Median Household Income | 3,251 | $212,154 |
| Mean Household Income | 3,251 | $327,332 |
| Income Deficit | 2,098 | $0 |
| Wage / Income Gap (%) | 8,529 | 59.71% |
| Wage / Income Gap ($) | 8,529 | 40.29¢ per $1 |
| Gini / Inequality Index | 8,529 | 0.54 |
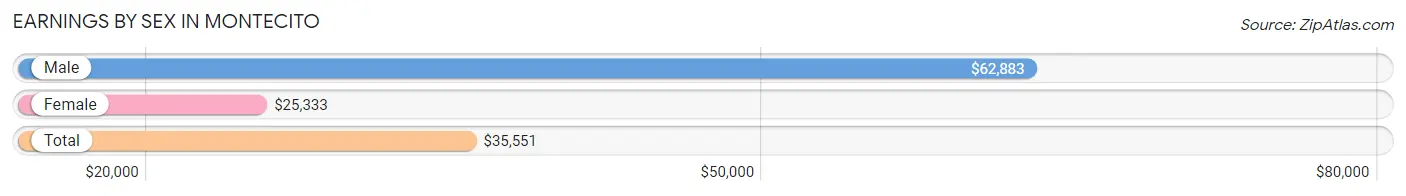
Earnings by Sex in Montecito
Average Earnings in Montecito are $35,551, $62,883 for men and $25,333 for women, a difference of 59.7%.
| Sex | Number | Average Earnings |
| Male | 2,059 (54.4%) | $62,883 |
| Female | 1,724 (45.6%) | $25,333 |
| Total | 3,783 (100.0%) | $35,551 |
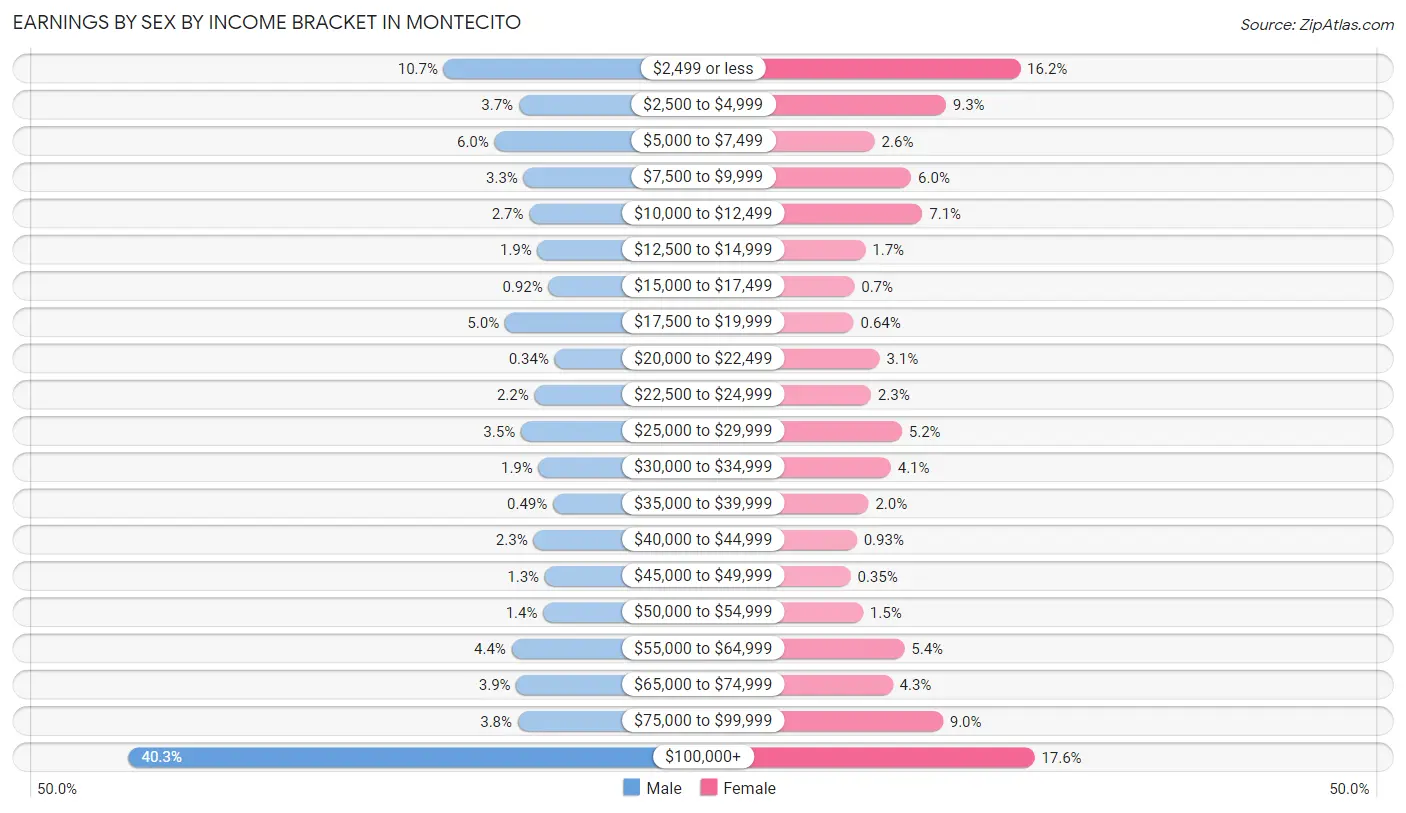
Earnings by Sex by Income Bracket in Montecito
The most common earnings brackets in Montecito are $100,000+ for men (829 | 40.3%) and $100,000+ for women (303 | 17.6%).
| Income | Male | Female |
| $2,499 or less | 221 (10.7%) | 280 (16.2%) |
| $2,500 to $4,999 | 76 (3.7%) | 160 (9.3%) |
| $5,000 to $7,499 | 123 (6.0%) | 45 (2.6%) |
| $7,500 to $9,999 | 67 (3.3%) | 104 (6.0%) |
| $10,000 to $12,499 | 56 (2.7%) | 122 (7.1%) |
| $12,500 to $14,999 | 40 (1.9%) | 30 (1.7%) |
| $15,000 to $17,499 | 19 (0.9%) | 12 (0.7%) |
| $17,500 to $19,999 | 103 (5.0%) | 11 (0.6%) |
| $20,000 to $22,499 | 7 (0.3%) | 53 (3.1%) |
| $22,500 to $24,999 | 46 (2.2%) | 39 (2.3%) |
| $25,000 to $29,999 | 72 (3.5%) | 89 (5.2%) |
| $30,000 to $34,999 | 38 (1.8%) | 71 (4.1%) |
| $35,000 to $39,999 | 10 (0.5%) | 35 (2.0%) |
| $40,000 to $44,999 | 48 (2.3%) | 16 (0.9%) |
| $45,000 to $49,999 | 26 (1.3%) | 6 (0.4%) |
| $50,000 to $54,999 | 29 (1.4%) | 26 (1.5%) |
| $55,000 to $64,999 | 90 (4.4%) | 93 (5.4%) |
| $65,000 to $74,999 | 81 (3.9%) | 74 (4.3%) |
| $75,000 to $99,999 | 78 (3.8%) | 155 (9.0%) |
| $100,000+ | 829 (40.3%) | 303 (17.6%) |
| Total | 2,059 (100.0%) | 1,724 (100.0%) |
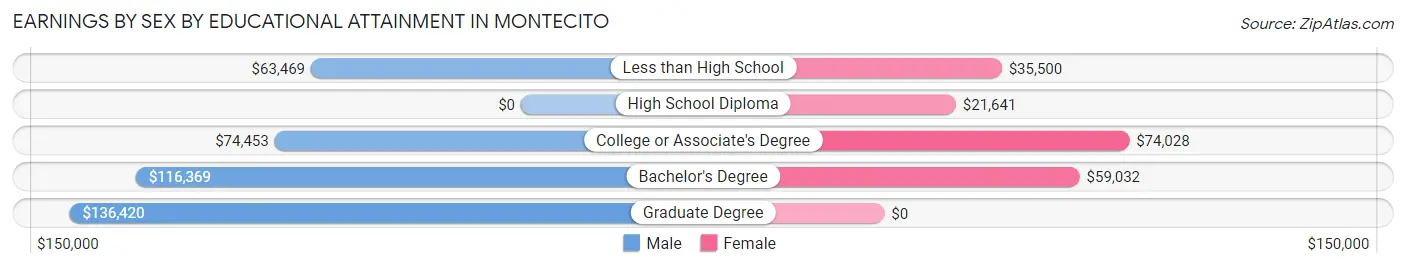
Earnings by Sex by Educational Attainment in Montecito
Average earnings in Montecito are $108,750 for men and $50,750 for women, a difference of 53.3%. Men with an educational attainment of graduate degree enjoy the highest average annual earnings of $136,420, while those with less than high school education earn the least with $63,469. Women with an educational attainment of college or associate's degree earn the most with the average annual earnings of $74,028, while those with high school diploma education have the smallest earnings of $21,641.
| Educational Attainment | Male Income | Female Income |
| Less than High School | $63,469 | $35,500 |
| High School Diploma | - | - |
| College or Associate's Degree | $74,453 | $74,028 |
| Bachelor's Degree | $116,369 | $59,032 |
| Graduate Degree | $136,420 | $0 |
| Total | $108,750 | $50,750 |
Family Income in Montecito
Family Income Brackets in Montecito
According to the Montecito family income data, there are 1,127 families falling into the $200,000+ income range, which is the most common income bracket and makes up 53.7% of all families. Conversely, the $10,000 to $14,999 income bracket is the least frequent group with only 6 families (0.3%) belonging to this category.
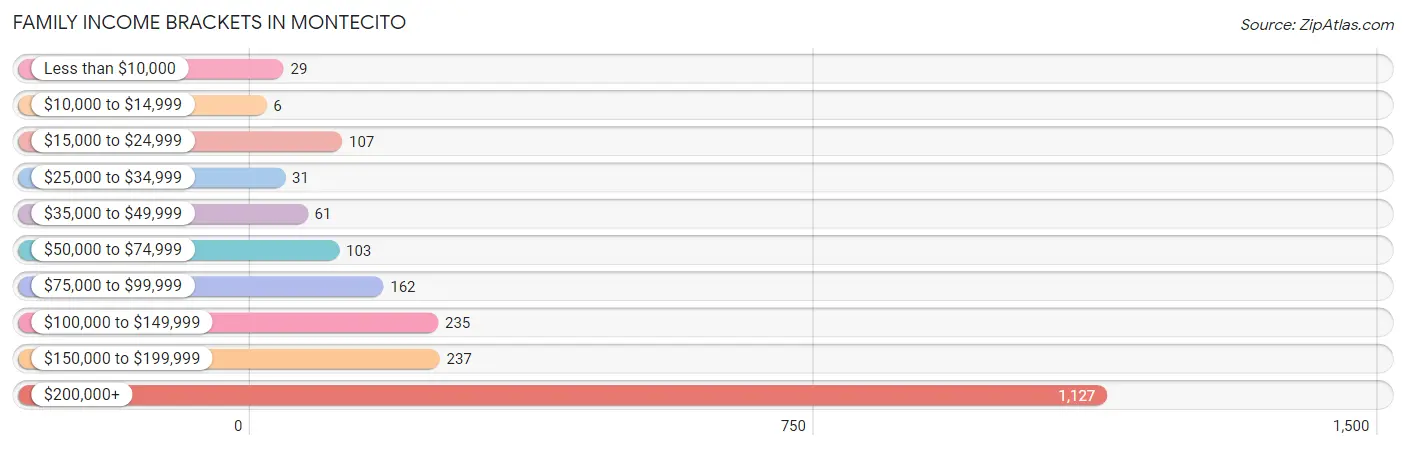
| Income Bracket | # Families | % Families |
| Less than $10,000 | 29 | 1.4% |
| $10,000 to $14,999 | 6 | 0.3% |
| $15,000 to $24,999 | 107 | 5.1% |
| $25,000 to $34,999 | 31 | 1.5% |
| $35,000 to $49,999 | 61 | 2.9% |
| $50,000 to $74,999 | 103 | 4.9% |
| $75,000 to $99,999 | 162 | 7.7% |
| $100,000 to $149,999 | 235 | 11.2% |
| $150,000 to $199,999 | 237 | 11.3% |
| $200,000+ | 1,127 | 53.7% |
Family Income by Famaliy Size in Montecito
5-person families (82 | 3.9%) account for the highest median family income in Montecito with $250,001 per family, while 2-person families (1,384 | 66.0%) have the highest median income of $114,722 per family member.
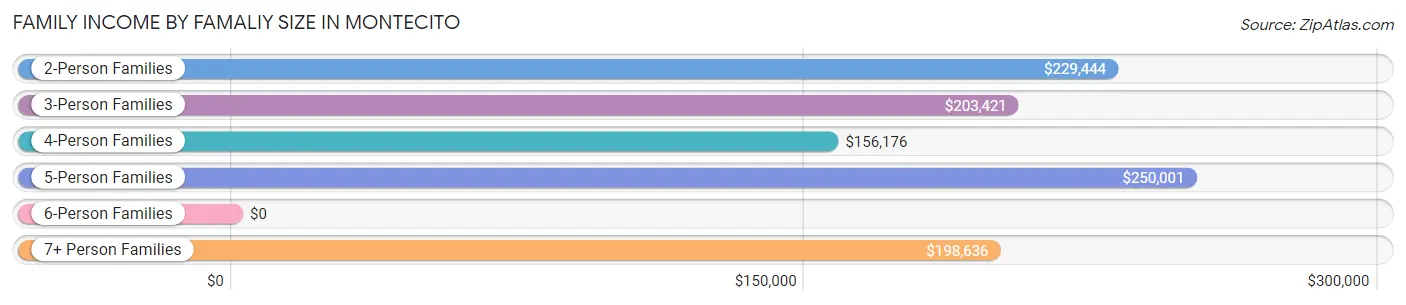
| Income Bracket | # Families | Median Income |
| 2-Person Families | 1,384 (66.0%) | $229,444 |
| 3-Person Families | 252 (12.0%) | $203,421 |
| 4-Person Families | 340 (16.2%) | $156,176 |
| 5-Person Families | 82 (3.9%) | $250,001 |
| 6-Person Families | 8 (0.4%) | $0 |
| 7+ Person Families | 32 (1.5%) | $198,636 |
| Total | 2,098 (100.0%) | $214,444 |
Family Income by Number of Earners in Montecito
The median family income in Montecito is $214,444, with families comprising no earners (674) having the highest median family income of $250,001, while families with 2 earners (629) have the lowest median family income of $192,014, accounting for 32.1% and 30.0% of families, respectively.
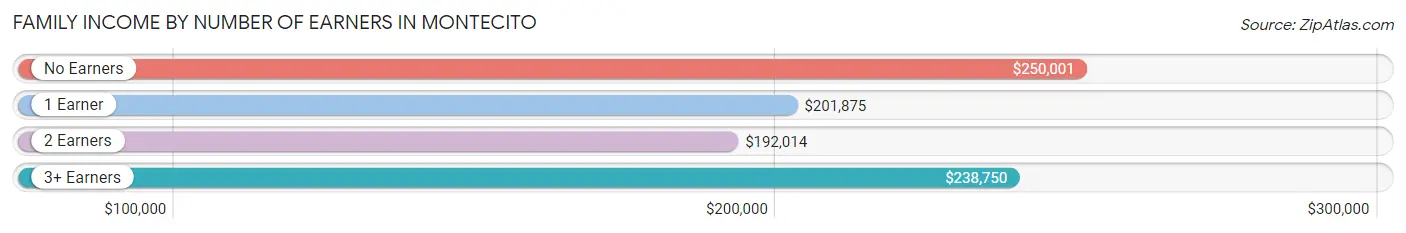
| Number of Earners | # Families | Median Income |
| No Earners | 674 (32.1%) | $250,001 |
| 1 Earner | 721 (34.4%) | $201,875 |
| 2 Earners | 629 (30.0%) | $192,014 |
| 3+ Earners | 74 (3.5%) | $238,750 |
| Total | 2,098 (100.0%) | $214,444 |
Household Income in Montecito
Household Income Brackets in Montecito
With 1,752 households falling in the category, the $200,000+ income range is the most frequent in Montecito, accounting for 53.9% of all households. In contrast, only 16 households (0.5%) fall into the $10,000 to $14,999 income bracket, making it the least populous group.
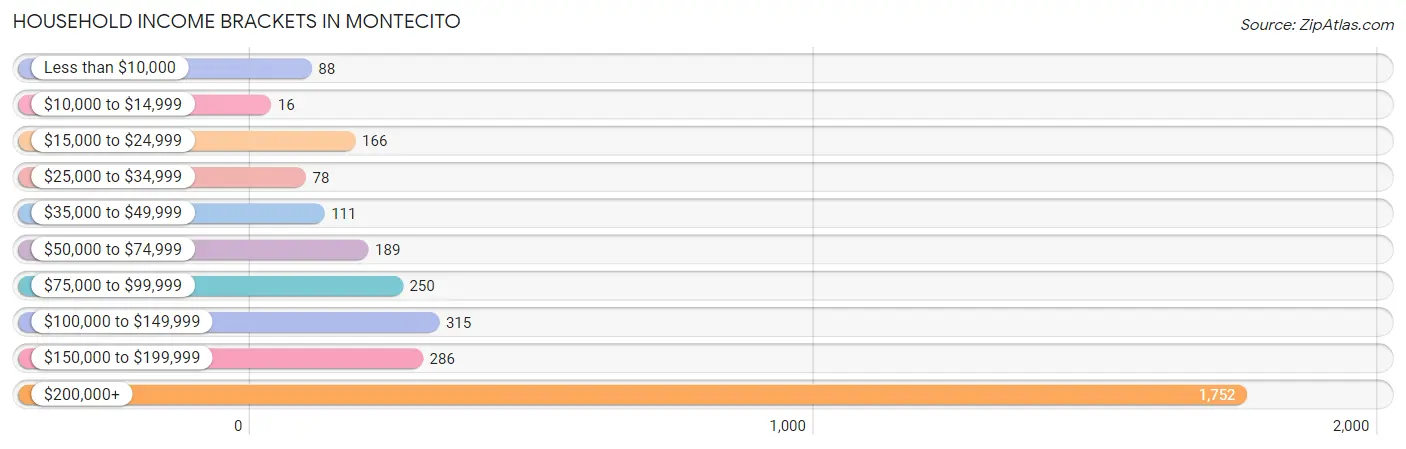
| Income Bracket | # Households | % Households |
| Less than $10,000 | 88 | 2.7% |
| $10,000 to $14,999 | 16 | 0.5% |
| $15,000 to $24,999 | 166 | 5.1% |
| $25,000 to $34,999 | 78 | 2.4% |
| $35,000 to $49,999 | 111 | 3.4% |
| $50,000 to $74,999 | 189 | 5.8% |
| $75,000 to $99,999 | 250 | 7.7% |
| $100,000 to $149,999 | 315 | 9.7% |
| $150,000 to $199,999 | 286 | 8.8% |
| $200,000+ | 1,752 | 53.9% |
Household Income by Householder Age in Montecito
The median household income in Montecito is $212,154, with the highest median household income of $216,514 found in the 65+ years age bracket for the primary householder. A total of 1,888 households (58.1%) fall into this category. Meanwhile, the 15 to 24 years age bracket for the primary householder has the lowest median household income of $0, with 45 households (1.4%) in this group.
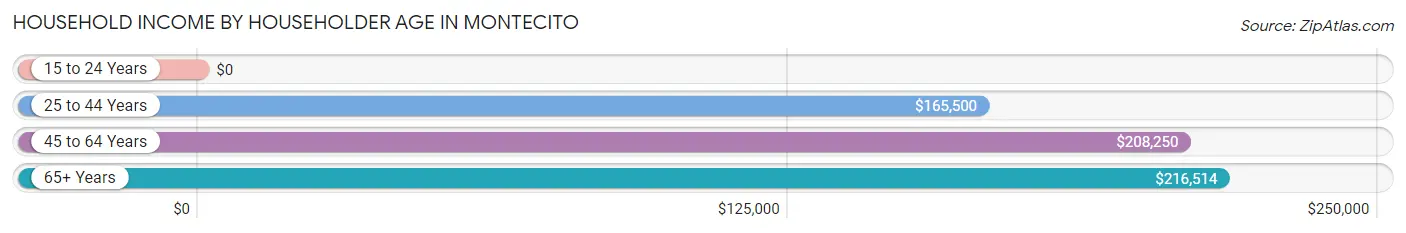
| Income Bracket | # Households | Median Income |
| 15 to 24 Years | 45 (1.4%) | $0 |
| 25 to 44 Years | 448 (13.8%) | $165,500 |
| 45 to 64 Years | 870 (26.8%) | $208,250 |
| 65+ Years | 1,888 (58.1%) | $216,514 |
| Total | 3,251 (100.0%) | $212,154 |
Poverty in Montecito
Income Below Poverty by Sex and Age in Montecito
With 9.2% poverty level for males and 6.7% for females among the residents of Montecito, 25 to 34 year old males and 25 to 34 year old females are the most vulnerable to poverty, with 126 males (49.2%) and 48 females (28.7%) in their respective age groups living below the poverty level.
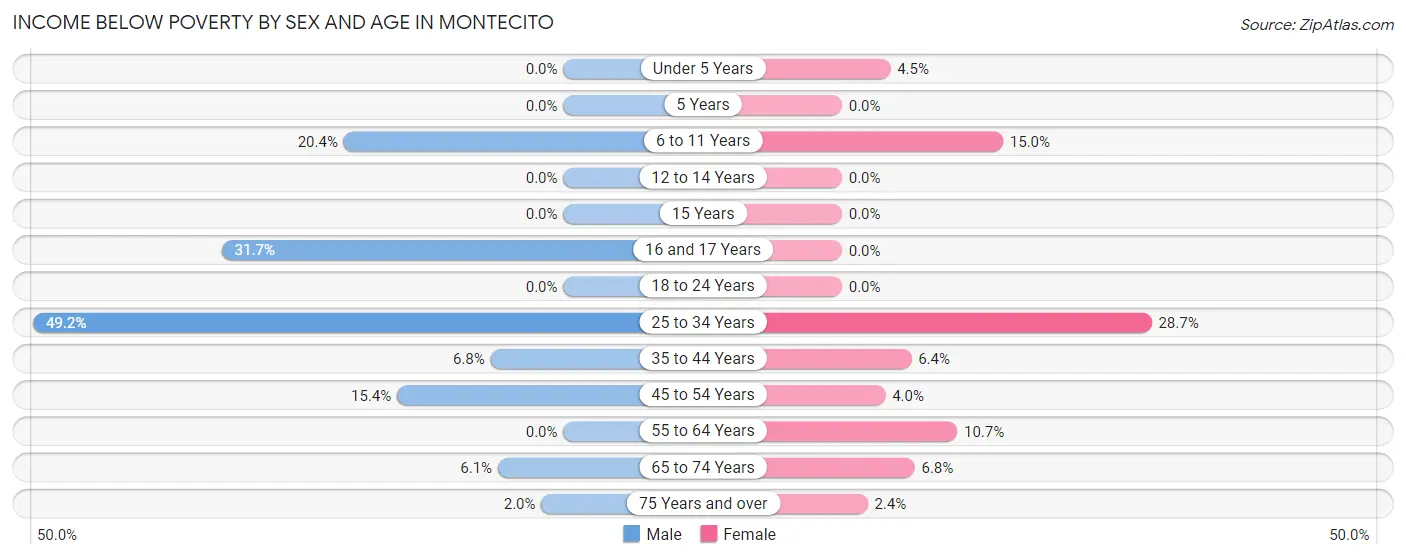
| Age Bracket | Male | Female |
| Under 5 Years | 0 (0.0%) | 7 (4.5%) |
| 5 Years | 0 (0.0%) | 0 (0.0%) |
| 6 to 11 Years | 32 (20.4%) | 48 (14.9%) |
| 12 to 14 Years | 0 (0.0%) | 0 (0.0%) |
| 15 Years | 0 (0.0%) | 0 (0.0%) |
| 16 and 17 Years | 26 (31.7%) | 0 (0.0%) |
| 18 to 24 Years | 0 (0.0%) | 0 (0.0%) |
| 25 to 34 Years | 126 (49.2%) | 48 (28.7%) |
| 35 to 44 Years | 21 (6.8%) | 27 (6.4%) |
| 45 to 54 Years | 48 (15.4%) | 14 (4.0%) |
| 55 to 64 Years | 0 (0.0%) | 60 (10.7%) |
| 65 to 74 Years | 35 (6.1%) | 45 (6.8%) |
| 75 Years and over | 15 (2.0%) | 25 (2.4%) |
| Total | 303 (9.2%) | 274 (6.7%) |
Income Above Poverty by Sex and Age in Montecito
According to the poverty statistics in Montecito, males aged under 5 years and females aged 5 years are the age groups that are most secure financially, with 100.0% of males and 100.0% of females in these age groups living above the poverty line.
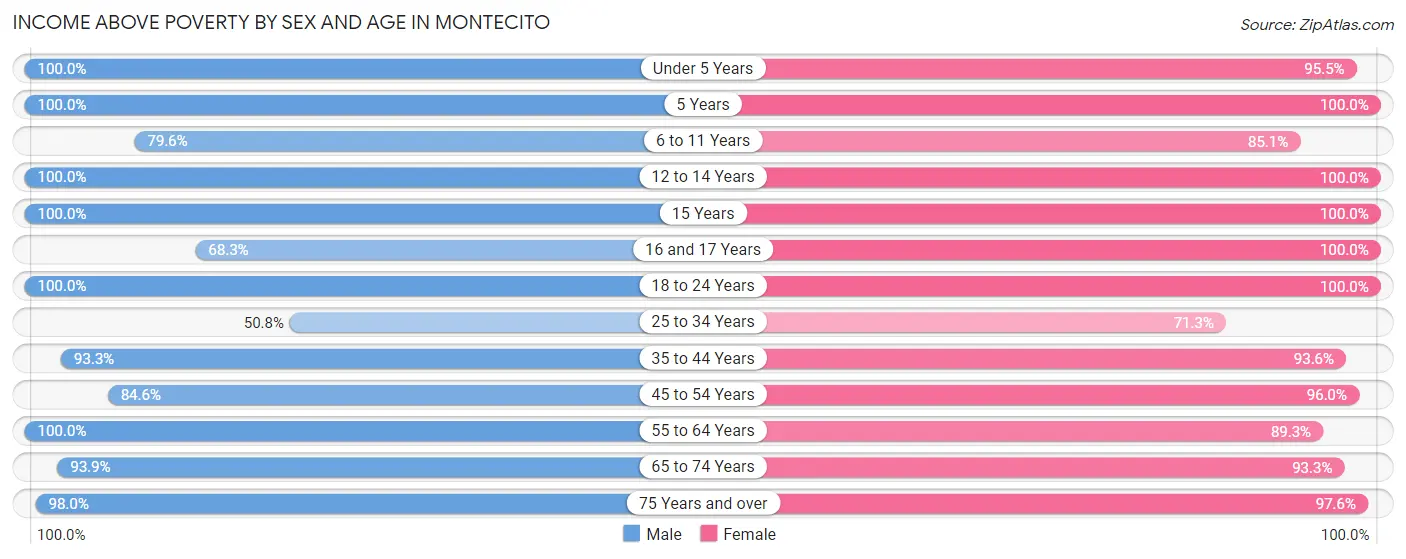
| Age Bracket | Male | Female |
| Under 5 Years | 112 (100.0%) | 149 (95.5%) |
| 5 Years | 38 (100.0%) | 26 (100.0%) |
| 6 to 11 Years | 125 (79.6%) | 273 (85.1%) |
| 12 to 14 Years | 54 (100.0%) | 100 (100.0%) |
| 15 Years | 18 (100.0%) | 34 (100.0%) |
| 16 and 17 Years | 56 (68.3%) | 79 (100.0%) |
| 18 to 24 Years | 257 (100.0%) | 191 (100.0%) |
| 25 to 34 Years | 130 (50.8%) | 119 (71.3%) |
| 35 to 44 Years | 290 (93.2%) | 392 (93.6%) |
| 45 to 54 Years | 263 (84.6%) | 333 (96.0%) |
| 55 to 64 Years | 394 (100.0%) | 501 (89.3%) |
| 65 to 74 Years | 542 (93.9%) | 622 (93.2%) |
| 75 Years and over | 721 (98.0%) | 1,025 (97.6%) |
| Total | 3,000 (90.8%) | 3,844 (93.3%) |
Income Below Poverty Among Married-Couple Families in Montecito
The poverty statistics for married-couple families in Montecito show that 6.1% or 108 of the total 1,781 families live below the poverty line. Families with 1 or 2 children have the highest poverty rate of 18.0%, comprising of 70 families. On the other hand, families with 3 or 4 children have the lowest poverty rate of 0.0%, which includes 0 families.
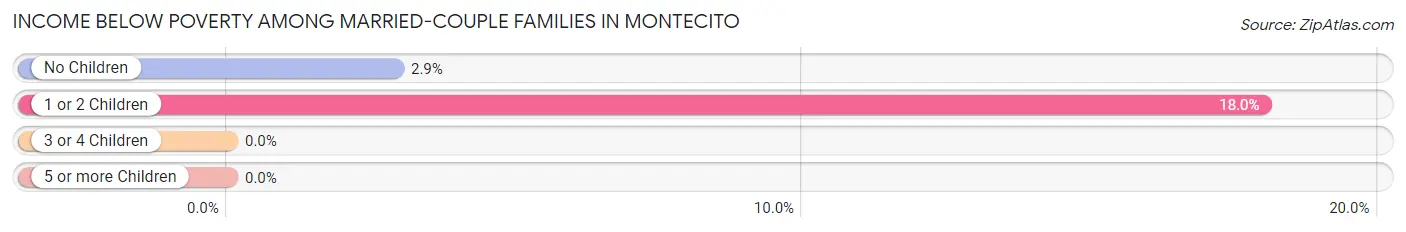
| Children | Above Poverty | Below Poverty |
| No Children | 1,279 (97.1%) | 38 (2.9%) |
| 1 or 2 Children | 319 (82.0%) | 70 (18.0%) |
| 3 or 4 Children | 71 (100.0%) | 0 (0.0%) |
| 5 or more Children | 4 (100.0%) | 0 (0.0%) |
| Total | 1,673 (93.9%) | 108 (6.1%) |
Income Below Poverty Among Single-Parent Households in Montecito
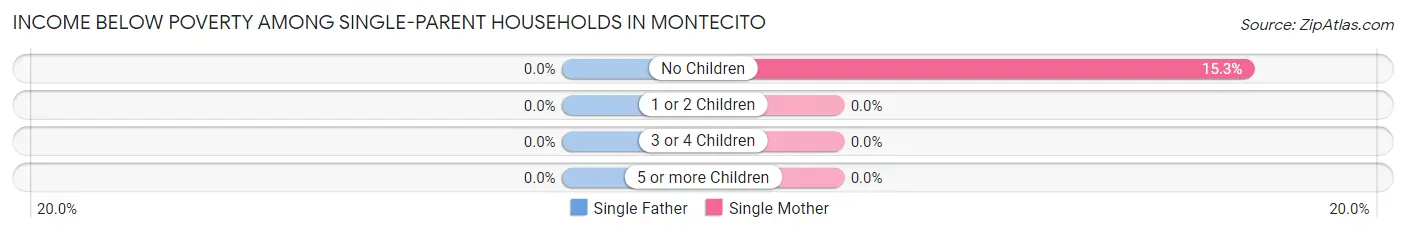
| Children | Single Father | Single Mother |
| No Children | 0 (0.0%) | 26 (15.3%) |
| 1 or 2 Children | 0 (0.0%) | 0 (0.0%) |
| 3 or 4 Children | 0 (0.0%) | 0 (0.0%) |
| 5 or more Children | 0 (0.0%) | 0 (0.0%) |
| Total | 0 (0.0%) | 26 (10.3%) |
Income Below Poverty Among Married-Couple vs Single-Parent Households in Montecito
The poverty data for Montecito shows that 108 of the married-couple family households (6.1%) and 26 of the single-parent households (8.2%) are living below the poverty level. Within the married-couple family households, those with 1 or 2 children have the highest poverty rate, with 70 households (18.0%) falling below the poverty line. Among the single-parent households, those with no children have the highest poverty rate, with 26 household (13.5%) living below poverty.
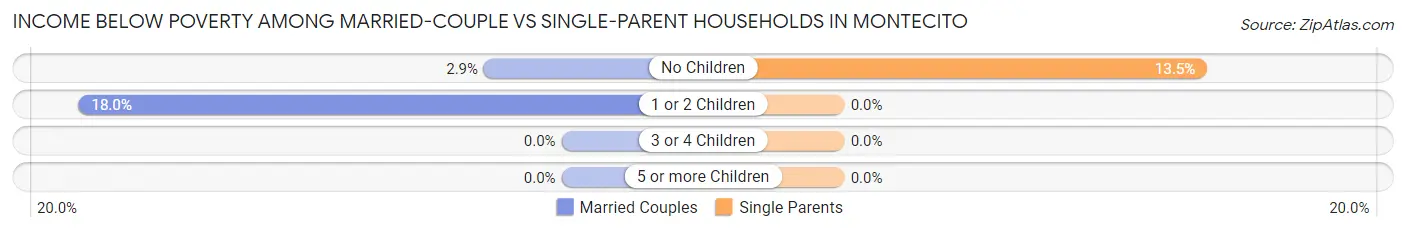
| Children | Married-Couple Families | Single-Parent Households |
| No Children | 38 (2.9%) | 26 (13.5%) |
| 1 or 2 Children | 70 (18.0%) | 0 (0.0%) |
| 3 or 4 Children | 0 (0.0%) | 0 (0.0%) |
| 5 or more Children | 0 (0.0%) | 0 (0.0%) |
| Total | 108 (6.1%) | 26 (8.2%) |
Race in Montecito
The most populous races in Montecito are White / Caucasian (7,254 | 85.1%), Two or more Races (826 | 9.7%), and Hispanic or Latino (739 | 8.7%).
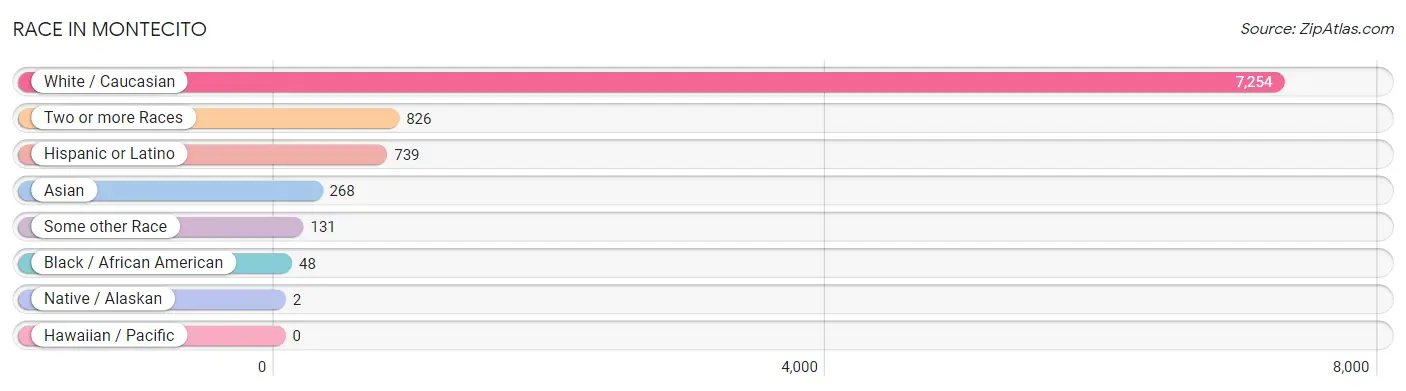
| Race | # Population | % Population |
| Asian | 268 | 3.1% |
| Black / African American | 48 | 0.6% |
| Hawaiian / Pacific | 0 | 0.0% |
| Hispanic or Latino | 739 | 8.7% |
| Native / Alaskan | 2 | 0.0% |
| White / Caucasian | 7,254 | 85.1% |
| Two or more Races | 826 | 9.7% |
| Some other Race | 131 | 1.5% |
| Total | 8,529 | 100.0% |
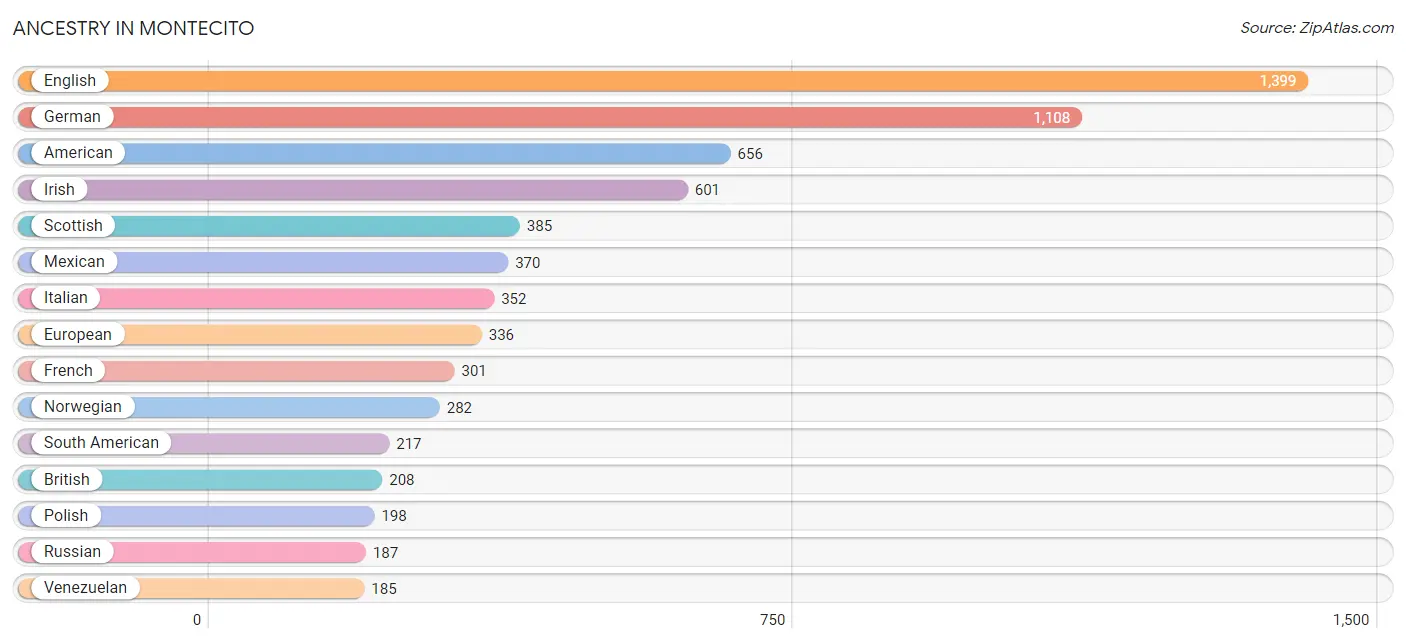
Ancestry in Montecito
The most populous ancestries reported in Montecito are English (1,399 | 16.4%), German (1,108 | 13.0%), American (656 | 7.7%), Irish (601 | 7.0%), and Scottish (385 | 4.5%), together accounting for 48.6% of all Montecito residents.
| Ancestry | # Population | % Population |
| African | 18 | 0.2% |
| Albanian | 6 | 0.1% |
| American | 656 | 7.7% |
| Argentinean | 1 | 0.0% |
| Armenian | 37 | 0.4% |
| Australian | 10 | 0.1% |
| Austrian | 48 | 0.6% |
| Basque | 9 | 0.1% |
| Bhutanese | 48 | 0.6% |
| British | 208 | 2.4% |
| Bulgarian | 5 | 0.1% |
| Burmese | 85 | 1.0% |
| Canadian | 17 | 0.2% |
| Central American | 65 | 0.8% |
| Cherokee | 22 | 0.3% |
| Colombian | 15 | 0.2% |
| Creek | 8 | 0.1% |
| Croatian | 20 | 0.2% |
| Cuban | 4 | 0.1% |
| Czech | 19 | 0.2% |
| Czechoslovakian | 6 | 0.1% |
| Danish | 96 | 1.1% |
| Dutch | 104 | 1.2% |
| Eastern European | 42 | 0.5% |
| Ecuadorian | 10 | 0.1% |
| English | 1,399 | 16.4% |
| European | 336 | 3.9% |
| Filipino | 5 | 0.1% |
| Finnish | 70 | 0.8% |
| French | 301 | 3.5% |
| French Canadian | 15 | 0.2% |
| German | 1,108 | 13.0% |
| Greek | 41 | 0.5% |
| Guatemalan | 1 | 0.0% |
| Honduran | 47 | 0.5% |
| Hungarian | 64 | 0.7% |
| Indian (Asian) | 169 | 2.0% |
| Iranian | 53 | 0.6% |
| Irish | 601 | 7.0% |
| Israeli | 10 | 0.1% |
| Italian | 352 | 4.1% |
| Korean | 59 | 0.7% |
| Lithuanian | 27 | 0.3% |
| Macedonian | 5 | 0.1% |
| Mexican | 370 | 4.3% |
| Native Hawaiian | 44 | 0.5% |
| Nicaraguan | 12 | 0.1% |
| Northern European | 36 | 0.4% |
| Norwegian | 282 | 3.3% |
| Pakistani | 18 | 0.2% |
| Polish | 198 | 2.3% |
| Portuguese | 16 | 0.2% |
| Puerto Rican | 21 | 0.3% |
| Romanian | 20 | 0.2% |
| Russian | 187 | 2.2% |
| Salvadoran | 5 | 0.1% |
| Scandinavian | 37 | 0.4% |
| Scotch-Irish | 129 | 1.5% |
| Scottish | 385 | 4.5% |
| Seminole | 5 | 0.1% |
| Sioux | 5 | 0.1% |
| Slavic | 34 | 0.4% |
| South African | 6 | 0.1% |
| South American | 217 | 2.5% |
| Spaniard | 40 | 0.5% |
| Spanish | 2 | 0.0% |
| Sri Lankan | 26 | 0.3% |
| Subsaharan African | 24 | 0.3% |
| Swedish | 151 | 1.8% |
| Swiss | 37 | 0.4% |
| Thai | 51 | 0.6% |
| Trinidadian and Tobagonian | 11 | 0.1% |
| Ukrainian | 19 | 0.2% |
| Venezuelan | 185 | 2.2% |
| Welsh | 171 | 2.0% | View All 75 Rows |
Immigrants in Montecito
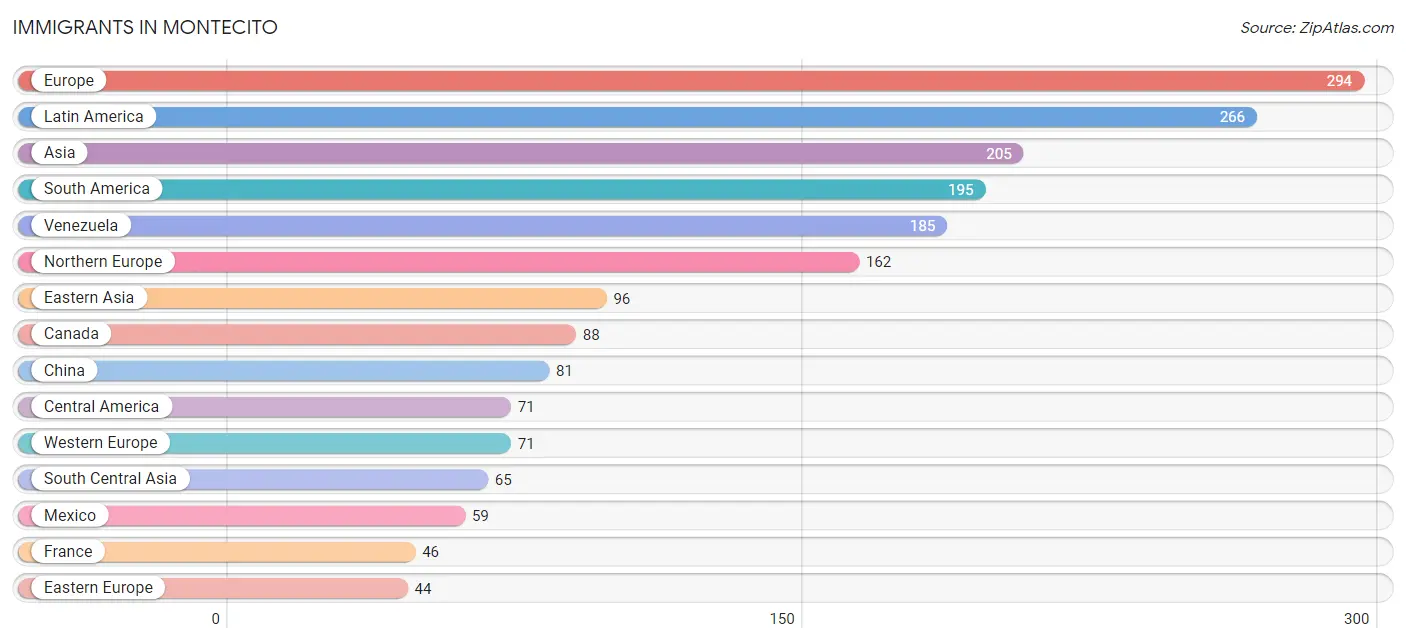
The most numerous immigrant groups reported in Montecito came from Europe (294 | 3.5%), Latin America (266 | 3.1%), Asia (205 | 2.4%), South America (195 | 2.3%), and Venezuela (185 | 2.2%), together accounting for 13.4% of all Montecito residents.
| Immigration Origin | # Population | % Population |
| Africa | 32 | 0.4% |
| Asia | 205 | 2.4% |
| Australia | 29 | 0.3% |
| Canada | 88 | 1.0% |
| Central America | 71 | 0.8% |
| China | 81 | 0.9% |
| Czechoslovakia | 16 | 0.2% |
| Denmark | 6 | 0.1% |
| Eastern Africa | 12 | 0.1% |
| Eastern Asia | 96 | 1.1% |
| Eastern Europe | 44 | 0.5% |
| Egypt | 17 | 0.2% |
| England | 11 | 0.1% |
| Europe | 294 | 3.5% |
| France | 46 | 0.5% |
| Germany | 16 | 0.2% |
| Honduras | 12 | 0.1% |
| Hong Kong | 7 | 0.1% |
| India | 23 | 0.3% |
| Iran | 42 | 0.5% |
| Ireland | 8 | 0.1% |
| Israel | 15 | 0.2% |
| Italy | 8 | 0.1% |
| Japan | 5 | 0.1% |
| Korea | 10 | 0.1% |
| Latin America | 266 | 3.1% |
| Malaysia | 6 | 0.1% |
| Mexico | 59 | 0.7% |
| Northern Africa | 17 | 0.2% |
| Northern Europe | 162 | 1.9% |
| Oceania | 29 | 0.3% |
| Poland | 18 | 0.2% |
| Russia | 2 | 0.0% |
| Singapore | 17 | 0.2% |
| South Africa | 3 | 0.0% |
| South America | 195 | 2.3% |
| South Central Asia | 65 | 0.8% |
| South Eastern Asia | 29 | 0.3% |
| Southern Europe | 17 | 0.2% |
| Spain | 9 | 0.1% |
| Sweden | 30 | 0.4% |
| Switzerland | 9 | 0.1% |
| Taiwan | 1 | 0.0% |
| Thailand | 6 | 0.1% |
| Ukraine | 8 | 0.1% |
| Venezuela | 185 | 2.2% |
| Western Asia | 15 | 0.2% |
| Western Europe | 71 | 0.8% |
| Zimbabwe | 12 | 0.1% | View All 49 Rows |
Sex and Age in Montecito
Sex and Age in Montecito
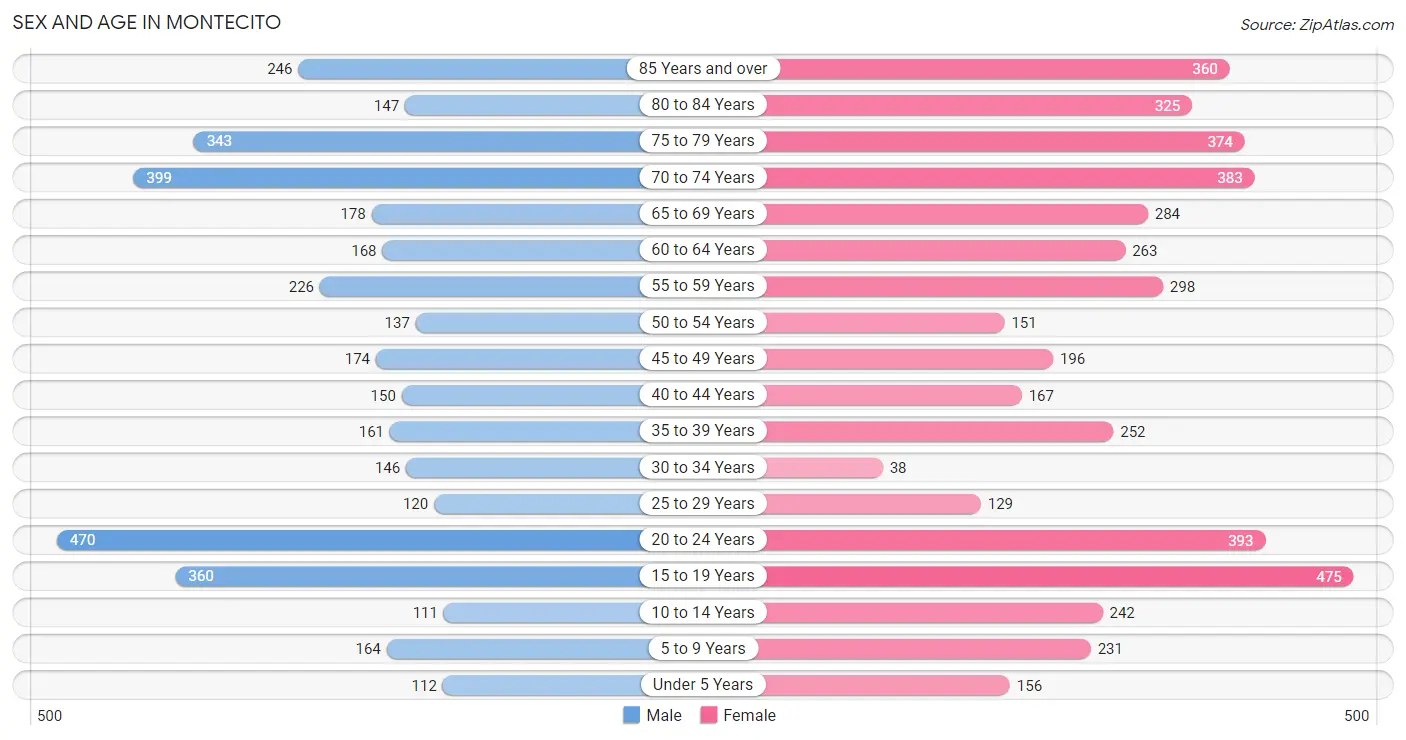
The most populous age groups in Montecito are 20 to 24 Years (470 | 12.3%) for men and 15 to 19 Years (475 | 10.1%) for women.
| Age Bracket | Male | Female |
| Under 5 Years | 112 (2.9%) | 156 (3.3%) |
| 5 to 9 Years | 164 (4.3%) | 231 (4.9%) |
| 10 to 14 Years | 111 (2.9%) | 242 (5.1%) |
| 15 to 19 Years | 360 (9.4%) | 475 (10.1%) |
| 20 to 24 Years | 470 (12.3%) | 393 (8.3%) |
| 25 to 29 Years | 120 (3.2%) | 129 (2.7%) |
| 30 to 34 Years | 146 (3.8%) | 38 (0.8%) |
| 35 to 39 Years | 161 (4.2%) | 252 (5.3%) |
| 40 to 44 Years | 150 (3.9%) | 167 (3.5%) |
| 45 to 49 Years | 174 (4.6%) | 196 (4.2%) |
| 50 to 54 Years | 137 (3.6%) | 151 (3.2%) |
| 55 to 59 Years | 226 (5.9%) | 298 (6.3%) |
| 60 to 64 Years | 168 (4.4%) | 263 (5.6%) |
| 65 to 69 Years | 178 (4.7%) | 284 (6.0%) |
| 70 to 74 Years | 399 (10.5%) | 383 (8.1%) |
| 75 to 79 Years | 343 (9.0%) | 374 (7.9%) |
| 80 to 84 Years | 147 (3.9%) | 325 (6.9%) |
| 85 Years and over | 246 (6.5%) | 360 (7.6%) |
| Total | 3,812 (100.0%) | 4,717 (100.0%) |
Families and Households in Montecito
Median Family Size in Montecito
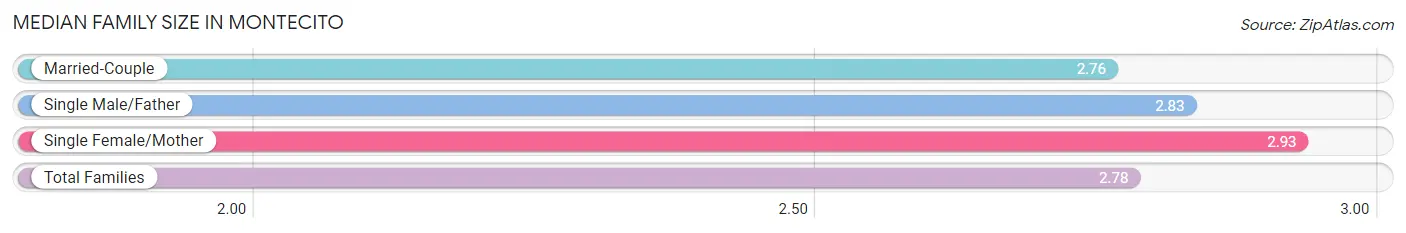
The median family size in Montecito is 2.78 persons per family, with single female/mother families (252 | 12.0%) accounting for the largest median family size of 2.93 persons per family. On the other hand, married-couple families (1,781 | 84.9%) represent the smallest median family size with 2.76 persons per family.
| Family Type | # Families | Family Size |
| Married-Couple | 1,781 (84.9%) | 2.76 |
| Single Male/Father | 65 (3.1%) | 2.83 |
| Single Female/Mother | 252 (12.0%) | 2.93 |
| Total Families | 2,098 (100.0%) | 2.78 |
Median Household Size in Montecito
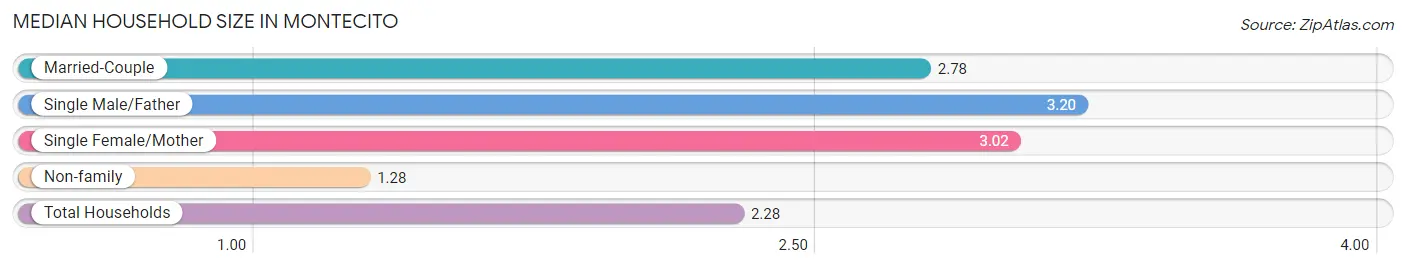
The median household size in Montecito is 2.28 persons per household, with single male/father households (65 | 2.0%) accounting for the largest median household size of 3.2 persons per household. non-family households (1,153 | 35.5%) represent the smallest median household size with 1.28 persons per household.
| Household Type | # Households | Household Size |
| Married-Couple | 1,781 (54.8%) | 2.78 |
| Single Male/Father | 65 (2.0%) | 3.20 |
| Single Female/Mother | 252 (7.7%) | 3.02 |
| Non-family | 1,153 (35.5%) | 1.28 |
| Total Households | 3,251 (100.0%) | 2.28 |
Household Size by Marriage Status in Montecito
Out of a total of 3,251 households in Montecito, 2,098 (64.5%) are family households, while 1,153 (35.5%) are nonfamily households. The most numerous type of family households are 2-person households, comprising 1,369, and the most common type of nonfamily households are 1-person households, comprising 987.
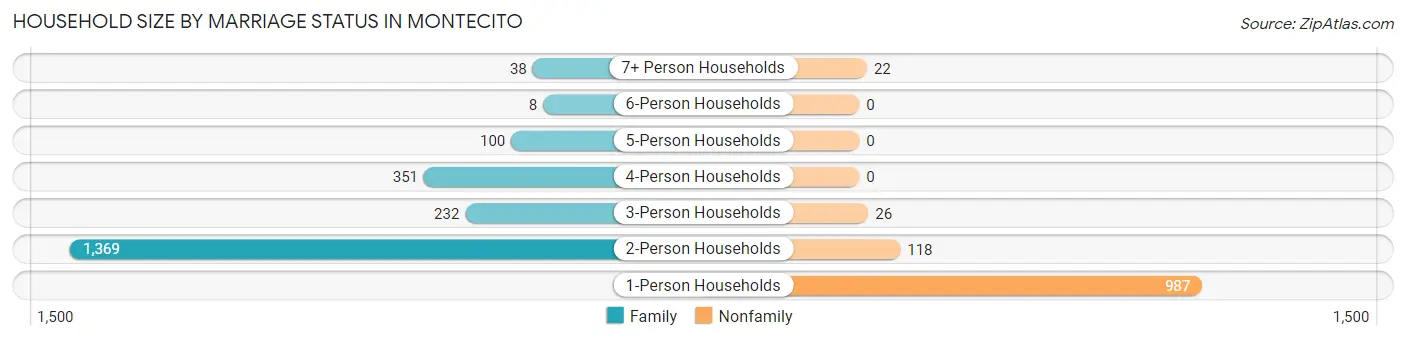
| Household Size | Family Households | Nonfamily Households |
| 1-Person Households | - | 987 (30.4%) |
| 2-Person Households | 1,369 (42.1%) | 118 (3.6%) |
| 3-Person Households | 232 (7.1%) | 26 (0.8%) |
| 4-Person Households | 351 (10.8%) | 0 (0.0%) |
| 5-Person Households | 100 (3.1%) | 0 (0.0%) |
| 6-Person Households | 8 (0.3%) | 0 (0.0%) |
| 7+ Person Households | 38 (1.2%) | 22 (0.7%) |
| Total | 2,098 (64.5%) | 1,153 (35.5%) |
Female Fertility in Montecito
Fertility by Age in Montecito
Average fertility rate in Montecito is 50.0 births per 1,000 women. Women in the age bracket of 20 to 34 years have the highest fertility rate with 98.0 births per 1,000 women. Women in the age bracket of 20 to 34 years acount for 66.3% of all women with births.
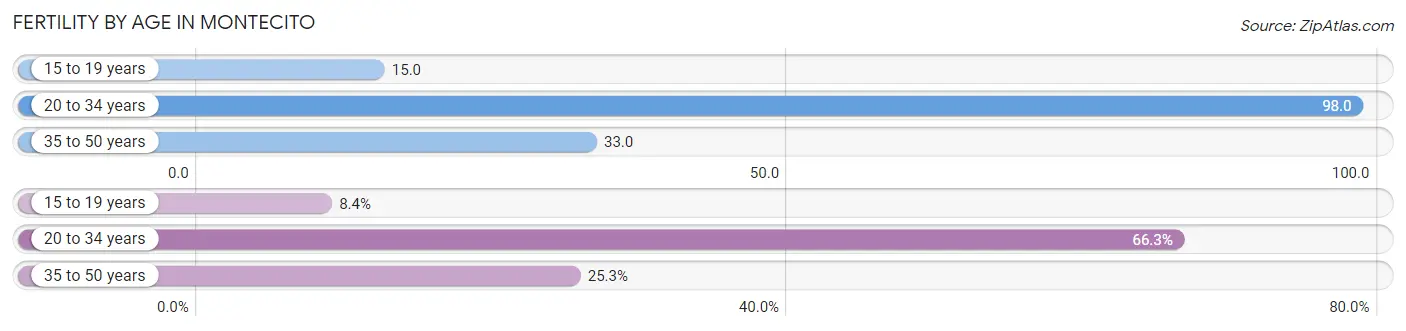
| Age Bracket | Women with Births | Births / 1,000 Women |
| 15 to 19 years | 7 (8.4%) | 15.0 |
| 20 to 34 years | 55 (66.3%) | 98.0 |
| 35 to 50 years | 21 (25.3%) | 33.0 |
| Total | 83 (100.0%) | 50.0 |
Fertility by Age by Marriage Status in Montecito
83.1% of women with births (83) in Montecito are married. The highest percentage of unmarried women with births falls into 15 to 19 years age bracket with 100.0% of them unmarried at the time of birth, while the lowest percentage of unmarried women with births belong to 35 to 50 years age bracket with 0.0% of them unmarried.
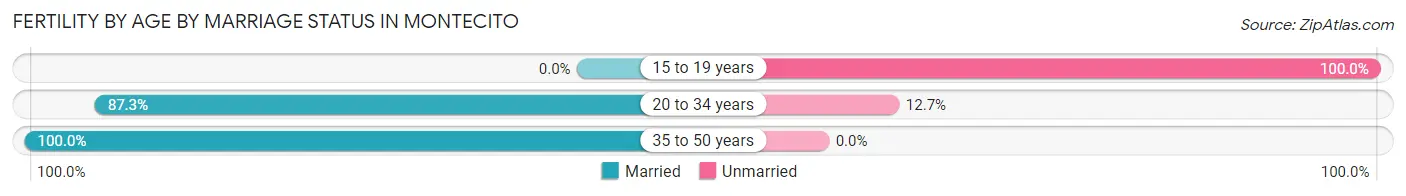
| Age Bracket | Married | Unmarried |
| 15 to 19 years | 0 (0.0%) | 7 (100.0%) |
| 20 to 34 years | 48 (87.3%) | 7 (12.7%) |
| 35 to 50 years | 21 (100.0%) | 0 (0.0%) |
| Total | 69 (83.1%) | 14 (16.9%) |
Fertility by Education in Montecito
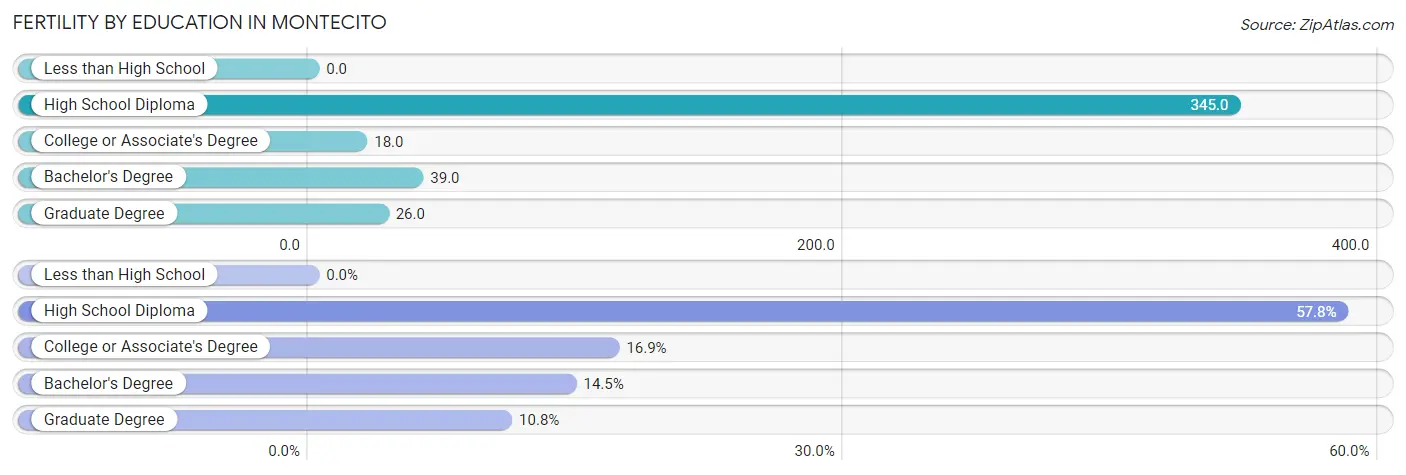
| Educational Attainment | Women with Births | Births / 1,000 Women |
| Less than High School | 0 (0.0%) | 0.0 |
| High School Diploma | 48 (57.8%) | 345.0 |
| College or Associate's Degree | 14 (16.9%) | 18.0 |
| Bachelor's Degree | 12 (14.5%) | 39.0 |
| Graduate Degree | 9 (10.8%) | 26.0 |
| Total | 83 (100.0%) | 50.0 |
Fertility by Education by Marriage Status in Montecito
16.9% of women with births in Montecito are unmarried. Women with the educational attainment of high school diploma are most likely to be married with 100.0% of them married at childbirth, while women with the educational attainment of college or associate's degree are least likely to be married with 100.0% of them unmarried at childbirth.
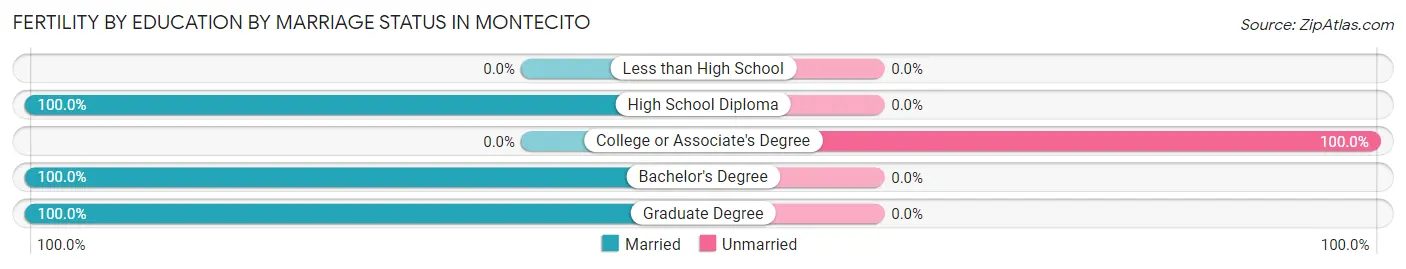
| Educational Attainment | Married | Unmarried |
| Less than High School | 0 (0.0%) | 0 (0.0%) |
| High School Diploma | 48 (100.0%) | 0 (0.0%) |
| College or Associate's Degree | 0 (0.0%) | 14 (100.0%) |
| Bachelor's Degree | 12 (100.0%) | 0 (0.0%) |
| Graduate Degree | 9 (100.0%) | 0 (0.0%) |
| Total | 69 (83.1%) | 14 (16.9%) |
Employment Characteristics in Montecito
Employment by Class of Employer in Montecito
Among the 2,997 employed individuals in Montecito, private company employees (1,328 | 44.3%), self-employed (incorporated) (532 | 17.7%), and self-employed (not incorporated) (407 | 13.6%) make up the most common classes of employment.
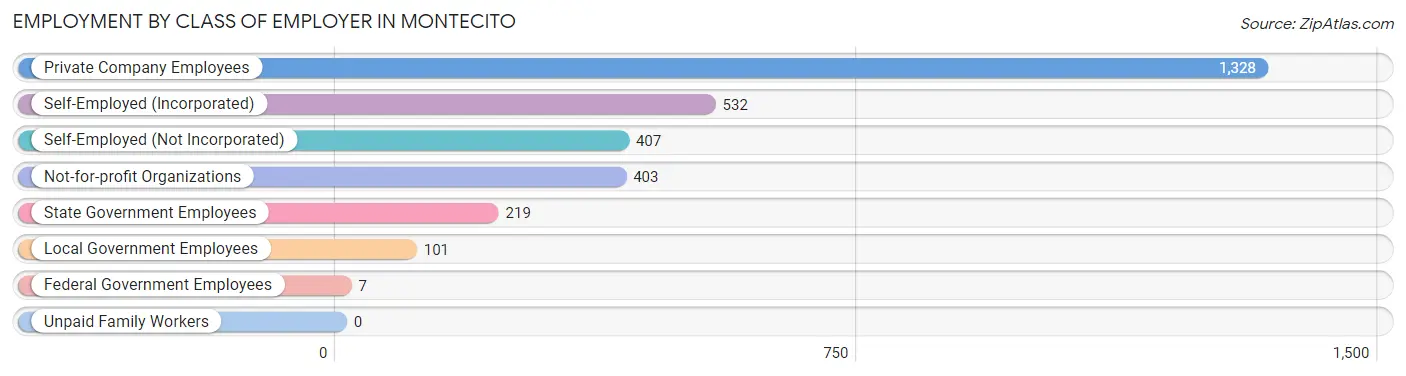
| Employer Class | # Employees | % Employees |
| Private Company Employees | 1,328 | 44.3% |
| Self-Employed (Incorporated) | 532 | 17.7% |
| Self-Employed (Not Incorporated) | 407 | 13.6% |
| Not-for-profit Organizations | 403 | 13.5% |
| Local Government Employees | 101 | 3.4% |
| State Government Employees | 219 | 7.3% |
| Federal Government Employees | 7 | 0.2% |
| Unpaid Family Workers | 0 | 0.0% |
| Total | 2,997 | 100.0% |
Employment Status by Age in Montecito
According to the labor force statistics for Montecito, out of the total population over 16 years of age (7,461), 43.1% or 3,216 individuals are in the labor force, with 5.0% or 161 of them unemployed. The age group with the highest labor force participation rate is 30 to 34 years, with 87.5% or 161 individuals in the labor force. Within the labor force, the 16 to 19 years age range has the highest percentage of unemployed individuals, with 16.7% or 44 of them being unemployed.
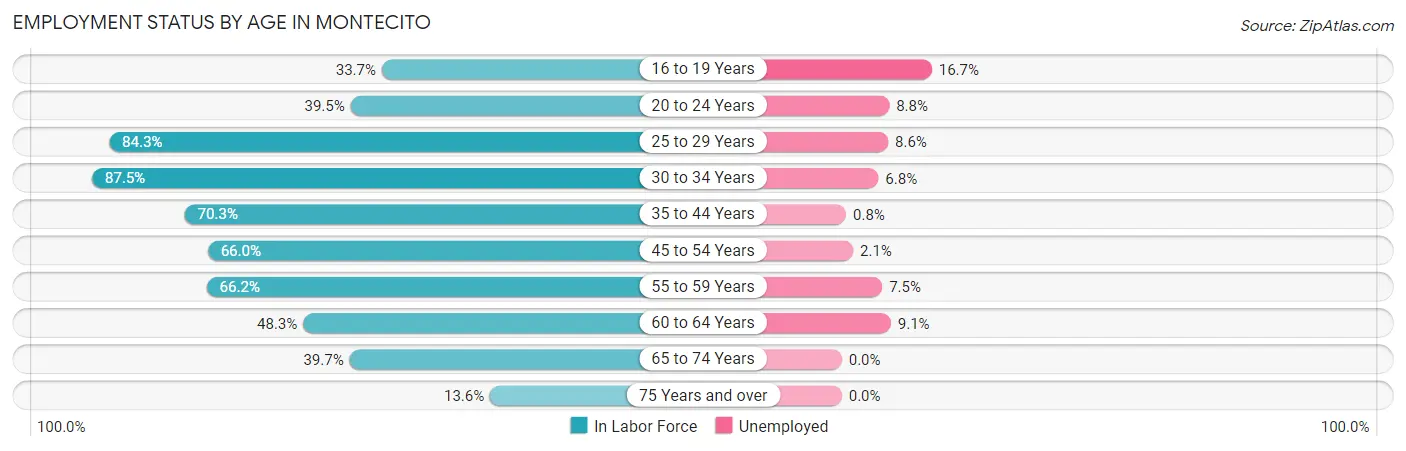
| Age Bracket | In Labor Force | Unemployed |
| 16 to 19 Years | 264 (33.7%) | 44 (16.7%) |
| 20 to 24 Years | 341 (39.5%) | 30 (8.8%) |
| 25 to 29 Years | 210 (84.3%) | 18 (8.6%) |
| 30 to 34 Years | 161 (87.5%) | 11 (6.8%) |
| 35 to 44 Years | 513 (70.3%) | 4 (0.8%) |
| 45 to 54 Years | 434 (66.0%) | 9 (2.1%) |
| 55 to 59 Years | 347 (66.2%) | 26 (7.5%) |
| 60 to 64 Years | 208 (48.3%) | 19 (9.1%) |
| 65 to 74 Years | 494 (39.7%) | 0 (0.0%) |
| 75 Years and over | 244 (13.6%) | 0 (0.0%) |
| Total | 3,216 (43.1%) | 161 (5.0%) |
Employment Status by Educational Attainment in Montecito
According to labor force statistics for Montecito, 67.5% of individuals (1,874) out of the total population between 25 and 64 years of age (2,776) are in the labor force, with 4.7% or 88 of them being unemployed. The group with the highest labor force participation rate are those with the educational attainment of less than high school, with 82.8% or 96 individuals in the labor force. Within the labor force, individuals with college / associate degree education have the highest percentage of unemployment, with 7.3% or 19 of them being unemployed.
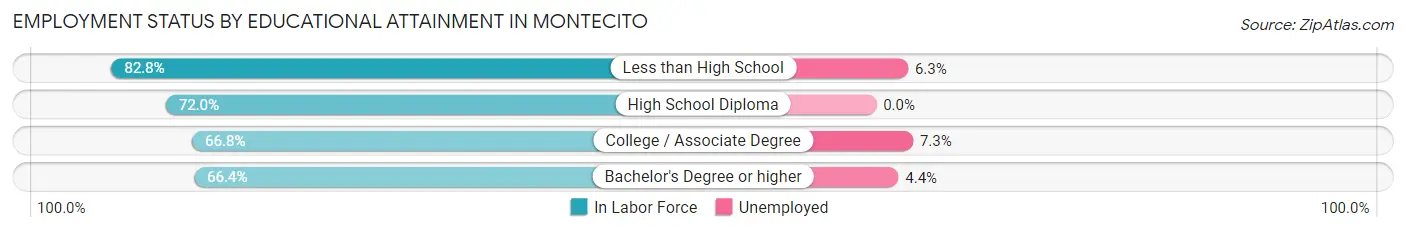
| Educational Attainment | In Labor Force | Unemployed |
| Less than High School | 96 (82.8%) | 7 (6.3%) |
| High School Diploma | 116 (72.0%) | 0 (0.0%) |
| College / Associate Degree | 266 (66.8%) | 29 (7.3%) |
| Bachelor's Degree or higher | 1,395 (66.4%) | 92 (4.4%) |
| Total | 1,874 (67.5%) | 130 (4.7%) |
Employment Occupations by Sex in Montecito
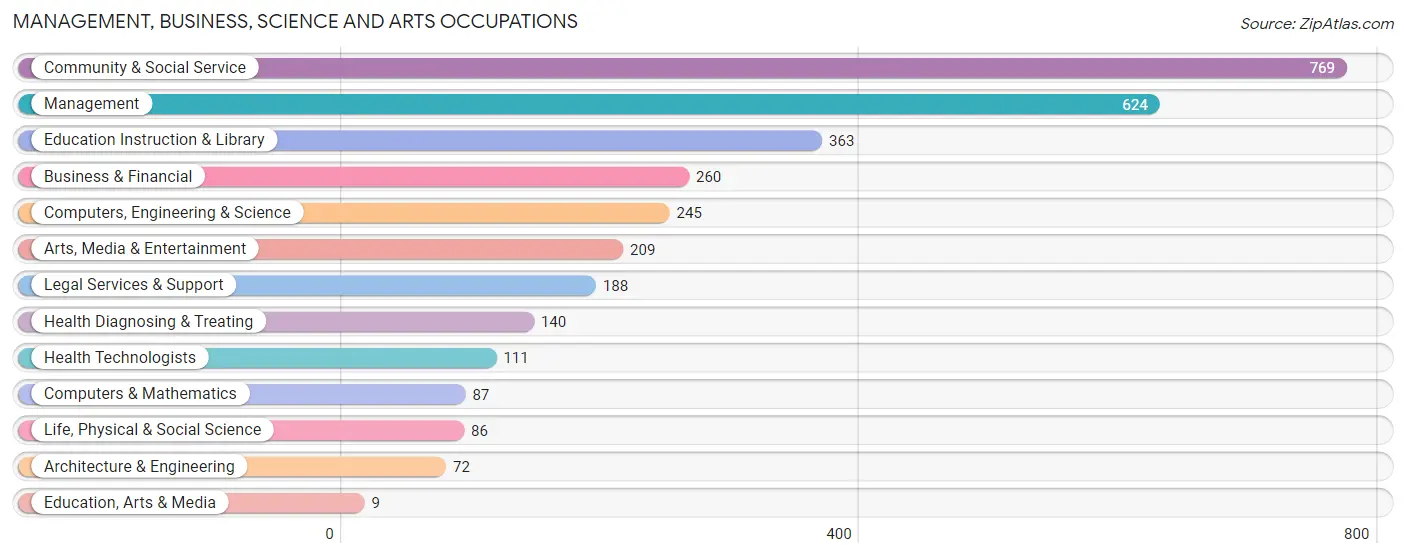
Management, Business, Science and Arts Occupations
The most common Management, Business, Science and Arts occupations in Montecito are Community & Social Service (769 | 25.2%), Management (624 | 20.4%), Education Instruction & Library (363 | 11.9%), Business & Financial (260 | 8.5%), and Computers, Engineering & Science (245 | 8.0%).
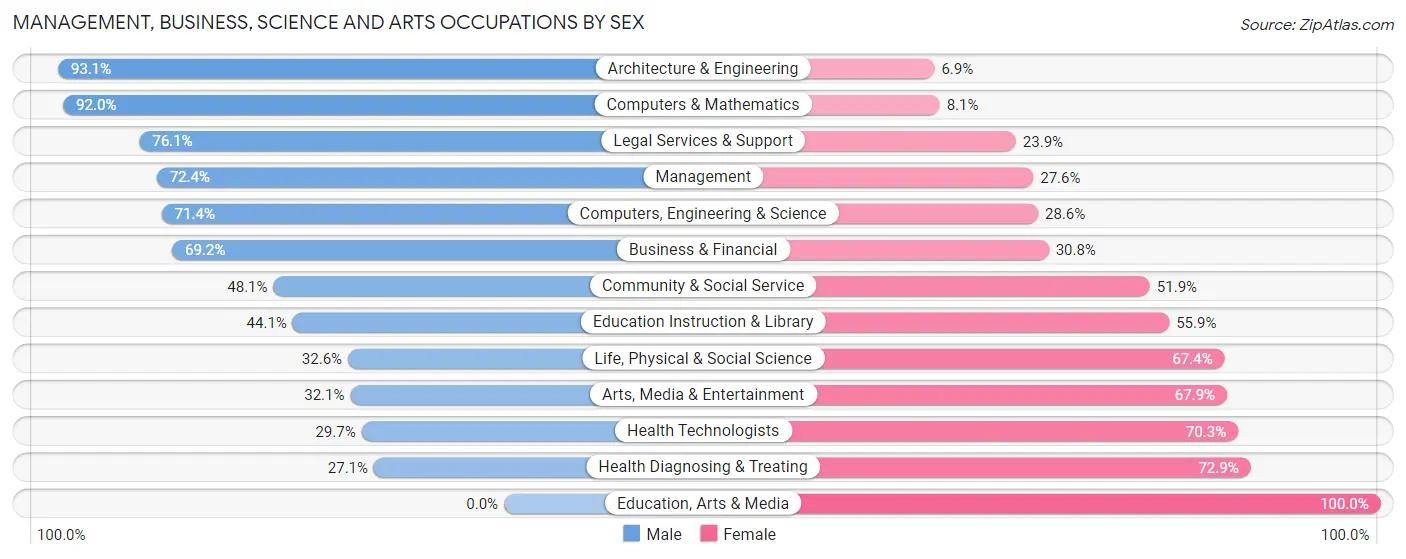
Management, Business, Science and Arts Occupations by Sex
Within the Management, Business, Science and Arts occupations in Montecito, the most male-oriented occupations are Architecture & Engineering (93.1%), Computers & Mathematics (91.9%), and Legal Services & Support (76.1%), while the most female-oriented occupations are Education, Arts & Media (100.0%), Health Diagnosing & Treating (72.9%), and Health Technologists (70.3%).
| Occupation | Male | Female |
| Management | 452 (72.4%) | 172 (27.6%) |
| Business & Financial | 180 (69.2%) | 80 (30.8%) |
| Computers, Engineering & Science | 175 (71.4%) | 70 (28.6%) |
| Computers & Mathematics | 80 (91.9%) | 7 (8.1%) |
| Architecture & Engineering | 67 (93.1%) | 5 (6.9%) |
| Life, Physical & Social Science | 28 (32.6%) | 58 (67.4%) |
| Community & Social Service | 370 (48.1%) | 399 (51.9%) |
| Education, Arts & Media | 0 (0.0%) | 9 (100.0%) |
| Legal Services & Support | 143 (76.1%) | 45 (23.9%) |
| Education Instruction & Library | 160 (44.1%) | 203 (55.9%) |
| Arts, Media & Entertainment | 67 (32.1%) | 142 (67.9%) |
| Health Diagnosing & Treating | 38 (27.1%) | 102 (72.9%) |
| Health Technologists | 33 (29.7%) | 78 (70.3%) |
| Total (Category) | 1,215 (59.6%) | 823 (40.4%) |
| Total (Overall) | 1,695 (55.5%) | 1,357 (44.5%) |
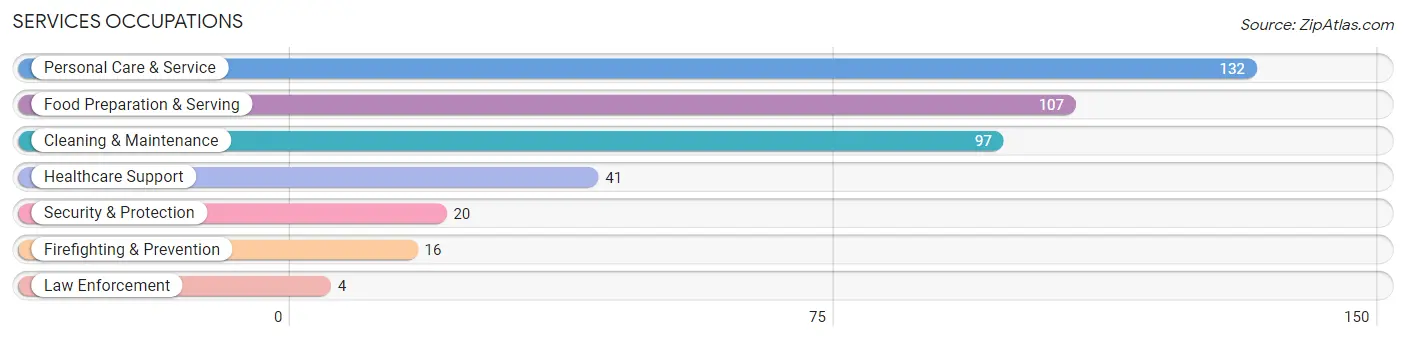
Services Occupations
The most common Services occupations in Montecito are Personal Care & Service (132 | 4.3%), Food Preparation & Serving (107 | 3.5%), Cleaning & Maintenance (97 | 3.2%), Healthcare Support (41 | 1.3%), and Security & Protection (20 | 0.7%).
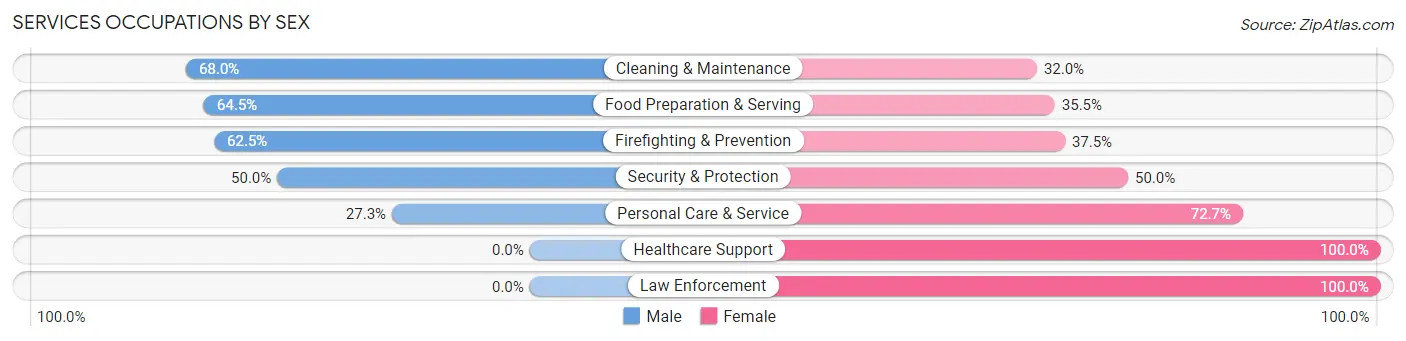
Services Occupations by Sex
Within the Services occupations in Montecito, the most male-oriented occupations are Cleaning & Maintenance (68.0%), Food Preparation & Serving (64.5%), and Firefighting & Prevention (62.5%), while the most female-oriented occupations are Healthcare Support (100.0%), Law Enforcement (100.0%), and Personal Care & Service (72.7%).
| Occupation | Male | Female |
| Healthcare Support | 0 (0.0%) | 41 (100.0%) |
| Security & Protection | 10 (50.0%) | 10 (50.0%) |
| Firefighting & Prevention | 10 (62.5%) | 6 (37.5%) |
| Law Enforcement | 0 (0.0%) | 4 (100.0%) |
| Food Preparation & Serving | 69 (64.5%) | 38 (35.5%) |
| Cleaning & Maintenance | 66 (68.0%) | 31 (32.0%) |
| Personal Care & Service | 36 (27.3%) | 96 (72.7%) |
| Total (Category) | 181 (45.6%) | 216 (54.4%) |
| Total (Overall) | 1,695 (55.5%) | 1,357 (44.5%) |
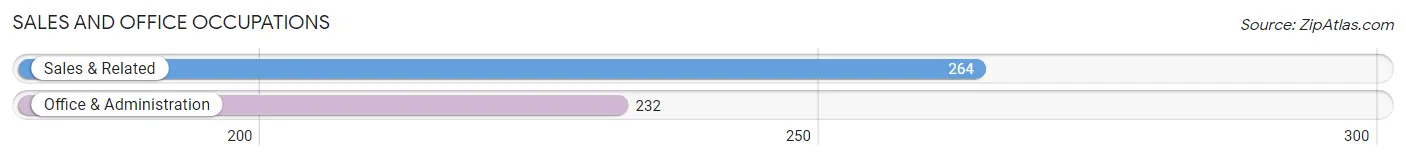
Sales and Office Occupations
The most common Sales and Office occupations in Montecito are Sales & Related (264 | 8.6%), and Office & Administration (232 | 7.6%).
Sales and Office Occupations by Sex
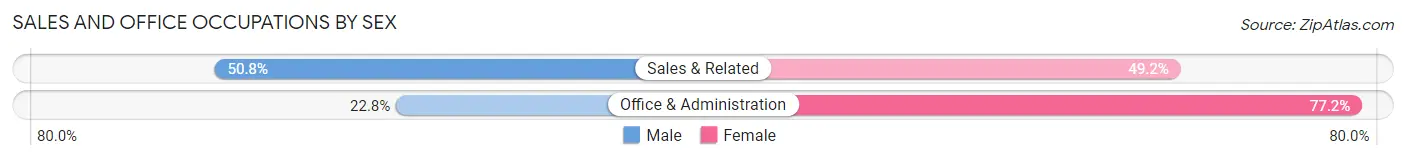
| Occupation | Male | Female |
| Sales & Related | 134 (50.8%) | 130 (49.2%) |
| Office & Administration | 53 (22.8%) | 179 (77.2%) |
| Total (Category) | 187 (37.7%) | 309 (62.3%) |
| Total (Overall) | 1,695 (55.5%) | 1,357 (44.5%) |
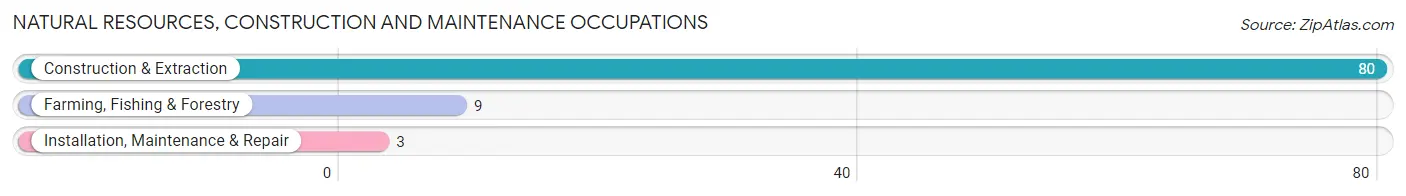
Natural Resources, Construction and Maintenance Occupations
The most common Natural Resources, Construction and Maintenance occupations in Montecito are Construction & Extraction (80 | 2.6%), Farming, Fishing & Forestry (9 | 0.3%), and Installation, Maintenance & Repair (3 | 0.1%).
Natural Resources, Construction and Maintenance Occupations by Sex
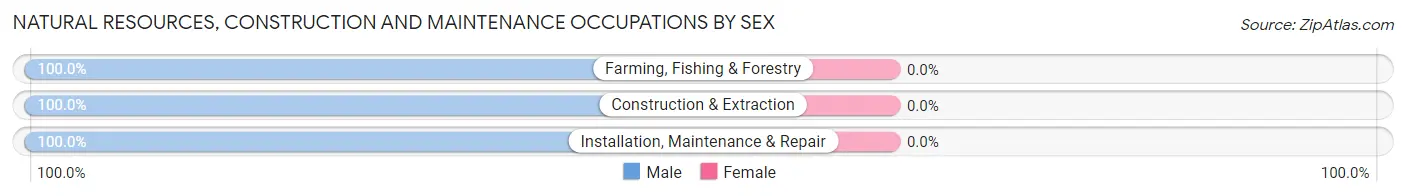
| Occupation | Male | Female |
| Farming, Fishing & Forestry | 9 (100.0%) | 0 (0.0%) |
| Construction & Extraction | 80 (100.0%) | 0 (0.0%) |
| Installation, Maintenance & Repair | 3 (100.0%) | 0 (0.0%) |
| Total (Category) | 92 (100.0%) | 0 (0.0%) |
| Total (Overall) | 1,695 (55.5%) | 1,357 (44.5%) |
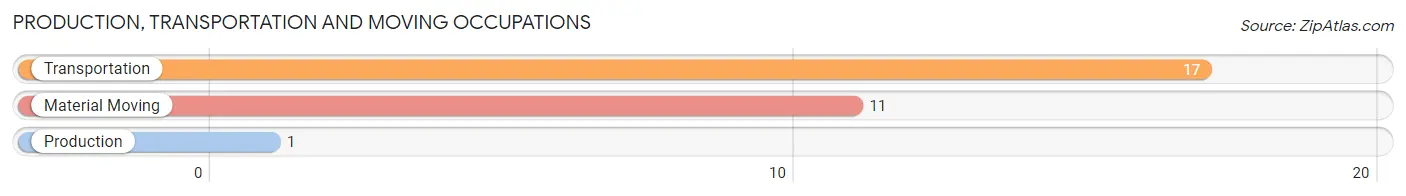
Production, Transportation and Moving Occupations
The most common Production, Transportation and Moving occupations in Montecito are Transportation (17 | 0.6%), Material Moving (11 | 0.4%), and Production (1 | 0.0%).
Production, Transportation and Moving Occupations by Sex
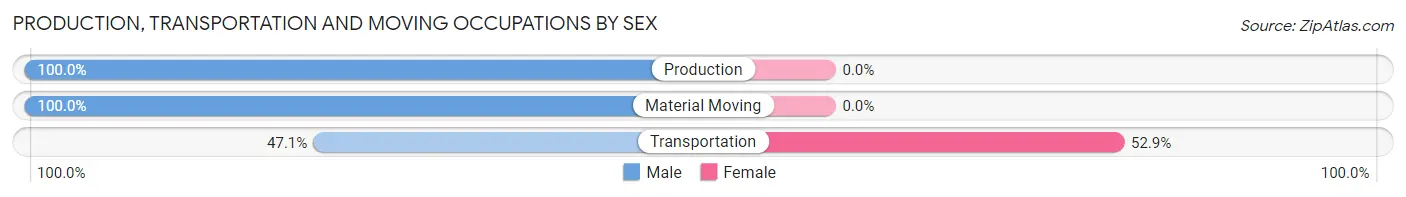
| Occupation | Male | Female |
| Production | 1 (100.0%) | 0 (0.0%) |
| Transportation | 8 (47.1%) | 9 (52.9%) |
| Material Moving | 11 (100.0%) | 0 (0.0%) |
| Total (Category) | 20 (69.0%) | 9 (31.0%) |
| Total (Overall) | 1,695 (55.5%) | 1,357 (44.5%) |
Employment Industries by Sex in Montecito
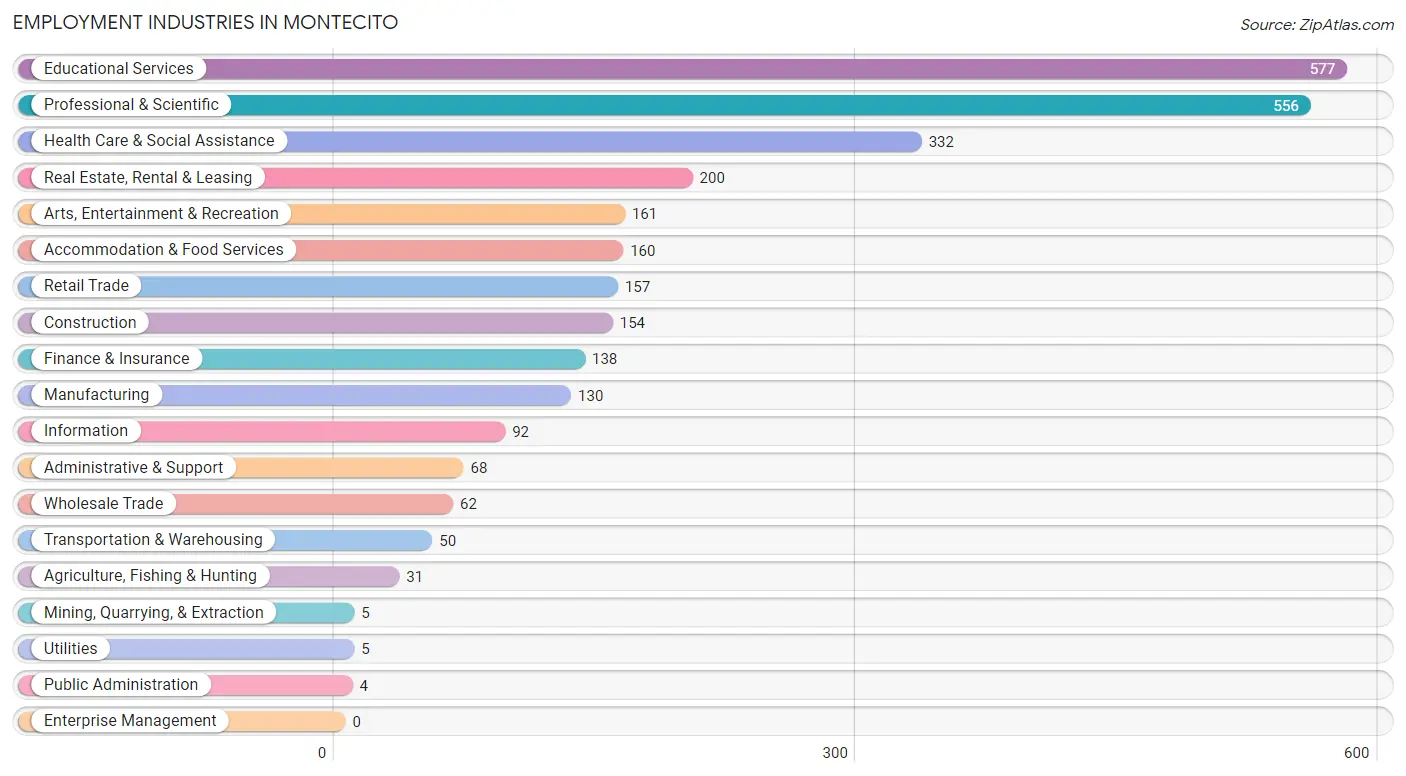
Employment Industries in Montecito
The major employment industries in Montecito include Educational Services (577 | 18.9%), Professional & Scientific (556 | 18.2%), Health Care & Social Assistance (332 | 10.9%), Real Estate, Rental & Leasing (200 | 6.6%), and Arts, Entertainment & Recreation (161 | 5.3%).
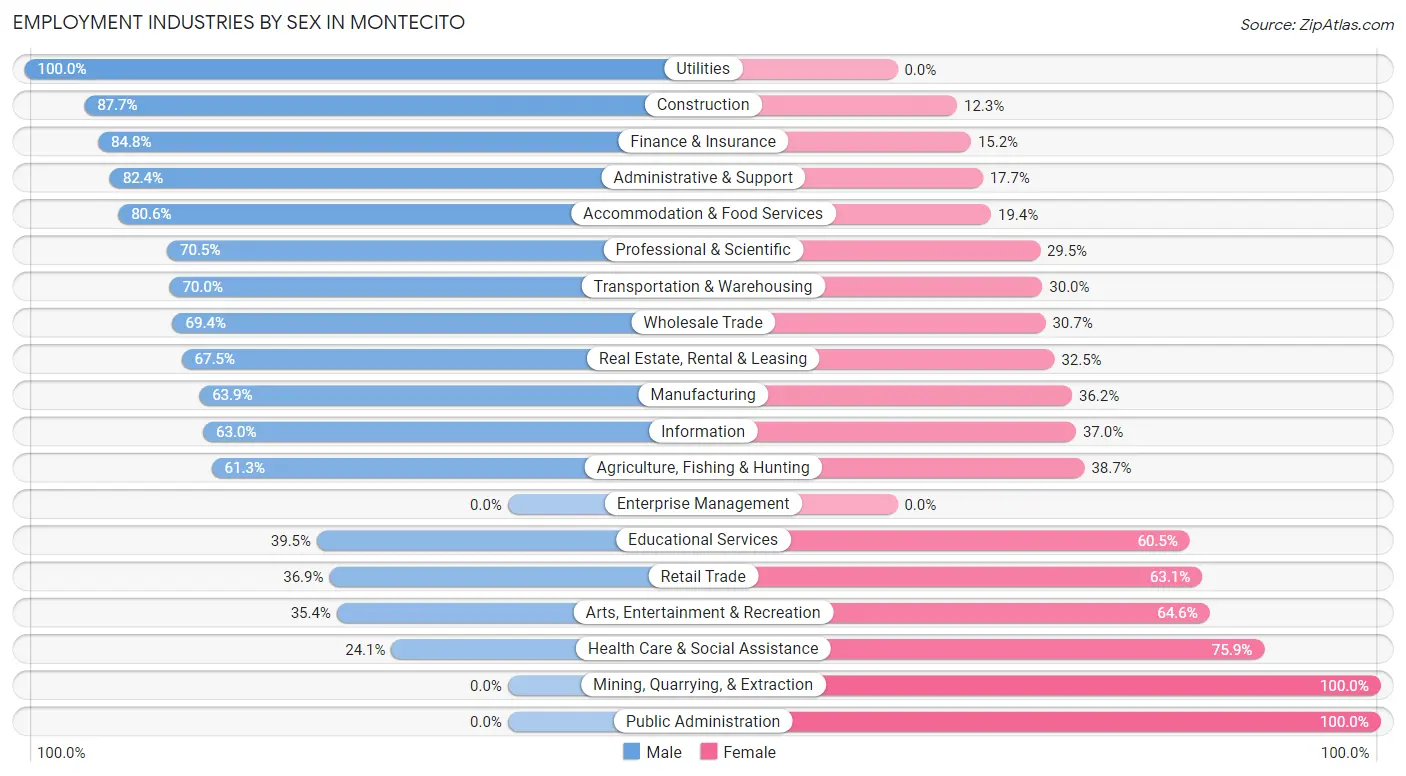
Employment Industries by Sex in Montecito
The Montecito industries that see more men than women are Utilities (100.0%), Construction (87.7%), and Finance & Insurance (84.8%), whereas the industries that tend to have a higher number of women are Mining, Quarrying, & Extraction (100.0%), Public Administration (100.0%), and Health Care & Social Assistance (75.9%).
| Industry | Male | Female |
| Agriculture, Fishing & Hunting | 19 (61.3%) | 12 (38.7%) |
| Mining, Quarrying, & Extraction | 0 (0.0%) | 5 (100.0%) |
| Construction | 135 (87.7%) | 19 (12.3%) |
| Manufacturing | 83 (63.8%) | 47 (36.1%) |
| Wholesale Trade | 43 (69.4%) | 19 (30.6%) |
| Retail Trade | 58 (36.9%) | 99 (63.1%) |
| Transportation & Warehousing | 35 (70.0%) | 15 (30.0%) |
| Utilities | 5 (100.0%) | 0 (0.0%) |
| Information | 58 (63.0%) | 34 (37.0%) |
| Finance & Insurance | 117 (84.8%) | 21 (15.2%) |
| Real Estate, Rental & Leasing | 135 (67.5%) | 65 (32.5%) |
| Professional & Scientific | 392 (70.5%) | 164 (29.5%) |
| Enterprise Management | 0 (0.0%) | 0 (0.0%) |
| Administrative & Support | 56 (82.4%) | 12 (17.6%) |
| Educational Services | 228 (39.5%) | 349 (60.5%) |
| Health Care & Social Assistance | 80 (24.1%) | 252 (75.9%) |
| Arts, Entertainment & Recreation | 57 (35.4%) | 104 (64.6%) |
| Accommodation & Food Services | 129 (80.6%) | 31 (19.4%) |
| Public Administration | 0 (0.0%) | 4 (100.0%) |
| Total | 1,695 (55.5%) | 1,357 (44.5%) |
Education in Montecito
School Enrollment in Montecito
The most common levels of schooling among the 2,676 students in Montecito are college / undergraduate (1,397 | 52.2%), elementary school (292 | 10.9%), and middle school (270 | 10.1%).
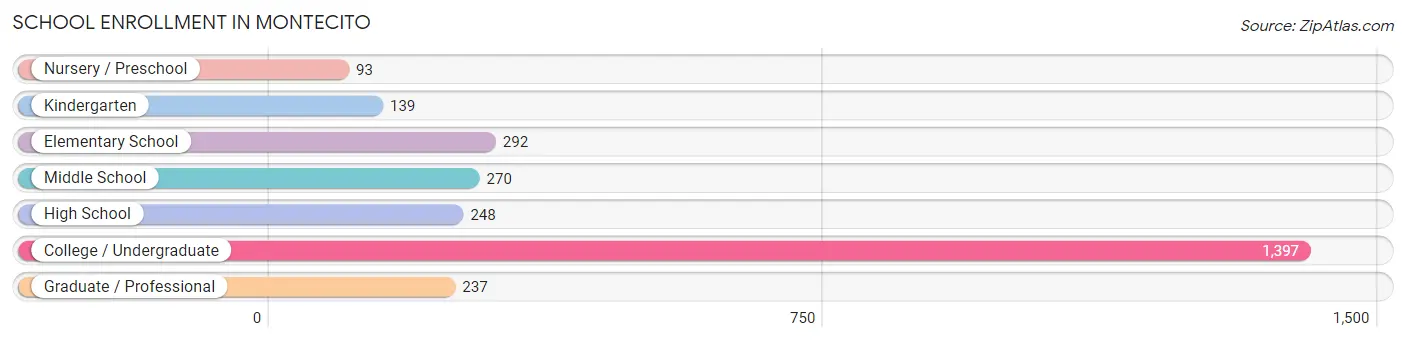
| School Level | # Students | % Students |
| Nursery / Preschool | 93 | 3.5% |
| Kindergarten | 139 | 5.2% |
| Elementary School | 292 | 10.9% |
| Middle School | 270 | 10.1% |
| High School | 248 | 9.3% |
| College / Undergraduate | 1,397 | 52.2% |
| Graduate / Professional | 237 | 8.9% |
| Total | 2,676 | 100.0% |
School Enrollment by Age by Funding Source in Montecito
Out of a total of 2,676 students who are enrolled in schools in Montecito, 1,033 (38.6%) attend a private institution, while the remaining 1,643 (61.4%) are enrolled in public schools. The age group of 25 to 34 year olds has the highest likelihood of being enrolled in private schools, with 62 (73.8% in the age bracket) enrolled. Conversely, the age group of 5 to 9 year old has the lowest likelihood of being enrolled in a private school, with 338 (88.0% in the age bracket) attending a public institution.
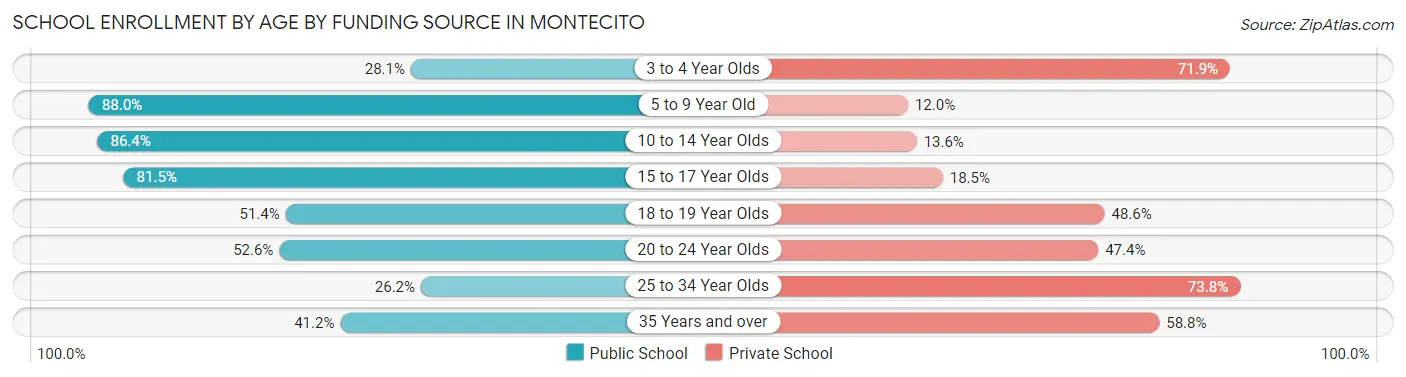
| Age Bracket | Public School | Private School |
| 3 to 4 Year Olds | 32 (28.1%) | 82 (71.9%) |
| 5 to 9 Year Old | 338 (88.0%) | 46 (12.0%) |
| 10 to 14 Year Olds | 305 (86.4%) | 48 (13.6%) |
| 15 to 17 Year Olds | 159 (81.5%) | 36 (18.5%) |
| 18 to 19 Year Olds | 311 (51.4%) | 294 (48.6%) |
| 20 to 24 Year Olds | 408 (52.6%) | 368 (47.4%) |
| 25 to 34 Year Olds | 22 (26.2%) | 62 (73.8%) |
| 35 Years and over | 68 (41.2%) | 97 (58.8%) |
| Total | 1,643 (61.4%) | 1,033 (38.6%) |
Educational Attainment by Field of Study in Montecito
Social sciences (1,055 | 21.0%), business (619 | 12.3%), visual & performing arts (489 | 9.7%), literature & languages (478 | 9.5%), and psychology (459 | 9.1%) are the most common fields of study among 5,020 individuals in Montecito who have obtained a bachelor's degree or higher.
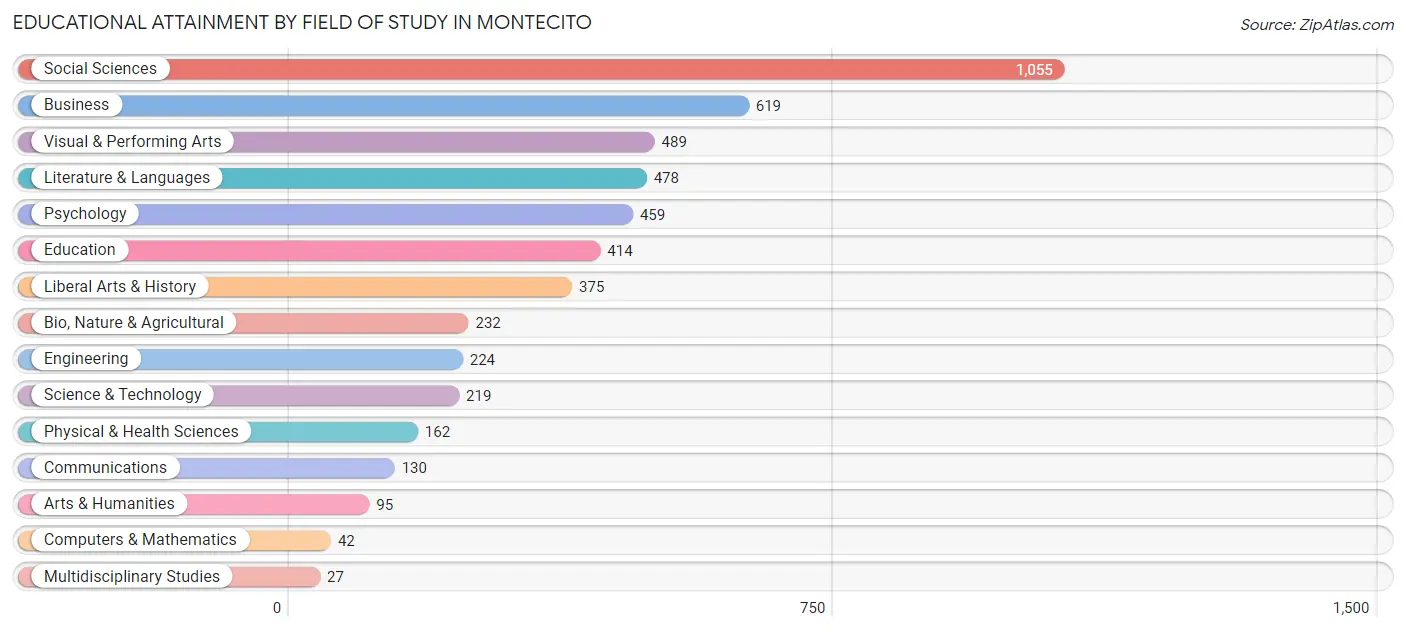
| Field of Study | # Graduates | % Graduates |
| Computers & Mathematics | 42 | 0.8% |
| Bio, Nature & Agricultural | 232 | 4.6% |
| Physical & Health Sciences | 162 | 3.2% |
| Psychology | 459 | 9.1% |
| Social Sciences | 1,055 | 21.0% |
| Engineering | 224 | 4.5% |
| Multidisciplinary Studies | 27 | 0.5% |
| Science & Technology | 219 | 4.4% |
| Business | 619 | 12.3% |
| Education | 414 | 8.3% |
| Literature & Languages | 478 | 9.5% |
| Liberal Arts & History | 375 | 7.5% |
| Visual & Performing Arts | 489 | 9.7% |
| Communications | 130 | 2.6% |
| Arts & Humanities | 95 | 1.9% |
| Total | 5,020 | 100.0% |
Transportation & Commute in Montecito
Vehicle Availability by Sex in Montecito
The most prevalent vehicle ownership categories in Montecito are males with 2 vehicles (718, accounting for 49.1%) and females with 2 vehicles (523, making up 63.5%).
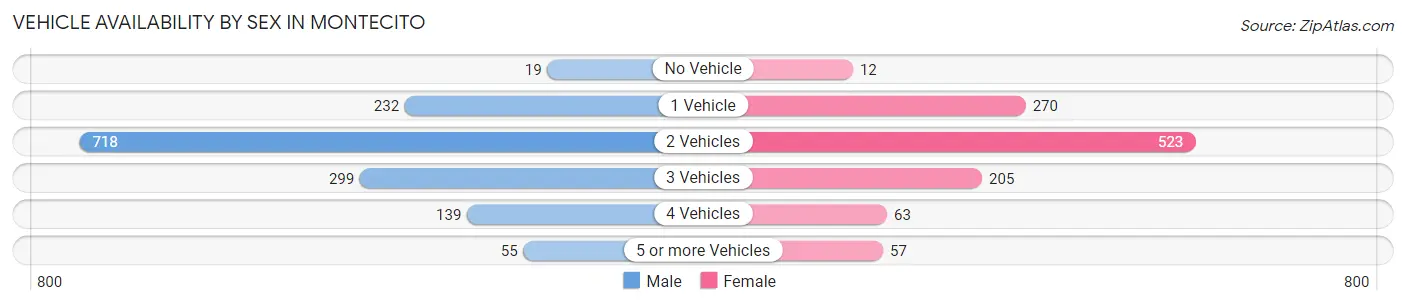
| Vehicles Available | Male | Female |
| No Vehicle | 19 (1.3%) | 12 (1.1%) |
| 1 Vehicle | 232 (15.9%) | 270 (23.9%) |
| 2 Vehicles | 718 (49.1%) | 523 (46.3%) |
| 3 Vehicles | 299 (20.4%) | 205 (18.1%) |
| 4 Vehicles | 139 (9.5%) | 63 (5.6%) |
| 5 or more Vehicles | 55 (3.8%) | 57 (5.0%) |
| Total | 1,462 (100.0%) | 1,130 (100.0%) |
Commute Time in Montecito
The most frequently occuring commute durations in Montecito are 15 to 19 minutes (495 commuters, 23.6%), 10 to 14 minutes (437 commuters, 20.8%), and 5 to 9 minutes (426 commuters, 20.3%).
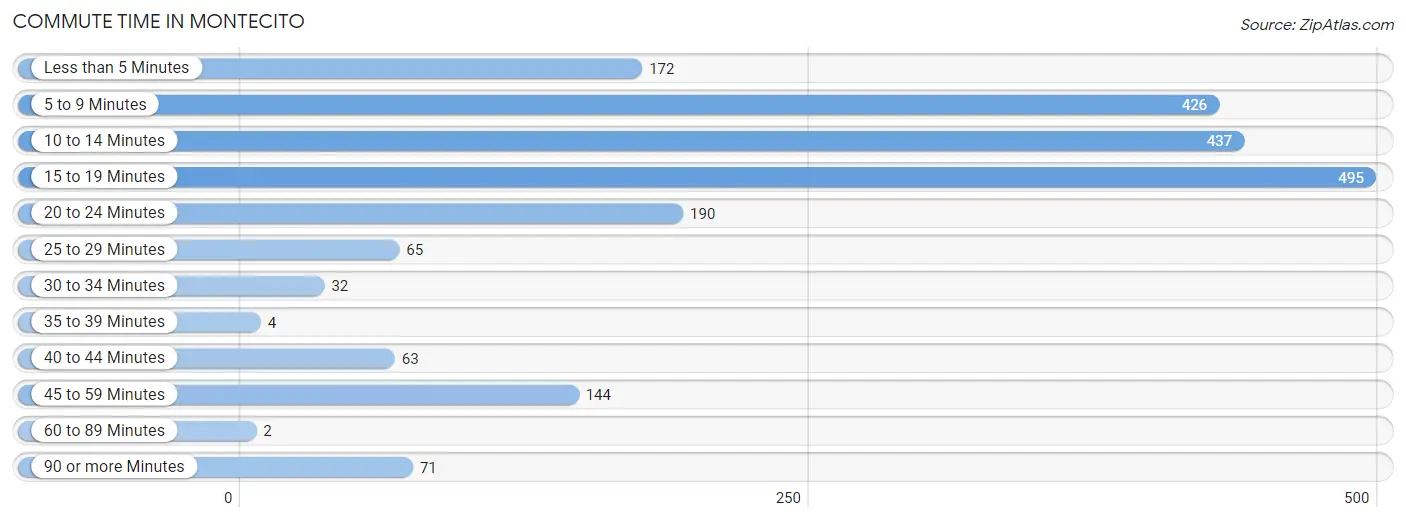
| Commute Time | # Commuters | % Commuters |
| Less than 5 Minutes | 172 | 8.2% |
| 5 to 9 Minutes | 426 | 20.3% |
| 10 to 14 Minutes | 437 | 20.8% |
| 15 to 19 Minutes | 495 | 23.6% |
| 20 to 24 Minutes | 190 | 9.0% |
| 25 to 29 Minutes | 65 | 3.1% |
| 30 to 34 Minutes | 32 | 1.5% |
| 35 to 39 Minutes | 4 | 0.2% |
| 40 to 44 Minutes | 63 | 3.0% |
| 45 to 59 Minutes | 144 | 6.9% |
| 60 to 89 Minutes | 2 | 0.1% |
| 90 or more Minutes | 71 | 3.4% |
Commute Time by Sex in Montecito
The most common commute times in Montecito are 5 to 9 minutes (246 commuters, 20.5%) for males and 15 to 19 minutes (268 commuters, 29.7%) for females.
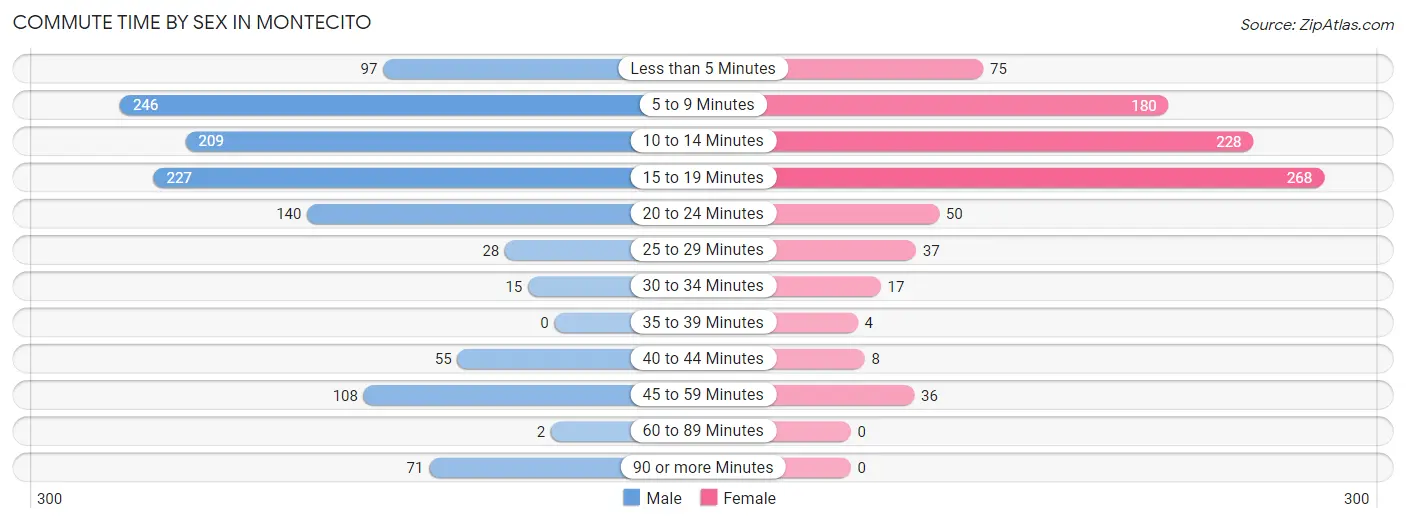
| Commute Time | Male | Female |
| Less than 5 Minutes | 97 (8.1%) | 75 (8.3%) |
| 5 to 9 Minutes | 246 (20.5%) | 180 (19.9%) |
| 10 to 14 Minutes | 209 (17.4%) | 228 (25.3%) |
| 15 to 19 Minutes | 227 (19.0%) | 268 (29.7%) |
| 20 to 24 Minutes | 140 (11.7%) | 50 (5.5%) |
| 25 to 29 Minutes | 28 (2.3%) | 37 (4.1%) |
| 30 to 34 Minutes | 15 (1.3%) | 17 (1.9%) |
| 35 to 39 Minutes | 0 (0.0%) | 4 (0.4%) |
| 40 to 44 Minutes | 55 (4.6%) | 8 (0.9%) |
| 45 to 59 Minutes | 108 (9.0%) | 36 (4.0%) |
| 60 to 89 Minutes | 2 (0.2%) | 0 (0.0%) |
| 90 or more Minutes | 71 (5.9%) | 0 (0.0%) |
Time of Departure to Work by Sex in Montecito
The most frequent times of departure to work in Montecito are 8:00 AM to 8:29 AM (289, 24.1%) for males and 8:00 AM to 8:29 AM (181, 20.0%) for females.
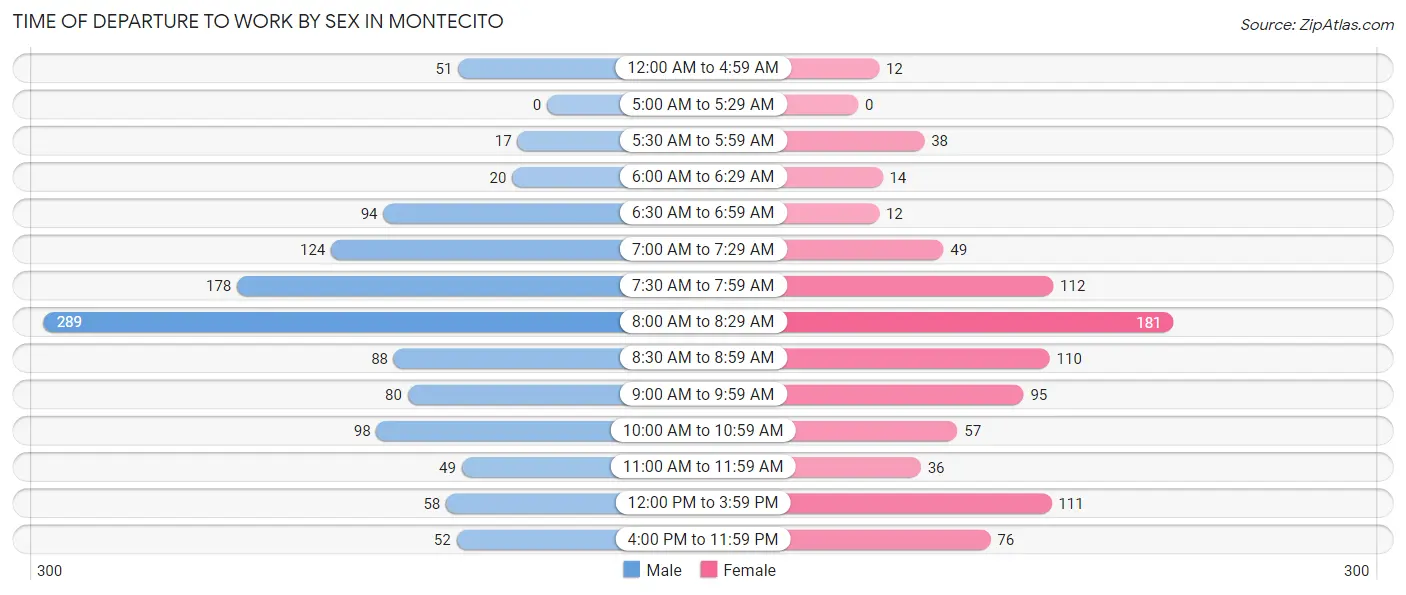
| Time of Departure | Male | Female |
| 12:00 AM to 4:59 AM | 51 (4.3%) | 12 (1.3%) |
| 5:00 AM to 5:29 AM | 0 (0.0%) | 0 (0.0%) |
| 5:30 AM to 5:59 AM | 17 (1.4%) | 38 (4.2%) |
| 6:00 AM to 6:29 AM | 20 (1.7%) | 14 (1.5%) |
| 6:30 AM to 6:59 AM | 94 (7.9%) | 12 (1.3%) |
| 7:00 AM to 7:29 AM | 124 (10.3%) | 49 (5.4%) |
| 7:30 AM to 7:59 AM | 178 (14.9%) | 112 (12.4%) |
| 8:00 AM to 8:29 AM | 289 (24.1%) | 181 (20.0%) |
| 8:30 AM to 8:59 AM | 88 (7.3%) | 110 (12.2%) |
| 9:00 AM to 9:59 AM | 80 (6.7%) | 95 (10.5%) |
| 10:00 AM to 10:59 AM | 98 (8.2%) | 57 (6.3%) |
| 11:00 AM to 11:59 AM | 49 (4.1%) | 36 (4.0%) |
| 12:00 PM to 3:59 PM | 58 (4.8%) | 111 (12.3%) |
| 4:00 PM to 11:59 PM | 52 (4.3%) | 76 (8.4%) |
| Total | 1,198 (100.0%) | 903 (100.0%) |
Housing Occupancy in Montecito
Occupancy by Ownership in Montecito
Of the total 3,251 dwellings in Montecito, owner-occupied units account for 2,334 (71.8%), while renter-occupied units make up 917 (28.2%).
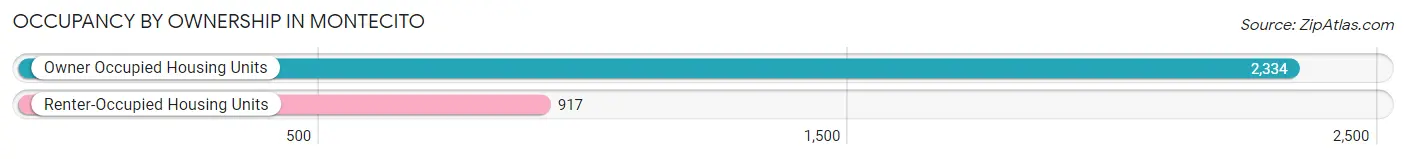
| Occupancy | # Housing Units | % Housing Units |
| Owner Occupied Housing Units | 2,334 | 71.8% |
| Renter-Occupied Housing Units | 917 | 28.2% |
| Total Occupied Housing Units | 3,251 | 100.0% |
Occupancy by Household Size in Montecito
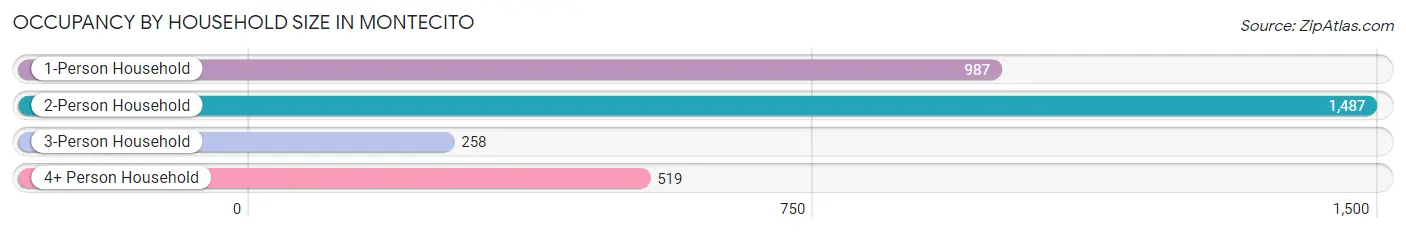
| Household Size | # Housing Units | % Housing Units |
| 1-Person Household | 987 | 30.4% |
| 2-Person Household | 1,487 | 45.7% |
| 3-Person Household | 258 | 7.9% |
| 4+ Person Household | 519 | 16.0% |
| Total Housing Units | 3,251 | 100.0% |
Occupancy by Ownership by Household Size in Montecito
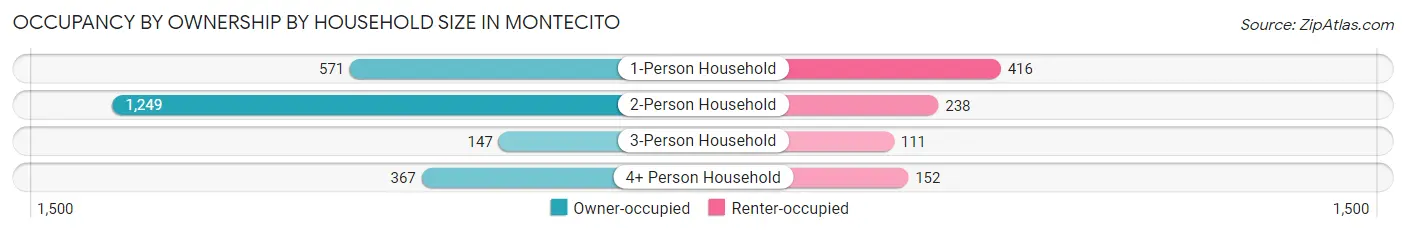
| Household Size | Owner-occupied | Renter-occupied |
| 1-Person Household | 571 (57.9%) | 416 (42.1%) |
| 2-Person Household | 1,249 (84.0%) | 238 (16.0%) |
| 3-Person Household | 147 (57.0%) | 111 (43.0%) |
| 4+ Person Household | 367 (70.7%) | 152 (29.3%) |
| Total Housing Units | 2,334 (71.8%) | 917 (28.2%) |
Occupancy by Educational Attainment in Montecito
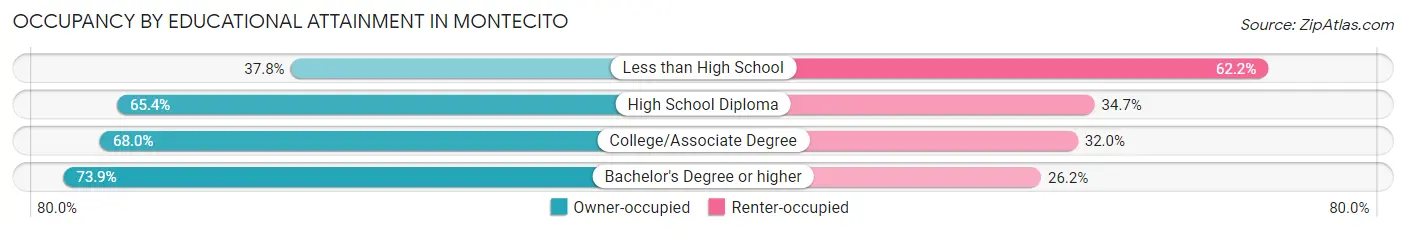
| Household Size | Owner-occupied | Renter-occupied |
| Less than High School | 28 (37.8%) | 46 (62.2%) |
| High School Diploma | 66 (65.3%) | 35 (34.6%) |
| College/Associate Degree | 368 (68.0%) | 173 (32.0%) |
| Bachelor's Degree or higher | 1,872 (73.9%) | 663 (26.2%) |
Occupancy by Age of Householder in Montecito
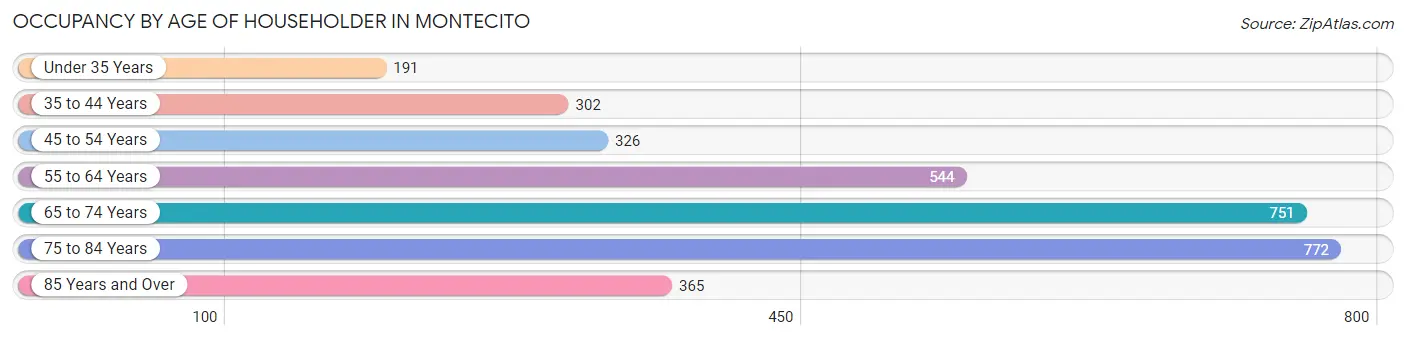
| Age Bracket | # Households | % Households |
| Under 35 Years | 191 | 5.9% |
| 35 to 44 Years | 302 | 9.3% |
| 45 to 54 Years | 326 | 10.0% |
| 55 to 64 Years | 544 | 16.7% |
| 65 to 74 Years | 751 | 23.1% |
| 75 to 84 Years | 772 | 23.7% |
| 85 Years and Over | 365 | 11.2% |
| Total | 3,251 | 100.0% |
Housing Finances in Montecito
Median Income by Occupancy in Montecito
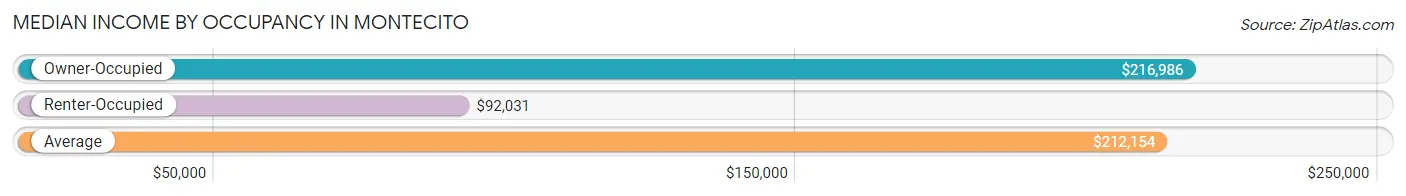
| Occupancy Type | # Households | Median Income |
| Owner-Occupied | 2,334 (71.8%) | $216,986 |
| Renter-Occupied | 917 (28.2%) | $92,031 |
| Average | 3,251 (100.0%) | $212,154 |
Occupancy by Householder Income Bracket in Montecito
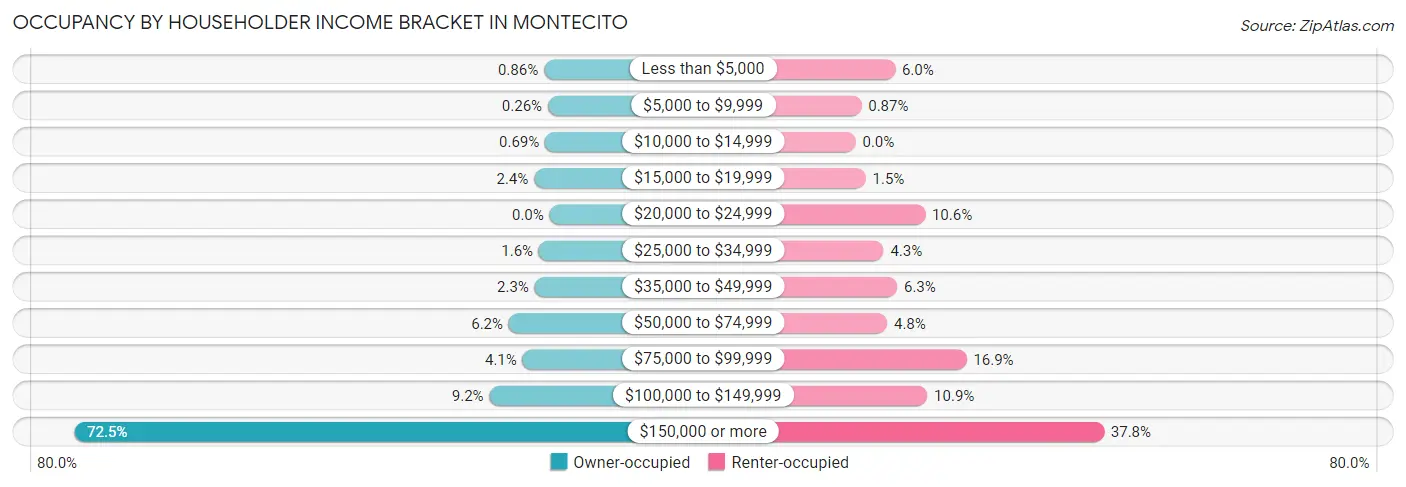
| Income Bracket | Owner-occupied | Renter-occupied |
| Less than $5,000 | 20 (0.9%) | 55 (6.0%) |
| $5,000 to $9,999 | 6 (0.3%) | 8 (0.9%) |
| $10,000 to $14,999 | 16 (0.7%) | 0 (0.0%) |
| $15,000 to $19,999 | 55 (2.4%) | 14 (1.5%) |
| $20,000 to $24,999 | 0 (0.0%) | 97 (10.6%) |
| $25,000 to $34,999 | 38 (1.6%) | 39 (4.3%) |
| $35,000 to $49,999 | 53 (2.3%) | 58 (6.3%) |
| $50,000 to $74,999 | 145 (6.2%) | 44 (4.8%) |
| $75,000 to $99,999 | 96 (4.1%) | 155 (16.9%) |
| $100,000 to $149,999 | 214 (9.2%) | 100 (10.9%) |
| $150,000 or more | 1,691 (72.5%) | 347 (37.8%) |
| Total | 2,334 (100.0%) | 917 (100.0%) |
Monthly Housing Cost Tiers in Montecito
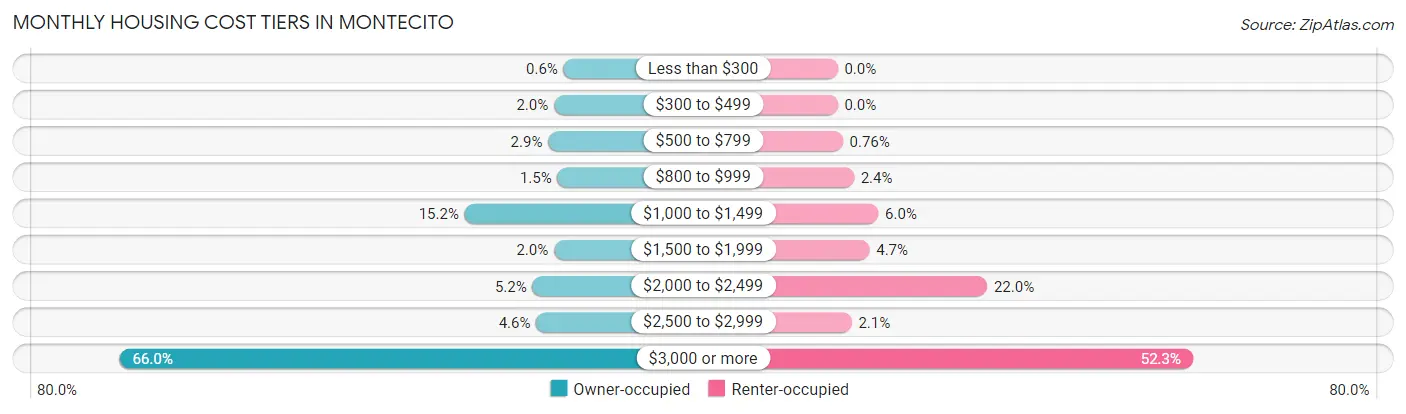
| Monthly Cost | Owner-occupied | Renter-occupied |
| Less than $300 | 14 (0.6%) | 0 (0.0%) |
| $300 to $499 | 47 (2.0%) | 0 (0.0%) |
| $500 to $799 | 67 (2.9%) | 7 (0.8%) |
| $800 to $999 | 35 (1.5%) | 22 (2.4%) |
| $1,000 to $1,499 | 354 (15.2%) | 55 (6.0%) |
| $1,500 to $1,999 | 47 (2.0%) | 43 (4.7%) |
| $2,000 to $2,499 | 121 (5.2%) | 202 (22.0%) |
| $2,500 to $2,999 | 108 (4.6%) | 19 (2.1%) |
| $3,000 or more | 1,541 (66.0%) | 480 (52.3%) |
| Total | 2,334 (100.0%) | 917 (100.0%) |
Physical Housing Characteristics in Montecito
Housing Structures in Montecito
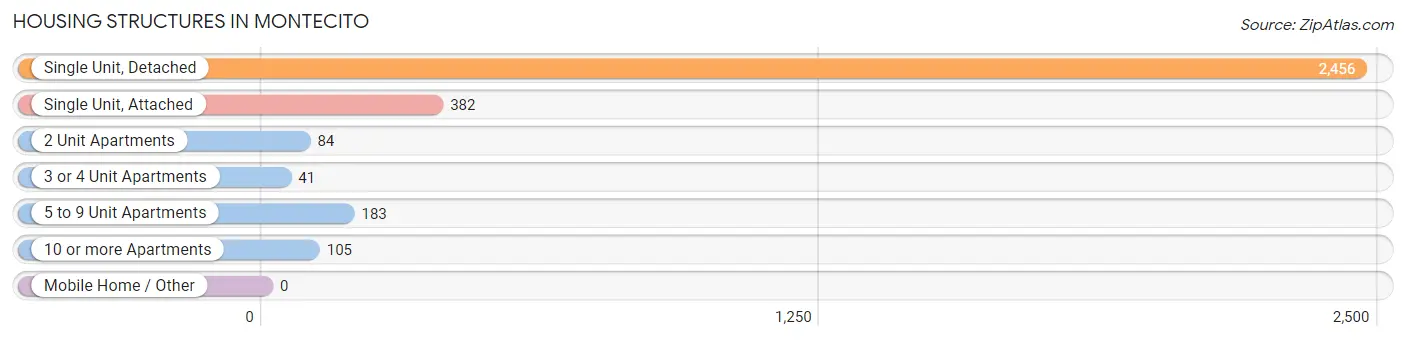
| Structure Type | # Housing Units | % Housing Units |
| Single Unit, Detached | 2,456 | 75.5% |
| Single Unit, Attached | 382 | 11.7% |
| 2 Unit Apartments | 84 | 2.6% |
| 3 or 4 Unit Apartments | 41 | 1.3% |
| 5 to 9 Unit Apartments | 183 | 5.6% |
| 10 or more Apartments | 105 | 3.2% |
| Mobile Home / Other | 0 | 0.0% |
| Total | 3,251 | 100.0% |
Housing Structures by Occupancy in Montecito
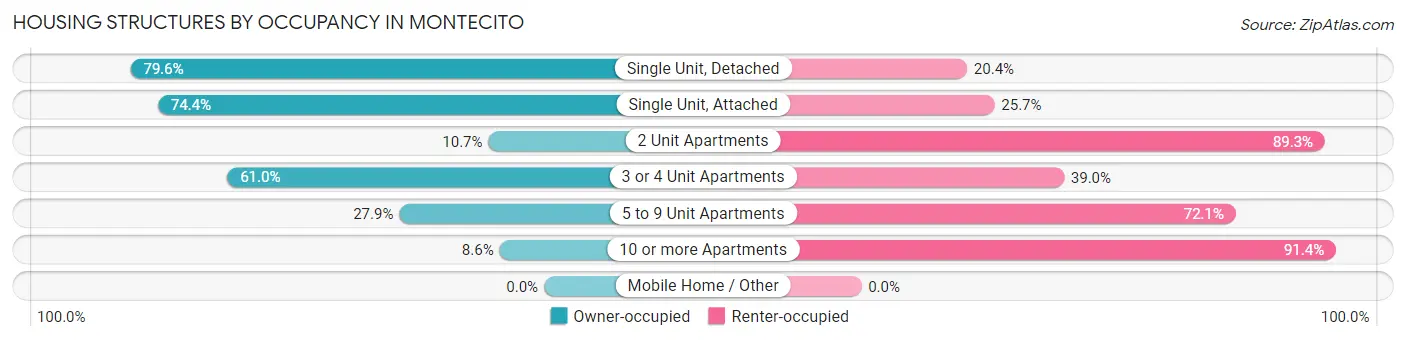
| Structure Type | Owner-occupied | Renter-occupied |
| Single Unit, Detached | 1,956 (79.6%) | 500 (20.4%) |
| Single Unit, Attached | 284 (74.4%) | 98 (25.7%) |
| 2 Unit Apartments | 9 (10.7%) | 75 (89.3%) |
| 3 or 4 Unit Apartments | 25 (61.0%) | 16 (39.0%) |
| 5 to 9 Unit Apartments | 51 (27.9%) | 132 (72.1%) |
| 10 or more Apartments | 9 (8.6%) | 96 (91.4%) |
| Mobile Home / Other | 0 (0.0%) | 0 (0.0%) |
| Total | 2,334 (71.8%) | 917 (28.2%) |
Housing Structures by Number of Rooms in Montecito
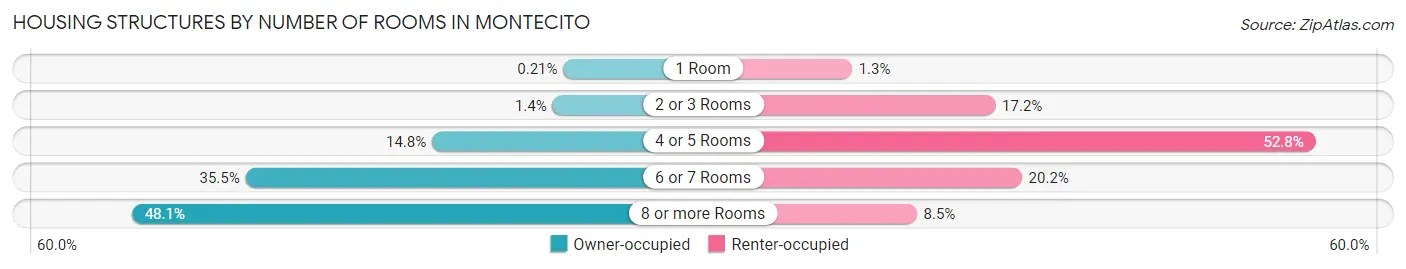
| Number of Rooms | Owner-occupied | Renter-occupied |
| 1 Room | 5 (0.2%) | 12 (1.3%) |
| 2 or 3 Rooms | 33 (1.4%) | 158 (17.2%) |
| 4 or 5 Rooms | 345 (14.8%) | 484 (52.8%) |
| 6 or 7 Rooms | 828 (35.5%) | 185 (20.2%) |
| 8 or more Rooms | 1,123 (48.1%) | 78 (8.5%) |
| Total | 2,334 (100.0%) | 917 (100.0%) |
Housing Structure by Heating Type in Montecito
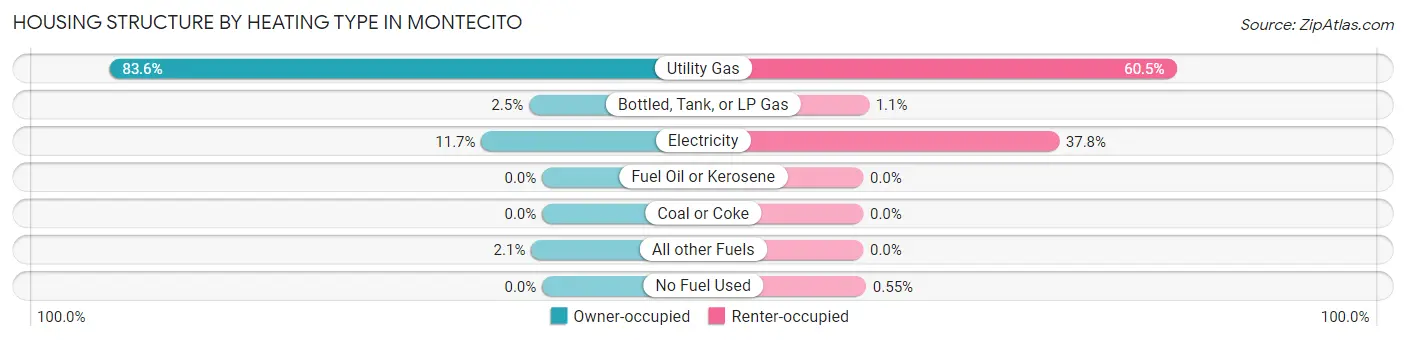
| Heating Type | Owner-occupied | Renter-occupied |
| Utility Gas | 1,952 (83.6%) | 555 (60.5%) |
| Bottled, Tank, or LP Gas | 59 (2.5%) | 10 (1.1%) |
| Electricity | 274 (11.7%) | 347 (37.8%) |
| Fuel Oil or Kerosene | 0 (0.0%) | 0 (0.0%) |
| Coal or Coke | 0 (0.0%) | 0 (0.0%) |
| All other Fuels | 49 (2.1%) | 0 (0.0%) |
| No Fuel Used | 0 (0.0%) | 5 (0.5%) |
| Total | 2,334 (100.0%) | 917 (100.0%) |
Household Vehicle Usage in Montecito
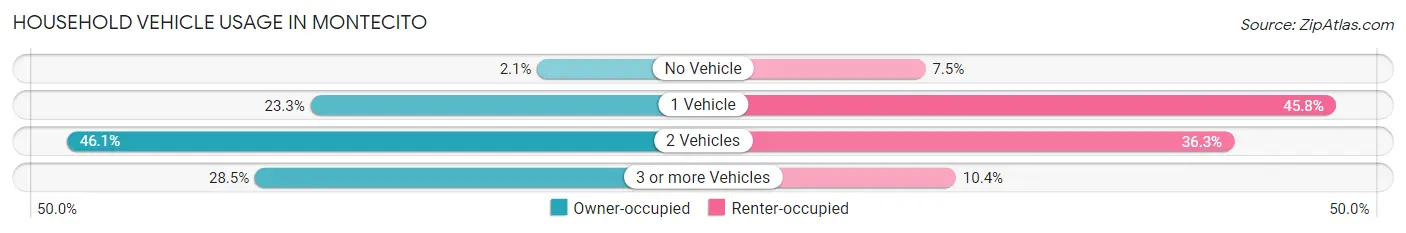
| Vehicles per Household | Owner-occupied | Renter-occupied |
| No Vehicle | 50 (2.1%) | 69 (7.5%) |
| 1 Vehicle | 544 (23.3%) | 420 (45.8%) |
| 2 Vehicles | 1,075 (46.1%) | 333 (36.3%) |
| 3 or more Vehicles | 665 (28.5%) | 95 (10.4%) |
| Total | 2,334 (100.0%) | 917 (100.0%) |
Real Estate & Mortgages in Montecito
Real Estate and Mortgage Overview in Montecito
| Characteristic | Without Mortgage | With Mortgage |
| Housing Units | 1,284 | 1,050 |
| Median Property Value | $2,000,001 | $2,000,001 |
| Median Household Income | $215,932 | $779 |
| Monthly Housing Costs | $1,501 | $953 |
| Real Estate Taxes | $10,001 | $34 |
Property Value by Mortgage Status in Montecito
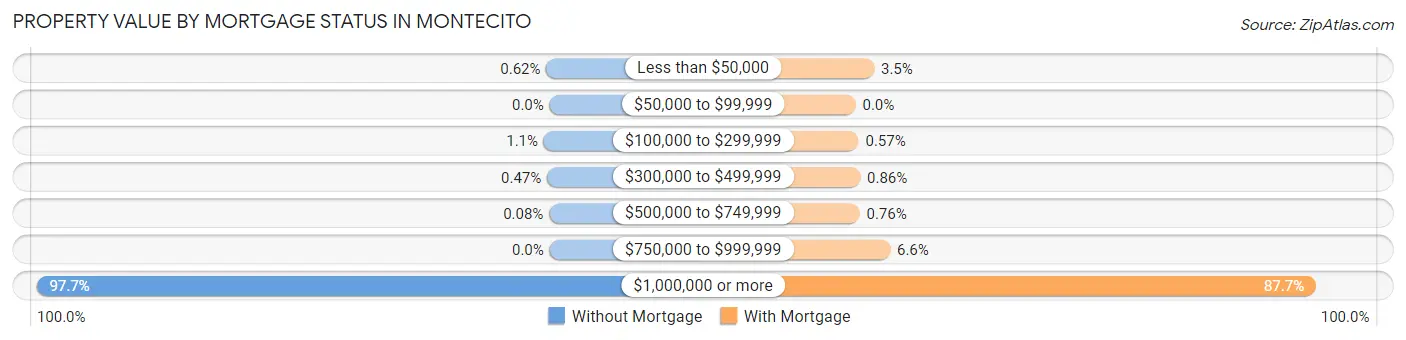
| Property Value | Without Mortgage | With Mortgage |
| Less than $50,000 | 8 (0.6%) | 37 (3.5%) |
| $50,000 to $99,999 | 0 (0.0%) | 0 (0.0%) |
| $100,000 to $299,999 | 14 (1.1%) | 6 (0.6%) |
| $300,000 to $499,999 | 6 (0.5%) | 9 (0.9%) |
| $500,000 to $749,999 | 1 (0.1%) | 8 (0.8%) |
| $750,000 to $999,999 | 0 (0.0%) | 69 (6.6%) |
| $1,000,000 or more | 1,255 (97.7%) | 921 (87.7%) |
| Total | 1,284 (100.0%) | 1,050 (100.0%) |
Household Income by Mortgage Status in Montecito
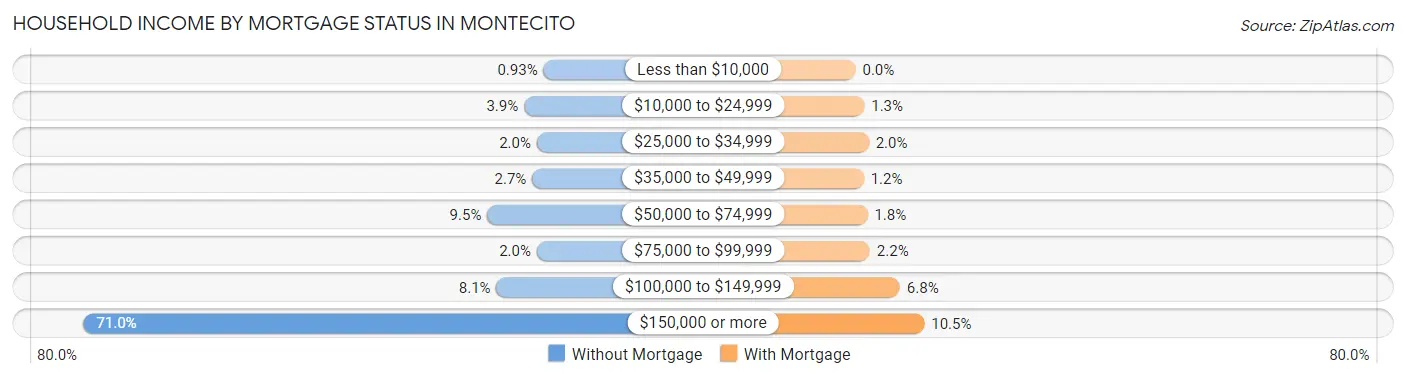
| Household Income | Without Mortgage | With Mortgage |
| Less than $10,000 | 12 (0.9%) | 0 (0.0%) |
| $10,000 to $24,999 | 50 (3.9%) | 14 (1.3%) |
| $25,000 to $34,999 | 25 (1.9%) | 21 (2.0%) |
| $35,000 to $49,999 | 34 (2.6%) | 13 (1.2%) |
| $50,000 to $74,999 | 122 (9.5%) | 19 (1.8%) |
| $75,000 to $99,999 | 25 (1.9%) | 23 (2.2%) |
| $100,000 to $149,999 | 104 (8.1%) | 71 (6.8%) |
| $150,000 or more | 912 (71.0%) | 110 (10.5%) |
| Total | 1,284 (100.0%) | 1,050 (100.0%) |
Property Value to Household Income Ratio in Montecito
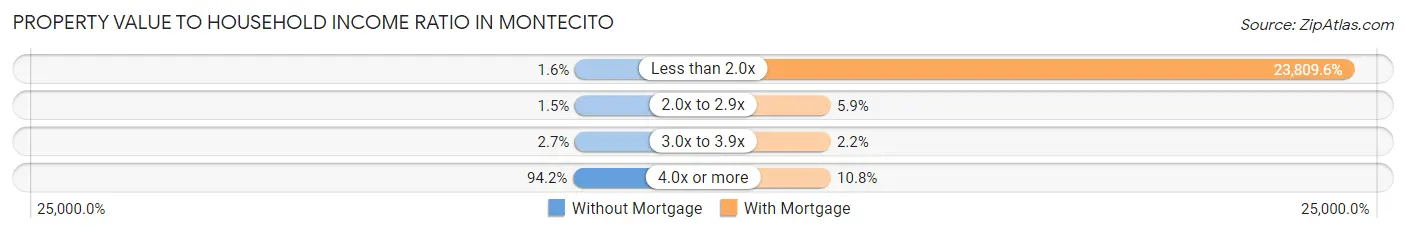
| Value-to-Income Ratio | Without Mortgage | With Mortgage |
| Less than 2.0x | 21 (1.6%) | 250,001 (23,809.6%) |
| 2.0x to 2.9x | 19 (1.5%) | 62 (5.9%) |
| 3.0x to 3.9x | 34 (2.6%) | 23 (2.2%) |
| 4.0x or more | 1,210 (94.2%) | 113 (10.8%) |
| Total | 1,284 (100.0%) | 1,050 (100.0%) |
Real Estate Taxes by Mortgage Status in Montecito
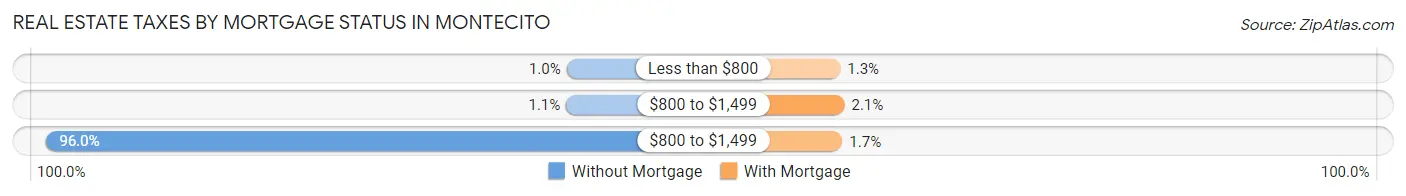
| Property Taxes | Without Mortgage | With Mortgage |
| Less than $800 | 13 (1.0%) | 14 (1.3%) |
| $800 to $1,499 | 14 (1.1%) | 22 (2.1%) |
| $800 to $1,499 | 1,233 (96.0%) | 18 (1.7%) |
| Total | 1,284 (100.0%) | 1,050 (100.0%) |
Health & Disability in Montecito
Health Insurance Coverage by Age in Montecito
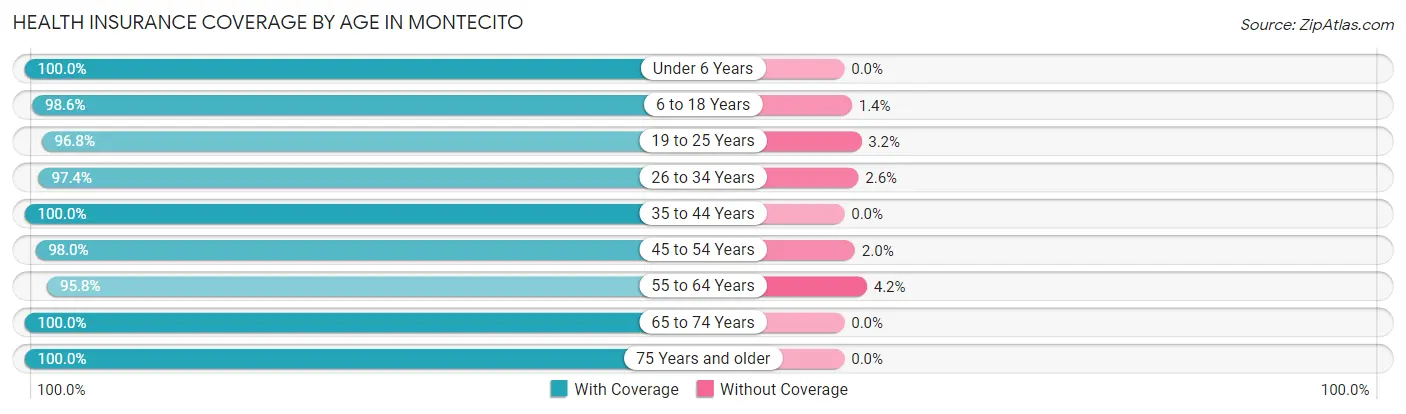
| Age Bracket | With Coverage | Without Coverage |
| Under 6 Years | 332 (100.0%) | 0 (0.0%) |
| 6 to 18 Years | 1,126 (98.6%) | 16 (1.4%) |
| 19 to 25 Years | 1,251 (96.8%) | 41 (3.2%) |
| 26 to 34 Years | 371 (97.4%) | 10 (2.6%) |
| 35 to 44 Years | 726 (100.0%) | 0 (0.0%) |
| 45 to 54 Years | 645 (98.0%) | 13 (2.0%) |
| 55 to 64 Years | 915 (95.8%) | 40 (4.2%) |
| 65 to 74 Years | 1,244 (100.0%) | 0 (0.0%) |
| 75 Years and older | 1,786 (100.0%) | 0 (0.0%) |
| Total | 8,396 (98.6%) | 120 (1.4%) |
Health Insurance Coverage by Citizenship Status in Montecito
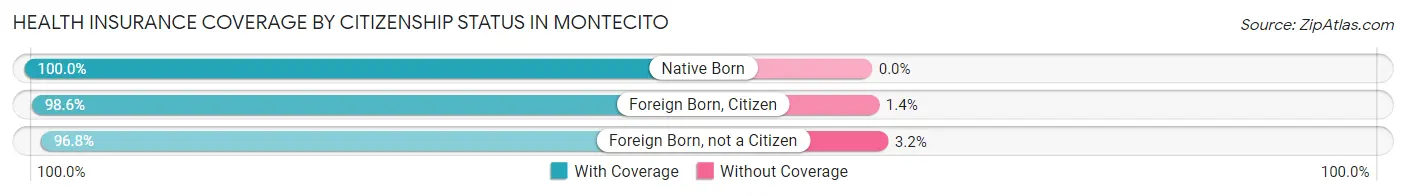
| Citizenship Status | With Coverage | Without Coverage |
| Native Born | 332 (100.0%) | 0 (0.0%) |
| Foreign Born, Citizen | 1,126 (98.6%) | 16 (1.4%) |
| Foreign Born, not a Citizen | 1,251 (96.8%) | 41 (3.2%) |
Health Insurance Coverage by Household Income in Montecito

| Household Income | With Coverage | Without Coverage |
| Under $25,000 | 485 (96.4%) | 18 (3.6%) |
| $25,000 to $49,999 | 263 (97.8%) | 6 (2.2%) |
| $50,000 to $74,999 | 354 (97.5%) | 9 (2.5%) |
| $75,000 to $99,999 | 663 (98.1%) | 13 (1.9%) |
| $100,000 and over | 5,537 (99.1%) | 50 (0.9%) |
Public vs Private Health Insurance Coverage by Age in Montecito
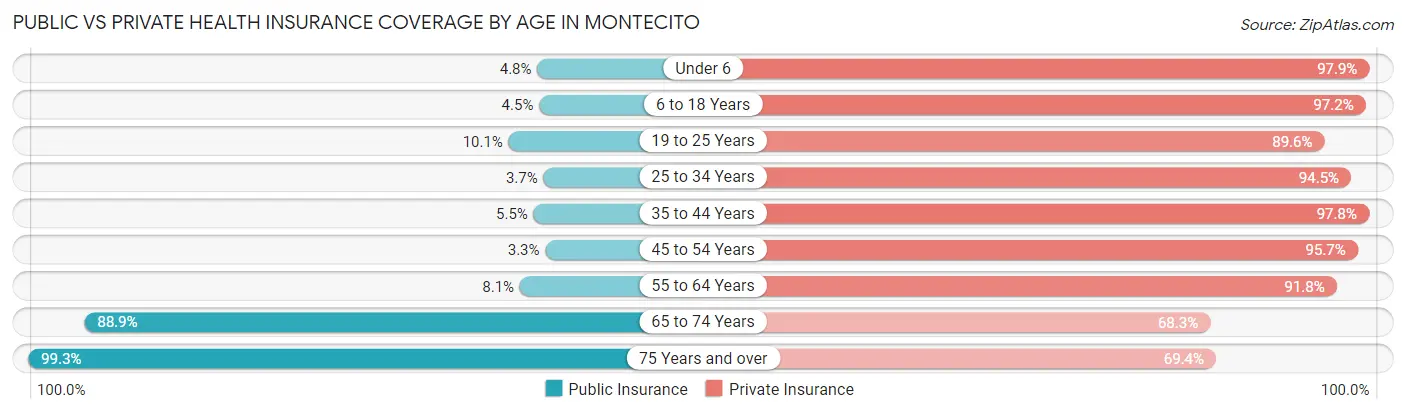
| Age Bracket | Public Insurance | Private Insurance |
| Under 6 | 16 (4.8%) | 325 (97.9%) |
| 6 to 18 Years | 51 (4.5%) | 1,110 (97.2%) |
| 19 to 25 Years | 131 (10.1%) | 1,157 (89.5%) |
| 25 to 34 Years | 14 (3.7%) | 360 (94.5%) |
| 35 to 44 Years | 40 (5.5%) | 710 (97.8%) |
| 45 to 54 Years | 22 (3.3%) | 630 (95.7%) |
| 55 to 64 Years | 77 (8.1%) | 877 (91.8%) |
| 65 to 74 Years | 1,106 (88.9%) | 850 (68.3%) |
| 75 Years and over | 1,774 (99.3%) | 1,240 (69.4%) |
| Total | 3,231 (37.9%) | 7,259 (85.2%) |
Disability Status by Sex by Age in Montecito
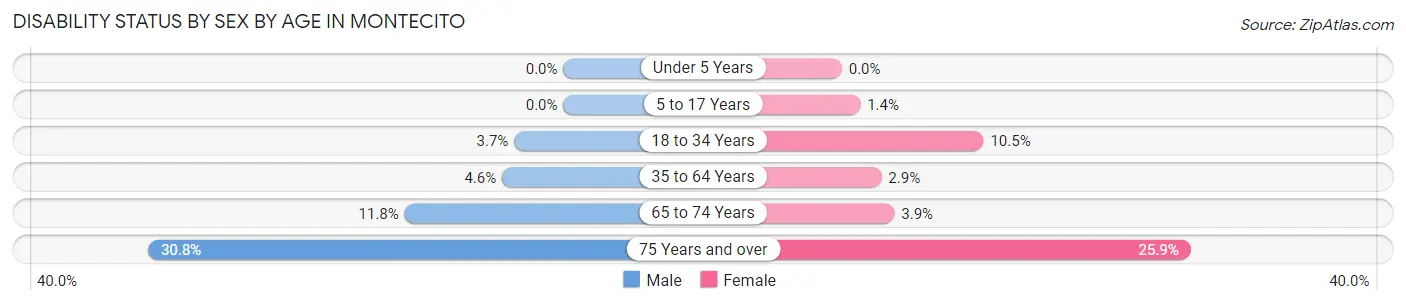
| Age Bracket | Male | Female |
| Under 5 Years | 0 (0.0%) | 0 (0.0%) |
| 5 to 17 Years | 0 (0.0%) | 8 (1.4%) |
| 18 to 34 Years | 36 (3.6%) | 97 (10.5%) |
| 35 to 64 Years | 46 (4.5%) | 39 (2.9%) |
| 65 to 74 Years | 68 (11.8%) | 26 (3.9%) |
| 75 Years and over | 227 (30.8%) | 272 (25.9%) |
Disability Class by Sex by Age in Montecito
Disability Class: Hearing Difficulty
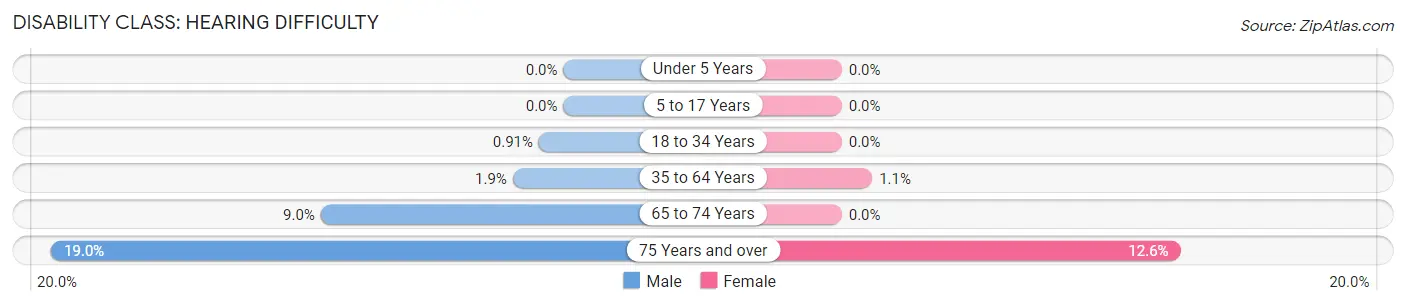
| Age Bracket | Male | Female |
| Under 5 Years | 0 (0.0%) | 0 (0.0%) |
| 5 to 17 Years | 0 (0.0%) | 0 (0.0%) |
| 18 to 34 Years | 9 (0.9%) | 0 (0.0%) |
| 35 to 64 Years | 19 (1.9%) | 15 (1.1%) |
| 65 to 74 Years | 52 (9.0%) | 0 (0.0%) |
| 75 Years and over | 140 (19.0%) | 132 (12.6%) |
Disability Class: Vision Difficulty
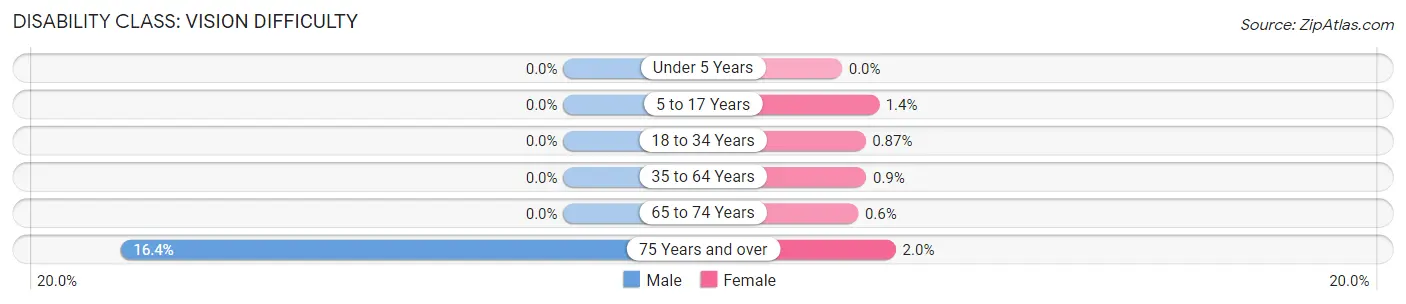
| Age Bracket | Male | Female |
| Under 5 Years | 0 (0.0%) | 0 (0.0%) |
| 5 to 17 Years | 0 (0.0%) | 8 (1.4%) |
| 18 to 34 Years | 0 (0.0%) | 8 (0.9%) |
| 35 to 64 Years | 0 (0.0%) | 12 (0.9%) |
| 65 to 74 Years | 0 (0.0%) | 4 (0.6%) |
| 75 Years and over | 121 (16.4%) | 21 (2.0%) |
Disability Class: Cognitive Difficulty
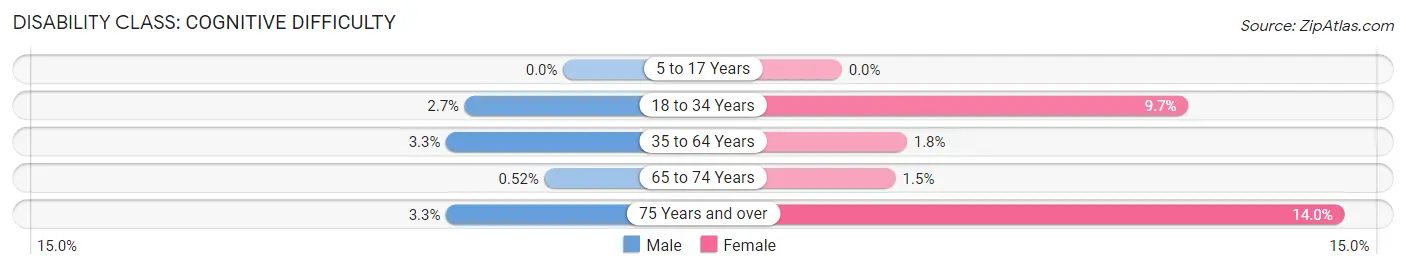
| Age Bracket | Male | Female |
| 5 to 17 Years | 0 (0.0%) | 0 (0.0%) |
| 18 to 34 Years | 27 (2.7%) | 89 (9.7%) |
| 35 to 64 Years | 33 (3.3%) | 24 (1.8%) |
| 65 to 74 Years | 3 (0.5%) | 10 (1.5%) |
| 75 Years and over | 24 (3.3%) | 147 (14.0%) |
Disability Class: Ambulatory Difficulty
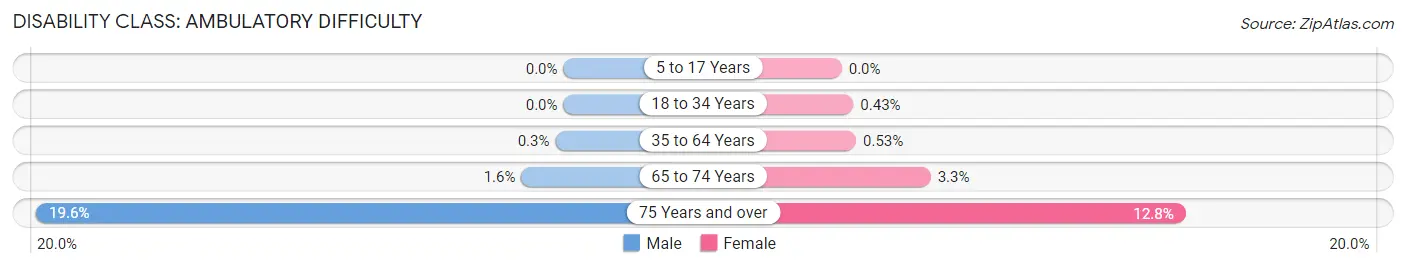
| Age Bracket | Male | Female |
| 5 to 17 Years | 0 (0.0%) | 0 (0.0%) |
| 18 to 34 Years | 0 (0.0%) | 4 (0.4%) |
| 35 to 64 Years | 3 (0.3%) | 7 (0.5%) |
| 65 to 74 Years | 9 (1.6%) | 22 (3.3%) |
| 75 Years and over | 144 (19.6%) | 134 (12.8%) |
Disability Class: Self-Care Difficulty
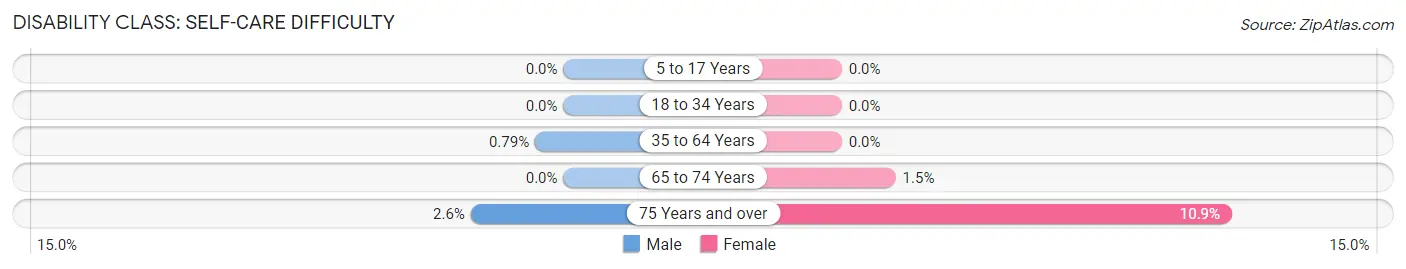
| Age Bracket | Male | Female |
| 5 to 17 Years | 0 (0.0%) | 0 (0.0%) |
| 18 to 34 Years | 0 (0.0%) | 0 (0.0%) |
| 35 to 64 Years | 8 (0.8%) | 0 (0.0%) |
| 65 to 74 Years | 0 (0.0%) | 10 (1.5%) |
| 75 Years and over | 19 (2.6%) | 114 (10.9%) |
Technology Access in Montecito
Computing Device Access in Montecito
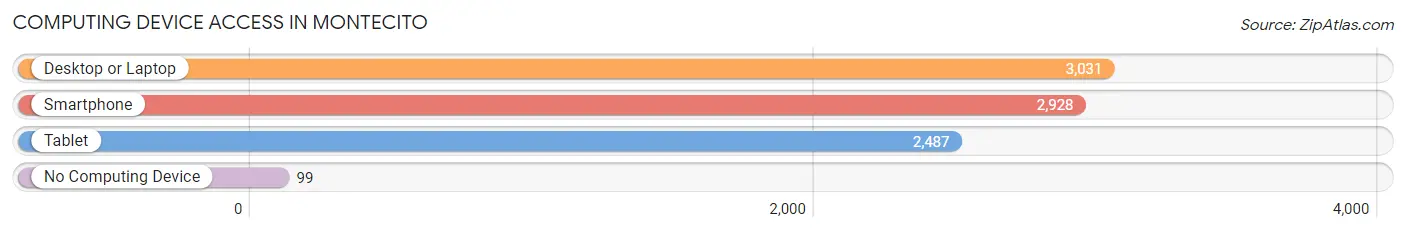
| Device Type | # Households | % Households |
| Desktop or Laptop | 3,031 | 93.2% |
| Smartphone | 2,928 | 90.1% |
| Tablet | 2,487 | 76.5% |
| No Computing Device | 99 | 3.0% |
| Total | 3,251 | 100.0% |
Internet Access in Montecito
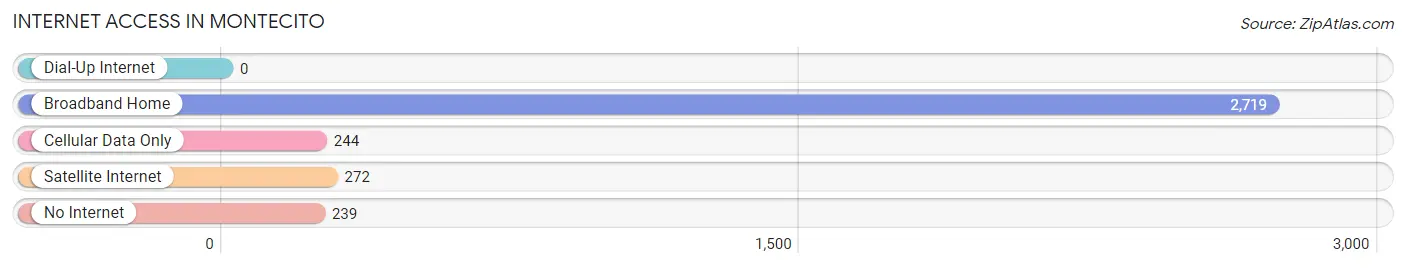
| Internet Type | # Households | % Households |
| Dial-Up Internet | 0 | 0.0% |
| Broadband Home | 2,719 | 83.6% |
| Cellular Data Only | 244 | 7.5% |
| Satellite Internet | 272 | 8.4% |
| No Internet | 239 | 7.3% |
| Total | 3,251 | 100.0% |
Montecito Summary
Montecito, California is a small, affluent community located in Santa Barbara County, California. It is situated between the Pacific Ocean and the Santa Ynez Mountains, and is known for its Mediterranean climate, stunning views, and luxurious lifestyle. Montecito is home to some of the wealthiest and most influential people in the world, and is a popular destination for celebrities and tourists alike.
History
Montecito was originally inhabited by the Chumash people, who lived in the area for thousands of years before the arrival of Europeans. The first Europeans to settle in the area were Spanish missionaries, who established the Mission Santa Barbara in 1786. The mission was the first of its kind in California, and was the center of the Chumash people’s lives for many years.
In the early 19th century, the area was divided into large land grants, and the first settlers began to arrive. The area was known as Rancho Montecito, and was used primarily for cattle ranching and farming. In the late 19th century, the area began to attract wealthy visitors from the East Coast, who built large estates and mansions in the area.
In the early 20th century, Montecito began to develop into a resort community, and many of the large estates were converted into luxury hotels. The area was also home to several prominent Hollywood stars, including Charlie Chaplin, Greta Garbo, and Clark Gable.
Geography
Montecito is located in Santa Barbara County, California, and is situated between the Pacific Ocean and the Santa Ynez Mountains. The area is known for its Mediterranean climate, with mild temperatures year-round and plenty of sunshine. The area is also known for its stunning views of the ocean and mountains, and is a popular destination for tourists and celebrities alike.
The area is home to several parks and beaches, including Butterfly Beach, Miramar Beach, and Montecito Beach. The area is also home to several golf courses, including the Montecito Country Club and the Santa Barbara Golf Club.
Economy
Montecito is known for its affluent lifestyle, and the local economy is largely driven by tourism and real estate. The area is home to several luxury hotels, resorts, and restaurants, and is a popular destination for celebrities and tourists alike. The area is also home to several high-end boutiques and shops, and is a popular destination for shoppers.
The area is also home to several technology companies, including AppFolio, Inc., and is a popular destination for entrepreneurs and tech professionals.
Demographics
As of the 2010 census, the population of Montecito was 8,965. The population is largely white (83.3%), with smaller percentages of Hispanic (7.2%), Asian (3.7%), and African American (1.2%) residents. The median household income is $125,000, and the median home value is $2.2 million. The area is known for its affluent lifestyle, and is home to some of the wealthiest and most influential people in the world.
Common Questions
What is Per Capita Income in Montecito?
Per Capita income in Montecito is $127,544.
What is the Median Family Income in Montecito?
Median Family Income in Montecito is $214,444.
What is the Median Household income in Montecito?
Median Household Income in Montecito is $212,154.
What is Income or Wage Gap in Montecito?
Income or Wage Gap in Montecito is 59.7%.
Women in Montecito earn 40.3 cents for every dollar earned by a man.
What is Inequality or Gini Index in Montecito?
Inequality or Gini Index in Montecito is 0.54.
What is the Total Population of Montecito?
Total Population of Montecito is 8,529.
What is the Total Male Population of Montecito?
Total Male Population of Montecito is 3,812.
What is the Total Female Population of Montecito?
Total Female Population of Montecito is 4,717.
What is the Ratio of Males per 100 Females in Montecito?
There are 80.81 Males per 100 Females in Montecito.
What is the Ratio of Females per 100 Males in Montecito?
There are 123.74 Females per 100 Males in Montecito.
What is the Median Population Age in Montecito?
Median Population Age in Montecito is 50.4 Years.
What is the Average Family Size in Montecito
Average Family Size in Montecito is 2.8 People.
What is the Average Household Size in Montecito
Average Household Size in Montecito is 2.3 People.
How Large is the Labor Force in Montecito?
There are 3,216 People in the Labor Forcein in Montecito.
What is the Percentage of People in the Labor Force in Montecito?
43.1% of People are in the Labor Force in Montecito.
What is the Unemployment Rate in Montecito?
Unemployment Rate in Montecito is 5.0%.