Cities with the Highest Percentage of Population Employed in Legal Services & Support in Washington
RELATED REPORTS & OPTIONS
Legal Services & Support
Washington
Compare Cities
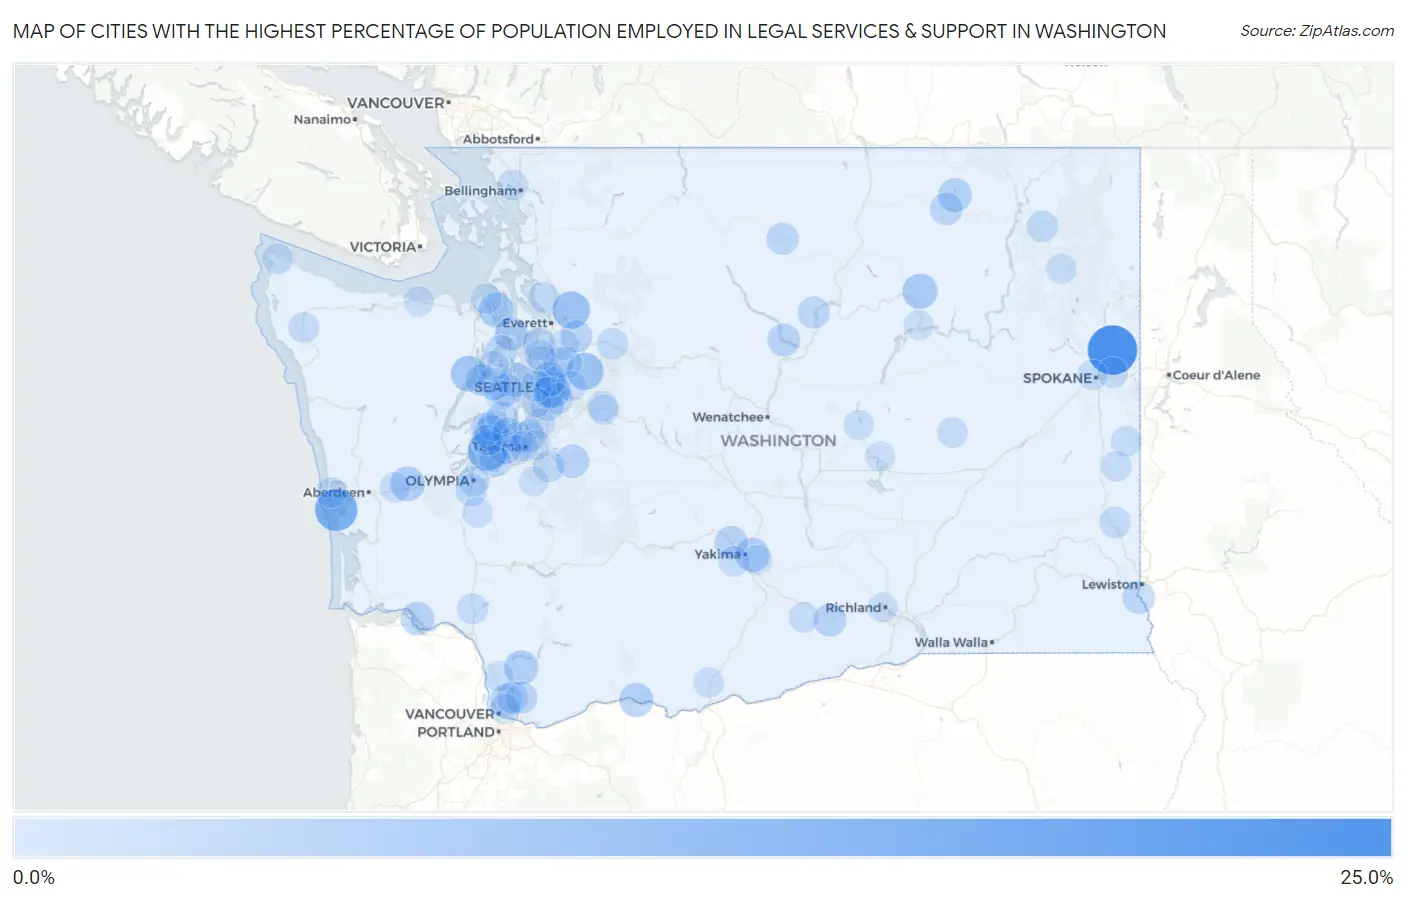
Map of Cities with the Highest Percentage of Population Employed in Legal Services & Support in Washington
0.0%
25.0%
Cities with the Highest Percentage of Population Employed in Legal Services & Support in Washington
| City | % Employed | vs State | vs National | |
| 1. | Green Bluff | 22.6% | 1.1%(+21.6)#1 | 1.2%(+21.5)#46 |
| 2. | Cohassett Beach | 14.4% | 1.1%(+13.3)#2 | 1.2%(+13.2)#111 |
| 3. | Longbranch | 11.3% | 1.1%(+10.2)#3 | 1.2%(+10.1)#174 |
| 4. | Lochsloy | 9.0% | 1.1%(+7.88)#4 | 1.2%(+7.77)#276 |
| 5. | Lake Marcel Stillwater | 8.6% | 1.1%(+7.50)#5 | 1.2%(+7.39)#300 |
| 6. | Brinnon | 7.3% | 1.1%(+6.25)#6 | 1.2%(+6.14)#401 |
| 7. | Beaux Arts Village | 7.2% | 1.1%(+6.17)#7 | 1.2%(+6.06)#411 |
| 8. | Hunts Point | 6.6% | 1.1%(+5.48)#8 | 1.2%(+5.37)#499 |
| 9. | Nespelem | 6.5% | 1.1%(+5.45)#9 | 1.2%(+5.34)#506 |
| 10. | Marrowstone | 6.4% | 1.1%(+5.36)#10 | 1.2%(+5.25)#527 |
| 11. | Satsop | 6.1% | 1.1%(+5.05)#11 | 1.2%(+4.94)#577 |
| 12. | Key Center | 5.7% | 1.1%(+4.65)#12 | 1.2%(+4.54)#656 |
| 13. | Amboy | 5.7% | 1.1%(+4.58)#13 | 1.2%(+4.47)#671 |
| 14. | Terrace Heights | 5.6% | 1.1%(+4.54)#14 | 1.2%(+4.43)#681 |
| 15. | Bingen | 5.5% | 1.1%(+4.38)#15 | 1.2%(+4.27)#718 |
| 16. | Bainbridge Island | 5.2% | 1.1%(+4.17)#16 | 1.2%(+4.06)#770 |
| 17. | Curlew Lake | 5.1% | 1.1%(+4.05)#17 | 1.2%(+3.94)#812 |
| 18. | Cathlamet | 5.1% | 1.1%(+3.98)#18 | 1.2%(+3.87)#828 |
| 19. | Hansville | 4.7% | 1.1%(+3.63)#19 | 1.2%(+3.52)#945 |
| 20. | Buckley | 4.7% | 1.1%(+3.61)#20 | 1.2%(+3.50)#955 |
| 21. | Eschbach | 4.6% | 1.1%(+3.54)#21 | 1.2%(+3.43)#978 |
| 22. | Fox Island | 4.4% | 1.1%(+3.31)#22 | 1.2%(+3.20)#1,049 |
| 23. | Prosser | 4.3% | 1.1%(+3.26)#23 | 1.2%(+3.15)#1,078 |
| 24. | Manson | 4.2% | 1.1%(+3.17)#24 | 1.2%(+3.06)#1,114 |
| 25. | Enetai | 4.2% | 1.1%(+3.14)#25 | 1.2%(+3.03)#1,130 |
| 26. | Republic | 4.0% | 1.1%(+2.93)#26 | 1.2%(+2.82)#1,227 |
| 27. | Chico | 3.9% | 1.1%(+2.87)#27 | 1.2%(+2.76)#1,262 |
| 28. | Asotin | 3.8% | 1.1%(+2.72)#28 | 1.2%(+2.61)#1,324 |
| 29. | Meadowdale | 3.8% | 1.1%(+2.71)#29 | 1.2%(+2.60)#1,327 |
| 30. | Dash Point | 3.8% | 1.1%(+2.71)#30 | 1.2%(+2.60)#1,329 |
| 31. | Lofall | 3.7% | 1.1%(+2.61)#31 | 1.2%(+2.50)#1,412 |
| 32. | Barberton | 3.6% | 1.1%(+2.53)#32 | 1.2%(+2.42)#1,461 |
| 33. | Winthrop | 3.6% | 1.1%(+2.50)#33 | 1.2%(+2.39)#1,481 |
| 34. | Vaughn | 3.5% | 1.1%(+2.40)#34 | 1.2%(+2.29)#1,562 |
| 35. | Chain Lake | 3.5% | 1.1%(+2.39)#35 | 1.2%(+2.28)#1,563 |
| 36. | Bryn Mawr Skyway | 3.5% | 1.1%(+2.38)#36 | 1.2%(+2.28)#1,568 |
| 37. | Hockinson | 3.4% | 1.1%(+2.33)#37 | 1.2%(+2.22)#1,609 |
| 38. | Pateros | 3.3% | 1.1%(+2.27)#38 | 1.2%(+2.16)#1,644 |
| 39. | Stansberry Lake | 3.2% | 1.1%(+2.15)#39 | 1.2%(+2.04)#1,734 |
| 40. | Seabeck | 3.2% | 1.1%(+2.11)#40 | 1.2%(+2.00)#1,770 |
| 41. | Mcmillin | 3.2% | 1.1%(+2.11)#41 | 1.2%(+2.00)#1,772 |
| 42. | Burley | 3.2% | 1.1%(+2.09)#42 | 1.2%(+1.98)#1,796 |
| 43. | Mercer Island | 3.1% | 1.1%(+1.99)#43 | 1.2%(+1.88)#1,867 |
| 44. | Brush Prairie | 3.1% | 1.1%(+1.98)#44 | 1.2%(+1.87)#1,870 |
| 45. | Tumwater | 3.0% | 1.1%(+1.88)#45 | 1.2%(+1.77)#1,973 |
| 46. | Anderson Island | 3.0% | 1.1%(+1.88)#46 | 1.2%(+1.77)#1,976 |
| 47. | Newcastle | 2.9% | 1.1%(+1.87)#47 | 1.2%(+1.76)#1,998 |
| 48. | Albion | 2.9% | 1.1%(+1.85)#48 | 1.2%(+1.74)#2,016 |
| 49. | Colville | 2.7% | 1.1%(+1.60)#49 | 1.2%(+1.49)#2,260 |
| 50. | May Creek | 2.6% | 1.1%(+1.53)#50 | 1.2%(+1.42)#2,347 |
| 51. | Lake Goodwin | 2.6% | 1.1%(+1.51)#51 | 1.2%(+1.40)#2,364 |
| 52. | Cottage Lake | 2.6% | 1.1%(+1.49)#52 | 1.2%(+1.38)#2,382 |
| 53. | Ruston | 2.5% | 1.1%(+1.44)#53 | 1.2%(+1.33)#2,433 |
| 54. | Olympia | 2.5% | 1.1%(+1.40)#54 | 1.2%(+1.29)#2,465 |
| 55. | Forks | 2.3% | 1.1%(+1.21)#55 | 1.2%(+1.10)#2,740 |
| 56. | Seattle | 2.2% | 1.1%(+1.17)#56 | 1.2%(+1.06)#2,804 |
| 57. | Castle Rock | 2.2% | 1.1%(+1.17)#57 | 1.2%(+1.06)#2,806 |
| 58. | Clear Lake Cdp Skagit County | 2.2% | 1.1%(+1.12)#58 | 1.2%(+1.01)#2,879 |
| 59. | North Bend | 2.2% | 1.1%(+1.09)#59 | 1.2%(+0.984)#2,932 |
| 60. | Home | 2.1% | 1.1%(+1.07)#60 | 1.2%(+0.962)#2,970 |
| 61. | Latah | 2.1% | 1.1%(+1.05)#61 | 1.2%(+0.944)#2,992 |
| 62. | Millwood | 2.1% | 1.1%(+1.04)#62 | 1.2%(+0.931)#3,007 |
| 63. | Ahtanum | 2.1% | 1.1%(+1.01)#63 | 1.2%(+0.905)#3,055 |
| 64. | Neah Bay | 2.1% | 1.1%(+0.992)#64 | 1.2%(+0.882)#3,100 |
| 65. | Lake Forest Park | 2.0% | 1.1%(+0.930)#65 | 1.2%(+0.820)#3,210 |
| 66. | Marietta Alderwood | 2.0% | 1.1%(+0.893)#66 | 1.2%(+0.784)#3,272 |
| 67. | Odessa | 2.0% | 1.1%(+0.886)#67 | 1.2%(+0.777)#3,289 |
| 68. | Ocean Shores | 1.9% | 1.1%(+0.806)#68 | 1.2%(+0.697)#3,451 |
| 69. | Oakesdale | 1.9% | 1.1%(+0.800)#69 | 1.2%(+0.691)#3,468 |
| 70. | Montesano | 1.9% | 1.1%(+0.793)#70 | 1.2%(+0.684)#3,479 |
| 71. | Woodinville | 1.9% | 1.1%(+0.778)#71 | 1.2%(+0.669)#3,503 |
| 72. | Gig Harbor | 1.8% | 1.1%(+0.754)#72 | 1.2%(+0.645)#3,572 |
| 73. | Port Townsend | 1.8% | 1.1%(+0.728)#73 | 1.2%(+0.618)#3,634 |
| 74. | Mabton | 1.8% | 1.1%(+0.724)#74 | 1.2%(+0.615)#3,647 |
| 75. | Bangor Base | 1.7% | 1.1%(+0.666)#75 | 1.2%(+0.557)#3,773 |
| 76. | Tenino | 1.7% | 1.1%(+0.658)#76 | 1.2%(+0.549)#3,794 |
| 77. | Chewelah | 1.7% | 1.1%(+0.651)#77 | 1.2%(+0.542)#3,809 |
| 78. | Des Moines | 1.7% | 1.1%(+0.646)#78 | 1.2%(+0.537)#3,831 |
| 79. | Cathcart | 1.7% | 1.1%(+0.646)#79 | 1.2%(+0.537)#3,832 |
| 80. | Sammamish | 1.7% | 1.1%(+0.638)#80 | 1.2%(+0.529)#3,852 |
| 81. | Minnehaha | 1.7% | 1.1%(+0.637)#81 | 1.2%(+0.528)#3,857 |
| 82. | Port Angeles East | 1.6% | 1.1%(+0.554)#82 | 1.2%(+0.445)#4,050 |
| 83. | Spokane | 1.6% | 1.1%(+0.532)#83 | 1.2%(+0.422)#4,107 |
| 84. | Goldendale | 1.6% | 1.1%(+0.522)#84 | 1.2%(+0.413)#4,132 |
| 85. | Fife Heights | 1.6% | 1.1%(+0.502)#85 | 1.2%(+0.393)#4,178 |
| 86. | Lakeview | 1.6% | 1.1%(+0.491)#86 | 1.2%(+0.381)#4,213 |
| 87. | Fairwood Cdp Spokane County | 1.6% | 1.1%(+0.478)#87 | 1.2%(+0.369)#4,244 |
| 88. | La Center | 1.5% | 1.1%(+0.474)#88 | 1.2%(+0.364)#4,260 |
| 89. | Fircrest | 1.5% | 1.1%(+0.412)#89 | 1.2%(+0.303)#4,454 |
| 90. | Clyde Hill | 1.5% | 1.1%(+0.398)#90 | 1.2%(+0.289)#4,508 |
| 91. | Moxee | 1.5% | 1.1%(+0.392)#91 | 1.2%(+0.283)#4,529 |
| 92. | White Center | 1.4% | 1.1%(+0.368)#92 | 1.2%(+0.259)#4,604 |
| 93. | Riverbend | 1.4% | 1.1%(+0.361)#93 | 1.2%(+0.252)#4,625 |
| 94. | Mountlake Terrace | 1.4% | 1.1%(+0.348)#94 | 1.2%(+0.239)#4,670 |
| 95. | Navy Yard City | 1.4% | 1.1%(+0.336)#95 | 1.2%(+0.227)#4,706 |
| 96. | Moses Lake North | 1.4% | 1.1%(+0.320)#96 | 1.2%(+0.210)#4,761 |
| 97. | Richland | 1.4% | 1.1%(+0.311)#97 | 1.2%(+0.202)#4,788 |
| 98. | Elk Plain | 1.4% | 1.1%(+0.276)#98 | 1.2%(+0.167)#4,898 |
| 99. | Coulee Dam | 1.3% | 1.1%(+0.272)#99 | 1.2%(+0.163)#4,909 |
| 100. | Tacoma | 1.3% | 1.1%(+0.264)#100 | 1.2%(+0.155)#4,940 |
Common Questions
What are the Top 10 Cities with the Highest Percentage of Population Employed in Legal Services & Support in Washington?
Top 10 Cities with the Highest Percentage of Population Employed in Legal Services & Support in Washington are:
#1
22.6%
#2
14.4%
#3
11.3%
#4
9.0%
#5
8.6%
#6
7.3%
#7
7.2%
#8
6.6%
#9
6.5%
#10
6.4%
What city has the Highest Percentage of Population Employed in Legal Services & Support in Washington?
Green Bluff has the Highest Percentage of Population Employed in Legal Services & Support in Washington with 22.6%.
What is the Percentage of Population Employed in Legal Services & Support in the State of Washington?
Percentage of Population Employed in Legal Services & Support in Washington is 1.1%.
What is the Percentage of Population Employed in Legal Services & Support in the United States?
Percentage of Population Employed in Legal Services & Support in the United States is 1.2%.