Ladera Heights, CA Map & Demographics
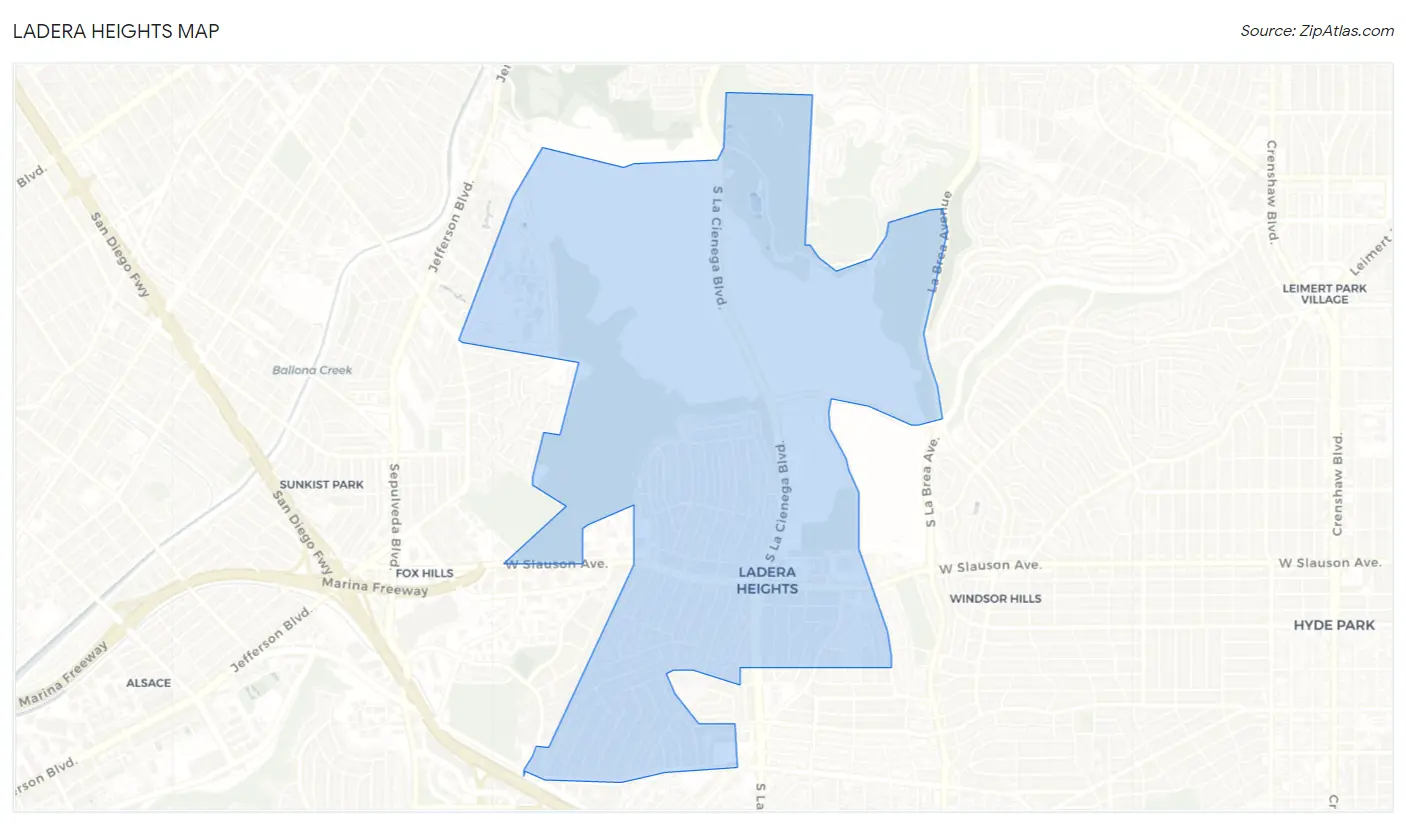
Ladera Heights Map
Ladera Heights Overview
$75,170
PER CAPITA INCOME
$177,353
AVG FAMILY INCOME
$157,824
AVG HOUSEHOLD INCOME
2.1%
WAGE / INCOME GAP [ % ]
97.9¢/ $1
WAGE / INCOME GAP [ $ ]
0.43
INEQUALITY / GINI INDEX
6,710
TOTAL POPULATION
2,954
MALE POPULATION
3,756
FEMALE POPULATION
78.65
MALES / 100 FEMALES
127.15
FEMALES / 100 MALES
42.9
MEDIAN AGE
3.0
AVG FAMILY SIZE
2.5
AVG HOUSEHOLD SIZE
3,598
LABOR FORCE [ PEOPLE ]
64.7%
PERCENT IN LABOR FORCE
3.4%
UNEMPLOYMENT RATE
Income in Ladera Heights
Income Overview in Ladera Heights
Per Capita Income in Ladera Heights is $75,170, while median incomes of families and households are $177,353 and $157,824 respectively.
| Characteristic | Number | Measure |
| Per Capita Income | 6,710 | $75,170 |
| Median Family Income | 1,816 | $177,353 |
| Mean Family Income | 1,816 | $212,061 |
| Median Household Income | 2,654 | $157,824 |
| Mean Household Income | 2,654 | $184,646 |
| Income Deficit | 1,816 | $0 |
| Wage / Income Gap (%) | 6,710 | 2.14% |
| Wage / Income Gap ($) | 6,710 | 97.86¢ per $1 |
| Gini / Inequality Index | 6,710 | 0.43 |
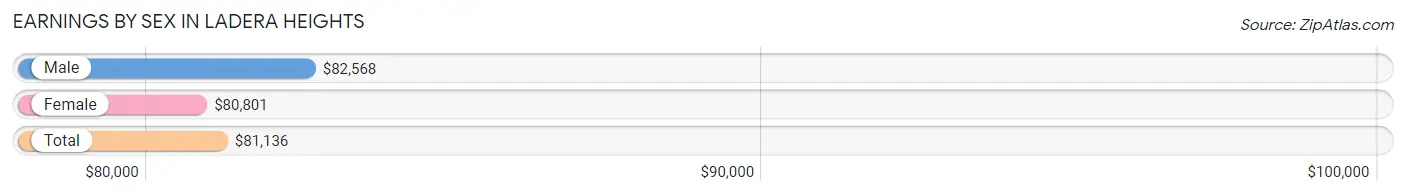
Earnings by Sex in Ladera Heights
Average Earnings in Ladera Heights are $81,136, $82,568 for men and $80,801 for women, a difference of 2.1%.
| Sex | Number | Average Earnings |
| Male | 1,753 (47.6%) | $82,568 |
| Female | 1,931 (52.4%) | $80,801 |
| Total | 3,684 (100.0%) | $81,136 |
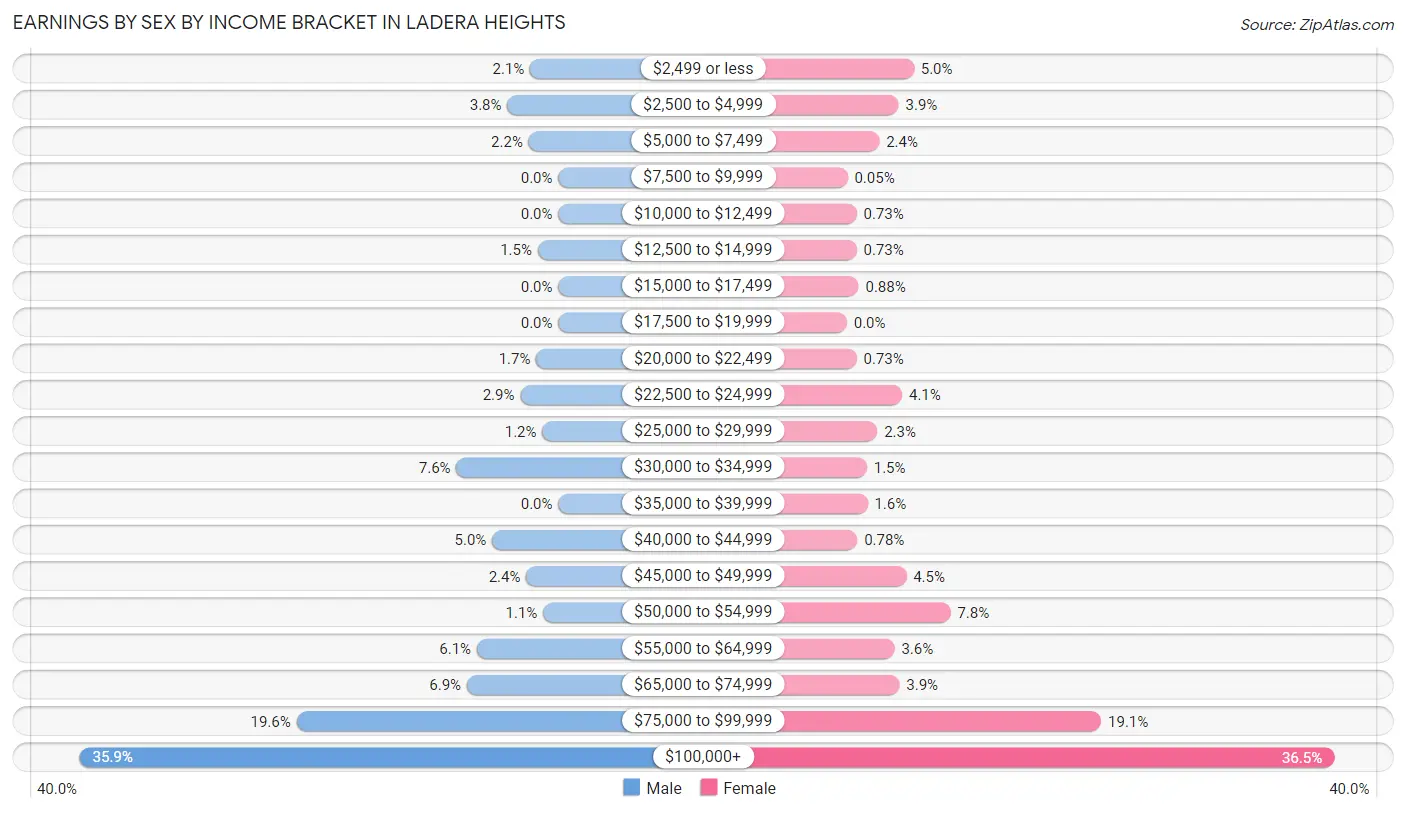
Earnings by Sex by Income Bracket in Ladera Heights
The most common earnings brackets in Ladera Heights are $100,000+ for men (629 | 35.9%) and $100,000+ for women (705 | 36.5%).
| Income | Male | Female |
| $2,499 or less | 37 (2.1%) | 97 (5.0%) |
| $2,500 to $4,999 | 67 (3.8%) | 75 (3.9%) |
| $5,000 to $7,499 | 39 (2.2%) | 47 (2.4%) |
| $7,500 to $9,999 | 0 (0.0%) | 1 (0.1%) |
| $10,000 to $12,499 | 0 (0.0%) | 14 (0.7%) |
| $12,500 to $14,999 | 27 (1.5%) | 14 (0.7%) |
| $15,000 to $17,499 | 0 (0.0%) | 17 (0.9%) |
| $17,500 to $19,999 | 0 (0.0%) | 0 (0.0%) |
| $20,000 to $22,499 | 29 (1.7%) | 14 (0.7%) |
| $22,500 to $24,999 | 50 (2.9%) | 80 (4.1%) |
| $25,000 to $29,999 | 21 (1.2%) | 44 (2.3%) |
| $30,000 to $34,999 | 134 (7.6%) | 29 (1.5%) |
| $35,000 to $39,999 | 0 (0.0%) | 30 (1.5%) |
| $40,000 to $44,999 | 87 (5.0%) | 15 (0.8%) |
| $45,000 to $49,999 | 42 (2.4%) | 86 (4.4%) |
| $50,000 to $54,999 | 20 (1.1%) | 150 (7.8%) |
| $55,000 to $64,999 | 107 (6.1%) | 69 (3.6%) |
| $65,000 to $74,999 | 120 (6.9%) | 76 (3.9%) |
| $75,000 to $99,999 | 344 (19.6%) | 368 (19.1%) |
| $100,000+ | 629 (35.9%) | 705 (36.5%) |
| Total | 1,753 (100.0%) | 1,931 (100.0%) |
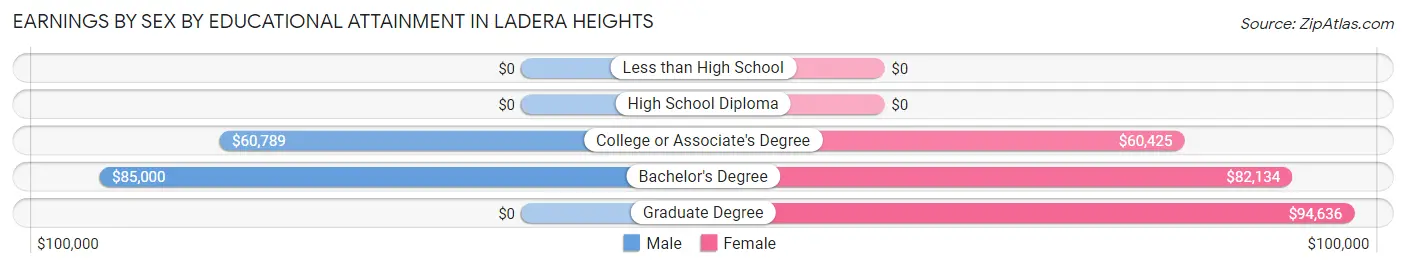
Earnings by Sex by Educational Attainment in Ladera Heights
Average earnings in Ladera Heights are $85,131 for men and $84,634 for women, a difference of 0.6%. Men with an educational attainment of bachelor's degree enjoy the highest average annual earnings of $85,000, while those with college or associate's degree education earn the least with $60,789. Women with an educational attainment of graduate degree earn the most with the average annual earnings of $94,636, while those with college or associate's degree education have the smallest earnings of $60,425.
| Educational Attainment | Male Income | Female Income |
| Less than High School | - | - |
| High School Diploma | - | - |
| College or Associate's Degree | $60,789 | $60,425 |
| Bachelor's Degree | $85,000 | $82,134 |
| Graduate Degree | - | - |
| Total | $85,131 | $84,634 |
Family Income in Ladera Heights
Family Income Brackets in Ladera Heights
According to the Ladera Heights family income data, there are 728 families falling into the $200,000+ income range, which is the most common income bracket and makes up 40.1% of all families.
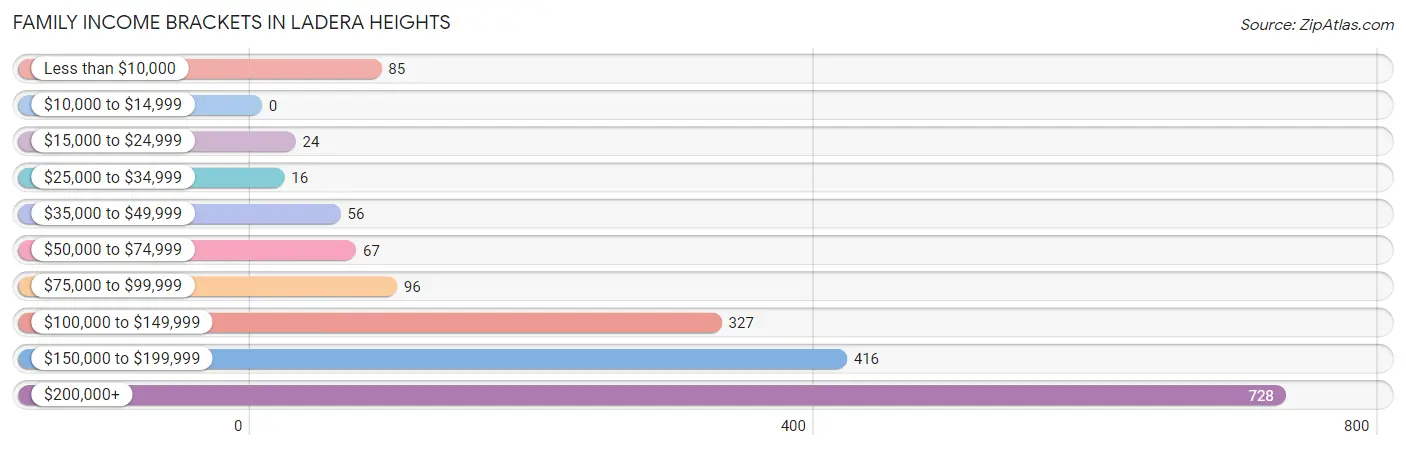
| Income Bracket | # Families | % Families |
| Less than $10,000 | 85 | 4.7% |
| $10,000 to $14,999 | 0 | 0.0% |
| $15,000 to $24,999 | 24 | 1.3% |
| $25,000 to $34,999 | 16 | 0.9% |
| $35,000 to $49,999 | 56 | 3.1% |
| $50,000 to $74,999 | 67 | 3.7% |
| $75,000 to $99,999 | 96 | 5.3% |
| $100,000 to $149,999 | 327 | 18.0% |
| $150,000 to $199,999 | 416 | 22.9% |
| $200,000+ | 728 | 40.1% |
Family Income by Famaliy Size in Ladera Heights
5-person families (55 | 3.0%) account for the highest median family income in Ladera Heights with $250,001 per family, while 2-person families (967 | 53.2%) have the highest median income of $81,080 per family member.
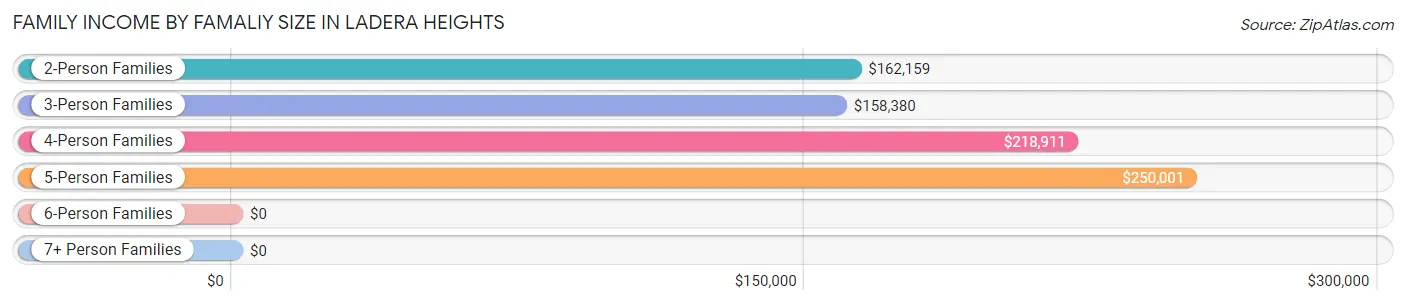
| Income Bracket | # Families | Median Income |
| 2-Person Families | 967 (53.2%) | $162,159 |
| 3-Person Families | 462 (25.4%) | $158,380 |
| 4-Person Families | 287 (15.8%) | $218,911 |
| 5-Person Families | 55 (3.0%) | $250,001 |
| 6-Person Families | 45 (2.5%) | $0 |
| 7+ Person Families | 0 (0.0%) | $0 |
| Total | 1,816 (100.0%) | $177,353 |
Family Income by Number of Earners in Ladera Heights
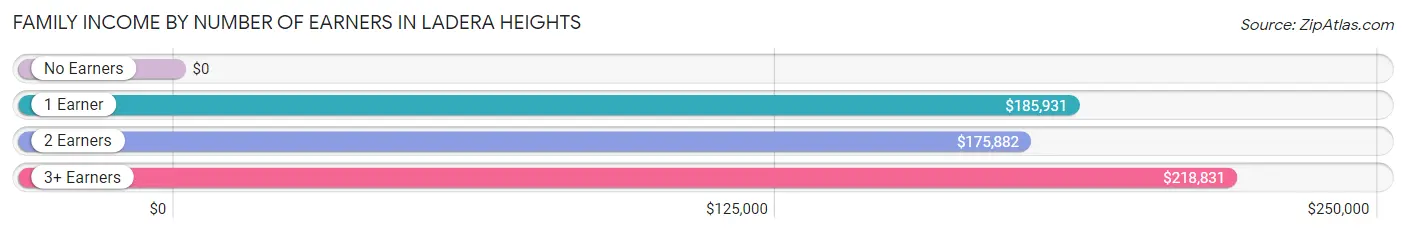
| Number of Earners | # Families | Median Income |
| No Earners | 269 (14.8%) | $0 |
| 1 Earner | 688 (37.9%) | $185,931 |
| 2 Earners | 724 (39.9%) | $175,882 |
| 3+ Earners | 135 (7.4%) | $218,831 |
| Total | 1,816 (100.0%) | $177,353 |
Household Income in Ladera Heights
Household Income Brackets in Ladera Heights
With 979 households falling in the category, the $200,000+ income range is the most frequent in Ladera Heights, accounting for 36.9% of all households.
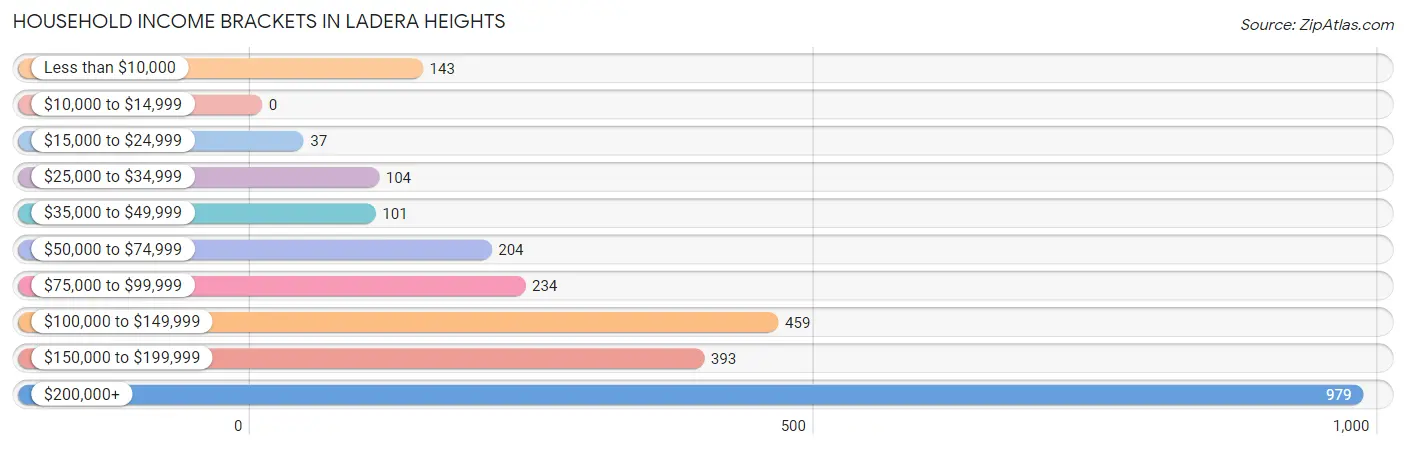
| Income Bracket | # Households | % Households |
| Less than $10,000 | 143 | 5.4% |
| $10,000 to $14,999 | 0 | 0.0% |
| $15,000 to $24,999 | 37 | 1.4% |
| $25,000 to $34,999 | 104 | 3.9% |
| $35,000 to $49,999 | 101 | 3.8% |
| $50,000 to $74,999 | 204 | 7.7% |
| $75,000 to $99,999 | 234 | 8.8% |
| $100,000 to $149,999 | 459 | 17.3% |
| $150,000 to $199,999 | 393 | 14.8% |
| $200,000+ | 979 | 36.9% |
Household Income by Householder Age in Ladera Heights
The median household income in Ladera Heights is $157,824, with the highest median household income of $186,056 found in the 45 to 64 years age bracket for the primary householder. A total of 958 households (36.1%) fall into this category. Meanwhile, the 15 to 24 years age bracket for the primary householder has the lowest median household income of $0, with 30 households (1.1%) in this group.
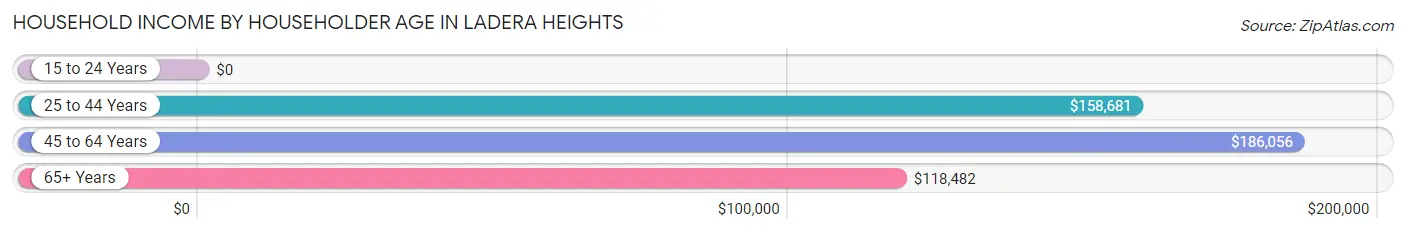
| Income Bracket | # Households | Median Income |
| 15 to 24 Years | 30 (1.1%) | $0 |
| 25 to 44 Years | 803 (30.3%) | $158,681 |
| 45 to 64 Years | 958 (36.1%) | $186,056 |
| 65+ Years | 863 (32.5%) | $118,482 |
| Total | 2,654 (100.0%) | $157,824 |
Poverty in Ladera Heights
Income Below Poverty by Sex and Age in Ladera Heights
With 5.5% poverty level for males and 8.4% for females among the residents of Ladera Heights, 25 to 34 year old males and 5 year old females are the most vulnerable to poverty, with 105 males (17.7%) and 109 females (86.5%) in their respective age groups living below the poverty level.
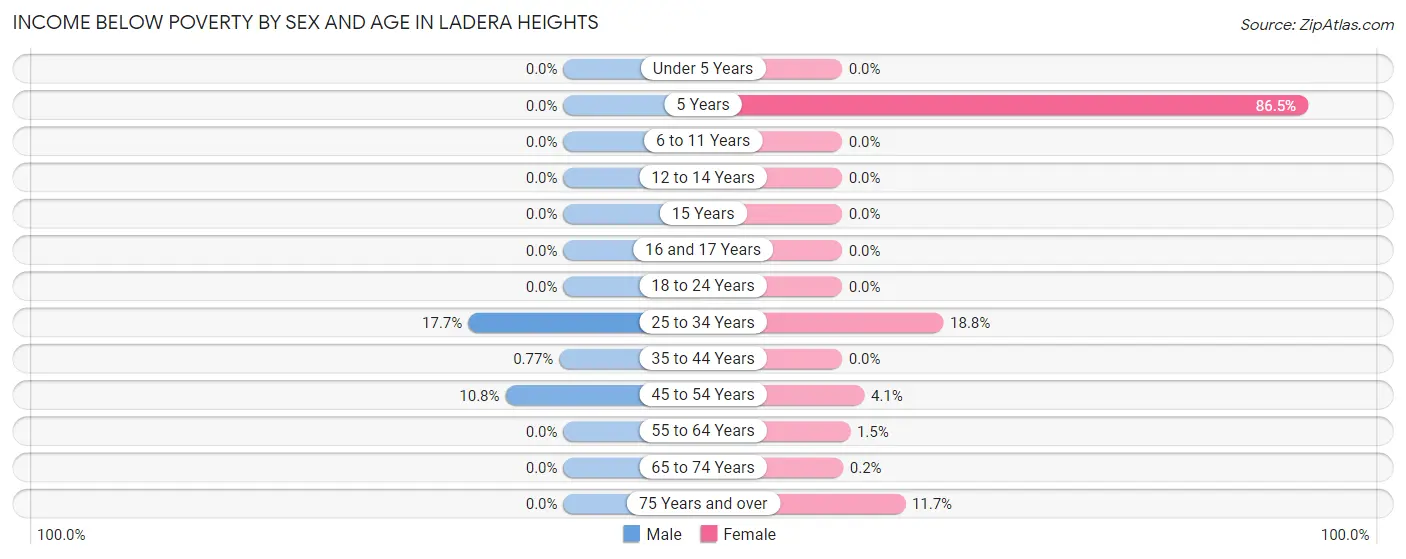
| Age Bracket | Male | Female |
| Under 5 Years | 0 (0.0%) | 0 (0.0%) |
| 5 Years | 0 (0.0%) | 109 (86.5%) |
| 6 to 11 Years | 0 (0.0%) | 0 (0.0%) |
| 12 to 14 Years | 0 (0.0%) | 0 (0.0%) |
| 15 Years | 0 (0.0%) | 0 (0.0%) |
| 16 and 17 Years | 0 (0.0%) | 0 (0.0%) |
| 18 to 24 Years | 0 (0.0%) | 0 (0.0%) |
| 25 to 34 Years | 105 (17.7%) | 120 (18.8%) |
| 35 to 44 Years | 3 (0.8%) | 0 (0.0%) |
| 45 to 54 Years | 51 (10.8%) | 19 (4.1%) |
| 55 to 64 Years | 0 (0.0%) | 7 (1.5%) |
| 65 to 74 Years | 0 (0.0%) | 1 (0.2%) |
| 75 Years and over | 0 (0.0%) | 60 (11.7%) |
| Total | 159 (5.5%) | 316 (8.4%) |
Income Above Poverty by Sex and Age in Ladera Heights
According to the poverty statistics in Ladera Heights, males aged under 5 years and females aged under 5 years are the age groups that are most secure financially, with 100.0% of males and 100.0% of females in these age groups living above the poverty line.
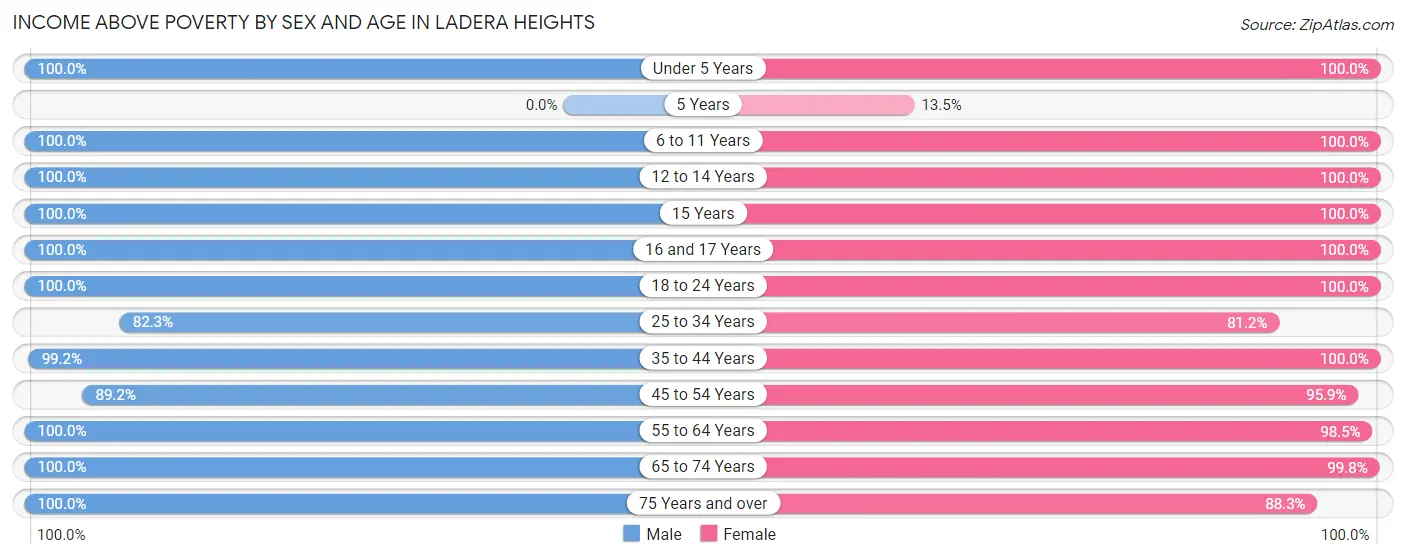
| Age Bracket | Male | Female |
| Under 5 Years | 79 (100.0%) | 102 (100.0%) |
| 5 Years | 0 (0.0%) | 17 (13.5%) |
| 6 to 11 Years | 342 (100.0%) | 247 (100.0%) |
| 12 to 14 Years | 79 (100.0%) | 37 (100.0%) |
| 15 Years | 18 (100.0%) | 53 (100.0%) |
| 16 and 17 Years | 13 (100.0%) | 26 (100.0%) |
| 18 to 24 Years | 127 (100.0%) | 269 (100.0%) |
| 25 to 34 Years | 489 (82.3%) | 518 (81.2%) |
| 35 to 44 Years | 387 (99.2%) | 325 (100.0%) |
| 45 to 54 Years | 423 (89.2%) | 441 (95.9%) |
| 55 to 64 Years | 303 (100.0%) | 457 (98.5%) |
| 65 to 74 Years | 149 (100.0%) | 496 (99.8%) |
| 75 Years and over | 318 (100.0%) | 452 (88.3%) |
| Total | 2,727 (94.5%) | 3,440 (91.6%) |
Income Below Poverty Among Married-Couple Families in Ladera Heights
The poverty statistics for married-couple families in Ladera Heights show that 7.0% or 85 of the total 1,222 families live below the poverty line. Families with 1 or 2 children have the highest poverty rate of 21.0%, comprising of 85 families. On the other hand, families with no children have the lowest poverty rate of 0.0%, which includes 0 families.
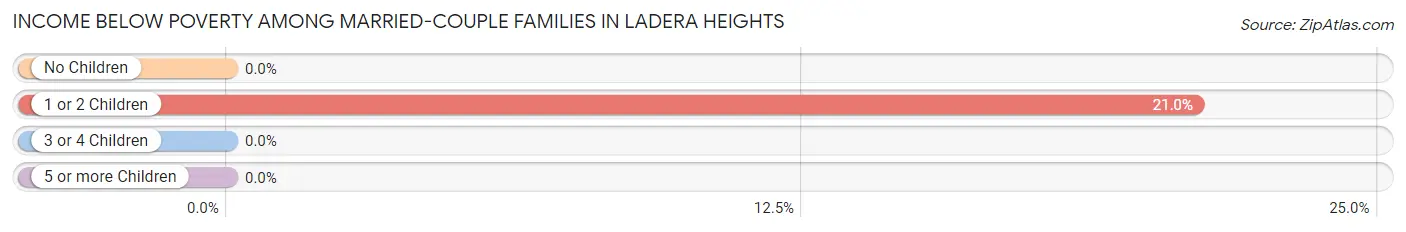
| Children | Above Poverty | Below Poverty |
| No Children | 740 (100.0%) | 0 (0.0%) |
| 1 or 2 Children | 319 (79.0%) | 85 (21.0%) |
| 3 or 4 Children | 78 (100.0%) | 0 (0.0%) |
| 5 or more Children | 0 (0.0%) | 0 (0.0%) |
| Total | 1,137 (93.0%) | 85 (7.0%) |
Income Below Poverty Among Single-Parent Households in Ladera Heights
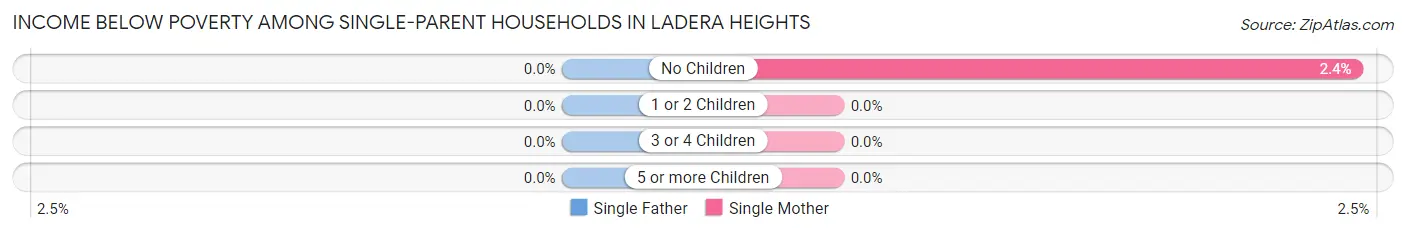
| Children | Single Father | Single Mother |
| No Children | 0 (0.0%) | 8 (2.4%) |
| 1 or 2 Children | 0 (0.0%) | 0 (0.0%) |
| 3 or 4 Children | 0 (0.0%) | 0 (0.0%) |
| 5 or more Children | 0 (0.0%) | 0 (0.0%) |
| Total | 0 (0.0%) | 8 (1.7%) |
Income Below Poverty Among Married-Couple vs Single-Parent Households in Ladera Heights
The poverty data for Ladera Heights shows that 85 of the married-couple family households (7.0%) and 8 of the single-parent households (1.3%) are living below the poverty level. Within the married-couple family households, those with 1 or 2 children have the highest poverty rate, with 85 households (21.0%) falling below the poverty line. Among the single-parent households, those with no children have the highest poverty rate, with 8 household (1.9%) living below poverty.
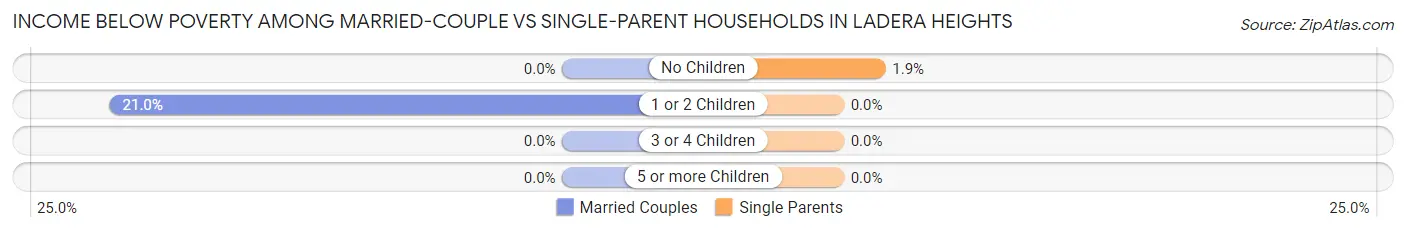
| Children | Married-Couple Families | Single-Parent Households |
| No Children | 0 (0.0%) | 8 (1.9%) |
| 1 or 2 Children | 85 (21.0%) | 0 (0.0%) |
| 3 or 4 Children | 0 (0.0%) | 0 (0.0%) |
| 5 or more Children | 0 (0.0%) | 0 (0.0%) |
| Total | 85 (7.0%) | 8 (1.3%) |
Race in Ladera Heights
The most populous races in Ladera Heights are Black / African American (4,310 | 64.2%), White / Caucasian (1,140 | 17.0%), and Two or more Races (815 | 12.1%).
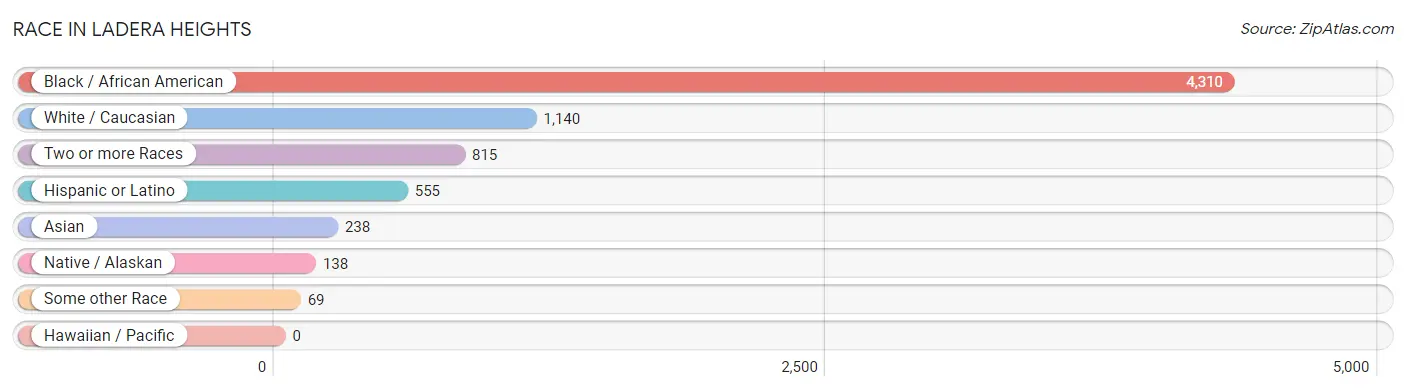
| Race | # Population | % Population |
| Asian | 238 | 3.5% |
| Black / African American | 4,310 | 64.2% |
| Hawaiian / Pacific | 0 | 0.0% |
| Hispanic or Latino | 555 | 8.3% |
| Native / Alaskan | 138 | 2.1% |
| White / Caucasian | 1,140 | 17.0% |
| Two or more Races | 815 | 12.1% |
| Some other Race | 69 | 1.0% |
| Total | 6,710 | 100.0% |
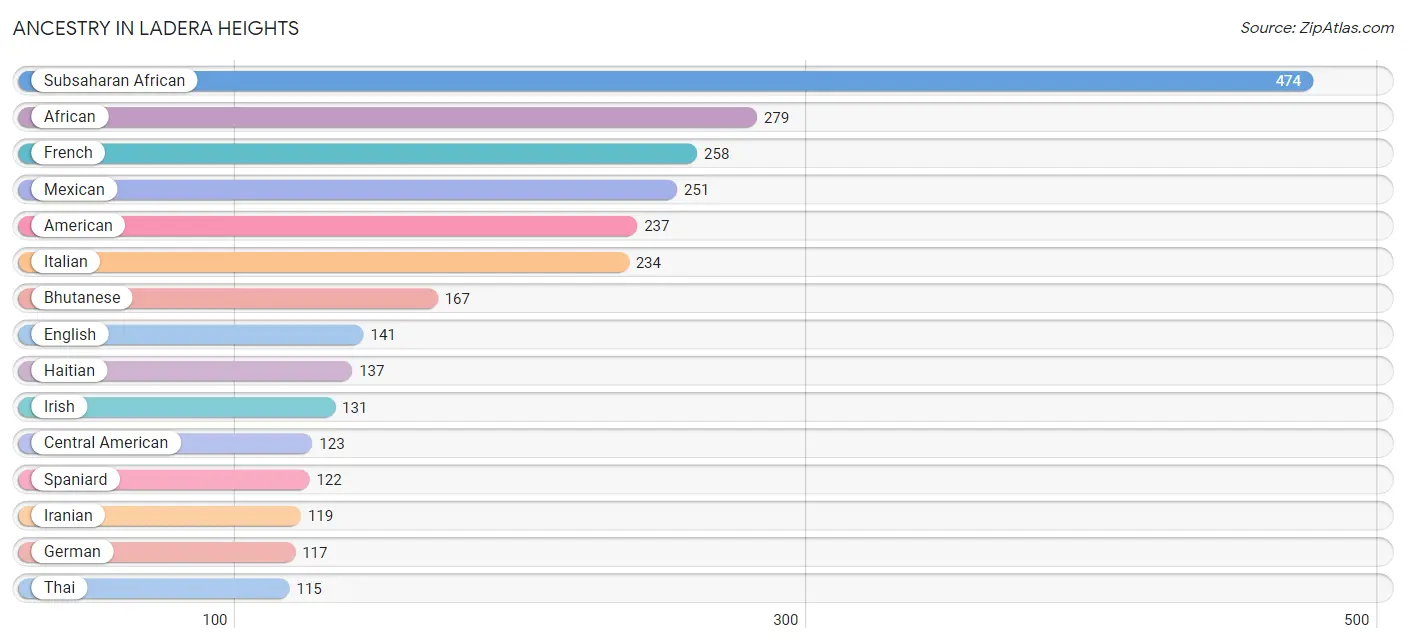
Ancestry in Ladera Heights
The most populous ancestries reported in Ladera Heights are Subsaharan African (474 | 7.1%), African (279 | 4.2%), French (258 | 3.8%), Mexican (251 | 3.7%), and American (237 | 3.5%), together accounting for 22.3% of all Ladera Heights residents.
| Ancestry | # Population | % Population |
| African | 279 | 4.2% |
| American | 237 | 3.5% |
| Arab | 16 | 0.2% |
| Armenian | 51 | 0.8% |
| Austrian | 15 | 0.2% |
| Belizean | 66 | 1.0% |
| Bhutanese | 167 | 2.5% |
| Blackfeet | 31 | 0.5% |
| British West Indian | 15 | 0.2% |
| Burmese | 86 | 1.3% |
| Central American | 123 | 1.8% |
| Central American Indian | 92 | 1.4% |
| Cherokee | 7 | 0.1% |
| Chickasaw | 47 | 0.7% |
| Chilean | 6 | 0.1% |
| Choctaw | 78 | 1.2% |
| Danish | 9 | 0.1% |
| English | 141 | 2.1% |
| Ethiopian | 74 | 1.1% |
| Filipino | 23 | 0.3% |
| Finnish | 15 | 0.2% |
| French | 258 | 3.8% |
| German | 117 | 1.7% |
| Guatemalan | 16 | 0.2% |
| Haitian | 137 | 2.0% |
| Indian (Asian) | 44 | 0.7% |
| Iranian | 119 | 1.8% |
| Irish | 131 | 1.9% |
| Italian | 234 | 3.5% |
| Jamaican | 32 | 0.5% |
| Jordanian | 16 | 0.2% |
| Korean | 70 | 1.0% |
| Lithuanian | 12 | 0.2% |
| Mexican | 251 | 3.7% |
| Mexican American Indian | 36 | 0.5% |
| Nigerian | 93 | 1.4% |
| Norwegian | 98 | 1.5% |
| Polish | 55 | 0.8% |
| Portuguese | 1 | 0.0% |
| Puerto Rican | 37 | 0.5% |
| Salvadoran | 107 | 1.6% |
| Samoan | 20 | 0.3% |
| Scotch-Irish | 15 | 0.2% |
| Scottish | 17 | 0.3% |
| Slovak | 15 | 0.2% |
| South American | 22 | 0.3% |
| Spaniard | 122 | 1.8% |
| Subsaharan African | 474 | 7.1% |
| Swedish | 9 | 0.1% |
| Thai | 115 | 1.7% |
| Trinidadian and Tobagonian | 16 | 0.2% |
| Venezuelan | 16 | 0.2% |
| West Indian | 44 | 0.7% | View All 53 Rows |
Immigrants in Ladera Heights
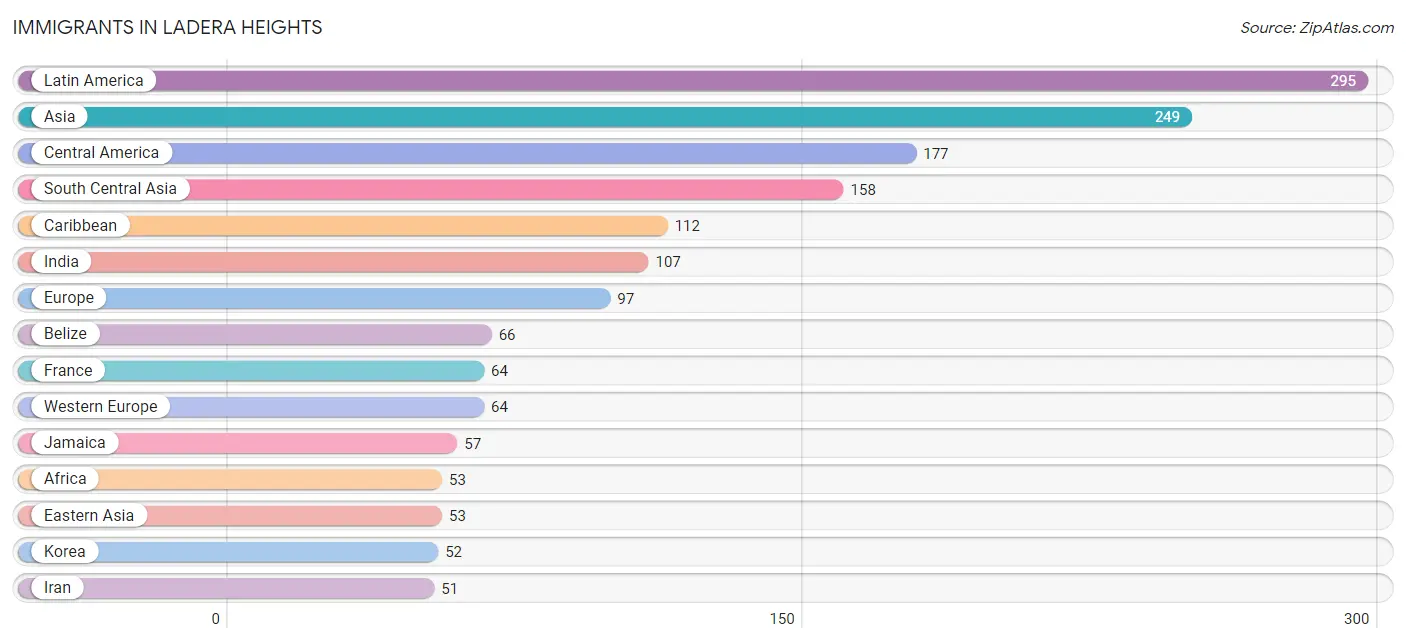
The most numerous immigrant groups reported in Ladera Heights came from Latin America (295 | 4.4%), Asia (249 | 3.7%), Central America (177 | 2.6%), South Central Asia (158 | 2.4%), and Caribbean (112 | 1.7%), together accounting for 14.8% of all Ladera Heights residents.
| Immigration Origin | # Population | % Population |
| Africa | 53 | 0.8% |
| Asia | 249 | 3.7% |
| Belize | 66 | 1.0% |
| Caribbean | 112 | 1.7% |
| Central America | 177 | 2.6% |
| Chile | 6 | 0.1% |
| China | 1 | 0.0% |
| Eastern Africa | 24 | 0.4% |
| Eastern Asia | 53 | 0.8% |
| England | 33 | 0.5% |
| Ethiopia | 24 | 0.4% |
| Europe | 97 | 1.5% |
| France | 64 | 0.9% |
| Guatemala | 16 | 0.2% |
| Haiti | 15 | 0.2% |
| India | 107 | 1.6% |
| Iran | 51 | 0.8% |
| Jamaica | 57 | 0.9% |
| Jordan | 16 | 0.2% |
| Korea | 52 | 0.8% |
| Latin America | 295 | 4.4% |
| Mexico | 19 | 0.3% |
| Nigeria | 29 | 0.4% |
| Northern Europe | 33 | 0.5% |
| Singapore | 22 | 0.3% |
| South America | 6 | 0.1% |
| South Central Asia | 158 | 2.4% |
| South Eastern Asia | 22 | 0.3% |
| Western Africa | 29 | 0.4% |
| Western Asia | 16 | 0.2% |
| Western Europe | 64 | 0.9% | View All 31 Rows |
Sex and Age in Ladera Heights
Sex and Age in Ladera Heights
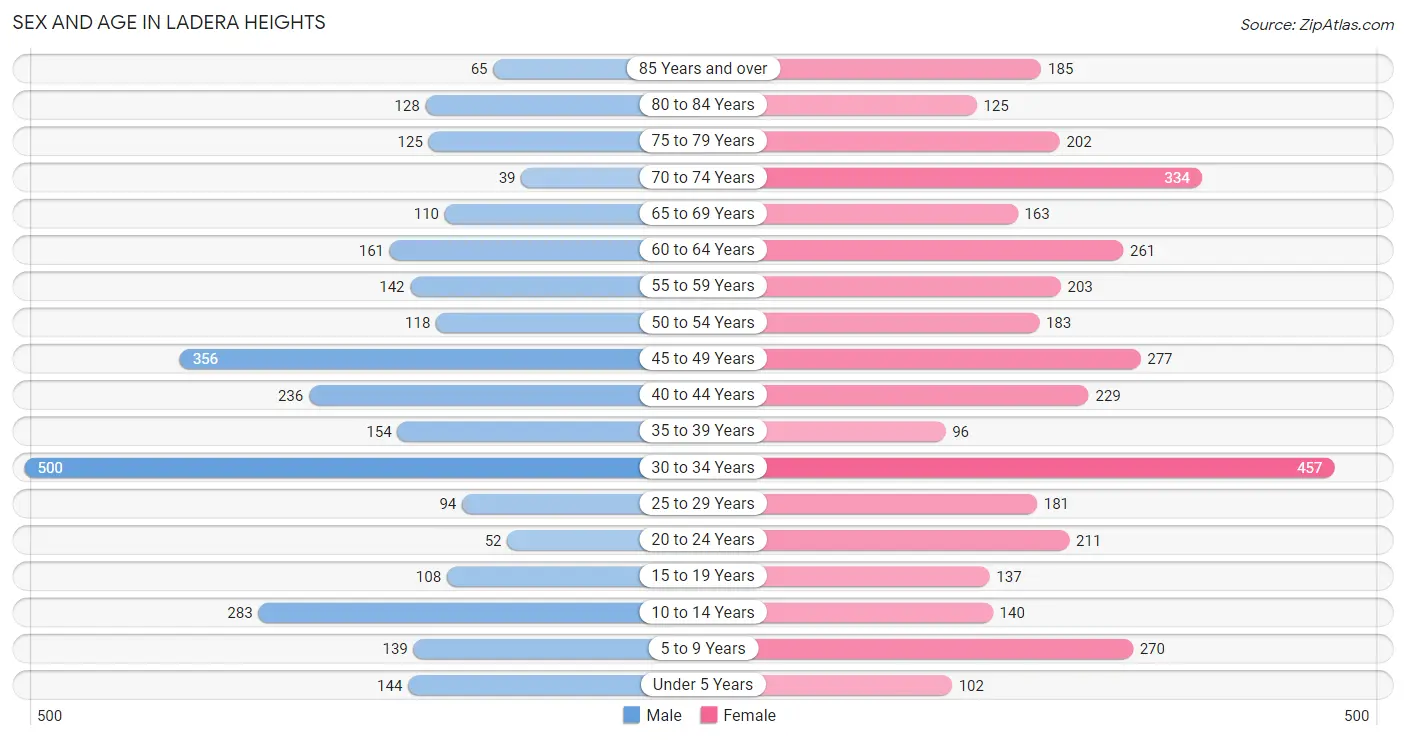
The most populous age groups in Ladera Heights are 30 to 34 Years (500 | 16.9%) for men and 30 to 34 Years (457 | 12.2%) for women.
| Age Bracket | Male | Female |
| Under 5 Years | 144 (4.9%) | 102 (2.7%) |
| 5 to 9 Years | 139 (4.7%) | 270 (7.2%) |
| 10 to 14 Years | 283 (9.6%) | 140 (3.7%) |
| 15 to 19 Years | 108 (3.7%) | 137 (3.6%) |
| 20 to 24 Years | 52 (1.8%) | 211 (5.6%) |
| 25 to 29 Years | 94 (3.2%) | 181 (4.8%) |
| 30 to 34 Years | 500 (16.9%) | 457 (12.2%) |
| 35 to 39 Years | 154 (5.2%) | 96 (2.6%) |
| 40 to 44 Years | 236 (8.0%) | 229 (6.1%) |
| 45 to 49 Years | 356 (12.0%) | 277 (7.4%) |
| 50 to 54 Years | 118 (4.0%) | 183 (4.9%) |
| 55 to 59 Years | 142 (4.8%) | 203 (5.4%) |
| 60 to 64 Years | 161 (5.4%) | 261 (7.0%) |
| 65 to 69 Years | 110 (3.7%) | 163 (4.3%) |
| 70 to 74 Years | 39 (1.3%) | 334 (8.9%) |
| 75 to 79 Years | 125 (4.2%) | 202 (5.4%) |
| 80 to 84 Years | 128 (4.3%) | 125 (3.3%) |
| 85 Years and over | 65 (2.2%) | 185 (4.9%) |
| Total | 2,954 (100.0%) | 3,756 (100.0%) |
Families and Households in Ladera Heights
Median Family Size in Ladera Heights
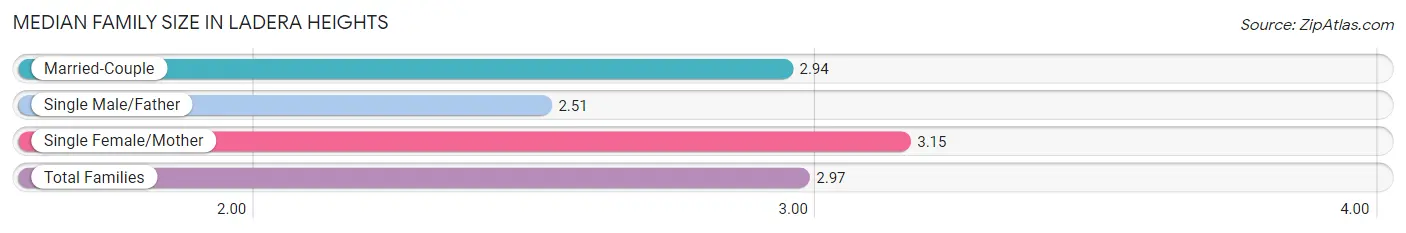
The median family size in Ladera Heights is 2.97 persons per family, with single female/mother families (479 | 26.4%) accounting for the largest median family size of 3.15 persons per family. On the other hand, single male/father families (115 | 6.3%) represent the smallest median family size with 2.51 persons per family.
| Family Type | # Families | Family Size |
| Married-Couple | 1,222 (67.3%) | 2.94 |
| Single Male/Father | 115 (6.3%) | 2.51 |
| Single Female/Mother | 479 (26.4%) | 3.15 |
| Total Families | 1,816 (100.0%) | 2.97 |
Median Household Size in Ladera Heights
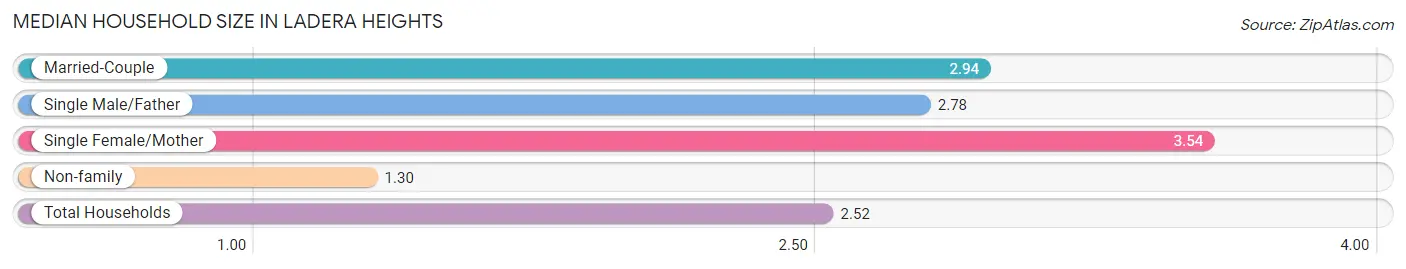
The median household size in Ladera Heights is 2.52 persons per household, with single female/mother households (479 | 18.0%) accounting for the largest median household size of 3.54 persons per household. non-family households (838 | 31.6%) represent the smallest median household size with 1.30 persons per household.
| Household Type | # Households | Household Size |
| Married-Couple | 1,222 (46.0%) | 2.94 |
| Single Male/Father | 115 (4.3%) | 2.78 |
| Single Female/Mother | 479 (18.0%) | 3.54 |
| Non-family | 838 (31.6%) | 1.30 |
| Total Households | 2,654 (100.0%) | 2.52 |
Household Size by Marriage Status in Ladera Heights
Out of a total of 2,654 households in Ladera Heights, 1,816 (68.4%) are family households, while 838 (31.6%) are nonfamily households. The most numerous type of family households are 2-person households, comprising 858, and the most common type of nonfamily households are 1-person households, comprising 614.
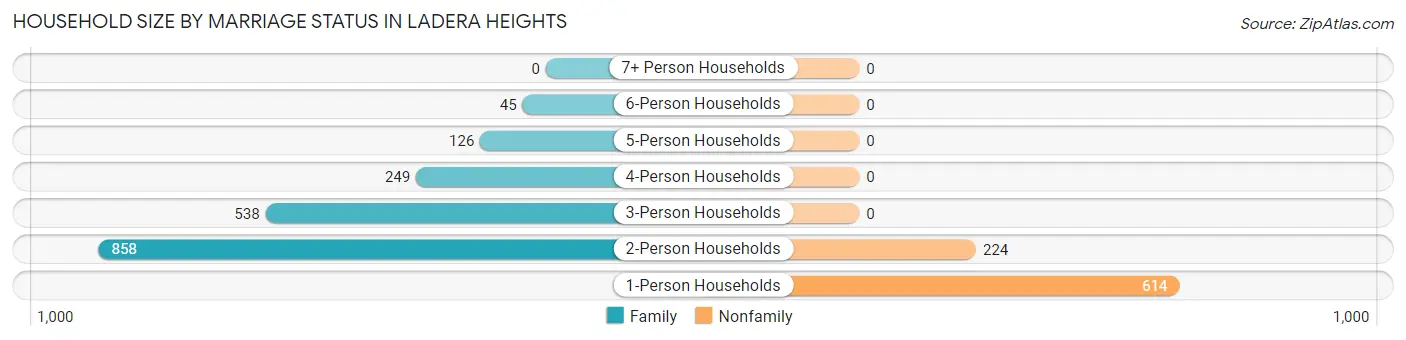
| Household Size | Family Households | Nonfamily Households |
| 1-Person Households | - | 614 (23.1%) |
| 2-Person Households | 858 (32.3%) | 224 (8.4%) |
| 3-Person Households | 538 (20.3%) | 0 (0.0%) |
| 4-Person Households | 249 (9.4%) | 0 (0.0%) |
| 5-Person Households | 126 (4.8%) | 0 (0.0%) |
| 6-Person Households | 45 (1.7%) | 0 (0.0%) |
| 7+ Person Households | 0 (0.0%) | 0 (0.0%) |
| Total | 1,816 (68.4%) | 838 (31.6%) |
Female Fertility in Ladera Heights
Fertility by Age in Ladera Heights
Average fertility rate in Ladera Heights is 8.0 births per 1,000 women. Women in the age bracket of 20 to 34 years have the highest fertility rate with 15.0 births per 1,000 women. Women in the age bracket of 20 to 34 years acount for 100.0% of all women with births.
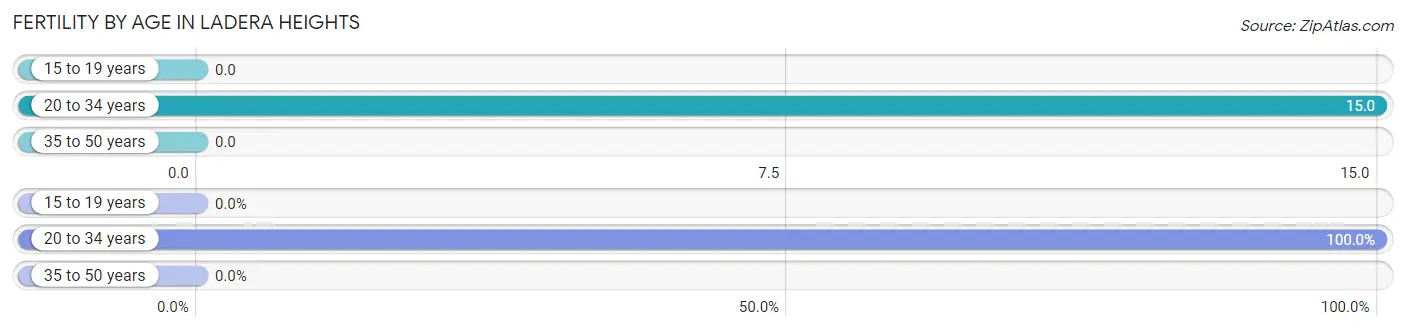
| Age Bracket | Women with Births | Births / 1,000 Women |
| 15 to 19 years | 0 (0.0%) | 0.0 |
| 20 to 34 years | 13 (100.0%) | 15.0 |
| 35 to 50 years | 0 (0.0%) | 0.0 |
| Total | 13 (100.0%) | 8.0 |
Fertility by Age by Marriage Status in Ladera Heights
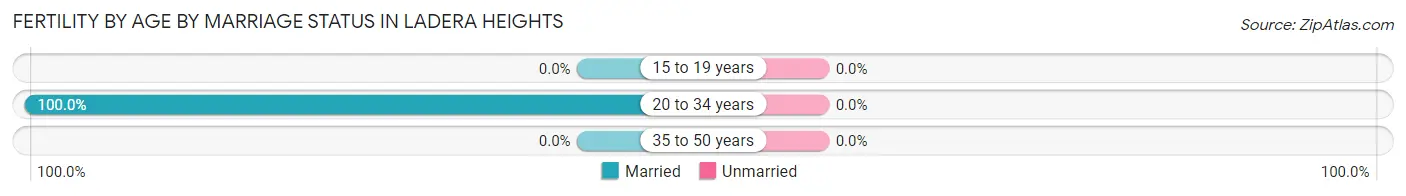
| Age Bracket | Married | Unmarried |
| 15 to 19 years | 0 (0.0%) | 0 (0.0%) |
| 20 to 34 years | 13 (100.0%) | 0 (0.0%) |
| 35 to 50 years | 0 (0.0%) | 0 (0.0%) |
| Total | 13 (100.0%) | 0 (0.0%) |
Fertility by Education in Ladera Heights
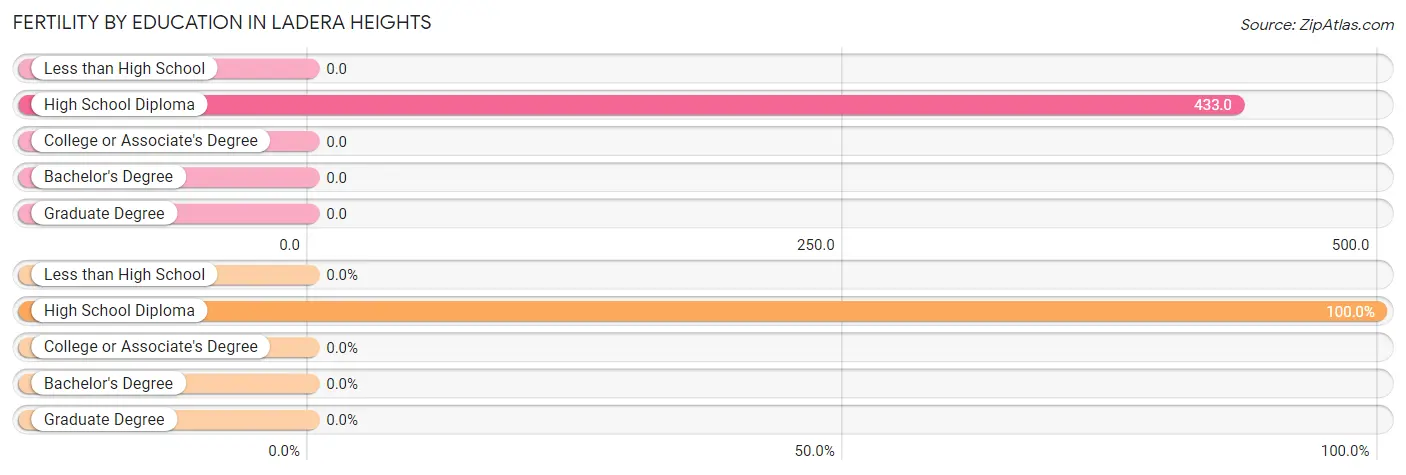
| Educational Attainment | Women with Births | Births / 1,000 Women |
| Less than High School | 0 (0.0%) | 0.0 |
| High School Diploma | 13 (100.0%) | 433.0 |
| College or Associate's Degree | 0 (0.0%) | 0.0 |
| Bachelor's Degree | 0 (0.0%) | 0.0 |
| Graduate Degree | 0 (0.0%) | 0.0 |
| Total | 13 (100.0%) | 8.0 |
Fertility by Education by Marriage Status in Ladera Heights
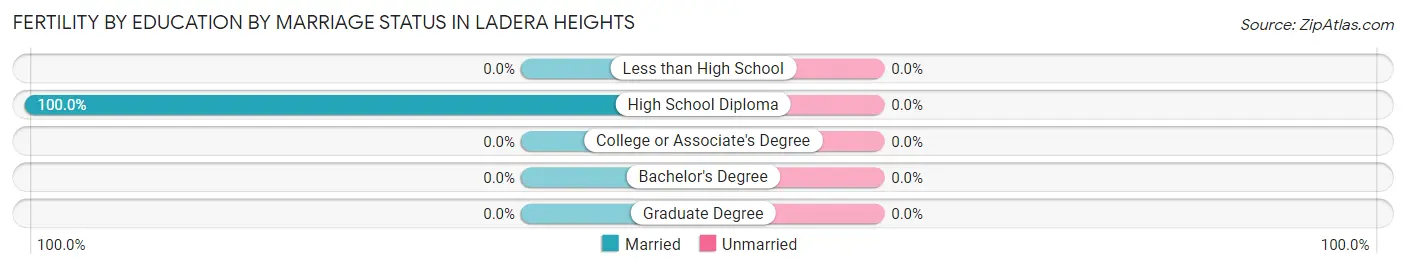
| Educational Attainment | Married | Unmarried |
| Less than High School | 0 (0.0%) | 0 (0.0%) |
| High School Diploma | 13 (100.0%) | 0 (0.0%) |
| College or Associate's Degree | 0 (0.0%) | 0 (0.0%) |
| Bachelor's Degree | 0 (0.0%) | 0 (0.0%) |
| Graduate Degree | 0 (0.0%) | 0 (0.0%) |
| Total | 13 (100.0%) | 0 (0.0%) |
Employment Characteristics in Ladera Heights
Employment by Class of Employer in Ladera Heights
Among the 3,415 employed individuals in Ladera Heights, private company employees (1,848 | 54.1%), local government employees (558 | 16.3%), and not-for-profit organizations (491 | 14.4%) make up the most common classes of employment.
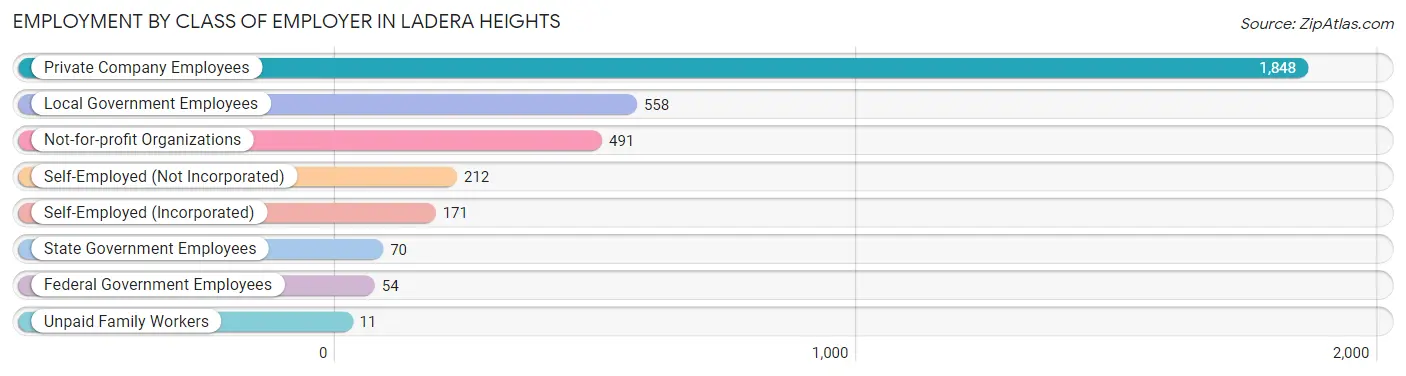
| Employer Class | # Employees | % Employees |
| Private Company Employees | 1,848 | 54.1% |
| Self-Employed (Incorporated) | 171 | 5.0% |
| Self-Employed (Not Incorporated) | 212 | 6.2% |
| Not-for-profit Organizations | 491 | 14.4% |
| Local Government Employees | 558 | 16.3% |
| State Government Employees | 70 | 2.1% |
| Federal Government Employees | 54 | 1.6% |
| Unpaid Family Workers | 11 | 0.3% |
| Total | 3,415 | 100.0% |
Employment Status by Age in Ladera Heights
According to the labor force statistics for Ladera Heights, out of the total population over 16 years of age (5,561), 64.7% or 3,598 individuals are in the labor force, with 3.4% or 122 of them unemployed. The age group with the highest labor force participation rate is 25 to 29 years, with 100.0% or 275 individuals in the labor force. Within the labor force, the 45 to 54 years age range has the highest percentage of unemployed individuals, with 8.0% or 62 of them being unemployed.
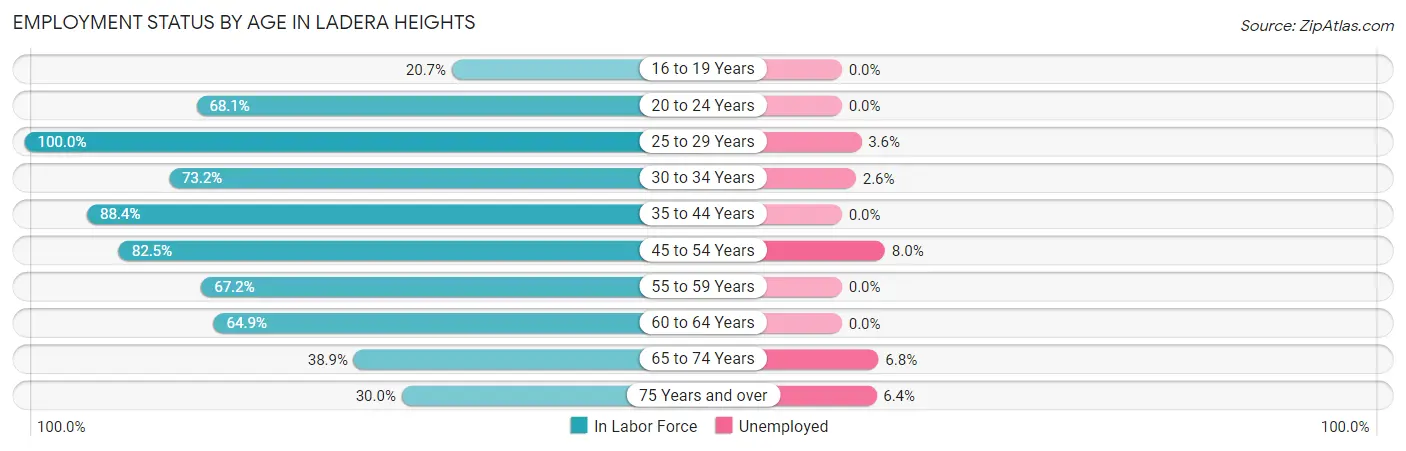
| Age Bracket | In Labor Force | Unemployed |
| 16 to 19 Years | 36 (20.7%) | 0 (0.0%) |
| 20 to 24 Years | 179 (68.1%) | 0 (0.0%) |
| 25 to 29 Years | 275 (100.0%) | 10 (3.6%) |
| 30 to 34 Years | 701 (73.2%) | 18 (2.6%) |
| 35 to 44 Years | 632 (88.4%) | 0 (0.0%) |
| 45 to 54 Years | 771 (82.5%) | 62 (8.0%) |
| 55 to 59 Years | 232 (67.2%) | 0 (0.0%) |
| 60 to 64 Years | 274 (64.9%) | 0 (0.0%) |
| 65 to 74 Years | 251 (38.9%) | 17 (6.8%) |
| 75 Years and over | 249 (30.0%) | 16 (6.4%) |
| Total | 3,598 (64.7%) | 122 (3.4%) |
Employment Status by Educational Attainment in Ladera Heights
According to labor force statistics for Ladera Heights, 79.1% of individuals (2,886) out of the total population between 25 and 64 years of age (3,648) are in the labor force, with 3.1% or 89 of them being unemployed. The group with the highest labor force participation rate are those with the educational attainment of less than high school, with 83.3% or 70 individuals in the labor force. Within the labor force, individuals with high school diploma education have the highest percentage of unemployment, with 6.6% or 10 of them being unemployed.
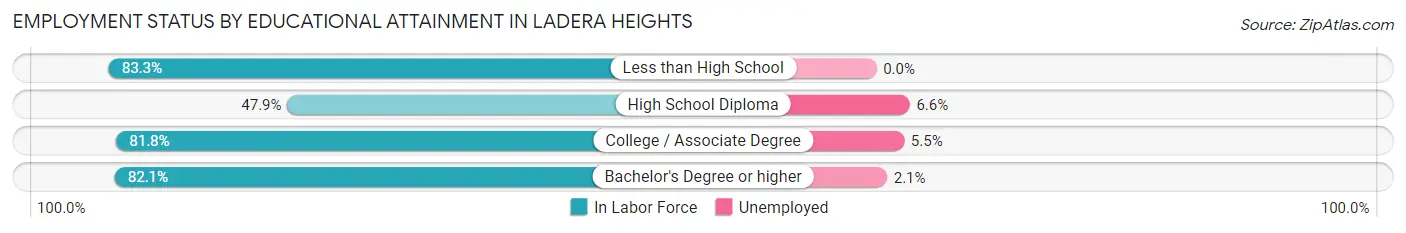
| Educational Attainment | In Labor Force | Unemployed |
| Less than High School | 70 (83.3%) | 0 (0.0%) |
| High School Diploma | 151 (47.9%) | 21 (6.6%) |
| College / Associate Degree | 730 (81.8%) | 49 (5.5%) |
| Bachelor's Degree or higher | 1,935 (82.1%) | 49 (2.1%) |
| Total | 2,886 (79.1%) | 113 (3.1%) |
Employment Occupations by Sex in Ladera Heights
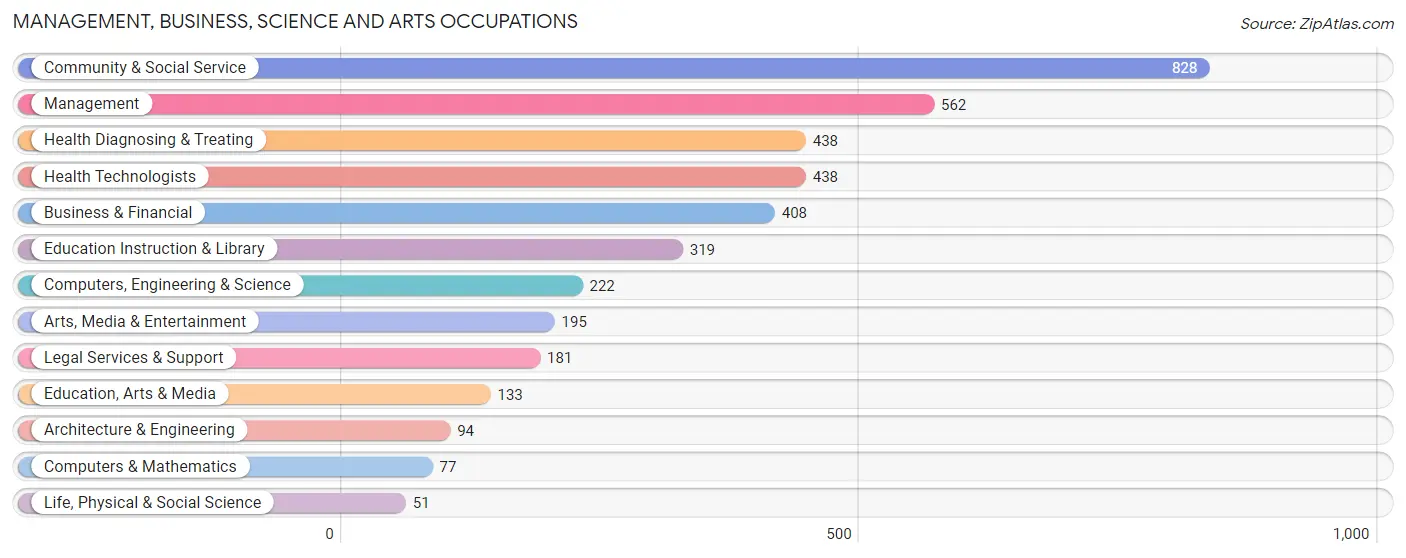
Management, Business, Science and Arts Occupations
The most common Management, Business, Science and Arts occupations in Ladera Heights are Community & Social Service (828 | 23.8%), Management (562 | 16.2%), Health Diagnosing & Treating (438 | 12.6%), Health Technologists (438 | 12.6%), and Business & Financial (408 | 11.7%).
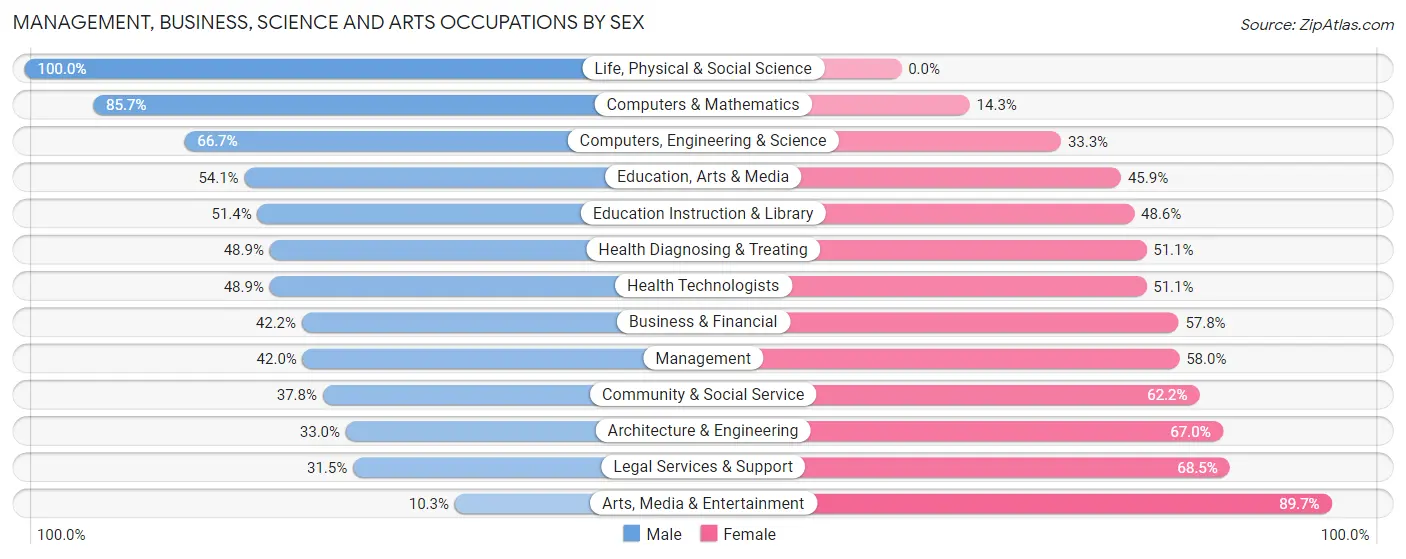
Management, Business, Science and Arts Occupations by Sex
Within the Management, Business, Science and Arts occupations in Ladera Heights, the most male-oriented occupations are Life, Physical & Social Science (100.0%), Computers & Mathematics (85.7%), and Computers, Engineering & Science (66.7%), while the most female-oriented occupations are Arts, Media & Entertainment (89.7%), Legal Services & Support (68.5%), and Architecture & Engineering (67.0%).
| Occupation | Male | Female |
| Management | 236 (42.0%) | 326 (58.0%) |
| Business & Financial | 172 (42.2%) | 236 (57.8%) |
| Computers, Engineering & Science | 148 (66.7%) | 74 (33.3%) |
| Computers & Mathematics | 66 (85.7%) | 11 (14.3%) |
| Architecture & Engineering | 31 (33.0%) | 63 (67.0%) |
| Life, Physical & Social Science | 51 (100.0%) | 0 (0.0%) |
| Community & Social Service | 313 (37.8%) | 515 (62.2%) |
| Education, Arts & Media | 72 (54.1%) | 61 (45.9%) |
| Legal Services & Support | 57 (31.5%) | 124 (68.5%) |
| Education Instruction & Library | 164 (51.4%) | 155 (48.6%) |
| Arts, Media & Entertainment | 20 (10.3%) | 175 (89.7%) |
| Health Diagnosing & Treating | 214 (48.9%) | 224 (51.1%) |
| Health Technologists | 214 (48.9%) | 224 (51.1%) |
| Total (Category) | 1,083 (44.1%) | 1,375 (55.9%) |
| Total (Overall) | 1,625 (46.7%) | 1,852 (53.3%) |
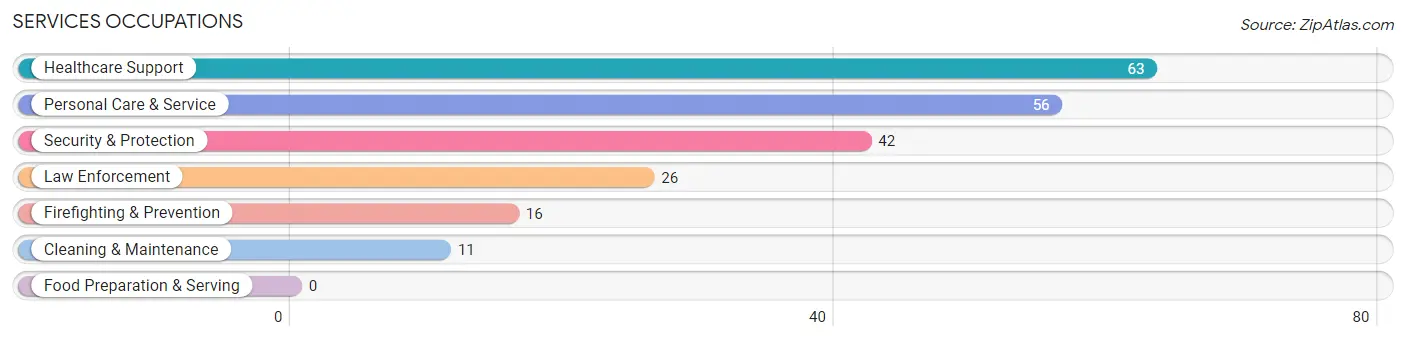
Services Occupations
The most common Services occupations in Ladera Heights are Healthcare Support (63 | 1.8%), Personal Care & Service (56 | 1.6%), Security & Protection (42 | 1.2%), Law Enforcement (26 | 0.7%), and Firefighting & Prevention (16 | 0.5%).
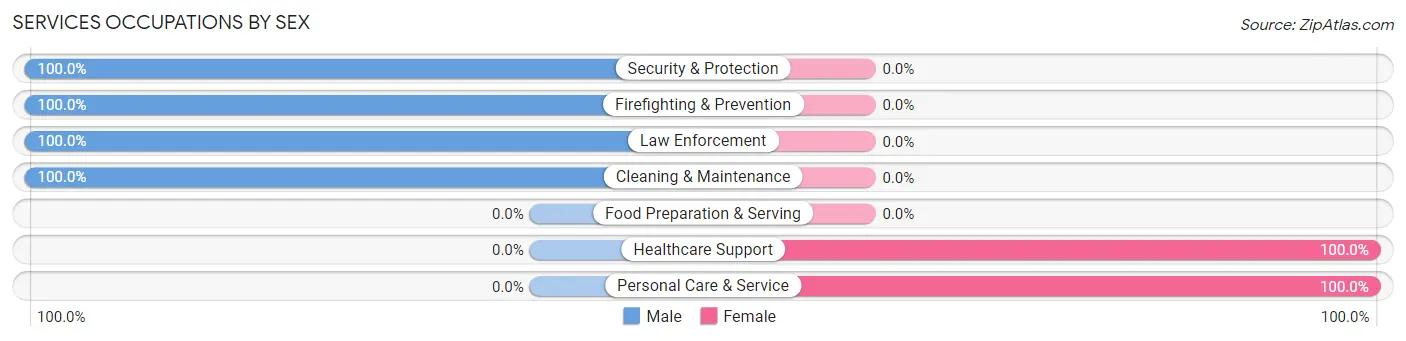
Services Occupations by Sex
Within the Services occupations in Ladera Heights, the most male-oriented occupations are Security & Protection (100.0%), Firefighting & Prevention (100.0%), and Law Enforcement (100.0%), while the most female-oriented occupations are Healthcare Support (100.0%), and Personal Care & Service (100.0%).
| Occupation | Male | Female |
| Healthcare Support | 0 (0.0%) | 63 (100.0%) |
| Security & Protection | 42 (100.0%) | 0 (0.0%) |
| Firefighting & Prevention | 16 (100.0%) | 0 (0.0%) |
| Law Enforcement | 26 (100.0%) | 0 (0.0%) |
| Food Preparation & Serving | 0 (0.0%) | 0 (0.0%) |
| Cleaning & Maintenance | 11 (100.0%) | 0 (0.0%) |
| Personal Care & Service | 0 (0.0%) | 56 (100.0%) |
| Total (Category) | 53 (30.8%) | 119 (69.2%) |
| Total (Overall) | 1,625 (46.7%) | 1,852 (53.3%) |
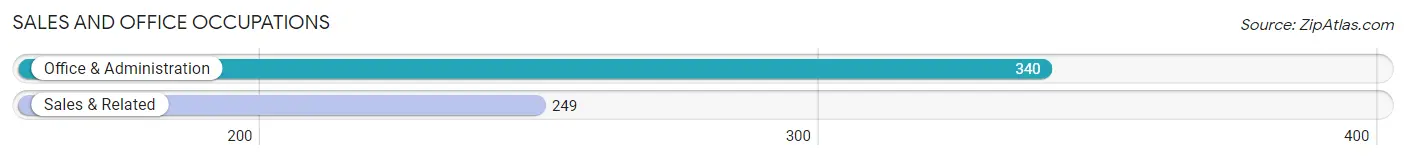
Sales and Office Occupations
The most common Sales and Office occupations in Ladera Heights are Office & Administration (340 | 9.8%), and Sales & Related (249 | 7.2%).
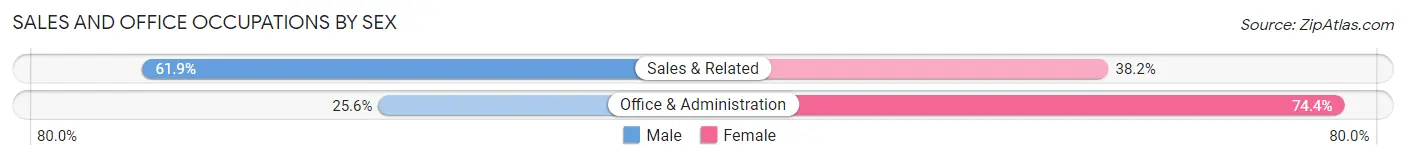
Sales and Office Occupations by Sex
| Occupation | Male | Female |
| Sales & Related | 154 (61.9%) | 95 (38.2%) |
| Office & Administration | 87 (25.6%) | 253 (74.4%) |
| Total (Category) | 241 (40.9%) | 348 (59.1%) |
| Total (Overall) | 1,625 (46.7%) | 1,852 (53.3%) |
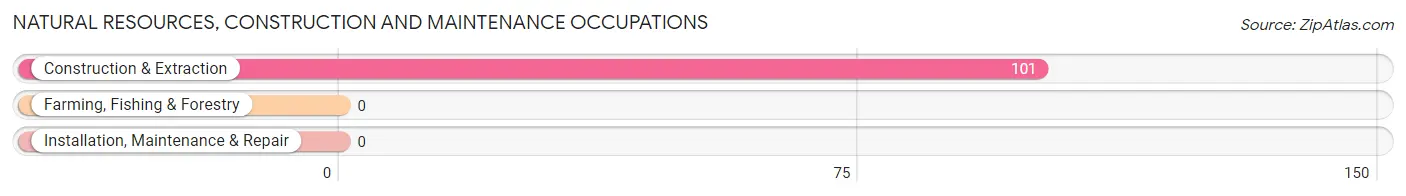
Natural Resources, Construction and Maintenance Occupations
The most common Natural Resources, Construction and Maintenance occupations in Ladera Heights are , and Construction & Extraction (101 | 2.9%).
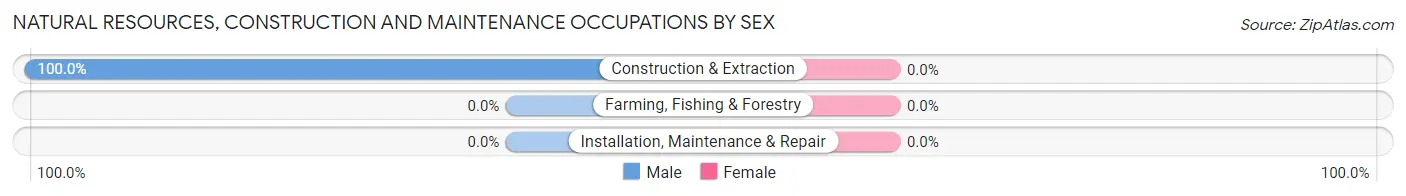
Natural Resources, Construction and Maintenance Occupations by Sex
| Occupation | Male | Female |
| Farming, Fishing & Forestry | 0 (0.0%) | 0 (0.0%) |
| Construction & Extraction | 101 (100.0%) | 0 (0.0%) |
| Installation, Maintenance & Repair | 0 (0.0%) | 0 (0.0%) |
| Total (Category) | 101 (100.0%) | 0 (0.0%) |
| Total (Overall) | 1,625 (46.7%) | 1,852 (53.3%) |
Production, Transportation and Moving Occupations
The most common Production, Transportation and Moving occupations in Ladera Heights are Transportation (85 | 2.4%), and Production (72 | 2.1%).
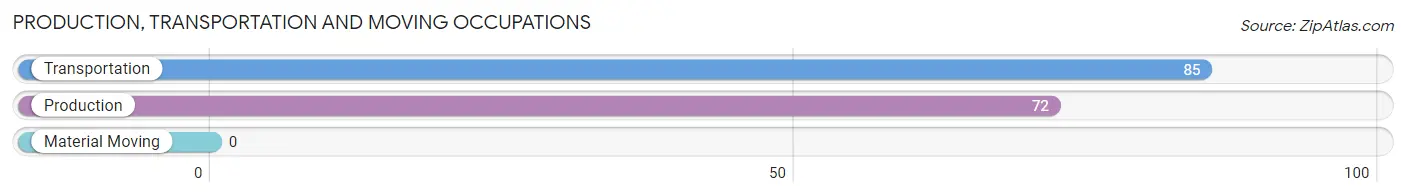
Production, Transportation and Moving Occupations by Sex
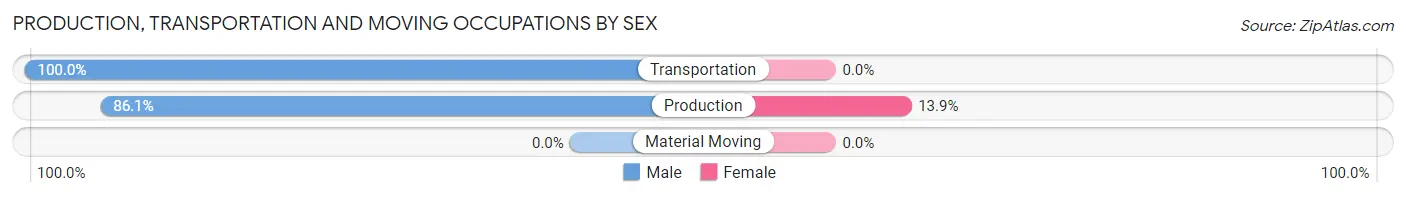
| Occupation | Male | Female |
| Production | 62 (86.1%) | 10 (13.9%) |
| Transportation | 85 (100.0%) | 0 (0.0%) |
| Material Moving | 0 (0.0%) | 0 (0.0%) |
| Total (Category) | 147 (93.6%) | 10 (6.4%) |
| Total (Overall) | 1,625 (46.7%) | 1,852 (53.3%) |
Employment Industries by Sex in Ladera Heights
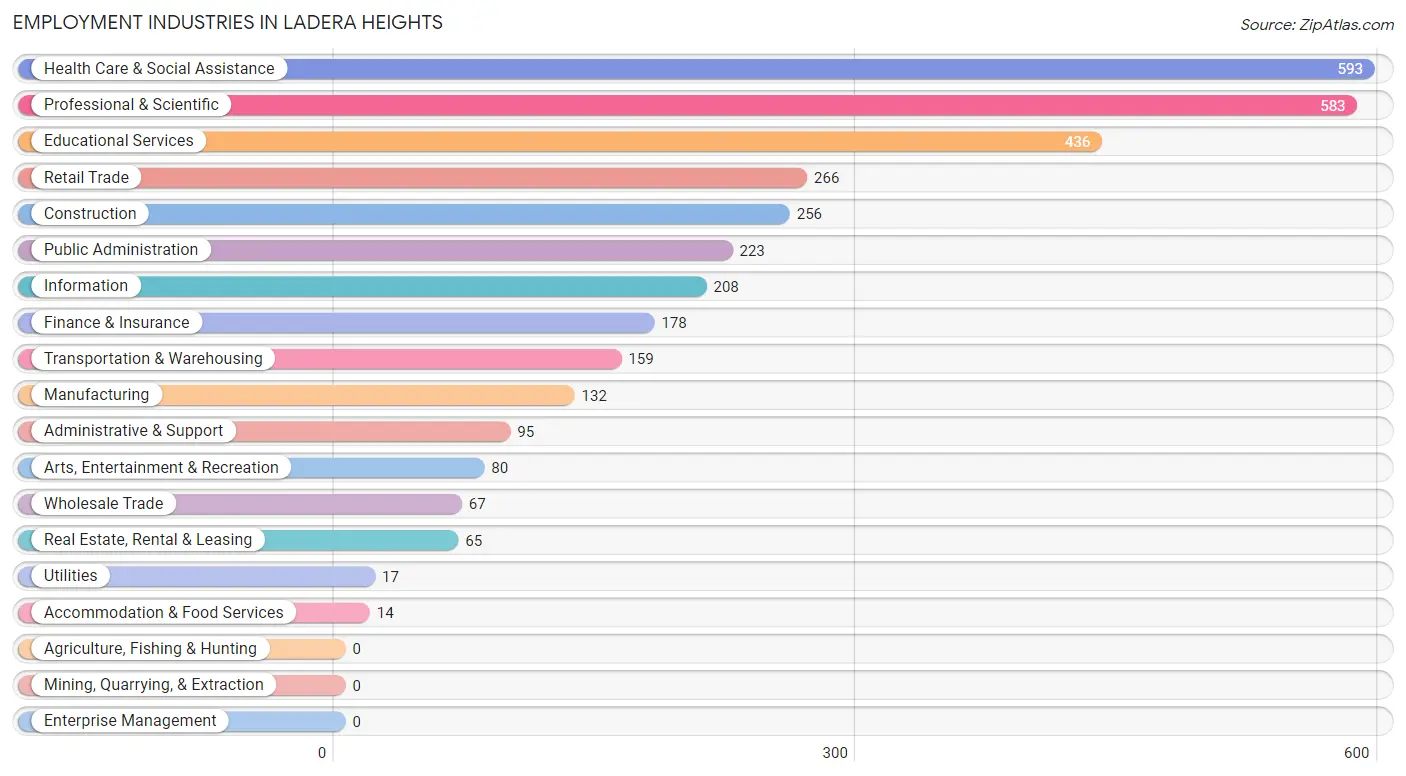
Employment Industries in Ladera Heights
The major employment industries in Ladera Heights include Health Care & Social Assistance (593 | 17.1%), Professional & Scientific (583 | 16.8%), Educational Services (436 | 12.5%), Retail Trade (266 | 7.6%), and Construction (256 | 7.4%).
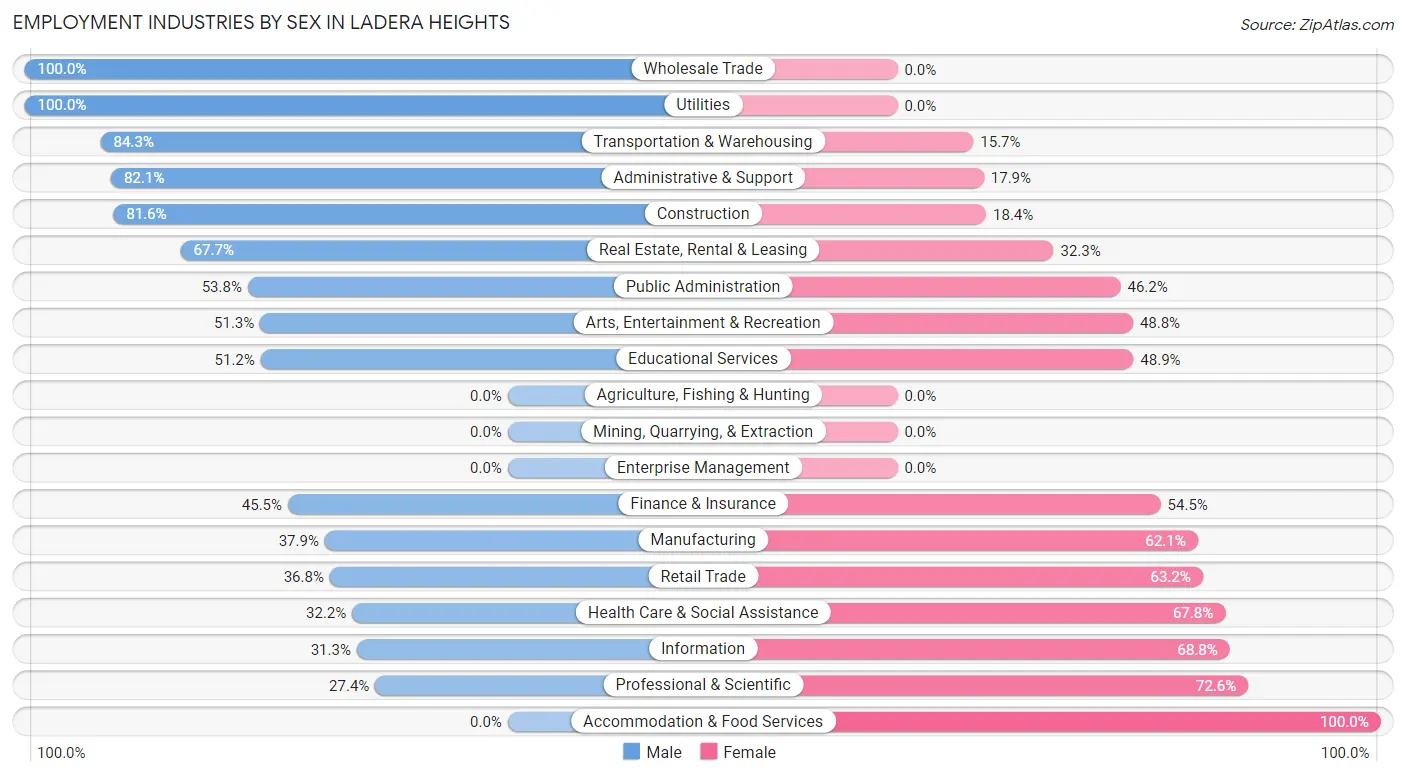
Employment Industries by Sex in Ladera Heights
The Ladera Heights industries that see more men than women are Wholesale Trade (100.0%), Utilities (100.0%), and Transportation & Warehousing (84.3%), whereas the industries that tend to have a higher number of women are Accommodation & Food Services (100.0%), Professional & Scientific (72.6%), and Information (68.8%).
| Industry | Male | Female |
| Agriculture, Fishing & Hunting | 0 (0.0%) | 0 (0.0%) |
| Mining, Quarrying, & Extraction | 0 (0.0%) | 0 (0.0%) |
| Construction | 209 (81.6%) | 47 (18.4%) |
| Manufacturing | 50 (37.9%) | 82 (62.1%) |
| Wholesale Trade | 67 (100.0%) | 0 (0.0%) |
| Retail Trade | 98 (36.8%) | 168 (63.2%) |
| Transportation & Warehousing | 134 (84.3%) | 25 (15.7%) |
| Utilities | 17 (100.0%) | 0 (0.0%) |
| Information | 65 (31.2%) | 143 (68.8%) |
| Finance & Insurance | 81 (45.5%) | 97 (54.5%) |
| Real Estate, Rental & Leasing | 44 (67.7%) | 21 (32.3%) |
| Professional & Scientific | 160 (27.4%) | 423 (72.6%) |
| Enterprise Management | 0 (0.0%) | 0 (0.0%) |
| Administrative & Support | 78 (82.1%) | 17 (17.9%) |
| Educational Services | 223 (51.1%) | 213 (48.8%) |
| Health Care & Social Assistance | 191 (32.2%) | 402 (67.8%) |
| Arts, Entertainment & Recreation | 41 (51.2%) | 39 (48.7%) |
| Accommodation & Food Services | 0 (0.0%) | 14 (100.0%) |
| Public Administration | 120 (53.8%) | 103 (46.2%) |
| Total | 1,625 (46.7%) | 1,852 (53.3%) |
Education in Ladera Heights
School Enrollment in Ladera Heights
The most common levels of schooling among the 1,131 students in Ladera Heights are elementary school (383 | 33.9%), college / undergraduate (357 | 31.6%), and middle school (246 | 21.7%).
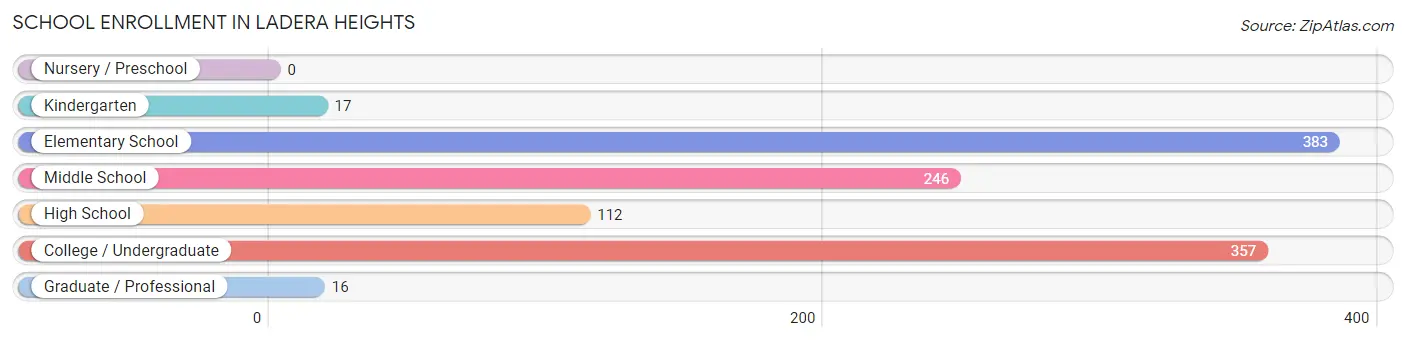
| School Level | # Students | % Students |
| Nursery / Preschool | 0 | 0.0% |
| Kindergarten | 17 | 1.5% |
| Elementary School | 383 | 33.9% |
| Middle School | 246 | 21.7% |
| High School | 112 | 9.9% |
| College / Undergraduate | 357 | 31.6% |
| Graduate / Professional | 16 | 1.4% |
| Total | 1,131 | 100.0% |
School Enrollment by Age by Funding Source in Ladera Heights
Out of a total of 1,131 students who are enrolled in schools in Ladera Heights, 205 (18.1%) attend a private institution, while the remaining 926 (81.9%) are enrolled in public schools. The age group of 20 to 24 year olds has the highest likelihood of being enrolled in private schools, with 65 (46.1% in the age bracket) enrolled. Conversely, the age group of 18 to 19 year olds has the lowest likelihood of being enrolled in a private school, with 94 (100.0% in the age bracket) attending a public institution.
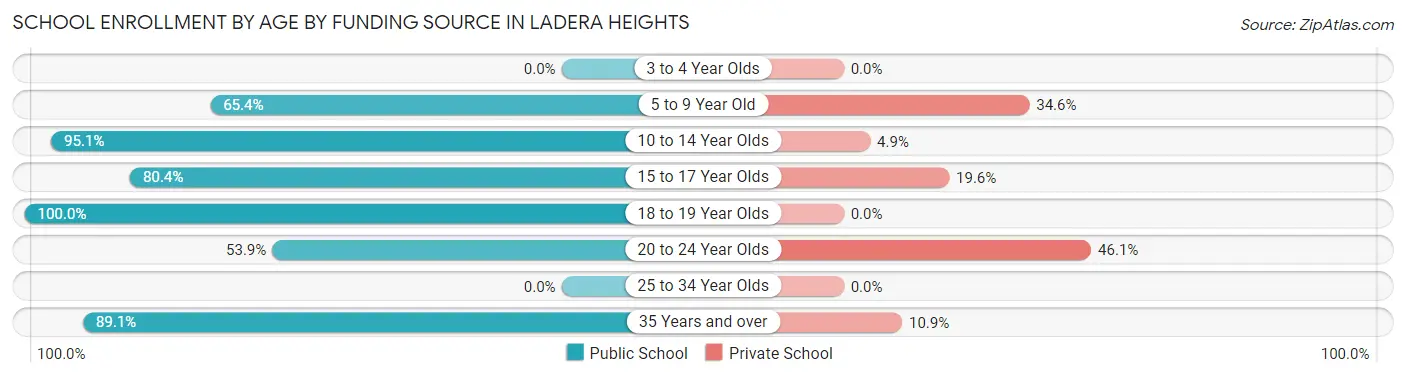
| Age Bracket | Public School | Private School |
| 3 to 4 Year Olds | 0 (0.0%) | 0 (0.0%) |
| 5 to 9 Year Old | 157 (65.4%) | 83 (34.6%) |
| 10 to 14 Year Olds | 386 (95.1%) | 20 (4.9%) |
| 15 to 17 Year Olds | 90 (80.4%) | 22 (19.6%) |
| 18 to 19 Year Olds | 94 (100.0%) | 0 (0.0%) |
| 20 to 24 Year Olds | 76 (53.9%) | 65 (46.1%) |
| 25 to 34 Year Olds | 0 (0.0%) | 0 (0.0%) |
| 35 Years and over | 123 (89.1%) | 15 (10.9%) |
| Total | 926 (81.9%) | 205 (18.1%) |
Educational Attainment by Field of Study in Ladera Heights
Business (661 | 19.9%), social sciences (447 | 13.5%), science & technology (311 | 9.4%), education (276 | 8.3%), and communications (218 | 6.6%) are the most common fields of study among 3,324 individuals in Ladera Heights who have obtained a bachelor's degree or higher.
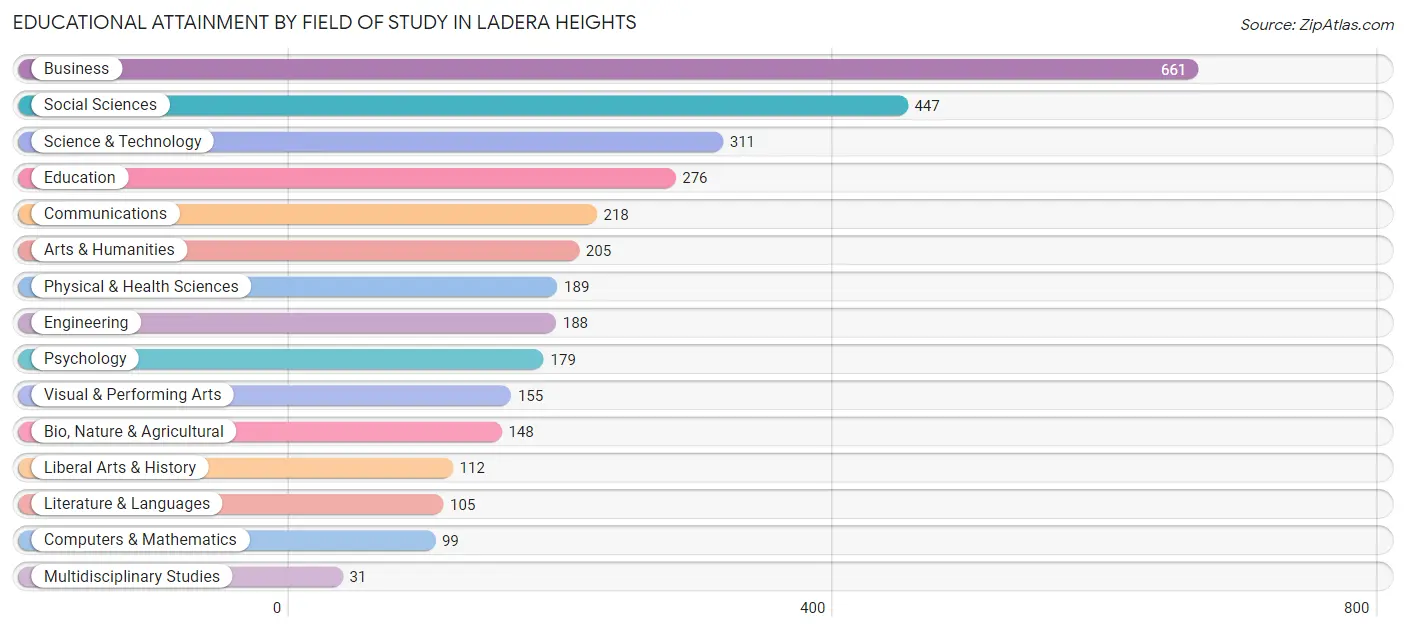
| Field of Study | # Graduates | % Graduates |
| Computers & Mathematics | 99 | 3.0% |
| Bio, Nature & Agricultural | 148 | 4.4% |
| Physical & Health Sciences | 189 | 5.7% |
| Psychology | 179 | 5.4% |
| Social Sciences | 447 | 13.5% |
| Engineering | 188 | 5.7% |
| Multidisciplinary Studies | 31 | 0.9% |
| Science & Technology | 311 | 9.4% |
| Business | 661 | 19.9% |
| Education | 276 | 8.3% |
| Literature & Languages | 105 | 3.2% |
| Liberal Arts & History | 112 | 3.4% |
| Visual & Performing Arts | 155 | 4.7% |
| Communications | 218 | 6.6% |
| Arts & Humanities | 205 | 6.2% |
| Total | 3,324 | 100.0% |
Transportation & Commute in Ladera Heights
Vehicle Availability by Sex in Ladera Heights
The most prevalent vehicle ownership categories in Ladera Heights are males with 2 vehicles (782, accounting for 49.4%) and females with 2 vehicles (1,007, making up 42.7%).
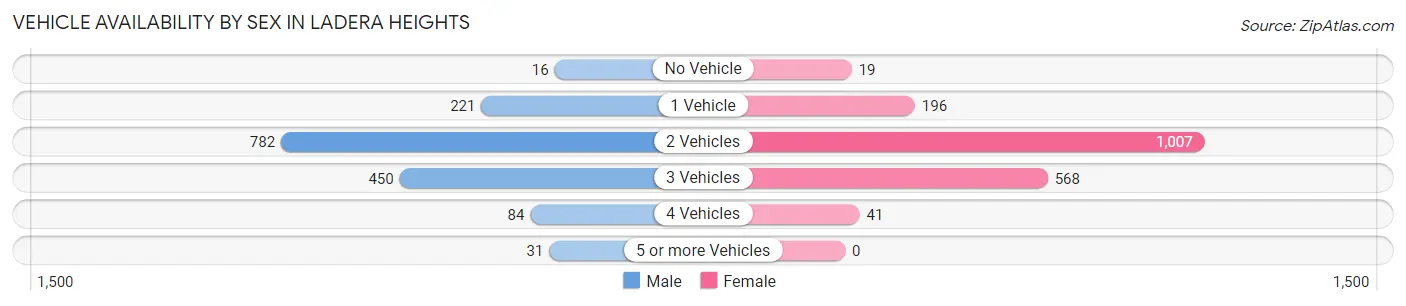
| Vehicles Available | Male | Female |
| No Vehicle | 16 (1.0%) | 19 (1.0%) |
| 1 Vehicle | 221 (14.0%) | 196 (10.7%) |
| 2 Vehicles | 782 (49.4%) | 1,007 (55.0%) |
| 3 Vehicles | 450 (28.4%) | 568 (31.0%) |
| 4 Vehicles | 84 (5.3%) | 41 (2.2%) |
| 5 or more Vehicles | 31 (2.0%) | 0 (0.0%) |
| Total | 1,584 (100.0%) | 1,831 (100.0%) |
Commute Time in Ladera Heights
The most frequently occuring commute durations in Ladera Heights are 30 to 34 minutes (810 commuters, 29.9%), 20 to 24 minutes (430 commuters, 15.9%), and 45 to 59 minutes (399 commuters, 14.7%).
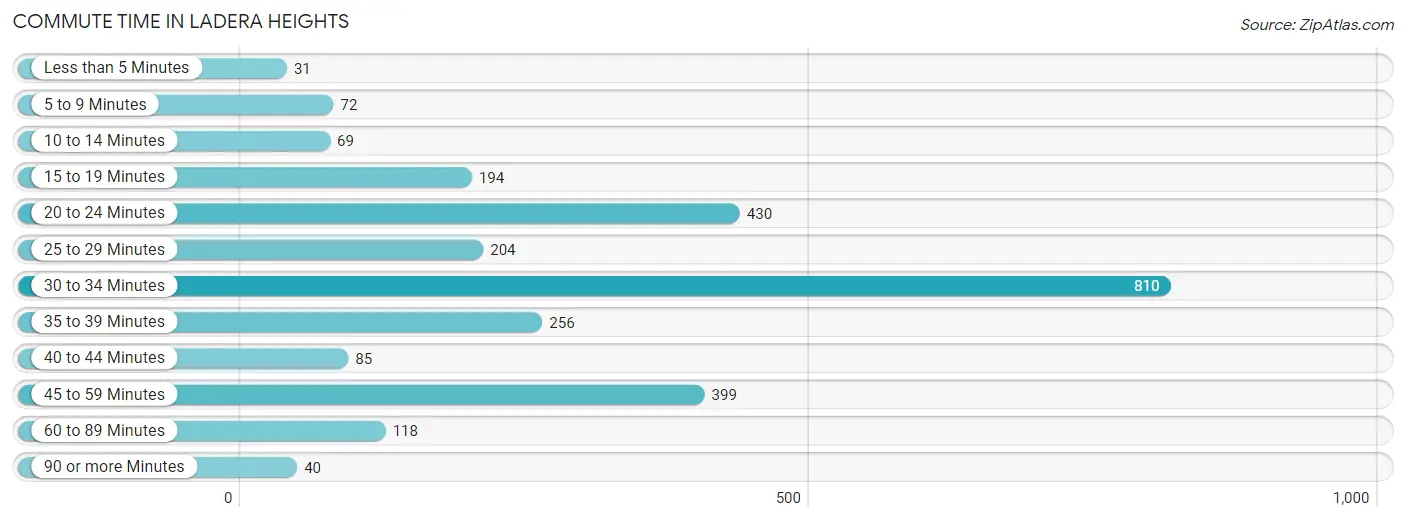
| Commute Time | # Commuters | % Commuters |
| Less than 5 Minutes | 31 | 1.1% |
| 5 to 9 Minutes | 72 | 2.7% |
| 10 to 14 Minutes | 69 | 2.5% |
| 15 to 19 Minutes | 194 | 7.2% |
| 20 to 24 Minutes | 430 | 15.9% |
| 25 to 29 Minutes | 204 | 7.5% |
| 30 to 34 Minutes | 810 | 29.9% |
| 35 to 39 Minutes | 256 | 9.5% |
| 40 to 44 Minutes | 85 | 3.1% |
| 45 to 59 Minutes | 399 | 14.7% |
| 60 to 89 Minutes | 118 | 4.4% |
| 90 or more Minutes | 40 | 1.5% |
Commute Time by Sex in Ladera Heights
The most common commute times in Ladera Heights are 30 to 34 minutes (326 commuters, 24.3%) for males and 30 to 34 minutes (484 commuters, 35.4%) for females.
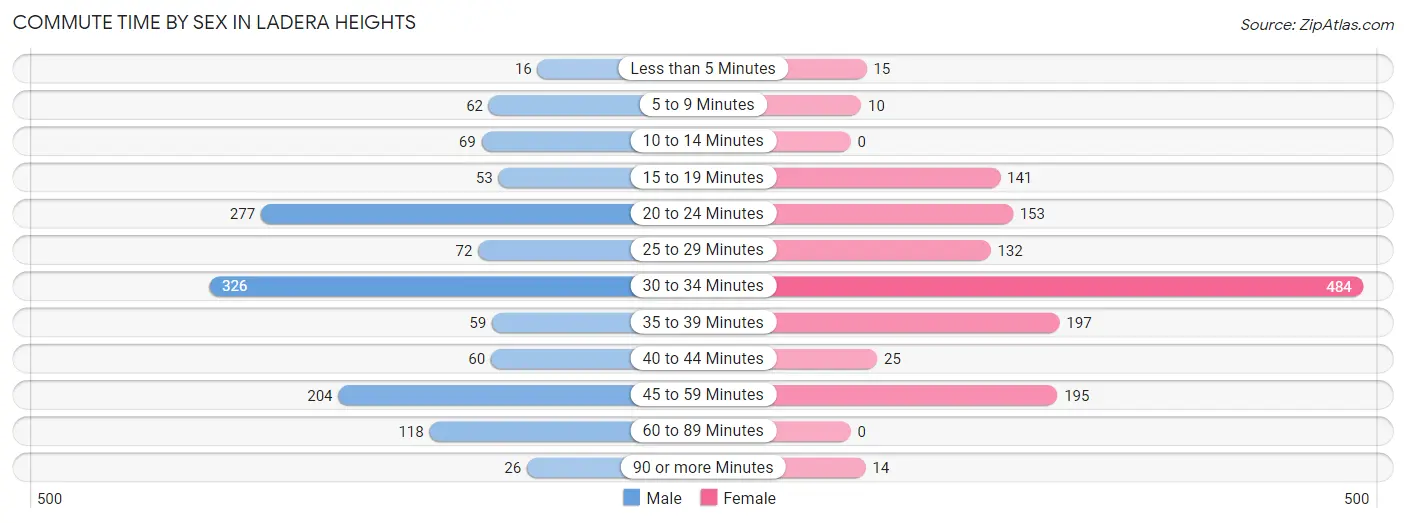
| Commute Time | Male | Female |
| Less than 5 Minutes | 16 (1.2%) | 15 (1.1%) |
| 5 to 9 Minutes | 62 (4.6%) | 10 (0.7%) |
| 10 to 14 Minutes | 69 (5.1%) | 0 (0.0%) |
| 15 to 19 Minutes | 53 (4.0%) | 141 (10.3%) |
| 20 to 24 Minutes | 277 (20.6%) | 153 (11.2%) |
| 25 to 29 Minutes | 72 (5.4%) | 132 (9.7%) |
| 30 to 34 Minutes | 326 (24.3%) | 484 (35.4%) |
| 35 to 39 Minutes | 59 (4.4%) | 197 (14.4%) |
| 40 to 44 Minutes | 60 (4.5%) | 25 (1.8%) |
| 45 to 59 Minutes | 204 (15.2%) | 195 (14.3%) |
| 60 to 89 Minutes | 118 (8.8%) | 0 (0.0%) |
| 90 or more Minutes | 26 (1.9%) | 14 (1.0%) |
Time of Departure to Work by Sex in Ladera Heights
The most frequent times of departure to work in Ladera Heights are 9:00 AM to 9:59 AM (388, 28.9%) for males and 8:30 AM to 8:59 AM (388, 28.4%) for females.
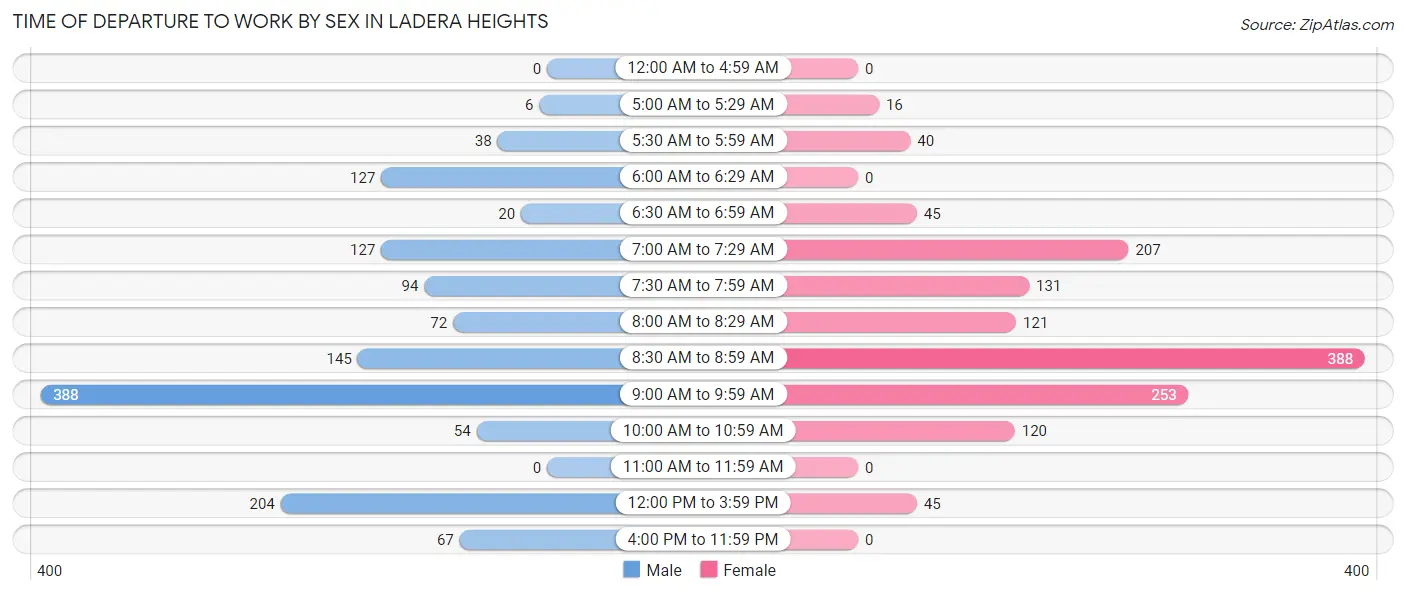
| Time of Departure | Male | Female |
| 12:00 AM to 4:59 AM | 0 (0.0%) | 0 (0.0%) |
| 5:00 AM to 5:29 AM | 6 (0.4%) | 16 (1.2%) |
| 5:30 AM to 5:59 AM | 38 (2.8%) | 40 (2.9%) |
| 6:00 AM to 6:29 AM | 127 (9.5%) | 0 (0.0%) |
| 6:30 AM to 6:59 AM | 20 (1.5%) | 45 (3.3%) |
| 7:00 AM to 7:29 AM | 127 (9.5%) | 207 (15.1%) |
| 7:30 AM to 7:59 AM | 94 (7.0%) | 131 (9.6%) |
| 8:00 AM to 8:29 AM | 72 (5.4%) | 121 (8.9%) |
| 8:30 AM to 8:59 AM | 145 (10.8%) | 388 (28.4%) |
| 9:00 AM to 9:59 AM | 388 (28.9%) | 253 (18.5%) |
| 10:00 AM to 10:59 AM | 54 (4.0%) | 120 (8.8%) |
| 11:00 AM to 11:59 AM | 0 (0.0%) | 0 (0.0%) |
| 12:00 PM to 3:59 PM | 204 (15.2%) | 45 (3.3%) |
| 4:00 PM to 11:59 PM | 67 (5.0%) | 0 (0.0%) |
| Total | 1,342 (100.0%) | 1,366 (100.0%) |
Housing Occupancy in Ladera Heights
Occupancy by Ownership in Ladera Heights
Of the total 2,654 dwellings in Ladera Heights, owner-occupied units account for 1,763 (66.4%), while renter-occupied units make up 891 (33.6%).
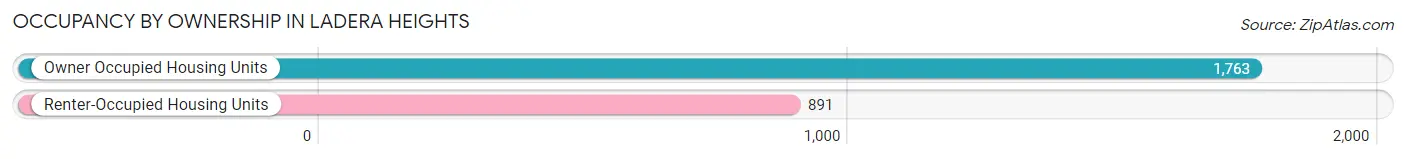
| Occupancy | # Housing Units | % Housing Units |
| Owner Occupied Housing Units | 1,763 | 66.4% |
| Renter-Occupied Housing Units | 891 | 33.6% |
| Total Occupied Housing Units | 2,654 | 100.0% |
Occupancy by Household Size in Ladera Heights
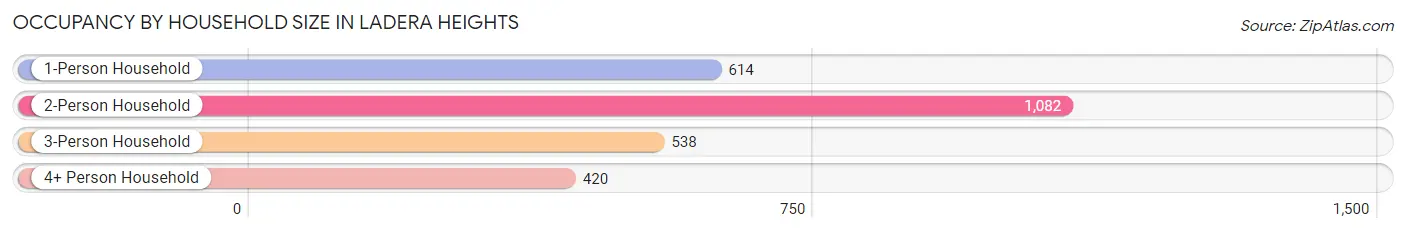
| Household Size | # Housing Units | % Housing Units |
| 1-Person Household | 614 | 23.1% |
| 2-Person Household | 1,082 | 40.8% |
| 3-Person Household | 538 | 20.3% |
| 4+ Person Household | 420 | 15.8% |
| Total Housing Units | 2,654 | 100.0% |
Occupancy by Ownership by Household Size in Ladera Heights
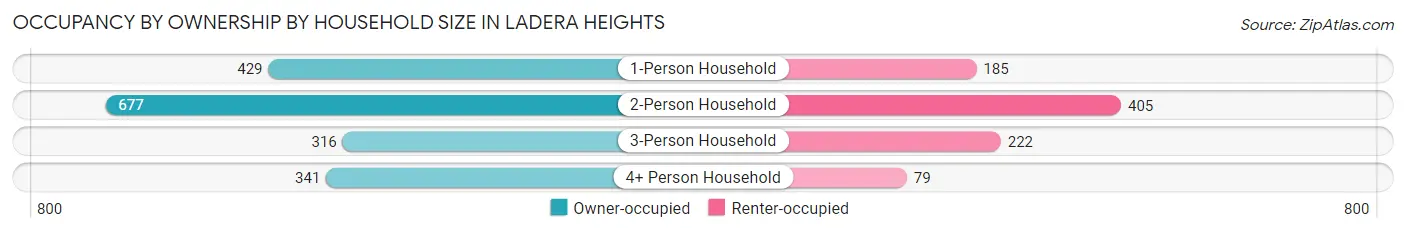
| Household Size | Owner-occupied | Renter-occupied |
| 1-Person Household | 429 (69.9%) | 185 (30.1%) |
| 2-Person Household | 677 (62.6%) | 405 (37.4%) |
| 3-Person Household | 316 (58.7%) | 222 (41.3%) |
| 4+ Person Household | 341 (81.2%) | 79 (18.8%) |
| Total Housing Units | 1,763 (66.4%) | 891 (33.6%) |
Occupancy by Educational Attainment in Ladera Heights
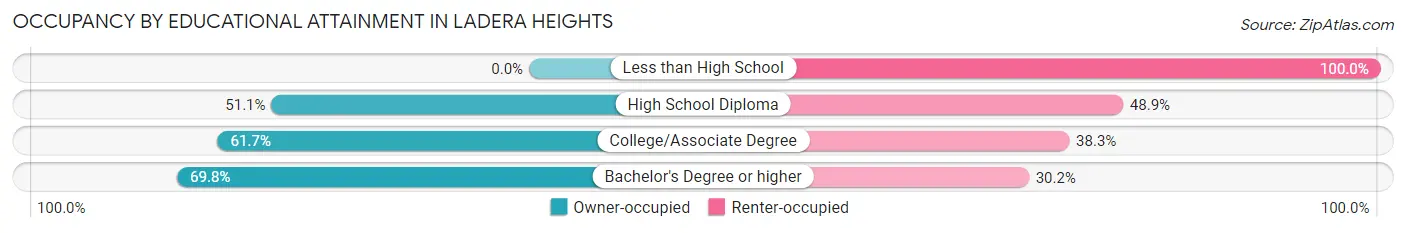
| Household Size | Owner-occupied | Renter-occupied |
| Less than High School | 0 (0.0%) | 14 (100.0%) |
| High School Diploma | 71 (51.1%) | 68 (48.9%) |
| College/Associate Degree | 405 (61.7%) | 251 (38.3%) |
| Bachelor's Degree or higher | 1,287 (69.8%) | 558 (30.2%) |
Occupancy by Age of Householder in Ladera Heights
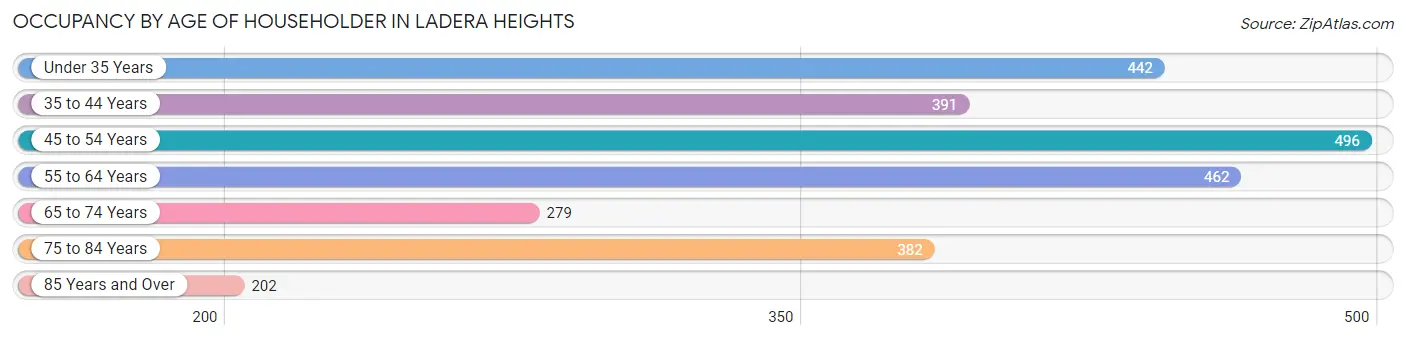
| Age Bracket | # Households | % Households |
| Under 35 Years | 442 | 16.7% |
| 35 to 44 Years | 391 | 14.7% |
| 45 to 54 Years | 496 | 18.7% |
| 55 to 64 Years | 462 | 17.4% |
| 65 to 74 Years | 279 | 10.5% |
| 75 to 84 Years | 382 | 14.4% |
| 85 Years and Over | 202 | 7.6% |
| Total | 2,654 | 100.0% |
Housing Finances in Ladera Heights
Median Income by Occupancy in Ladera Heights
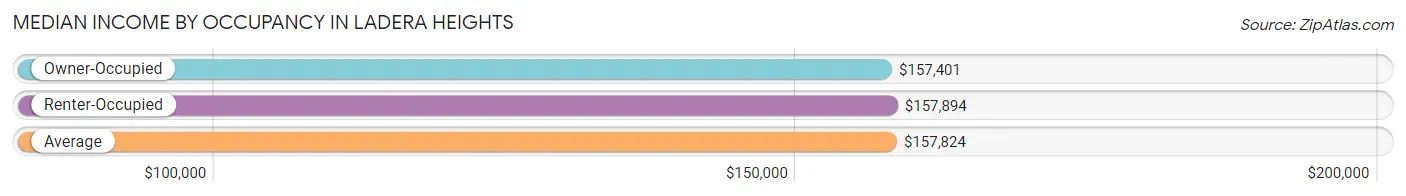
| Occupancy Type | # Households | Median Income |
| Owner-Occupied | 1,763 (66.4%) | $157,401 |
| Renter-Occupied | 891 (33.6%) | $157,894 |
| Average | 2,654 (100.0%) | $157,824 |
Occupancy by Householder Income Bracket in Ladera Heights
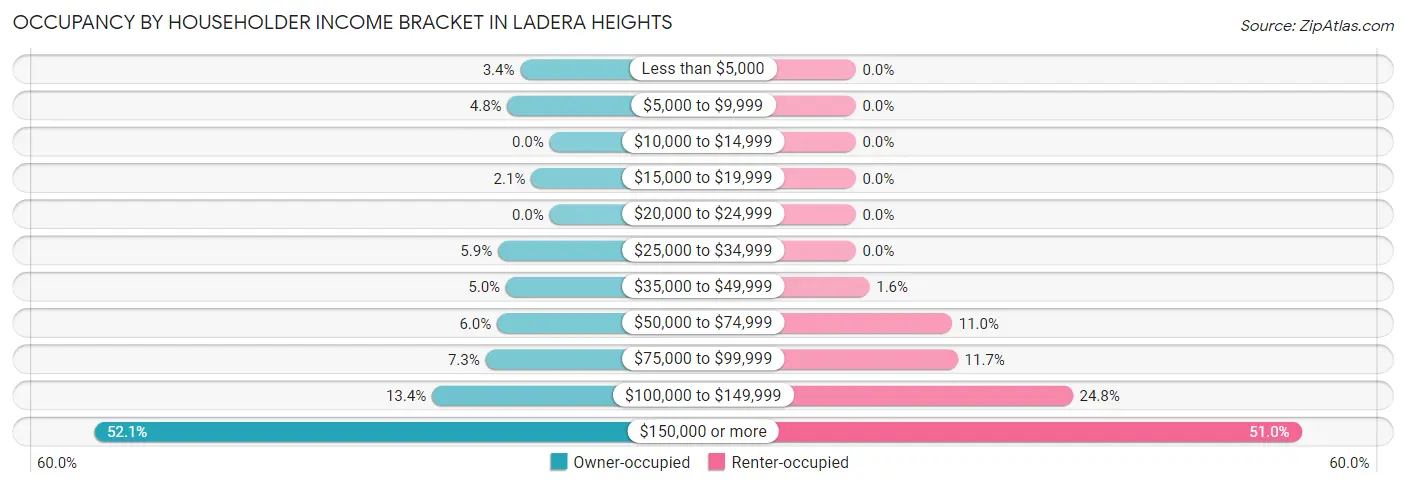
| Income Bracket | Owner-occupied | Renter-occupied |
| Less than $5,000 | 59 (3.4%) | 0 (0.0%) |
| $5,000 to $9,999 | 85 (4.8%) | 0 (0.0%) |
| $10,000 to $14,999 | 0 (0.0%) | 0 (0.0%) |
| $15,000 to $19,999 | 37 (2.1%) | 0 (0.0%) |
| $20,000 to $24,999 | 0 (0.0%) | 0 (0.0%) |
| $25,000 to $34,999 | 104 (5.9%) | 0 (0.0%) |
| $35,000 to $49,999 | 88 (5.0%) | 14 (1.6%) |
| $50,000 to $74,999 | 106 (6.0%) | 98 (11.0%) |
| $75,000 to $99,999 | 129 (7.3%) | 104 (11.7%) |
| $100,000 to $149,999 | 237 (13.4%) | 221 (24.8%) |
| $150,000 or more | 918 (52.1%) | 454 (50.9%) |
| Total | 1,763 (100.0%) | 891 (100.0%) |
Monthly Housing Cost Tiers in Ladera Heights
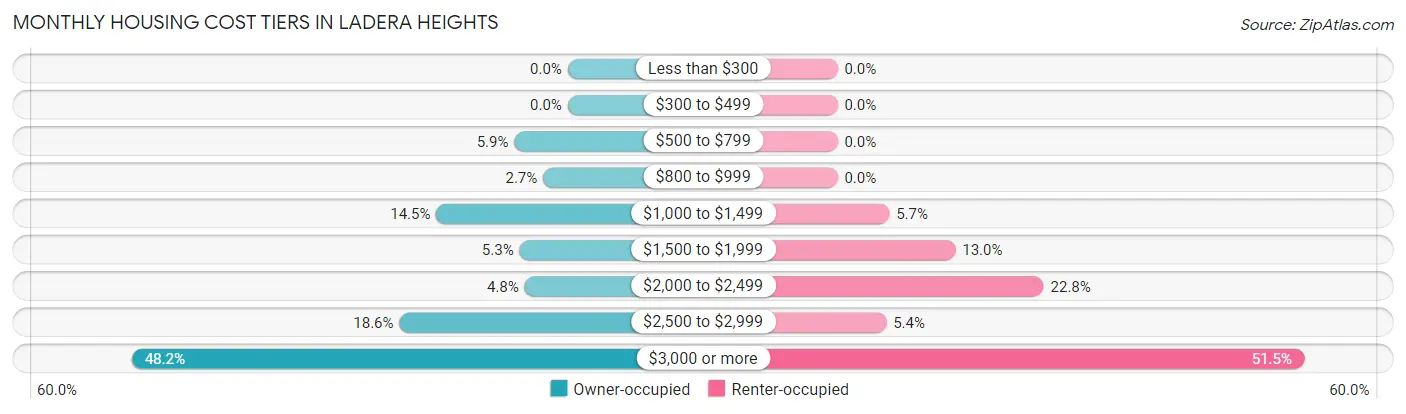
| Monthly Cost | Owner-occupied | Renter-occupied |
| Less than $300 | 0 (0.0%) | 0 (0.0%) |
| $300 to $499 | 0 (0.0%) | 0 (0.0%) |
| $500 to $799 | 104 (5.9%) | 0 (0.0%) |
| $800 to $999 | 48 (2.7%) | 0 (0.0%) |
| $1,000 to $1,499 | 256 (14.5%) | 51 (5.7%) |
| $1,500 to $1,999 | 94 (5.3%) | 116 (13.0%) |
| $2,000 to $2,499 | 84 (4.8%) | 203 (22.8%) |
| $2,500 to $2,999 | 328 (18.6%) | 48 (5.4%) |
| $3,000 or more | 849 (48.2%) | 459 (51.5%) |
| Total | 1,763 (100.0%) | 891 (100.0%) |
Physical Housing Characteristics in Ladera Heights
Housing Structures in Ladera Heights
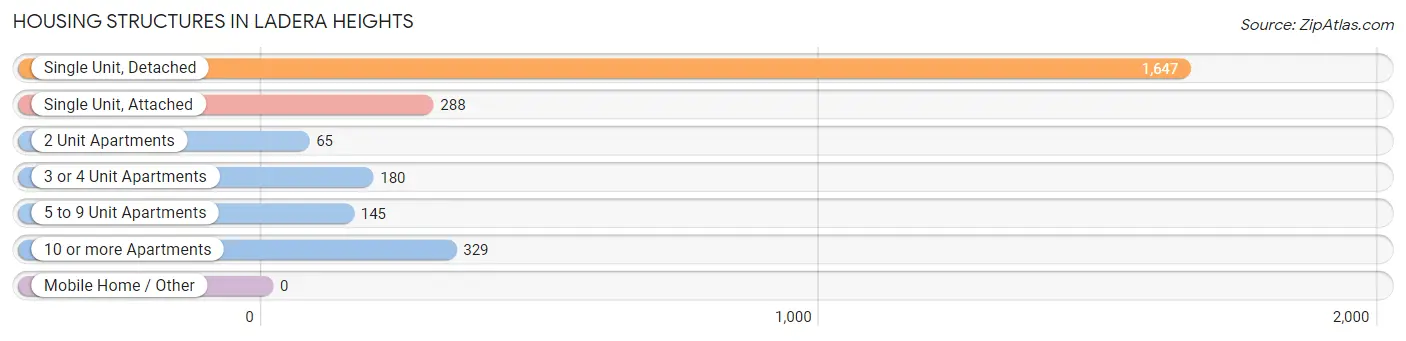
| Structure Type | # Housing Units | % Housing Units |
| Single Unit, Detached | 1,647 | 62.1% |
| Single Unit, Attached | 288 | 10.8% |
| 2 Unit Apartments | 65 | 2.5% |
| 3 or 4 Unit Apartments | 180 | 6.8% |
| 5 to 9 Unit Apartments | 145 | 5.5% |
| 10 or more Apartments | 329 | 12.4% |
| Mobile Home / Other | 0 | 0.0% |
| Total | 2,654 | 100.0% |
Housing Structures by Occupancy in Ladera Heights
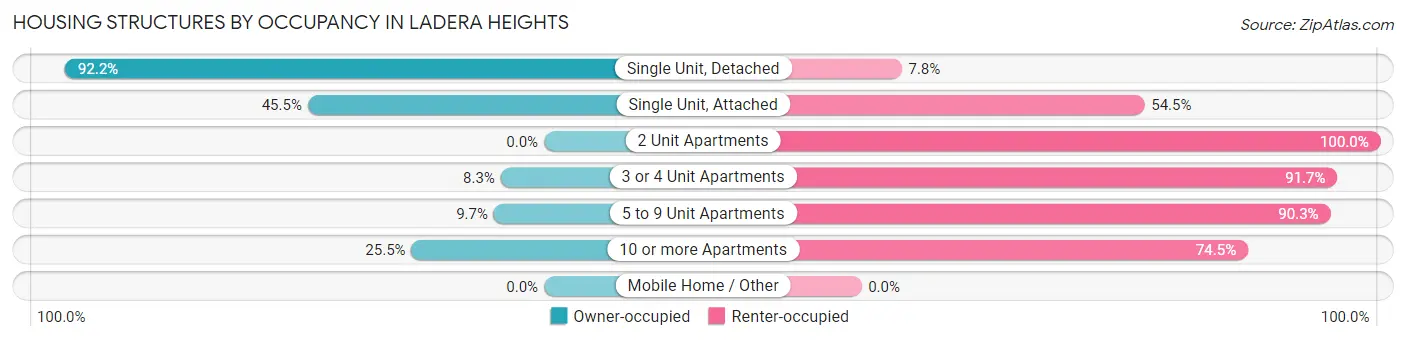
| Structure Type | Owner-occupied | Renter-occupied |
| Single Unit, Detached | 1,519 (92.2%) | 128 (7.8%) |
| Single Unit, Attached | 131 (45.5%) | 157 (54.5%) |
| 2 Unit Apartments | 0 (0.0%) | 65 (100.0%) |
| 3 or 4 Unit Apartments | 15 (8.3%) | 165 (91.7%) |
| 5 to 9 Unit Apartments | 14 (9.7%) | 131 (90.3%) |
| 10 or more Apartments | 84 (25.5%) | 245 (74.5%) |
| Mobile Home / Other | 0 (0.0%) | 0 (0.0%) |
| Total | 1,763 (66.4%) | 891 (33.6%) |
Housing Structures by Number of Rooms in Ladera Heights
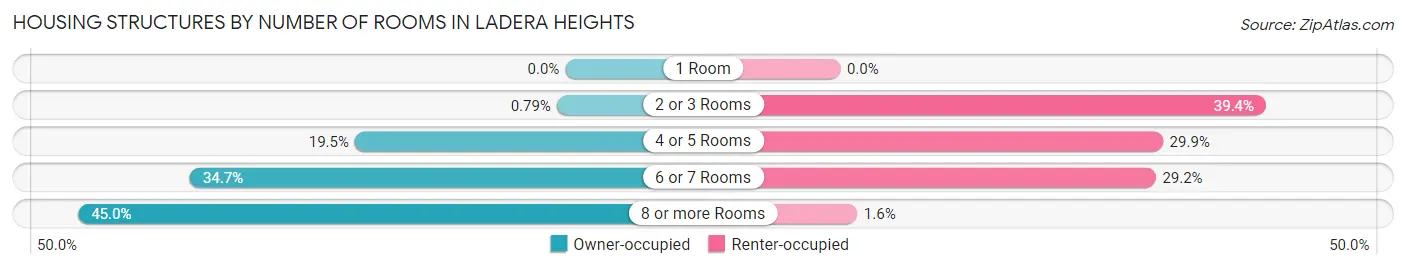
| Number of Rooms | Owner-occupied | Renter-occupied |
| 1 Room | 0 (0.0%) | 0 (0.0%) |
| 2 or 3 Rooms | 14 (0.8%) | 351 (39.4%) |
| 4 or 5 Rooms | 343 (19.5%) | 266 (29.8%) |
| 6 or 7 Rooms | 612 (34.7%) | 260 (29.2%) |
| 8 or more Rooms | 794 (45.0%) | 14 (1.6%) |
| Total | 1,763 (100.0%) | 891 (100.0%) |
Housing Structure by Heating Type in Ladera Heights
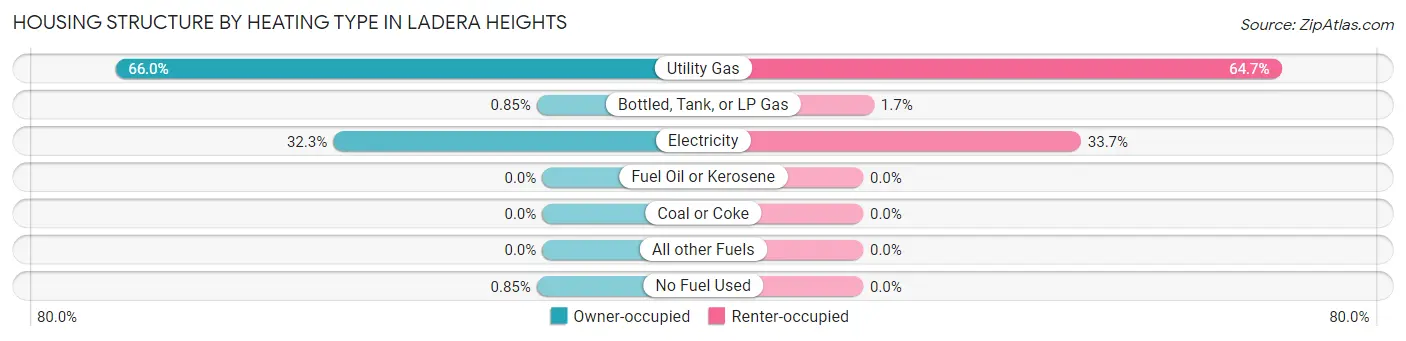
| Heating Type | Owner-occupied | Renter-occupied |
| Utility Gas | 1,163 (66.0%) | 576 (64.6%) |
| Bottled, Tank, or LP Gas | 15 (0.9%) | 15 (1.7%) |
| Electricity | 570 (32.3%) | 300 (33.7%) |
| Fuel Oil or Kerosene | 0 (0.0%) | 0 (0.0%) |
| Coal or Coke | 0 (0.0%) | 0 (0.0%) |
| All other Fuels | 0 (0.0%) | 0 (0.0%) |
| No Fuel Used | 15 (0.9%) | 0 (0.0%) |
| Total | 1,763 (100.0%) | 891 (100.0%) |
Household Vehicle Usage in Ladera Heights
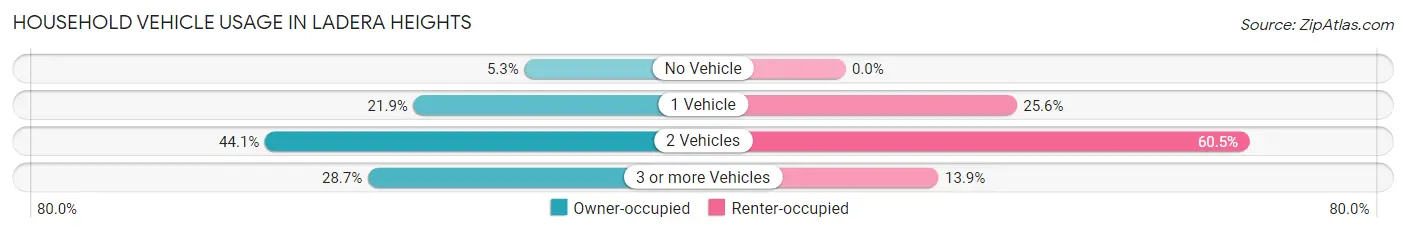
| Vehicles per Household | Owner-occupied | Renter-occupied |
| No Vehicle | 94 (5.3%) | 0 (0.0%) |
| 1 Vehicle | 386 (21.9%) | 228 (25.6%) |
| 2 Vehicles | 777 (44.1%) | 539 (60.5%) |
| 3 or more Vehicles | 506 (28.7%) | 124 (13.9%) |
| Total | 1,763 (100.0%) | 891 (100.0%) |
Real Estate & Mortgages in Ladera Heights
Real Estate and Mortgage Overview in Ladera Heights
| Characteristic | Without Mortgage | With Mortgage |
| Housing Units | 515 | 1,248 |
| Median Property Value | $1,391,100 | $1,498,600 |
| Median Household Income | $87,266 | $729 |
| Monthly Housing Costs | $1,241 | $834 |
| Real Estate Taxes | $6,731 | $16 |
Property Value by Mortgage Status in Ladera Heights
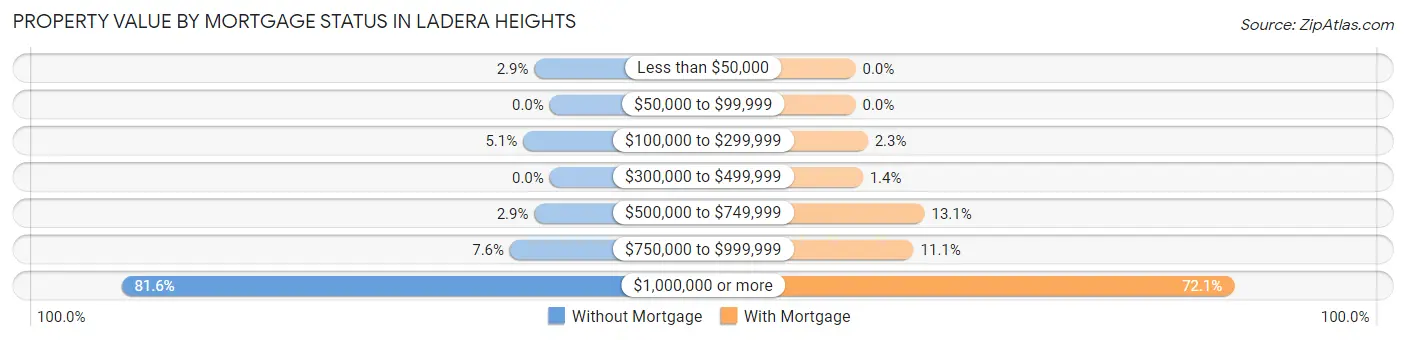
| Property Value | Without Mortgage | With Mortgage |
| Less than $50,000 | 15 (2.9%) | 0 (0.0%) |
| $50,000 to $99,999 | 0 (0.0%) | 0 (0.0%) |
| $100,000 to $299,999 | 26 (5.1%) | 29 (2.3%) |
| $300,000 to $499,999 | 0 (0.0%) | 17 (1.4%) |
| $500,000 to $749,999 | 15 (2.9%) | 164 (13.1%) |
| $750,000 to $999,999 | 39 (7.6%) | 138 (11.1%) |
| $1,000,000 or more | 420 (81.6%) | 900 (72.1%) |
| Total | 515 (100.0%) | 1,248 (100.0%) |
Household Income by Mortgage Status in Ladera Heights
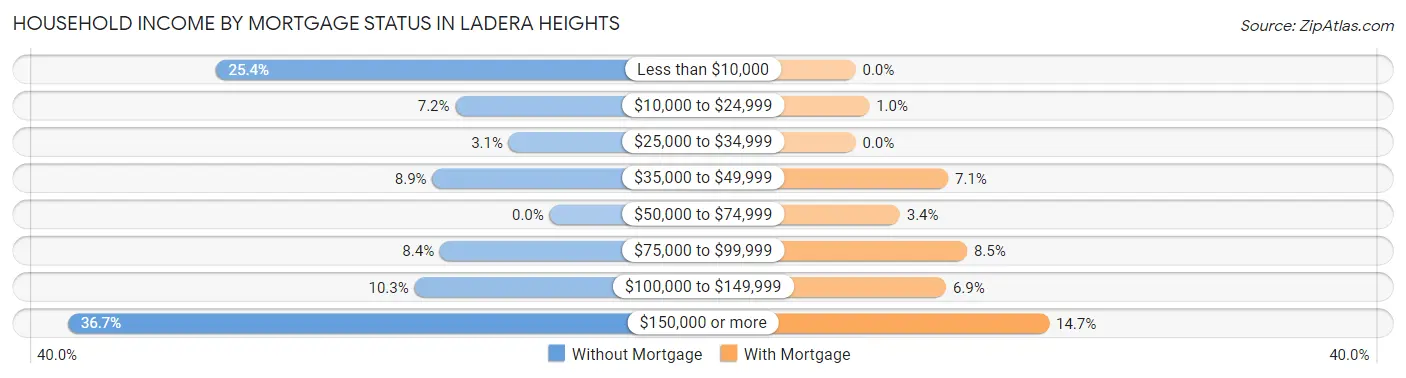
| Household Income | Without Mortgage | With Mortgage |
| Less than $10,000 | 131 (25.4%) | 0 (0.0%) |
| $10,000 to $24,999 | 37 (7.2%) | 13 (1.0%) |
| $25,000 to $34,999 | 16 (3.1%) | 0 (0.0%) |
| $35,000 to $49,999 | 46 (8.9%) | 88 (7.0%) |
| $50,000 to $74,999 | 0 (0.0%) | 42 (3.4%) |
| $75,000 to $99,999 | 43 (8.4%) | 106 (8.5%) |
| $100,000 to $149,999 | 53 (10.3%) | 86 (6.9%) |
| $150,000 or more | 189 (36.7%) | 184 (14.7%) |
| Total | 515 (100.0%) | 1,248 (100.0%) |
Property Value to Household Income Ratio in Ladera Heights
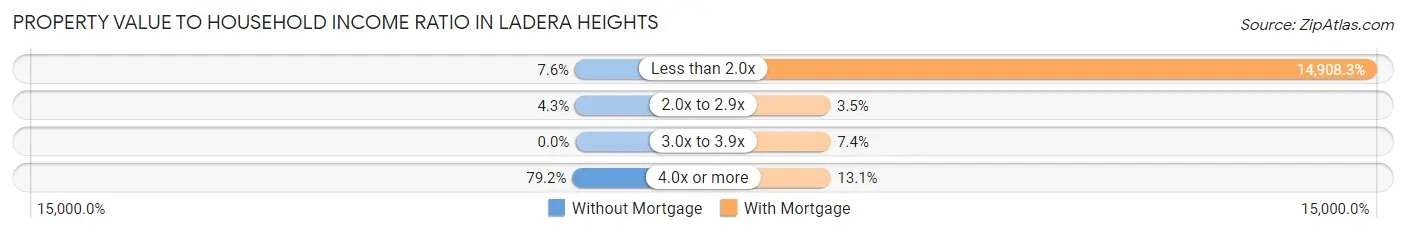
| Value-to-Income Ratio | Without Mortgage | With Mortgage |
| Less than 2.0x | 39 (7.6%) | 186,056 (14,908.3%) |
| 2.0x to 2.9x | 22 (4.3%) | 43 (3.5%) |
| 3.0x to 3.9x | 0 (0.0%) | 92 (7.4%) |
| 4.0x or more | 408 (79.2%) | 164 (13.1%) |
| Total | 515 (100.0%) | 1,248 (100.0%) |
Real Estate Taxes by Mortgage Status in Ladera Heights
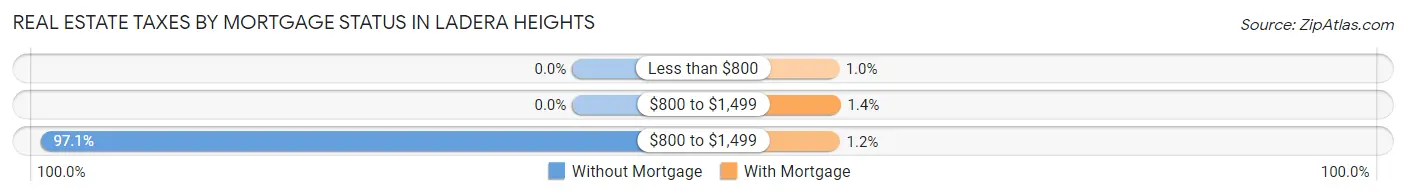
| Property Taxes | Without Mortgage | With Mortgage |
| Less than $800 | 0 (0.0%) | 13 (1.0%) |
| $800 to $1,499 | 0 (0.0%) | 17 (1.4%) |
| $800 to $1,499 | 500 (97.1%) | 15 (1.2%) |
| Total | 515 (100.0%) | 1,248 (100.0%) |
Health & Disability in Ladera Heights
Health Insurance Coverage by Age in Ladera Heights
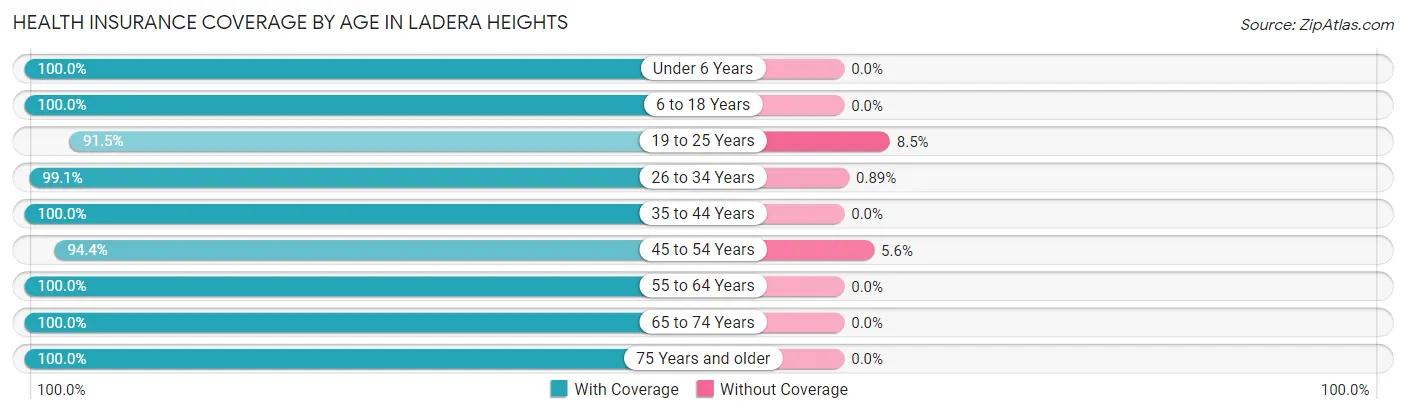
| Age Bracket | With Coverage | Without Coverage |
| Under 6 Years | 372 (100.0%) | 0 (0.0%) |
| 6 to 18 Years | 948 (100.0%) | 0 (0.0%) |
| 19 to 25 Years | 345 (91.5%) | 32 (8.5%) |
| 26 to 34 Years | 1,108 (99.1%) | 10 (0.9%) |
| 35 to 44 Years | 715 (100.0%) | 0 (0.0%) |
| 45 to 54 Years | 882 (94.4%) | 52 (5.6%) |
| 55 to 64 Years | 767 (100.0%) | 0 (0.0%) |
| 65 to 74 Years | 646 (100.0%) | 0 (0.0%) |
| 75 Years and older | 830 (100.0%) | 0 (0.0%) |
| Total | 6,613 (98.6%) | 94 (1.4%) |
Health Insurance Coverage by Citizenship Status in Ladera Heights
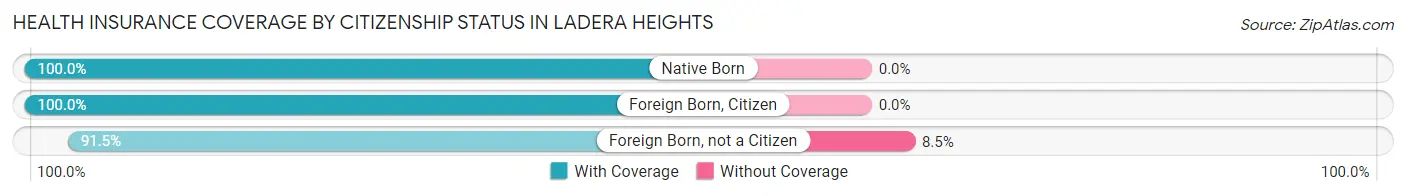
| Citizenship Status | With Coverage | Without Coverage |
| Native Born | 372 (100.0%) | 0 (0.0%) |
| Foreign Born, Citizen | 948 (100.0%) | 0 (0.0%) |
| Foreign Born, not a Citizen | 345 (91.5%) | 32 (8.5%) |
Health Insurance Coverage by Household Income in Ladera Heights
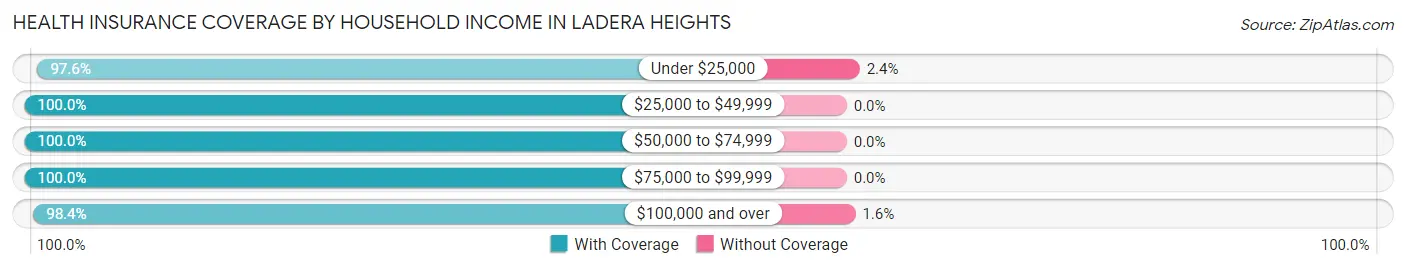
| Household Income | With Coverage | Without Coverage |
| Under $25,000 | 403 (97.6%) | 10 (2.4%) |
| $25,000 to $49,999 | 374 (100.0%) | 0 (0.0%) |
| $50,000 to $74,999 | 305 (100.0%) | 0 (0.0%) |
| $75,000 to $99,999 | 443 (100.0%) | 0 (0.0%) |
| $100,000 and over | 5,081 (98.4%) | 84 (1.6%) |
Public vs Private Health Insurance Coverage by Age in Ladera Heights
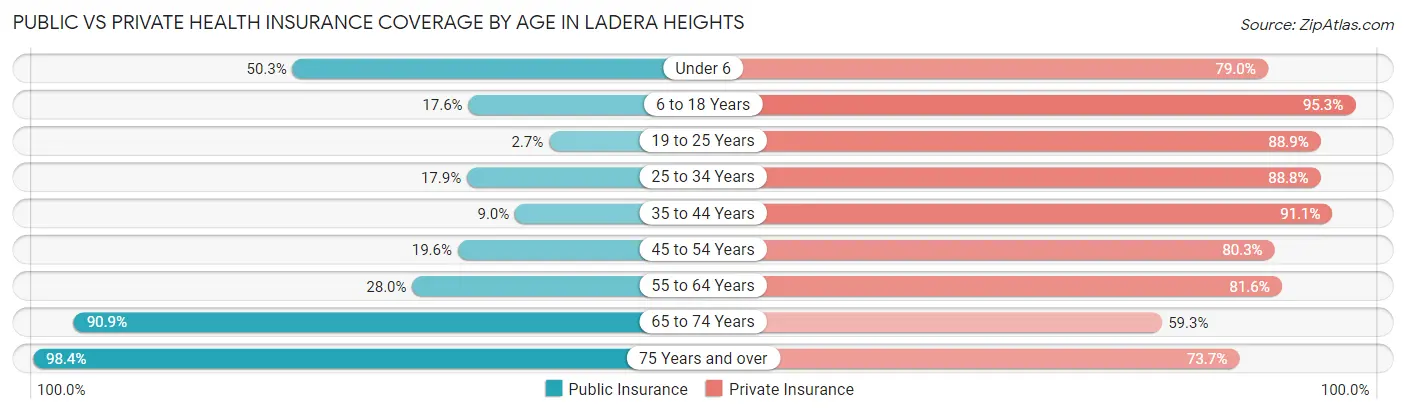
| Age Bracket | Public Insurance | Private Insurance |
| Under 6 | 187 (50.3%) | 294 (79.0%) |
| 6 to 18 Years | 167 (17.6%) | 903 (95.3%) |
| 19 to 25 Years | 10 (2.6%) | 335 (88.9%) |
| 25 to 34 Years | 200 (17.9%) | 993 (88.8%) |
| 35 to 44 Years | 64 (8.9%) | 651 (91.0%) |
| 45 to 54 Years | 183 (19.6%) | 750 (80.3%) |
| 55 to 64 Years | 215 (28.0%) | 626 (81.6%) |
| 65 to 74 Years | 587 (90.9%) | 383 (59.3%) |
| 75 Years and over | 817 (98.4%) | 612 (73.7%) |
| Total | 2,430 (36.2%) | 5,547 (82.7%) |
Disability Status by Sex by Age in Ladera Heights
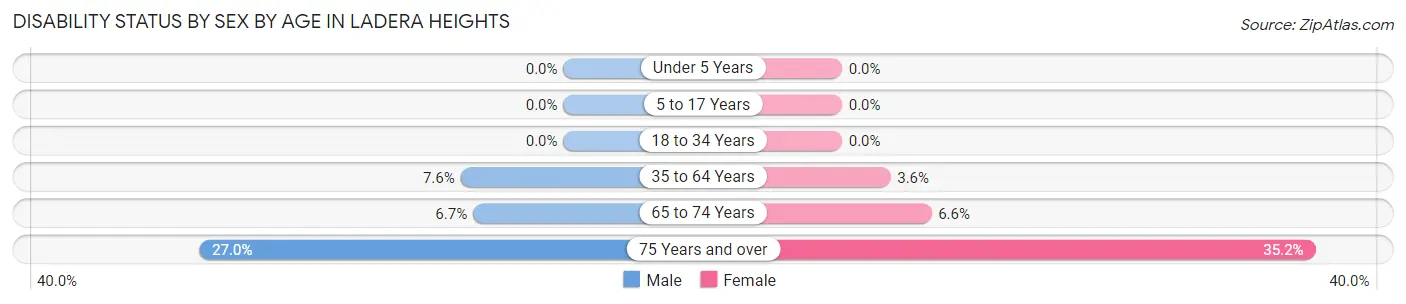
| Age Bracket | Male | Female |
| Under 5 Years | 0 (0.0%) | 0 (0.0%) |
| 5 to 17 Years | 0 (0.0%) | 0 (0.0%) |
| 18 to 34 Years | 0 (0.0%) | 0 (0.0%) |
| 35 to 64 Years | 89 (7.6%) | 45 (3.6%) |
| 65 to 74 Years | 10 (6.7%) | 33 (6.6%) |
| 75 Years and over | 86 (27.0%) | 180 (35.2%) |
Disability Class by Sex by Age in Ladera Heights
Disability Class: Hearing Difficulty
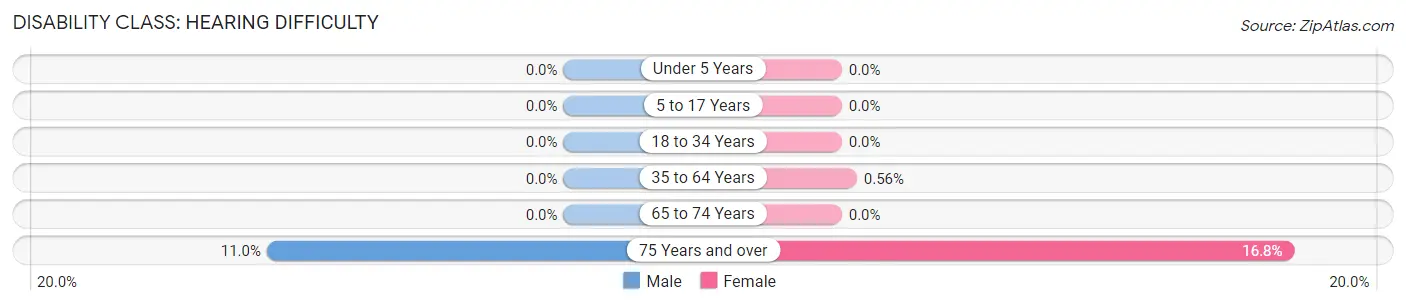
| Age Bracket | Male | Female |
| Under 5 Years | 0 (0.0%) | 0 (0.0%) |
| 5 to 17 Years | 0 (0.0%) | 0 (0.0%) |
| 18 to 34 Years | 0 (0.0%) | 0 (0.0%) |
| 35 to 64 Years | 0 (0.0%) | 7 (0.6%) |
| 65 to 74 Years | 0 (0.0%) | 0 (0.0%) |
| 75 Years and over | 35 (11.0%) | 86 (16.8%) |
Disability Class: Vision Difficulty
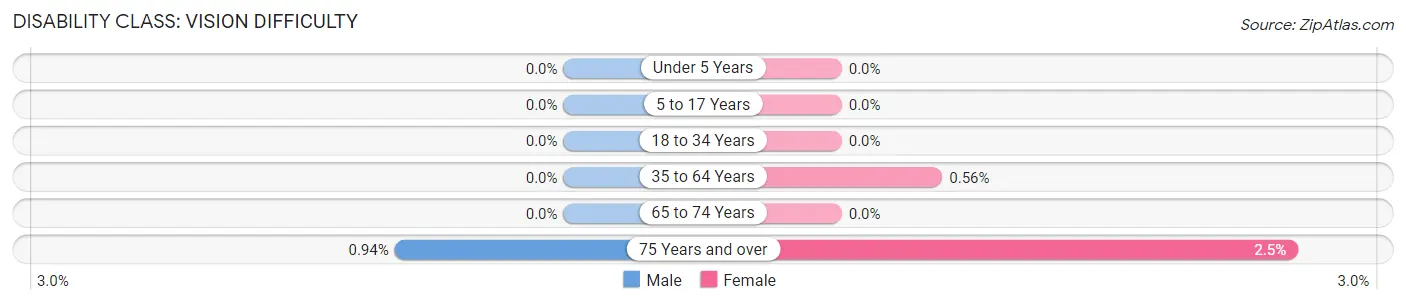
| Age Bracket | Male | Female |
| Under 5 Years | 0 (0.0%) | 0 (0.0%) |
| 5 to 17 Years | 0 (0.0%) | 0 (0.0%) |
| 18 to 34 Years | 0 (0.0%) | 0 (0.0%) |
| 35 to 64 Years | 0 (0.0%) | 7 (0.6%) |
| 65 to 74 Years | 0 (0.0%) | 0 (0.0%) |
| 75 Years and over | 3 (0.9%) | 13 (2.5%) |
Disability Class: Cognitive Difficulty
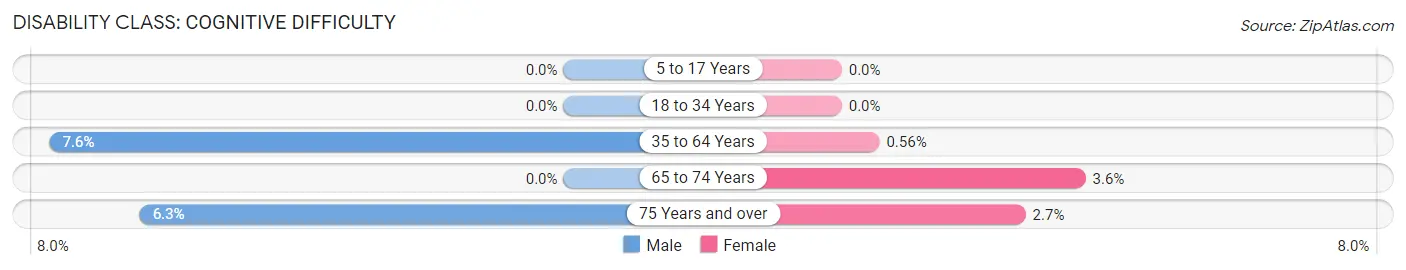
| Age Bracket | Male | Female |
| 5 to 17 Years | 0 (0.0%) | 0 (0.0%) |
| 18 to 34 Years | 0 (0.0%) | 0 (0.0%) |
| 35 to 64 Years | 89 (7.6%) | 7 (0.6%) |
| 65 to 74 Years | 0 (0.0%) | 18 (3.6%) |
| 75 Years and over | 20 (6.3%) | 14 (2.7%) |
Disability Class: Ambulatory Difficulty
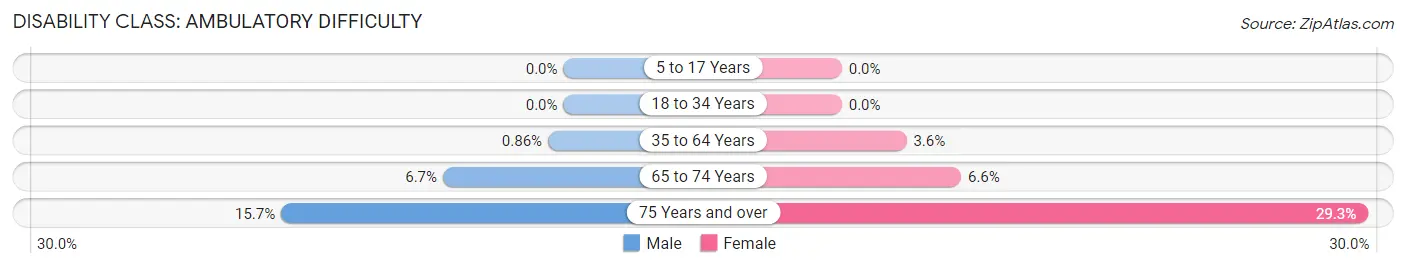
| Age Bracket | Male | Female |
| 5 to 17 Years | 0 (0.0%) | 0 (0.0%) |
| 18 to 34 Years | 0 (0.0%) | 0 (0.0%) |
| 35 to 64 Years | 10 (0.9%) | 45 (3.6%) |
| 65 to 74 Years | 10 (6.7%) | 33 (6.6%) |
| 75 Years and over | 50 (15.7%) | 150 (29.3%) |
Disability Class: Self-Care Difficulty
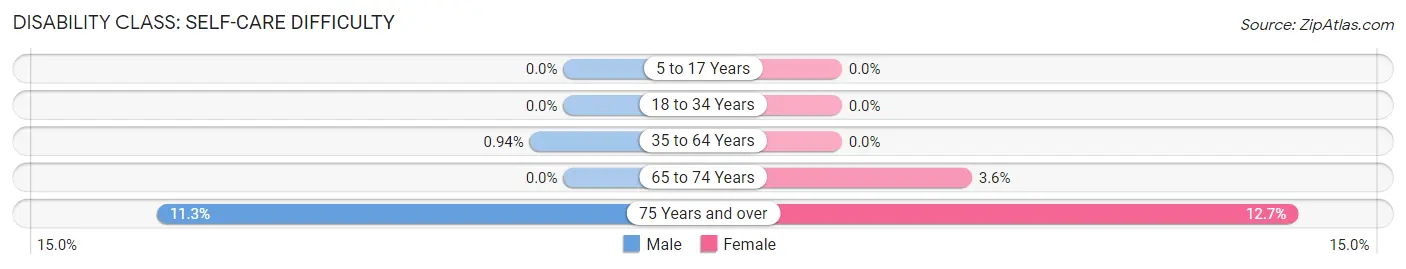
| Age Bracket | Male | Female |
| 5 to 17 Years | 0 (0.0%) | 0 (0.0%) |
| 18 to 34 Years | 0 (0.0%) | 0 (0.0%) |
| 35 to 64 Years | 11 (0.9%) | 0 (0.0%) |
| 65 to 74 Years | 0 (0.0%) | 18 (3.6%) |
| 75 Years and over | 36 (11.3%) | 65 (12.7%) |
Technology Access in Ladera Heights
Computing Device Access in Ladera Heights
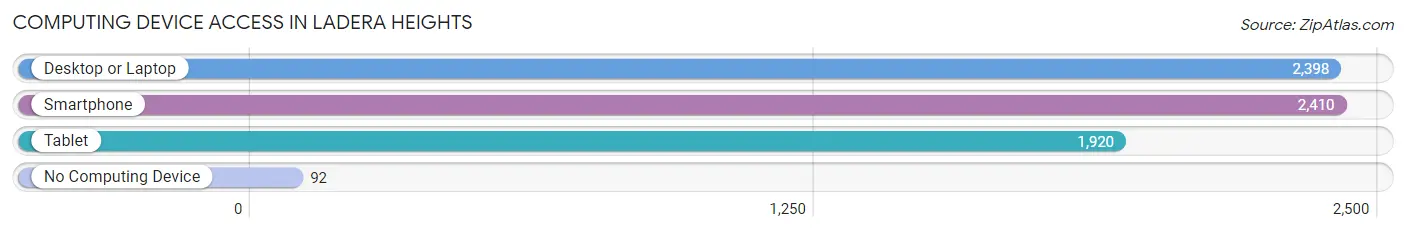
| Device Type | # Households | % Households |
| Desktop or Laptop | 2,398 | 90.3% |
| Smartphone | 2,410 | 90.8% |
| Tablet | 1,920 | 72.3% |
| No Computing Device | 92 | 3.5% |
| Total | 2,654 | 100.0% |
Internet Access in Ladera Heights
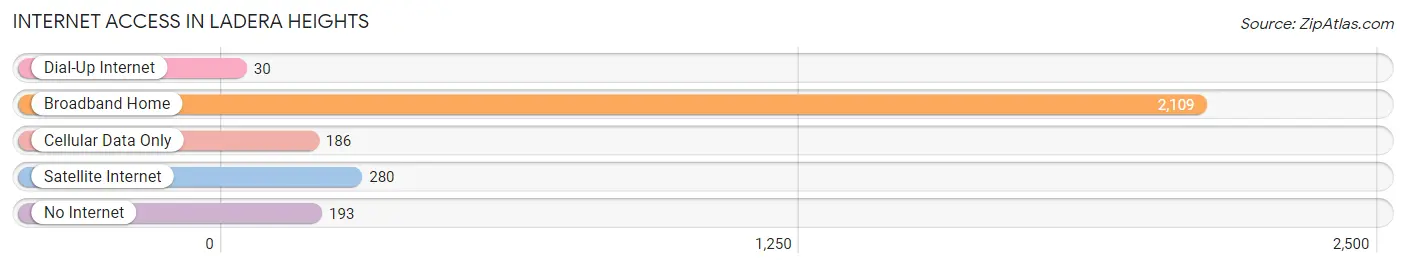
| Internet Type | # Households | % Households |
| Dial-Up Internet | 30 | 1.1% |
| Broadband Home | 2,109 | 79.5% |
| Cellular Data Only | 186 | 7.0% |
| Satellite Internet | 280 | 10.5% |
| No Internet | 193 | 7.3% |
| Total | 2,654 | 100.0% |
Ladera Heights Summary
Ladera Heights is an unincorporated area located in the southwestern region of Los Angeles County, California. It is bordered by the cities of Culver City, Inglewood, and View Park-Windsor Hills. The area is known for its affluent African-American population and its large, luxurious homes.
History
Ladera Heights was originally part of the Rancho La Cienega o Paso de la Tijera, a Mexican land grant given to Antonio Jose Rocha in 1834. The area was later developed by the Ladera Land Company in the 1920s. The company was owned by the prominent Doheny family, who also owned the nearby Doheny Ranch. The area was initially developed as a residential community for wealthy Angelenos, and was known for its large, luxurious homes.
In the 1950s, the area began to attract a growing African-American population, many of whom were professionals and business owners. This influx of African-Americans led to the area becoming known as a “black Beverly Hills.” The area has since become one of the most affluent African-American communities in the United States.
Geography
Ladera Heights is located in the southwestern region of Los Angeles County, California. It is bordered by the cities of Culver City, Inglewood, and View Park-Windsor Hills. The area is located in the Baldwin Hills, a range of low mountains that run along the western edge of the Los Angeles Basin. The area is characterized by its rolling hills and lush vegetation.
Economy
Ladera Heights is an affluent area with a median household income of $90,000. The area is home to a number of businesses, including banks, restaurants, and retail stores. The area is also home to a number of professional offices, including law firms, accounting firms, and medical offices.
Demographics
As of the 2010 census, the population of Ladera Heights was 8,542. The racial makeup of the area was 79.2% African-American, 11.2% White, 4.3% Asian, and 4.3% other. The median age of the population was 44.7 years. The median household income was $90,000.
Conclusion
Ladera Heights is an affluent unincorporated area located in the southwestern region of Los Angeles County, California. It is bordered by the cities of Culver City, Inglewood, and View Park-Windsor Hills. The area is known for its affluent African-American population and its large, luxurious homes. The area has a median household income of $90,000 and is home to a number of businesses, including banks, restaurants, and retail stores. As of the 2010 census, the population of Ladera Heights was 8,542, with 79.2% of the population being African-American.
Common Questions
What is Per Capita Income in Ladera Heights?
Per Capita income in Ladera Heights is $75,170.
What is the Median Family Income in Ladera Heights?
Median Family Income in Ladera Heights is $177,353.
What is the Median Household income in Ladera Heights?
Median Household Income in Ladera Heights is $157,824.
What is Income or Wage Gap in Ladera Heights?
Income or Wage Gap in Ladera Heights is 2.1%.
Women in Ladera Heights earn 97.9 cents for every dollar earned by a man.
What is Inequality or Gini Index in Ladera Heights?
Inequality or Gini Index in Ladera Heights is 0.43.
What is the Total Population of Ladera Heights?
Total Population of Ladera Heights is 6,710.
What is the Total Male Population of Ladera Heights?
Total Male Population of Ladera Heights is 2,954.
What is the Total Female Population of Ladera Heights?
Total Female Population of Ladera Heights is 3,756.
What is the Ratio of Males per 100 Females in Ladera Heights?
There are 78.65 Males per 100 Females in Ladera Heights.
What is the Ratio of Females per 100 Males in Ladera Heights?
There are 127.15 Females per 100 Males in Ladera Heights.
What is the Median Population Age in Ladera Heights?
Median Population Age in Ladera Heights is 42.9 Years.
What is the Average Family Size in Ladera Heights
Average Family Size in Ladera Heights is 3.0 People.
What is the Average Household Size in Ladera Heights
Average Household Size in Ladera Heights is 2.5 People.
How Large is the Labor Force in Ladera Heights?
There are 3,598 People in the Labor Forcein in Ladera Heights.
What is the Percentage of People in the Labor Force in Ladera Heights?
64.7% of People are in the Labor Force in Ladera Heights.
What is the Unemployment Rate in Ladera Heights?
Unemployment Rate in Ladera Heights is 3.4%.