North Gate, CA Map & Demographics
North Gate Map
North Gate Overview
$109,421
PER CAPITA INCOME
$196,429
AVG FAMILY INCOME
$225,066
AVG HOUSEHOLD INCOME
0.45
INEQUALITY / GINI INDEX
900
TOTAL POPULATION
461
MALE POPULATION
439
FEMALE POPULATION
105.01
MALES / 100 FEMALES
95.23
FEMALES / 100 MALES
54.1
MEDIAN AGE
3.3
AVG FAMILY SIZE
3.2
AVG HOUSEHOLD SIZE
376
LABOR FORCE [ PEOPLE ]
49.6%
PERCENT IN LABOR FORCE
Income in North Gate
Income Overview in North Gate
Per Capita Income in North Gate is $109,421, while median incomes of families and households are $196,429 and $225,066 respectively.
| Characteristic | Number | Measure |
| Per Capita Income | 900 | $109,421 |
| Median Family Income | 256 | $196,429 |
| Mean Family Income | 256 | $309,946 |
| Median Household Income | 284 | $225,066 |
| Mean Household Income | 284 | $334,530 |
| Income Deficit | 256 | $0 |
| Wage / Income Gap (%) | 900 | 0.00% |
| Wage / Income Gap ($) | 900 | 100.00¢ per $1 |
| Gini / Inequality Index | 900 | 0.45 |
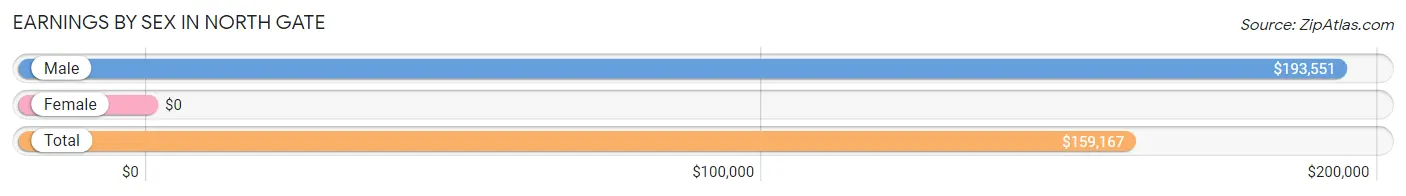
Earnings by Sex in North Gate
| Sex | Number | Average Earnings |
| Male | 297 (77.3%) | $193,551 |
| Female | 87 (22.7%) | $0 |
| Total | 384 (100.0%) | $159,167 |
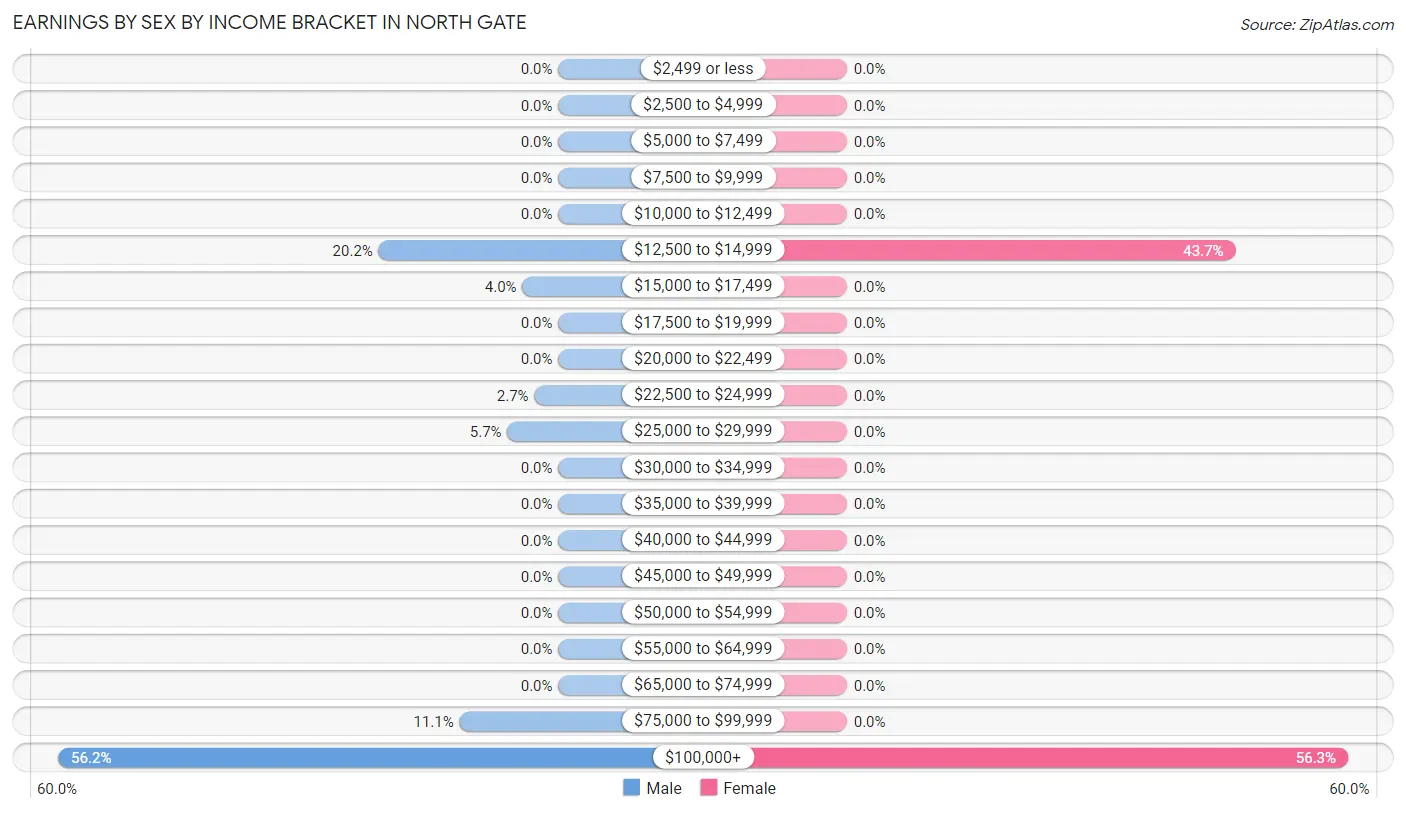
Earnings by Sex by Income Bracket in North Gate
The most common earnings brackets in North Gate are $100,000+ for men (167 | 56.2%) and $100,000+ for women (49 | 56.3%).
| Income | Male | Female |
| $2,499 or less | 0 (0.0%) | 0 (0.0%) |
| $2,500 to $4,999 | 0 (0.0%) | 0 (0.0%) |
| $5,000 to $7,499 | 0 (0.0%) | 0 (0.0%) |
| $7,500 to $9,999 | 0 (0.0%) | 0 (0.0%) |
| $10,000 to $12,499 | 0 (0.0%) | 0 (0.0%) |
| $12,500 to $14,999 | 60 (20.2%) | 38 (43.7%) |
| $15,000 to $17,499 | 12 (4.0%) | 0 (0.0%) |
| $17,500 to $19,999 | 0 (0.0%) | 0 (0.0%) |
| $20,000 to $22,499 | 0 (0.0%) | 0 (0.0%) |
| $22,500 to $24,999 | 8 (2.7%) | 0 (0.0%) |
| $25,000 to $29,999 | 17 (5.7%) | 0 (0.0%) |
| $30,000 to $34,999 | 0 (0.0%) | 0 (0.0%) |
| $35,000 to $39,999 | 0 (0.0%) | 0 (0.0%) |
| $40,000 to $44,999 | 0 (0.0%) | 0 (0.0%) |
| $45,000 to $49,999 | 0 (0.0%) | 0 (0.0%) |
| $50,000 to $54,999 | 0 (0.0%) | 0 (0.0%) |
| $55,000 to $64,999 | 0 (0.0%) | 0 (0.0%) |
| $65,000 to $74,999 | 0 (0.0%) | 0 (0.0%) |
| $75,000 to $99,999 | 33 (11.1%) | 0 (0.0%) |
| $100,000+ | 167 (56.2%) | 49 (56.3%) |
| Total | 297 (100.0%) | 87 (100.0%) |
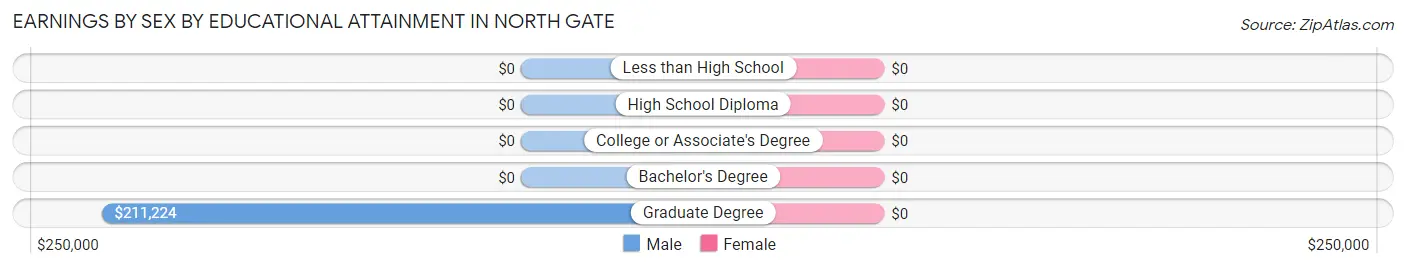
Earnings by Sex by Educational Attainment in North Gate
| Educational Attainment | Male Income | Female Income |
| Less than High School | - | - |
| High School Diploma | - | - |
| College or Associate's Degree | - | - |
| Bachelor's Degree | - | - |
| Graduate Degree | $211,224 | $0 |
| Total | $210,677 | $0 |
Family Income in North Gate
Family Income Brackets in North Gate
According to the North Gate family income data, there are 119 families falling into the $200,000+ income range, which is the most common income bracket and makes up 46.5% of all families.
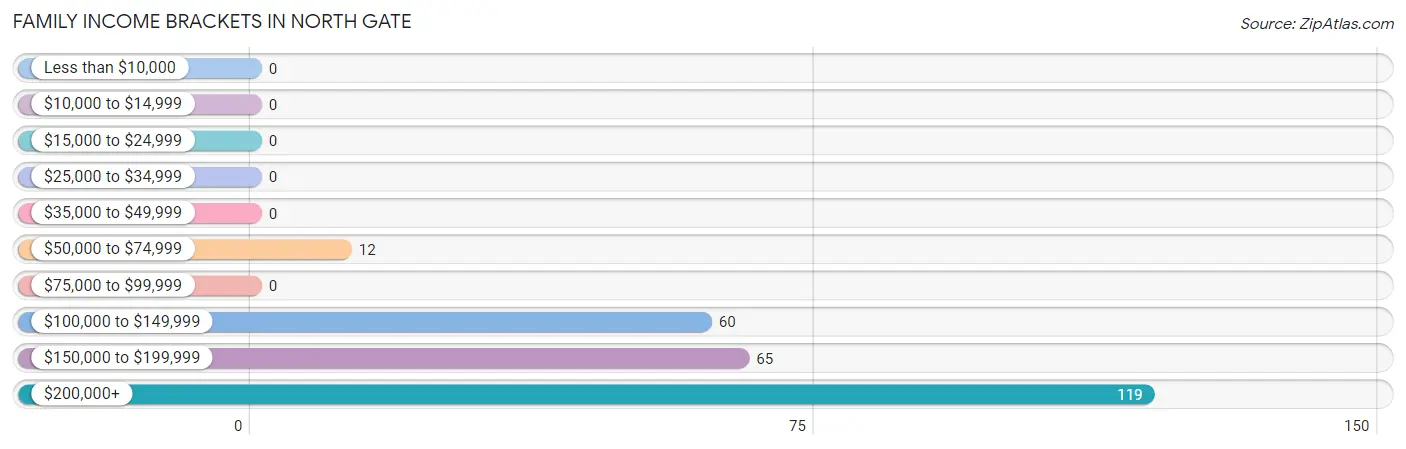
| Income Bracket | # Families | % Families |
| Less than $10,000 | 0 | 0.0% |
| $10,000 to $14,999 | 0 | 0.0% |
| $15,000 to $24,999 | 0 | 0.0% |
| $25,000 to $34,999 | 0 | 0.0% |
| $35,000 to $49,999 | 0 | 0.0% |
| $50,000 to $74,999 | 12 | 4.7% |
| $75,000 to $99,999 | 0 | 0.0% |
| $100,000 to $149,999 | 60 | 23.4% |
| $150,000 to $199,999 | 65 | 25.4% |
| $200,000+ | 119 | 46.5% |
Family Income by Famaliy Size in North Gate
2-person families (152 | 59.4%) account for the highest median family income in North Gate with $225,197 per family, while 2-person families (152 | 59.4%) have the highest median income of $112,598 per family member.
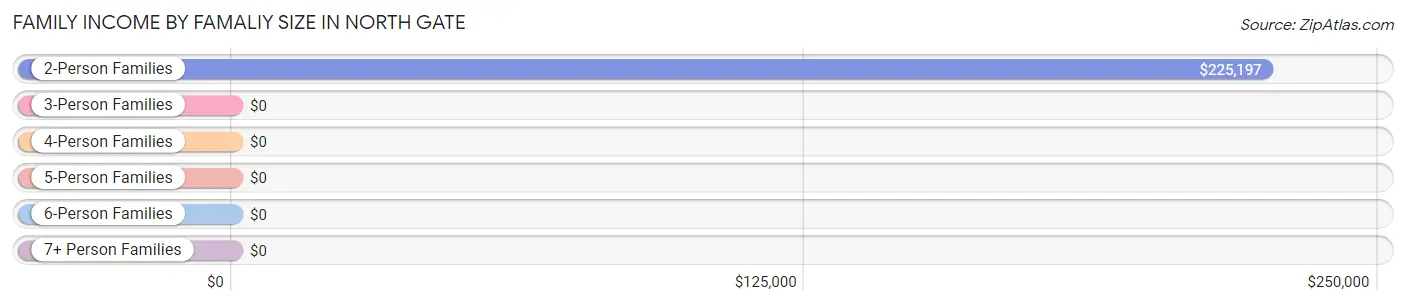
| Income Bracket | # Families | Median Income |
| 2-Person Families | 152 (59.4%) | $225,197 |
| 3-Person Families | 18 (7.0%) | $0 |
| 4-Person Families | 10 (3.9%) | $0 |
| 5-Person Families | 28 (10.9%) | $0 |
| 6-Person Families | 48 (18.8%) | $0 |
| 7+ Person Families | 0 (0.0%) | $0 |
| Total | 256 (100.0%) | $196,429 |
Family Income by Number of Earners in North Gate
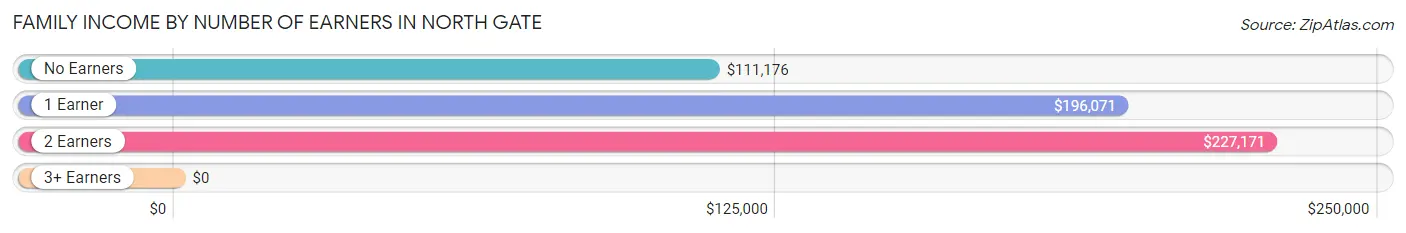
| Number of Earners | # Families | Median Income |
| No Earners | 40 (15.6%) | $111,176 |
| 1 Earner | 130 (50.8%) | $196,071 |
| 2 Earners | 66 (25.8%) | $227,171 |
| 3+ Earners | 20 (7.8%) | $0 |
| Total | 256 (100.0%) | $196,429 |
Household Income in North Gate
Household Income Brackets in North Gate
With 143 households falling in the category, the $200,000+ income range is the most frequent in North Gate, accounting for 50.3% of all households.
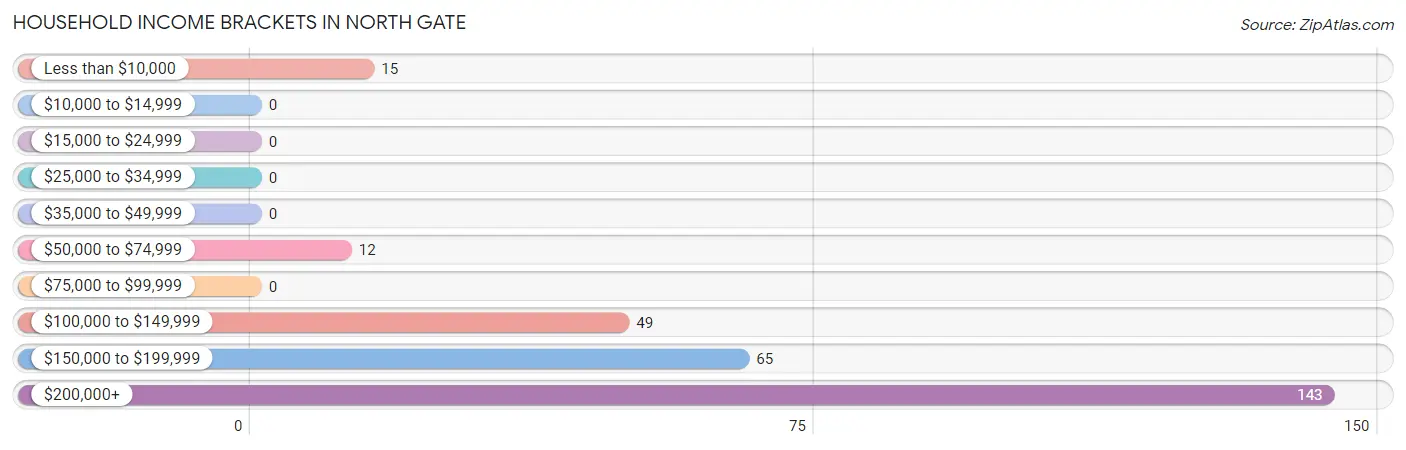
| Income Bracket | # Households | % Households |
| Less than $10,000 | 15 | 5.3% |
| $10,000 to $14,999 | 0 | 0.0% |
| $15,000 to $24,999 | 0 | 0.0% |
| $25,000 to $34,999 | 0 | 0.0% |
| $35,000 to $49,999 | 0 | 0.0% |
| $50,000 to $74,999 | 12 | 4.2% |
| $75,000 to $99,999 | 0 | 0.0% |
| $100,000 to $149,999 | 49 | 17.3% |
| $150,000 to $199,999 | 65 | 22.9% |
| $200,000+ | 143 | 50.4% |
Household Income by Householder Age in North Gate
The median household income in North Gate is $225,066, with the highest median household income of $226,645 found in the 25 to 44 years age bracket for the primary householder. A total of 50 households (17.6%) fall into this category.
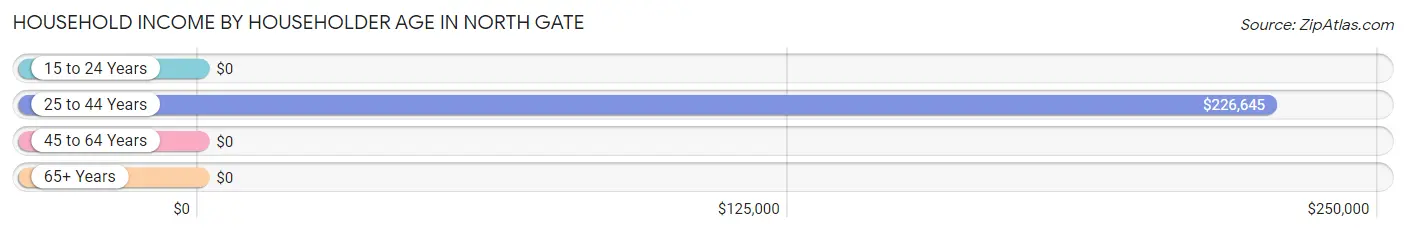
| Income Bracket | # Households | Median Income |
| 15 to 24 Years | 0 (0.0%) | $0 |
| 25 to 44 Years | 50 (17.6%) | $226,645 |
| 45 to 64 Years | 125 (44.0%) | $0 |
| 65+ Years | 109 (38.4%) | $0 |
| Total | 284 (100.0%) | $225,066 |
Poverty in North Gate
Income Below Poverty by Sex and Age in North Gate
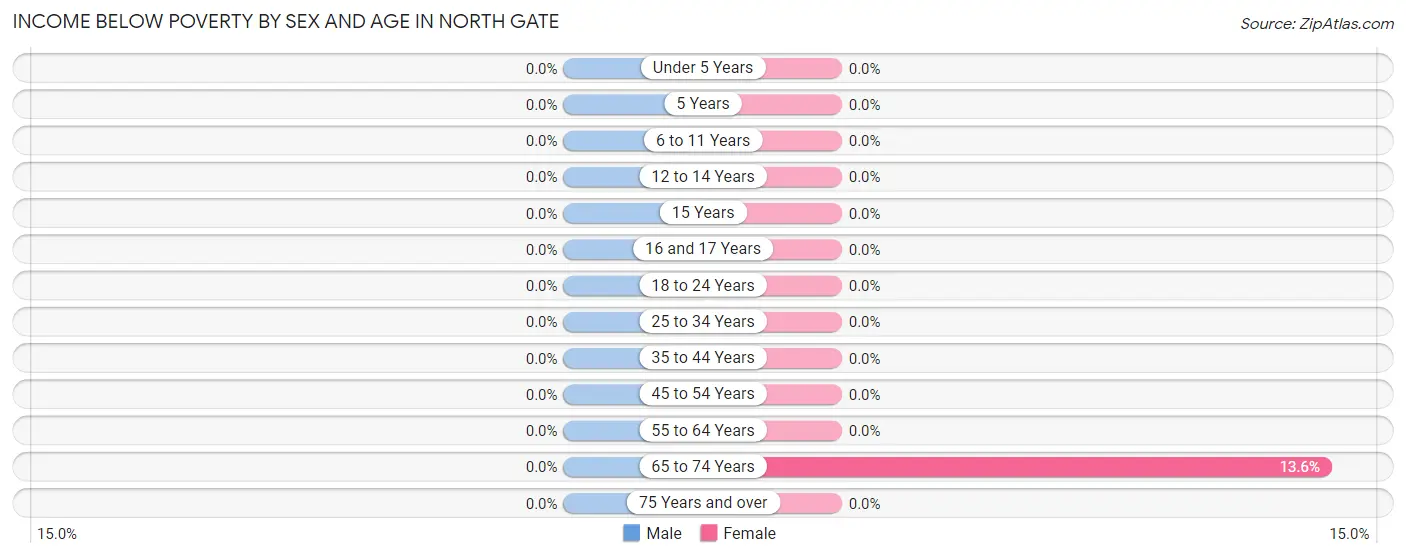
| Age Bracket | Male | Female |
| Under 5 Years | 0 (0.0%) | 0 (0.0%) |
| 5 Years | 0 (0.0%) | 0 (0.0%) |
| 6 to 11 Years | 0 (0.0%) | 0 (0.0%) |
| 12 to 14 Years | 0 (0.0%) | 0 (0.0%) |
| 15 Years | 0 (0.0%) | 0 (0.0%) |
| 16 and 17 Years | 0 (0.0%) | 0 (0.0%) |
| 18 to 24 Years | 0 (0.0%) | 0 (0.0%) |
| 25 to 34 Years | 0 (0.0%) | 0 (0.0%) |
| 35 to 44 Years | 0 (0.0%) | 0 (0.0%) |
| 45 to 54 Years | 0 (0.0%) | 0 (0.0%) |
| 55 to 64 Years | 0 (0.0%) | 0 (0.0%) |
| 65 to 74 Years | 0 (0.0%) | 15 (13.6%) |
| 75 Years and over | 0 (0.0%) | 0 (0.0%) |
| Total | 0 (0.0%) | 15 (3.4%) |
Income Above Poverty by Sex and Age in North Gate
According to the poverty statistics in North Gate, males aged under 5 years and females aged under 5 years are the age groups that are most secure financially, with 100.0% of males and 100.0% of females in these age groups living above the poverty line.
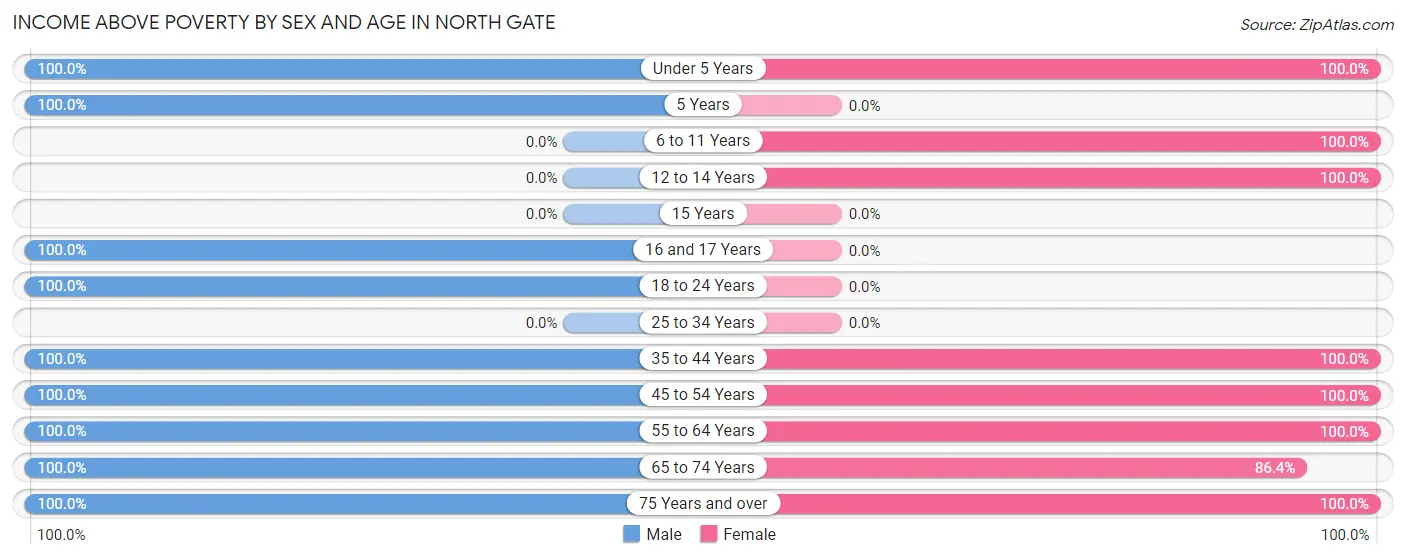
| Age Bracket | Male | Female |
| Under 5 Years | 23 (100.0%) | 11 (100.0%) |
| 5 Years | 4 (100.0%) | 0 (0.0%) |
| 6 to 11 Years | 0 (0.0%) | 52 (100.0%) |
| 12 to 14 Years | 0 (0.0%) | 52 (100.0%) |
| 15 Years | 0 (0.0%) | 0 (0.0%) |
| 16 and 17 Years | 40 (100.0%) | 0 (0.0%) |
| 18 to 24 Years | 77 (100.0%) | 0 (0.0%) |
| 25 to 34 Years | 0 (0.0%) | 0 (0.0%) |
| 35 to 44 Years | 8 (100.0%) | 88 (100.0%) |
| 45 to 54 Years | 106 (100.0%) | 69 (100.0%) |
| 55 to 64 Years | 86 (100.0%) | 32 (100.0%) |
| 65 to 74 Years | 77 (100.0%) | 95 (86.4%) |
| 75 Years and over | 40 (100.0%) | 25 (100.0%) |
| Total | 461 (100.0%) | 424 (96.6%) |
Income Below Poverty Among Married-Couple Families in North Gate
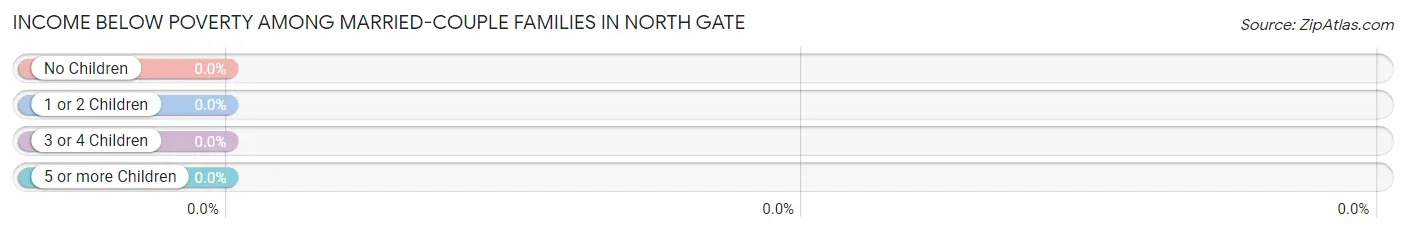
| Children | Above Poverty | Below Poverty |
| No Children | 102 (100.0%) | 0 (0.0%) |
| 1 or 2 Children | 92 (100.0%) | 0 (0.0%) |
| 3 or 4 Children | 12 (100.0%) | 0 (0.0%) |
| 5 or more Children | 0 (0.0%) | 0 (0.0%) |
| Total | 206 (100.0%) | 0 (0.0%) |
Income Below Poverty Among Single-Parent Households in North Gate
| Children | Single Father | Single Mother |
| No Children | 0 (0.0%) | 0 (0.0%) |
| 1 or 2 Children | 0 (0.0%) | 0 (0.0%) |
| 3 or 4 Children | 0 (0.0%) | 0 (0.0%) |
| 5 or more Children | 0 (0.0%) | 0 (0.0%) |
| Total | 0 (0.0%) | 0 (0.0%) |
Income Below Poverty Among Married-Couple vs Single-Parent Households in North Gate
| Children | Married-Couple Families | Single-Parent Households |
| No Children | 0 (0.0%) | 0 (0.0%) |
| 1 or 2 Children | 0 (0.0%) | 0 (0.0%) |
| 3 or 4 Children | 0 (0.0%) | 0 (0.0%) |
| 5 or more Children | 0 (0.0%) | 0 (0.0%) |
| Total | 0 (0.0%) | 0 (0.0%) |
Race in North Gate
The most populous races in North Gate are White / Caucasian (778 | 86.4%), Asian (63 | 7.0%), and Two or more Races (59 | 6.6%).
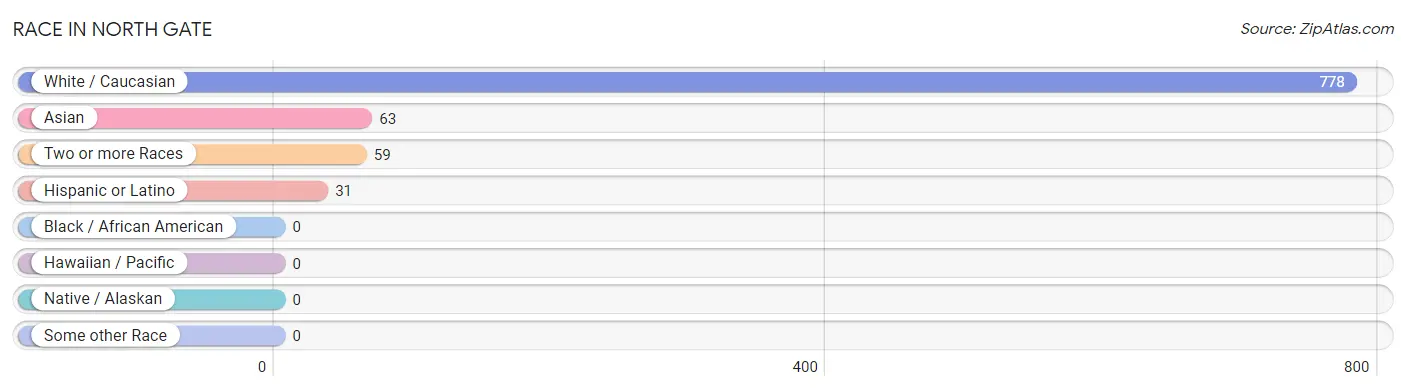
| Race | # Population | % Population |
| Asian | 63 | 7.0% |
| Black / African American | 0 | 0.0% |
| Hawaiian / Pacific | 0 | 0.0% |
| Hispanic or Latino | 31 | 3.4% |
| Native / Alaskan | 0 | 0.0% |
| White / Caucasian | 778 | 86.4% |
| Two or more Races | 59 | 6.6% |
| Some other Race | 0 | 0.0% |
| Total | 900 | 100.0% |
Ancestry in North Gate
The most populous ancestries reported in North Gate are Ukrainian (140 | 15.6%), German (107 | 11.9%), American (97 | 10.8%), Swedish (70 | 7.8%), and Indian (Asian) (63 | 7.0%), together accounting for 53.0% of all North Gate residents.
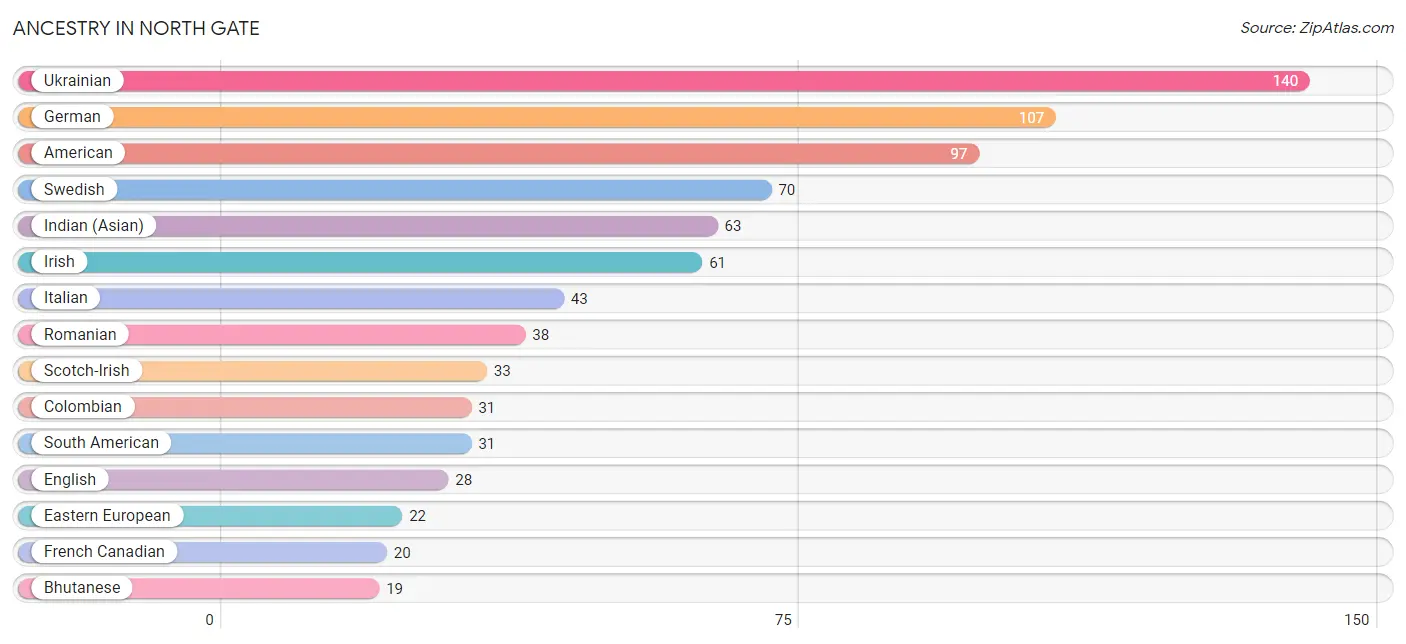
| Ancestry | # Population | % Population |
| American | 97 | 10.8% |
| Bhutanese | 19 | 2.1% |
| British | 17 | 1.9% |
| Canadian | 17 | 1.9% |
| Colombian | 31 | 3.4% |
| Danish | 11 | 1.2% |
| Dutch | 11 | 1.2% |
| Eastern European | 22 | 2.4% |
| English | 28 | 3.1% |
| French Canadian | 20 | 2.2% |
| German | 107 | 11.9% |
| Indian (Asian) | 63 | 7.0% |
| Irish | 61 | 6.8% |
| Italian | 43 | 4.8% |
| Romanian | 38 | 4.2% |
| Scotch-Irish | 33 | 3.7% |
| South American | 31 | 3.4% |
| Swedish | 70 | 7.8% |
| Ukrainian | 140 | 15.6% | View All 19 Rows |
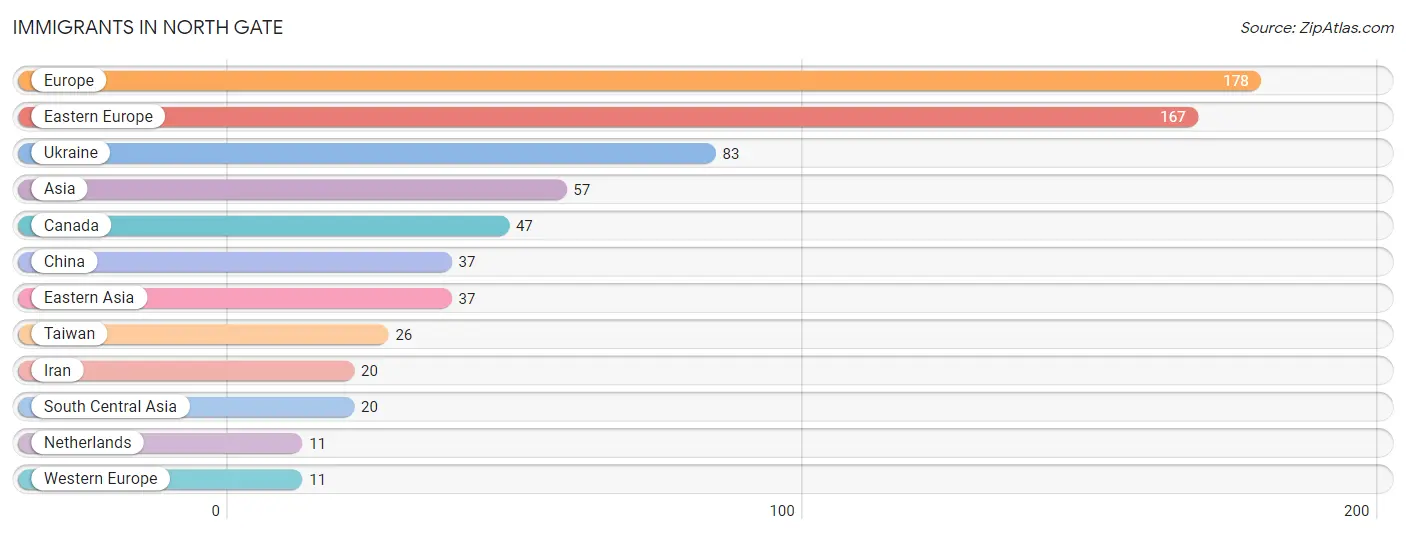
Immigrants in North Gate
The most numerous immigrant groups reported in North Gate came from Europe (178 | 19.8%), Eastern Europe (167 | 18.6%), Ukraine (83 | 9.2%), Asia (57 | 6.3%), and Canada (47 | 5.2%), together accounting for 59.1% of all North Gate residents.
| Immigration Origin | # Population | % Population |
| Asia | 57 | 6.3% |
| Canada | 47 | 5.2% |
| China | 37 | 4.1% |
| Eastern Asia | 37 | 4.1% |
| Eastern Europe | 167 | 18.6% |
| Europe | 178 | 19.8% |
| Iran | 20 | 2.2% |
| Netherlands | 11 | 1.2% |
| South Central Asia | 20 | 2.2% |
| Taiwan | 26 | 2.9% |
| Ukraine | 83 | 9.2% |
| Western Europe | 11 | 1.2% | View All 12 Rows |
Sex and Age in North Gate
Sex and Age in North Gate
The most populous age groups in North Gate are 50 to 54 Years (96 | 20.8%) for men and 65 to 69 Years (85 | 19.4%) for women.
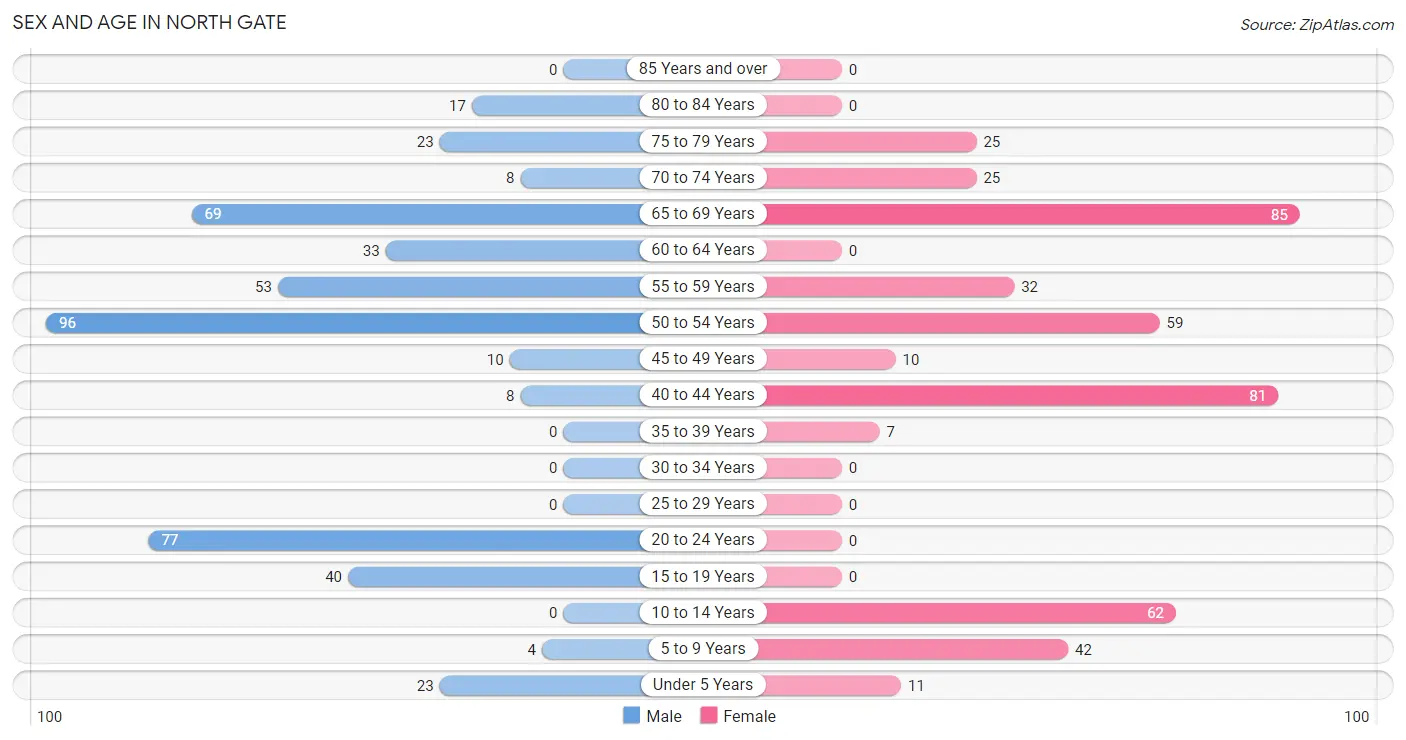
| Age Bracket | Male | Female |
| Under 5 Years | 23 (5.0%) | 11 (2.5%) |
| 5 to 9 Years | 4 (0.9%) | 42 (9.6%) |
| 10 to 14 Years | 0 (0.0%) | 62 (14.1%) |
| 15 to 19 Years | 40 (8.7%) | 0 (0.0%) |
| 20 to 24 Years | 77 (16.7%) | 0 (0.0%) |
| 25 to 29 Years | 0 (0.0%) | 0 (0.0%) |
| 30 to 34 Years | 0 (0.0%) | 0 (0.0%) |
| 35 to 39 Years | 0 (0.0%) | 7 (1.6%) |
| 40 to 44 Years | 8 (1.7%) | 81 (18.4%) |
| 45 to 49 Years | 10 (2.2%) | 10 (2.3%) |
| 50 to 54 Years | 96 (20.8%) | 59 (13.4%) |
| 55 to 59 Years | 53 (11.5%) | 32 (7.3%) |
| 60 to 64 Years | 33 (7.2%) | 0 (0.0%) |
| 65 to 69 Years | 69 (15.0%) | 85 (19.4%) |
| 70 to 74 Years | 8 (1.7%) | 25 (5.7%) |
| 75 to 79 Years | 23 (5.0%) | 25 (5.7%) |
| 80 to 84 Years | 17 (3.7%) | 0 (0.0%) |
| 85 Years and over | 0 (0.0%) | 0 (0.0%) |
| Total | 461 (100.0%) | 439 (100.0%) |
Families and Households in North Gate
Median Family Size in North Gate
The median family size in North Gate is 3.29 persons per family, with married-couple families (206 | 80.5%) accounting for the largest median family size of 3.54 persons per family. On the other hand, single male/father families (12 | 4.7%) represent the smallest median family size with 2.17 persons per family.
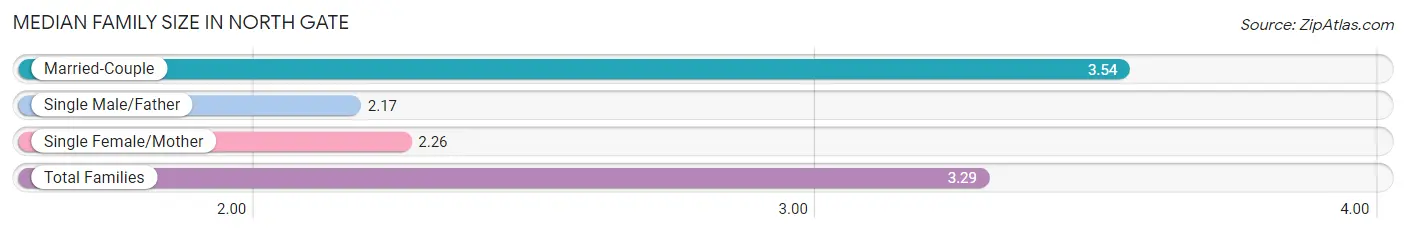
| Family Type | # Families | Family Size |
| Married-Couple | 206 (80.5%) | 3.54 |
| Single Male/Father | 12 (4.7%) | 2.17 |
| Single Female/Mother | 38 (14.8%) | 2.26 |
| Total Families | 256 (100.0%) | 3.29 |
Median Household Size in North Gate
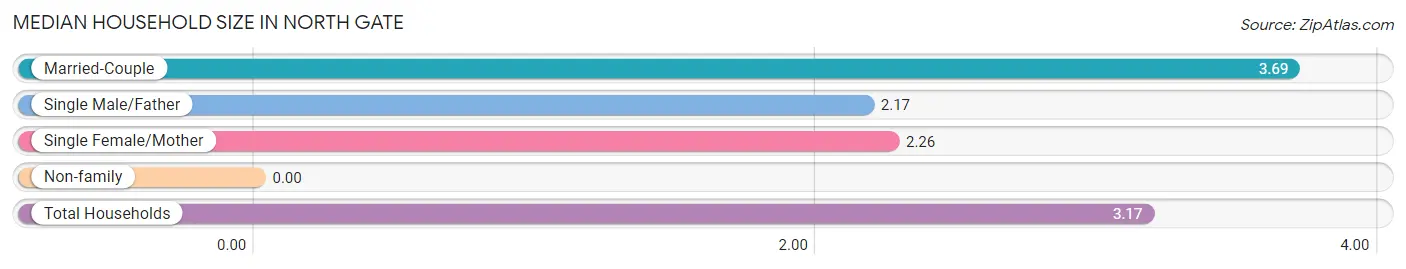
| Household Type | # Households | Household Size |
| Married-Couple | 206 (72.5%) | 3.69 |
| Single Male/Father | 12 (4.2%) | 2.17 |
| Single Female/Mother | 38 (13.4%) | 2.26 |
| Non-family | 28 (9.9%) | - |
| Total Households | 284 (100.0%) | 3.17 |
Household Size by Marriage Status in North Gate
Out of a total of 284 households in North Gate, 256 (90.1%) are family households, while 28 (9.9%) are nonfamily households. The most numerous type of family households are 2-person households, comprising 141, and the most common type of nonfamily households are 1-person households, comprising 28.
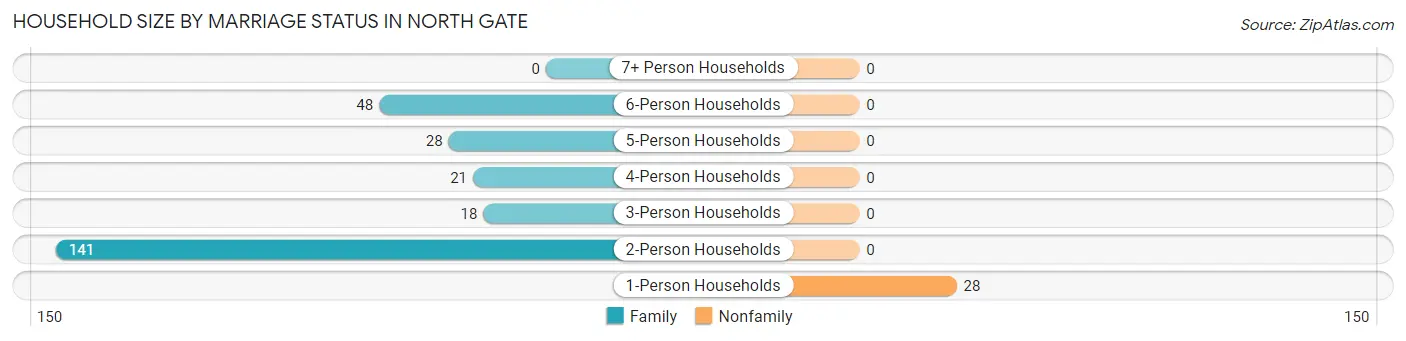
| Household Size | Family Households | Nonfamily Households |
| 1-Person Households | - | 28 (9.9%) |
| 2-Person Households | 141 (49.6%) | 0 (0.0%) |
| 3-Person Households | 18 (6.3%) | 0 (0.0%) |
| 4-Person Households | 21 (7.4%) | 0 (0.0%) |
| 5-Person Households | 28 (9.9%) | 0 (0.0%) |
| 6-Person Households | 48 (16.9%) | 0 (0.0%) |
| 7+ Person Households | 0 (0.0%) | 0 (0.0%) |
| Total | 256 (90.1%) | 28 (9.9%) |
Female Fertility in North Gate
Fertility by Age in North Gate
Average fertility rate in North Gate is 71.0 births per 1,000 women. Women in the age bracket of 35 to 50 years have the highest fertility rate with 71.0 births per 1,000 women. Women in the age bracket of 35 to 50 years acount for 100.0% of all women with births.
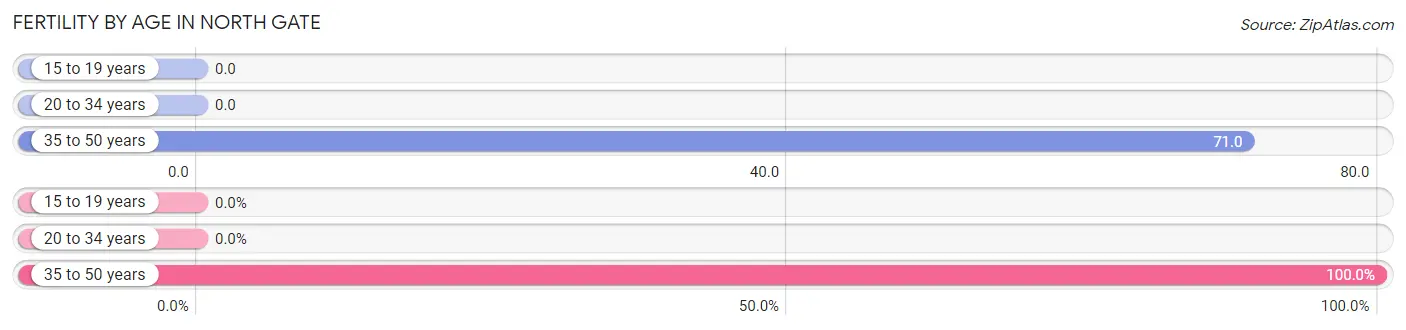
| Age Bracket | Women with Births | Births / 1,000 Women |
| 15 to 19 years | 0 (0.0%) | 0.0 |
| 20 to 34 years | 0 (0.0%) | 0.0 |
| 35 to 50 years | 7 (100.0%) | 71.0 |
| Total | 7 (100.0%) | 71.0 |
Fertility by Age by Marriage Status in North Gate
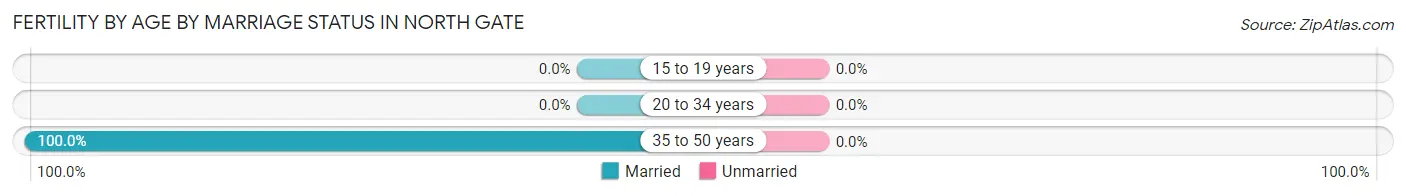
| Age Bracket | Married | Unmarried |
| 15 to 19 years | 0 (0.0%) | 0 (0.0%) |
| 20 to 34 years | 0 (0.0%) | 0 (0.0%) |
| 35 to 50 years | 7 (100.0%) | 0 (0.0%) |
| Total | 7 (100.0%) | 0 (0.0%) |
Fertility by Education in North Gate
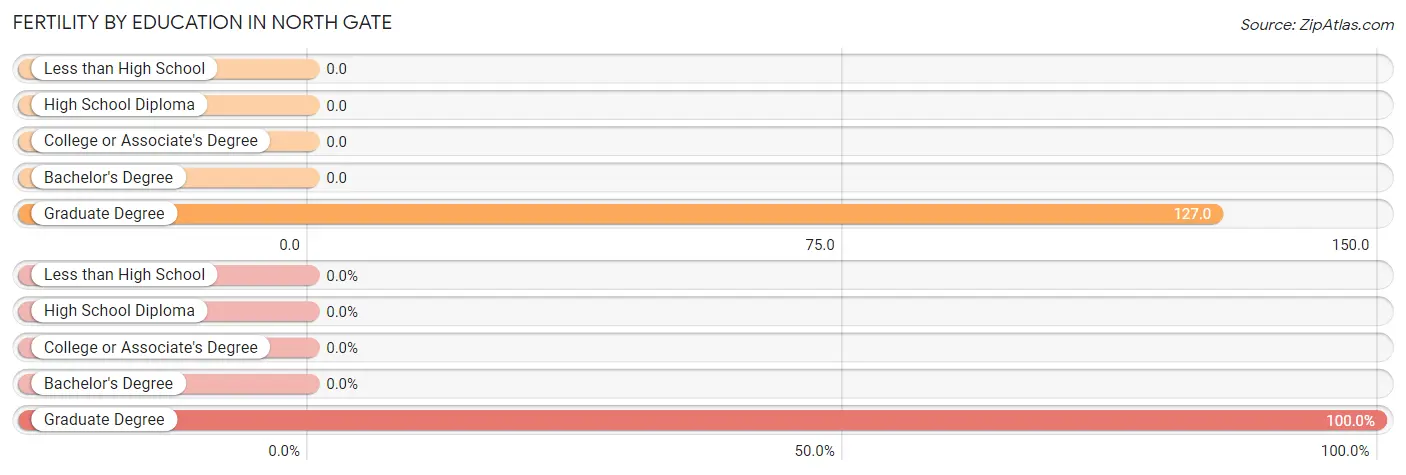
| Educational Attainment | Women with Births | Births / 1,000 Women |
| Less than High School | 0 (0.0%) | 0.0 |
| High School Diploma | 0 (0.0%) | 0.0 |
| College or Associate's Degree | 0 (0.0%) | 0.0 |
| Bachelor's Degree | 0 (0.0%) | 0.0 |
| Graduate Degree | 7 (100.0%) | 127.0 |
| Total | 7 (100.0%) | 71.0 |
Fertility by Education by Marriage Status in North Gate
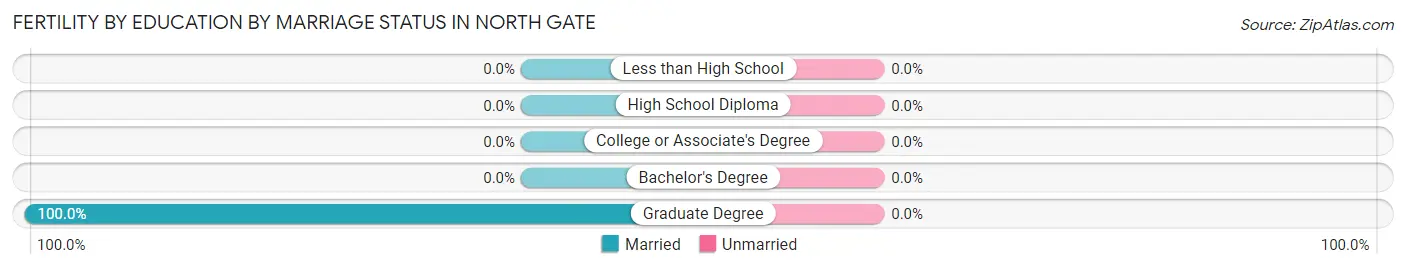
| Educational Attainment | Married | Unmarried |
| Less than High School | 0 (0.0%) | 0 (0.0%) |
| High School Diploma | 0 (0.0%) | 0 (0.0%) |
| College or Associate's Degree | 0 (0.0%) | 0 (0.0%) |
| Bachelor's Degree | 0 (0.0%) | 0 (0.0%) |
| Graduate Degree | 7 (100.0%) | 0 (0.0%) |
| Total | 7 (100.0%) | 0 (0.0%) |
Employment Characteristics in North Gate
Employment by Class of Employer in North Gate
Among the 376 employed individuals in North Gate, private company employees (280 | 74.5%), self-employed (not incorporated) (79 | 21.0%), and not-for-profit organizations (13 | 3.5%) make up the most common classes of employment.
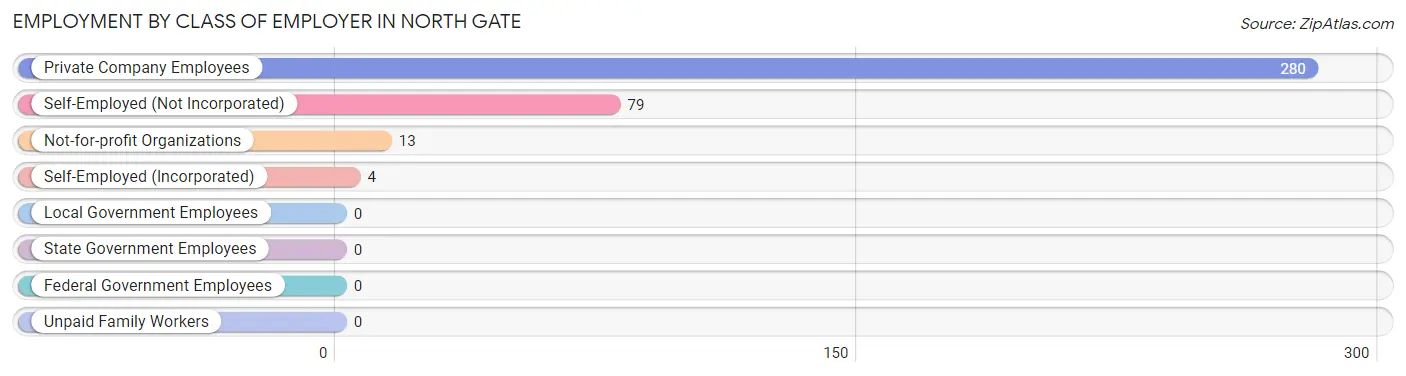
| Employer Class | # Employees | % Employees |
| Private Company Employees | 280 | 74.5% |
| Self-Employed (Incorporated) | 4 | 1.1% |
| Self-Employed (Not Incorporated) | 79 | 21.0% |
| Not-for-profit Organizations | 13 | 3.5% |
| Local Government Employees | 0 | 0.0% |
| State Government Employees | 0 | 0.0% |
| Federal Government Employees | 0 | 0.0% |
| Unpaid Family Workers | 0 | 0.0% |
| Total | 376 | 100.0% |
Employment Status by Age in North Gate
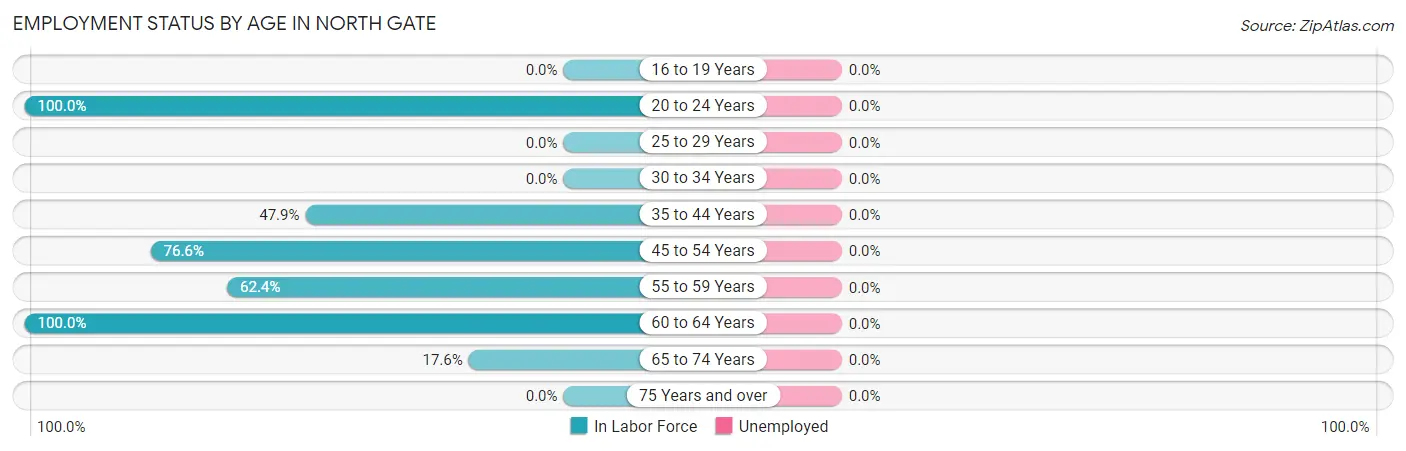
| Age Bracket | In Labor Force | Unemployed |
| 16 to 19 Years | 0 (0.0%) | 0 (0.0%) |
| 20 to 24 Years | 77 (100.0%) | 0 (0.0%) |
| 25 to 29 Years | 0 (0.0%) | 0 (0.0%) |
| 30 to 34 Years | 0 (0.0%) | 0 (0.0%) |
| 35 to 44 Years | 46 (47.9%) | 0 (0.0%) |
| 45 to 54 Years | 134 (76.6%) | 0 (0.0%) |
| 55 to 59 Years | 53 (62.4%) | 0 (0.0%) |
| 60 to 64 Years | 33 (100.0%) | 0 (0.0%) |
| 65 to 74 Years | 33 (17.6%) | 0 (0.0%) |
| 75 Years and over | 0 (0.0%) | 0 (0.0%) |
| Total | 376 (49.6%) | 0 (0.0%) |
Employment Status by Educational Attainment in North Gate
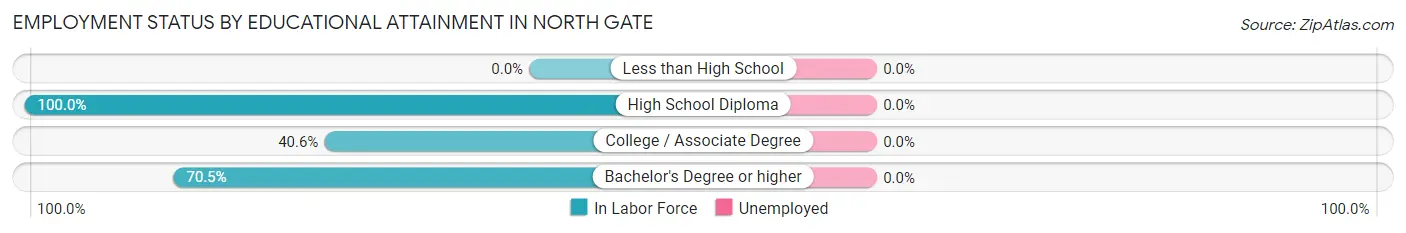
| Educational Attainment | In Labor Force | Unemployed |
| Less than High School | 0 (0.0%) | 0 (0.0%) |
| High School Diploma | 4 (100.0%) | 0 (0.0%) |
| College / Associate Degree | 13 (40.6%) | 0 (0.0%) |
| Bachelor's Degree or higher | 249 (70.5%) | 0 (0.0%) |
| Total | 266 (68.4%) | 0 (0.0%) |
Employment Occupations by Sex in North Gate
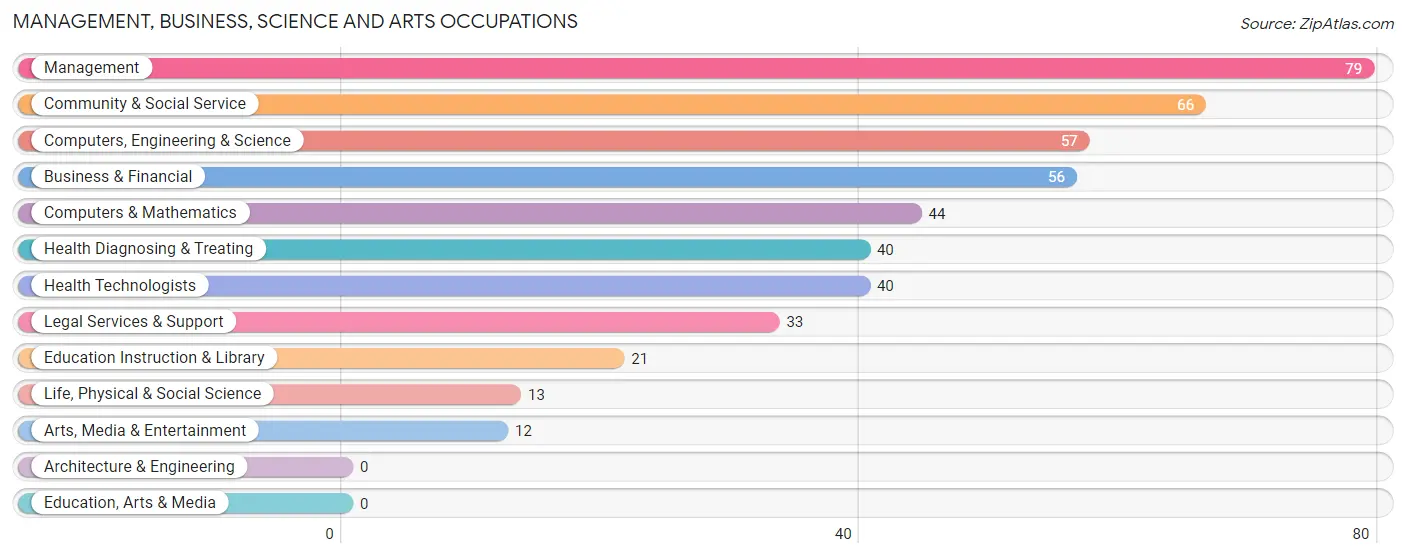
Management, Business, Science and Arts Occupations
The most common Management, Business, Science and Arts occupations in North Gate are Management (79 | 21.0%), Community & Social Service (66 | 17.5%), Computers, Engineering & Science (57 | 15.2%), Business & Financial (56 | 14.9%), and Computers & Mathematics (44 | 11.7%).
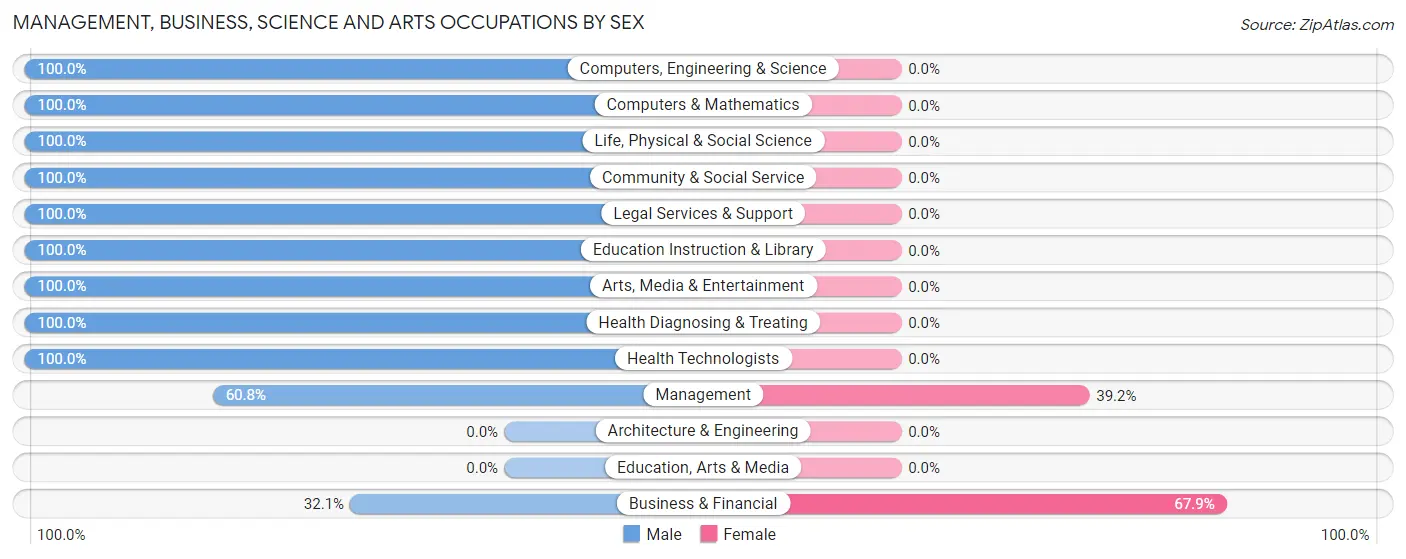
Management, Business, Science and Arts Occupations by Sex
Within the Management, Business, Science and Arts occupations in North Gate, the most male-oriented occupations are Computers, Engineering & Science (100.0%), Computers & Mathematics (100.0%), and Life, Physical & Social Science (100.0%), while the most female-oriented occupations are Business & Financial (67.9%), and Management (39.2%).
| Occupation | Male | Female |
| Management | 48 (60.8%) | 31 (39.2%) |
| Business & Financial | 18 (32.1%) | 38 (67.9%) |
| Computers, Engineering & Science | 57 (100.0%) | 0 (0.0%) |
| Computers & Mathematics | 44 (100.0%) | 0 (0.0%) |
| Architecture & Engineering | 0 (0.0%) | 0 (0.0%) |
| Life, Physical & Social Science | 13 (100.0%) | 0 (0.0%) |
| Community & Social Service | 66 (100.0%) | 0 (0.0%) |
| Education, Arts & Media | 0 (0.0%) | 0 (0.0%) |
| Legal Services & Support | 33 (100.0%) | 0 (0.0%) |
| Education Instruction & Library | 21 (100.0%) | 0 (0.0%) |
| Arts, Media & Entertainment | 12 (100.0%) | 0 (0.0%) |
| Health Diagnosing & Treating | 40 (100.0%) | 0 (0.0%) |
| Health Technologists | 40 (100.0%) | 0 (0.0%) |
| Total (Category) | 229 (76.8%) | 69 (23.2%) |
| Total (Overall) | 289 (76.9%) | 87 (23.1%) |
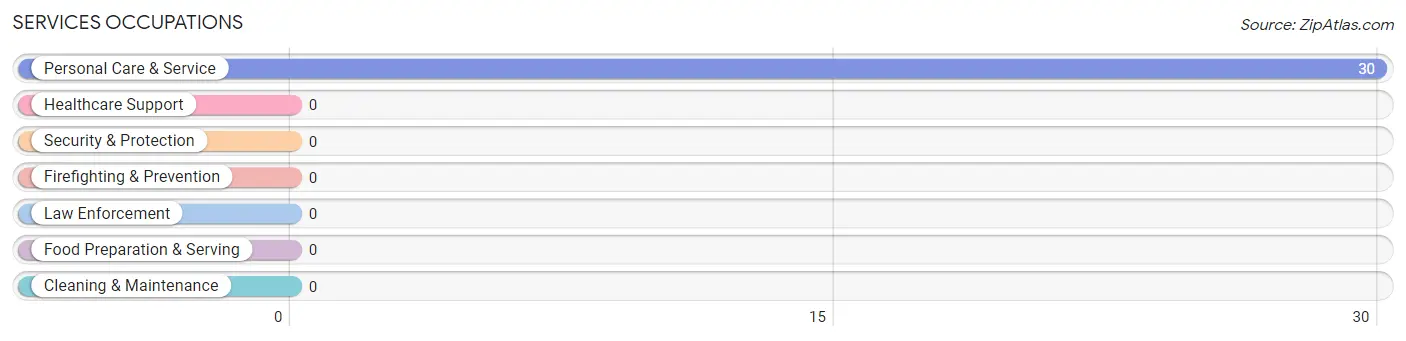
Services Occupations
The most common Services occupations in North Gate are , and Personal Care & Service (30 | 8.0%).
Services Occupations by Sex
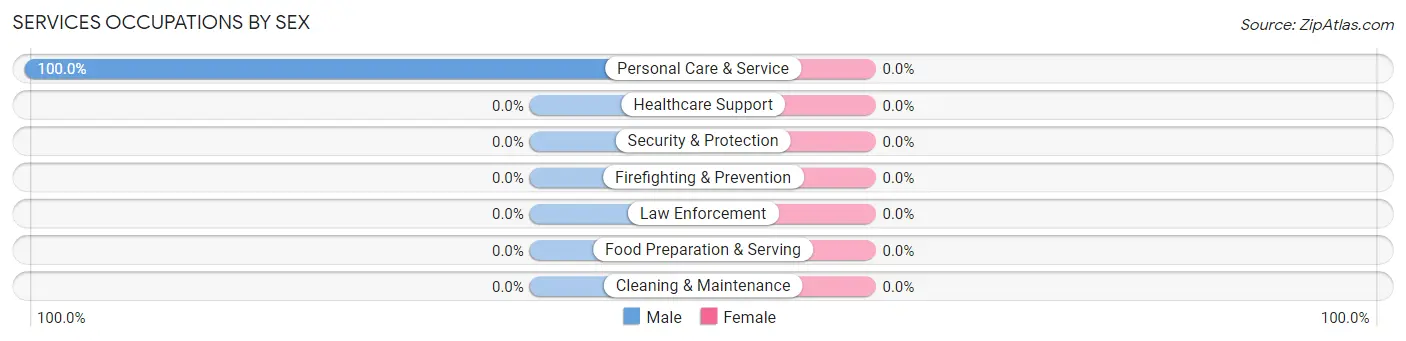
| Occupation | Male | Female |
| Healthcare Support | 0 (0.0%) | 0 (0.0%) |
| Security & Protection | 0 (0.0%) | 0 (0.0%) |
| Firefighting & Prevention | 0 (0.0%) | 0 (0.0%) |
| Law Enforcement | 0 (0.0%) | 0 (0.0%) |
| Food Preparation & Serving | 0 (0.0%) | 0 (0.0%) |
| Cleaning & Maintenance | 0 (0.0%) | 0 (0.0%) |
| Personal Care & Service | 30 (100.0%) | 0 (0.0%) |
| Total (Category) | 30 (100.0%) | 0 (0.0%) |
| Total (Overall) | 289 (76.9%) | 87 (23.1%) |
Sales and Office Occupations
The most common Sales and Office occupations in North Gate are Sales & Related (30 | 8.0%), and Office & Administration (18 | 4.8%).
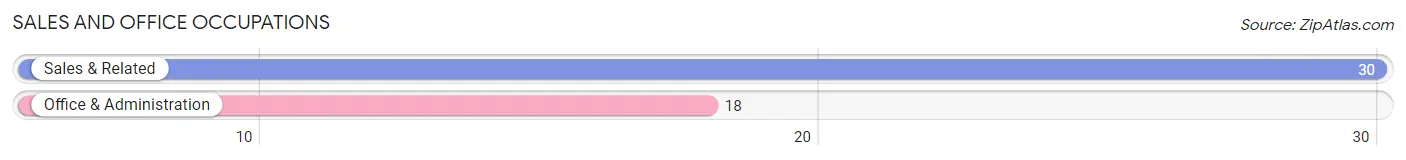
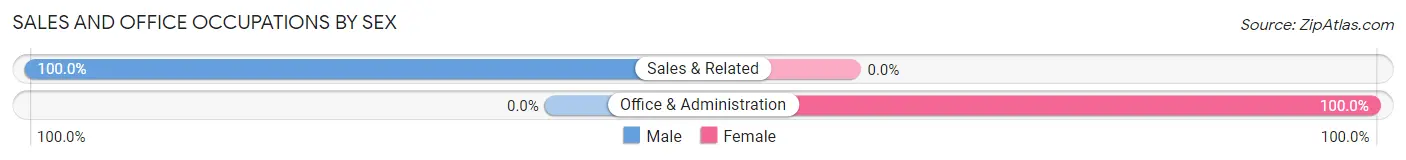
Sales and Office Occupations by Sex
| Occupation | Male | Female |
| Sales & Related | 30 (100.0%) | 0 (0.0%) |
| Office & Administration | 0 (0.0%) | 18 (100.0%) |
| Total (Category) | 30 (62.5%) | 18 (37.5%) |
| Total (Overall) | 289 (76.9%) | 87 (23.1%) |
Natural Resources, Construction and Maintenance Occupations
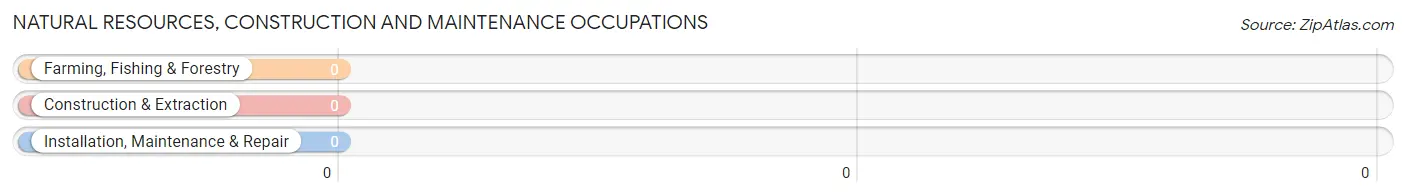
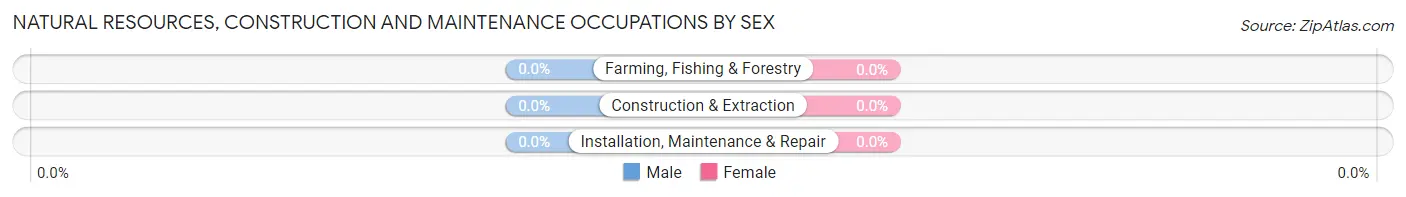
Natural Resources, Construction and Maintenance Occupations by Sex
| Occupation | Male | Female |
| Farming, Fishing & Forestry | 0 (0.0%) | 0 (0.0%) |
| Construction & Extraction | 0 (0.0%) | 0 (0.0%) |
| Installation, Maintenance & Repair | 0 (0.0%) | 0 (0.0%) |
| Total (Category) | 0 (0.0%) | 0 (0.0%) |
| Total (Overall) | 289 (76.9%) | 87 (23.1%) |
Production, Transportation and Moving Occupations
Production, Transportation and Moving Occupations by Sex
| Occupation | Male | Female |
| Production | 0 (0.0%) | 0 (0.0%) |
| Transportation | 0 (0.0%) | 0 (0.0%) |
| Material Moving | 0 (0.0%) | 0 (0.0%) |
| Total (Category) | 0 (0.0%) | 0 (0.0%) |
| Total (Overall) | 289 (76.9%) | 87 (23.1%) |
Employment Industries by Sex in North Gate
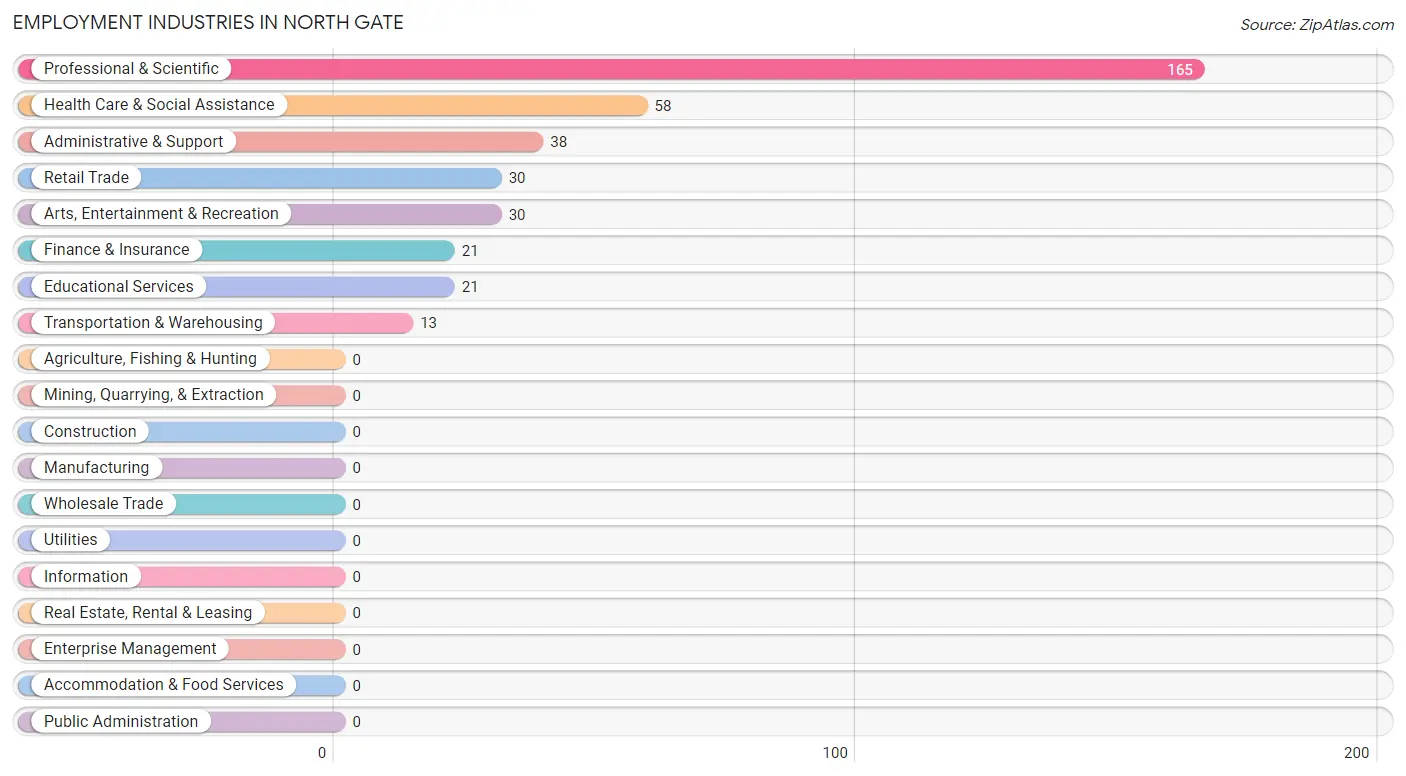
Employment Industries in North Gate
The major employment industries in North Gate include Professional & Scientific (165 | 43.9%), Health Care & Social Assistance (58 | 15.4%), Administrative & Support (38 | 10.1%), Retail Trade (30 | 8.0%), and Arts, Entertainment & Recreation (30 | 8.0%).
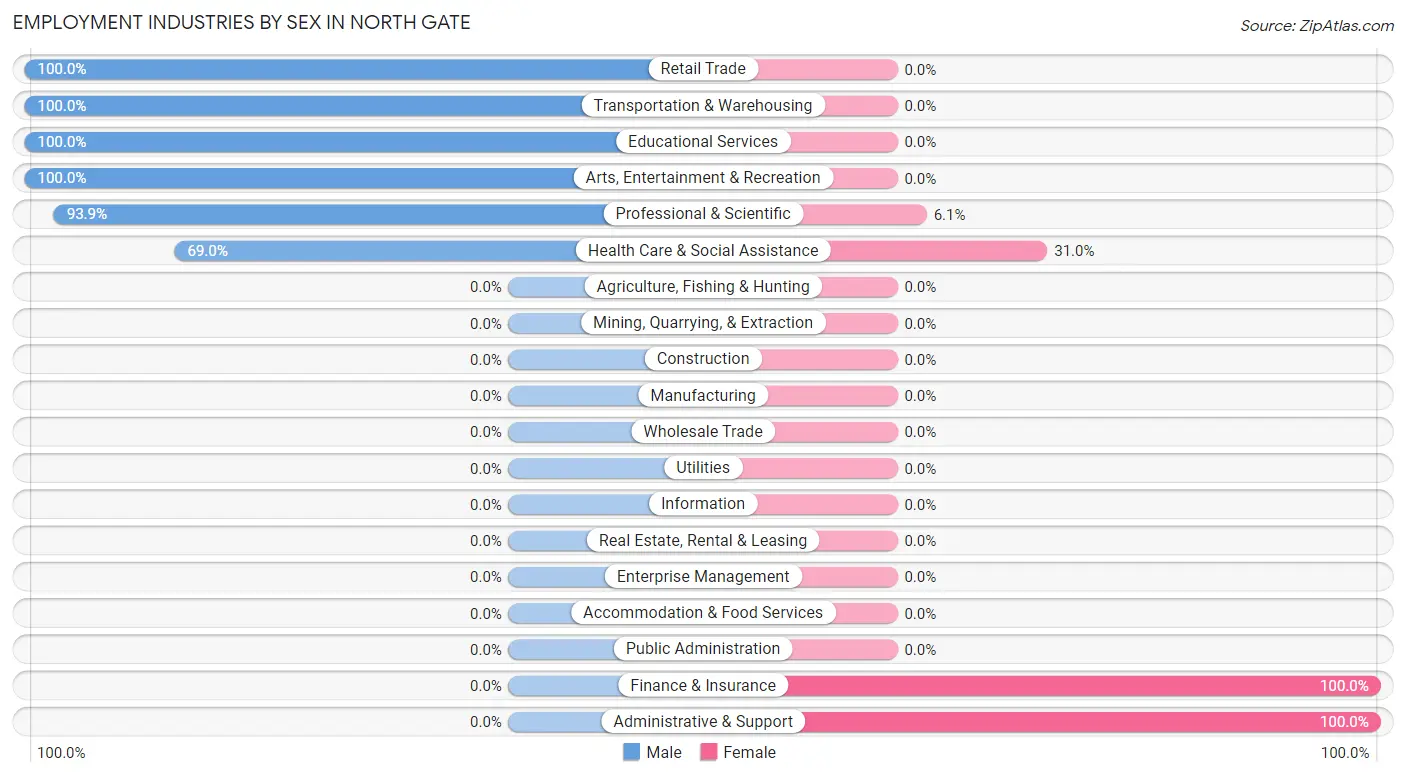
Employment Industries by Sex in North Gate
The North Gate industries that see more men than women are Retail Trade (100.0%), Transportation & Warehousing (100.0%), and Educational Services (100.0%), whereas the industries that tend to have a higher number of women are Finance & Insurance (100.0%), Administrative & Support (100.0%), and Health Care & Social Assistance (31.0%).
| Industry | Male | Female |
| Agriculture, Fishing & Hunting | 0 (0.0%) | 0 (0.0%) |
| Mining, Quarrying, & Extraction | 0 (0.0%) | 0 (0.0%) |
| Construction | 0 (0.0%) | 0 (0.0%) |
| Manufacturing | 0 (0.0%) | 0 (0.0%) |
| Wholesale Trade | 0 (0.0%) | 0 (0.0%) |
| Retail Trade | 30 (100.0%) | 0 (0.0%) |
| Transportation & Warehousing | 13 (100.0%) | 0 (0.0%) |
| Utilities | 0 (0.0%) | 0 (0.0%) |
| Information | 0 (0.0%) | 0 (0.0%) |
| Finance & Insurance | 0 (0.0%) | 21 (100.0%) |
| Real Estate, Rental & Leasing | 0 (0.0%) | 0 (0.0%) |
| Professional & Scientific | 155 (93.9%) | 10 (6.1%) |
| Enterprise Management | 0 (0.0%) | 0 (0.0%) |
| Administrative & Support | 0 (0.0%) | 38 (100.0%) |
| Educational Services | 21 (100.0%) | 0 (0.0%) |
| Health Care & Social Assistance | 40 (69.0%) | 18 (31.0%) |
| Arts, Entertainment & Recreation | 30 (100.0%) | 0 (0.0%) |
| Accommodation & Food Services | 0 (0.0%) | 0 (0.0%) |
| Public Administration | 0 (0.0%) | 0 (0.0%) |
| Total | 289 (76.9%) | 87 (23.1%) |
Education in North Gate
School Enrollment in North Gate
The most common levels of schooling among the 216 students in North Gate are college / undergraduate (60 | 27.8%), middle school (52 | 24.1%), and elementary school (42 | 19.4%).
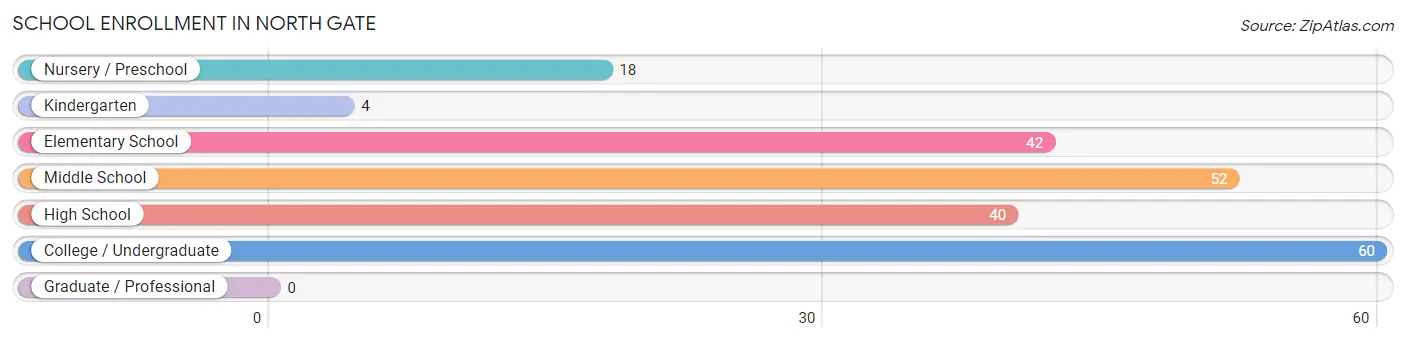
| School Level | # Students | % Students |
| Nursery / Preschool | 18 | 8.3% |
| Kindergarten | 4 | 1.8% |
| Elementary School | 42 | 19.4% |
| Middle School | 52 | 24.1% |
| High School | 40 | 18.5% |
| College / Undergraduate | 60 | 27.8% |
| Graduate / Professional | 0 | 0.0% |
| Total | 216 | 100.0% |
School Enrollment by Age by Funding Source in North Gate
Out of a total of 216 students who are enrolled in schools in North Gate, 54 (25.0%) attend a private institution, while the remaining 162 (75.0%) are enrolled in public schools. The age group of 3 to 4 year olds has the highest likelihood of being enrolled in private schools, with 18 (100.0% in the age bracket) enrolled. Conversely, the age group of 10 to 14 year olds has the lowest likelihood of being enrolled in a private school, with 52 (100.0% in the age bracket) attending a public institution.
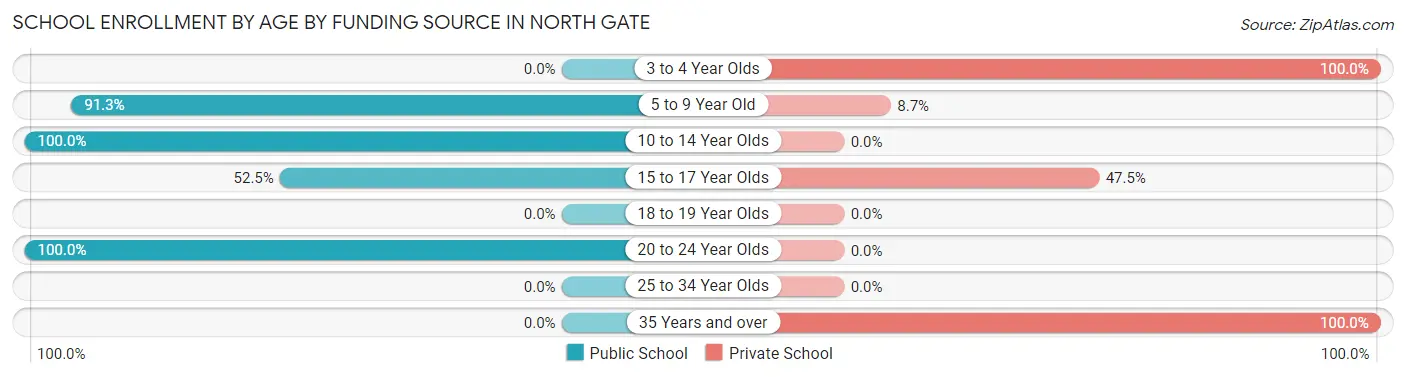
| Age Bracket | Public School | Private School |
| 3 to 4 Year Olds | 0 (0.0%) | 18 (100.0%) |
| 5 to 9 Year Old | 42 (91.3%) | 4 (8.7%) |
| 10 to 14 Year Olds | 52 (100.0%) | 0 (0.0%) |
| 15 to 17 Year Olds | 21 (52.5%) | 19 (47.5%) |
| 18 to 19 Year Olds | 0 (0.0%) | 0 (0.0%) |
| 20 to 24 Year Olds | 47 (100.0%) | 0 (0.0%) |
| 25 to 34 Year Olds | 0 (0.0%) | 0 (0.0%) |
| 35 Years and over | 0 (0.0%) | 13 (100.0%) |
| Total | 162 (75.0%) | 54 (25.0%) |
Educational Attainment by Field of Study in North Gate
Business (150 | 26.3%), computers & mathematics (98 | 17.2%), science & technology (63 | 11.0%), literature & languages (40 | 7.0%), and communications (40 | 7.0%) are the most common fields of study among 571 individuals in North Gate who have obtained a bachelor's degree or higher.
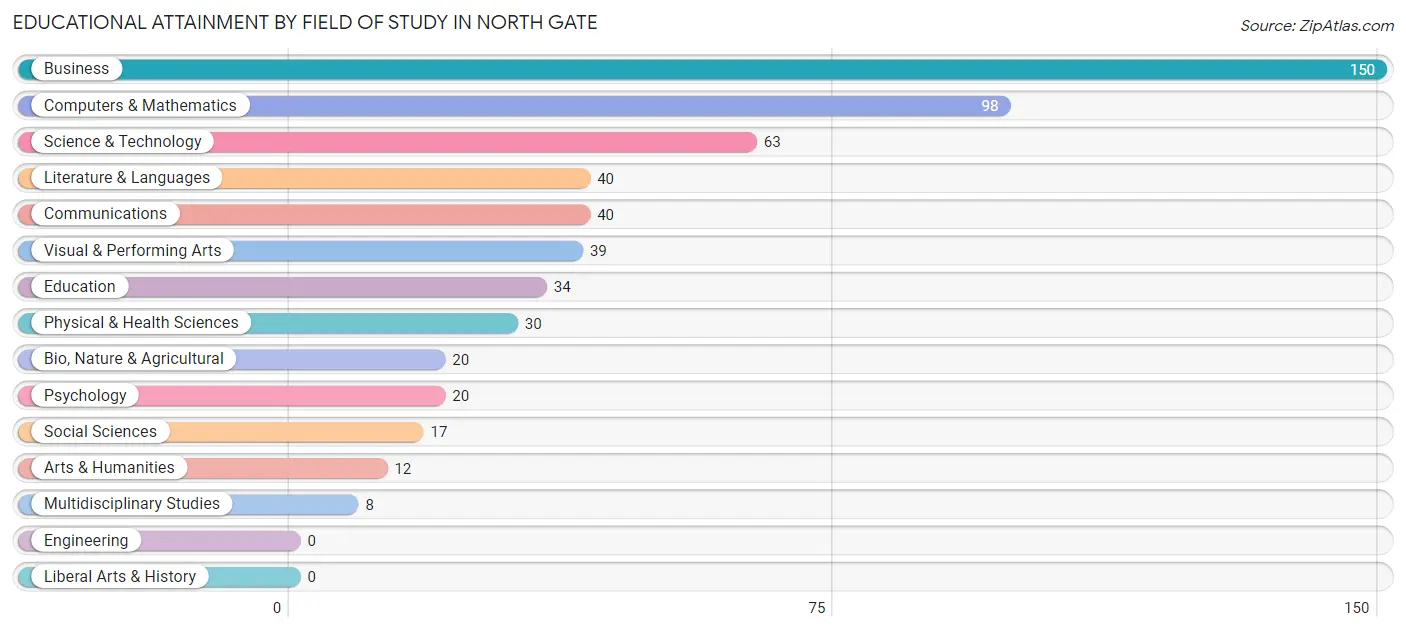
| Field of Study | # Graduates | % Graduates |
| Computers & Mathematics | 98 | 17.2% |
| Bio, Nature & Agricultural | 20 | 3.5% |
| Physical & Health Sciences | 30 | 5.2% |
| Psychology | 20 | 3.5% |
| Social Sciences | 17 | 3.0% |
| Engineering | 0 | 0.0% |
| Multidisciplinary Studies | 8 | 1.4% |
| Science & Technology | 63 | 11.0% |
| Business | 150 | 26.3% |
| Education | 34 | 5.9% |
| Literature & Languages | 40 | 7.0% |
| Liberal Arts & History | 0 | 0.0% |
| Visual & Performing Arts | 39 | 6.8% |
| Communications | 40 | 7.0% |
| Arts & Humanities | 12 | 2.1% |
| Total | 571 | 100.0% |
Transportation & Commute in North Gate
Vehicle Availability by Sex in North Gate
The most prevalent vehicle ownership categories in North Gate are males with 2 vehicles (102, accounting for 35.3%) and females with 2 vehicles (69, making up 117.2%).
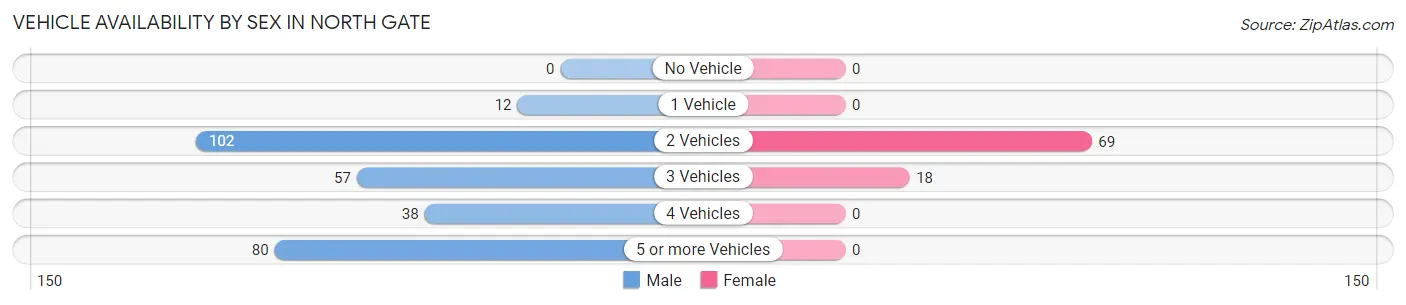
| Vehicles Available | Male | Female |
| No Vehicle | 0 (0.0%) | 0 (0.0%) |
| 1 Vehicle | 12 (4.2%) | 0 (0.0%) |
| 2 Vehicles | 102 (35.3%) | 69 (79.3%) |
| 3 Vehicles | 57 (19.7%) | 18 (20.7%) |
| 4 Vehicles | 38 (13.2%) | 0 (0.0%) |
| 5 or more Vehicles | 80 (27.7%) | 0 (0.0%) |
| Total | 289 (100.0%) | 87 (100.0%) |
Commute Time in North Gate
The most frequently occuring commute durations in North Gate are 10 to 14 minutes (115 commuters, 33.1%), 35 to 39 minutes (71 commuters, 20.5%), and 25 to 29 minutes (48 commuters, 13.8%).
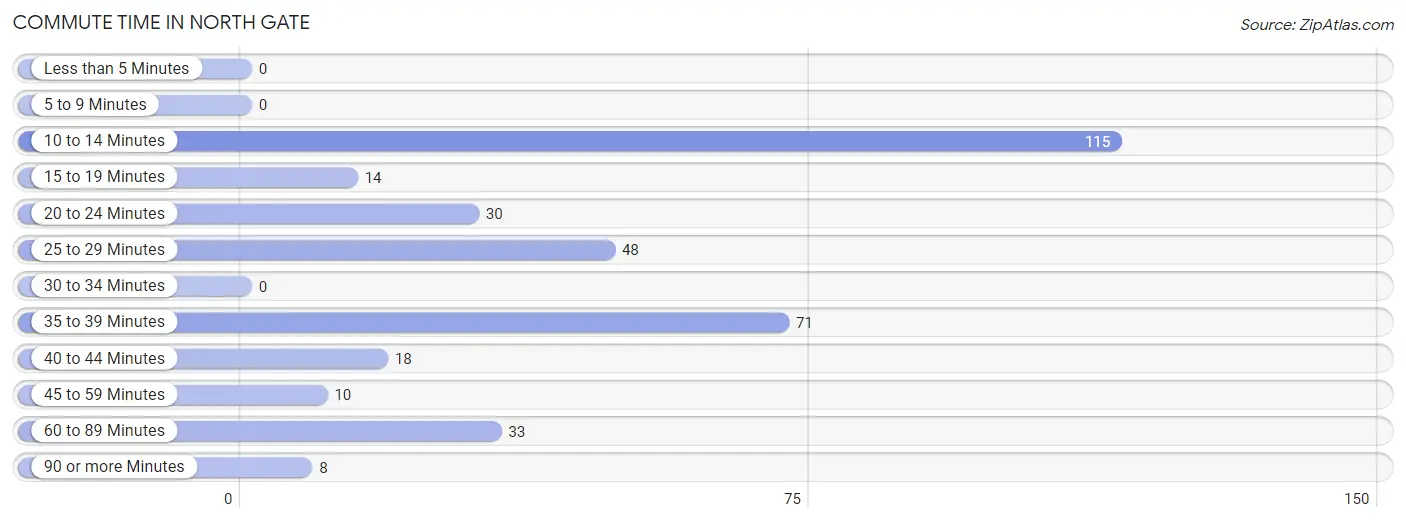
| Commute Time | # Commuters | % Commuters |
| Less than 5 Minutes | 0 | 0.0% |
| 5 to 9 Minutes | 0 | 0.0% |
| 10 to 14 Minutes | 115 | 33.1% |
| 15 to 19 Minutes | 14 | 4.0% |
| 20 to 24 Minutes | 30 | 8.6% |
| 25 to 29 Minutes | 48 | 13.8% |
| 30 to 34 Minutes | 0 | 0.0% |
| 35 to 39 Minutes | 71 | 20.5% |
| 40 to 44 Minutes | 18 | 5.2% |
| 45 to 59 Minutes | 10 | 2.9% |
| 60 to 89 Minutes | 33 | 9.5% |
| 90 or more Minutes | 8 | 2.3% |
Commute Time by Sex in North Gate
The most common commute times in North Gate are 10 to 14 minutes (94 commuters, 36.1%) for males and 35 to 39 minutes (38 commuters, 43.7%) for females.
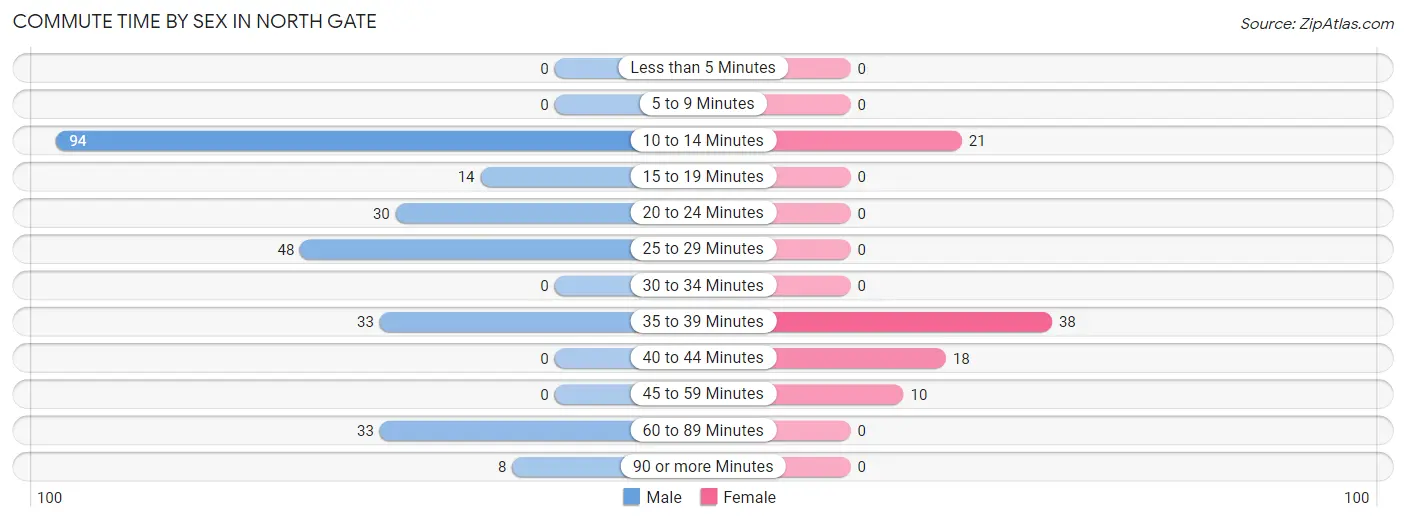
| Commute Time | Male | Female |
| Less than 5 Minutes | 0 (0.0%) | 0 (0.0%) |
| 5 to 9 Minutes | 0 (0.0%) | 0 (0.0%) |
| 10 to 14 Minutes | 94 (36.1%) | 21 (24.1%) |
| 15 to 19 Minutes | 14 (5.4%) | 0 (0.0%) |
| 20 to 24 Minutes | 30 (11.5%) | 0 (0.0%) |
| 25 to 29 Minutes | 48 (18.5%) | 0 (0.0%) |
| 30 to 34 Minutes | 0 (0.0%) | 0 (0.0%) |
| 35 to 39 Minutes | 33 (12.7%) | 38 (43.7%) |
| 40 to 44 Minutes | 0 (0.0%) | 18 (20.7%) |
| 45 to 59 Minutes | 0 (0.0%) | 10 (11.5%) |
| 60 to 89 Minutes | 33 (12.7%) | 0 (0.0%) |
| 90 or more Minutes | 8 (3.1%) | 0 (0.0%) |
Time of Departure to Work by Sex in North Gate
The most frequent times of departure to work in North Gate are 6:30 AM to 6:59 AM (81, 31.1%) for males and 8:00 AM to 8:29 AM (77, 88.5%) for females.
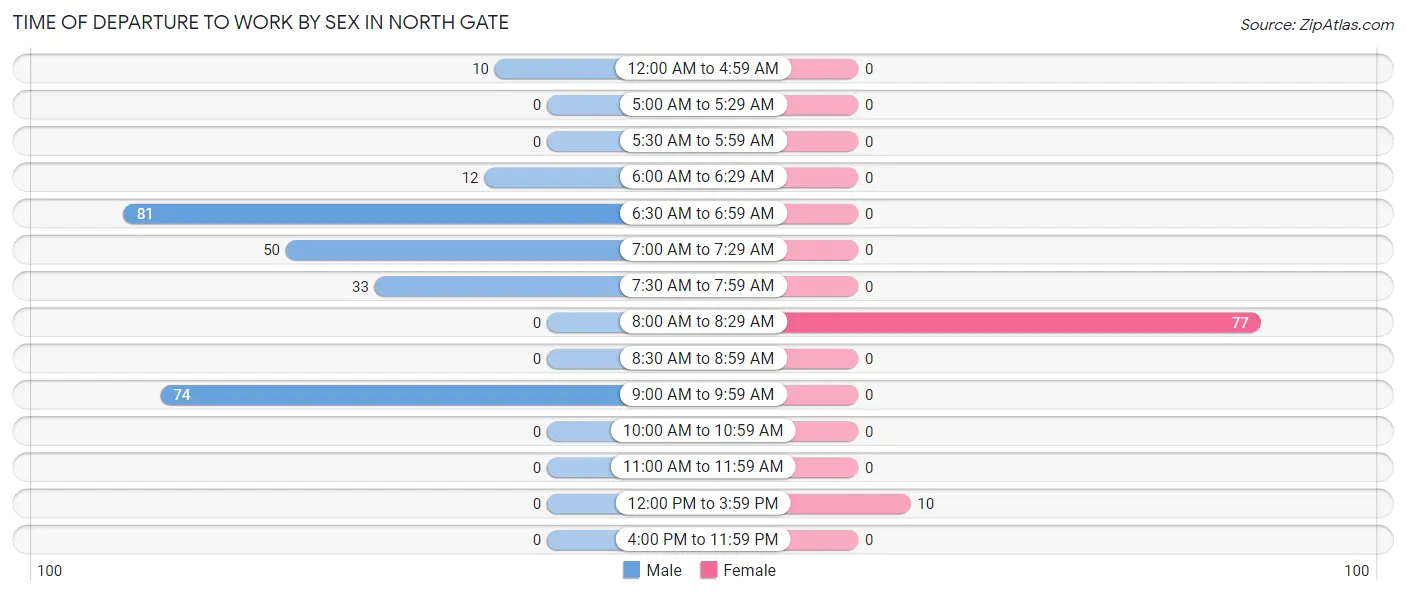
| Time of Departure | Male | Female |
| 12:00 AM to 4:59 AM | 10 (3.8%) | 0 (0.0%) |
| 5:00 AM to 5:29 AM | 0 (0.0%) | 0 (0.0%) |
| 5:30 AM to 5:59 AM | 0 (0.0%) | 0 (0.0%) |
| 6:00 AM to 6:29 AM | 12 (4.6%) | 0 (0.0%) |
| 6:30 AM to 6:59 AM | 81 (31.1%) | 0 (0.0%) |
| 7:00 AM to 7:29 AM | 50 (19.2%) | 0 (0.0%) |
| 7:30 AM to 7:59 AM | 33 (12.7%) | 0 (0.0%) |
| 8:00 AM to 8:29 AM | 0 (0.0%) | 77 (88.5%) |
| 8:30 AM to 8:59 AM | 0 (0.0%) | 0 (0.0%) |
| 9:00 AM to 9:59 AM | 74 (28.5%) | 0 (0.0%) |
| 10:00 AM to 10:59 AM | 0 (0.0%) | 0 (0.0%) |
| 11:00 AM to 11:59 AM | 0 (0.0%) | 0 (0.0%) |
| 12:00 PM to 3:59 PM | 0 (0.0%) | 10 (11.5%) |
| 4:00 PM to 11:59 PM | 0 (0.0%) | 0 (0.0%) |
| Total | 260 (100.0%) | 87 (100.0%) |
Housing Occupancy in North Gate
Occupancy by Ownership in North Gate
Of the total 284 dwellings in North Gate, owner-occupied units account for 246 (86.6%), while renter-occupied units make up 38 (13.4%).
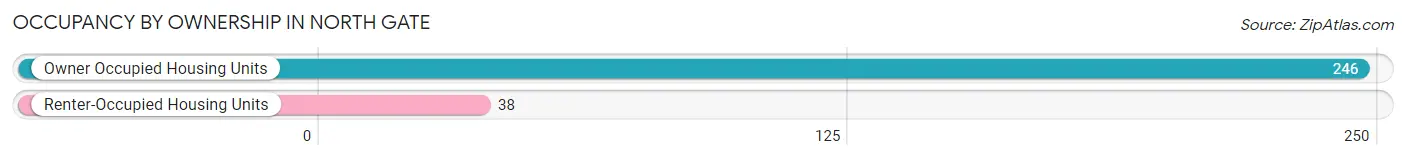
| Occupancy | # Housing Units | % Housing Units |
| Owner Occupied Housing Units | 246 | 86.6% |
| Renter-Occupied Housing Units | 38 | 13.4% |
| Total Occupied Housing Units | 284 | 100.0% |
Occupancy by Household Size in North Gate
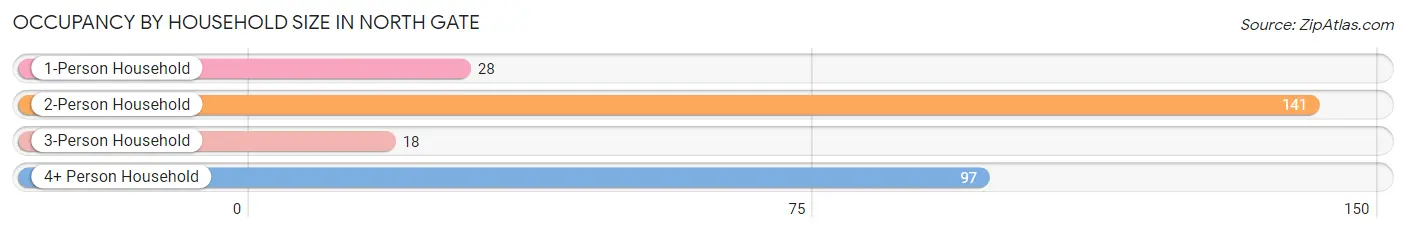
| Household Size | # Housing Units | % Housing Units |
| 1-Person Household | 28 | 9.9% |
| 2-Person Household | 141 | 49.6% |
| 3-Person Household | 18 | 6.3% |
| 4+ Person Household | 97 | 34.2% |
| Total Housing Units | 284 | 100.0% |
Occupancy by Ownership by Household Size in North Gate
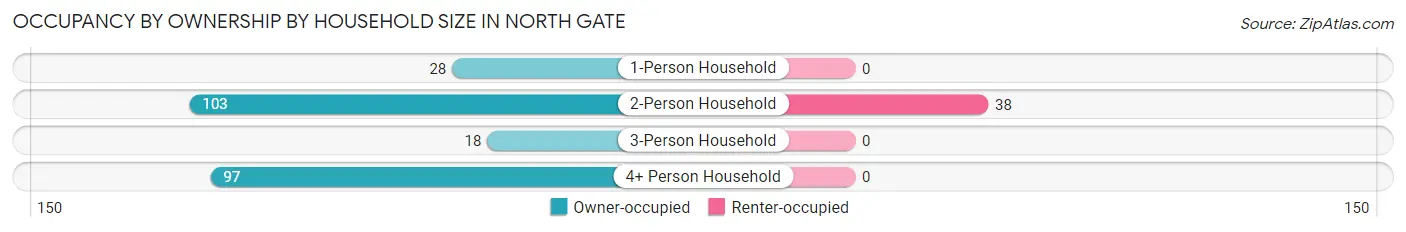
| Household Size | Owner-occupied | Renter-occupied |
| 1-Person Household | 28 (100.0%) | 0 (0.0%) |
| 2-Person Household | 103 (73.1%) | 38 (27.0%) |
| 3-Person Household | 18 (100.0%) | 0 (0.0%) |
| 4+ Person Household | 97 (100.0%) | 0 (0.0%) |
| Total Housing Units | 246 (86.6%) | 38 (13.4%) |
Occupancy by Educational Attainment in North Gate
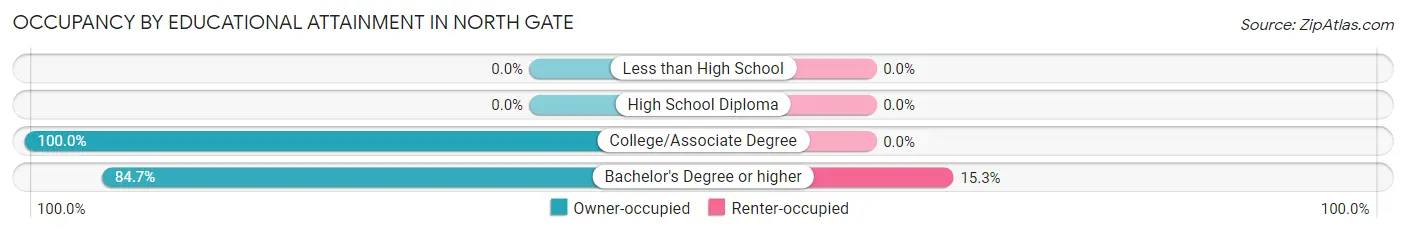
| Household Size | Owner-occupied | Renter-occupied |
| Less than High School | 0 (0.0%) | 0 (0.0%) |
| High School Diploma | 0 (0.0%) | 0 (0.0%) |
| College/Associate Degree | 36 (100.0%) | 0 (0.0%) |
| Bachelor's Degree or higher | 210 (84.7%) | 38 (15.3%) |
Occupancy by Age of Householder in North Gate
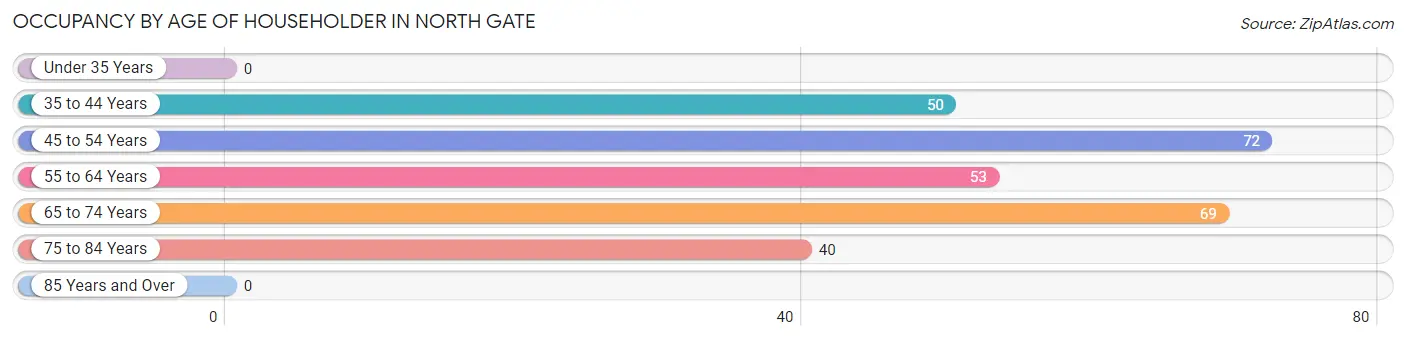
| Age Bracket | # Households | % Households |
| Under 35 Years | 0 | 0.0% |
| 35 to 44 Years | 50 | 17.6% |
| 45 to 54 Years | 72 | 25.4% |
| 55 to 64 Years | 53 | 18.7% |
| 65 to 74 Years | 69 | 24.3% |
| 75 to 84 Years | 40 | 14.1% |
| 85 Years and Over | 0 | 0.0% |
| Total | 284 | 100.0% |
Housing Finances in North Gate
Median Income by Occupancy in North Gate
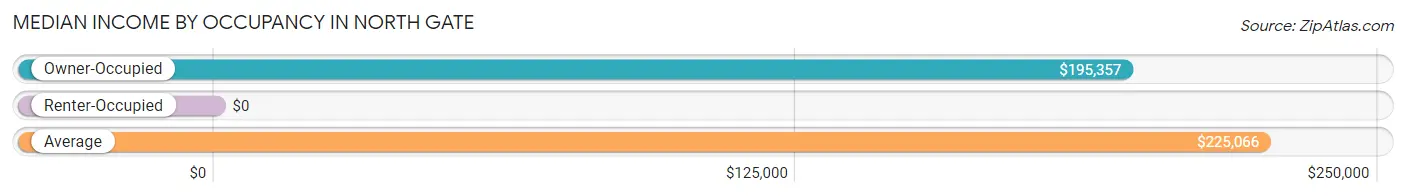
| Occupancy Type | # Households | Median Income |
| Owner-Occupied | 246 (86.6%) | $195,357 |
| Renter-Occupied | 38 (13.4%) | $0 |
| Average | 284 (100.0%) | $225,066 |
Occupancy by Householder Income Bracket in North Gate
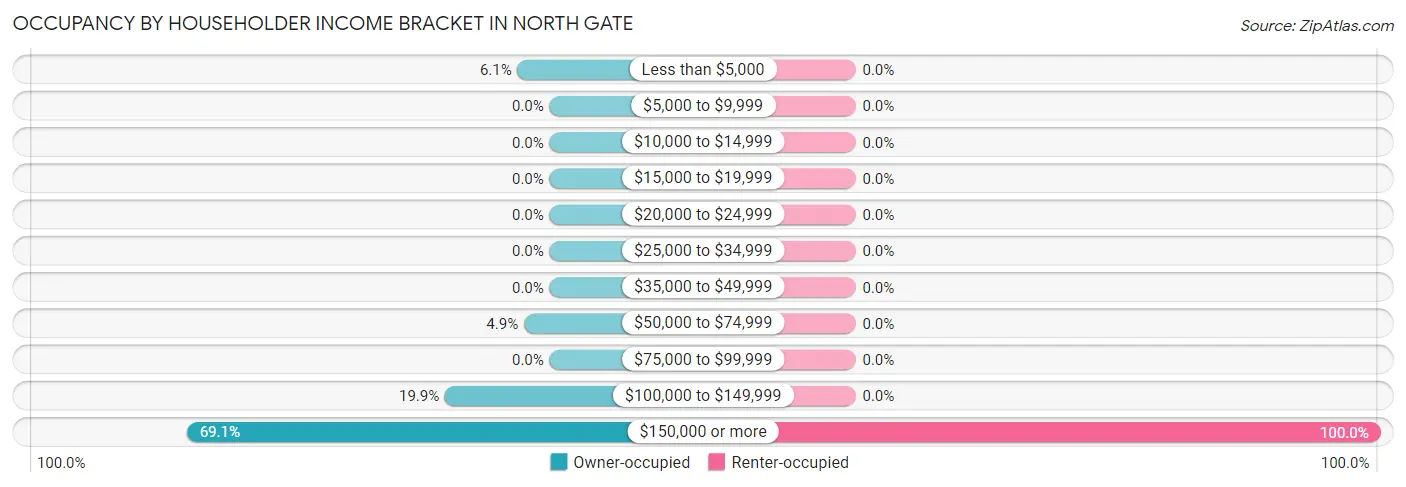
| Income Bracket | Owner-occupied | Renter-occupied |
| Less than $5,000 | 15 (6.1%) | 0 (0.0%) |
| $5,000 to $9,999 | 0 (0.0%) | 0 (0.0%) |
| $10,000 to $14,999 | 0 (0.0%) | 0 (0.0%) |
| $15,000 to $19,999 | 0 (0.0%) | 0 (0.0%) |
| $20,000 to $24,999 | 0 (0.0%) | 0 (0.0%) |
| $25,000 to $34,999 | 0 (0.0%) | 0 (0.0%) |
| $35,000 to $49,999 | 0 (0.0%) | 0 (0.0%) |
| $50,000 to $74,999 | 12 (4.9%) | 0 (0.0%) |
| $75,000 to $99,999 | 0 (0.0%) | 0 (0.0%) |
| $100,000 to $149,999 | 49 (19.9%) | 0 (0.0%) |
| $150,000 or more | 170 (69.1%) | 38 (100.0%) |
| Total | 246 (100.0%) | 38 (100.0%) |
Monthly Housing Cost Tiers in North Gate
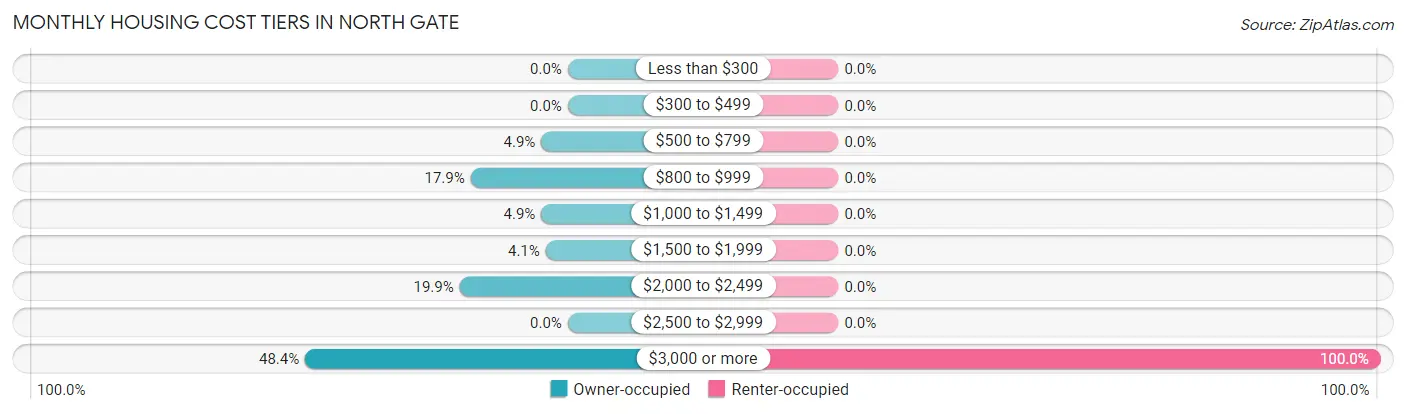
| Monthly Cost | Owner-occupied | Renter-occupied |
| Less than $300 | 0 (0.0%) | 0 (0.0%) |
| $300 to $499 | 0 (0.0%) | 0 (0.0%) |
| $500 to $799 | 12 (4.9%) | 0 (0.0%) |
| $800 to $999 | 44 (17.9%) | 0 (0.0%) |
| $1,000 to $1,499 | 12 (4.9%) | 0 (0.0%) |
| $1,500 to $1,999 | 10 (4.1%) | 0 (0.0%) |
| $2,000 to $2,499 | 49 (19.9%) | 0 (0.0%) |
| $2,500 to $2,999 | 0 (0.0%) | 0 (0.0%) |
| $3,000 or more | 119 (48.4%) | 38 (100.0%) |
| Total | 246 (100.0%) | 38 (100.0%) |
Physical Housing Characteristics in North Gate
Housing Structures in North Gate
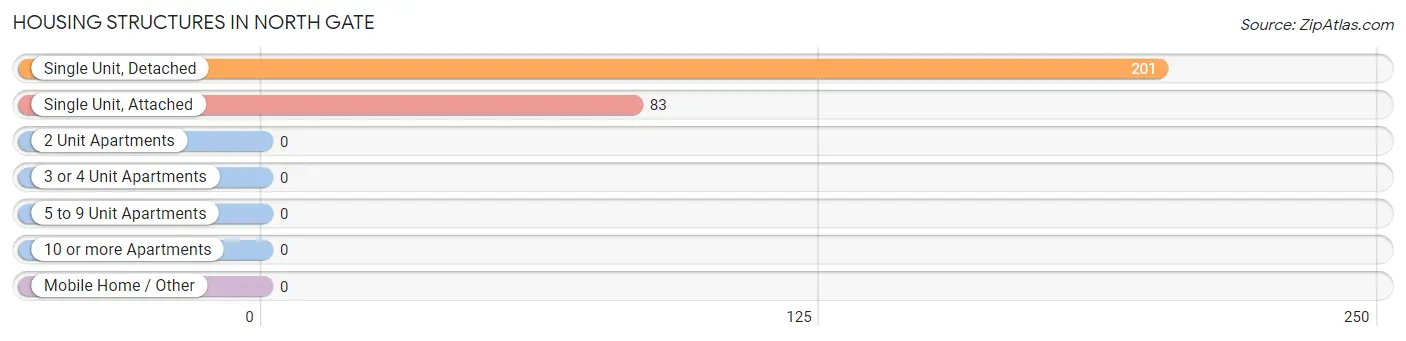
| Structure Type | # Housing Units | % Housing Units |
| Single Unit, Detached | 201 | 70.8% |
| Single Unit, Attached | 83 | 29.2% |
| 2 Unit Apartments | 0 | 0.0% |
| 3 or 4 Unit Apartments | 0 | 0.0% |
| 5 to 9 Unit Apartments | 0 | 0.0% |
| 10 or more Apartments | 0 | 0.0% |
| Mobile Home / Other | 0 | 0.0% |
| Total | 284 | 100.0% |
Housing Structures by Occupancy in North Gate
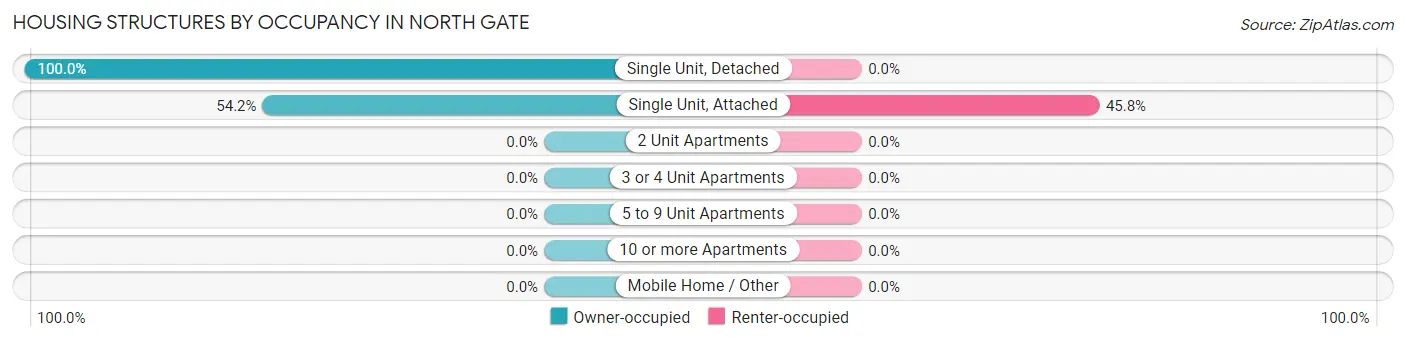
| Structure Type | Owner-occupied | Renter-occupied |
| Single Unit, Detached | 201 (100.0%) | 0 (0.0%) |
| Single Unit, Attached | 45 (54.2%) | 38 (45.8%) |
| 2 Unit Apartments | 0 (0.0%) | 0 (0.0%) |
| 3 or 4 Unit Apartments | 0 (0.0%) | 0 (0.0%) |
| 5 to 9 Unit Apartments | 0 (0.0%) | 0 (0.0%) |
| 10 or more Apartments | 0 (0.0%) | 0 (0.0%) |
| Mobile Home / Other | 0 (0.0%) | 0 (0.0%) |
| Total | 246 (86.6%) | 38 (13.4%) |
Housing Structures by Number of Rooms in North Gate
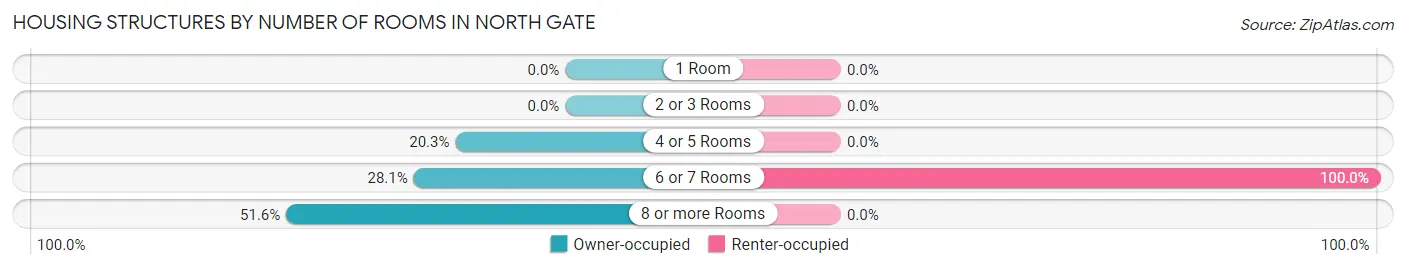
| Number of Rooms | Owner-occupied | Renter-occupied |
| 1 Room | 0 (0.0%) | 0 (0.0%) |
| 2 or 3 Rooms | 0 (0.0%) | 0 (0.0%) |
| 4 or 5 Rooms | 50 (20.3%) | 0 (0.0%) |
| 6 or 7 Rooms | 69 (28.1%) | 38 (100.0%) |
| 8 or more Rooms | 127 (51.6%) | 0 (0.0%) |
| Total | 246 (100.0%) | 38 (100.0%) |
Housing Structure by Heating Type in North Gate
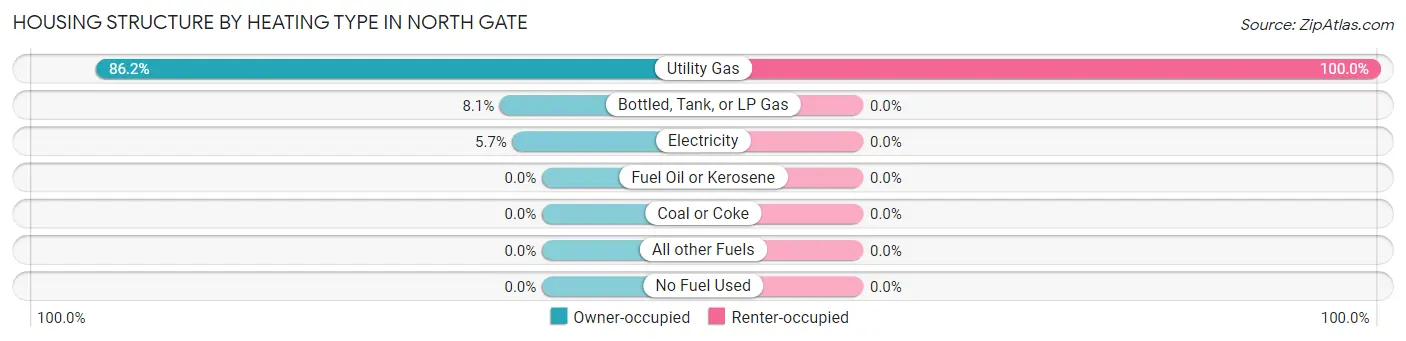
| Heating Type | Owner-occupied | Renter-occupied |
| Utility Gas | 212 (86.2%) | 38 (100.0%) |
| Bottled, Tank, or LP Gas | 20 (8.1%) | 0 (0.0%) |
| Electricity | 14 (5.7%) | 0 (0.0%) |
| Fuel Oil or Kerosene | 0 (0.0%) | 0 (0.0%) |
| Coal or Coke | 0 (0.0%) | 0 (0.0%) |
| All other Fuels | 0 (0.0%) | 0 (0.0%) |
| No Fuel Used | 0 (0.0%) | 0 (0.0%) |
| Total | 246 (100.0%) | 38 (100.0%) |
Household Vehicle Usage in North Gate
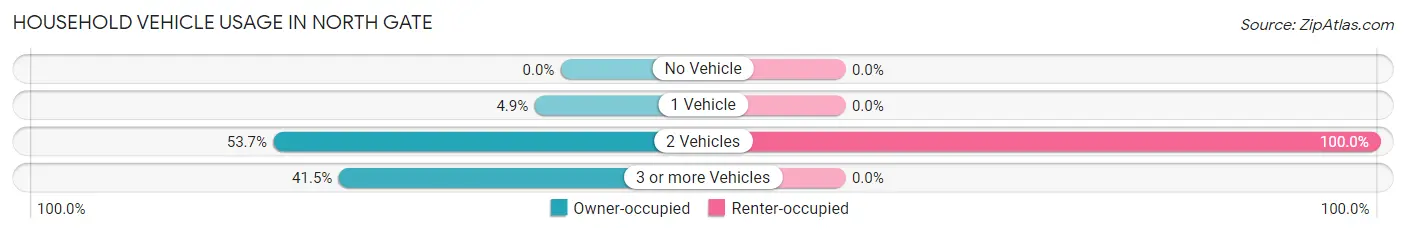
| Vehicles per Household | Owner-occupied | Renter-occupied |
| No Vehicle | 0 (0.0%) | 0 (0.0%) |
| 1 Vehicle | 12 (4.9%) | 0 (0.0%) |
| 2 Vehicles | 132 (53.7%) | 38 (100.0%) |
| 3 or more Vehicles | 102 (41.5%) | 0 (0.0%) |
| Total | 246 (100.0%) | 38 (100.0%) |
Real Estate & Mortgages in North Gate
Real Estate and Mortgage Overview in North Gate
| Characteristic | Without Mortgage | With Mortgage |
| Housing Units | 117 | 129 |
| Median Property Value | $1,696,000 | $2,000,001 |
| Median Household Income | $193,494 | $94 |
| Monthly Housing Costs | $1,321 | $98 |
| Real Estate Taxes | $7,151 | $0 |
Property Value by Mortgage Status in North Gate
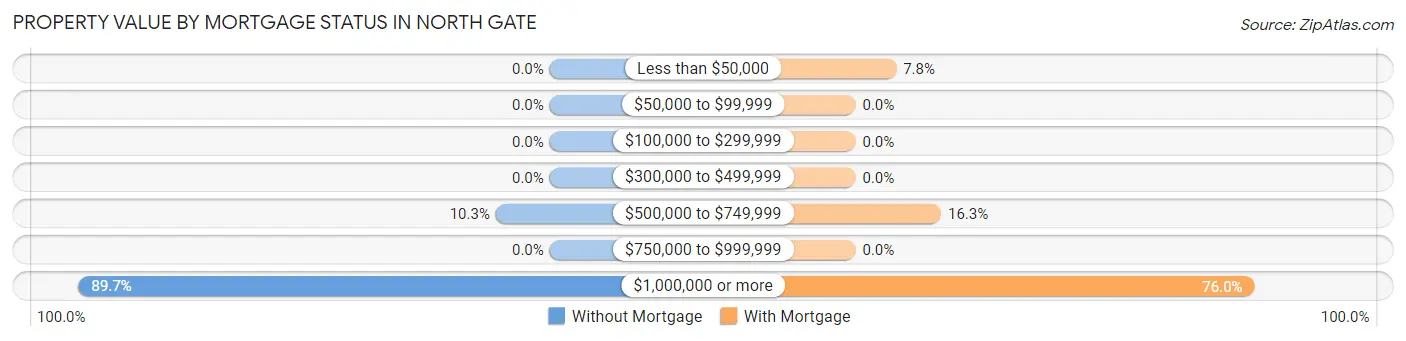
| Property Value | Without Mortgage | With Mortgage |
| Less than $50,000 | 0 (0.0%) | 10 (7.7%) |
| $50,000 to $99,999 | 0 (0.0%) | 0 (0.0%) |
| $100,000 to $299,999 | 0 (0.0%) | 0 (0.0%) |
| $300,000 to $499,999 | 0 (0.0%) | 0 (0.0%) |
| $500,000 to $749,999 | 12 (10.3%) | 21 (16.3%) |
| $750,000 to $999,999 | 0 (0.0%) | 0 (0.0%) |
| $1,000,000 or more | 105 (89.7%) | 98 (76.0%) |
| Total | 117 (100.0%) | 129 (100.0%) |
Household Income by Mortgage Status in North Gate
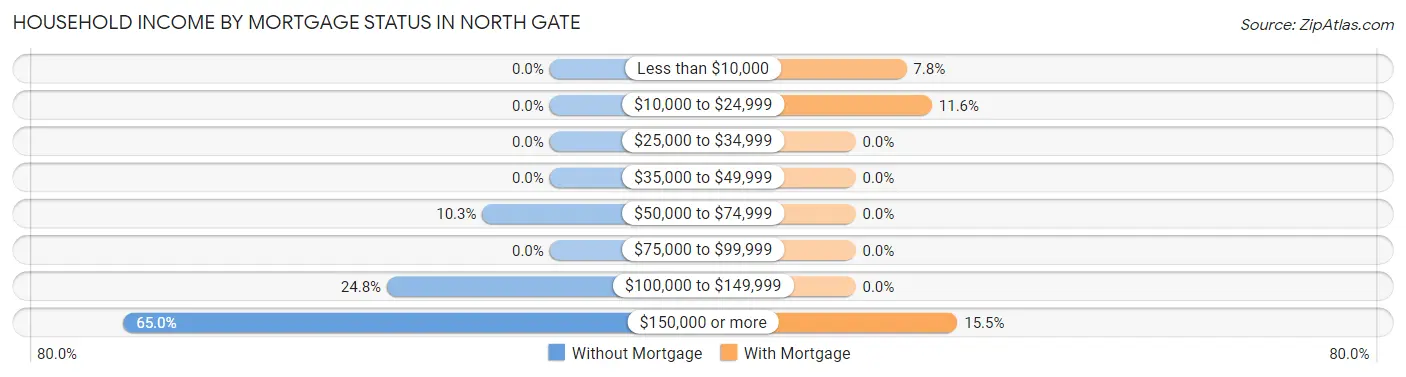
| Household Income | Without Mortgage | With Mortgage |
| Less than $10,000 | 0 (0.0%) | 10 (7.7%) |
| $10,000 to $24,999 | 0 (0.0%) | 15 (11.6%) |
| $25,000 to $34,999 | 0 (0.0%) | 0 (0.0%) |
| $35,000 to $49,999 | 0 (0.0%) | 0 (0.0%) |
| $50,000 to $74,999 | 12 (10.3%) | 0 (0.0%) |
| $75,000 to $99,999 | 0 (0.0%) | 0 (0.0%) |
| $100,000 to $149,999 | 29 (24.8%) | 0 (0.0%) |
| $150,000 or more | 76 (65.0%) | 20 (15.5%) |
| Total | 117 (100.0%) | 129 (100.0%) |
Property Value to Household Income Ratio in North Gate
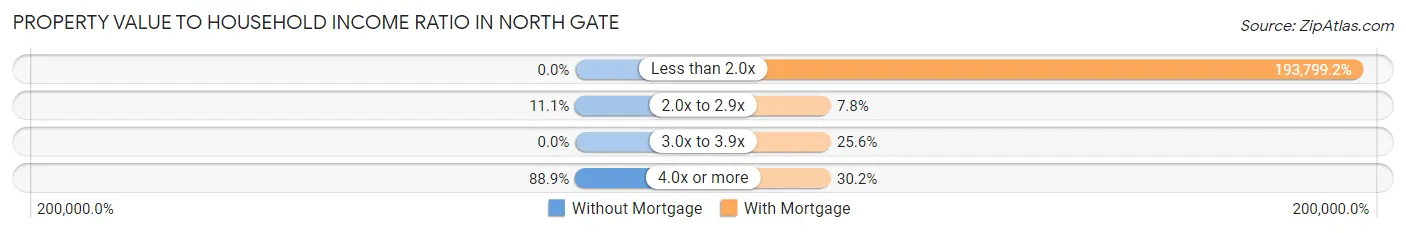
| Value-to-Income Ratio | Without Mortgage | With Mortgage |
| Less than 2.0x | 0 (0.0%) | 250,001 (193,799.2%) |
| 2.0x to 2.9x | 13 (11.1%) | 10 (7.7%) |
| 3.0x to 3.9x | 0 (0.0%) | 33 (25.6%) |
| 4.0x or more | 104 (88.9%) | 39 (30.2%) |
| Total | 117 (100.0%) | 129 (100.0%) |
Real Estate Taxes by Mortgage Status in North Gate
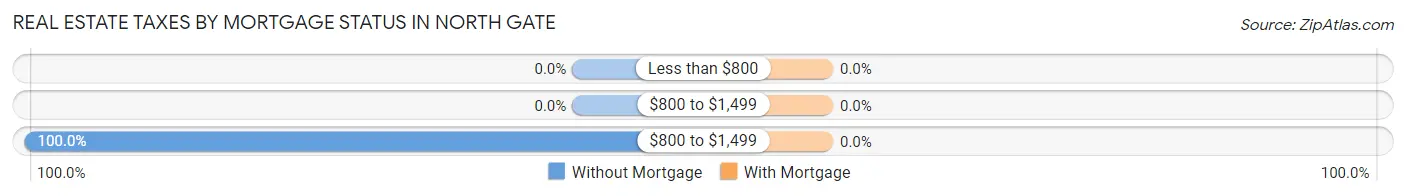
| Property Taxes | Without Mortgage | With Mortgage |
| Less than $800 | 0 (0.0%) | 0 (0.0%) |
| $800 to $1,499 | 0 (0.0%) | 0 (0.0%) |
| $800 to $1,499 | 117 (100.0%) | 0 (0.0%) |
| Total | 117 (100.0%) | 129 (100.0%) |
Health & Disability in North Gate
Health Insurance Coverage by Age in North Gate
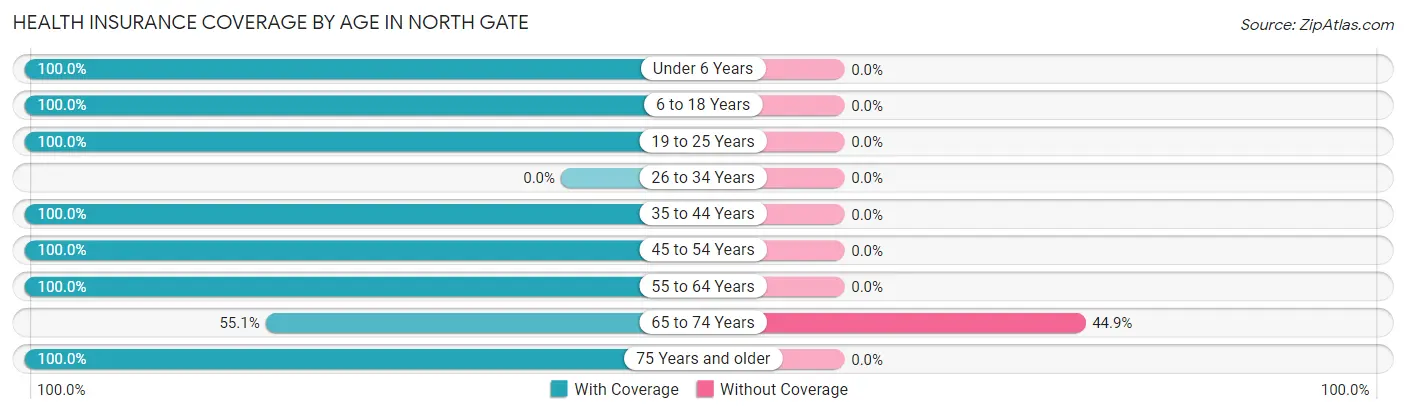
| Age Bracket | With Coverage | Without Coverage |
| Under 6 Years | 38 (100.0%) | 0 (0.0%) |
| 6 to 18 Years | 144 (100.0%) | 0 (0.0%) |
| 19 to 25 Years | 77 (100.0%) | 0 (0.0%) |
| 26 to 34 Years | 0 (0.0%) | 0 (0.0%) |
| 35 to 44 Years | 96 (100.0%) | 0 (0.0%) |
| 45 to 54 Years | 175 (100.0%) | 0 (0.0%) |
| 55 to 64 Years | 118 (100.0%) | 0 (0.0%) |
| 65 to 74 Years | 103 (55.1%) | 84 (44.9%) |
| 75 Years and older | 65 (100.0%) | 0 (0.0%) |
| Total | 816 (90.7%) | 84 (9.3%) |
Health Insurance Coverage by Citizenship Status in North Gate
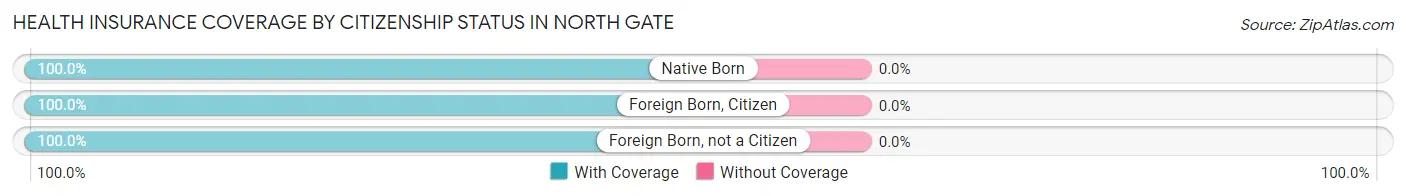
| Citizenship Status | With Coverage | Without Coverage |
| Native Born | 38 (100.0%) | 0 (0.0%) |
| Foreign Born, Citizen | 144 (100.0%) | 0 (0.0%) |
| Foreign Born, not a Citizen | 77 (100.0%) | 0 (0.0%) |
Health Insurance Coverage by Household Income in North Gate
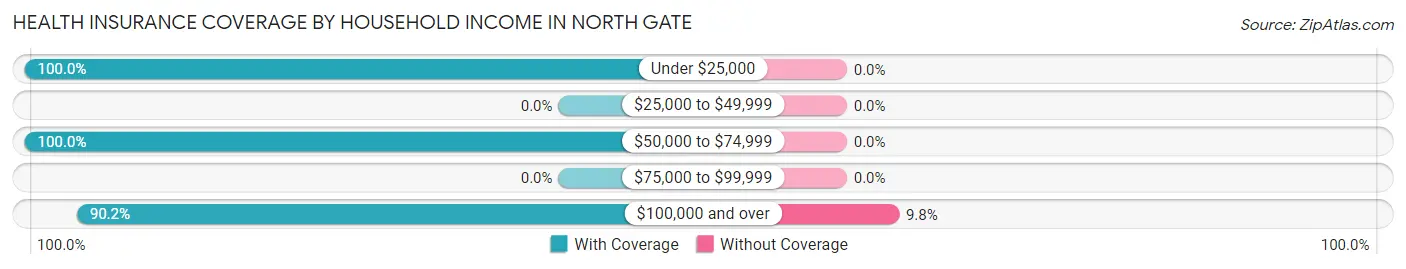
| Household Income | With Coverage | Without Coverage |
| Under $25,000 | 15 (100.0%) | 0 (0.0%) |
| $25,000 to $49,999 | 0 (0.0%) | 0 (0.0%) |
| $50,000 to $74,999 | 26 (100.0%) | 0 (0.0%) |
| $75,000 to $99,999 | 0 (0.0%) | 0 (0.0%) |
| $100,000 and over | 775 (90.2%) | 84 (9.8%) |
Public vs Private Health Insurance Coverage by Age in North Gate
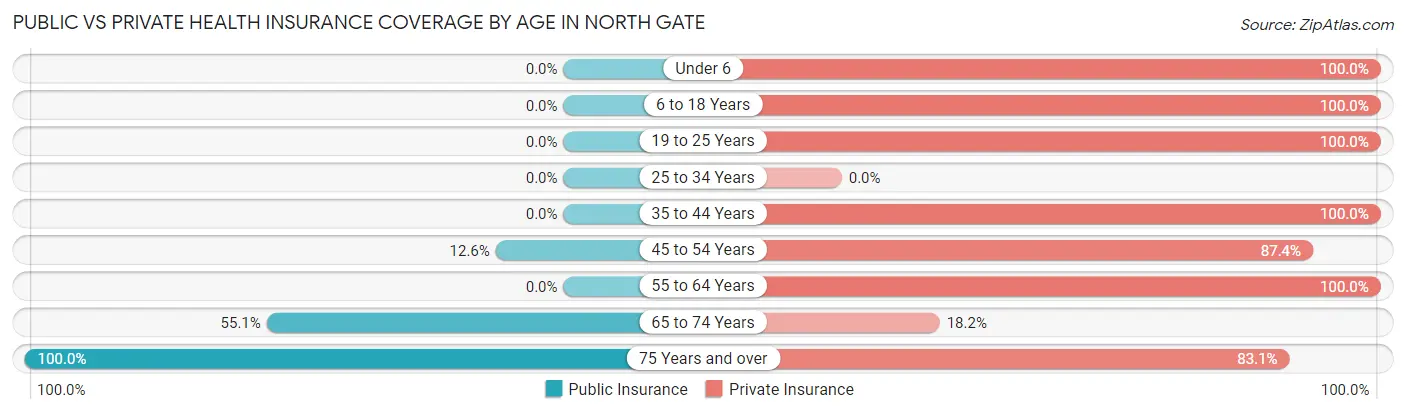
| Age Bracket | Public Insurance | Private Insurance |
| Under 6 | 0 (0.0%) | 38 (100.0%) |
| 6 to 18 Years | 0 (0.0%) | 144 (100.0%) |
| 19 to 25 Years | 0 (0.0%) | 77 (100.0%) |
| 25 to 34 Years | 0 (0.0%) | 0 (0.0%) |
| 35 to 44 Years | 0 (0.0%) | 96 (100.0%) |
| 45 to 54 Years | 22 (12.6%) | 153 (87.4%) |
| 55 to 64 Years | 0 (0.0%) | 118 (100.0%) |
| 65 to 74 Years | 103 (55.1%) | 34 (18.2%) |
| 75 Years and over | 65 (100.0%) | 54 (83.1%) |
| Total | 190 (21.1%) | 714 (79.3%) |
Disability Status by Sex by Age in North Gate
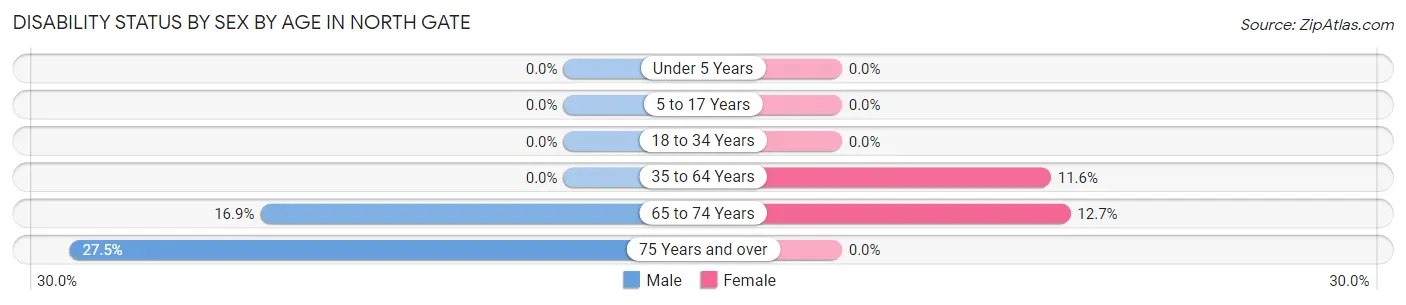
| Age Bracket | Male | Female |
| Under 5 Years | 0 (0.0%) | 0 (0.0%) |
| 5 to 17 Years | 0 (0.0%) | 0 (0.0%) |
| 18 to 34 Years | 0 (0.0%) | 0 (0.0%) |
| 35 to 64 Years | 0 (0.0%) | 22 (11.6%) |
| 65 to 74 Years | 13 (16.9%) | 14 (12.7%) |
| 75 Years and over | 11 (27.5%) | 0 (0.0%) |
Disability Class by Sex by Age in North Gate
Disability Class: Hearing Difficulty
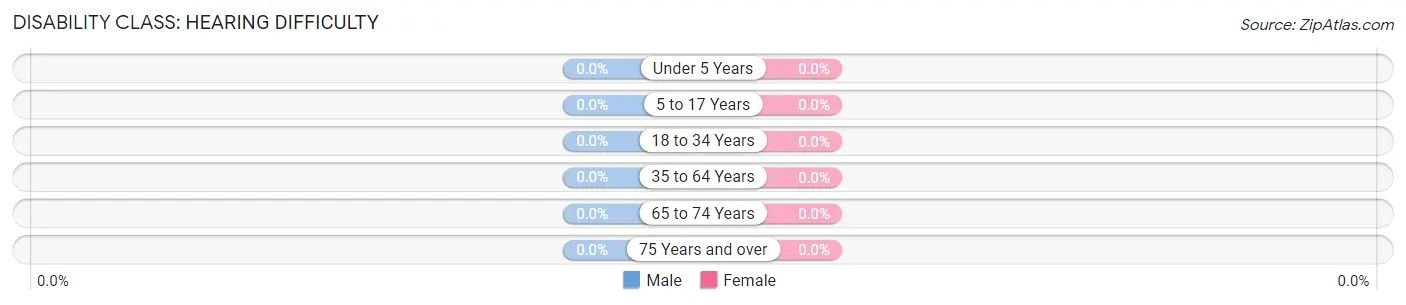
| Age Bracket | Male | Female |
| Under 5 Years | 0 (0.0%) | 0 (0.0%) |
| 5 to 17 Years | 0 (0.0%) | 0 (0.0%) |
| 18 to 34 Years | 0 (0.0%) | 0 (0.0%) |
| 35 to 64 Years | 0 (0.0%) | 0 (0.0%) |
| 65 to 74 Years | 0 (0.0%) | 0 (0.0%) |
| 75 Years and over | 0 (0.0%) | 0 (0.0%) |
Disability Class: Vision Difficulty
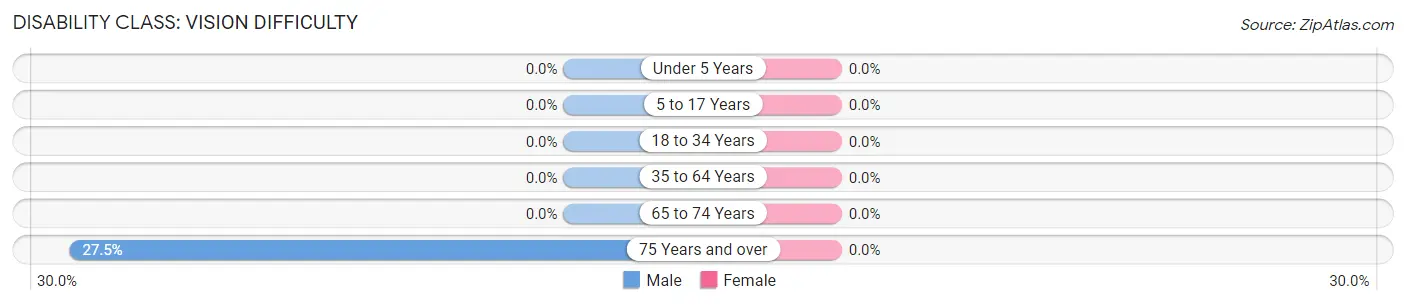
| Age Bracket | Male | Female |
| Under 5 Years | 0 (0.0%) | 0 (0.0%) |
| 5 to 17 Years | 0 (0.0%) | 0 (0.0%) |
| 18 to 34 Years | 0 (0.0%) | 0 (0.0%) |
| 35 to 64 Years | 0 (0.0%) | 0 (0.0%) |
| 65 to 74 Years | 0 (0.0%) | 0 (0.0%) |
| 75 Years and over | 11 (27.5%) | 0 (0.0%) |
Disability Class: Cognitive Difficulty
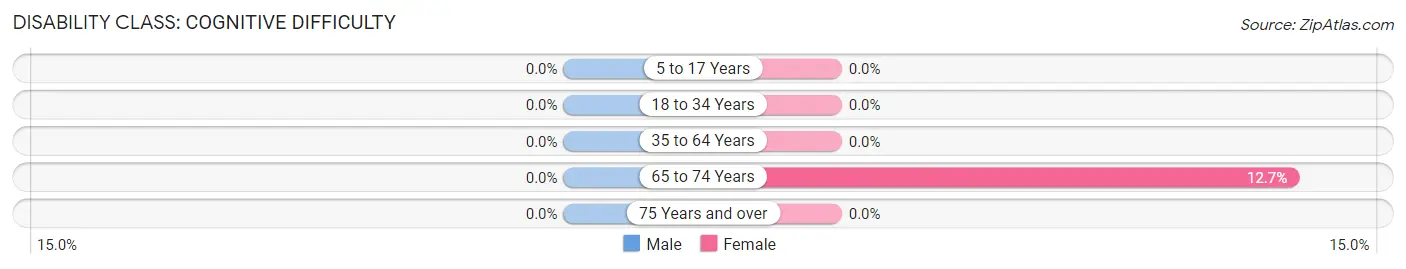
| Age Bracket | Male | Female |
| 5 to 17 Years | 0 (0.0%) | 0 (0.0%) |
| 18 to 34 Years | 0 (0.0%) | 0 (0.0%) |
| 35 to 64 Years | 0 (0.0%) | 0 (0.0%) |
| 65 to 74 Years | 0 (0.0%) | 14 (12.7%) |
| 75 Years and over | 0 (0.0%) | 0 (0.0%) |
Disability Class: Ambulatory Difficulty

| Age Bracket | Male | Female |
| 5 to 17 Years | 0 (0.0%) | 0 (0.0%) |
| 18 to 34 Years | 0 (0.0%) | 0 (0.0%) |
| 35 to 64 Years | 0 (0.0%) | 0 (0.0%) |
| 65 to 74 Years | 13 (16.9%) | 0 (0.0%) |
| 75 Years and over | 0 (0.0%) | 0 (0.0%) |
Disability Class: Self-Care Difficulty
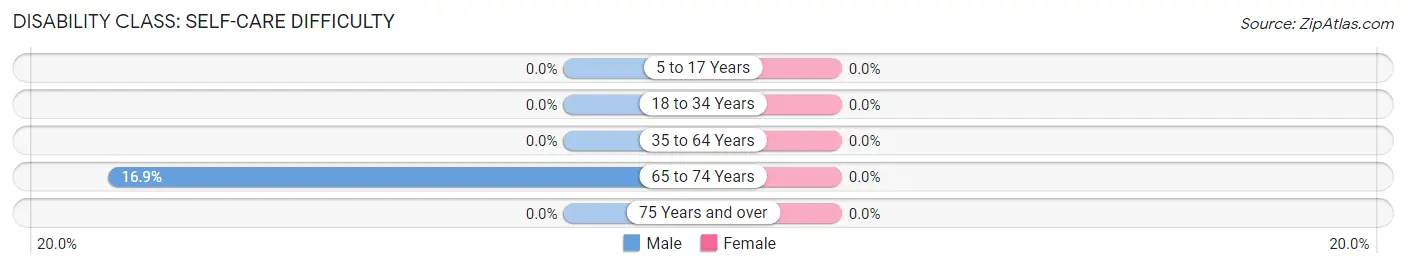
| Age Bracket | Male | Female |
| 5 to 17 Years | 0 (0.0%) | 0 (0.0%) |
| 18 to 34 Years | 0 (0.0%) | 0 (0.0%) |
| 35 to 64 Years | 0 (0.0%) | 0 (0.0%) |
| 65 to 74 Years | 13 (16.9%) | 0 (0.0%) |
| 75 Years and over | 0 (0.0%) | 0 (0.0%) |
Technology Access in North Gate
Computing Device Access in North Gate
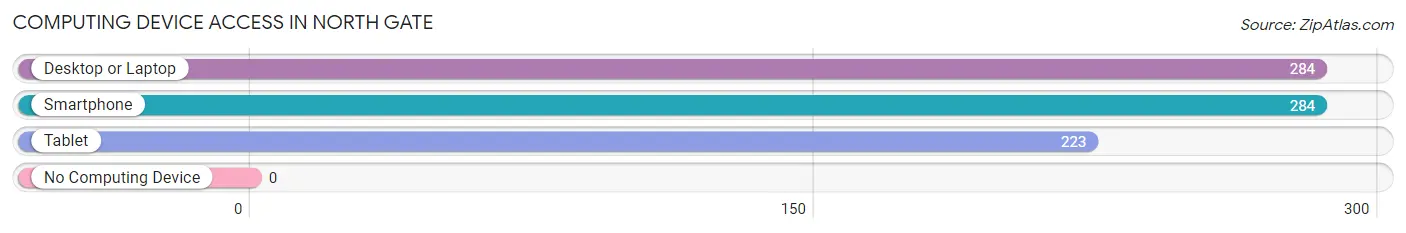
| Device Type | # Households | % Households |
| Desktop or Laptop | 284 | 100.0% |
| Smartphone | 284 | 100.0% |
| Tablet | 223 | 78.5% |
| No Computing Device | 0 | 0.0% |
| Total | 284 | 100.0% |
Internet Access in North Gate
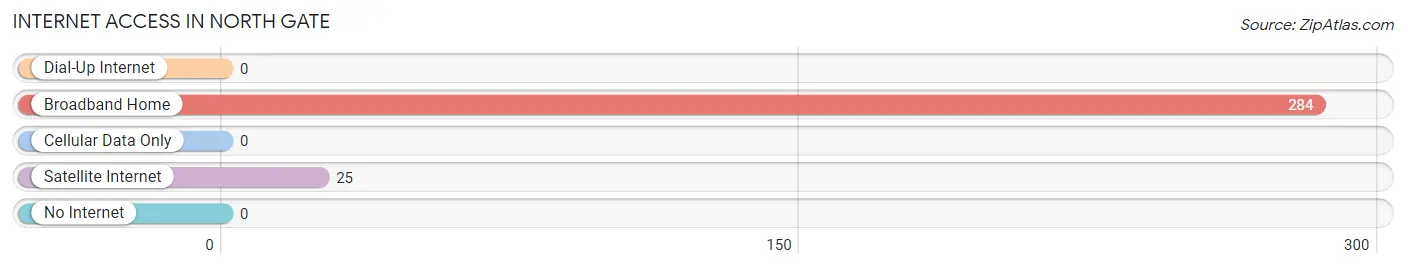
| Internet Type | # Households | % Households |
| Dial-Up Internet | 0 | 0.0% |
| Broadband Home | 284 | 100.0% |
| Cellular Data Only | 0 | 0.0% |
| Satellite Internet | 25 | 8.8% |
| No Internet | 0 | 0.0% |
| Total | 284 | 100.0% |
North Gate Summary
Gate, CA is a small city located in the San Francisco Bay Area of California. It is situated in the East Bay region of the Bay Area, and is bordered by the cities of Oakland, Berkeley, and Emeryville. The city is home to a population of approximately 10,000 people, and is known for its diverse population and vibrant culture.
History
North Gate, CA was originally inhabited by the Ohlone people, who were the first inhabitants of the area. The Ohlone people were hunter-gatherers who lived in the area for thousands of years before the arrival of Europeans. In the late 1700s, Spanish explorers arrived in the area and began to settle the region. The area was then part of the Rancho San Antonio land grant, which was given to the Peralta family in 1820.
In the late 1800s, the area was developed as a residential neighborhood, and the city of North Gate was officially incorporated in 1908. The city was named after the North Gate Bridge, which was built in the early 1900s to connect the city to Oakland.
Geography
North Gate, CA is located in the East Bay region of the San Francisco Bay Area. The city is situated on the eastern shore of San Francisco Bay, and is bordered by the cities of Oakland, Berkeley, and Emeryville. The city is located at an elevation of approximately 30 feet above sea level.
The city has a total area of 1.7 square miles, and is located in a temperate climate zone. The city experiences mild temperatures throughout the year, with average highs in the mid-60s and lows in the mid-50s.
Economy
North Gate, CA is home to a diverse economy, with a variety of industries represented in the city. The city is home to a number of technology companies, including Oracle, Apple, and Google. The city is also home to a number of retail stores, restaurants, and other businesses.
The city is also home to a number of educational institutions, including the University of California, Berkeley, and the California College of the Arts. The city is also home to a number of cultural attractions, including the Berkeley Art Museum and Pacific Film Archive.
Demographics
North Gate, CA has a population of approximately 10,000 people, and is known for its diverse population. The city has a median household income of $75,000, and a median age of 38. The city is home to a variety of ethnic and racial groups, including White (47%), Hispanic (25%), Asian (14%), and African American (7%).
The city is also home to a variety of religious groups, including Christianity (45%), Judaism (15%), and Islam (5%). The city is also home to a number of LGBT residents, and is known for its vibrant and diverse culture.
Conclusion
North Gate, CA is a small city located in the San Francisco Bay Area of California. It is situated in the East Bay region of the Bay Area, and is bordered by the cities of Oakland, Berkeley, and Emeryville. The city is home to a population of approximately 10,000 people, and is known for its diverse population and vibrant culture. The city has a diverse economy, with a variety of industries represented in the city, and is home to a number of educational institutions and cultural attractions. The city is also home to a variety of ethnic and racial groups, and is known for its vibrant and diverse culture.
Common Questions
What is Per Capita Income in North Gate?
Per Capita income in North Gate is $109,421.
What is the Median Family Income in North Gate?
Median Family Income in North Gate is $196,429.
What is the Median Household income in North Gate?
Median Household Income in North Gate is $225,066.
What is Inequality or Gini Index in North Gate?
Inequality or Gini Index in North Gate is 0.45.
What is the Total Population of North Gate?
Total Population of North Gate is 900.
What is the Total Male Population of North Gate?
Total Male Population of North Gate is 461.
What is the Total Female Population of North Gate?
Total Female Population of North Gate is 439.
What is the Ratio of Males per 100 Females in North Gate?
There are 105.01 Males per 100 Females in North Gate.
What is the Ratio of Females per 100 Males in North Gate?
There are 95.23 Females per 100 Males in North Gate.
What is the Median Population Age in North Gate?
Median Population Age in North Gate is 54.1 Years.
What is the Average Family Size in North Gate
Average Family Size in North Gate is 3.3 People.
What is the Average Household Size in North Gate
Average Household Size in North Gate is 3.2 People.
How Large is the Labor Force in North Gate?
There are 376 People in the Labor Forcein in North Gate.
What is the Percentage of People in the Labor Force in North Gate?
49.6% of People are in the Labor Force in North Gate.