San Anselmo, CA Map & Demographics
San Anselmo Map
San Anselmo Overview
$97,674
PER CAPITA INCOME
$230,588
AVG FAMILY INCOME
$165,366
AVG HOUSEHOLD INCOME
31.2%
WAGE / INCOME GAP [ % ]
68.8¢/ $1
WAGE / INCOME GAP [ $ ]
0.49
INEQUALITY / GINI INDEX
12,761
TOTAL POPULATION
6,451
MALE POPULATION
6,310
FEMALE POPULATION
102.23
MALES / 100 FEMALES
97.81
FEMALES / 100 MALES
46.0
MEDIAN AGE
3.0
AVG FAMILY SIZE
2.5
AVG HOUSEHOLD SIZE
7,205
LABOR FORCE [ PEOPLE ]
72.3%
PERCENT IN LABOR FORCE
5.4%
UNEMPLOYMENT RATE
San Anselmo Zip Codes
San Anselmo Area Codes
Income in San Anselmo
Income Overview in San Anselmo
Per Capita Income in San Anselmo is $97,674, while median incomes of families and households are $230,588 and $165,366 respectively.
| Characteristic | Number | Measure |
| Per Capita Income | 12,761 | $97,674 |
| Median Family Income | 3,404 | $230,588 |
| Mean Family Income | 3,404 | $303,456 |
| Median Household Income | 5,091 | $165,366 |
| Mean Household Income | 5,091 | $238,945 |
| Income Deficit | 3,404 | $0 |
| Wage / Income Gap (%) | 12,761 | 31.21% |
| Wage / Income Gap ($) | 12,761 | 68.79¢ per $1 |
| Gini / Inequality Index | 12,761 | 0.49 |
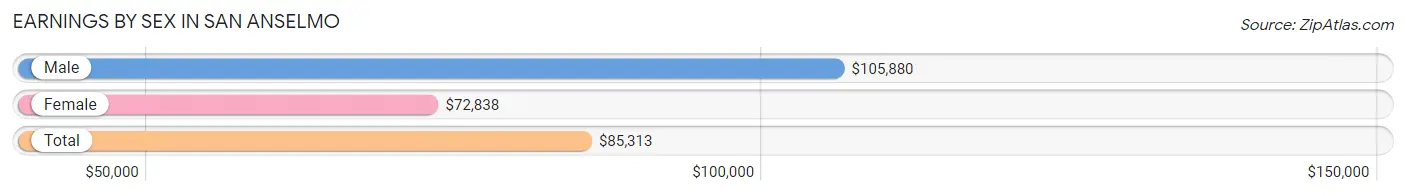
Earnings by Sex in San Anselmo
Average Earnings in San Anselmo are $85,313, $105,880 for men and $72,838 for women, a difference of 31.2%.
| Sex | Number | Average Earnings |
| Male | 3,936 (52.7%) | $105,880 |
| Female | 3,530 (47.3%) | $72,838 |
| Total | 7,466 (100.0%) | $85,313 |
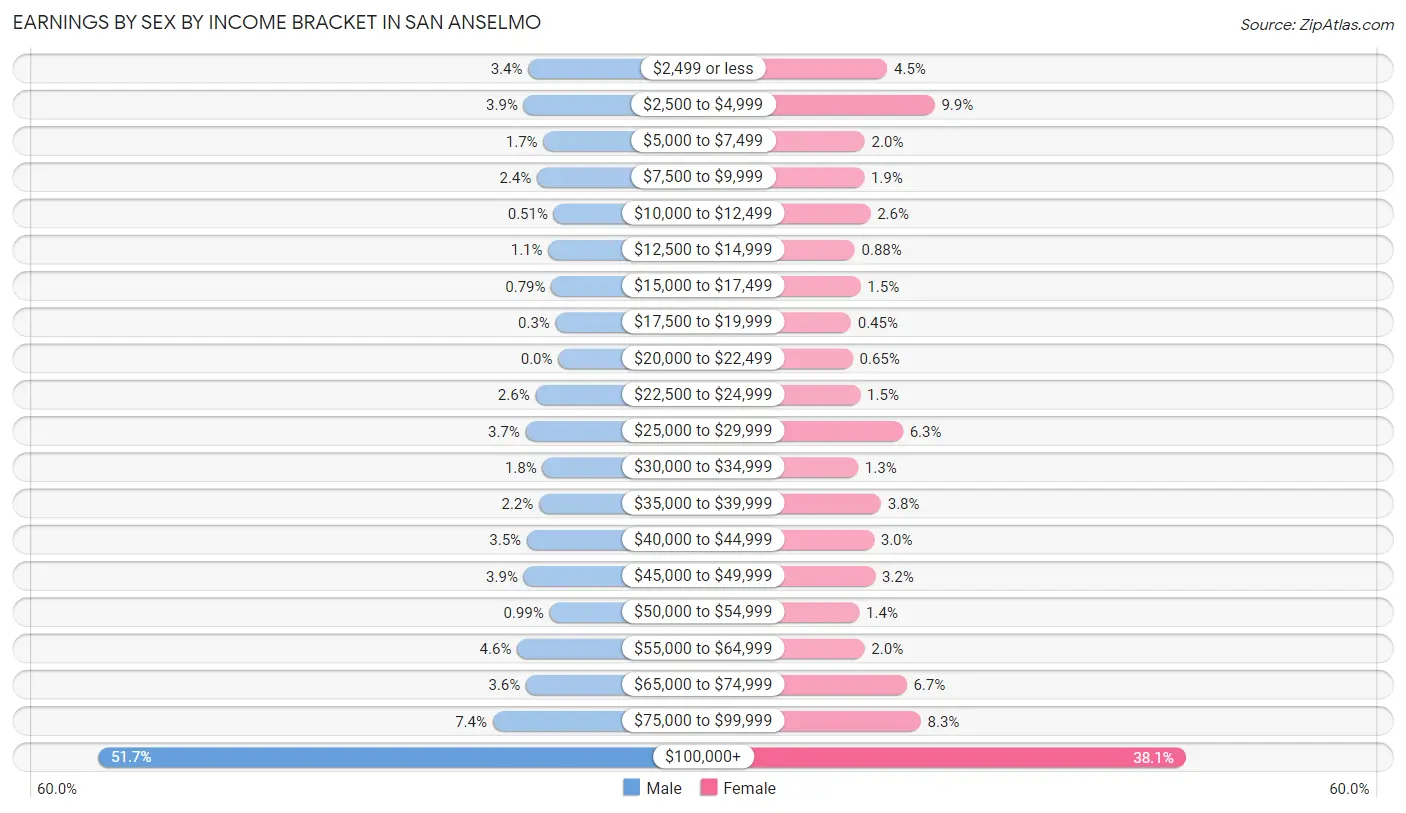
Earnings by Sex by Income Bracket in San Anselmo
The most common earnings brackets in San Anselmo are $100,000+ for men (2,036 | 51.7%) and $100,000+ for women (1,344 | 38.1%).
| Income | Male | Female |
| $2,499 or less | 133 (3.4%) | 160 (4.5%) |
| $2,500 to $4,999 | 153 (3.9%) | 348 (9.9%) |
| $5,000 to $7,499 | 66 (1.7%) | 71 (2.0%) |
| $7,500 to $9,999 | 94 (2.4%) | 68 (1.9%) |
| $10,000 to $12,499 | 20 (0.5%) | 93 (2.6%) |
| $12,500 to $14,999 | 44 (1.1%) | 31 (0.9%) |
| $15,000 to $17,499 | 31 (0.8%) | 54 (1.5%) |
| $17,500 to $19,999 | 12 (0.3%) | 16 (0.4%) |
| $20,000 to $22,499 | 0 (0.0%) | 23 (0.6%) |
| $22,500 to $24,999 | 101 (2.6%) | 53 (1.5%) |
| $25,000 to $29,999 | 145 (3.7%) | 222 (6.3%) |
| $30,000 to $34,999 | 70 (1.8%) | 44 (1.3%) |
| $35,000 to $39,999 | 85 (2.2%) | 135 (3.8%) |
| $40,000 to $44,999 | 139 (3.5%) | 107 (3.0%) |
| $45,000 to $49,999 | 153 (3.9%) | 112 (3.2%) |
| $50,000 to $54,999 | 39 (1.0%) | 49 (1.4%) |
| $55,000 to $64,999 | 182 (4.6%) | 70 (2.0%) |
| $65,000 to $74,999 | 143 (3.6%) | 237 (6.7%) |
| $75,000 to $99,999 | 290 (7.4%) | 293 (8.3%) |
| $100,000+ | 2,036 (51.7%) | 1,344 (38.1%) |
| Total | 3,936 (100.0%) | 3,530 (100.0%) |
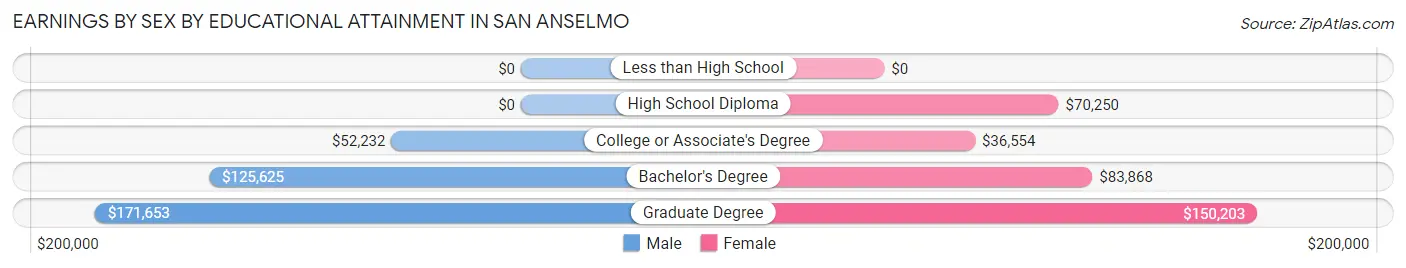
Earnings by Sex by Educational Attainment in San Anselmo
Average earnings in San Anselmo are $116,761 for men and $84,254 for women, a difference of 27.8%. Men with an educational attainment of graduate degree enjoy the highest average annual earnings of $171,653, while those with college or associate's degree education earn the least with $52,232. Women with an educational attainment of graduate degree earn the most with the average annual earnings of $150,203, while those with college or associate's degree education have the smallest earnings of $36,554.
| Educational Attainment | Male Income | Female Income |
| Less than High School | - | - |
| High School Diploma | - | - |
| College or Associate's Degree | $52,232 | $36,554 |
| Bachelor's Degree | $125,625 | $83,868 |
| Graduate Degree | $171,653 | $150,203 |
| Total | $116,761 | $84,254 |
Family Income in San Anselmo
Family Income Brackets in San Anselmo
According to the San Anselmo family income data, there are 1,954 families falling into the $200,000+ income range, which is the most common income bracket and makes up 57.4% of all families.
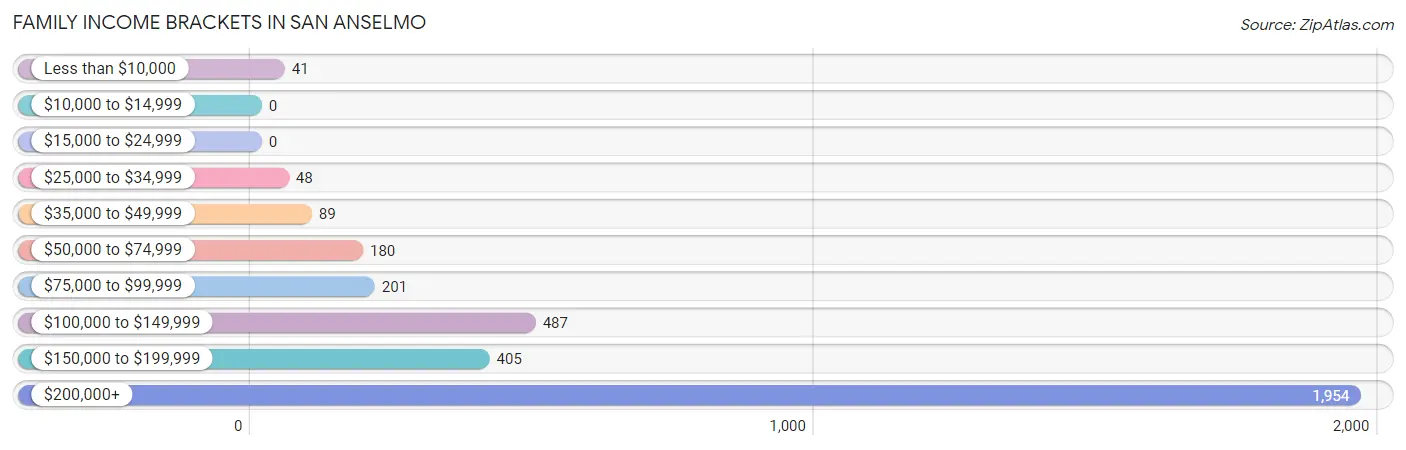
| Income Bracket | # Families | % Families |
| Less than $10,000 | 41 | 1.2% |
| $10,000 to $14,999 | 0 | 0.0% |
| $15,000 to $24,999 | 0 | 0.0% |
| $25,000 to $34,999 | 48 | 1.4% |
| $35,000 to $49,999 | 89 | 2.6% |
| $50,000 to $74,999 | 180 | 5.3% |
| $75,000 to $99,999 | 201 | 5.9% |
| $100,000 to $149,999 | 487 | 14.3% |
| $150,000 to $199,999 | 405 | 11.9% |
| $200,000+ | 1,954 | 57.4% |
Family Income by Famaliy Size in San Anselmo
4-person families (691 | 20.3%) account for the highest median family income in San Anselmo with $250,001 per family, while 2-person families (1,543 | 45.3%) have the highest median income of $97,422 per family member.
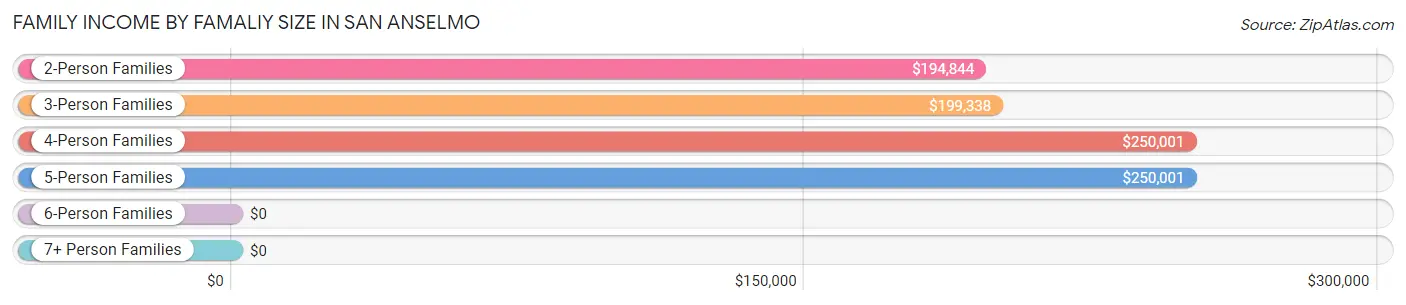
| Income Bracket | # Families | Median Income |
| 2-Person Families | 1,543 (45.3%) | $194,844 |
| 3-Person Families | 799 (23.5%) | $199,338 |
| 4-Person Families | 691 (20.3%) | $250,001 |
| 5-Person Families | 326 (9.6%) | $250,001 |
| 6-Person Families | 45 (1.3%) | $0 |
| 7+ Person Families | 0 (0.0%) | $0 |
| Total | 3,404 (100.0%) | $230,588 |
Family Income by Number of Earners in San Anselmo
The median family income in San Anselmo is $230,588, with families comprising 2 earners (1,769) having the highest median family income of $250,001, while families with no earners (188) have the lowest median family income of $124,318, accounting for 52.0% and 5.5% of families, respectively.
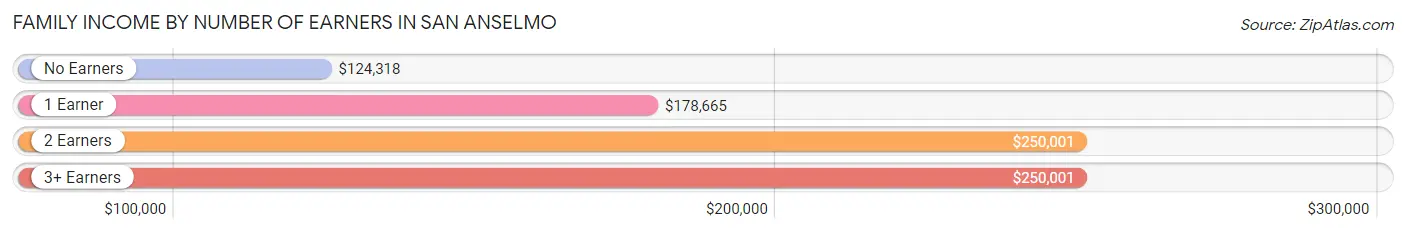
| Number of Earners | # Families | Median Income |
| No Earners | 188 (5.5%) | $124,318 |
| 1 Earner | 1,127 (33.1%) | $178,665 |
| 2 Earners | 1,769 (52.0%) | $250,001 |
| 3+ Earners | 320 (9.4%) | $250,001 |
| Total | 3,404 (100.0%) | $230,588 |
Household Income in San Anselmo
Household Income Brackets in San Anselmo
With 2,133 households falling in the category, the $200,000+ income range is the most frequent in San Anselmo, accounting for 41.9% of all households. In contrast, only 81 households (1.6%) fall into the $10,000 to $14,999 income bracket, making it the least populous group.
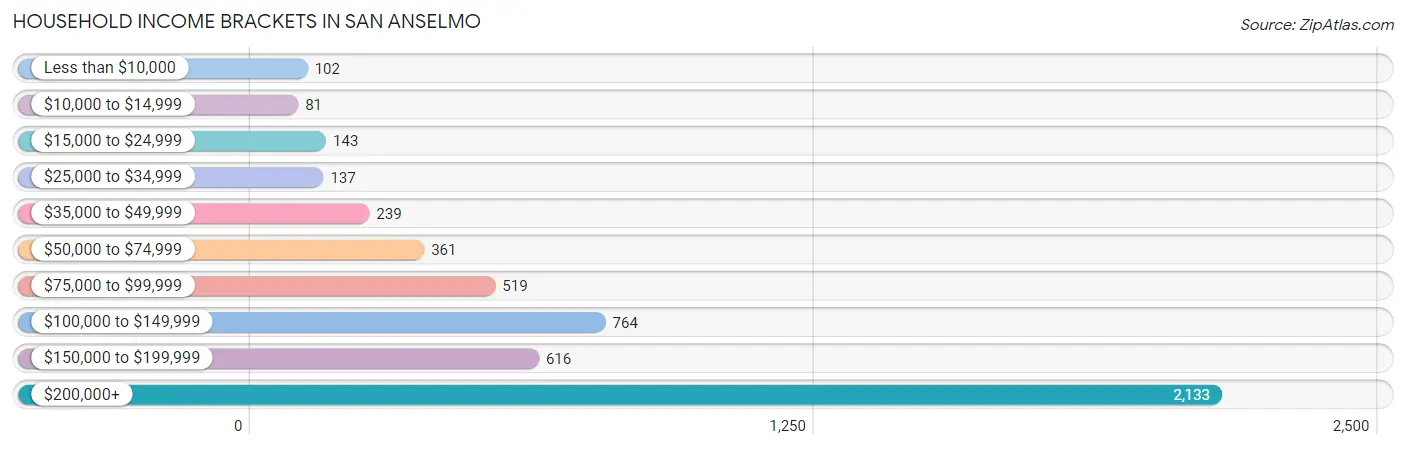
| Income Bracket | # Households | % Households |
| Less than $10,000 | 102 | 2.0% |
| $10,000 to $14,999 | 81 | 1.6% |
| $15,000 to $24,999 | 143 | 2.8% |
| $25,000 to $34,999 | 137 | 2.7% |
| $35,000 to $49,999 | 239 | 4.7% |
| $50,000 to $74,999 | 361 | 7.1% |
| $75,000 to $99,999 | 519 | 10.2% |
| $100,000 to $149,999 | 764 | 15.0% |
| $150,000 to $199,999 | 616 | 12.1% |
| $200,000+ | 2,133 | 41.9% |
Household Income by Householder Age in San Anselmo
The median household income in San Anselmo is $165,366, with the highest median household income of $217,206 found in the 45 to 64 years age bracket for the primary householder. A total of 2,320 households (45.6%) fall into this category. Meanwhile, the 15 to 24 years age bracket for the primary householder has the lowest median household income of $0, with 42 households (0.8%) in this group.
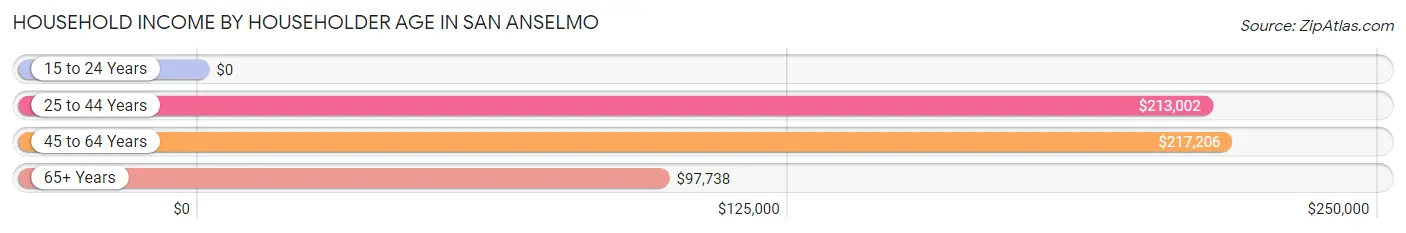
| Income Bracket | # Households | Median Income |
| 15 to 24 Years | 42 (0.8%) | $0 |
| 25 to 44 Years | 1,095 (21.5%) | $213,002 |
| 45 to 64 Years | 2,320 (45.6%) | $217,206 |
| 65+ Years | 1,634 (32.1%) | $97,738 |
| Total | 5,091 (100.0%) | $165,366 |
Poverty in San Anselmo
Income Below Poverty by Sex and Age in San Anselmo
With 3.4% poverty level for males and 5.2% for females among the residents of San Anselmo, 25 to 34 year old males and under 5 year old females are the most vulnerable to poverty, with 37 males (10.7%) and 31 females (11.4%) in their respective age groups living below the poverty level.
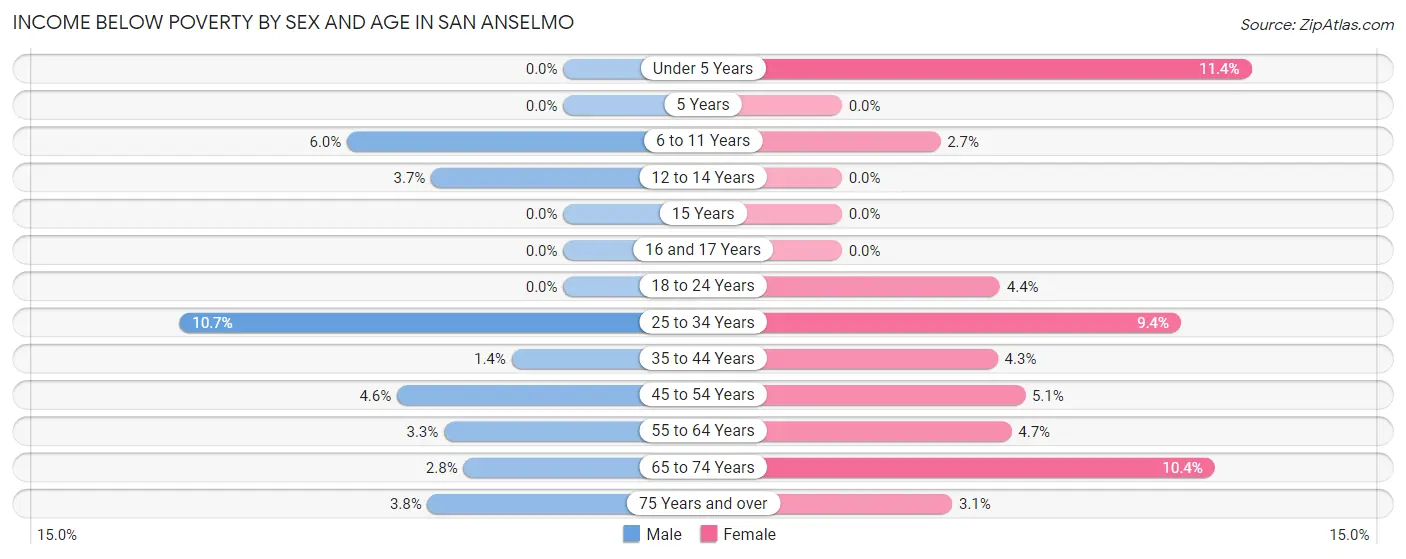
| Age Bracket | Male | Female |
| Under 5 Years | 0 (0.0%) | 31 (11.4%) |
| 5 Years | 0 (0.0%) | 0 (0.0%) |
| 6 to 11 Years | 38 (6.0%) | 10 (2.7%) |
| 12 to 14 Years | 10 (3.7%) | 0 (0.0%) |
| 15 Years | 0 (0.0%) | 0 (0.0%) |
| 16 and 17 Years | 0 (0.0%) | 0 (0.0%) |
| 18 to 24 Years | 0 (0.0%) | 17 (4.4%) |
| 25 to 34 Years | 37 (10.7%) | 49 (9.4%) |
| 35 to 44 Years | 11 (1.4%) | 38 (4.3%) |
| 45 to 54 Years | 49 (4.6%) | 44 (5.1%) |
| 55 to 64 Years | 31 (3.3%) | 52 (4.7%) |
| 65 to 74 Years | 24 (2.8%) | 74 (10.4%) |
| 75 Years and over | 17 (3.8%) | 15 (3.1%) |
| Total | 217 (3.4%) | 330 (5.2%) |
Income Above Poverty by Sex and Age in San Anselmo
According to the poverty statistics in San Anselmo, males aged under 5 years and females aged 5 years are the age groups that are most secure financially, with 100.0% of males and 100.0% of females in these age groups living above the poverty line.
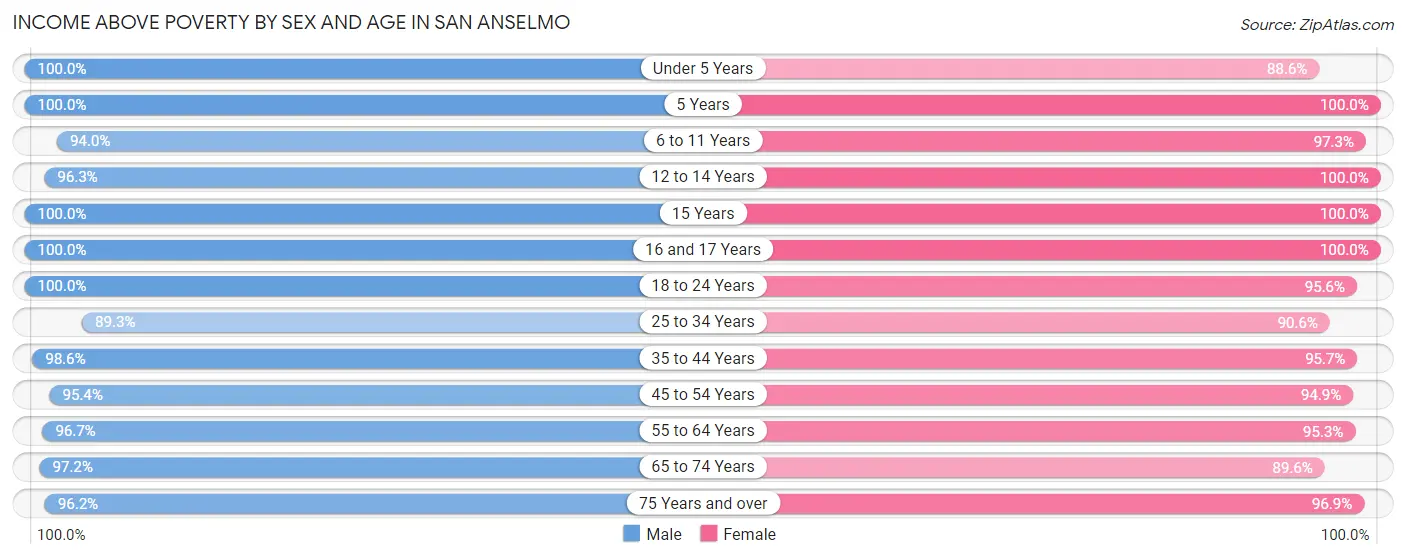
| Age Bracket | Male | Female |
| Under 5 Years | 409 (100.0%) | 241 (88.6%) |
| 5 Years | 135 (100.0%) | 169 (100.0%) |
| 6 to 11 Years | 593 (94.0%) | 355 (97.3%) |
| 12 to 14 Years | 262 (96.3%) | 209 (100.0%) |
| 15 Years | 136 (100.0%) | 167 (100.0%) |
| 16 and 17 Years | 114 (100.0%) | 155 (100.0%) |
| 18 to 24 Years | 307 (100.0%) | 369 (95.6%) |
| 25 to 34 Years | 309 (89.3%) | 470 (90.6%) |
| 35 to 44 Years | 754 (98.6%) | 837 (95.7%) |
| 45 to 54 Years | 1,010 (95.4%) | 818 (94.9%) |
| 55 to 64 Years | 902 (96.7%) | 1,050 (95.3%) |
| 65 to 74 Years | 838 (97.2%) | 639 (89.6%) |
| 75 Years and over | 433 (96.2%) | 474 (96.9%) |
| Total | 6,202 (96.6%) | 5,953 (94.8%) |
Income Below Poverty Among Married-Couple Families in San Anselmo
The poverty statistics for married-couple families in San Anselmo show that 0.8% or 23 of the total 2,813 families live below the poverty line. Families with 3 or 4 children have the highest poverty rate of 4.3%, comprising of 11 families. On the other hand, families with 1 or 2 children have the lowest poverty rate of 0.0%, which includes 0 families.
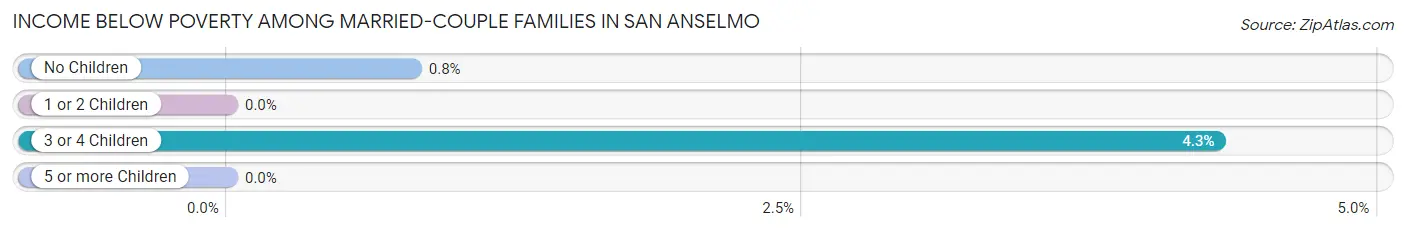
| Children | Above Poverty | Below Poverty |
| No Children | 1,492 (99.2%) | 12 (0.8%) |
| 1 or 2 Children | 1,053 (100.0%) | 0 (0.0%) |
| 3 or 4 Children | 245 (95.7%) | 11 (4.3%) |
| 5 or more Children | 0 (0.0%) | 0 (0.0%) |
| Total | 2,790 (99.2%) | 23 (0.8%) |
Income Below Poverty Among Single-Parent Households in San Anselmo
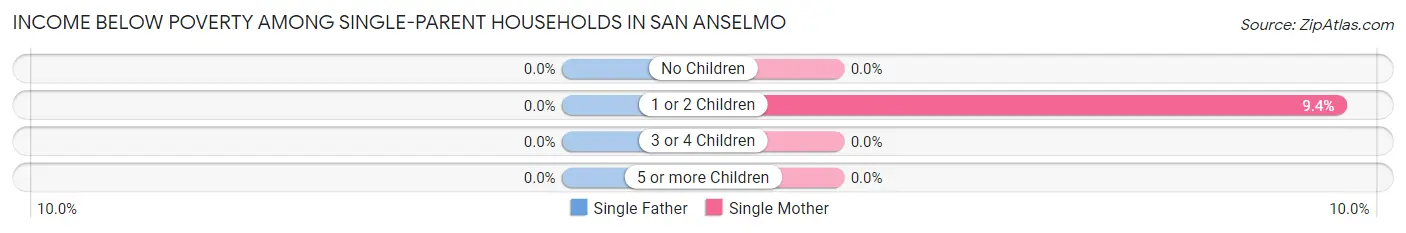
| Children | Single Father | Single Mother |
| No Children | 0 (0.0%) | 0 (0.0%) |
| 1 or 2 Children | 0 (0.0%) | 28 (9.4%) |
| 3 or 4 Children | 0 (0.0%) | 0 (0.0%) |
| 5 or more Children | 0 (0.0%) | 0 (0.0%) |
| Total | 0 (0.0%) | 28 (7.0%) |
Income Below Poverty Among Married-Couple vs Single-Parent Households in San Anselmo
The poverty data for San Anselmo shows that 23 of the married-couple family households (0.8%) and 28 of the single-parent households (4.7%) are living below the poverty level. Within the married-couple family households, those with 3 or 4 children have the highest poverty rate, with 11 households (4.3%) falling below the poverty line. Among the single-parent households, those with 1 or 2 children have the highest poverty rate, with 28 household (7.4%) living below poverty.
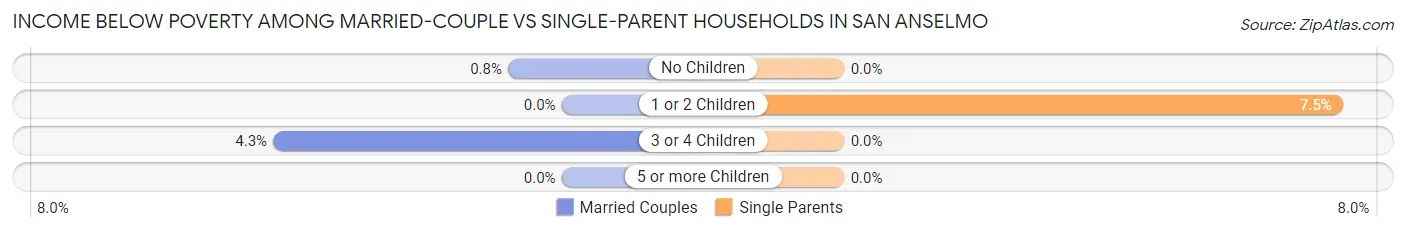
| Children | Married-Couple Families | Single-Parent Households |
| No Children | 12 (0.8%) | 0 (0.0%) |
| 1 or 2 Children | 0 (0.0%) | 28 (7.4%) |
| 3 or 4 Children | 11 (4.3%) | 0 (0.0%) |
| 5 or more Children | 0 (0.0%) | 0 (0.0%) |
| Total | 23 (0.8%) | 28 (4.7%) |
Race in San Anselmo
The most populous races in San Anselmo are White / Caucasian (10,638 | 83.4%), Hispanic or Latino (921 | 7.2%), and Two or more Races (774 | 6.1%).
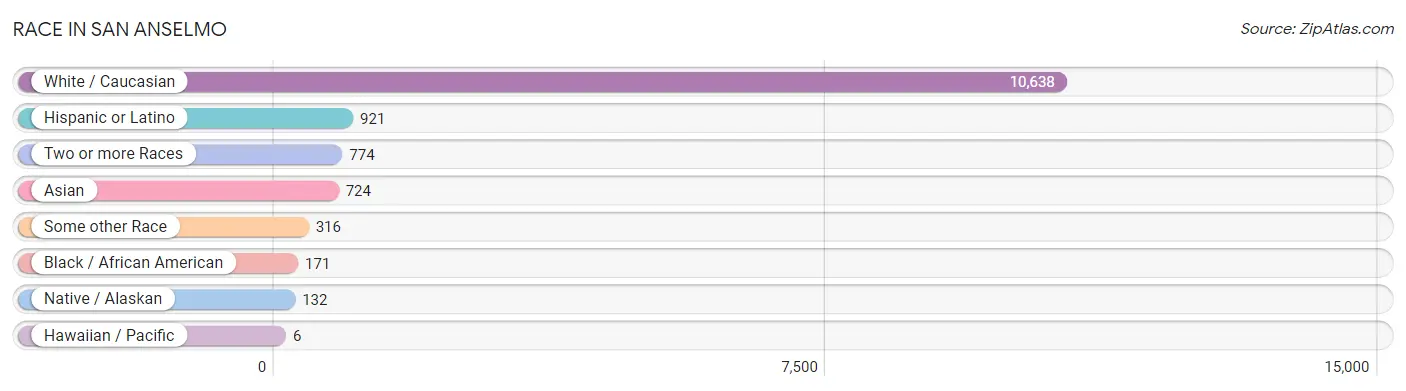
| Race | # Population | % Population |
| Asian | 724 | 5.7% |
| Black / African American | 171 | 1.3% |
| Hawaiian / Pacific | 6 | 0.1% |
| Hispanic or Latino | 921 | 7.2% |
| Native / Alaskan | 132 | 1.0% |
| White / Caucasian | 10,638 | 83.4% |
| Two or more Races | 774 | 6.1% |
| Some other Race | 316 | 2.5% |
| Total | 12,761 | 100.0% |
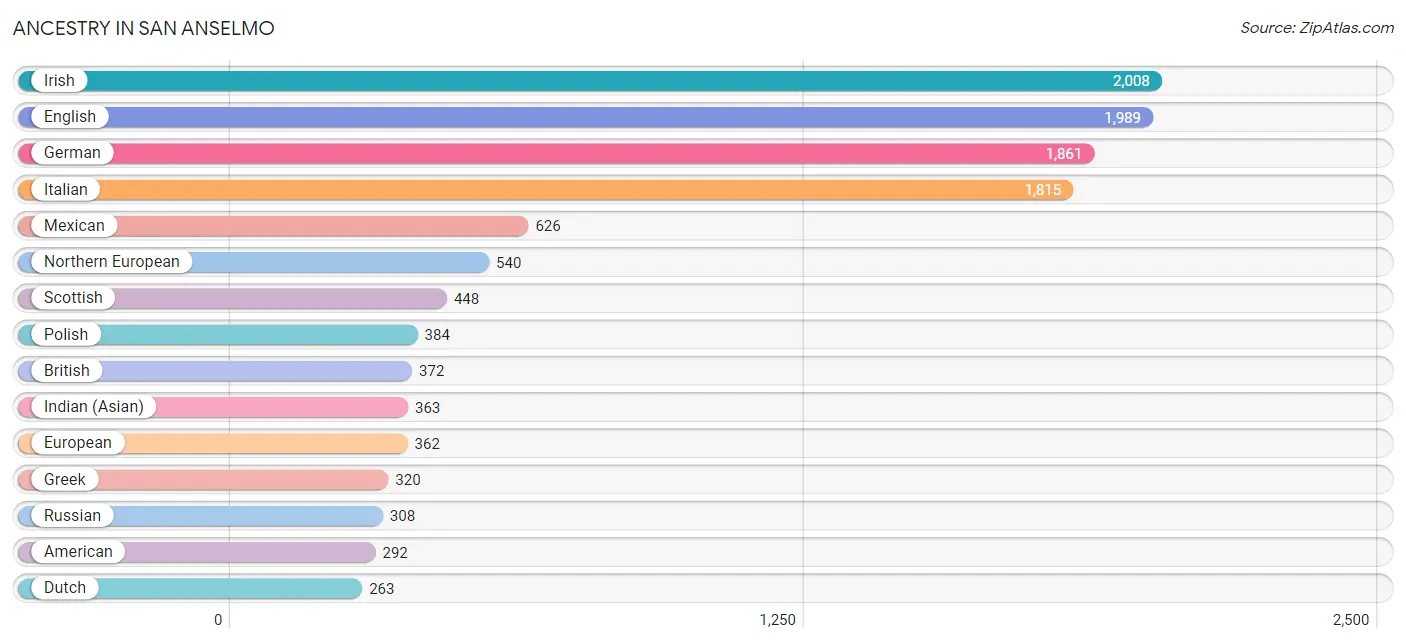
Ancestry in San Anselmo
The most populous ancestries reported in San Anselmo are Irish (2,008 | 15.7%), English (1,989 | 15.6%), German (1,861 | 14.6%), Italian (1,815 | 14.2%), and Mexican (626 | 4.9%), together accounting for 65.0% of all San Anselmo residents.
| Ancestry | # Population | % Population |
| American | 292 | 2.3% |
| Arab | 38 | 0.3% |
| Armenian | 6 | 0.1% |
| Australian | 36 | 0.3% |
| Austrian | 29 | 0.2% |
| Belgian | 11 | 0.1% |
| Bhutanese | 189 | 1.5% |
| Brazilian | 8 | 0.1% |
| British | 372 | 2.9% |
| Burmese | 89 | 0.7% |
| Central American | 1 | 0.0% |
| Cherokee | 16 | 0.1% |
| Chilean | 94 | 0.7% |
| Colombian | 20 | 0.2% |
| Creek | 5 | 0.0% |
| Croatian | 79 | 0.6% |
| Cuban | 49 | 0.4% |
| Czech | 74 | 0.6% |
| Czechoslovakian | 8 | 0.1% |
| Danish | 78 | 0.6% |
| Dominican | 37 | 0.3% |
| Dutch | 263 | 2.1% |
| Eastern European | 186 | 1.5% |
| Egyptian | 5 | 0.0% |
| English | 1,989 | 15.6% |
| European | 362 | 2.8% |
| Finnish | 21 | 0.2% |
| French | 258 | 2.0% |
| French Canadian | 237 | 1.9% |
| German | 1,861 | 14.6% |
| Greek | 320 | 2.5% |
| Guatemalan | 1 | 0.0% |
| Hungarian | 21 | 0.2% |
| Indian (Asian) | 363 | 2.8% |
| Iranian | 94 | 0.7% |
| Irish | 2,008 | 15.7% |
| Italian | 1,815 | 14.2% |
| Korean | 211 | 1.7% |
| Laotian | 5 | 0.0% |
| Lebanese | 25 | 0.2% |
| Lithuanian | 79 | 0.6% |
| Mexican | 626 | 4.9% |
| Navajo | 90 | 0.7% |
| Northern European | 540 | 4.2% |
| Norwegian | 240 | 1.9% |
| Pakistani | 15 | 0.1% |
| Pennsylvania German | 8 | 0.1% |
| Peruvian | 10 | 0.1% |
| Polish | 384 | 3.0% |
| Portuguese | 88 | 0.7% |
| Romanian | 11 | 0.1% |
| Russian | 308 | 2.4% |
| Scandinavian | 17 | 0.1% |
| Scotch-Irish | 64 | 0.5% |
| Scottish | 448 | 3.5% |
| Slovak | 11 | 0.1% |
| South American | 124 | 1.0% |
| South American Indian | 20 | 0.2% |
| Spaniard | 68 | 0.5% |
| Swedish | 239 | 1.9% |
| Swiss | 103 | 0.8% |
| Thai | 140 | 1.1% |
| Ukrainian | 18 | 0.1% |
| Welsh | 160 | 1.3% |
| Yugoslavian | 16 | 0.1% | View All 65 Rows |
Immigrants in San Anselmo
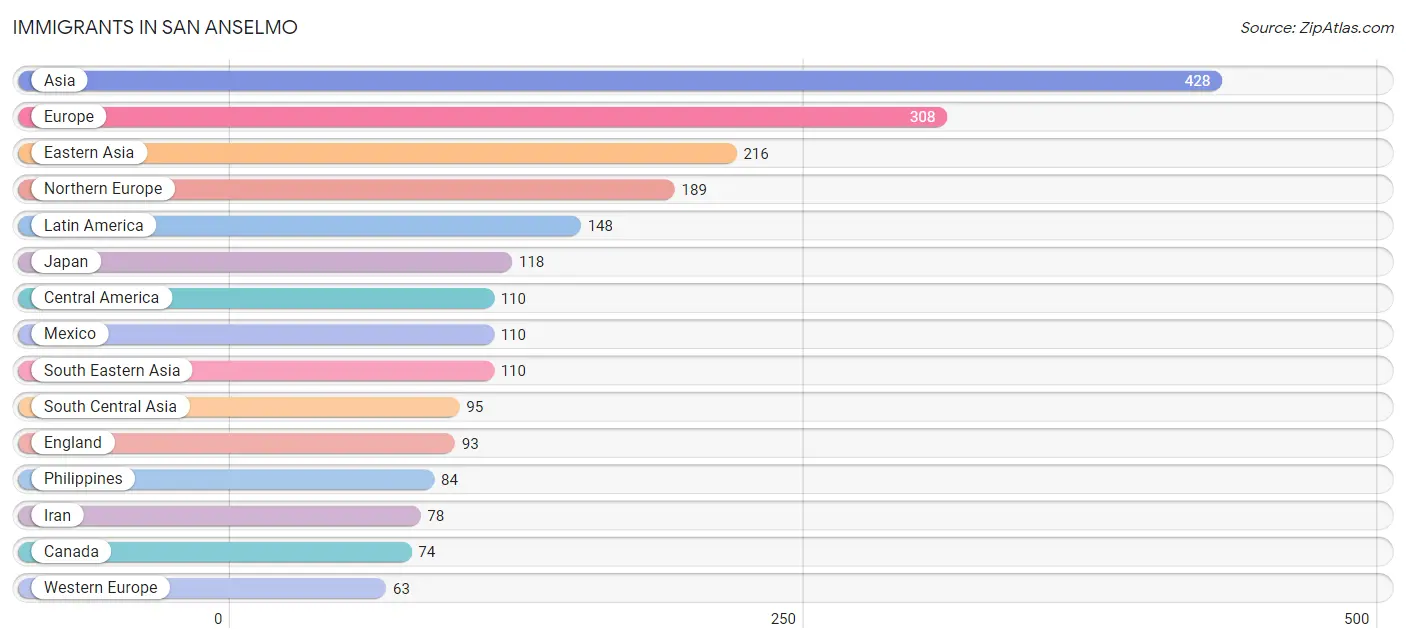
The most numerous immigrant groups reported in San Anselmo came from Asia (428 | 3.4%), Europe (308 | 2.4%), Eastern Asia (216 | 1.7%), Northern Europe (189 | 1.5%), and Latin America (148 | 1.2%), together accounting for 10.1% of all San Anselmo residents.
| Immigration Origin | # Population | % Population |
| Asia | 428 | 3.4% |
| Austria | 8 | 0.1% |
| Bangladesh | 1 | 0.0% |
| Brazil | 8 | 0.1% |
| Canada | 74 | 0.6% |
| Central America | 110 | 0.9% |
| Chile | 20 | 0.2% |
| China | 42 | 0.3% |
| Denmark | 23 | 0.2% |
| Eastern Asia | 216 | 1.7% |
| Eastern Europe | 33 | 0.3% |
| England | 93 | 0.7% |
| Europe | 308 | 2.4% |
| Fiji | 6 | 0.1% |
| France | 17 | 0.1% |
| Germany | 30 | 0.2% |
| India | 16 | 0.1% |
| Indonesia | 5 | 0.0% |
| Iran | 78 | 0.6% |
| Ireland | 29 | 0.2% |
| Israel | 7 | 0.1% |
| Italy | 6 | 0.1% |
| Japan | 118 | 0.9% |
| Korea | 56 | 0.4% |
| Latin America | 148 | 1.2% |
| Malaysia | 15 | 0.1% |
| Mexico | 110 | 0.9% |
| Northern Europe | 189 | 1.5% |
| Oceania | 6 | 0.1% |
| Peru | 10 | 0.1% |
| Philippines | 84 | 0.7% |
| Russia | 13 | 0.1% |
| Scotland | 14 | 0.1% |
| South America | 38 | 0.3% |
| South Central Asia | 95 | 0.7% |
| South Eastern Asia | 110 | 0.9% |
| Southern Europe | 23 | 0.2% |
| Spain | 17 | 0.1% |
| Switzerland | 8 | 0.1% |
| Thailand | 6 | 0.1% |
| Western Asia | 7 | 0.1% |
| Western Europe | 63 | 0.5% | View All 42 Rows |
Sex and Age in San Anselmo
Sex and Age in San Anselmo
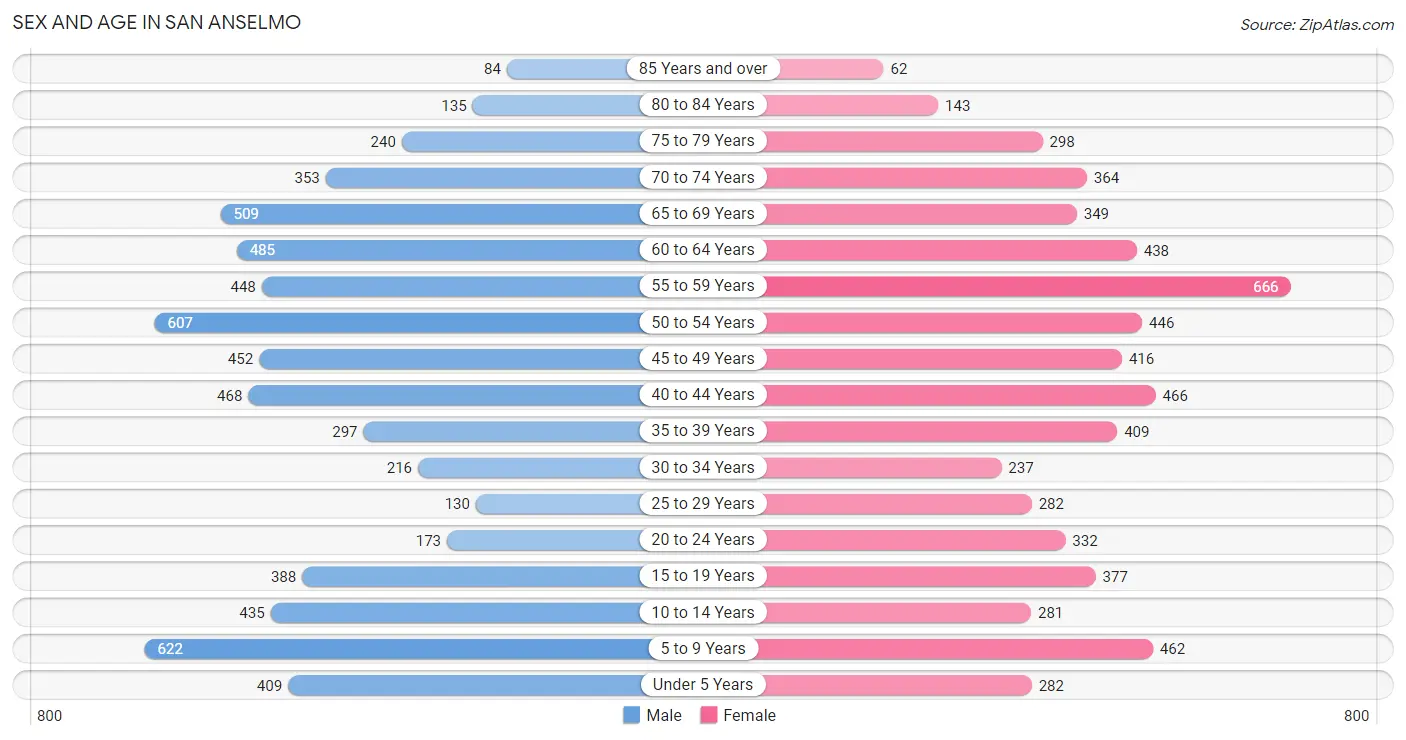
The most populous age groups in San Anselmo are 5 to 9 Years (622 | 9.6%) for men and 55 to 59 Years (666 | 10.5%) for women.
| Age Bracket | Male | Female |
| Under 5 Years | 409 (6.3%) | 282 (4.5%) |
| 5 to 9 Years | 622 (9.6%) | 462 (7.3%) |
| 10 to 14 Years | 435 (6.7%) | 281 (4.4%) |
| 15 to 19 Years | 388 (6.0%) | 377 (6.0%) |
| 20 to 24 Years | 173 (2.7%) | 332 (5.3%) |
| 25 to 29 Years | 130 (2.0%) | 282 (4.5%) |
| 30 to 34 Years | 216 (3.4%) | 237 (3.8%) |
| 35 to 39 Years | 297 (4.6%) | 409 (6.5%) |
| 40 to 44 Years | 468 (7.2%) | 466 (7.4%) |
| 45 to 49 Years | 452 (7.0%) | 416 (6.6%) |
| 50 to 54 Years | 607 (9.4%) | 446 (7.1%) |
| 55 to 59 Years | 448 (6.9%) | 666 (10.5%) |
| 60 to 64 Years | 485 (7.5%) | 438 (6.9%) |
| 65 to 69 Years | 509 (7.9%) | 349 (5.5%) |
| 70 to 74 Years | 353 (5.5%) | 364 (5.8%) |
| 75 to 79 Years | 240 (3.7%) | 298 (4.7%) |
| 80 to 84 Years | 135 (2.1%) | 143 (2.3%) |
| 85 Years and over | 84 (1.3%) | 62 (1.0%) |
| Total | 6,451 (100.0%) | 6,310 (100.0%) |
Families and Households in San Anselmo
Median Family Size in San Anselmo
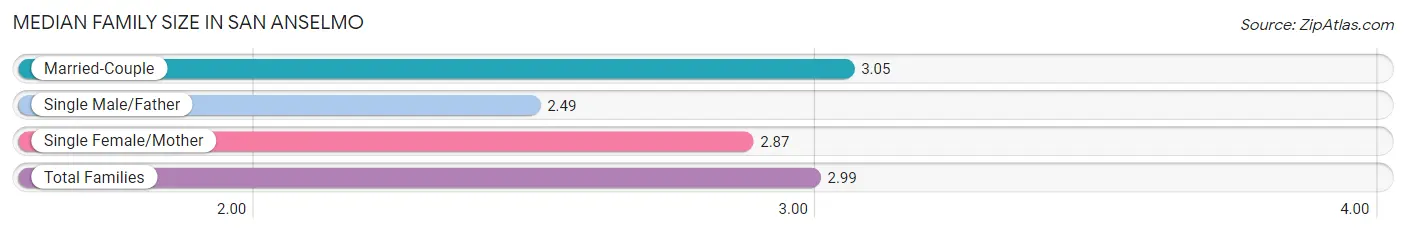
The median family size in San Anselmo is 2.99 persons per family, with married-couple families (2,813 | 82.6%) accounting for the largest median family size of 3.05 persons per family. On the other hand, single male/father families (188 | 5.5%) represent the smallest median family size with 2.49 persons per family.
| Family Type | # Families | Family Size |
| Married-Couple | 2,813 (82.6%) | 3.05 |
| Single Male/Father | 188 (5.5%) | 2.49 |
| Single Female/Mother | 403 (11.8%) | 2.87 |
| Total Families | 3,404 (100.0%) | 2.99 |
Median Household Size in San Anselmo
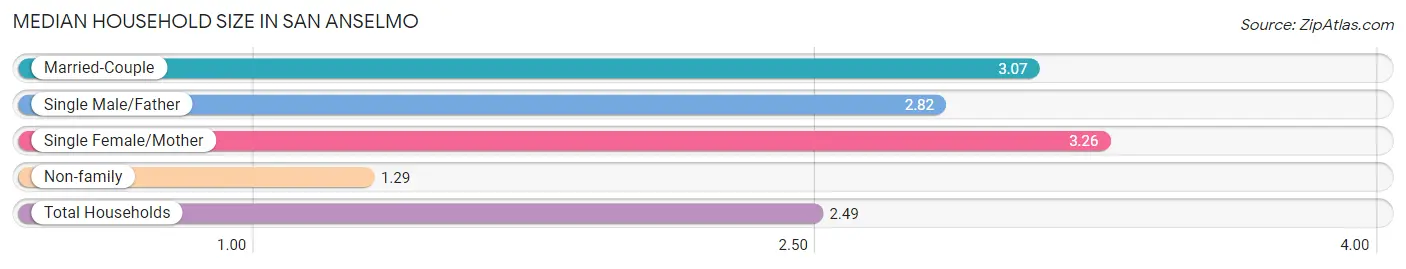
The median household size in San Anselmo is 2.49 persons per household, with single female/mother households (403 | 7.9%) accounting for the largest median household size of 3.26 persons per household. non-family households (1,687 | 33.1%) represent the smallest median household size with 1.29 persons per household.
| Household Type | # Households | Household Size |
| Married-Couple | 2,813 (55.2%) | 3.07 |
| Single Male/Father | 188 (3.7%) | 2.82 |
| Single Female/Mother | 403 (7.9%) | 3.26 |
| Non-family | 1,687 (33.1%) | 1.29 |
| Total Households | 5,091 (100.0%) | 2.49 |
Household Size by Marriage Status in San Anselmo
Out of a total of 5,091 households in San Anselmo, 3,404 (66.9%) are family households, while 1,687 (33.1%) are nonfamily households. The most numerous type of family households are 2-person households, comprising 1,499, and the most common type of nonfamily households are 1-person households, comprising 1,260.
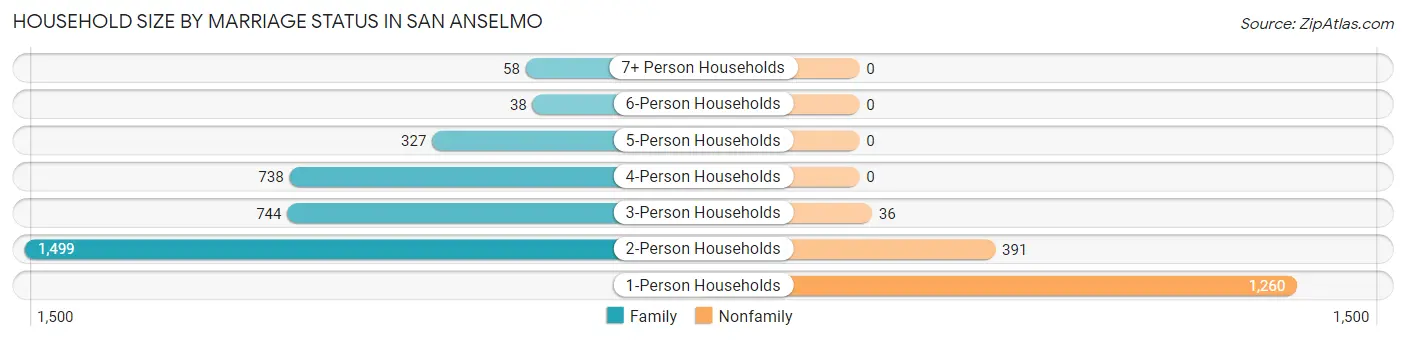
| Household Size | Family Households | Nonfamily Households |
| 1-Person Households | - | 1,260 (24.7%) |
| 2-Person Households | 1,499 (29.4%) | 391 (7.7%) |
| 3-Person Households | 744 (14.6%) | 36 (0.7%) |
| 4-Person Households | 738 (14.5%) | 0 (0.0%) |
| 5-Person Households | 327 (6.4%) | 0 (0.0%) |
| 6-Person Households | 38 (0.7%) | 0 (0.0%) |
| 7+ Person Households | 58 (1.1%) | 0 (0.0%) |
| Total | 3,404 (66.9%) | 1,687 (33.1%) |
Female Fertility in San Anselmo
Fertility by Age in San Anselmo
Average fertility rate in San Anselmo is 36.0 births per 1,000 women. Women in the age bracket of 35 to 50 years have the highest fertility rate with 53.0 births per 1,000 women. Women in the age bracket of 35 to 50 years acount for 76.6% of all women with births.
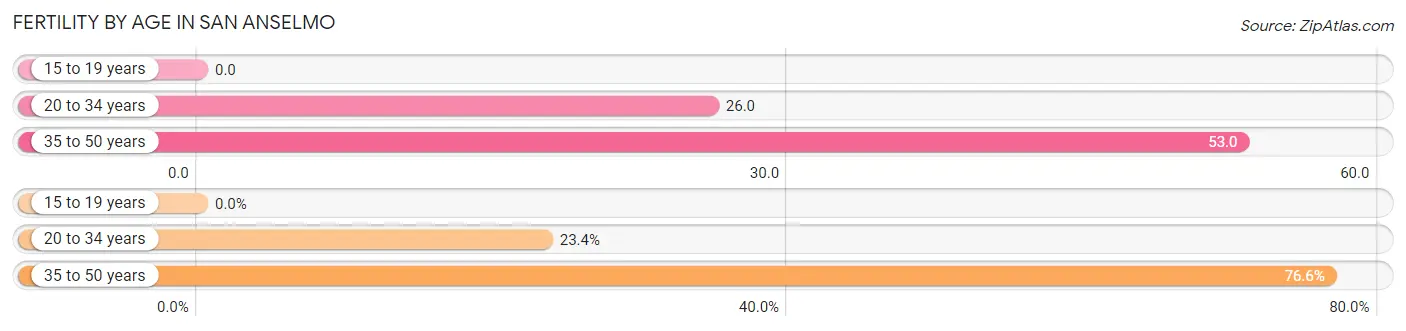
| Age Bracket | Women with Births | Births / 1,000 Women |
| 15 to 19 years | 0 (0.0%) | 0.0 |
| 20 to 34 years | 22 (23.4%) | 26.0 |
| 35 to 50 years | 72 (76.6%) | 53.0 |
| Total | 94 (100.0%) | 36.0 |
Fertility by Age by Marriage Status in San Anselmo
84.0% of women with births (94) in San Anselmo are married. The highest percentage of unmarried women with births falls into 35 to 50 years age bracket with 20.8% of them unmarried at the time of birth, while the lowest percentage of unmarried women with births belong to 20 to 34 years age bracket with 0.0% of them unmarried.
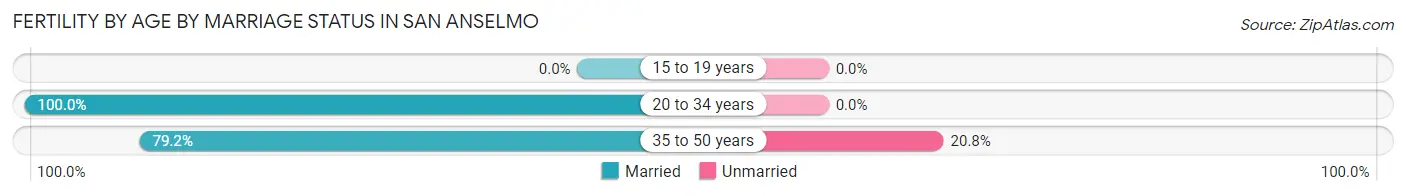
| Age Bracket | Married | Unmarried |
| 15 to 19 years | 0 (0.0%) | 0 (0.0%) |
| 20 to 34 years | 22 (100.0%) | 0 (0.0%) |
| 35 to 50 years | 57 (79.2%) | 15 (20.8%) |
| Total | 79 (84.0%) | 15 (16.0%) |
Fertility by Education in San Anselmo
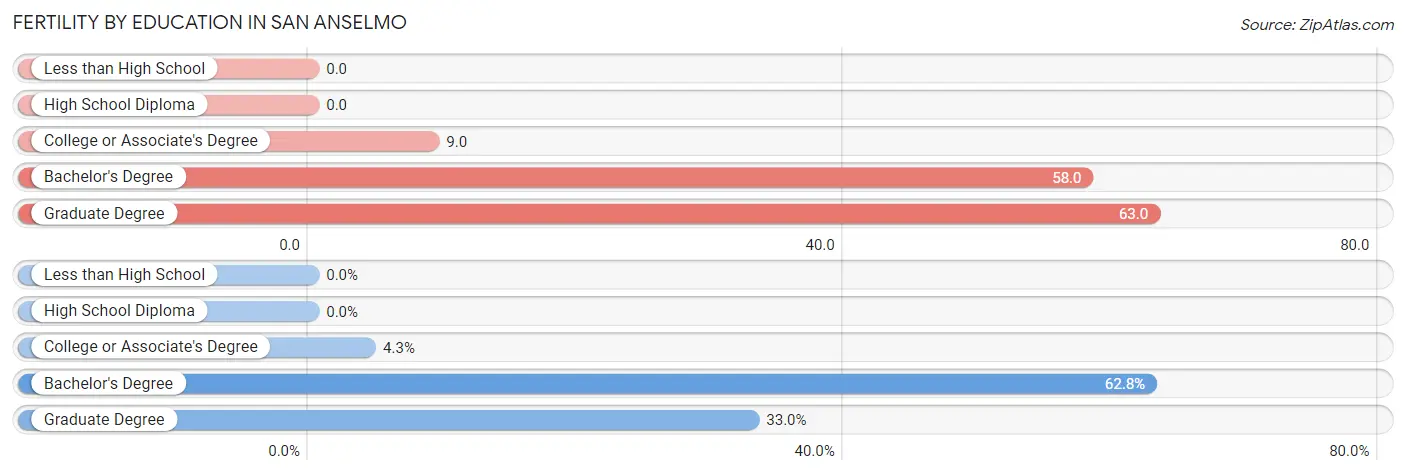
| Educational Attainment | Women with Births | Births / 1,000 Women |
| Less than High School | 0 (0.0%) | 0.0 |
| High School Diploma | 0 (0.0%) | 0.0 |
| College or Associate's Degree | 4 (4.3%) | 9.0 |
| Bachelor's Degree | 59 (62.8%) | 58.0 |
| Graduate Degree | 31 (33.0%) | 63.0 |
| Total | 94 (100.0%) | 36.0 |
Fertility by Education by Marriage Status in San Anselmo
16.0% of women with births in San Anselmo are unmarried. Women with the educational attainment of college or associate's degree are most likely to be married with 100.0% of them married at childbirth, while women with the educational attainment of bachelor's degree are least likely to be married with 25.4% of them unmarried at childbirth.
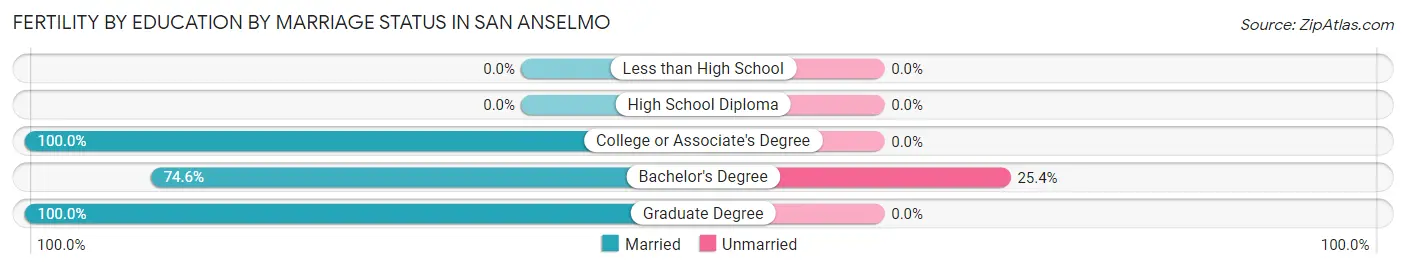
| Educational Attainment | Married | Unmarried |
| Less than High School | 0 (0.0%) | 0 (0.0%) |
| High School Diploma | 0 (0.0%) | 0 (0.0%) |
| College or Associate's Degree | 4 (100.0%) | 0 (0.0%) |
| Bachelor's Degree | 44 (74.6%) | 15 (25.4%) |
| Graduate Degree | 31 (100.0%) | 0 (0.0%) |
| Total | 79 (84.0%) | 15 (16.0%) |
Employment Characteristics in San Anselmo
Employment by Class of Employer in San Anselmo
Among the 6,620 employed individuals in San Anselmo, private company employees (3,427 | 51.8%), self-employed (not incorporated) (1,114 | 16.8%), and not-for-profit organizations (680 | 10.3%) make up the most common classes of employment.
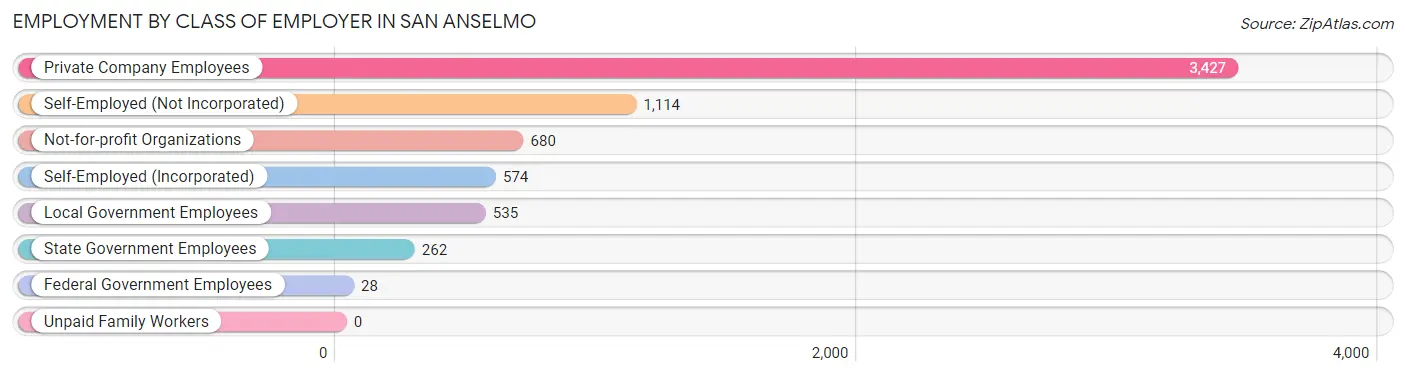
| Employer Class | # Employees | % Employees |
| Private Company Employees | 3,427 | 51.8% |
| Self-Employed (Incorporated) | 574 | 8.7% |
| Self-Employed (Not Incorporated) | 1,114 | 16.8% |
| Not-for-profit Organizations | 680 | 10.3% |
| Local Government Employees | 535 | 8.1% |
| State Government Employees | 262 | 4.0% |
| Federal Government Employees | 28 | 0.4% |
| Unpaid Family Workers | 0 | 0.0% |
| Total | 6,620 | 100.0% |
Employment Status by Age in San Anselmo
According to the labor force statistics for San Anselmo, out of the total population over 16 years of age (9,966), 72.3% or 7,205 individuals are in the labor force, with 5.4% or 389 of them unemployed. The age group with the highest labor force participation rate is 35 to 44 years, with 89.6% or 1,469 individuals in the labor force. Within the labor force, the 25 to 29 years age range has the highest percentage of unemployed individuals, with 21.9% or 76 of them being unemployed.
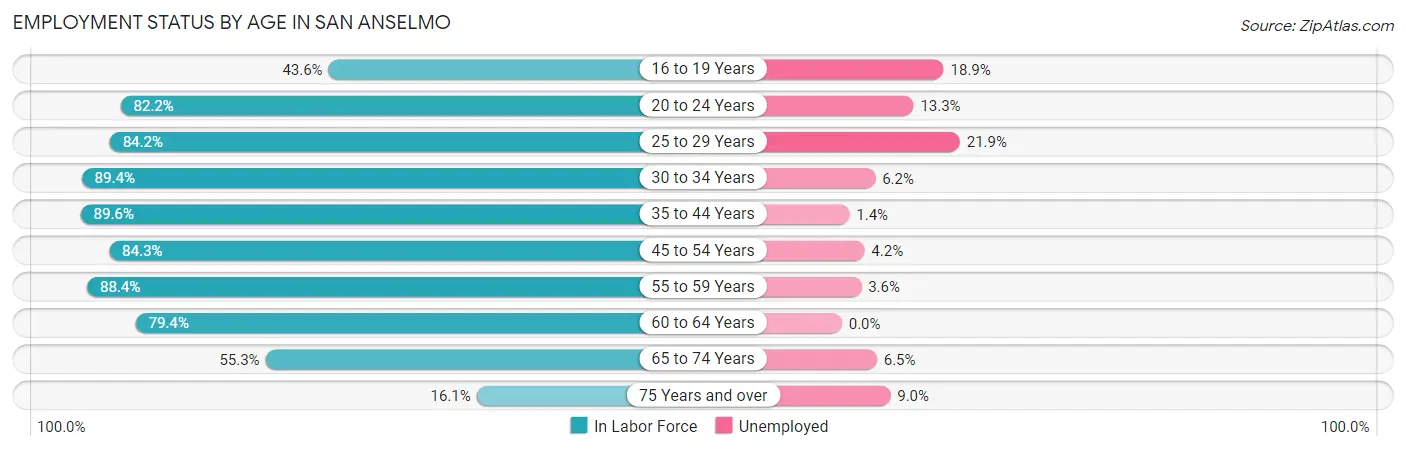
| Age Bracket | In Labor Force | Unemployed |
| 16 to 19 Years | 201 (43.6%) | 38 (18.9%) |
| 20 to 24 Years | 415 (82.2%) | 55 (13.3%) |
| 25 to 29 Years | 347 (84.2%) | 76 (21.9%) |
| 30 to 34 Years | 405 (89.4%) | 25 (6.2%) |
| 35 to 44 Years | 1,469 (89.6%) | 21 (1.4%) |
| 45 to 54 Years | 1,619 (84.3%) | 68 (4.2%) |
| 55 to 59 Years | 985 (88.4%) | 35 (3.6%) |
| 60 to 64 Years | 733 (79.4%) | 0 (0.0%) |
| 65 to 74 Years | 871 (55.3%) | 57 (6.5%) |
| 75 Years and over | 155 (16.1%) | 14 (9.0%) |
| Total | 7,205 (72.3%) | 389 (5.4%) |
Employment Status by Educational Attainment in San Anselmo
According to labor force statistics for San Anselmo, 86.0% of individuals (5,558) out of the total population between 25 and 64 years of age (6,463) are in the labor force, with 4.0% or 222 of them being unemployed. The group with the highest labor force participation rate are those with the educational attainment of bachelor's degree or higher, with 87.7% or 4,281 individuals in the labor force. Within the labor force, individuals with high school diploma education have the highest percentage of unemployment, with 18.7% or 62 of them being unemployed.
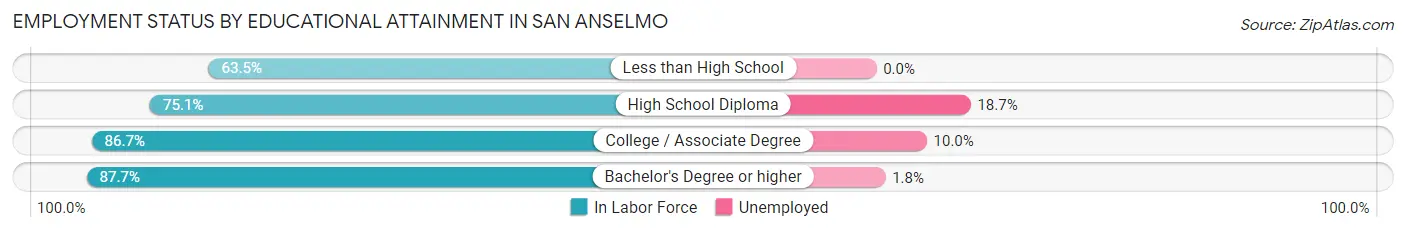
| Educational Attainment | In Labor Force | Unemployed |
| Less than High School | 115 (63.5%) | 0 (0.0%) |
| High School Diploma | 331 (75.1%) | 82 (18.7%) |
| College / Associate Degree | 832 (86.7%) | 96 (10.0%) |
| Bachelor's Degree or higher | 4,281 (87.7%) | 88 (1.8%) |
| Total | 5,558 (86.0%) | 259 (4.0%) |
Employment Occupations by Sex in San Anselmo
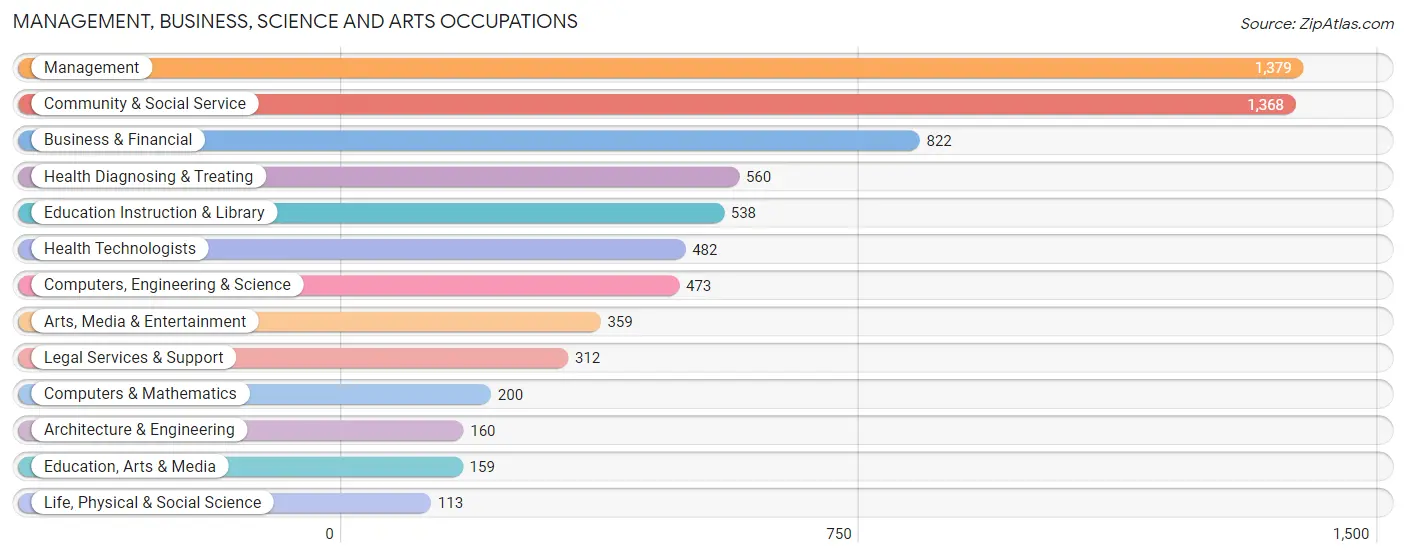
Management, Business, Science and Arts Occupations
The most common Management, Business, Science and Arts occupations in San Anselmo are Management (1,379 | 20.2%), Community & Social Service (1,368 | 20.1%), Business & Financial (822 | 12.1%), Health Diagnosing & Treating (560 | 8.2%), and Education Instruction & Library (538 | 7.9%).
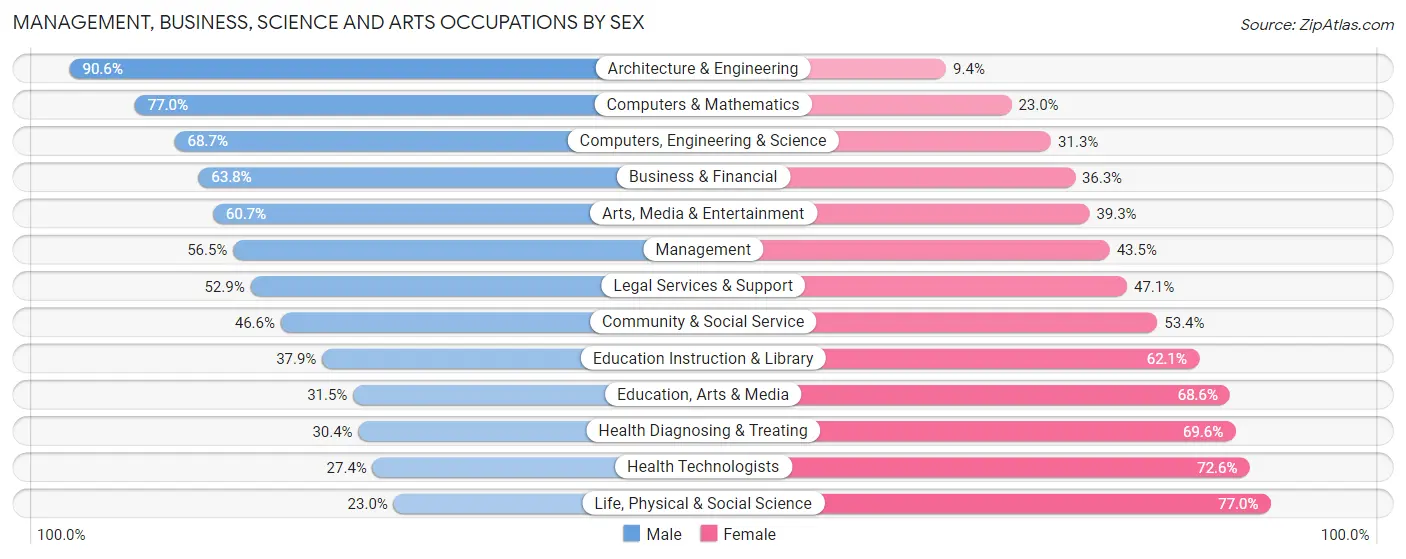
Management, Business, Science and Arts Occupations by Sex
Within the Management, Business, Science and Arts occupations in San Anselmo, the most male-oriented occupations are Architecture & Engineering (90.6%), Computers & Mathematics (77.0%), and Computers, Engineering & Science (68.7%), while the most female-oriented occupations are Life, Physical & Social Science (77.0%), Health Technologists (72.6%), and Health Diagnosing & Treating (69.6%).
| Occupation | Male | Female |
| Management | 779 (56.5%) | 600 (43.5%) |
| Business & Financial | 524 (63.7%) | 298 (36.2%) |
| Computers, Engineering & Science | 325 (68.7%) | 148 (31.3%) |
| Computers & Mathematics | 154 (77.0%) | 46 (23.0%) |
| Architecture & Engineering | 145 (90.6%) | 15 (9.4%) |
| Life, Physical & Social Science | 26 (23.0%) | 87 (77.0%) |
| Community & Social Service | 637 (46.6%) | 731 (53.4%) |
| Education, Arts & Media | 50 (31.5%) | 109 (68.5%) |
| Legal Services & Support | 165 (52.9%) | 147 (47.1%) |
| Education Instruction & Library | 204 (37.9%) | 334 (62.1%) |
| Arts, Media & Entertainment | 218 (60.7%) | 141 (39.3%) |
| Health Diagnosing & Treating | 170 (30.4%) | 390 (69.6%) |
| Health Technologists | 132 (27.4%) | 350 (72.6%) |
| Total (Category) | 2,435 (52.9%) | 2,167 (47.1%) |
| Total (Overall) | 3,689 (54.1%) | 3,124 (45.9%) |
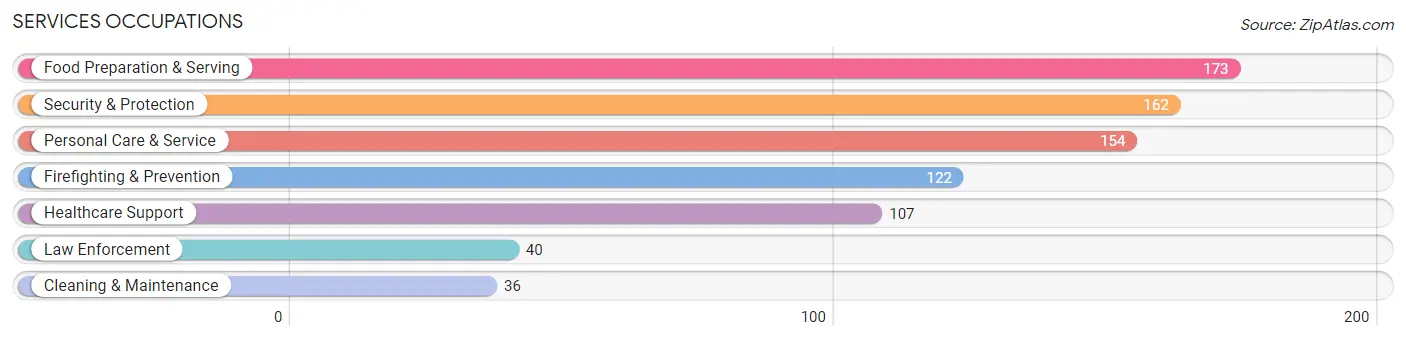
Services Occupations
The most common Services occupations in San Anselmo are Food Preparation & Serving (173 | 2.5%), Security & Protection (162 | 2.4%), Personal Care & Service (154 | 2.3%), Firefighting & Prevention (122 | 1.8%), and Healthcare Support (107 | 1.6%).
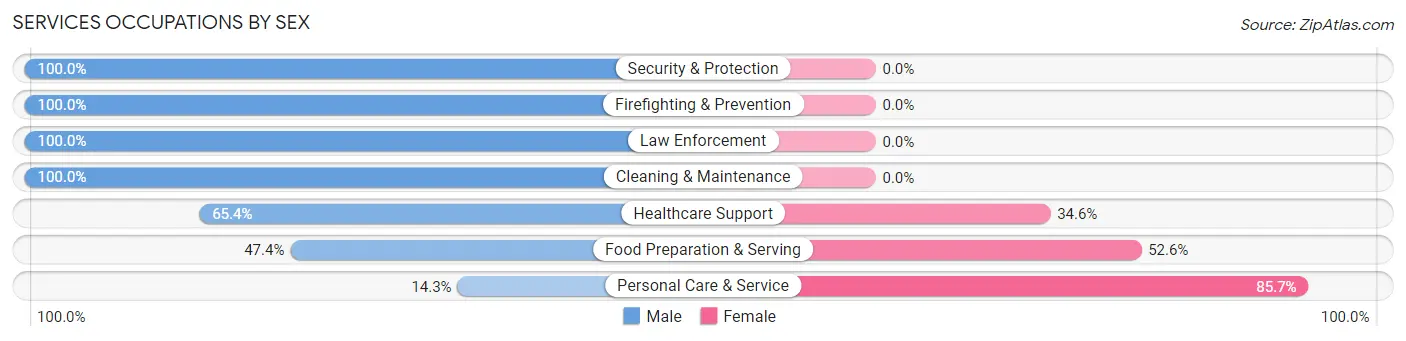
Services Occupations by Sex
Within the Services occupations in San Anselmo, the most male-oriented occupations are Security & Protection (100.0%), Firefighting & Prevention (100.0%), and Law Enforcement (100.0%), while the most female-oriented occupations are Personal Care & Service (85.7%), Food Preparation & Serving (52.6%), and Healthcare Support (34.6%).
| Occupation | Male | Female |
| Healthcare Support | 70 (65.4%) | 37 (34.6%) |
| Security & Protection | 162 (100.0%) | 0 (0.0%) |
| Firefighting & Prevention | 122 (100.0%) | 0 (0.0%) |
| Law Enforcement | 40 (100.0%) | 0 (0.0%) |
| Food Preparation & Serving | 82 (47.4%) | 91 (52.6%) |
| Cleaning & Maintenance | 36 (100.0%) | 0 (0.0%) |
| Personal Care & Service | 22 (14.3%) | 132 (85.7%) |
| Total (Category) | 372 (58.9%) | 260 (41.1%) |
| Total (Overall) | 3,689 (54.1%) | 3,124 (45.9%) |
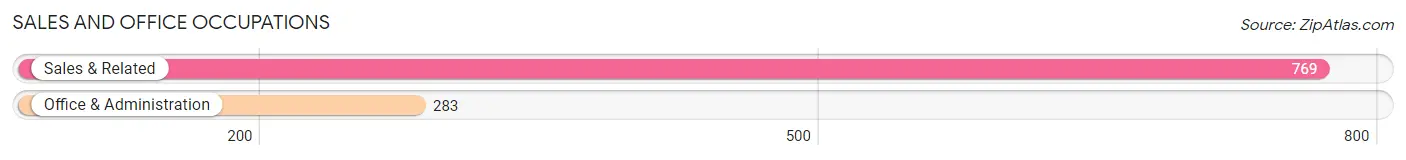
Sales and Office Occupations
The most common Sales and Office occupations in San Anselmo are Sales & Related (769 | 11.3%), and Office & Administration (283 | 4.2%).
Sales and Office Occupations by Sex
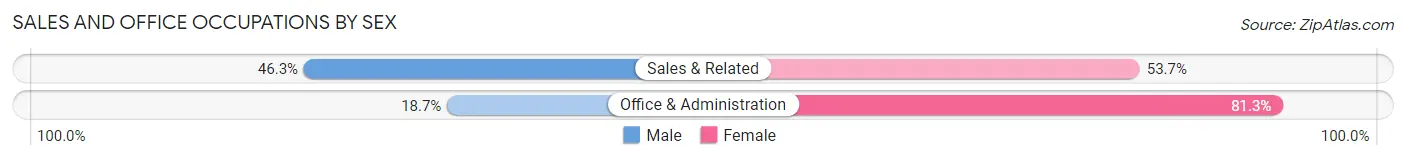
| Occupation | Male | Female |
| Sales & Related | 356 (46.3%) | 413 (53.7%) |
| Office & Administration | 53 (18.7%) | 230 (81.3%) |
| Total (Category) | 409 (38.9%) | 643 (61.1%) |
| Total (Overall) | 3,689 (54.1%) | 3,124 (45.9%) |
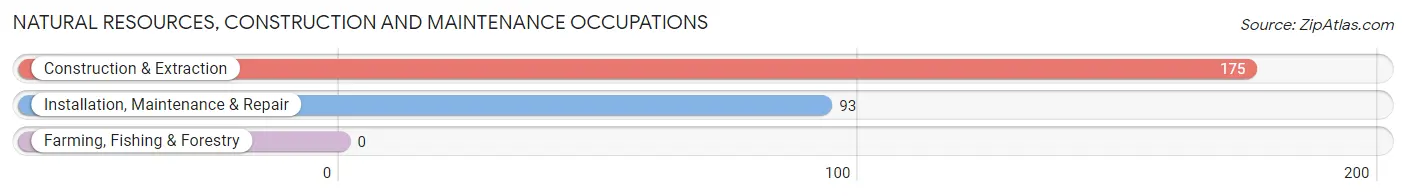
Natural Resources, Construction and Maintenance Occupations
The most common Natural Resources, Construction and Maintenance occupations in San Anselmo are Construction & Extraction (175 | 2.6%), and Installation, Maintenance & Repair (93 | 1.4%).
Natural Resources, Construction and Maintenance Occupations by Sex
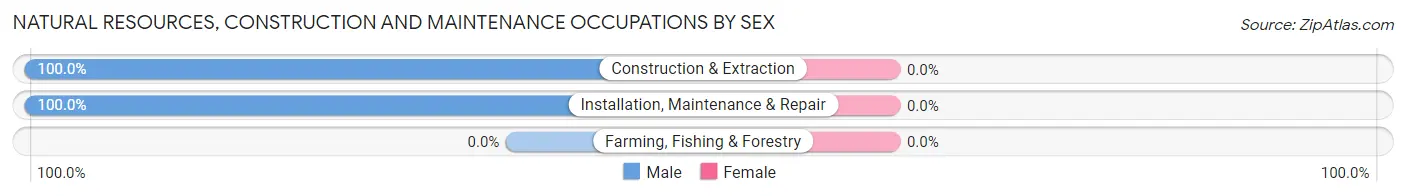
| Occupation | Male | Female |
| Farming, Fishing & Forestry | 0 (0.0%) | 0 (0.0%) |
| Construction & Extraction | 175 (100.0%) | 0 (0.0%) |
| Installation, Maintenance & Repair | 93 (100.0%) | 0 (0.0%) |
| Total (Category) | 268 (100.0%) | 0 (0.0%) |
| Total (Overall) | 3,689 (54.1%) | 3,124 (45.9%) |
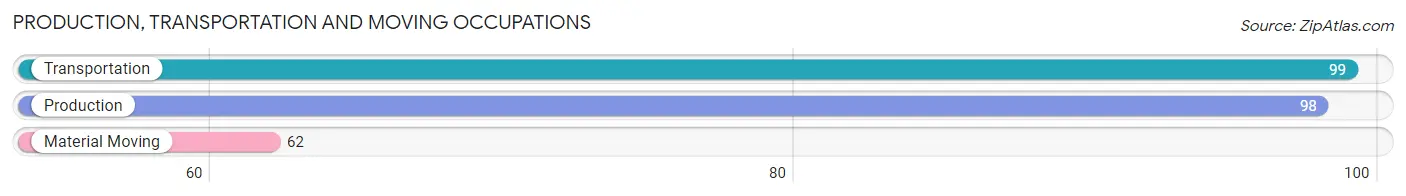
Production, Transportation and Moving Occupations
The most common Production, Transportation and Moving occupations in San Anselmo are Transportation (99 | 1.5%), Production (98 | 1.4%), and Material Moving (62 | 0.9%).
Production, Transportation and Moving Occupations by Sex
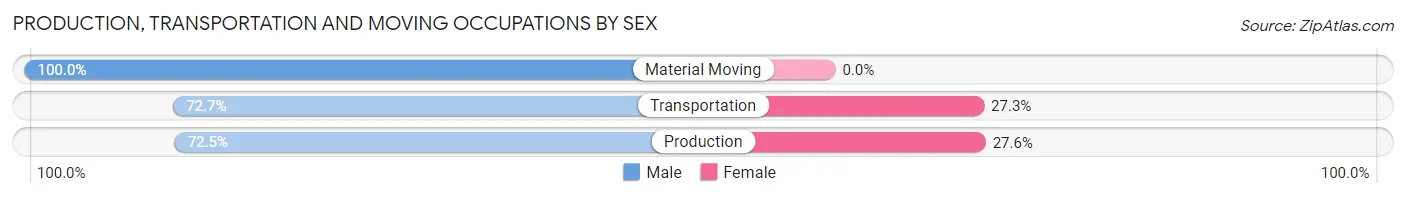
| Occupation | Male | Female |
| Production | 71 (72.5%) | 27 (27.6%) |
| Transportation | 72 (72.7%) | 27 (27.3%) |
| Material Moving | 62 (100.0%) | 0 (0.0%) |
| Total (Category) | 205 (79.1%) | 54 (20.8%) |
| Total (Overall) | 3,689 (54.1%) | 3,124 (45.9%) |
Employment Industries by Sex in San Anselmo
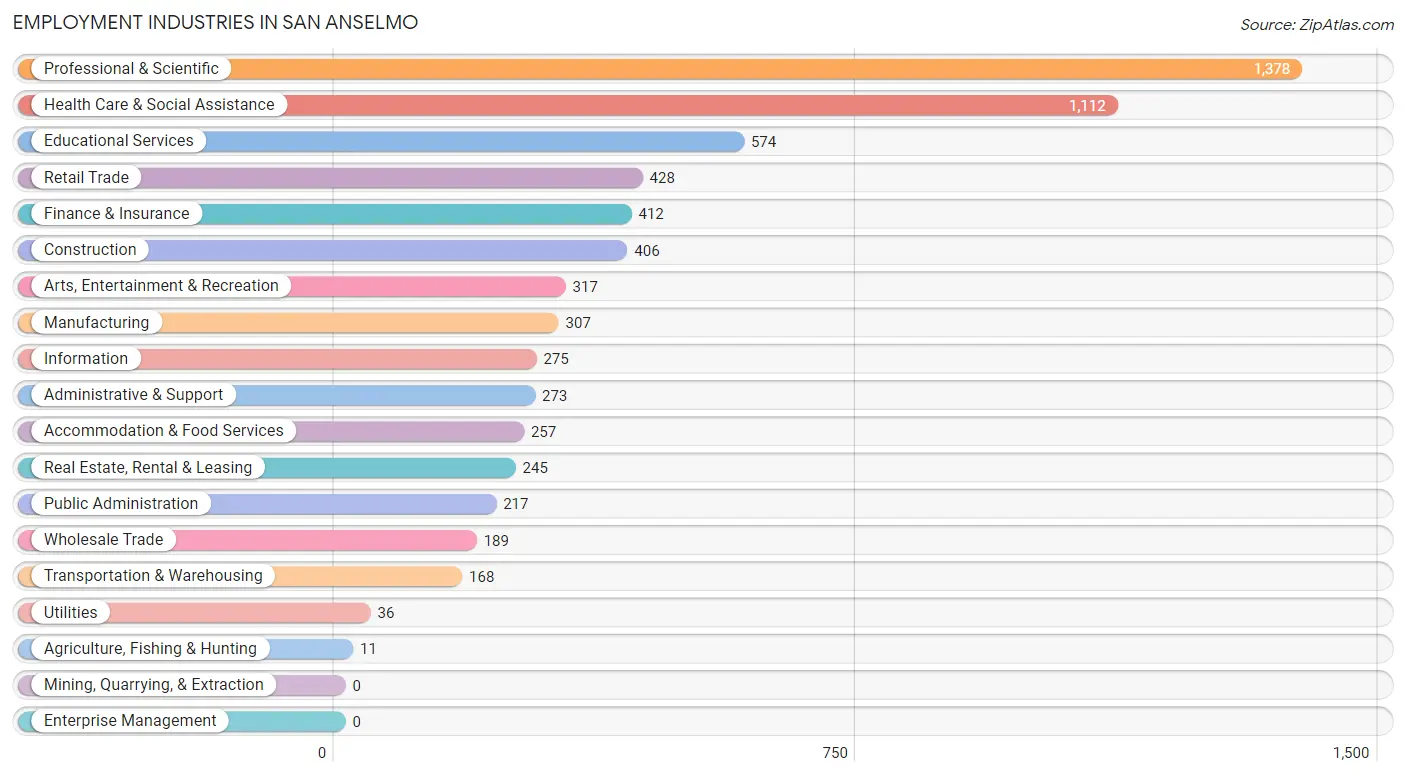
Employment Industries in San Anselmo
The major employment industries in San Anselmo include Professional & Scientific (1,378 | 20.2%), Health Care & Social Assistance (1,112 | 16.3%), Educational Services (574 | 8.4%), Retail Trade (428 | 6.3%), and Finance & Insurance (412 | 6.0%).
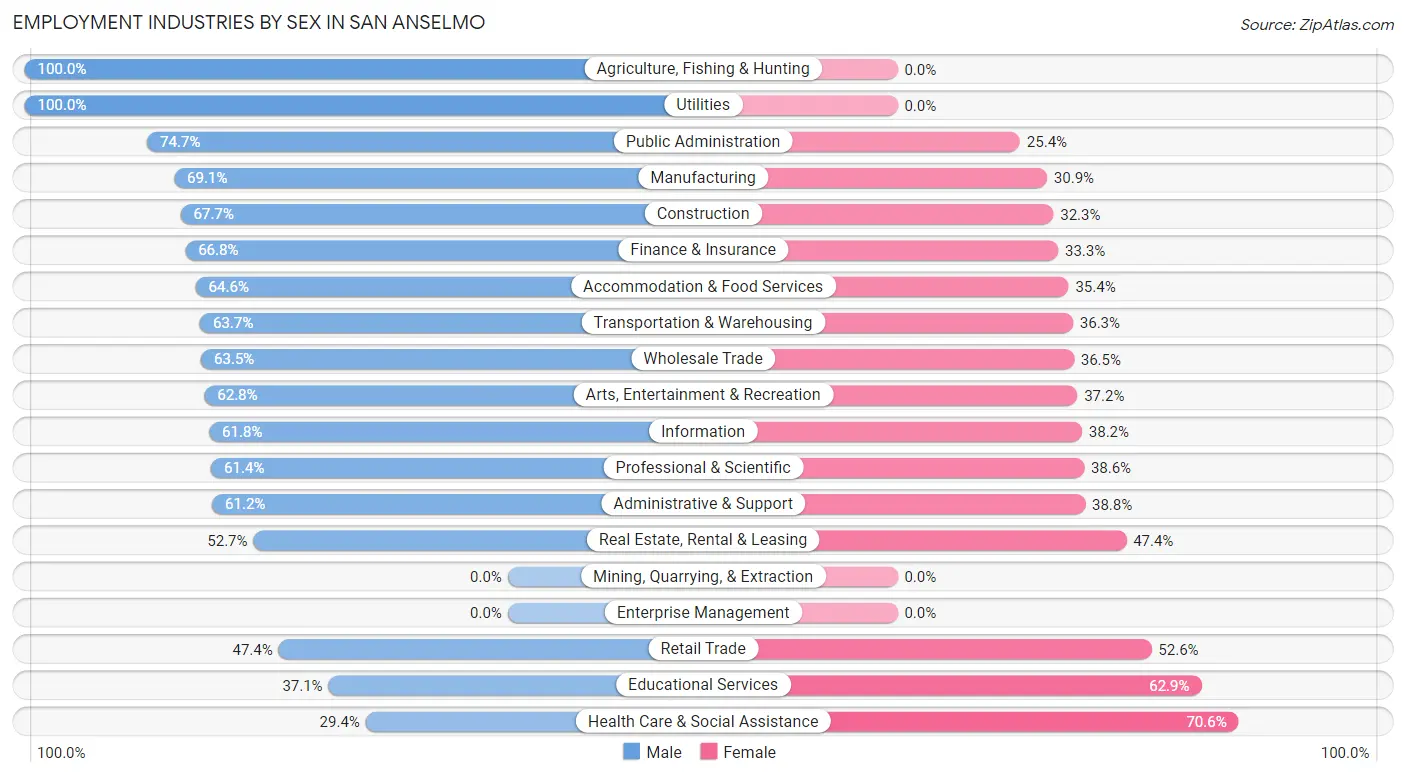
Employment Industries by Sex in San Anselmo
The San Anselmo industries that see more men than women are Agriculture, Fishing & Hunting (100.0%), Utilities (100.0%), and Public Administration (74.7%), whereas the industries that tend to have a higher number of women are Health Care & Social Assistance (70.6%), Educational Services (62.9%), and Retail Trade (52.6%).
| Industry | Male | Female |
| Agriculture, Fishing & Hunting | 11 (100.0%) | 0 (0.0%) |
| Mining, Quarrying, & Extraction | 0 (0.0%) | 0 (0.0%) |
| Construction | 275 (67.7%) | 131 (32.3%) |
| Manufacturing | 212 (69.1%) | 95 (30.9%) |
| Wholesale Trade | 120 (63.5%) | 69 (36.5%) |
| Retail Trade | 203 (47.4%) | 225 (52.6%) |
| Transportation & Warehousing | 107 (63.7%) | 61 (36.3%) |
| Utilities | 36 (100.0%) | 0 (0.0%) |
| Information | 170 (61.8%) | 105 (38.2%) |
| Finance & Insurance | 275 (66.7%) | 137 (33.3%) |
| Real Estate, Rental & Leasing | 129 (52.6%) | 116 (47.3%) |
| Professional & Scientific | 846 (61.4%) | 532 (38.6%) |
| Enterprise Management | 0 (0.0%) | 0 (0.0%) |
| Administrative & Support | 167 (61.2%) | 106 (38.8%) |
| Educational Services | 213 (37.1%) | 361 (62.9%) |
| Health Care & Social Assistance | 327 (29.4%) | 785 (70.6%) |
| Arts, Entertainment & Recreation | 199 (62.8%) | 118 (37.2%) |
| Accommodation & Food Services | 166 (64.6%) | 91 (35.4%) |
| Public Administration | 162 (74.7%) | 55 (25.4%) |
| Total | 3,689 (54.1%) | 3,124 (45.9%) |
Education in San Anselmo
School Enrollment in San Anselmo
The most common levels of schooling among the 3,361 students in San Anselmo are high school (757 | 22.5%), elementary school (753 | 22.4%), and middle school (599 | 17.8%).
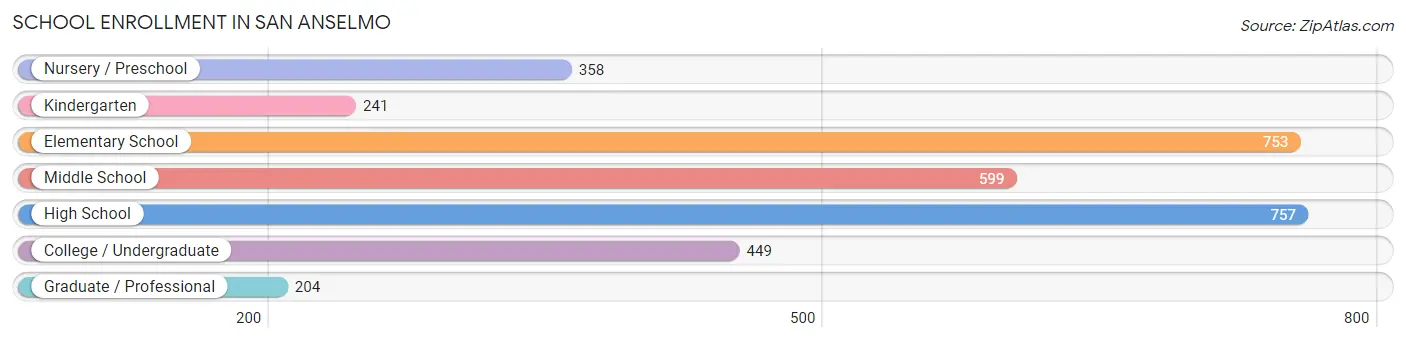
| School Level | # Students | % Students |
| Nursery / Preschool | 358 | 10.6% |
| Kindergarten | 241 | 7.2% |
| Elementary School | 753 | 22.4% |
| Middle School | 599 | 17.8% |
| High School | 757 | 22.5% |
| College / Undergraduate | 449 | 13.4% |
| Graduate / Professional | 204 | 6.1% |
| Total | 3,361 | 100.0% |
School Enrollment by Age by Funding Source in San Anselmo
Out of a total of 3,361 students who are enrolled in schools in San Anselmo, 944 (28.1%) attend a private institution, while the remaining 2,417 (71.9%) are enrolled in public schools. The age group of 35 years and over has the highest likelihood of being enrolled in private schools, with 161 (83.0% in the age bracket) enrolled. Conversely, the age group of 20 to 24 year olds has the lowest likelihood of being enrolled in a private school, with 339 (95.8% in the age bracket) attending a public institution.
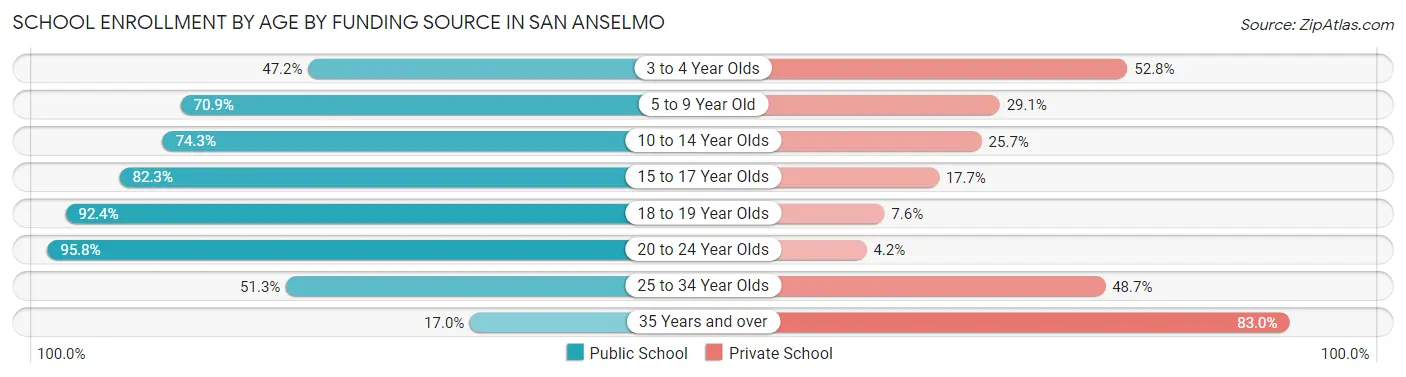
| Age Bracket | Public School | Private School |
| 3 to 4 Year Olds | 108 (47.2%) | 121 (52.8%) |
| 5 to 9 Year Old | 769 (70.9%) | 315 (29.1%) |
| 10 to 14 Year Olds | 532 (74.3%) | 184 (25.7%) |
| 15 to 17 Year Olds | 451 (82.3%) | 97 (17.7%) |
| 18 to 19 Year Olds | 146 (92.4%) | 12 (7.6%) |
| 20 to 24 Year Olds | 339 (95.8%) | 15 (4.2%) |
| 25 to 34 Year Olds | 40 (51.3%) | 38 (48.7%) |
| 35 Years and over | 33 (17.0%) | 161 (83.0%) |
| Total | 2,417 (71.9%) | 944 (28.1%) |
Educational Attainment by Field of Study in San Anselmo
Social sciences (1,151 | 17.0%), business (999 | 14.7%), visual & performing arts (692 | 10.2%), science & technology (536 | 7.9%), and psychology (520 | 7.7%) are the most common fields of study among 6,776 individuals in San Anselmo who have obtained a bachelor's degree or higher.
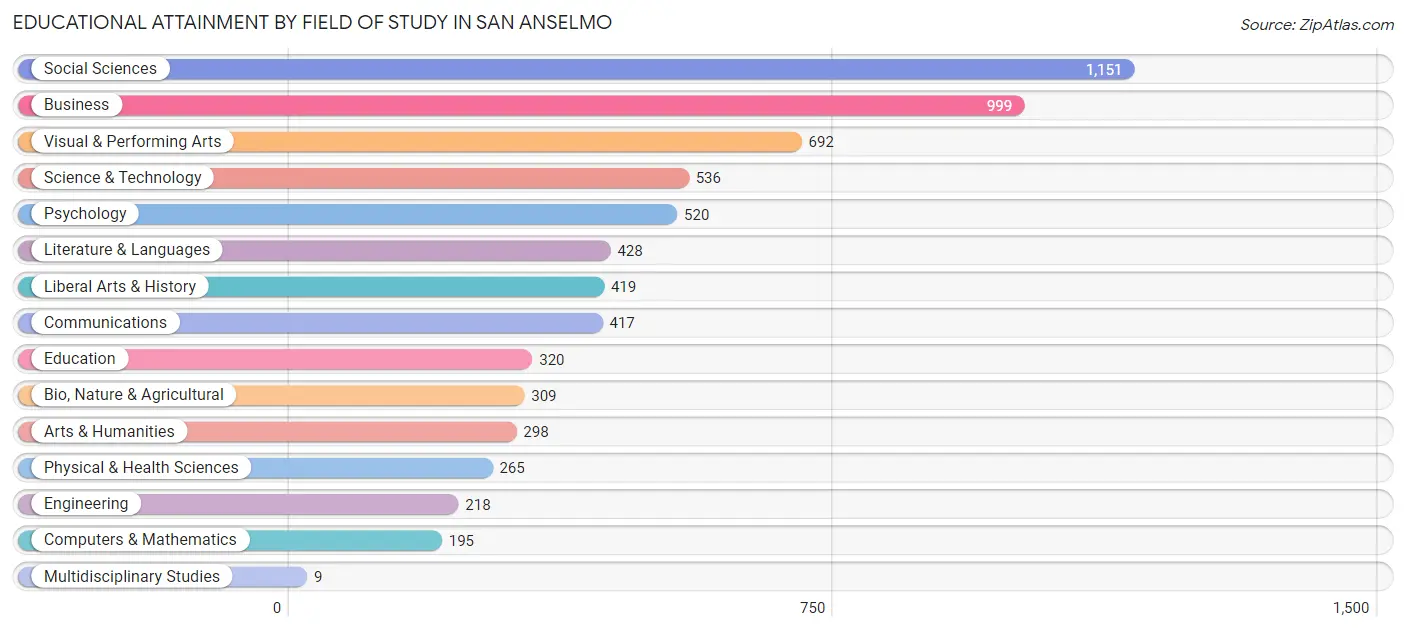
| Field of Study | # Graduates | % Graduates |
| Computers & Mathematics | 195 | 2.9% |
| Bio, Nature & Agricultural | 309 | 4.6% |
| Physical & Health Sciences | 265 | 3.9% |
| Psychology | 520 | 7.7% |
| Social Sciences | 1,151 | 17.0% |
| Engineering | 218 | 3.2% |
| Multidisciplinary Studies | 9 | 0.1% |
| Science & Technology | 536 | 7.9% |
| Business | 999 | 14.7% |
| Education | 320 | 4.7% |
| Literature & Languages | 428 | 6.3% |
| Liberal Arts & History | 419 | 6.2% |
| Visual & Performing Arts | 692 | 10.2% |
| Communications | 417 | 6.1% |
| Arts & Humanities | 298 | 4.4% |
| Total | 6,776 | 100.0% |
Transportation & Commute in San Anselmo
Vehicle Availability by Sex in San Anselmo
The most prevalent vehicle ownership categories in San Anselmo are males with 2 vehicles (1,857, accounting for 52.9%) and females with 2 vehicles (1,422, making up 60.0%).
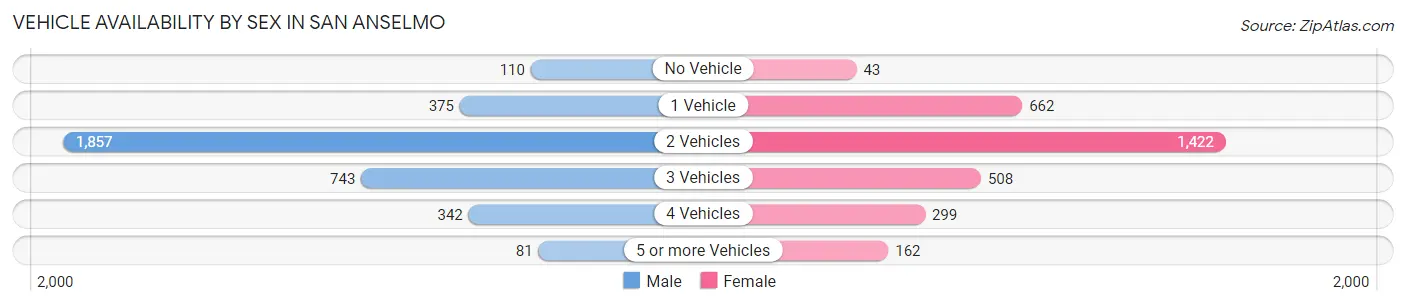
| Vehicles Available | Male | Female |
| No Vehicle | 110 (3.1%) | 43 (1.4%) |
| 1 Vehicle | 375 (10.7%) | 662 (21.4%) |
| 2 Vehicles | 1,857 (52.9%) | 1,422 (45.9%) |
| 3 Vehicles | 743 (21.2%) | 508 (16.4%) |
| 4 Vehicles | 342 (9.8%) | 299 (9.7%) |
| 5 or more Vehicles | 81 (2.3%) | 162 (5.2%) |
| Total | 3,508 (100.0%) | 3,096 (100.0%) |
Commute Time in San Anselmo
The most frequently occuring commute durations in San Anselmo are 20 to 24 minutes (869 commuters, 17.4%), 60 to 89 minutes (643 commuters, 12.9%), and 10 to 14 minutes (637 commuters, 12.7%).
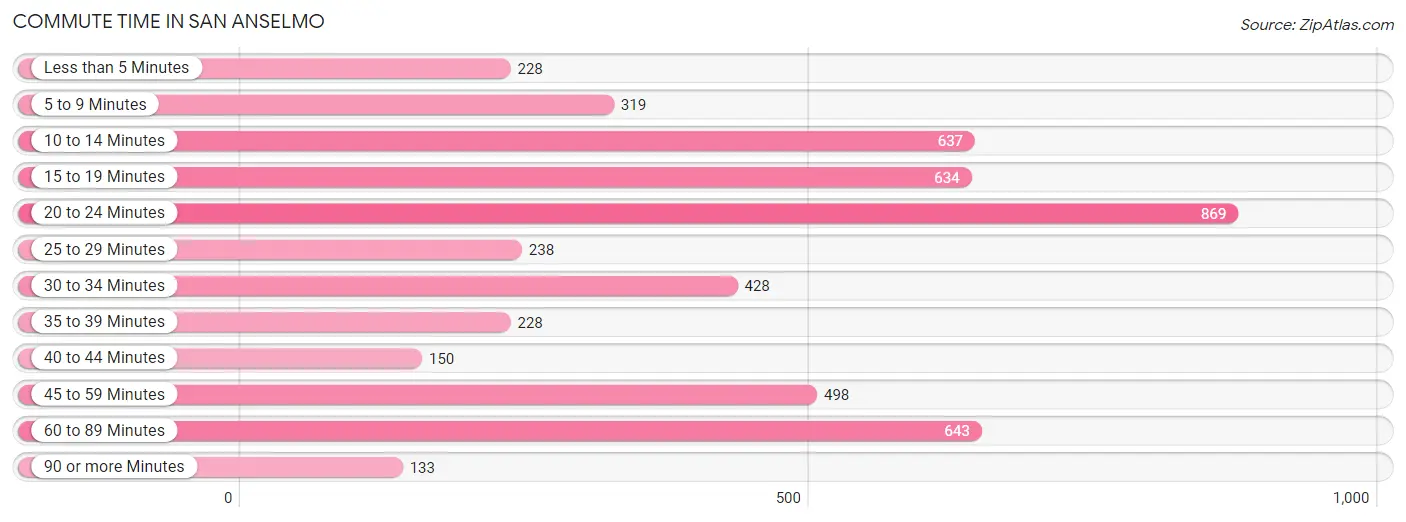
| Commute Time | # Commuters | % Commuters |
| Less than 5 Minutes | 228 | 4.6% |
| 5 to 9 Minutes | 319 | 6.4% |
| 10 to 14 Minutes | 637 | 12.7% |
| 15 to 19 Minutes | 634 | 12.7% |
| 20 to 24 Minutes | 869 | 17.4% |
| 25 to 29 Minutes | 238 | 4.8% |
| 30 to 34 Minutes | 428 | 8.6% |
| 35 to 39 Minutes | 228 | 4.6% |
| 40 to 44 Minutes | 150 | 3.0% |
| 45 to 59 Minutes | 498 | 10.0% |
| 60 to 89 Minutes | 643 | 12.9% |
| 90 or more Minutes | 133 | 2.7% |
Commute Time by Sex in San Anselmo
The most common commute times in San Anselmo are 20 to 24 minutes (426 commuters, 16.1%) for males and 20 to 24 minutes (443 commuters, 18.8%) for females.
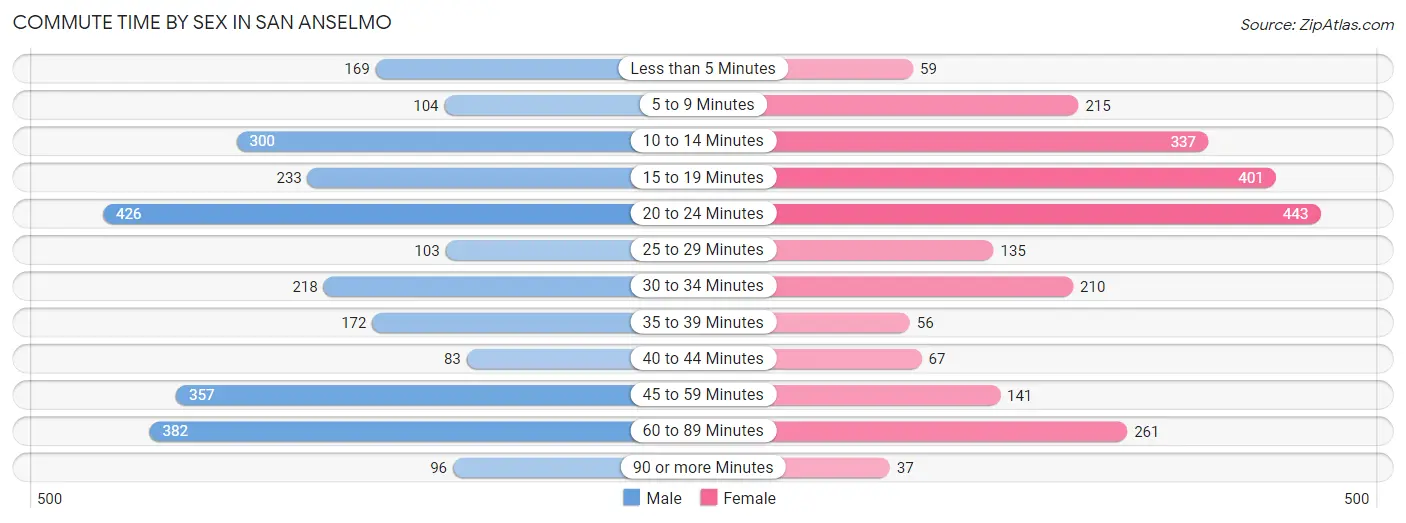
| Commute Time | Male | Female |
| Less than 5 Minutes | 169 (6.4%) | 59 (2.5%) |
| 5 to 9 Minutes | 104 (3.9%) | 215 (9.1%) |
| 10 to 14 Minutes | 300 (11.4%) | 337 (14.3%) |
| 15 to 19 Minutes | 233 (8.8%) | 401 (17.0%) |
| 20 to 24 Minutes | 426 (16.1%) | 443 (18.8%) |
| 25 to 29 Minutes | 103 (3.9%) | 135 (5.7%) |
| 30 to 34 Minutes | 218 (8.3%) | 210 (8.9%) |
| 35 to 39 Minutes | 172 (6.5%) | 56 (2.4%) |
| 40 to 44 Minutes | 83 (3.1%) | 67 (2.8%) |
| 45 to 59 Minutes | 357 (13.5%) | 141 (6.0%) |
| 60 to 89 Minutes | 382 (14.4%) | 261 (11.1%) |
| 90 or more Minutes | 96 (3.6%) | 37 (1.6%) |
Time of Departure to Work by Sex in San Anselmo
The most frequent times of departure to work in San Anselmo are 9:00 AM to 9:59 AM (469, 17.7%) for males and 7:30 AM to 7:59 AM (390, 16.5%) for females.
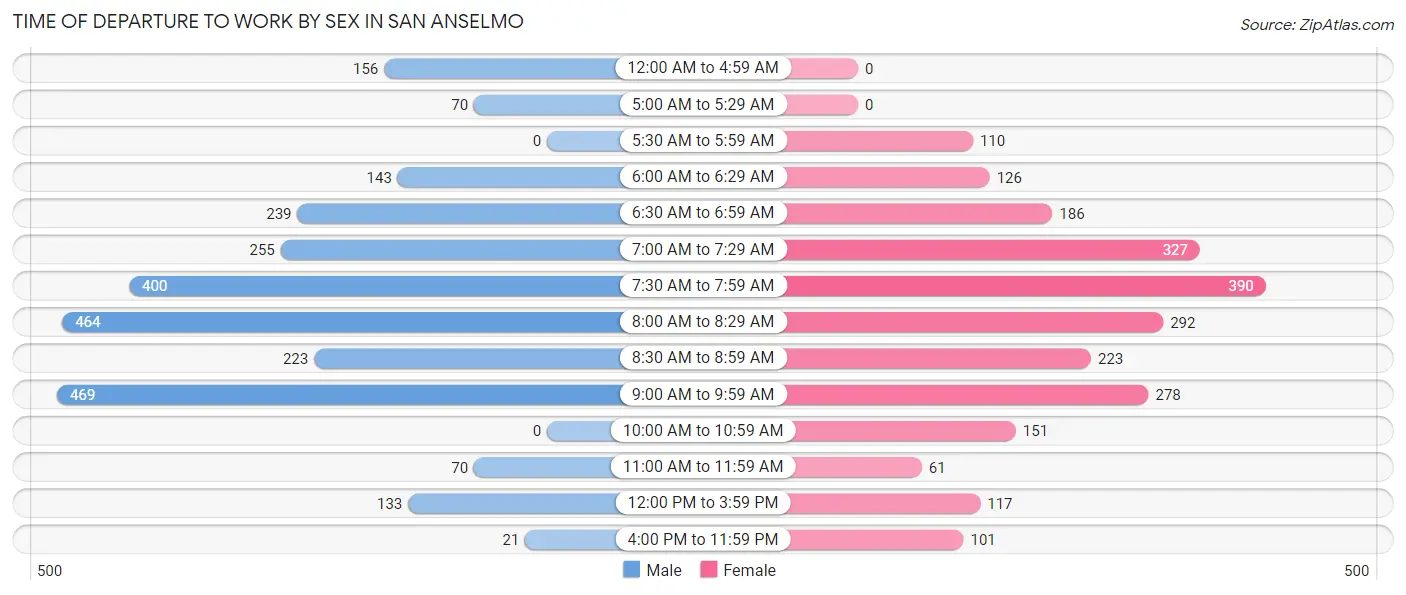
| Time of Departure | Male | Female |
| 12:00 AM to 4:59 AM | 156 (5.9%) | 0 (0.0%) |
| 5:00 AM to 5:29 AM | 70 (2.6%) | 0 (0.0%) |
| 5:30 AM to 5:59 AM | 0 (0.0%) | 110 (4.7%) |
| 6:00 AM to 6:29 AM | 143 (5.4%) | 126 (5.3%) |
| 6:30 AM to 6:59 AM | 239 (9.0%) | 186 (7.9%) |
| 7:00 AM to 7:29 AM | 255 (9.7%) | 327 (13.8%) |
| 7:30 AM to 7:59 AM | 400 (15.1%) | 390 (16.5%) |
| 8:00 AM to 8:29 AM | 464 (17.6%) | 292 (12.4%) |
| 8:30 AM to 8:59 AM | 223 (8.4%) | 223 (9.4%) |
| 9:00 AM to 9:59 AM | 469 (17.7%) | 278 (11.8%) |
| 10:00 AM to 10:59 AM | 0 (0.0%) | 151 (6.4%) |
| 11:00 AM to 11:59 AM | 70 (2.6%) | 61 (2.6%) |
| 12:00 PM to 3:59 PM | 133 (5.0%) | 117 (5.0%) |
| 4:00 PM to 11:59 PM | 21 (0.8%) | 101 (4.3%) |
| Total | 2,643 (100.0%) | 2,362 (100.0%) |
Housing Occupancy in San Anselmo
Occupancy by Ownership in San Anselmo
Of the total 5,091 dwellings in San Anselmo, owner-occupied units account for 3,375 (66.3%), while renter-occupied units make up 1,716 (33.7%).
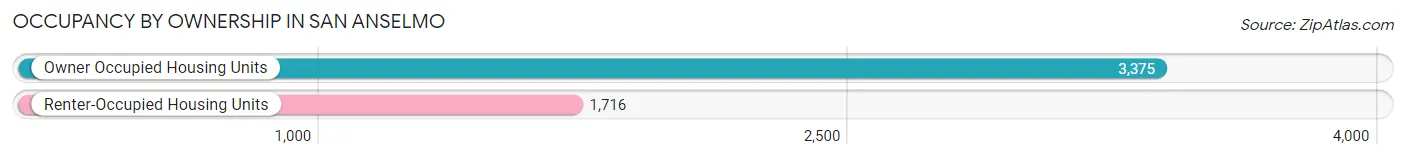
| Occupancy | # Housing Units | % Housing Units |
| Owner Occupied Housing Units | 3,375 | 66.3% |
| Renter-Occupied Housing Units | 1,716 | 33.7% |
| Total Occupied Housing Units | 5,091 | 100.0% |
Occupancy by Household Size in San Anselmo
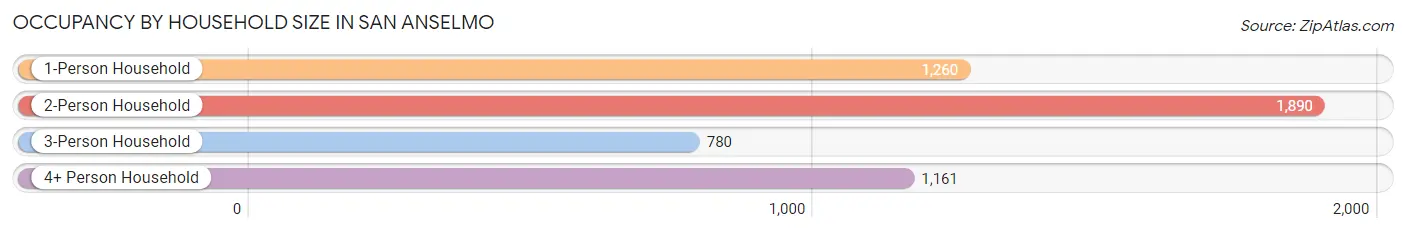
| Household Size | # Housing Units | % Housing Units |
| 1-Person Household | 1,260 | 24.7% |
| 2-Person Household | 1,890 | 37.1% |
| 3-Person Household | 780 | 15.3% |
| 4+ Person Household | 1,161 | 22.8% |
| Total Housing Units | 5,091 | 100.0% |
Occupancy by Ownership by Household Size in San Anselmo
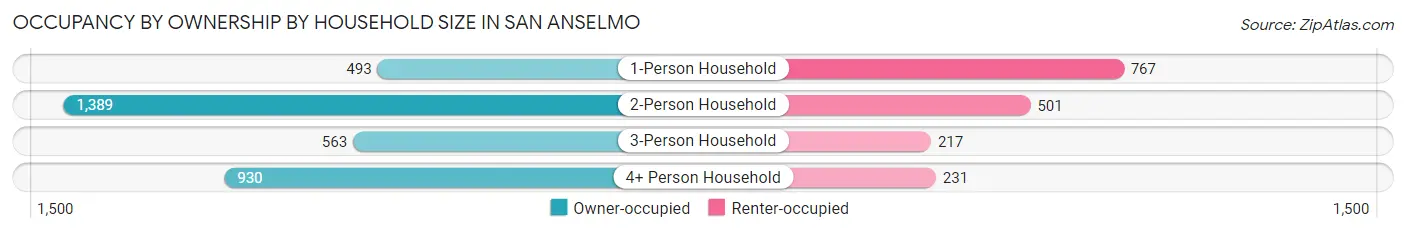
| Household Size | Owner-occupied | Renter-occupied |
| 1-Person Household | 493 (39.1%) | 767 (60.9%) |
| 2-Person Household | 1,389 (73.5%) | 501 (26.5%) |
| 3-Person Household | 563 (72.2%) | 217 (27.8%) |
| 4+ Person Household | 930 (80.1%) | 231 (19.9%) |
| Total Housing Units | 3,375 (66.3%) | 1,716 (33.7%) |
Occupancy by Educational Attainment in San Anselmo
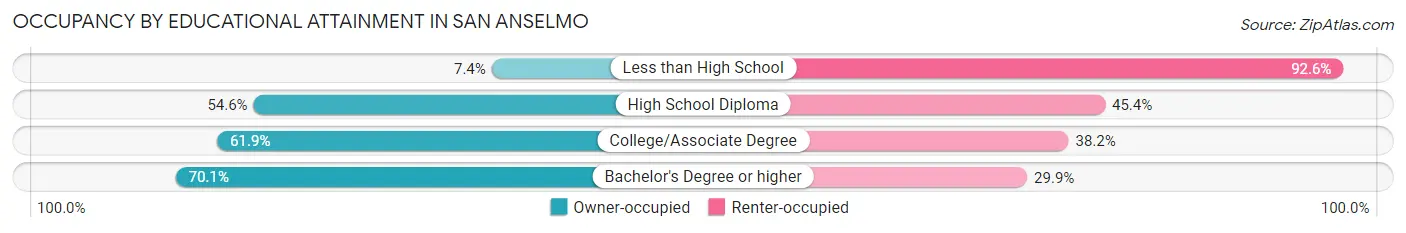
| Household Size | Owner-occupied | Renter-occupied |
| Less than High School | 6 (7.4%) | 75 (92.6%) |
| High School Diploma | 171 (54.6%) | 142 (45.4%) |
| College/Associate Degree | 702 (61.9%) | 433 (38.2%) |
| Bachelor's Degree or higher | 2,496 (70.1%) | 1,066 (29.9%) |
Occupancy by Age of Householder in San Anselmo
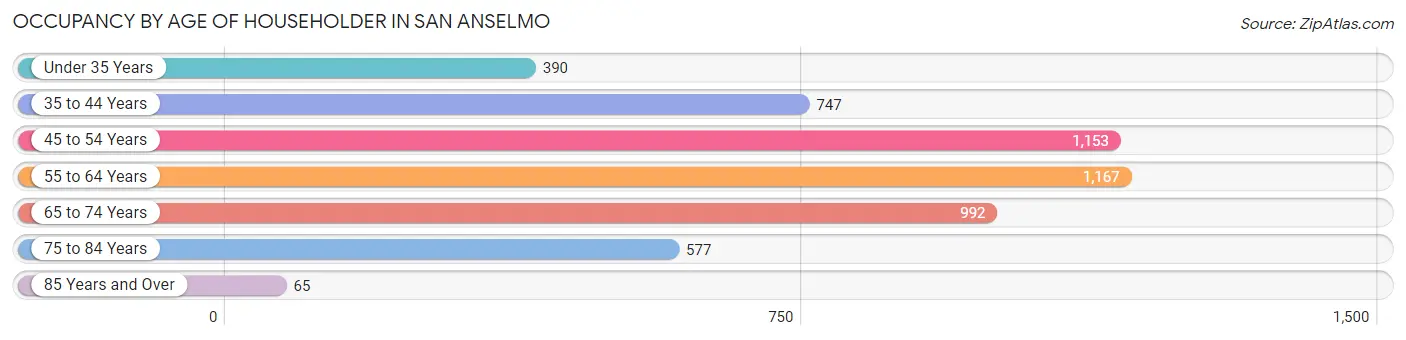
| Age Bracket | # Households | % Households |
| Under 35 Years | 390 | 7.7% |
| 35 to 44 Years | 747 | 14.7% |
| 45 to 54 Years | 1,153 | 22.7% |
| 55 to 64 Years | 1,167 | 22.9% |
| 65 to 74 Years | 992 | 19.5% |
| 75 to 84 Years | 577 | 11.3% |
| 85 Years and Over | 65 | 1.3% |
| Total | 5,091 | 100.0% |
Housing Finances in San Anselmo
Median Income by Occupancy in San Anselmo
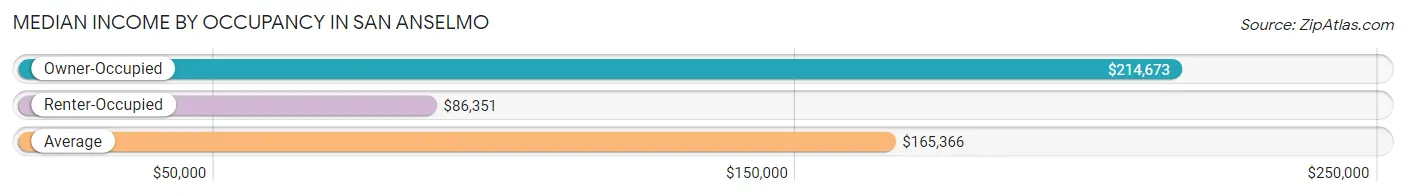
| Occupancy Type | # Households | Median Income |
| Owner-Occupied | 3,375 (66.3%) | $214,673 |
| Renter-Occupied | 1,716 (33.7%) | $86,351 |
| Average | 5,091 (100.0%) | $165,366 |
Occupancy by Householder Income Bracket in San Anselmo
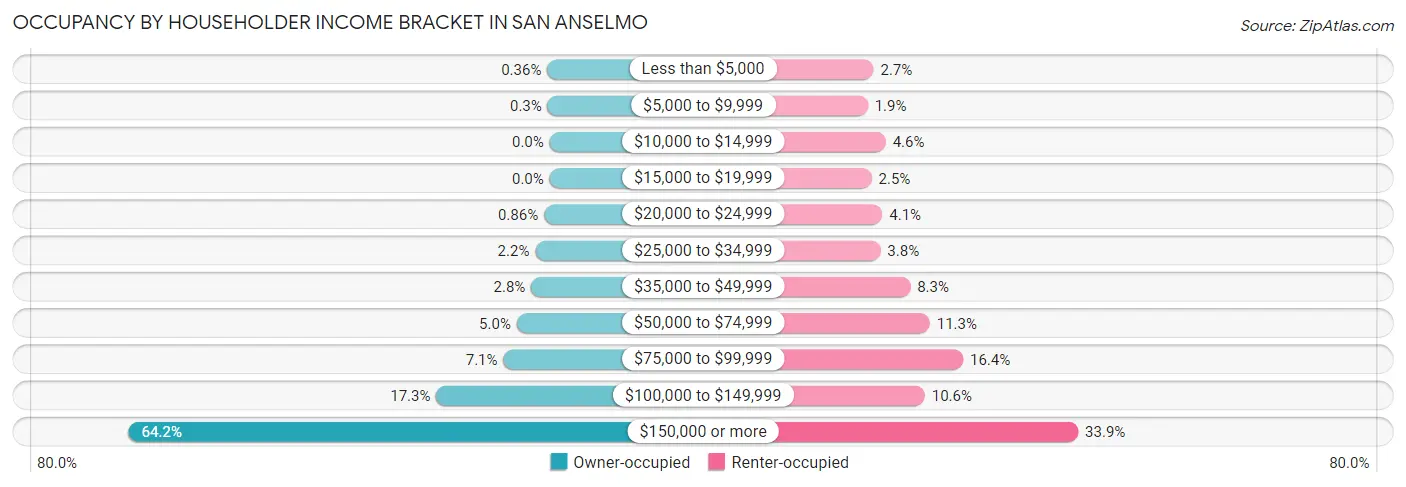
| Income Bracket | Owner-occupied | Renter-occupied |
| Less than $5,000 | 12 (0.4%) | 47 (2.7%) |
| $5,000 to $9,999 | 10 (0.3%) | 32 (1.9%) |
| $10,000 to $14,999 | 0 (0.0%) | 79 (4.6%) |
| $15,000 to $19,999 | 0 (0.0%) | 42 (2.5%) |
| $20,000 to $24,999 | 29 (0.9%) | 70 (4.1%) |
| $25,000 to $34,999 | 74 (2.2%) | 65 (3.8%) |
| $35,000 to $49,999 | 95 (2.8%) | 143 (8.3%) |
| $50,000 to $74,999 | 169 (5.0%) | 194 (11.3%) |
| $75,000 to $99,999 | 238 (7.0%) | 281 (16.4%) |
| $100,000 to $149,999 | 583 (17.3%) | 181 (10.5%) |
| $150,000 or more | 2,165 (64.1%) | 582 (33.9%) |
| Total | 3,375 (100.0%) | 1,716 (100.0%) |
Monthly Housing Cost Tiers in San Anselmo
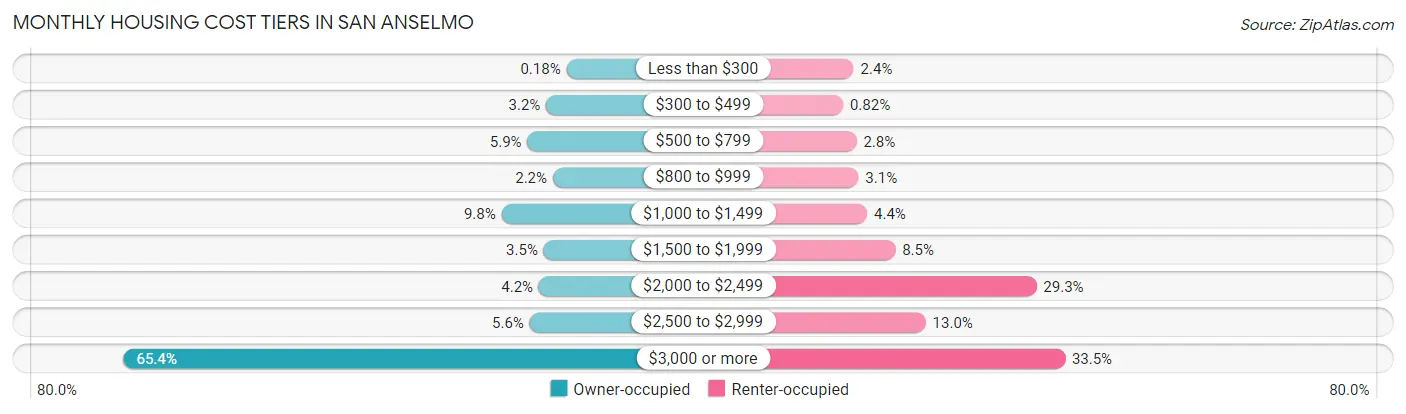
| Monthly Cost | Owner-occupied | Renter-occupied |
| Less than $300 | 6 (0.2%) | 41 (2.4%) |
| $300 to $499 | 107 (3.2%) | 14 (0.8%) |
| $500 to $799 | 200 (5.9%) | 48 (2.8%) |
| $800 to $999 | 74 (2.2%) | 53 (3.1%) |
| $1,000 to $1,499 | 329 (9.8%) | 75 (4.4%) |
| $1,500 to $1,999 | 119 (3.5%) | 146 (8.5%) |
| $2,000 to $2,499 | 143 (4.2%) | 503 (29.3%) |
| $2,500 to $2,999 | 189 (5.6%) | 223 (13.0%) |
| $3,000 or more | 2,208 (65.4%) | 575 (33.5%) |
| Total | 3,375 (100.0%) | 1,716 (100.0%) |
Physical Housing Characteristics in San Anselmo
Housing Structures in San Anselmo
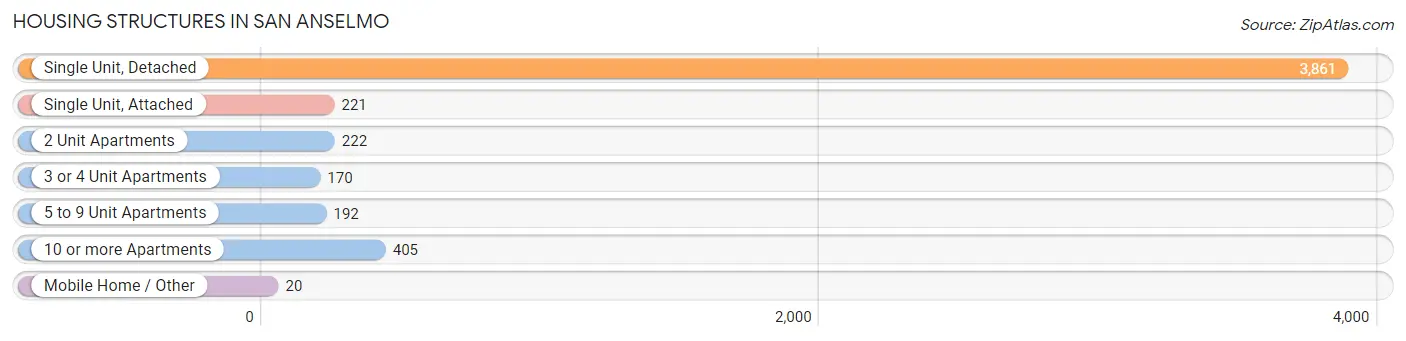
| Structure Type | # Housing Units | % Housing Units |
| Single Unit, Detached | 3,861 | 75.8% |
| Single Unit, Attached | 221 | 4.3% |
| 2 Unit Apartments | 222 | 4.4% |
| 3 or 4 Unit Apartments | 170 | 3.3% |
| 5 to 9 Unit Apartments | 192 | 3.8% |
| 10 or more Apartments | 405 | 8.0% |
| Mobile Home / Other | 20 | 0.4% |
| Total | 5,091 | 100.0% |
Housing Structures by Occupancy in San Anselmo
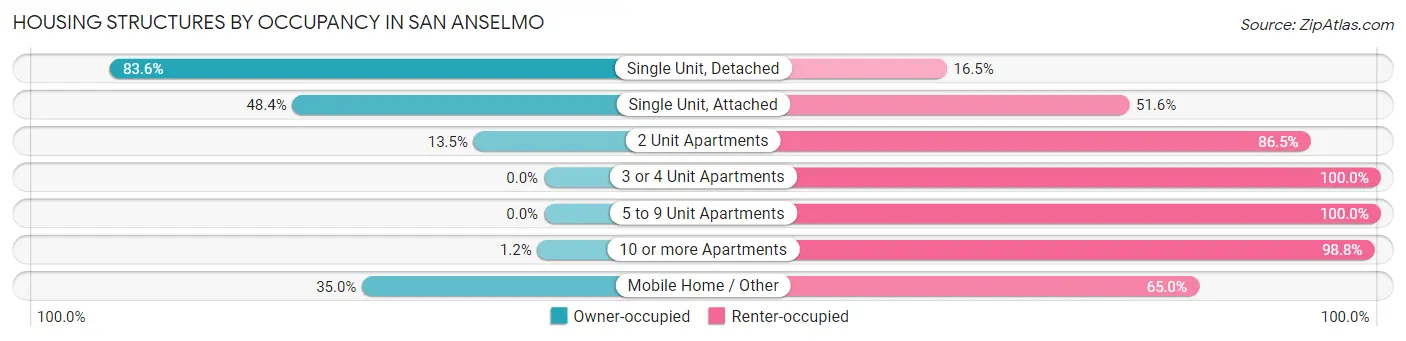
| Structure Type | Owner-occupied | Renter-occupied |
| Single Unit, Detached | 3,226 (83.6%) | 635 (16.5%) |
| Single Unit, Attached | 107 (48.4%) | 114 (51.6%) |
| 2 Unit Apartments | 30 (13.5%) | 192 (86.5%) |
| 3 or 4 Unit Apartments | 0 (0.0%) | 170 (100.0%) |
| 5 to 9 Unit Apartments | 0 (0.0%) | 192 (100.0%) |
| 10 or more Apartments | 5 (1.2%) | 400 (98.8%) |
| Mobile Home / Other | 7 (35.0%) | 13 (65.0%) |
| Total | 3,375 (66.3%) | 1,716 (33.7%) |
Housing Structures by Number of Rooms in San Anselmo
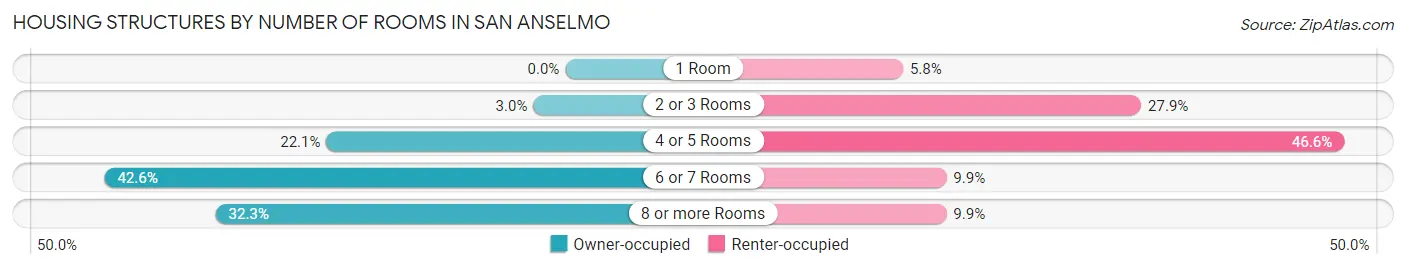
| Number of Rooms | Owner-occupied | Renter-occupied |
| 1 Room | 0 (0.0%) | 100 (5.8%) |
| 2 or 3 Rooms | 100 (3.0%) | 478 (27.9%) |
| 4 or 5 Rooms | 746 (22.1%) | 800 (46.6%) |
| 6 or 7 Rooms | 1,438 (42.6%) | 169 (9.9%) |
| 8 or more Rooms | 1,091 (32.3%) | 169 (9.9%) |
| Total | 3,375 (100.0%) | 1,716 (100.0%) |
Housing Structure by Heating Type in San Anselmo
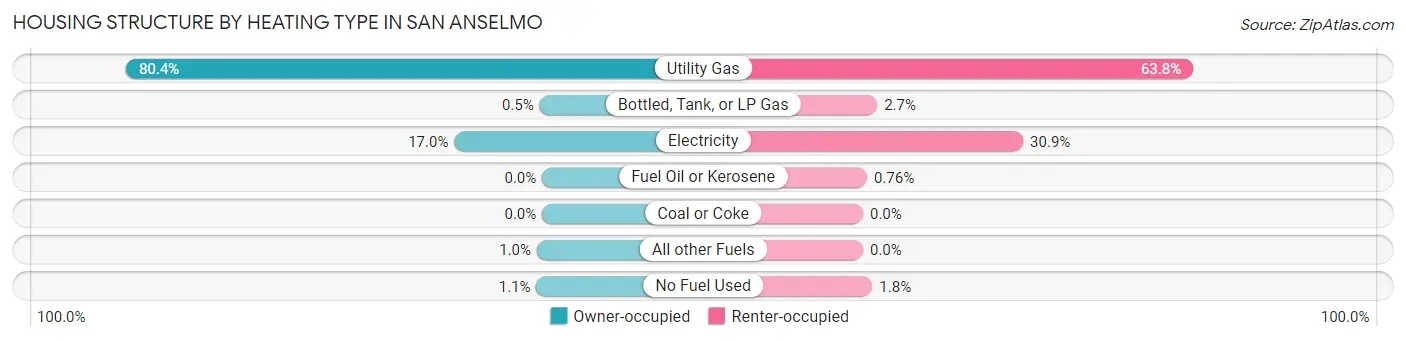
| Heating Type | Owner-occupied | Renter-occupied |
| Utility Gas | 2,714 (80.4%) | 1,094 (63.7%) |
| Bottled, Tank, or LP Gas | 17 (0.5%) | 47 (2.7%) |
| Electricity | 573 (17.0%) | 531 (30.9%) |
| Fuel Oil or Kerosene | 0 (0.0%) | 13 (0.8%) |
| Coal or Coke | 0 (0.0%) | 0 (0.0%) |
| All other Fuels | 34 (1.0%) | 0 (0.0%) |
| No Fuel Used | 37 (1.1%) | 31 (1.8%) |
| Total | 3,375 (100.0%) | 1,716 (100.0%) |
Household Vehicle Usage in San Anselmo
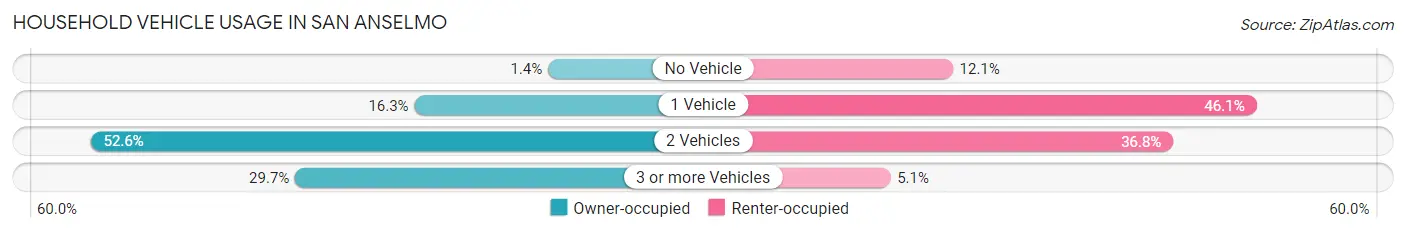
| Vehicles per Household | Owner-occupied | Renter-occupied |
| No Vehicle | 46 (1.4%) | 207 (12.1%) |
| 1 Vehicle | 551 (16.3%) | 791 (46.1%) |
| 2 Vehicles | 1,776 (52.6%) | 631 (36.8%) |
| 3 or more Vehicles | 1,002 (29.7%) | 87 (5.1%) |
| Total | 3,375 (100.0%) | 1,716 (100.0%) |
Real Estate & Mortgages in San Anselmo
Real Estate and Mortgage Overview in San Anselmo
| Characteristic | Without Mortgage | With Mortgage |
| Housing Units | 841 | 2,534 |
| Median Property Value | $1,311,700 | $1,498,400 |
| Median Household Income | $123,618 | $1,874 |
| Monthly Housing Costs | $1,051 | $2,173 |
| Real Estate Taxes | $6,809 | $21 |
Property Value by Mortgage Status in San Anselmo
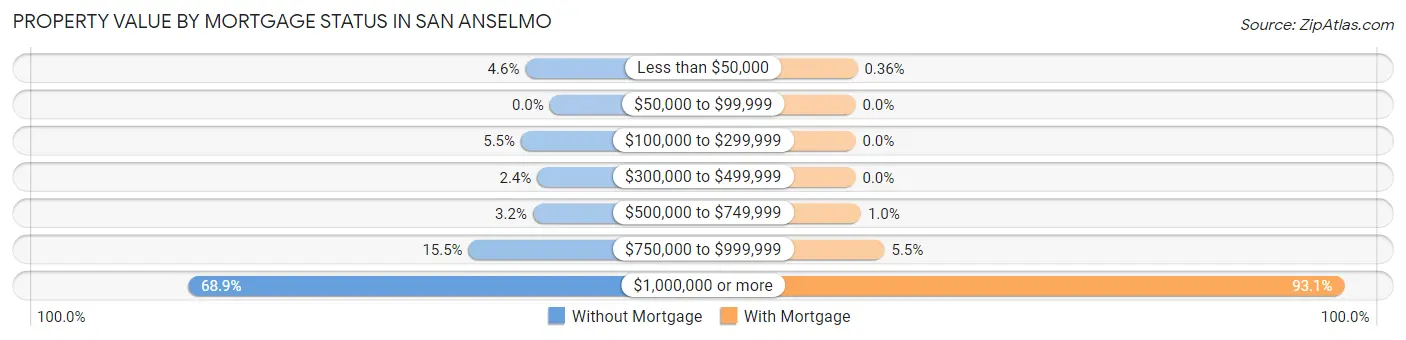
| Property Value | Without Mortgage | With Mortgage |
| Less than $50,000 | 39 (4.6%) | 9 (0.4%) |
| $50,000 to $99,999 | 0 (0.0%) | 0 (0.0%) |
| $100,000 to $299,999 | 46 (5.5%) | 0 (0.0%) |
| $300,000 to $499,999 | 20 (2.4%) | 0 (0.0%) |
| $500,000 to $749,999 | 27 (3.2%) | 26 (1.0%) |
| $750,000 to $999,999 | 130 (15.5%) | 140 (5.5%) |
| $1,000,000 or more | 579 (68.9%) | 2,359 (93.1%) |
| Total | 841 (100.0%) | 2,534 (100.0%) |
Household Income by Mortgage Status in San Anselmo
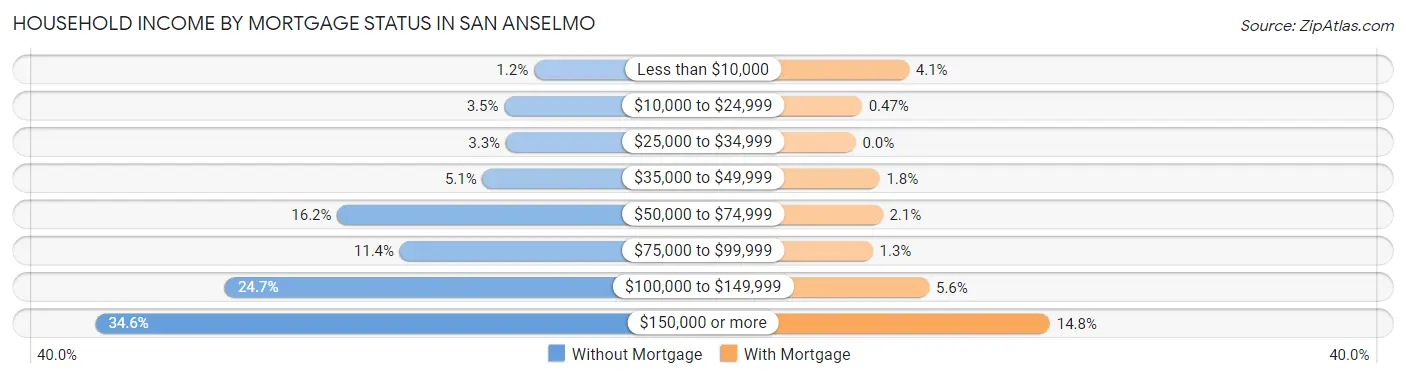
| Household Income | Without Mortgage | With Mortgage |
| Less than $10,000 | 10 (1.2%) | 103 (4.1%) |
| $10,000 to $24,999 | 29 (3.5%) | 12 (0.5%) |
| $25,000 to $34,999 | 28 (3.3%) | 0 (0.0%) |
| $35,000 to $49,999 | 43 (5.1%) | 46 (1.8%) |
| $50,000 to $74,999 | 136 (16.2%) | 52 (2.1%) |
| $75,000 to $99,999 | 96 (11.4%) | 33 (1.3%) |
| $100,000 to $149,999 | 208 (24.7%) | 142 (5.6%) |
| $150,000 or more | 291 (34.6%) | 375 (14.8%) |
| Total | 841 (100.0%) | 2,534 (100.0%) |
Property Value to Household Income Ratio in San Anselmo
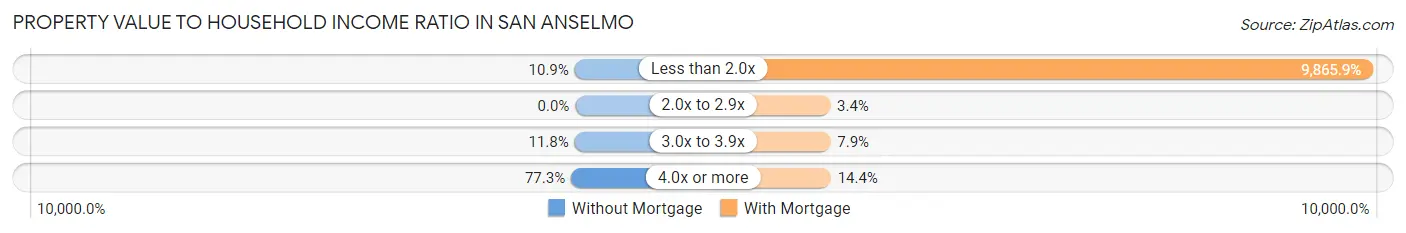
| Value-to-Income Ratio | Without Mortgage | With Mortgage |
| Less than 2.0x | 92 (10.9%) | 250,001 (9,865.9%) |
| 2.0x to 2.9x | 0 (0.0%) | 87 (3.4%) |
| 3.0x to 3.9x | 99 (11.8%) | 201 (7.9%) |
| 4.0x or more | 650 (77.3%) | 366 (14.4%) |
| Total | 841 (100.0%) | 2,534 (100.0%) |
Real Estate Taxes by Mortgage Status in San Anselmo
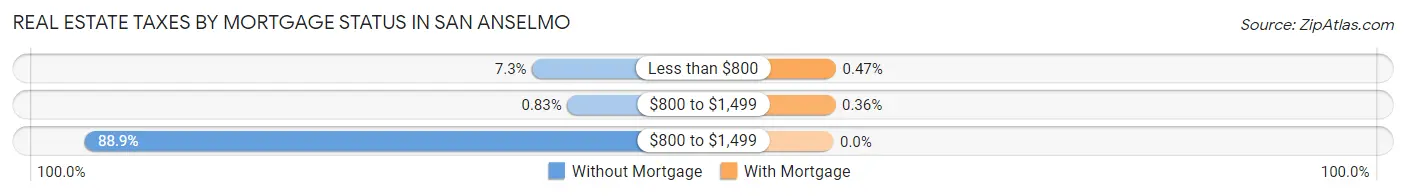
| Property Taxes | Without Mortgage | With Mortgage |
| Less than $800 | 61 (7.2%) | 12 (0.5%) |
| $800 to $1,499 | 7 (0.8%) | 9 (0.4%) |
| $800 to $1,499 | 748 (88.9%) | 0 (0.0%) |
| Total | 841 (100.0%) | 2,534 (100.0%) |
Health & Disability in San Anselmo
Health Insurance Coverage by Age in San Anselmo
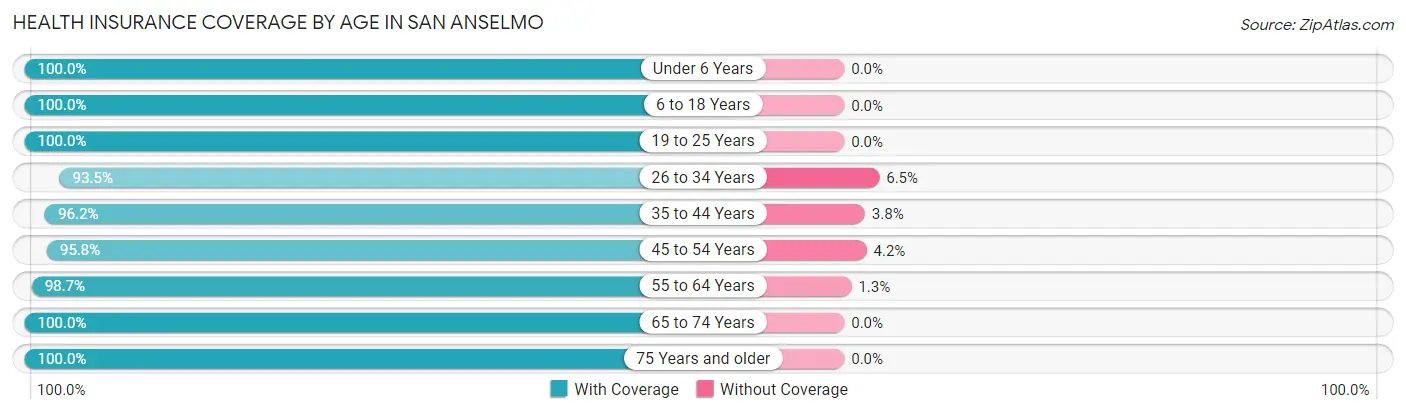
| Age Bracket | With Coverage | Without Coverage |
| Under 6 Years | 995 (100.0%) | 0 (0.0%) |
| 6 to 18 Years | 2,198 (100.0%) | 0 (0.0%) |
| 19 to 25 Years | 585 (100.0%) | 0 (0.0%) |
| 26 to 34 Years | 788 (93.5%) | 55 (6.5%) |
| 35 to 44 Years | 1,577 (96.2%) | 63 (3.8%) |
| 45 to 54 Years | 1,841 (95.8%) | 80 (4.2%) |
| 55 to 64 Years | 2,008 (98.7%) | 27 (1.3%) |
| 65 to 74 Years | 1,575 (100.0%) | 0 (0.0%) |
| 75 Years and older | 939 (100.0%) | 0 (0.0%) |
| Total | 12,506 (98.2%) | 225 (1.8%) |
Health Insurance Coverage by Citizenship Status in San Anselmo
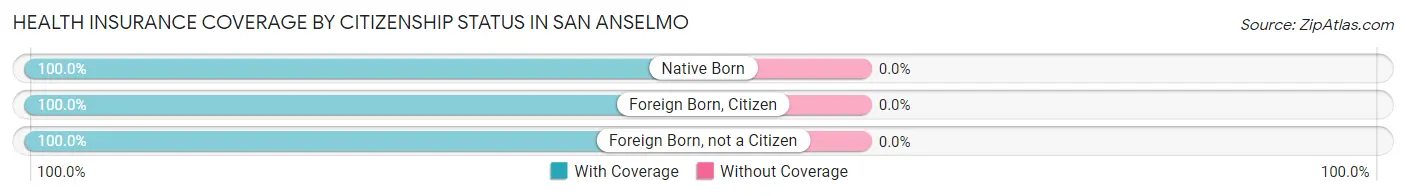
| Citizenship Status | With Coverage | Without Coverage |
| Native Born | 995 (100.0%) | 0 (0.0%) |
| Foreign Born, Citizen | 2,198 (100.0%) | 0 (0.0%) |
| Foreign Born, not a Citizen | 585 (100.0%) | 0 (0.0%) |
Health Insurance Coverage by Household Income in San Anselmo
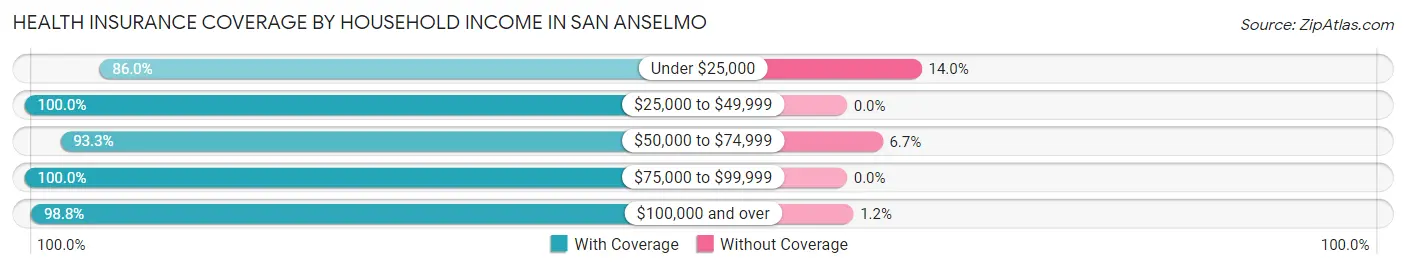
| Household Income | With Coverage | Without Coverage |
| Under $25,000 | 307 (86.0%) | 50 (14.0%) |
| $25,000 to $49,999 | 701 (100.0%) | 0 (0.0%) |
| $50,000 to $74,999 | 657 (93.3%) | 47 (6.7%) |
| $75,000 to $99,999 | 913 (100.0%) | 0 (0.0%) |
| $100,000 and over | 9,862 (98.8%) | 120 (1.2%) |
Public vs Private Health Insurance Coverage by Age in San Anselmo
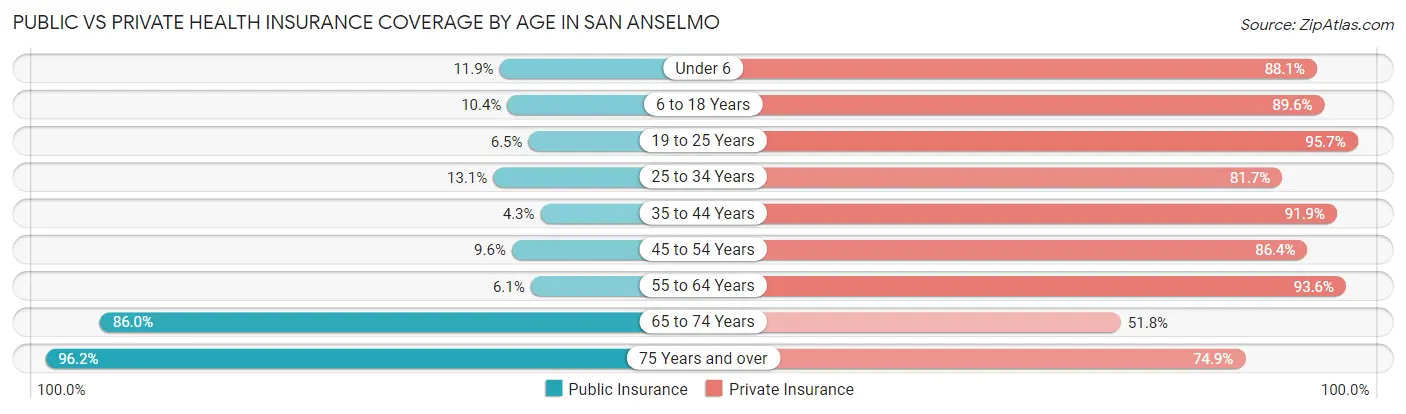
| Age Bracket | Public Insurance | Private Insurance |
| Under 6 | 118 (11.9%) | 877 (88.1%) |
| 6 to 18 Years | 229 (10.4%) | 1,969 (89.6%) |
| 19 to 25 Years | 38 (6.5%) | 560 (95.7%) |
| 25 to 34 Years | 110 (13.1%) | 689 (81.7%) |
| 35 to 44 Years | 70 (4.3%) | 1,507 (91.9%) |
| 45 to 54 Years | 184 (9.6%) | 1,660 (86.4%) |
| 55 to 64 Years | 124 (6.1%) | 1,904 (93.6%) |
| 65 to 74 Years | 1,355 (86.0%) | 816 (51.8%) |
| 75 Years and over | 903 (96.2%) | 703 (74.9%) |
| Total | 3,131 (24.6%) | 10,685 (83.9%) |
Disability Status by Sex by Age in San Anselmo
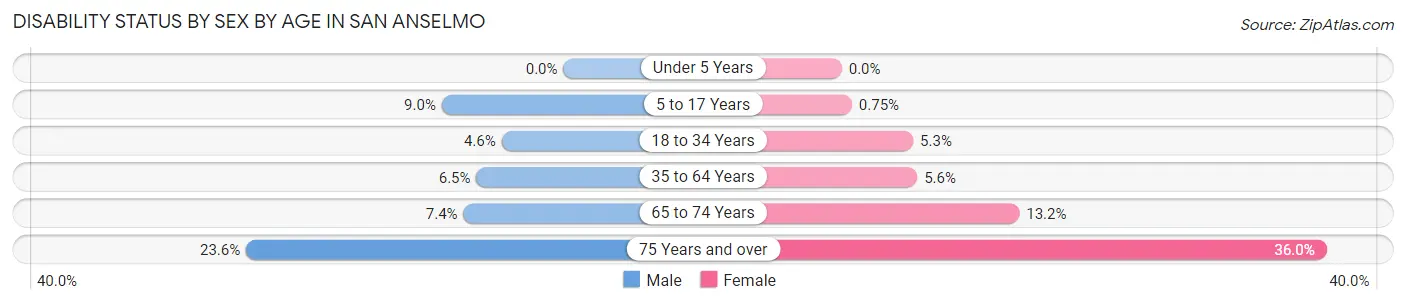
| Age Bracket | Male | Female |
| Under 5 Years | 0 (0.0%) | 0 (0.0%) |
| 5 to 17 Years | 118 (9.0%) | 8 (0.7%) |
| 18 to 34 Years | 30 (4.6%) | 48 (5.3%) |
| 35 to 64 Years | 178 (6.5%) | 159 (5.6%) |
| 65 to 74 Years | 64 (7.4%) | 94 (13.2%) |
| 75 Years and over | 106 (23.6%) | 176 (36.0%) |
Disability Class by Sex by Age in San Anselmo
Disability Class: Hearing Difficulty
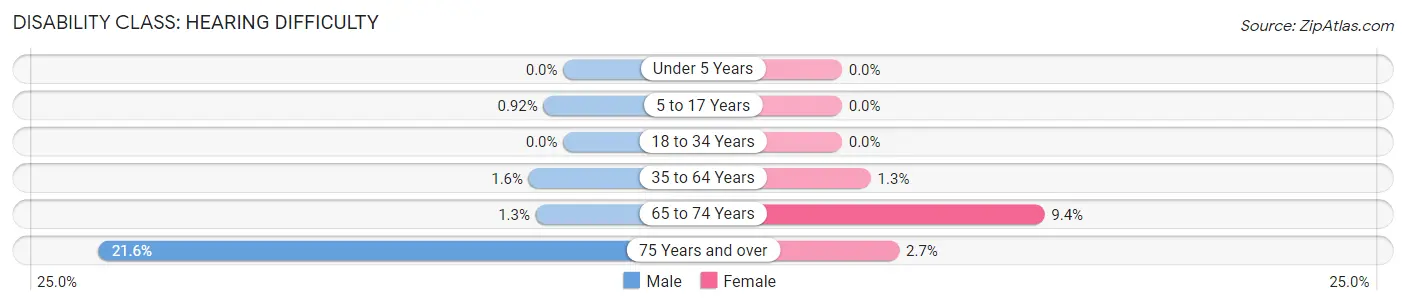
| Age Bracket | Male | Female |
| Under 5 Years | 0 (0.0%) | 0 (0.0%) |
| 5 to 17 Years | 12 (0.9%) | 0 (0.0%) |
| 18 to 34 Years | 0 (0.0%) | 0 (0.0%) |
| 35 to 64 Years | 44 (1.6%) | 38 (1.3%) |
| 65 to 74 Years | 11 (1.3%) | 67 (9.4%) |
| 75 Years and over | 97 (21.6%) | 13 (2.7%) |
Disability Class: Vision Difficulty
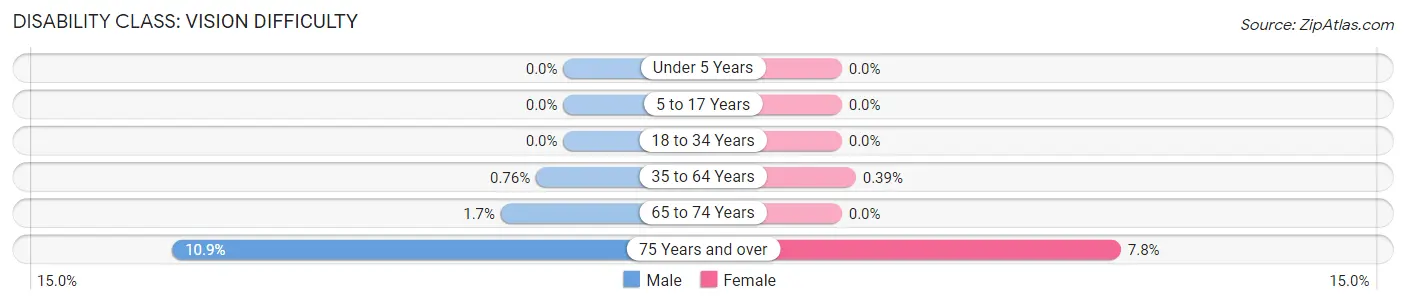
| Age Bracket | Male | Female |
| Under 5 Years | 0 (0.0%) | 0 (0.0%) |
| 5 to 17 Years | 0 (0.0%) | 0 (0.0%) |
| 18 to 34 Years | 0 (0.0%) | 0 (0.0%) |
| 35 to 64 Years | 21 (0.8%) | 11 (0.4%) |
| 65 to 74 Years | 15 (1.7%) | 0 (0.0%) |
| 75 Years and over | 49 (10.9%) | 38 (7.8%) |
Disability Class: Cognitive Difficulty
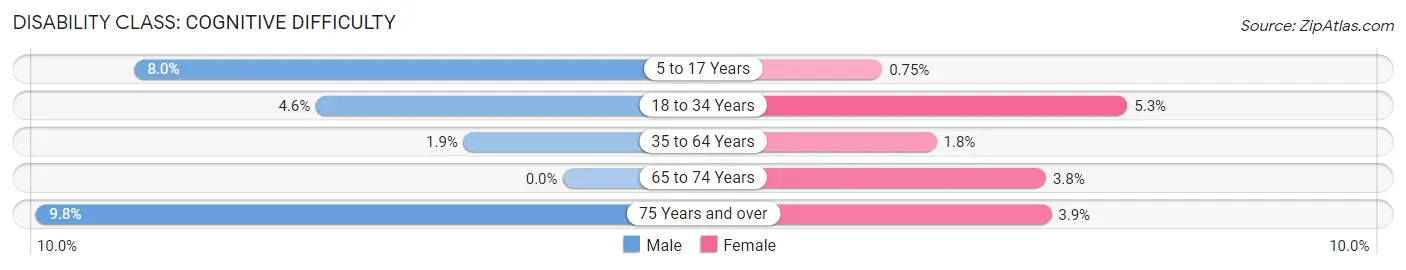
| Age Bracket | Male | Female |
| 5 to 17 Years | 104 (8.0%) | 8 (0.7%) |
| 18 to 34 Years | 30 (4.6%) | 48 (5.3%) |
| 35 to 64 Years | 51 (1.8%) | 50 (1.8%) |
| 65 to 74 Years | 0 (0.0%) | 27 (3.8%) |
| 75 Years and over | 44 (9.8%) | 19 (3.9%) |
Disability Class: Ambulatory Difficulty
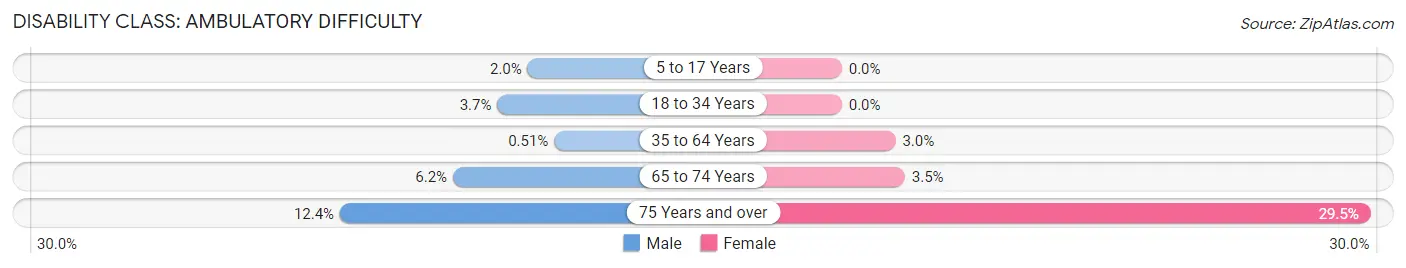
| Age Bracket | Male | Female |
| 5 to 17 Years | 26 (2.0%) | 0 (0.0%) |
| 18 to 34 Years | 24 (3.7%) | 0 (0.0%) |
| 35 to 64 Years | 14 (0.5%) | 85 (3.0%) |
| 65 to 74 Years | 53 (6.1%) | 25 (3.5%) |
| 75 Years and over | 56 (12.4%) | 144 (29.4%) |
Disability Class: Self-Care Difficulty
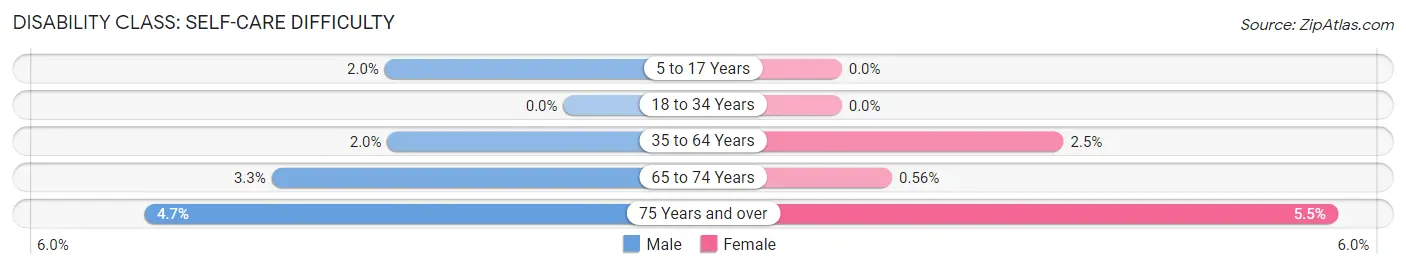
| Age Bracket | Male | Female |
| 5 to 17 Years | 26 (2.0%) | 0 (0.0%) |
| 18 to 34 Years | 0 (0.0%) | 0 (0.0%) |
| 35 to 64 Years | 54 (2.0%) | 70 (2.5%) |
| 65 to 74 Years | 28 (3.3%) | 4 (0.6%) |
| 75 Years and over | 21 (4.7%) | 27 (5.5%) |
Technology Access in San Anselmo
Computing Device Access in San Anselmo
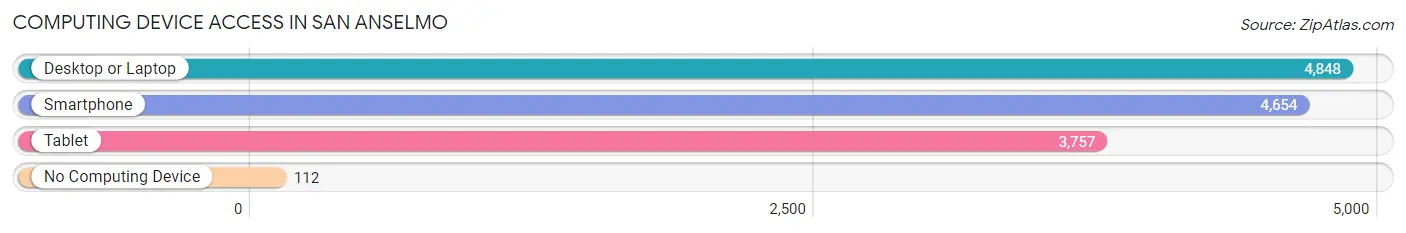
| Device Type | # Households | % Households |
| Desktop or Laptop | 4,848 | 95.2% |
| Smartphone | 4,654 | 91.4% |
| Tablet | 3,757 | 73.8% |
| No Computing Device | 112 | 2.2% |
| Total | 5,091 | 100.0% |
Internet Access in San Anselmo
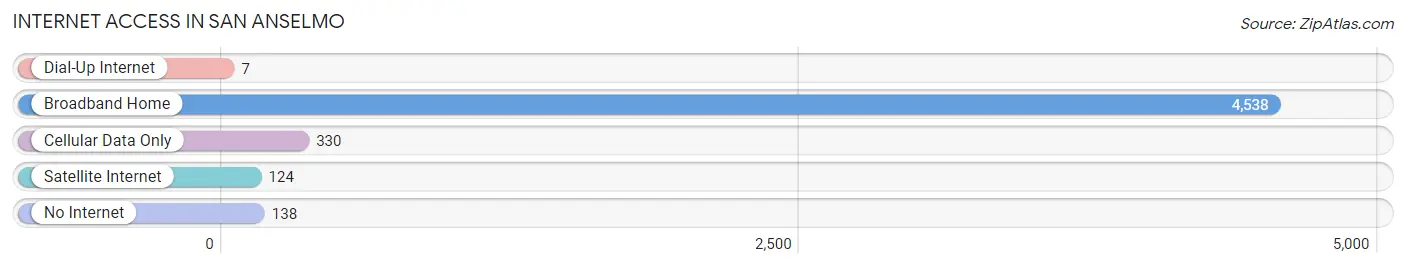
| Internet Type | # Households | % Households |
| Dial-Up Internet | 7 | 0.1% |
| Broadband Home | 4,538 | 89.1% |
| Cellular Data Only | 330 | 6.5% |
| Satellite Internet | 124 | 2.4% |
| No Internet | 138 | 2.7% |
| Total | 5,091 | 100.0% |
San Anselmo Summary
San Anselmo is a small town located in Marin County, California, United States. It is situated in the San Francisco Bay Area, about 10 miles north of San Francisco. The town has a population of 12,336 as of the 2010 census.
History
San Anselmo was founded in 1875 by two brothers, William and George Skinner, who purchased the land from the Mexican government. The town was named after Saint Anselm of Canterbury, a Benedictine monk and theologian. The town was originally a farming community, but it soon developed into a residential area.
In the early 1900s, San Anselmo became a popular destination for wealthy San Franciscans who wanted to escape the hustle and bustle of the city. The town was known for its Victorian-style homes and its picturesque downtown area.
In the 1920s, San Anselmo was the site of a major earthquake that caused significant damage to the town. The earthquake destroyed many of the town’s buildings, including the town hall and the post office.
In the 1950s, San Anselmo began to experience a population boom as people moved to the area from other parts of the country. The town’s population grew from 4,000 in 1950 to 12,000 in 1960.
Geography
San Anselmo is located in the San Francisco Bay Area, about 10 miles north of San Francisco. The town is situated in a valley surrounded by hills and mountains. The town is located at an elevation of about 500 feet above sea level.
The town is located in a temperate climate zone, with mild winters and warm summers. The average annual temperature is about 60 degrees Fahrenheit.
Economy
San Anselmo is a residential community, and the town’s economy is largely based on the service industry. The town is home to a variety of restaurants, shops, and other businesses.
The town is also home to several technology companies, including Autodesk, which is headquartered in San Anselmo.
Demographics
As of the 2010 census, San Anselmo had a population of 12,336. The town’s population is largely white (83.3%), with smaller percentages of Asian (7.2%), Hispanic (4.7%), and African American (2.2%) residents.
The median household income in San Anselmo is $107,817, which is significantly higher than the national median of $53,482. The median home value in San Anselmo is $1,092,400, which is also significantly higher than the national median of $184,700.
Conclusion
San Anselmo is a small town located in Marin County, California, United States. It is situated in the San Francisco Bay Area, about 10 miles north of San Francisco. The town has a population of 12,336 as of the 2010 census. San Anselmo was founded in 1875 and is known for its Victorian-style homes and picturesque downtown area. The town’s economy is largely based on the service industry, and the town is home to several technology companies. The town’s population is largely white, with smaller percentages of Asian, Hispanic, and African American residents. The median household income in San Anselmo is significantly higher than the national median, and the median home value is also significantly higher than the national median.
Common Questions
What is Per Capita Income in San Anselmo?
Per Capita income in San Anselmo is $97,674.
What is the Median Family Income in San Anselmo?
Median Family Income in San Anselmo is $230,588.
What is the Median Household income in San Anselmo?
Median Household Income in San Anselmo is $165,366.
What is Income or Wage Gap in San Anselmo?
Income or Wage Gap in San Anselmo is 31.2%.
Women in San Anselmo earn 68.8 cents for every dollar earned by a man.
What is Inequality or Gini Index in San Anselmo?
Inequality or Gini Index in San Anselmo is 0.49.
What is the Total Population of San Anselmo?
Total Population of San Anselmo is 12,761.
What is the Total Male Population of San Anselmo?
Total Male Population of San Anselmo is 6,451.
What is the Total Female Population of San Anselmo?
Total Female Population of San Anselmo is 6,310.
What is the Ratio of Males per 100 Females in San Anselmo?
There are 102.23 Males per 100 Females in San Anselmo.
What is the Ratio of Females per 100 Males in San Anselmo?
There are 97.81 Females per 100 Males in San Anselmo.
What is the Median Population Age in San Anselmo?
Median Population Age in San Anselmo is 46.0 Years.
What is the Average Family Size in San Anselmo
Average Family Size in San Anselmo is 3.0 People.
What is the Average Household Size in San Anselmo
Average Household Size in San Anselmo is 2.5 People.
How Large is the Labor Force in San Anselmo?
There are 7,205 People in the Labor Forcein in San Anselmo.
What is the Percentage of People in the Labor Force in San Anselmo?
72.3% of People are in the Labor Force in San Anselmo.
What is the Unemployment Rate in San Anselmo?
Unemployment Rate in San Anselmo is 5.4%.