Cities with the Highest Percentage of Population Employed in Legal Services & Support in New Hampshire
RELATED REPORTS & OPTIONS
Legal Services & Support
New Hampshire
Compare Cities
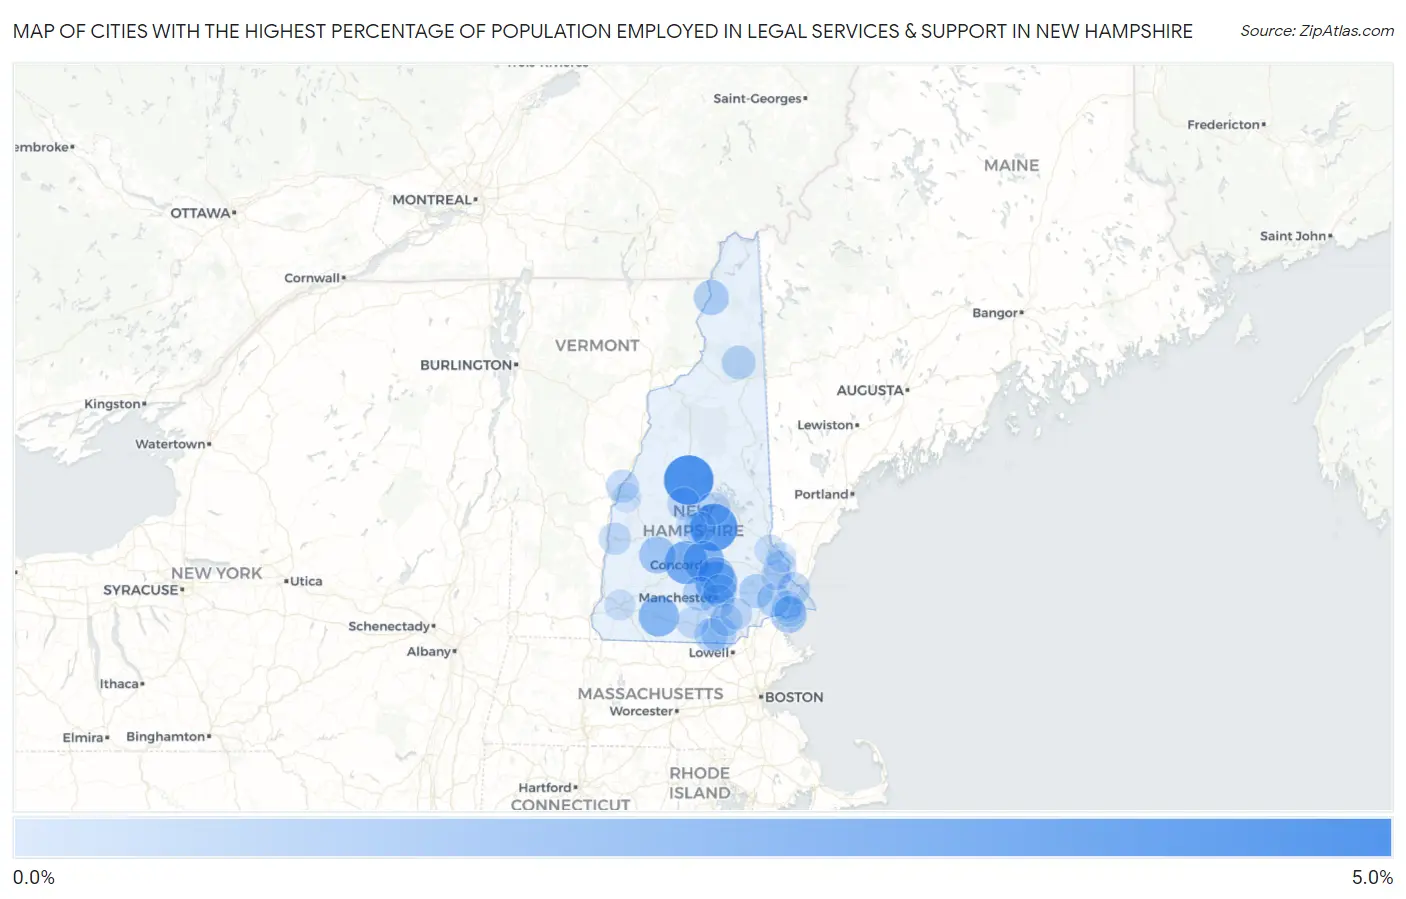
Map of Cities with the Highest Percentage of Population Employed in Legal Services & Support in New Hampshire
0.0%
5.0%
Cities with the Highest Percentage of Population Employed in Legal Services & Support in New Hampshire
| City | % Employed | vs State | vs National | |
| 1. | Plymouth | 4.9% | 0.83%(+4.11)#1 | 1.2%(+3.76)#856 |
| 2. | Belmont | 4.4% | 0.83%(+3.53)#2 | 1.2%(+3.18)#1,059 |
| 3. | Contoocook | 3.3% | 0.83%(+2.42)#3 | 1.2%(+2.07)#1,714 |
| 4. | Hooksett | 3.0% | 0.83%(+2.12)#4 | 1.2%(+1.77)#1,980 |
| 5. | Concord | 2.7% | 0.83%(+1.91)#5 | 1.2%(+1.56)#2,194 |
| 6. | Peterborough | 2.6% | 0.83%(+1.75)#6 | 1.2%(+1.40)#2,370 |
| 7. | Bradford | 1.7% | 0.83%(+0.869)#7 | 1.2%(+0.518)#3,882 |
| 8. | Seabrook Beach | 1.5% | 0.83%(+0.645)#8 | 1.2%(+0.294)#4,487 |
| 9. | Suncook | 1.4% | 0.83%(+0.607)#9 | 1.2%(+0.256)#4,613 |
| 10. | Colebrook | 1.2% | 0.83%(+0.391)#10 | 1.2%(+0.041)#5,355 |
| 11. | Hudson | 1.2% | 0.83%(+0.379)#11 | 1.2%(+0.029)#5,410 |
| 12. | Goffstown | 1.0% | 0.83%(+0.192)#12 | 1.2%(-0.159)#6,233 |
| 13. | Epping | 0.99% | 0.83%(+0.159)#13 | 1.2%(-0.192)#6,411 |
| 14. | Manchester | 0.98% | 0.83%(+0.146)#14 | 1.2%(-0.205)#6,477 |
| 15. | South Hooksett | 0.93% | 0.83%(+0.102)#15 | 1.2%(-0.249)#6,703 |
| 16. | Exeter | 0.91% | 0.83%(+0.082)#16 | 1.2%(-0.269)#6,811 |
| 17. | Nashua | 0.90% | 0.83%(+0.064)#17 | 1.2%(-0.286)#6,890 |
| 18. | Berlin | 0.88% | 0.83%(+0.050)#18 | 1.2%(-0.300)#6,957 |
| 19. | Hanover | 0.71% | 0.83%(-0.122)#19 | 1.2%(-0.473)#8,001 |
| 20. | Dover | 0.70% | 0.83%(-0.130)#20 | 1.2%(-0.481)#8,054 |
| 21. | Bristol | 0.68% | 0.83%(-0.151)#21 | 1.2%(-0.502)#8,209 |
| 22. | Portsmouth | 0.67% | 0.83%(-0.160)#22 | 1.2%(-0.511)#8,280 |
| 23. | Laconia | 0.66% | 0.83%(-0.175)#23 | 1.2%(-0.526)#8,368 |
| 24. | Londonderry | 0.56% | 0.83%(-0.273)#24 | 1.2%(-0.624)#9,079 |
| 25. | Claremont | 0.52% | 0.83%(-0.317)#25 | 1.2%(-0.667)#9,370 |
| 26. | Derry | 0.49% | 0.83%(-0.343)#26 | 1.2%(-0.694)#9,571 |
| 27. | Milford | 0.46% | 0.83%(-0.377)#27 | 1.2%(-0.728)#9,852 |
| 28. | Tilton Northfield | 0.44% | 0.83%(-0.393)#28 | 1.2%(-0.744)#9,956 |
| 29. | Hampton | 0.38% | 0.83%(-0.453)#29 | 1.2%(-0.804)#10,359 |
| 30. | Hampton Beach | 0.33% | 0.83%(-0.498)#30 | 1.2%(-0.849)#10,699 |
| 31. | Franklin | 0.31% | 0.83%(-0.526)#31 | 1.2%(-0.877)#10,890 |
| 32. | Rochester | 0.24% | 0.83%(-0.592)#32 | 1.2%(-0.943)#11,249 |
| 33. | Keene | 0.21% | 0.83%(-0.623)#33 | 1.2%(-0.974)#11,396 |
| 34. | Durham | 0.13% | 0.83%(-0.700)#34 | 1.2%(-1.05)#11,674 |
| 35. | Lebanon | 0.068% | 0.83%(-0.765)#35 | 1.2%(-1.12)#11,795 |
| 36. | Somersworth | 0.029% | 0.83%(-0.804)#36 | 1.2%(-1.16)#11,830 |
1
Common Questions
What are the Top 10 Cities with the Highest Percentage of Population Employed in Legal Services & Support in New Hampshire?
Top 10 Cities with the Highest Percentage of Population Employed in Legal Services & Support in New Hampshire are:
#1
4.9%
#2
4.4%
#3
3.3%
#4
3.0%
#5
2.7%
#6
2.6%
#7
1.7%
#8
1.5%
#9
1.4%
#10
1.2%
What city has the Highest Percentage of Population Employed in Legal Services & Support in New Hampshire?
Plymouth has the Highest Percentage of Population Employed in Legal Services & Support in New Hampshire with 4.9%.
What is the Percentage of Population Employed in Legal Services & Support in the State of New Hampshire?
Percentage of Population Employed in Legal Services & Support in New Hampshire is 0.83%.
What is the Percentage of Population Employed in Legal Services & Support in the United States?
Percentage of Population Employed in Legal Services & Support in the United States is 1.2%.