Agoura Hills, CA Map & Demographics
Agoura Hills Map
Agoura Hills Overview
$75,425
PER CAPITA INCOME
$187,550
AVG FAMILY INCOME
$157,930
AVG HOUSEHOLD INCOME
43.5%
WAGE / INCOME GAP [ % ]
56.5¢/ $1
WAGE / INCOME GAP [ $ ]
$12,632
FAMILY INCOME DEFICIT
0.45
INEQUALITY / GINI INDEX
20,088
TOTAL POPULATION
9,975
MALE POPULATION
10,113
FEMALE POPULATION
98.64
MALES / 100 FEMALES
101.38
FEMALES / 100 MALES
44.5
MEDIAN AGE
3.2
AVG FAMILY SIZE
2.8
AVG HOUSEHOLD SIZE
10,346
LABOR FORCE [ PEOPLE ]
63.4%
PERCENT IN LABOR FORCE
5.4%
UNEMPLOYMENT RATE
Agoura Hills Zip Codes
Income in Agoura Hills
Income Overview in Agoura Hills
Per Capita Income in Agoura Hills is $75,425, while median incomes of families and households are $187,550 and $157,930 respectively.
| Characteristic | Number | Measure |
| Per Capita Income | 20,088 | $75,425 |
| Median Family Income | 5,491 | $187,550 |
| Mean Family Income | 5,491 | $238,552 |
| Median Household Income | 7,085 | $157,930 |
| Mean Household Income | 7,085 | $211,006 |
| Income Deficit | 5,491 | $12,632 |
| Wage / Income Gap (%) | 20,088 | 43.50% |
| Wage / Income Gap ($) | 20,088 | 56.50¢ per $1 |
| Gini / Inequality Index | 20,088 | 0.45 |
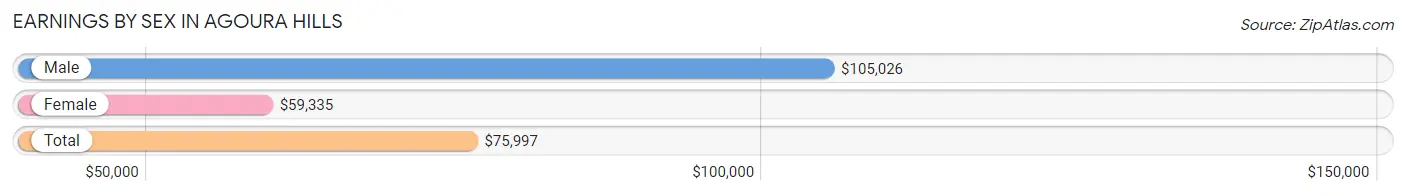
Earnings by Sex in Agoura Hills
Average Earnings in Agoura Hills are $75,997, $105,026 for men and $59,335 for women, a difference of 43.5%.
| Sex | Number | Average Earnings |
| Male | 5,681 (52.5%) | $105,026 |
| Female | 5,134 (47.5%) | $59,335 |
| Total | 10,815 (100.0%) | $75,997 |
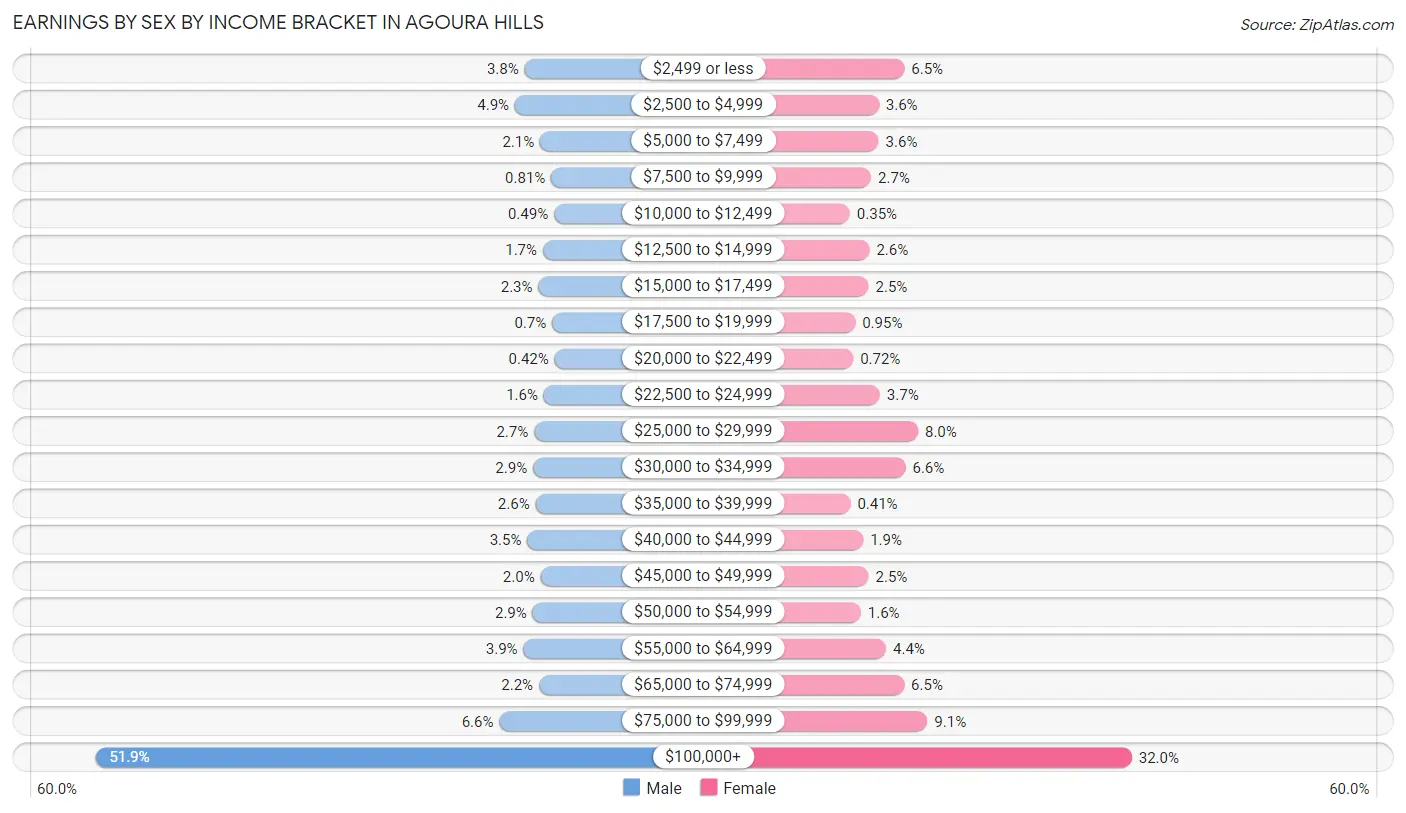
Earnings by Sex by Income Bracket in Agoura Hills
The most common earnings brackets in Agoura Hills are $100,000+ for men (2,950 | 51.9%) and $100,000+ for women (1,645 | 32.0%).
| Income | Male | Female |
| $2,499 or less | 216 (3.8%) | 332 (6.5%) |
| $2,500 to $4,999 | 277 (4.9%) | 185 (3.6%) |
| $5,000 to $7,499 | 117 (2.1%) | 184 (3.6%) |
| $7,500 to $9,999 | 46 (0.8%) | 140 (2.7%) |
| $10,000 to $12,499 | 28 (0.5%) | 18 (0.4%) |
| $12,500 to $14,999 | 99 (1.7%) | 131 (2.5%) |
| $15,000 to $17,499 | 128 (2.2%) | 126 (2.5%) |
| $17,500 to $19,999 | 40 (0.7%) | 49 (0.9%) |
| $20,000 to $22,499 | 24 (0.4%) | 37 (0.7%) |
| $22,500 to $24,999 | 93 (1.6%) | 191 (3.7%) |
| $25,000 to $29,999 | 155 (2.7%) | 411 (8.0%) |
| $30,000 to $34,999 | 162 (2.9%) | 339 (6.6%) |
| $35,000 to $39,999 | 146 (2.6%) | 21 (0.4%) |
| $40,000 to $44,999 | 198 (3.5%) | 95 (1.8%) |
| $45,000 to $49,999 | 114 (2.0%) | 126 (2.5%) |
| $50,000 to $54,999 | 164 (2.9%) | 81 (1.6%) |
| $55,000 to $64,999 | 223 (3.9%) | 227 (4.4%) |
| $65,000 to $74,999 | 124 (2.2%) | 331 (6.5%) |
| $75,000 to $99,999 | 377 (6.6%) | 465 (9.1%) |
| $100,000+ | 2,950 (51.9%) | 1,645 (32.0%) |
| Total | 5,681 (100.0%) | 5,134 (100.0%) |
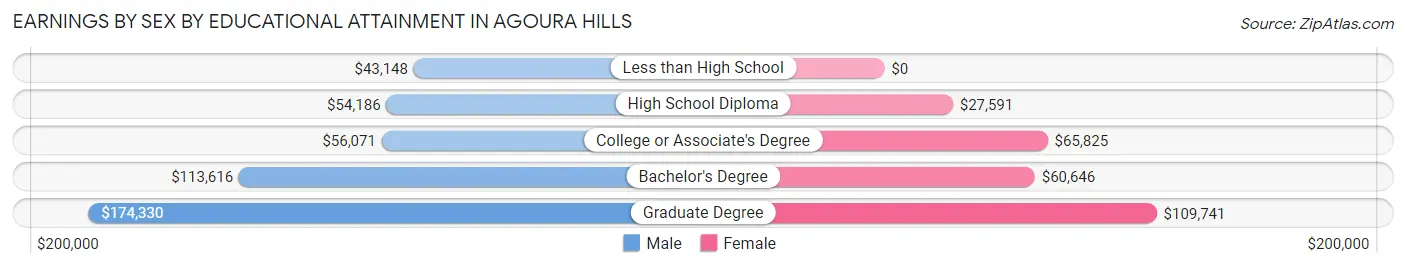
Earnings by Sex by Educational Attainment in Agoura Hills
Average earnings in Agoura Hills are $113,810 for men and $67,200 for women, a difference of 40.9%. Men with an educational attainment of graduate degree enjoy the highest average annual earnings of $174,330, while those with less than high school education earn the least with $43,148. Women with an educational attainment of graduate degree earn the most with the average annual earnings of $109,741, while those with high school diploma education have the smallest earnings of $27,591.
| Educational Attainment | Male Income | Female Income |
| Less than High School | $43,148 | $0 |
| High School Diploma | $54,186 | $27,591 |
| College or Associate's Degree | $56,071 | $65,825 |
| Bachelor's Degree | $113,616 | $60,646 |
| Graduate Degree | $174,330 | $109,741 |
| Total | $113,810 | $67,200 |
Family Income in Agoura Hills
Family Income Brackets in Agoura Hills
According to the Agoura Hills family income data, there are 2,498 families falling into the $200,000+ income range, which is the most common income bracket and makes up 45.5% of all families. Conversely, the $10,000 to $14,999 income bracket is the least frequent group with only 38 families (0.7%) belonging to this category.
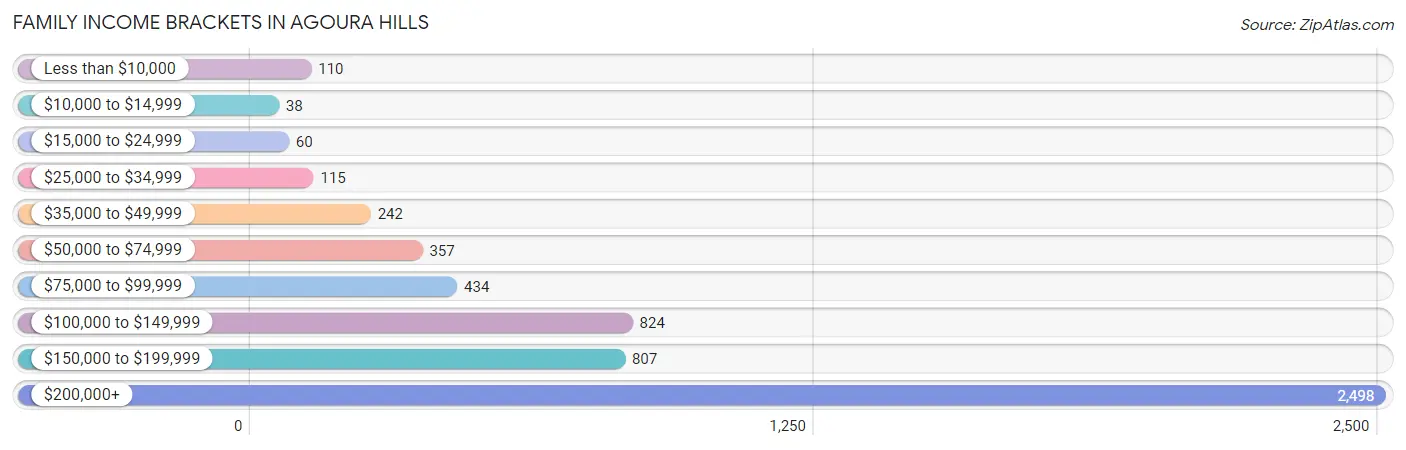
| Income Bracket | # Families | % Families |
| Less than $10,000 | 110 | 2.0% |
| $10,000 to $14,999 | 38 | 0.7% |
| $15,000 to $24,999 | 60 | 1.1% |
| $25,000 to $34,999 | 115 | 2.1% |
| $35,000 to $49,999 | 242 | 4.4% |
| $50,000 to $74,999 | 357 | 6.5% |
| $75,000 to $99,999 | 434 | 7.9% |
| $100,000 to $149,999 | 824 | 15.0% |
| $150,000 to $199,999 | 807 | 14.7% |
| $200,000+ | 2,498 | 45.5% |
Family Income by Famaliy Size in Agoura Hills
5-person families (431 | 7.9%) account for the highest median family income in Agoura Hills with $250,001 per family, while 2-person families (2,063 | 37.6%) have the highest median income of $79,758 per family member.

| Income Bracket | # Families | Median Income |
| 2-Person Families | 2,063 (37.6%) | $159,517 |
| 3-Person Families | 1,501 (27.3%) | $178,447 |
| 4-Person Families | 1,354 (24.7%) | $229,167 |
| 5-Person Families | 431 (7.9%) | $250,001 |
| 6-Person Families | 142 (2.6%) | $0 |
| 7+ Person Families | 0 (0.0%) | $0 |
| Total | 5,491 (100.0%) | $187,550 |
Family Income by Number of Earners in Agoura Hills
The median family income in Agoura Hills is $187,550, with families comprising 3+ earners (602) having the highest median family income of $250,001, while families with no earners (497) have the lowest median family income of $52,440, accounting for 11.0% and 9.0% of families, respectively.
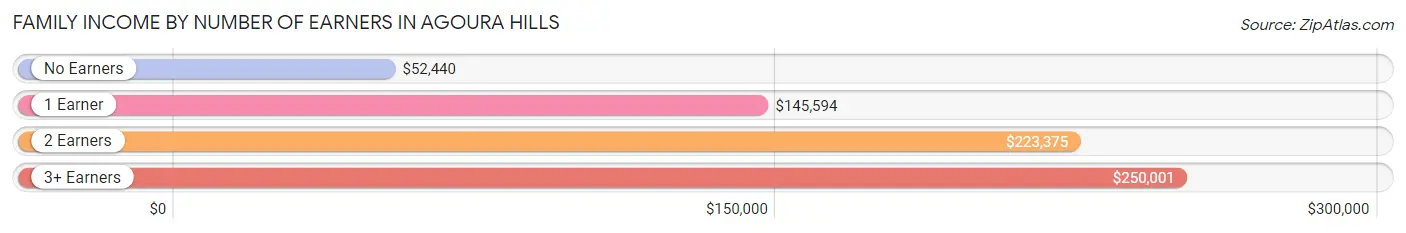
| Number of Earners | # Families | Median Income |
| No Earners | 497 (9.0%) | $52,440 |
| 1 Earner | 1,687 (30.7%) | $145,594 |
| 2 Earners | 2,705 (49.3%) | $223,375 |
| 3+ Earners | 602 (11.0%) | $250,001 |
| Total | 5,491 (100.0%) | $187,550 |
Household Income in Agoura Hills
Household Income Brackets in Agoura Hills
With 2,742 households falling in the category, the $200,000+ income range is the most frequent in Agoura Hills, accounting for 38.7% of all households. In contrast, only 35 households (0.5%) fall into the $10,000 to $14,999 income bracket, making it the least populous group.
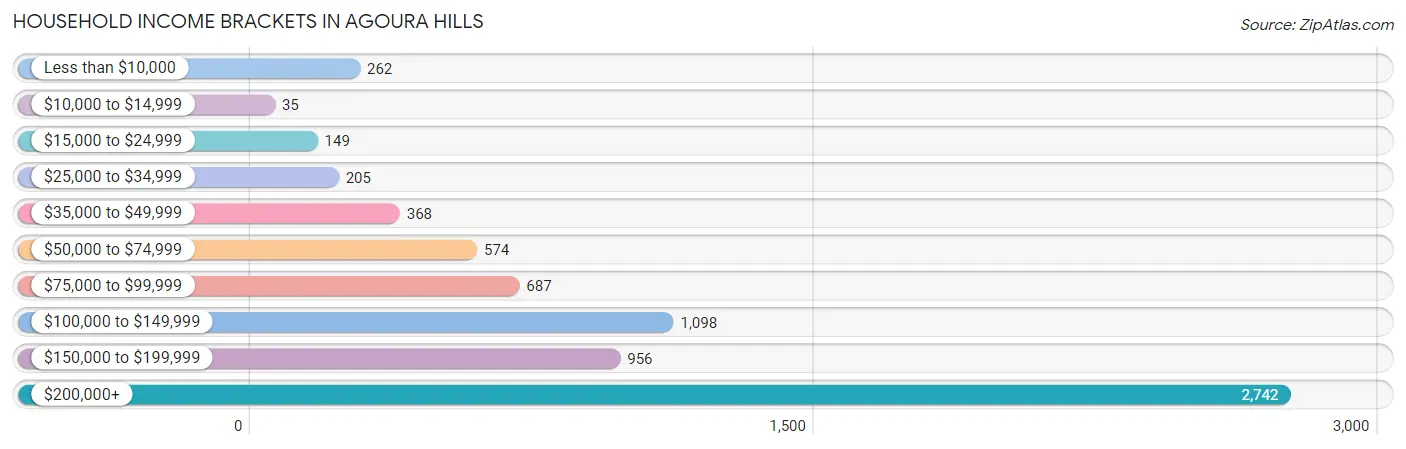
| Income Bracket | # Households | % Households |
| Less than $10,000 | 262 | 3.7% |
| $10,000 to $14,999 | 35 | 0.5% |
| $15,000 to $24,999 | 149 | 2.1% |
| $25,000 to $34,999 | 205 | 2.9% |
| $35,000 to $49,999 | 368 | 5.2% |
| $50,000 to $74,999 | 574 | 8.1% |
| $75,000 to $99,999 | 687 | 9.7% |
| $100,000 to $149,999 | 1,098 | 15.5% |
| $150,000 to $199,999 | 956 | 13.5% |
| $200,000+ | 2,742 | 38.7% |
Household Income by Householder Age in Agoura Hills
The median household income in Agoura Hills is $157,930, with the highest median household income of $195,542 found in the 25 to 44 years age bracket for the primary householder. A total of 1,675 households (23.6%) fall into this category. Meanwhile, the 15 to 24 years age bracket for the primary householder has the lowest median household income of $0, with 9 households (0.1%) in this group.
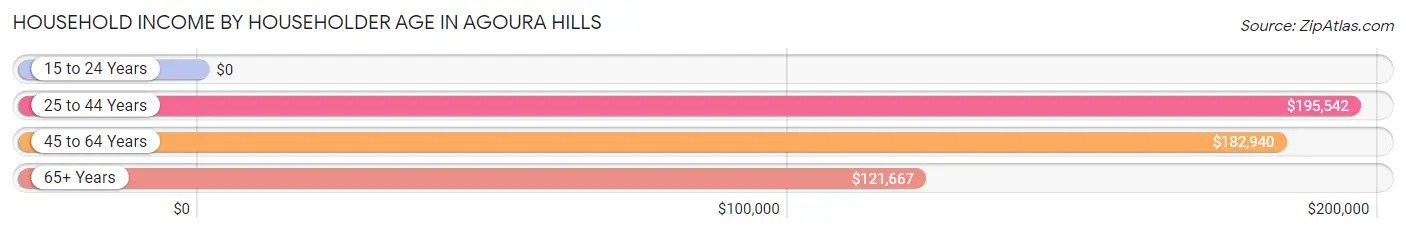
| Income Bracket | # Households | Median Income |
| 15 to 24 Years | 9 (0.1%) | $0 |
| 25 to 44 Years | 1,675 (23.6%) | $195,542 |
| 45 to 64 Years | 3,593 (50.7%) | $182,940 |
| 65+ Years | 1,808 (25.5%) | $121,667 |
| Total | 7,085 (100.0%) | $157,930 |
Poverty in Agoura Hills
Income Below Poverty by Sex and Age in Agoura Hills
With 4.4% poverty level for males and 5.6% for females among the residents of Agoura Hills, 18 to 24 year old males and 18 to 24 year old females are the most vulnerable to poverty, with 71 males (8.7%) and 152 females (20.0%) in their respective age groups living below the poverty level.
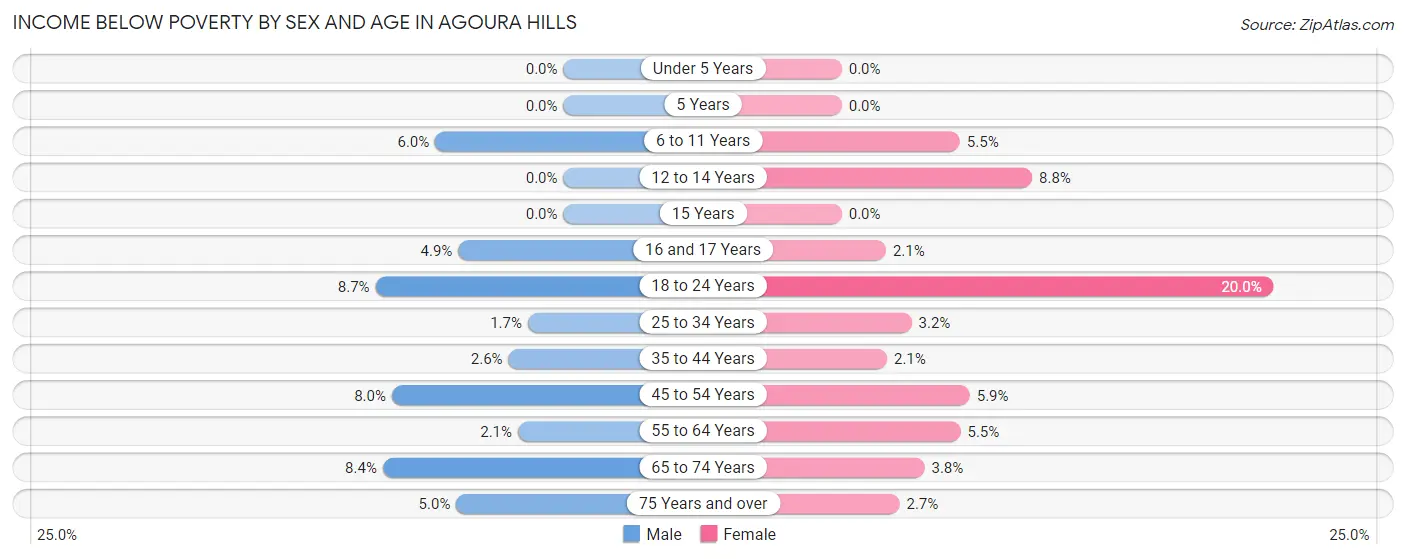
| Age Bracket | Male | Female |
| Under 5 Years | 0 (0.0%) | 0 (0.0%) |
| 5 Years | 0 (0.0%) | 0 (0.0%) |
| 6 to 11 Years | 54 (5.9%) | 45 (5.5%) |
| 12 to 14 Years | 0 (0.0%) | 49 (8.8%) |
| 15 Years | 0 (0.0%) | 0 (0.0%) |
| 16 and 17 Years | 20 (4.9%) | 9 (2.1%) |
| 18 to 24 Years | 71 (8.7%) | 152 (20.0%) |
| 25 to 34 Years | 14 (1.7%) | 25 (3.2%) |
| 35 to 44 Years | 33 (2.5%) | 26 (2.1%) |
| 45 to 54 Years | 99 (8.0%) | 85 (5.9%) |
| 55 to 64 Years | 37 (2.1%) | 108 (5.5%) |
| 65 to 74 Years | 89 (8.4%) | 41 (3.8%) |
| 75 Years and over | 22 (5.0%) | 18 (2.7%) |
| Total | 439 (4.4%) | 558 (5.6%) |
Income Above Poverty by Sex and Age in Agoura Hills
According to the poverty statistics in Agoura Hills, males aged under 5 years and females aged under 5 years are the age groups that are most secure financially, with 100.0% of males and 100.0% of females in these age groups living above the poverty line.
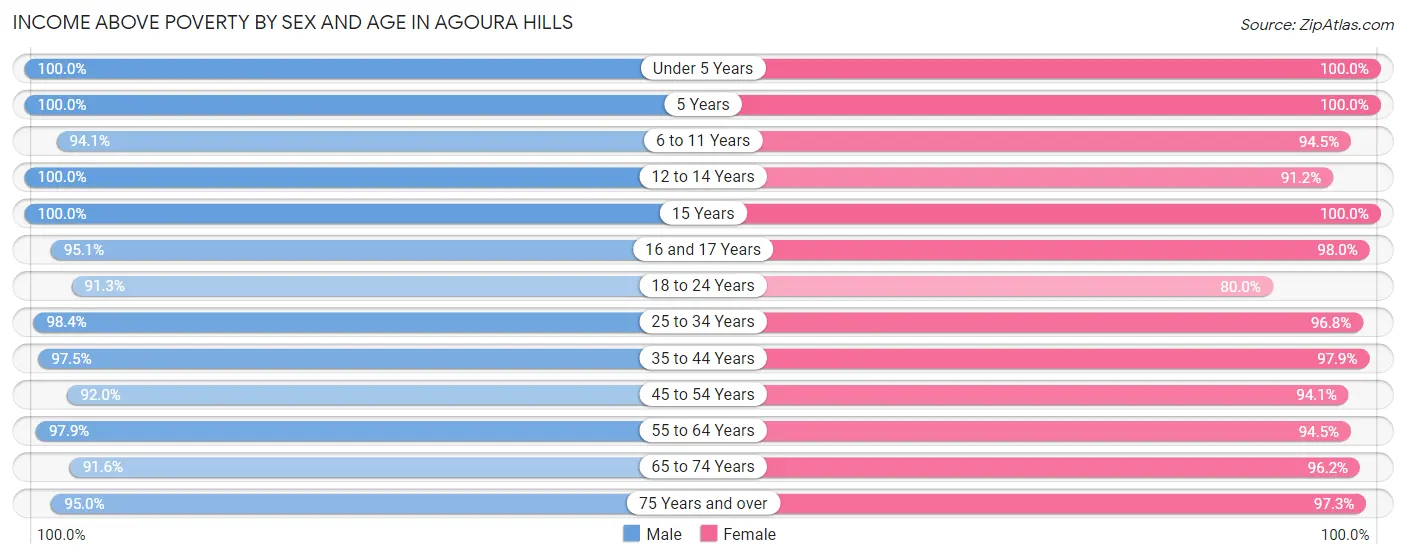
| Age Bracket | Male | Female |
| Under 5 Years | 356 (100.0%) | 287 (100.0%) |
| 5 Years | 78 (100.0%) | 14 (100.0%) |
| 6 to 11 Years | 854 (94.1%) | 776 (94.5%) |
| 12 to 14 Years | 498 (100.0%) | 506 (91.2%) |
| 15 Years | 175 (100.0%) | 45 (100.0%) |
| 16 and 17 Years | 390 (95.1%) | 430 (98.0%) |
| 18 to 24 Years | 743 (91.3%) | 607 (80.0%) |
| 25 to 34 Years | 836 (98.4%) | 746 (96.8%) |
| 35 to 44 Years | 1,263 (97.5%) | 1,213 (97.9%) |
| 45 to 54 Years | 1,145 (92.0%) | 1,345 (94.1%) |
| 55 to 64 Years | 1,718 (97.9%) | 1,851 (94.5%) |
| 65 to 74 Years | 973 (91.6%) | 1,028 (96.2%) |
| 75 Years and over | 421 (95.0%) | 653 (97.3%) |
| Total | 9,450 (95.6%) | 9,501 (94.5%) |
Income Below Poverty Among Married-Couple Families in Agoura Hills
The poverty statistics for married-couple families in Agoura Hills show that 2.9% or 132 of the total 4,623 families live below the poverty line. Families with no children have the highest poverty rate of 3.5%, comprising of 93 families. On the other hand, families with 3 or 4 children have the lowest poverty rate of 0.0%, which includes 0 families.
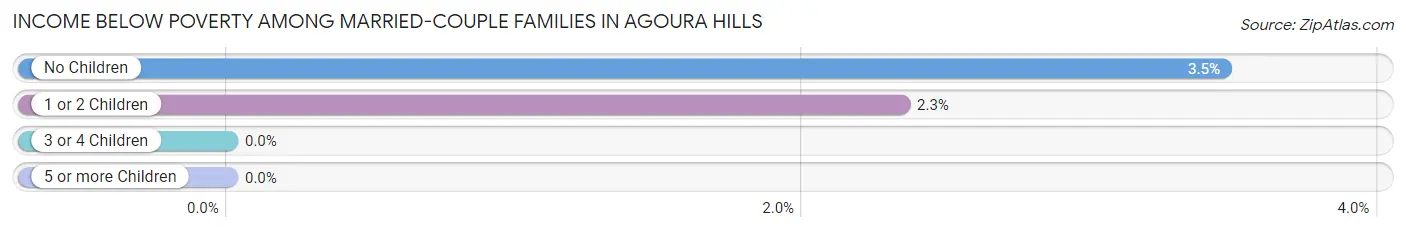
| Children | Above Poverty | Below Poverty |
| No Children | 2,595 (96.5%) | 93 (3.5%) |
| 1 or 2 Children | 1,630 (97.7%) | 39 (2.3%) |
| 3 or 4 Children | 266 (100.0%) | 0 (0.0%) |
| 5 or more Children | 0 (0.0%) | 0 (0.0%) |
| Total | 4,491 (97.1%) | 132 (2.9%) |
Income Below Poverty Among Single-Parent Households in Agoura Hills
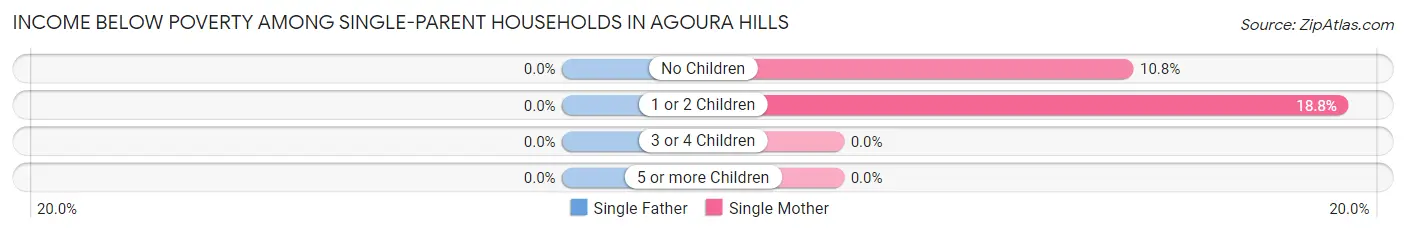
| Children | Single Father | Single Mother |
| No Children | 0 (0.0%) | 22 (10.8%) |
| 1 or 2 Children | 0 (0.0%) | 73 (18.8%) |
| 3 or 4 Children | 0 (0.0%) | 0 (0.0%) |
| 5 or more Children | 0 (0.0%) | 0 (0.0%) |
| Total | 0 (0.0%) | 95 (16.1%) |
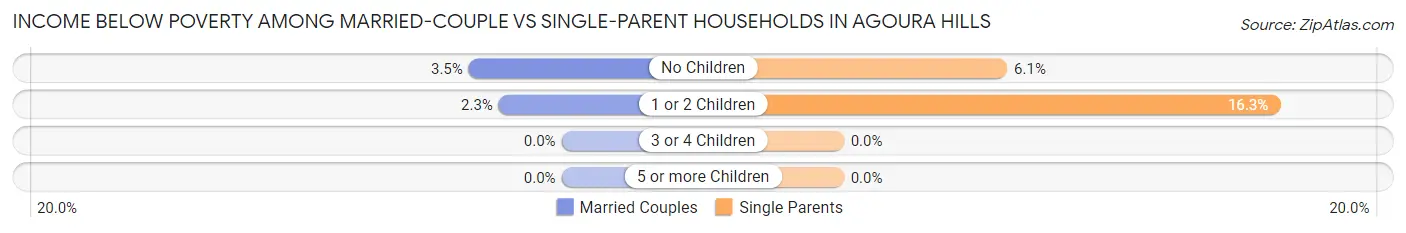
Income Below Poverty Among Married-Couple vs Single-Parent Households in Agoura Hills
The poverty data for Agoura Hills shows that 132 of the married-couple family households (2.9%) and 95 of the single-parent households (10.9%) are living below the poverty level. Within the married-couple family households, those with no children have the highest poverty rate, with 93 households (3.5%) falling below the poverty line. Among the single-parent households, those with 1 or 2 children have the highest poverty rate, with 73 household (16.3%) living below poverty.
| Children | Married-Couple Families | Single-Parent Households |
| No Children | 93 (3.5%) | 22 (6.1%) |
| 1 or 2 Children | 39 (2.3%) | 73 (16.3%) |
| 3 or 4 Children | 0 (0.0%) | 0 (0.0%) |
| 5 or more Children | 0 (0.0%) | 0 (0.0%) |
| Total | 132 (2.9%) | 95 (10.9%) |
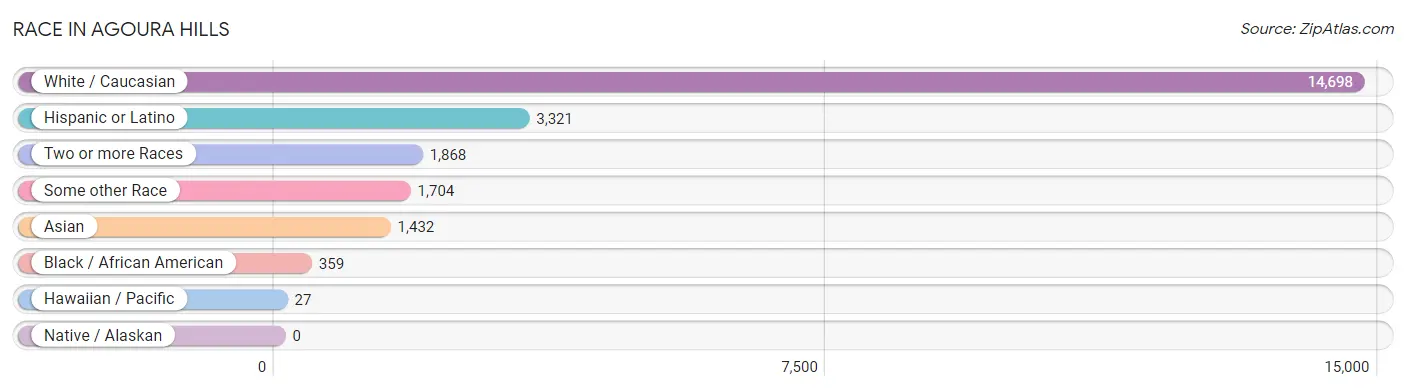
Race in Agoura Hills
The most populous races in Agoura Hills are White / Caucasian (14,698 | 73.2%), Hispanic or Latino (3,321 | 16.5%), and Two or more Races (1,868 | 9.3%).
| Race | # Population | % Population |
| Asian | 1,432 | 7.1% |
| Black / African American | 359 | 1.8% |
| Hawaiian / Pacific | 27 | 0.1% |
| Hispanic or Latino | 3,321 | 16.5% |
| Native / Alaskan | 0 | 0.0% |
| White / Caucasian | 14,698 | 73.2% |
| Two or more Races | 1,868 | 9.3% |
| Some other Race | 1,704 | 8.5% |
| Total | 20,088 | 100.0% |
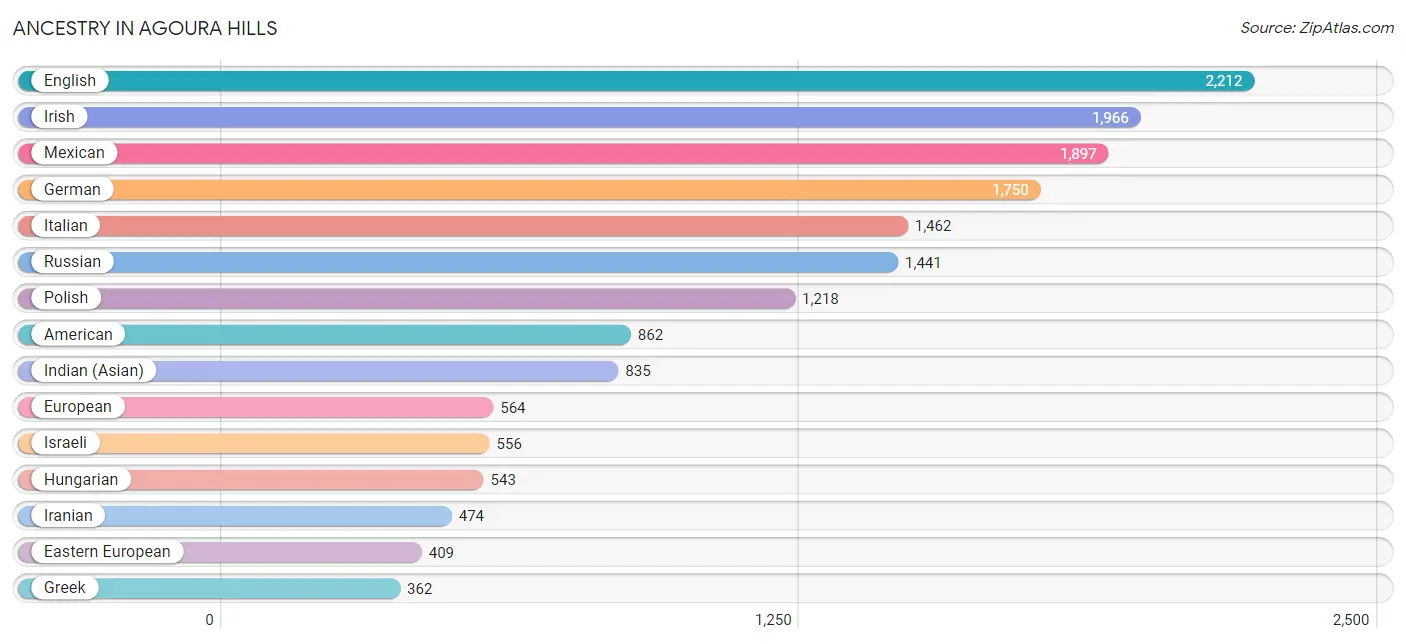
Ancestry in Agoura Hills
The most populous ancestries reported in Agoura Hills are English (2,212 | 11.0%), Irish (1,966 | 9.8%), Mexican (1,897 | 9.4%), German (1,750 | 8.7%), and Italian (1,462 | 7.3%), together accounting for 46.2% of all Agoura Hills residents.
| Ancestry | # Population | % Population |
| African | 30 | 0.2% |
| American | 862 | 4.3% |
| Arab | 215 | 1.1% |
| Argentinean | 35 | 0.2% |
| Armenian | 21 | 0.1% |
| Austrian | 76 | 0.4% |
| Basque | 42 | 0.2% |
| Belgian | 32 | 0.2% |
| Bhutanese | 181 | 0.9% |
| Bolivian | 1 | 0.0% |
| Brazilian | 227 | 1.1% |
| British | 38 | 0.2% |
| Bulgarian | 55 | 0.3% |
| Burmese | 353 | 1.8% |
| Canadian | 86 | 0.4% |
| Central American | 191 | 0.9% |
| Cherokee | 33 | 0.2% |
| Chilean | 15 | 0.1% |
| Choctaw | 10 | 0.1% |
| Colombian | 111 | 0.5% |
| Croatian | 38 | 0.2% |
| Cuban | 75 | 0.4% |
| Czech | 34 | 0.2% |
| Czechoslovakian | 17 | 0.1% |
| Danish | 52 | 0.3% |
| Dominican | 80 | 0.4% |
| Dutch | 211 | 1.1% |
| Eastern European | 409 | 2.0% |
| English | 2,212 | 11.0% |
| European | 564 | 2.8% |
| Filipino | 112 | 0.6% |
| Finnish | 81 | 0.4% |
| French | 342 | 1.7% |
| French Canadian | 11 | 0.1% |
| German | 1,750 | 8.7% |
| Greek | 362 | 1.8% |
| Guamanian / Chamorro | 11 | 0.1% |
| Guatemalan | 124 | 0.6% |
| Hungarian | 543 | 2.7% |
| Indian (Asian) | 835 | 4.2% |
| Iranian | 474 | 2.4% |
| Irish | 1,966 | 9.8% |
| Israeli | 556 | 2.8% |
| Italian | 1,462 | 7.3% |
| Japanese | 47 | 0.2% |
| Korean | 155 | 0.8% |
| Laotian | 71 | 0.4% |
| Lebanese | 98 | 0.5% |
| Lithuanian | 110 | 0.5% |
| Mexican | 1,897 | 9.4% |
| Mongolian | 30 | 0.2% |
| Moroccan | 47 | 0.2% |
| Nicaraguan | 56 | 0.3% |
| Northern European | 41 | 0.2% |
| Norwegian | 319 | 1.6% |
| Osage | 15 | 0.1% |
| Pakistani | 56 | 0.3% |
| Peruvian | 139 | 0.7% |
| Polish | 1,218 | 6.1% |
| Puerto Rican | 99 | 0.5% |
| Romanian | 133 | 0.7% |
| Russian | 1,441 | 7.2% |
| Salvadoran | 11 | 0.1% |
| Scandinavian | 59 | 0.3% |
| Scotch-Irish | 104 | 0.5% |
| Scottish | 259 | 1.3% |
| Serbian | 10 | 0.1% |
| Slavic | 28 | 0.1% |
| Slovak | 8 | 0.0% |
| South African | 141 | 0.7% |
| South American | 344 | 1.7% |
| Spaniard | 339 | 1.7% |
| Spanish | 202 | 1.0% |
| Sri Lankan | 111 | 0.5% |
| Subsaharan African | 171 | 0.9% |
| Swedish | 164 | 0.8% |
| Swiss | 48 | 0.2% |
| Syrian | 11 | 0.1% |
| Thai | 270 | 1.3% |
| Turkish | 169 | 0.8% |
| Ukrainian | 62 | 0.3% |
| Welsh | 80 | 0.4% | View All 82 Rows |
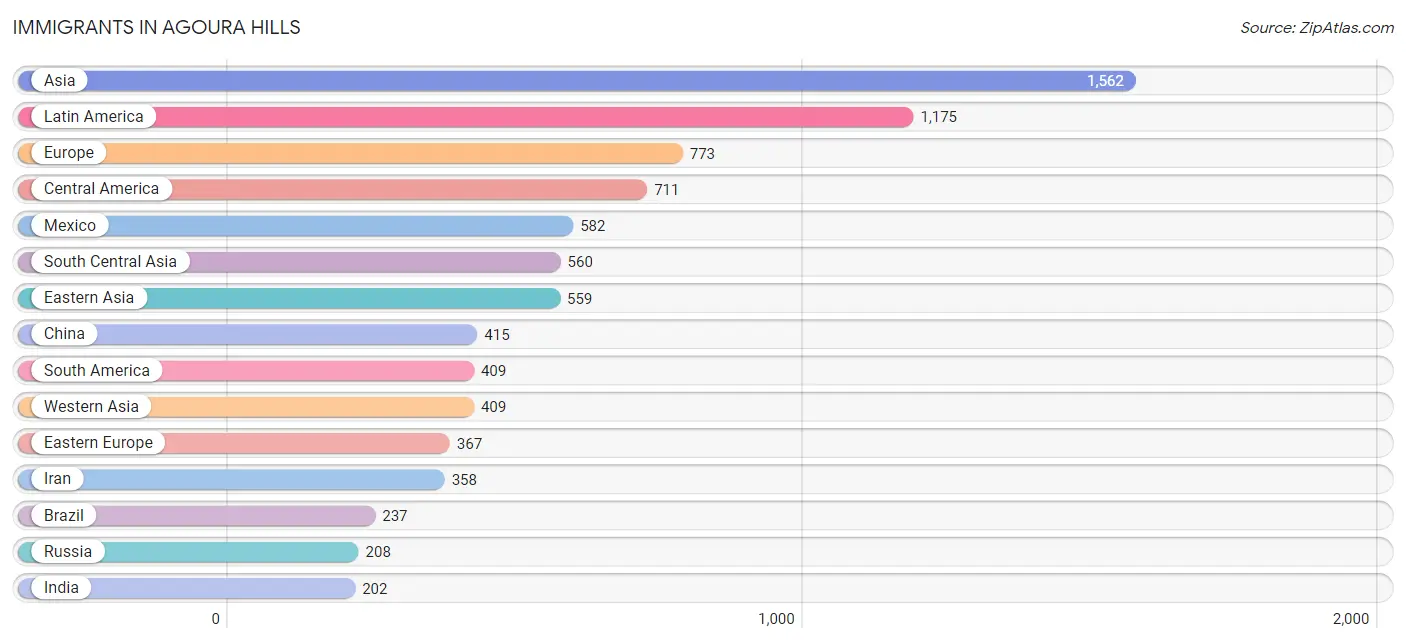
Immigrants in Agoura Hills
The most numerous immigrant groups reported in Agoura Hills came from Asia (1,562 | 7.8%), Latin America (1,175 | 5.9%), Europe (773 | 3.8%), Central America (711 | 3.5%), and Mexico (582 | 2.9%), together accounting for 23.9% of all Agoura Hills residents.
| Immigration Origin | # Population | % Population |
| Africa | 49 | 0.2% |
| Armenia | 8 | 0.0% |
| Asia | 1,562 | 7.8% |
| Belgium | 19 | 0.1% |
| Bolivia | 1 | 0.0% |
| Brazil | 237 | 1.2% |
| Bulgaria | 46 | 0.2% |
| Canada | 172 | 0.9% |
| Caribbean | 55 | 0.3% |
| Central America | 711 | 3.5% |
| Chile | 43 | 0.2% |
| China | 415 | 2.1% |
| Colombia | 63 | 0.3% |
| Cuba | 17 | 0.1% |
| Dominican Republic | 38 | 0.2% |
| Eastern Asia | 559 | 2.8% |
| Eastern Europe | 367 | 1.8% |
| El Salvador | 11 | 0.1% |
| England | 96 | 0.5% |
| Europe | 773 | 3.8% |
| France | 52 | 0.3% |
| Germany | 42 | 0.2% |
| Guatemala | 117 | 0.6% |
| Hong Kong | 25 | 0.1% |
| India | 202 | 1.0% |
| Indonesia | 3 | 0.0% |
| Iran | 358 | 1.8% |
| Israel | 191 | 0.9% |
| Italy | 85 | 0.4% |
| Japan | 55 | 0.3% |
| Korea | 89 | 0.4% |
| Latin America | 1,175 | 5.9% |
| Lebanon | 15 | 0.1% |
| Mexico | 582 | 2.9% |
| Moldova | 15 | 0.1% |
| Morocco | 12 | 0.1% |
| Netherlands | 10 | 0.1% |
| Nicaragua | 1 | 0.0% |
| Northern Africa | 12 | 0.1% |
| Northern Europe | 161 | 0.8% |
| Peru | 65 | 0.3% |
| Philippines | 20 | 0.1% |
| Russia | 208 | 1.0% |
| Saudi Arabia | 69 | 0.3% |
| Scotland | 16 | 0.1% |
| Singapore | 9 | 0.0% |
| South Africa | 37 | 0.2% |
| South America | 409 | 2.0% |
| South Central Asia | 560 | 2.8% |
| South Eastern Asia | 34 | 0.2% |
| Southern Europe | 122 | 0.6% |
| Spain | 37 | 0.2% |
| Sweden | 32 | 0.2% |
| Taiwan | 68 | 0.3% |
| Turkey | 38 | 0.2% |
| Ukraine | 98 | 0.5% |
| Vietnam | 2 | 0.0% |
| Western Asia | 409 | 2.0% |
| Western Europe | 123 | 0.6% | View All 59 Rows |
Sex and Age in Agoura Hills
Sex and Age in Agoura Hills
The most populous age groups in Agoura Hills are 55 to 59 Years (905 | 9.1%) for men and 55 to 59 Years (1,011 | 10.0%) for women.
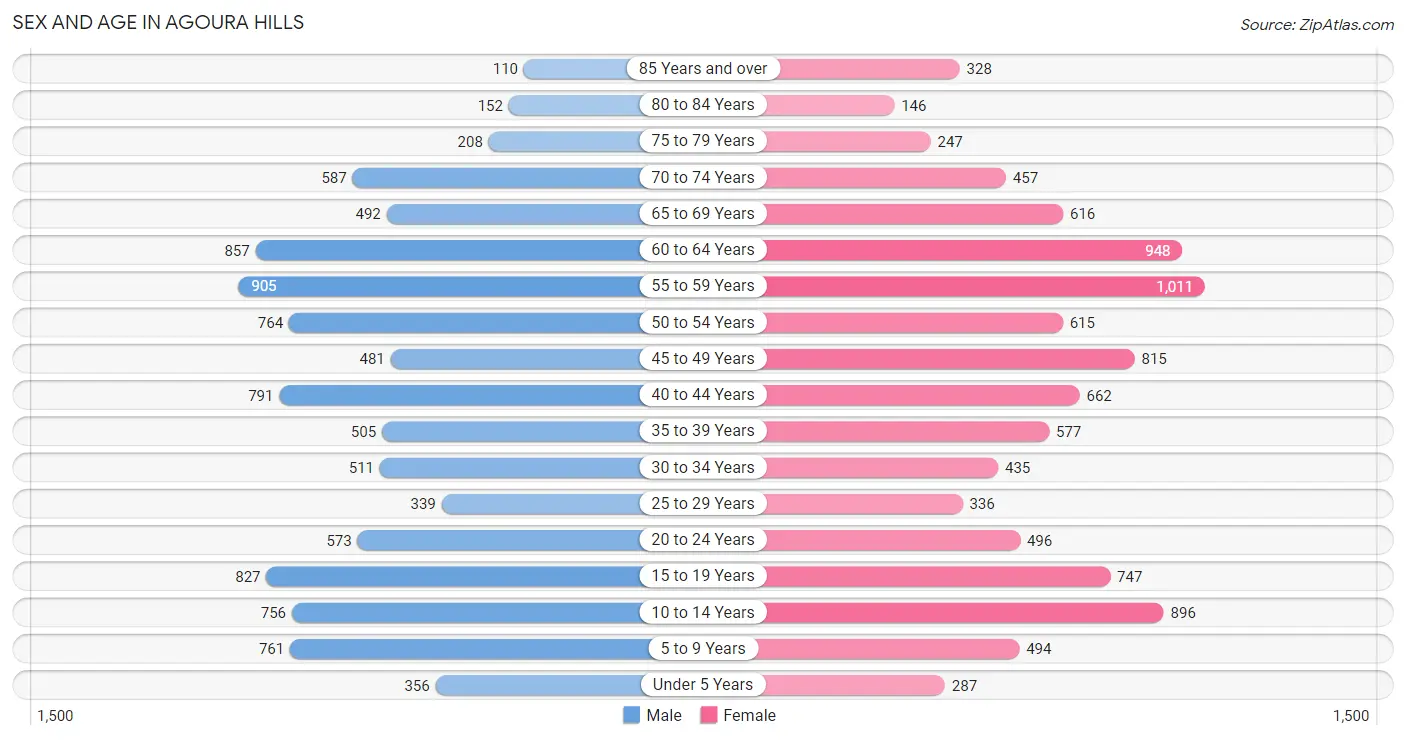
| Age Bracket | Male | Female |
| Under 5 Years | 356 (3.6%) | 287 (2.8%) |
| 5 to 9 Years | 761 (7.6%) | 494 (4.9%) |
| 10 to 14 Years | 756 (7.6%) | 896 (8.9%) |
| 15 to 19 Years | 827 (8.3%) | 747 (7.4%) |
| 20 to 24 Years | 573 (5.7%) | 496 (4.9%) |
| 25 to 29 Years | 339 (3.4%) | 336 (3.3%) |
| 30 to 34 Years | 511 (5.1%) | 435 (4.3%) |
| 35 to 39 Years | 505 (5.1%) | 577 (5.7%) |
| 40 to 44 Years | 791 (7.9%) | 662 (6.6%) |
| 45 to 49 Years | 481 (4.8%) | 815 (8.1%) |
| 50 to 54 Years | 764 (7.7%) | 615 (6.1%) |
| 55 to 59 Years | 905 (9.1%) | 1,011 (10.0%) |
| 60 to 64 Years | 857 (8.6%) | 948 (9.4%) |
| 65 to 69 Years | 492 (4.9%) | 616 (6.1%) |
| 70 to 74 Years | 587 (5.9%) | 457 (4.5%) |
| 75 to 79 Years | 208 (2.1%) | 247 (2.4%) |
| 80 to 84 Years | 152 (1.5%) | 146 (1.4%) |
| 85 Years and over | 110 (1.1%) | 328 (3.2%) |
| Total | 9,975 (100.0%) | 10,113 (100.0%) |
Families and Households in Agoura Hills
Median Family Size in Agoura Hills
The median family size in Agoura Hills is 3.21 persons per family, with married-couple families (4,623 | 84.2%) accounting for the largest median family size of 3.27 persons per family. On the other hand, single male/father families (276 | 5.0%) represent the smallest median family size with 2.80 persons per family.
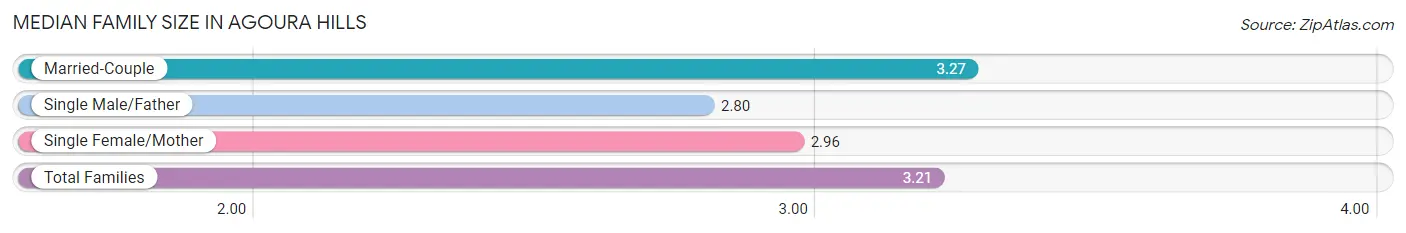
| Family Type | # Families | Family Size |
| Married-Couple | 4,623 (84.2%) | 3.27 |
| Single Male/Father | 276 (5.0%) | 2.80 |
| Single Female/Mother | 592 (10.8%) | 2.96 |
| Total Families | 5,491 (100.0%) | 3.21 |
Median Household Size in Agoura Hills
The median household size in Agoura Hills is 2.82 persons per household, with married-couple households (4,623 | 65.2%) accounting for the largest median household size of 3.33 persons per household. non-family households (1,594 | 22.5%) represent the smallest median household size with 1.23 persons per household.
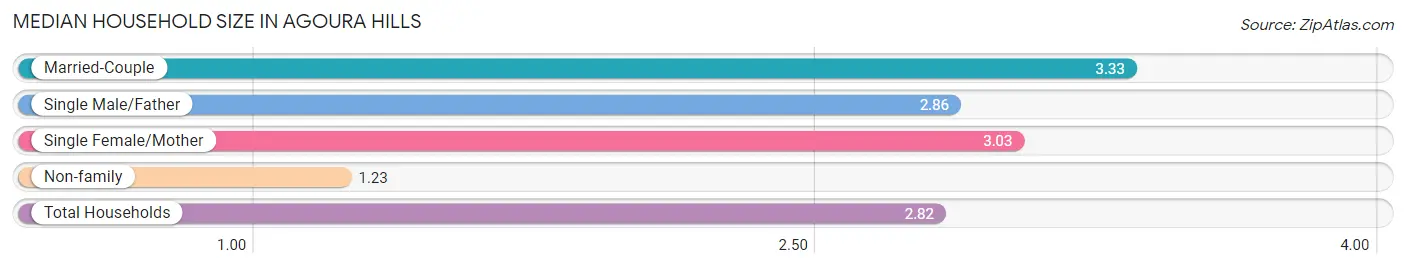
| Household Type | # Households | Household Size |
| Married-Couple | 4,623 (65.2%) | 3.33 |
| Single Male/Father | 276 (3.9%) | 2.86 |
| Single Female/Mother | 592 (8.4%) | 3.03 |
| Non-family | 1,594 (22.5%) | 1.23 |
| Total Households | 7,085 (100.0%) | 2.82 |
Household Size by Marriage Status in Agoura Hills
Out of a total of 7,085 households in Agoura Hills, 5,491 (77.5%) are family households, while 1,594 (22.5%) are nonfamily households. The most numerous type of family households are 2-person households, comprising 1,936, and the most common type of nonfamily households are 1-person households, comprising 1,273.
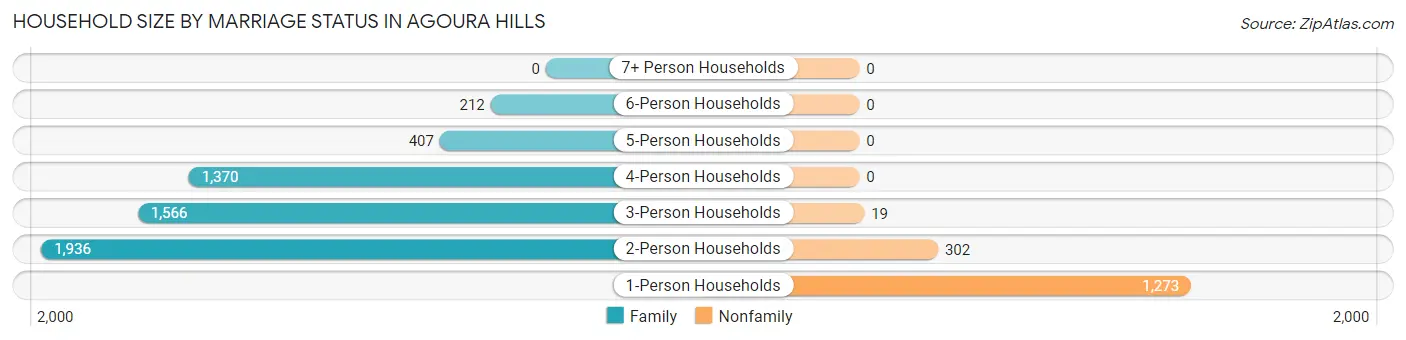
| Household Size | Family Households | Nonfamily Households |
| 1-Person Households | - | 1,273 (18.0%) |
| 2-Person Households | 1,936 (27.3%) | 302 (4.3%) |
| 3-Person Households | 1,566 (22.1%) | 19 (0.3%) |
| 4-Person Households | 1,370 (19.3%) | 0 (0.0%) |
| 5-Person Households | 407 (5.7%) | 0 (0.0%) |
| 6-Person Households | 212 (3.0%) | 0 (0.0%) |
| 7+ Person Households | 0 (0.0%) | 0 (0.0%) |
| Total | 5,491 (77.5%) | 1,594 (22.5%) |
Female Fertility in Agoura Hills
Fertility by Age in Agoura Hills
Average fertility rate in Agoura Hills is 23.0 births per 1,000 women. Women in the age bracket of 35 to 50 years have the highest fertility rate with 38.0 births per 1,000 women. Women in the age bracket of 35 to 50 years acount for 85.4% of all women with births.
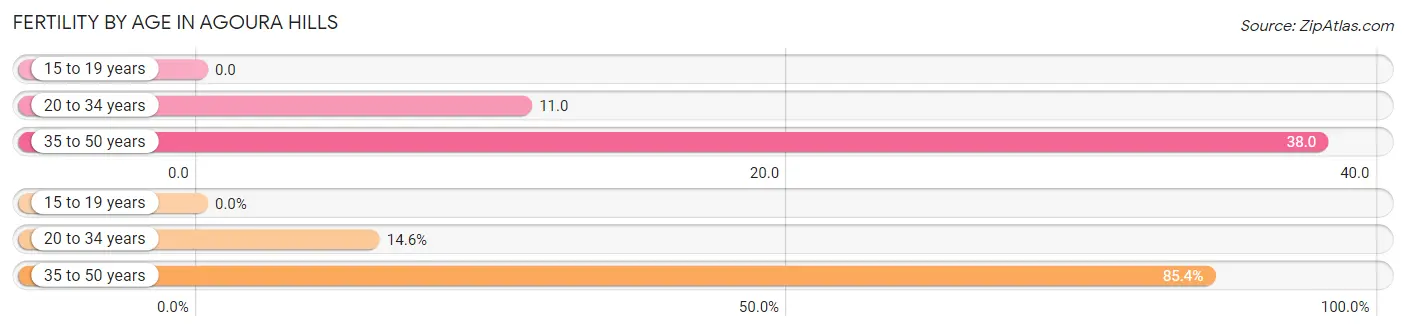
| Age Bracket | Women with Births | Births / 1,000 Women |
| 15 to 19 years | 0 (0.0%) | 0.0 |
| 20 to 34 years | 14 (14.6%) | 11.0 |
| 35 to 50 years | 82 (85.4%) | 38.0 |
| Total | 96 (100.0%) | 23.0 |
Fertility by Age by Marriage Status in Agoura Hills
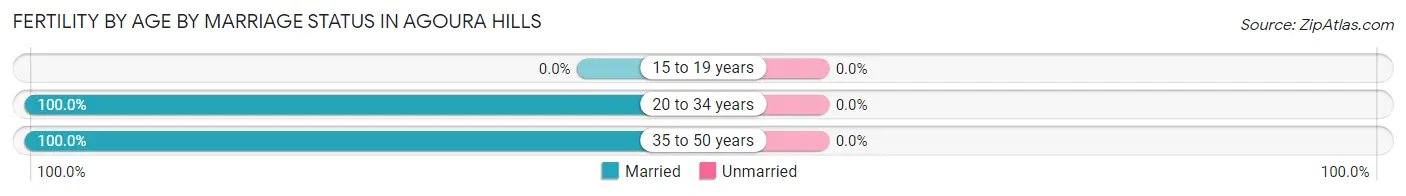
| Age Bracket | Married | Unmarried |
| 15 to 19 years | 0 (0.0%) | 0 (0.0%) |
| 20 to 34 years | 14 (100.0%) | 0 (0.0%) |
| 35 to 50 years | 82 (100.0%) | 0 (0.0%) |
| Total | 96 (100.0%) | 0 (0.0%) |
Fertility by Education in Agoura Hills
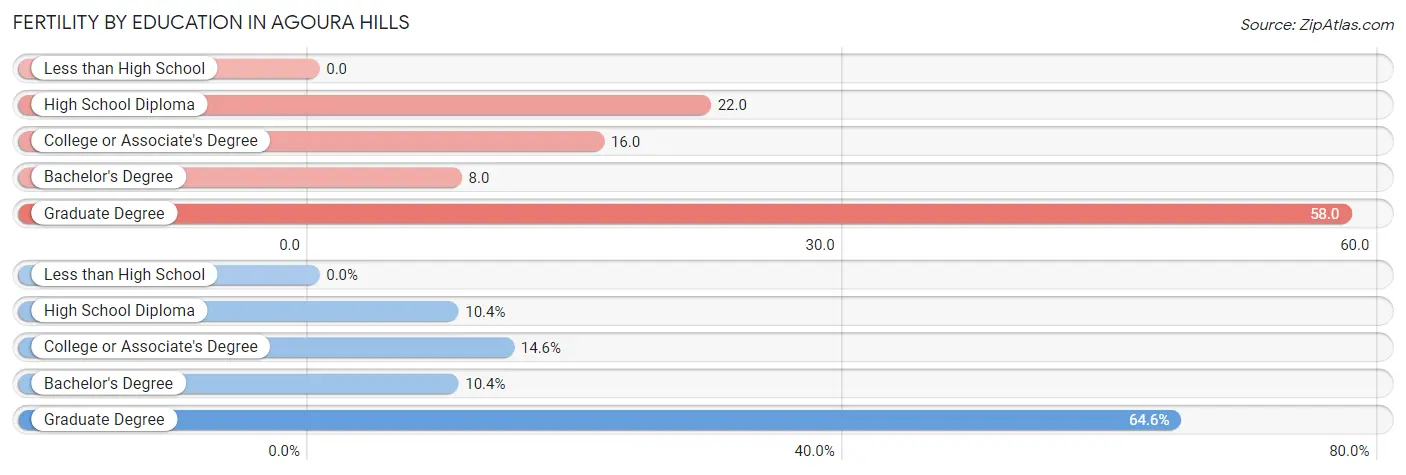
| Educational Attainment | Women with Births | Births / 1,000 Women |
| Less than High School | 0 (0.0%) | 0.0 |
| High School Diploma | 10 (10.4%) | 22.0 |
| College or Associate's Degree | 14 (14.6%) | 16.0 |
| Bachelor's Degree | 10 (10.4%) | 8.0 |
| Graduate Degree | 62 (64.6%) | 58.0 |
| Total | 96 (100.0%) | 23.0 |
Fertility by Education by Marriage Status in Agoura Hills
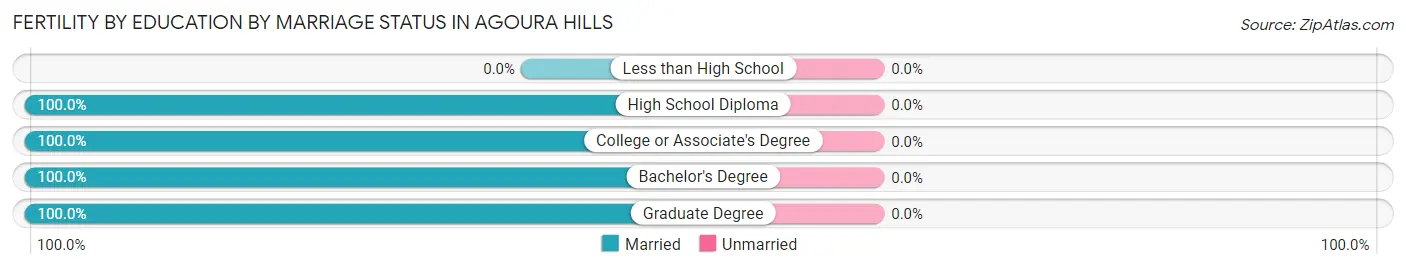
| Educational Attainment | Married | Unmarried |
| Less than High School | 0 (0.0%) | 0 (0.0%) |
| High School Diploma | 10 (100.0%) | 0 (0.0%) |
| College or Associate's Degree | 14 (100.0%) | 0 (0.0%) |
| Bachelor's Degree | 10 (100.0%) | 0 (0.0%) |
| Graduate Degree | 62 (100.0%) | 0 (0.0%) |
| Total | 96 (100.0%) | 0 (0.0%) |
Employment Characteristics in Agoura Hills
Employment by Class of Employer in Agoura Hills
Among the 9,353 employed individuals in Agoura Hills, private company employees (5,771 | 61.7%), self-employed (incorporated) (1,100 | 11.8%), and self-employed (not incorporated) (918 | 9.8%) make up the most common classes of employment.
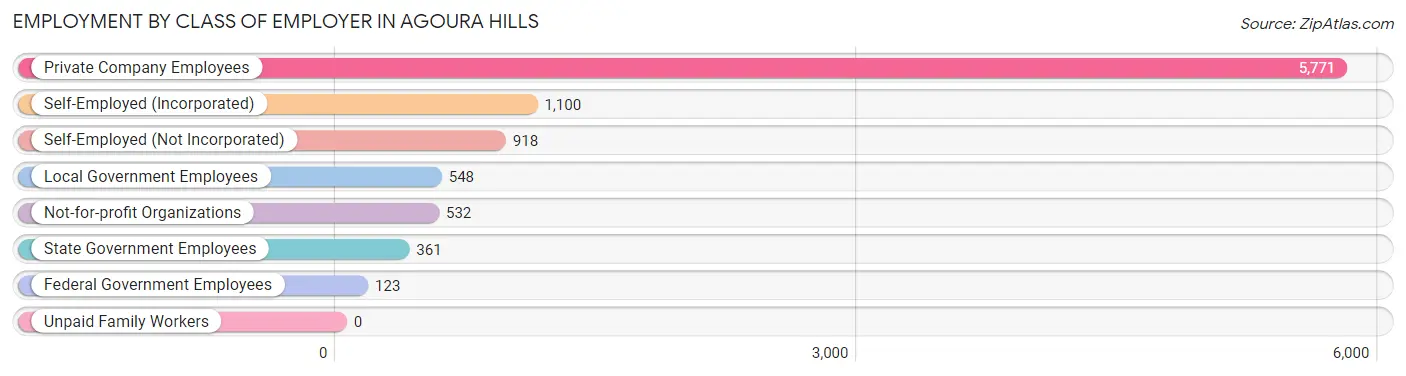
| Employer Class | # Employees | % Employees |
| Private Company Employees | 5,771 | 61.7% |
| Self-Employed (Incorporated) | 1,100 | 11.8% |
| Self-Employed (Not Incorporated) | 918 | 9.8% |
| Not-for-profit Organizations | 532 | 5.7% |
| Local Government Employees | 548 | 5.9% |
| State Government Employees | 361 | 3.9% |
| Federal Government Employees | 123 | 1.3% |
| Unpaid Family Workers | 0 | 0.0% |
| Total | 9,353 | 100.0% |
Employment Status by Age in Agoura Hills
According to the labor force statistics for Agoura Hills, out of the total population over 16 years of age (16,318), 63.4% or 10,346 individuals are in the labor force, with 5.4% or 559 of them unemployed. The age group with the highest labor force participation rate is 45 to 54 years, with 86.7% or 2,319 individuals in the labor force. Within the labor force, the 20 to 24 years age range has the highest percentage of unemployed individuals, with 19.1% or 102 of them being unemployed.
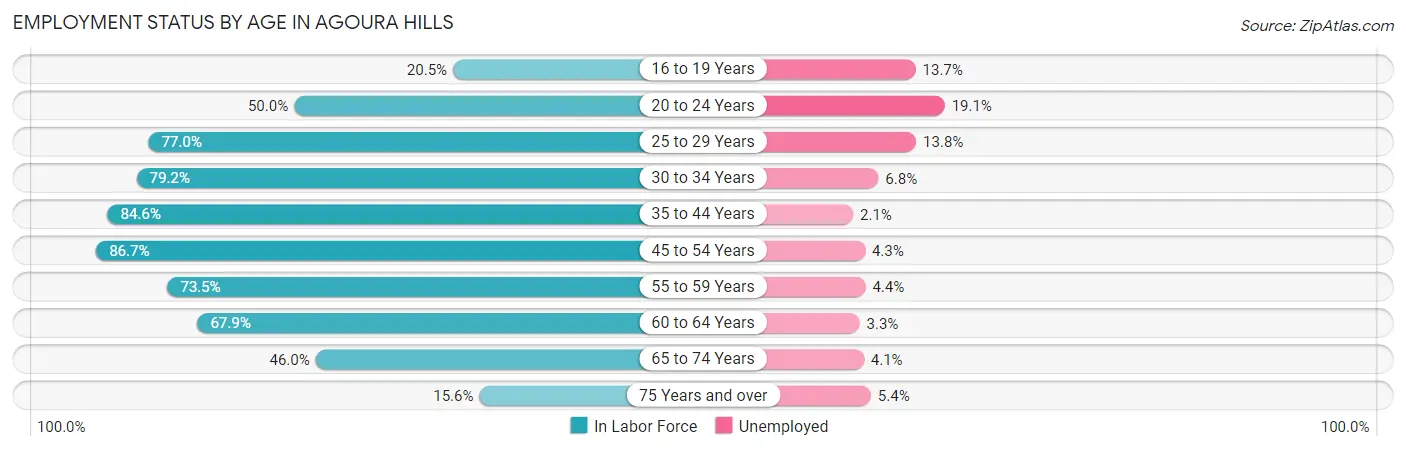
| Age Bracket | In Labor Force | Unemployed |
| 16 to 19 Years | 278 (20.5%) | 38 (13.7%) |
| 20 to 24 Years | 534 (50.0%) | 102 (19.1%) |
| 25 to 29 Years | 520 (77.0%) | 72 (13.8%) |
| 30 to 34 Years | 749 (79.2%) | 51 (6.8%) |
| 35 to 44 Years | 2,145 (84.6%) | 45 (2.1%) |
| 45 to 54 Years | 2,319 (86.7%) | 100 (4.3%) |
| 55 to 59 Years | 1,408 (73.5%) | 62 (4.4%) |
| 60 to 64 Years | 1,226 (67.9%) | 40 (3.3%) |
| 65 to 74 Years | 990 (46.0%) | 41 (4.1%) |
| 75 Years and over | 186 (15.6%) | 10 (5.4%) |
| Total | 10,346 (63.4%) | 559 (5.4%) |
Employment Status by Educational Attainment in Agoura Hills
According to labor force statistics for Agoura Hills, 79.3% of individuals (8,368) out of the total population between 25 and 64 years of age (10,552) are in the labor force, with 4.4% or 368 of them being unemployed. The group with the highest labor force participation rate are those with the educational attainment of less than high school, with 84.9% or 152 individuals in the labor force. Within the labor force, individuals with college / associate degree education have the highest percentage of unemployment, with 7.5% or 100 of them being unemployed.
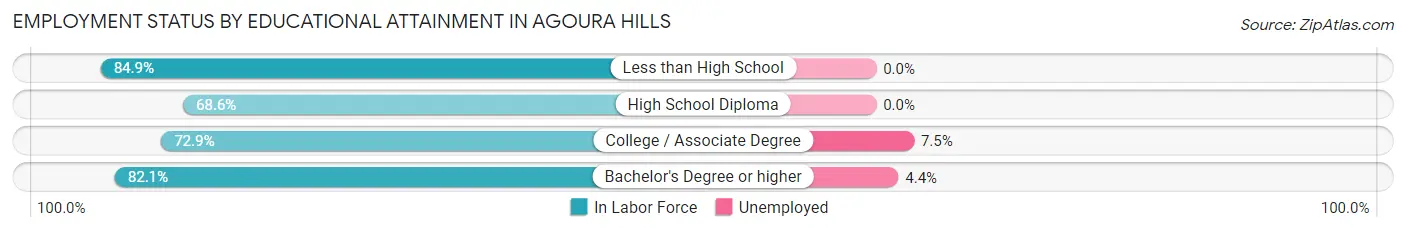
| Educational Attainment | In Labor Force | Unemployed |
| Less than High School | 152 (84.9%) | 0 (0.0%) |
| High School Diploma | 677 (68.6%) | 0 (0.0%) |
| College / Associate Degree | 1,330 (72.9%) | 137 (7.5%) |
| Bachelor's Degree or higher | 6,208 (82.1%) | 333 (4.4%) |
| Total | 8,368 (79.3%) | 464 (4.4%) |
Employment Occupations by Sex in Agoura Hills
Management, Business, Science and Arts Occupations
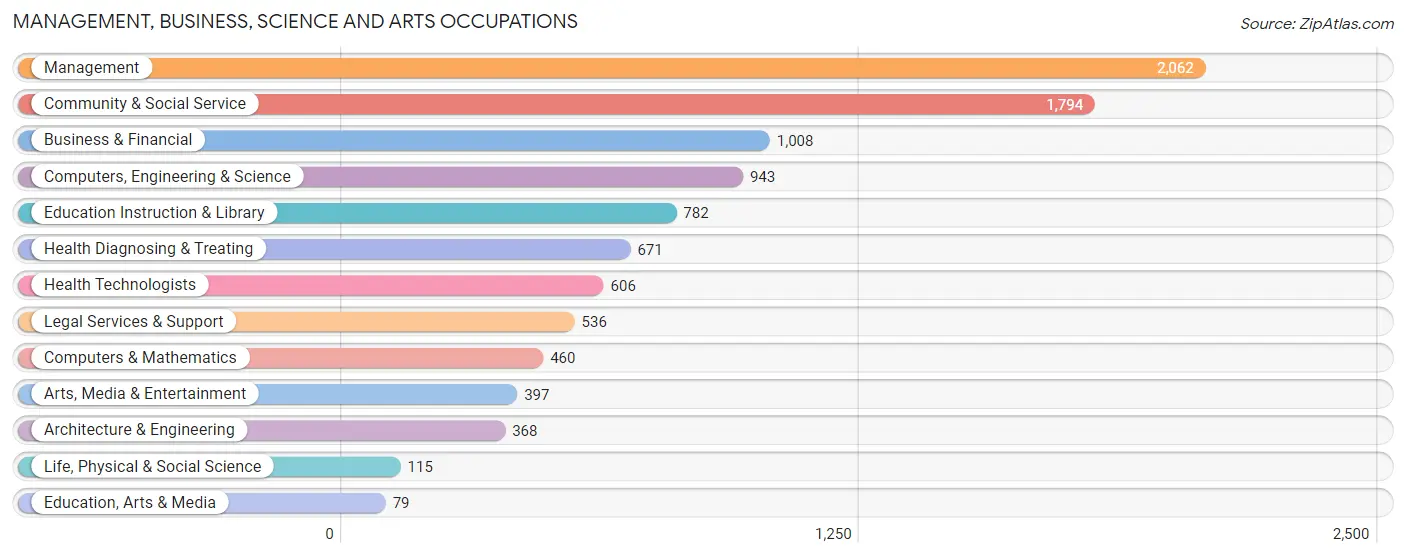
The most common Management, Business, Science and Arts occupations in Agoura Hills are Management (2,062 | 21.1%), Community & Social Service (1,794 | 18.3%), Business & Financial (1,008 | 10.3%), Computers, Engineering & Science (943 | 9.6%), and Education Instruction & Library (782 | 8.0%).
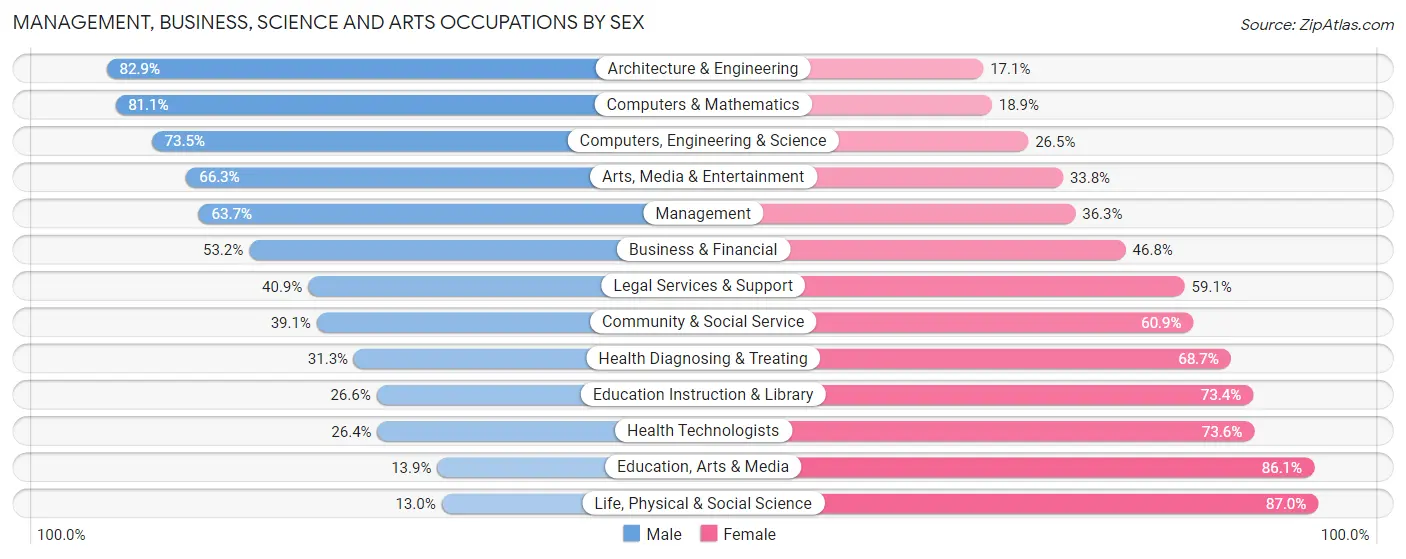
Management, Business, Science and Arts Occupations by Sex
Within the Management, Business, Science and Arts occupations in Agoura Hills, the most male-oriented occupations are Architecture & Engineering (82.9%), Computers & Mathematics (81.1%), and Computers, Engineering & Science (73.5%), while the most female-oriented occupations are Life, Physical & Social Science (87.0%), Education, Arts & Media (86.1%), and Health Technologists (73.6%).
| Occupation | Male | Female |
| Management | 1,313 (63.7%) | 749 (36.3%) |
| Business & Financial | 536 (53.2%) | 472 (46.8%) |
| Computers, Engineering & Science | 693 (73.5%) | 250 (26.5%) |
| Computers & Mathematics | 373 (81.1%) | 87 (18.9%) |
| Architecture & Engineering | 305 (82.9%) | 63 (17.1%) |
| Life, Physical & Social Science | 15 (13.0%) | 100 (87.0%) |
| Community & Social Service | 701 (39.1%) | 1,093 (60.9%) |
| Education, Arts & Media | 11 (13.9%) | 68 (86.1%) |
| Legal Services & Support | 219 (40.9%) | 317 (59.1%) |
| Education Instruction & Library | 208 (26.6%) | 574 (73.4%) |
| Arts, Media & Entertainment | 263 (66.2%) | 134 (33.8%) |
| Health Diagnosing & Treating | 210 (31.3%) | 461 (68.7%) |
| Health Technologists | 160 (26.4%) | 446 (73.6%) |
| Total (Category) | 3,453 (53.3%) | 3,025 (46.7%) |
| Total (Overall) | 5,124 (52.3%) | 4,666 (47.7%) |
Services Occupations
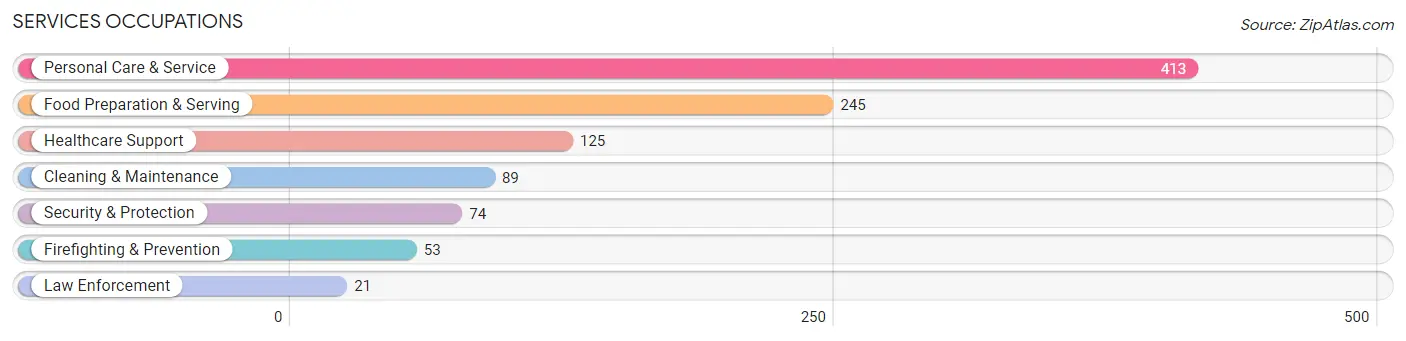
The most common Services occupations in Agoura Hills are Personal Care & Service (413 | 4.2%), Food Preparation & Serving (245 | 2.5%), Healthcare Support (125 | 1.3%), Cleaning & Maintenance (89 | 0.9%), and Security & Protection (74 | 0.8%).
Services Occupations by Sex
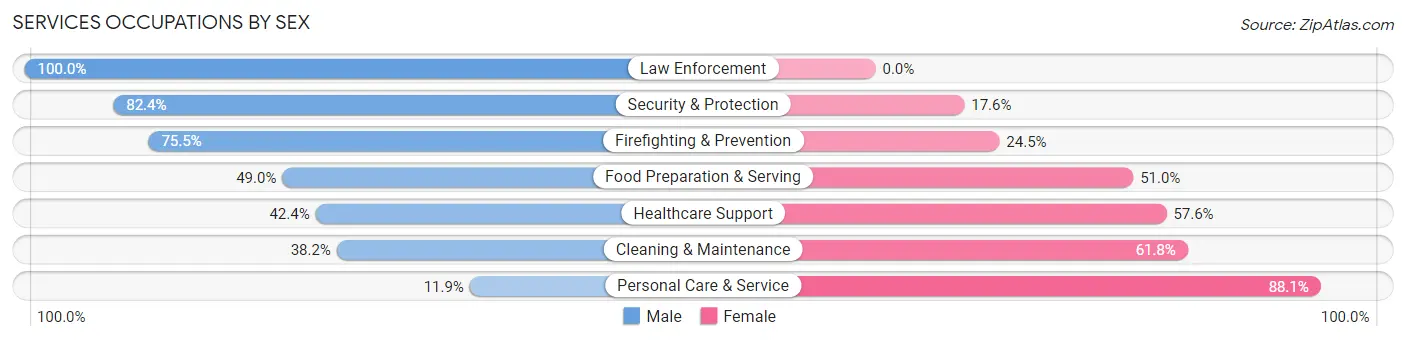
Within the Services occupations in Agoura Hills, the most male-oriented occupations are Law Enforcement (100.0%), Security & Protection (82.4%), and Firefighting & Prevention (75.5%), while the most female-oriented occupations are Personal Care & Service (88.1%), Cleaning & Maintenance (61.8%), and Healthcare Support (57.6%).
| Occupation | Male | Female |
| Healthcare Support | 53 (42.4%) | 72 (57.6%) |
| Security & Protection | 61 (82.4%) | 13 (17.6%) |
| Firefighting & Prevention | 40 (75.5%) | 13 (24.5%) |
| Law Enforcement | 21 (100.0%) | 0 (0.0%) |
| Food Preparation & Serving | 120 (49.0%) | 125 (51.0%) |
| Cleaning & Maintenance | 34 (38.2%) | 55 (61.8%) |
| Personal Care & Service | 49 (11.9%) | 364 (88.1%) |
| Total (Category) | 317 (33.5%) | 629 (66.5%) |
| Total (Overall) | 5,124 (52.3%) | 4,666 (47.7%) |
Sales and Office Occupations
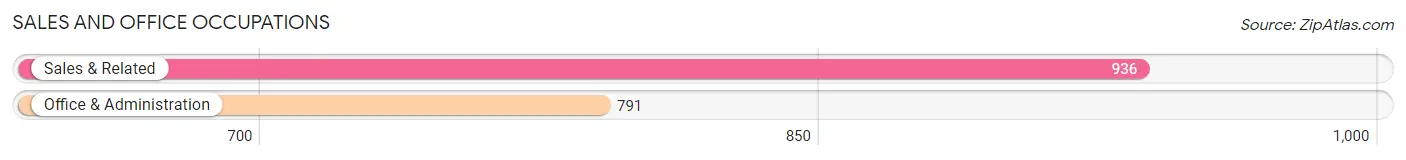
The most common Sales and Office occupations in Agoura Hills are Sales & Related (936 | 9.6%), and Office & Administration (791 | 8.1%).
Sales and Office Occupations by Sex
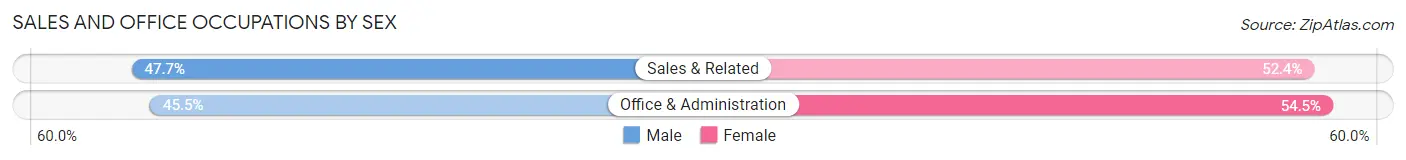
| Occupation | Male | Female |
| Sales & Related | 446 (47.6%) | 490 (52.3%) |
| Office & Administration | 360 (45.5%) | 431 (54.5%) |
| Total (Category) | 806 (46.7%) | 921 (53.3%) |
| Total (Overall) | 5,124 (52.3%) | 4,666 (47.7%) |
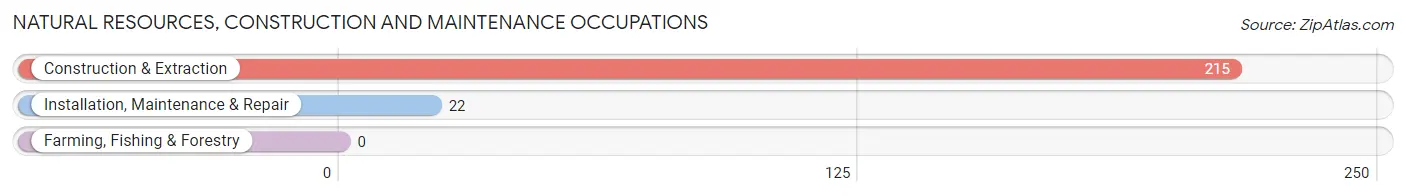
Natural Resources, Construction and Maintenance Occupations
The most common Natural Resources, Construction and Maintenance occupations in Agoura Hills are Construction & Extraction (215 | 2.2%), and Installation, Maintenance & Repair (22 | 0.2%).
Natural Resources, Construction and Maintenance Occupations by Sex
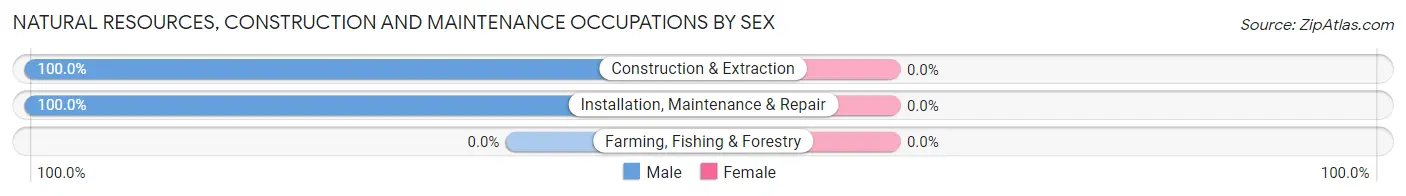
| Occupation | Male | Female |
| Farming, Fishing & Forestry | 0 (0.0%) | 0 (0.0%) |
| Construction & Extraction | 215 (100.0%) | 0 (0.0%) |
| Installation, Maintenance & Repair | 22 (100.0%) | 0 (0.0%) |
| Total (Category) | 237 (100.0%) | 0 (0.0%) |
| Total (Overall) | 5,124 (52.3%) | 4,666 (47.7%) |
Production, Transportation and Moving Occupations
The most common Production, Transportation and Moving occupations in Agoura Hills are Transportation (208 | 2.1%), Production (144 | 1.5%), and Material Moving (50 | 0.5%).
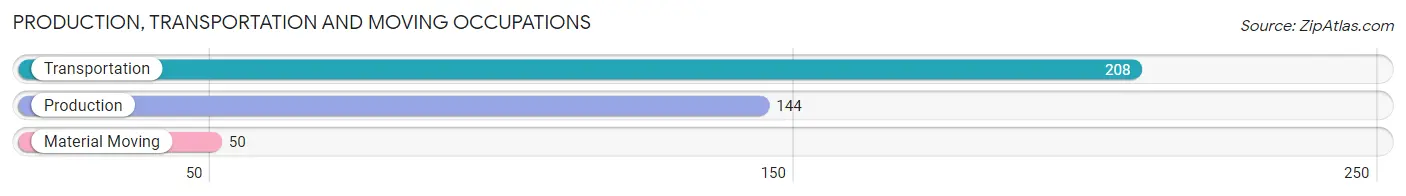
Production, Transportation and Moving Occupations by Sex
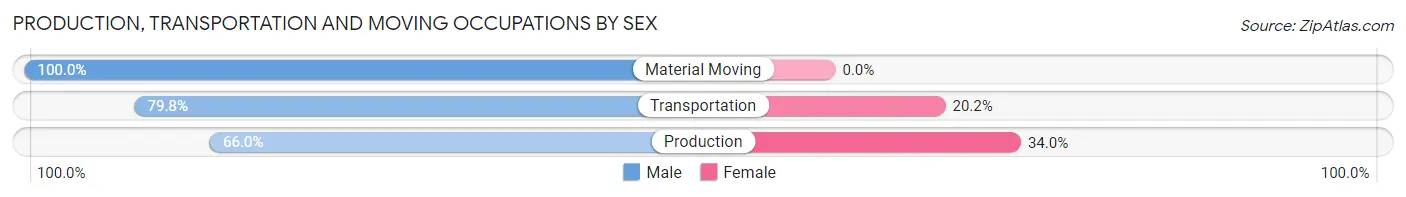
| Occupation | Male | Female |
| Production | 95 (66.0%) | 49 (34.0%) |
| Transportation | 166 (79.8%) | 42 (20.2%) |
| Material Moving | 50 (100.0%) | 0 (0.0%) |
| Total (Category) | 311 (77.4%) | 91 (22.6%) |
| Total (Overall) | 5,124 (52.3%) | 4,666 (47.7%) |
Employment Industries by Sex in Agoura Hills
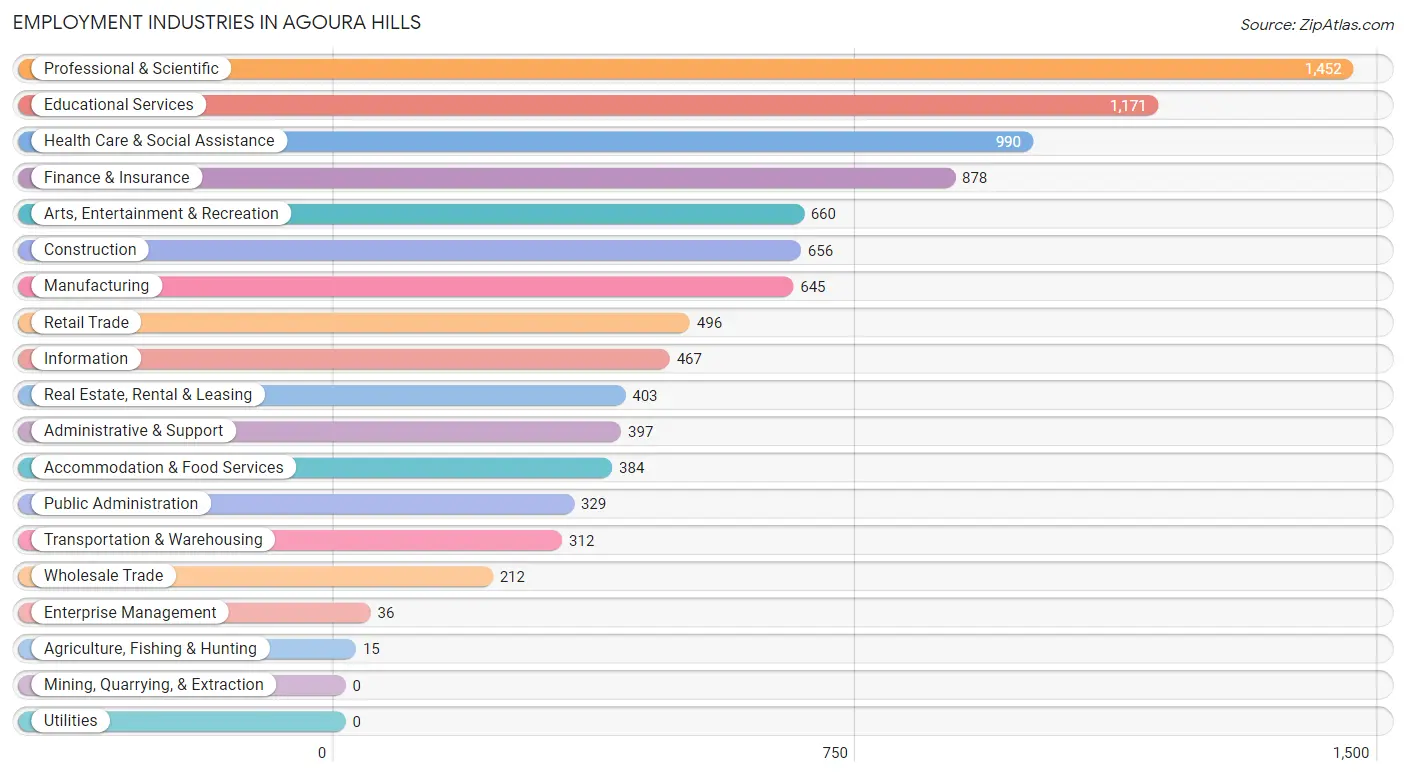
Employment Industries in Agoura Hills
The major employment industries in Agoura Hills include Professional & Scientific (1,452 | 14.8%), Educational Services (1,171 | 12.0%), Health Care & Social Assistance (990 | 10.1%), Finance & Insurance (878 | 9.0%), and Arts, Entertainment & Recreation (660 | 6.7%).
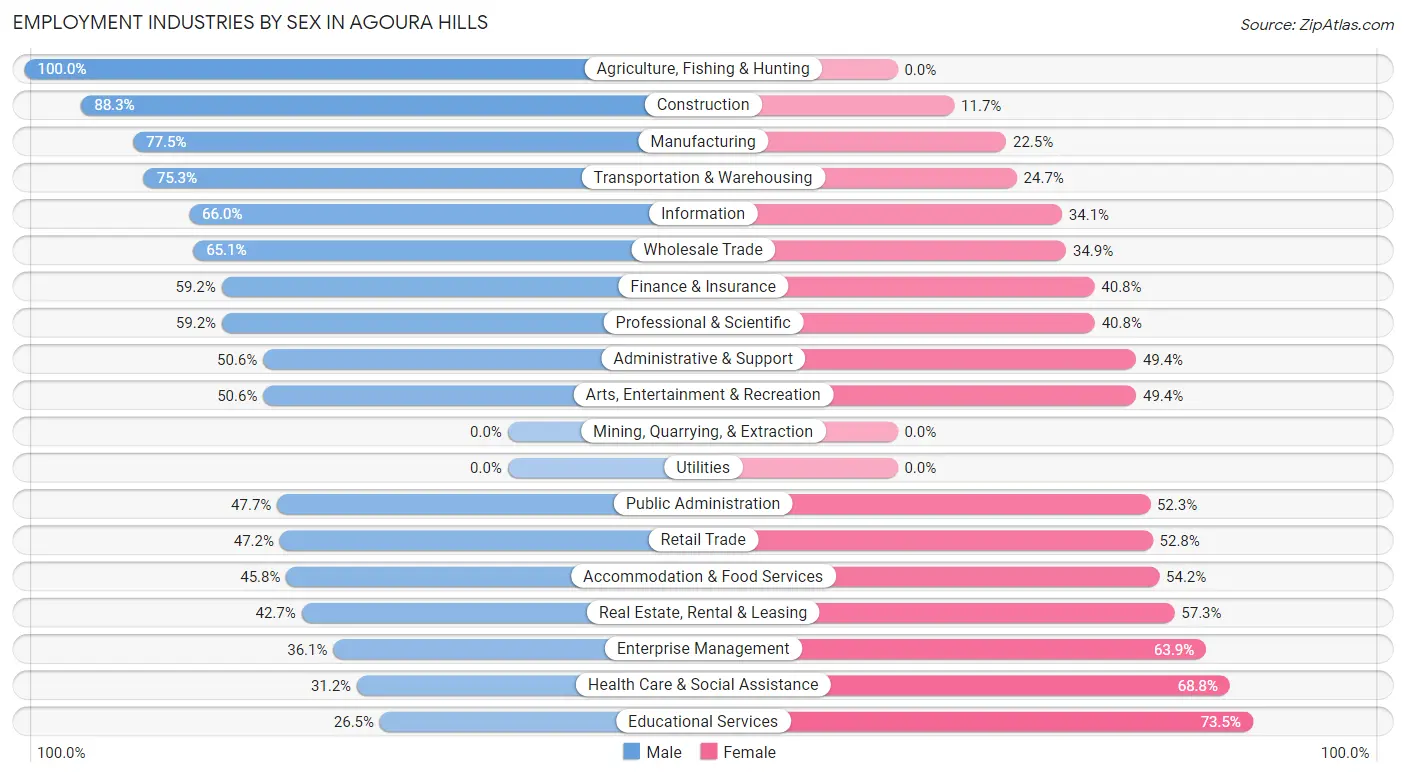
Employment Industries by Sex in Agoura Hills
The Agoura Hills industries that see more men than women are Agriculture, Fishing & Hunting (100.0%), Construction (88.3%), and Manufacturing (77.5%), whereas the industries that tend to have a higher number of women are Educational Services (73.5%), Health Care & Social Assistance (68.8%), and Enterprise Management (63.9%).
| Industry | Male | Female |
| Agriculture, Fishing & Hunting | 15 (100.0%) | 0 (0.0%) |
| Mining, Quarrying, & Extraction | 0 (0.0%) | 0 (0.0%) |
| Construction | 579 (88.3%) | 77 (11.7%) |
| Manufacturing | 500 (77.5%) | 145 (22.5%) |
| Wholesale Trade | 138 (65.1%) | 74 (34.9%) |
| Retail Trade | 234 (47.2%) | 262 (52.8%) |
| Transportation & Warehousing | 235 (75.3%) | 77 (24.7%) |
| Utilities | 0 (0.0%) | 0 (0.0%) |
| Information | 308 (65.9%) | 159 (34.1%) |
| Finance & Insurance | 520 (59.2%) | 358 (40.8%) |
| Real Estate, Rental & Leasing | 172 (42.7%) | 231 (57.3%) |
| Professional & Scientific | 859 (59.2%) | 593 (40.8%) |
| Enterprise Management | 13 (36.1%) | 23 (63.9%) |
| Administrative & Support | 201 (50.6%) | 196 (49.4%) |
| Educational Services | 310 (26.5%) | 861 (73.5%) |
| Health Care & Social Assistance | 309 (31.2%) | 681 (68.8%) |
| Arts, Entertainment & Recreation | 334 (50.6%) | 326 (49.4%) |
| Accommodation & Food Services | 176 (45.8%) | 208 (54.2%) |
| Public Administration | 157 (47.7%) | 172 (52.3%) |
| Total | 5,124 (52.3%) | 4,666 (47.7%) |
Education in Agoura Hills
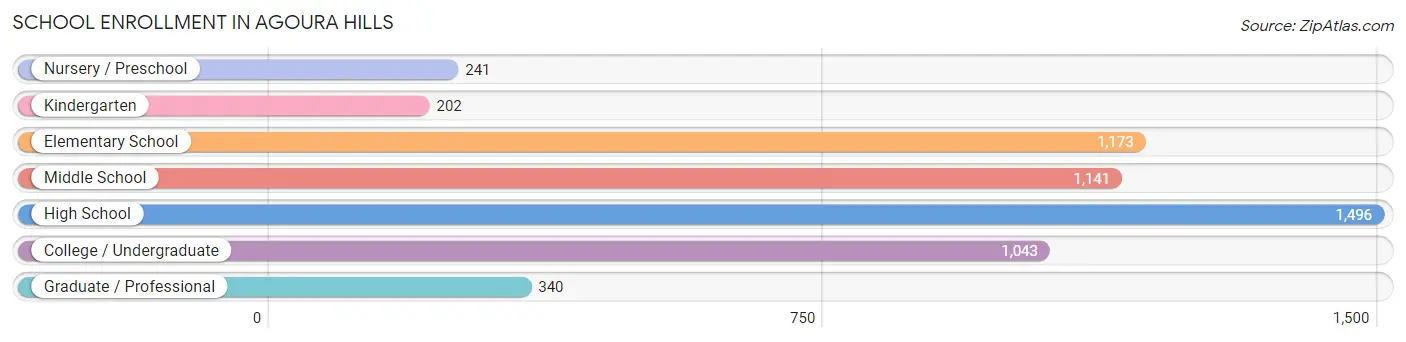
School Enrollment in Agoura Hills
The most common levels of schooling among the 5,636 students in Agoura Hills are high school (1,496 | 26.5%), elementary school (1,173 | 20.8%), and middle school (1,141 | 20.2%).
| School Level | # Students | % Students |
| Nursery / Preschool | 241 | 4.3% |
| Kindergarten | 202 | 3.6% |
| Elementary School | 1,173 | 20.8% |
| Middle School | 1,141 | 20.2% |
| High School | 1,496 | 26.5% |
| College / Undergraduate | 1,043 | 18.5% |
| Graduate / Professional | 340 | 6.0% |
| Total | 5,636 | 100.0% |
School Enrollment by Age by Funding Source in Agoura Hills
Out of a total of 5,636 students who are enrolled in schools in Agoura Hills, 1,127 (20.0%) attend a private institution, while the remaining 4,509 (80.0%) are enrolled in public schools. The age group of 3 to 4 year olds has the highest likelihood of being enrolled in private schools, with 147 (61.0% in the age bracket) enrolled. Conversely, the age group of 10 to 14 year olds has the lowest likelihood of being enrolled in a private school, with 1,586 (98.0% in the age bracket) attending a public institution.
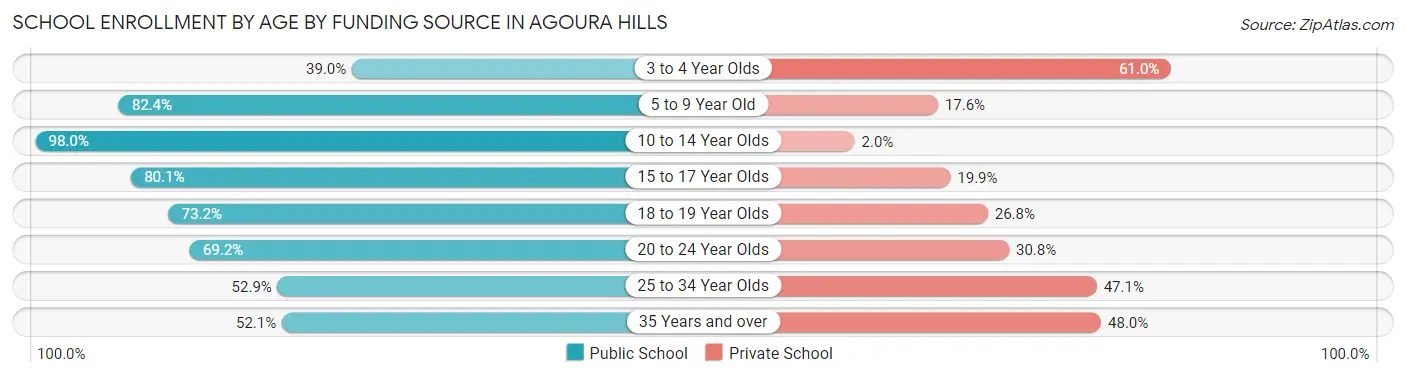
| Age Bracket | Public School | Private School |
| 3 to 4 Year Olds | 94 (39.0%) | 147 (61.0%) |
| 5 to 9 Year Old | 972 (82.4%) | 207 (17.6%) |
| 10 to 14 Year Olds | 1,586 (98.0%) | 33 (2.0%) |
| 15 to 17 Year Olds | 847 (80.1%) | 210 (19.9%) |
| 18 to 19 Year Olds | 368 (73.2%) | 135 (26.8%) |
| 20 to 24 Year Olds | 409 (69.2%) | 182 (30.8%) |
| 25 to 34 Year Olds | 120 (52.9%) | 107 (47.1%) |
| 35 Years and over | 114 (52.0%) | 105 (47.9%) |
| Total | 4,509 (80.0%) | 1,127 (20.0%) |
Educational Attainment by Field of Study in Agoura Hills
Business (1,391 | 13.8%), social sciences (1,176 | 11.7%), engineering (924 | 9.2%), psychology (823 | 8.2%), and bio, nature & agricultural (791 | 7.9%) are the most common fields of study among 10,081 individuals in Agoura Hills who have obtained a bachelor's degree or higher.
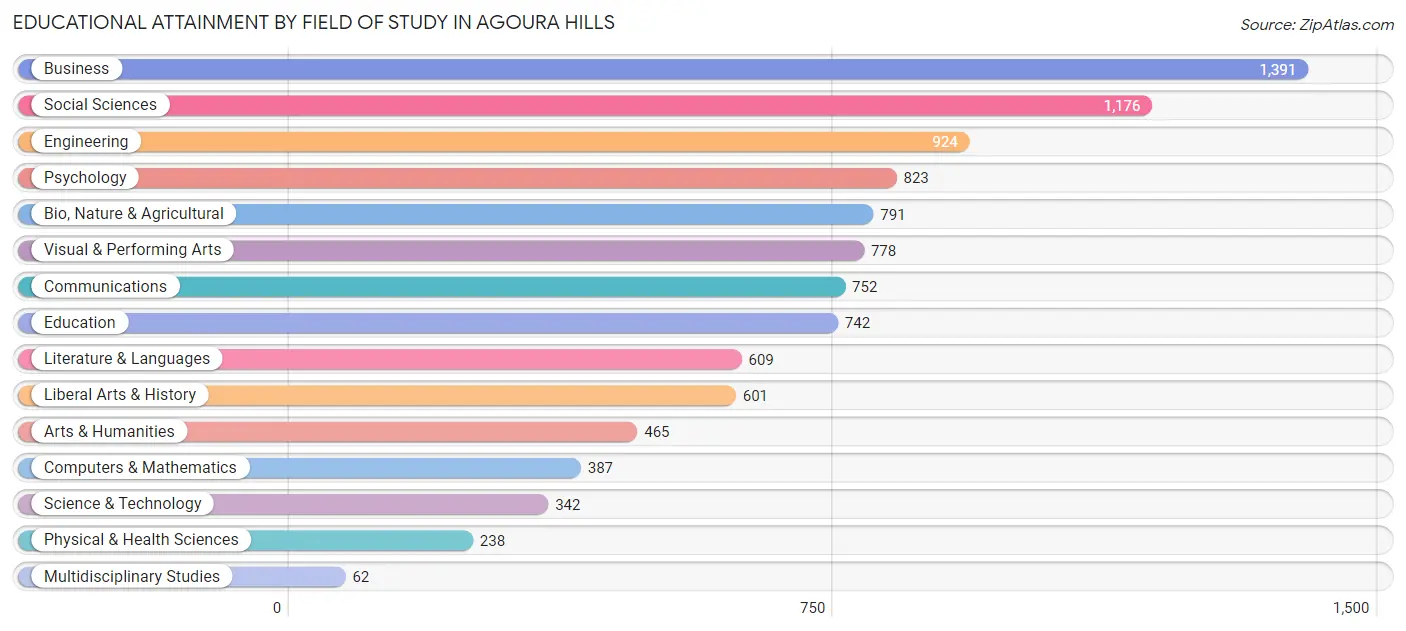
| Field of Study | # Graduates | % Graduates |
| Computers & Mathematics | 387 | 3.8% |
| Bio, Nature & Agricultural | 791 | 7.9% |
| Physical & Health Sciences | 238 | 2.4% |
| Psychology | 823 | 8.2% |
| Social Sciences | 1,176 | 11.7% |
| Engineering | 924 | 9.2% |
| Multidisciplinary Studies | 62 | 0.6% |
| Science & Technology | 342 | 3.4% |
| Business | 1,391 | 13.8% |
| Education | 742 | 7.4% |
| Literature & Languages | 609 | 6.0% |
| Liberal Arts & History | 601 | 6.0% |
| Visual & Performing Arts | 778 | 7.7% |
| Communications | 752 | 7.5% |
| Arts & Humanities | 465 | 4.6% |
| Total | 10,081 | 100.0% |
Transportation & Commute in Agoura Hills
Vehicle Availability by Sex in Agoura Hills
The most prevalent vehicle ownership categories in Agoura Hills are males with 2 vehicles (2,396, accounting for 48.4%) and females with 2 vehicles (2,188, making up 54.5%).
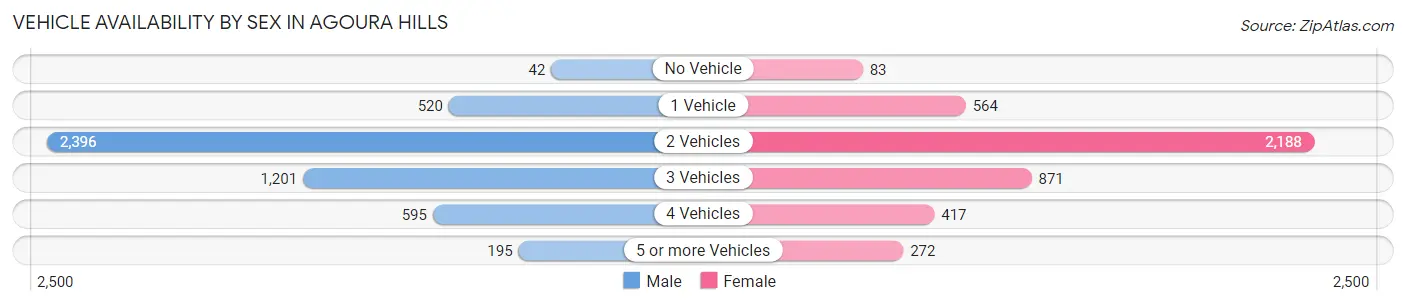
| Vehicles Available | Male | Female |
| No Vehicle | 42 (0.9%) | 83 (1.9%) |
| 1 Vehicle | 520 (10.5%) | 564 (12.8%) |
| 2 Vehicles | 2,396 (48.4%) | 2,188 (49.8%) |
| 3 Vehicles | 1,201 (24.3%) | 871 (19.8%) |
| 4 Vehicles | 595 (12.0%) | 417 (9.5%) |
| 5 or more Vehicles | 195 (3.9%) | 272 (6.2%) |
| Total | 4,949 (100.0%) | 4,395 (100.0%) |
Commute Time in Agoura Hills
The most frequently occuring commute durations in Agoura Hills are 20 to 24 minutes (1,249 commuters, 18.2%), 10 to 14 minutes (1,209 commuters, 17.6%), and 15 to 19 minutes (870 commuters, 12.7%).
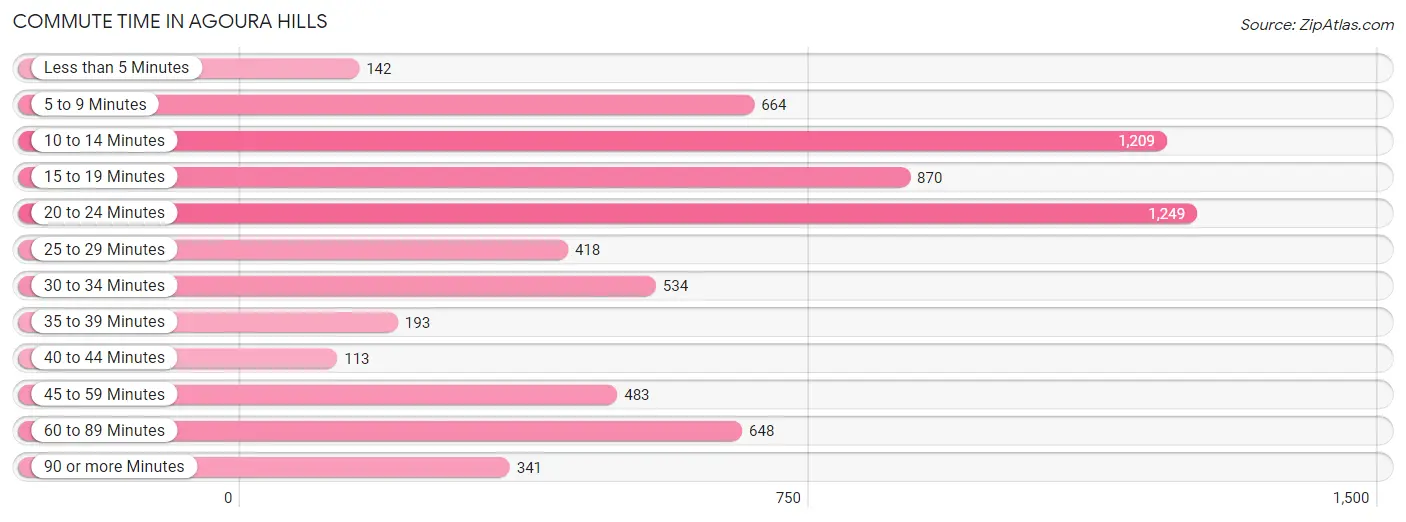
| Commute Time | # Commuters | % Commuters |
| Less than 5 Minutes | 142 | 2.1% |
| 5 to 9 Minutes | 664 | 9.7% |
| 10 to 14 Minutes | 1,209 | 17.6% |
| 15 to 19 Minutes | 870 | 12.7% |
| 20 to 24 Minutes | 1,249 | 18.2% |
| 25 to 29 Minutes | 418 | 6.1% |
| 30 to 34 Minutes | 534 | 7.8% |
| 35 to 39 Minutes | 193 | 2.8% |
| 40 to 44 Minutes | 113 | 1.7% |
| 45 to 59 Minutes | 483 | 7.0% |
| 60 to 89 Minutes | 648 | 9.4% |
| 90 or more Minutes | 341 | 5.0% |
Commute Time by Sex in Agoura Hills
The most common commute times in Agoura Hills are 10 to 14 minutes (642 commuters, 16.9%) for males and 20 to 24 minutes (689 commuters, 22.4%) for females.
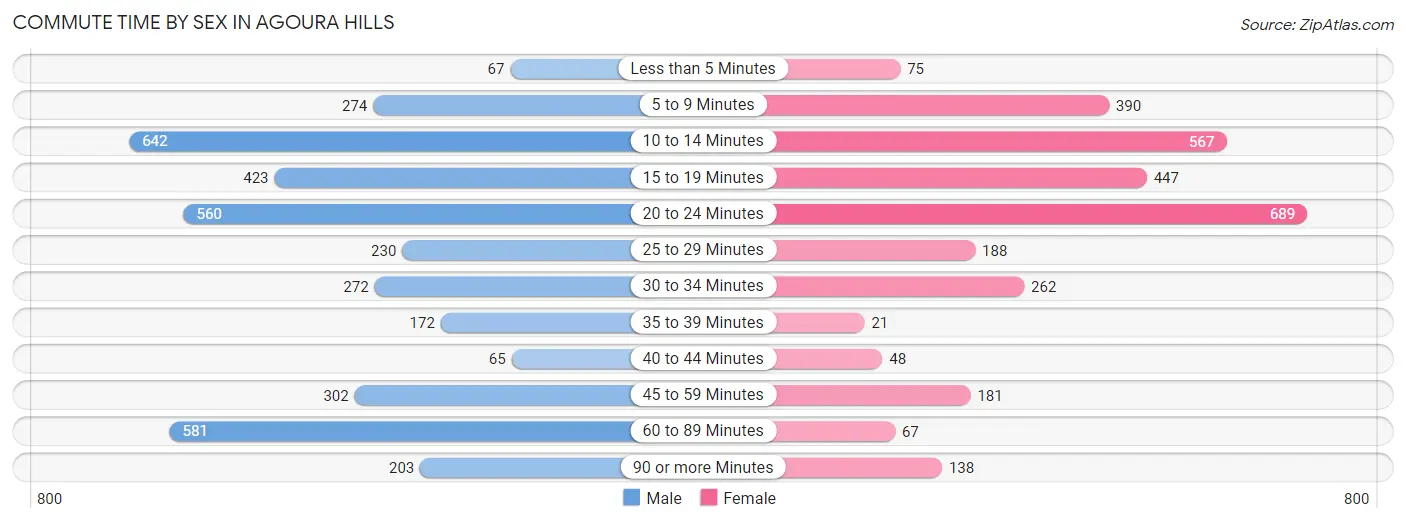
| Commute Time | Male | Female |
| Less than 5 Minutes | 67 (1.8%) | 75 (2.4%) |
| 5 to 9 Minutes | 274 (7.2%) | 390 (12.7%) |
| 10 to 14 Minutes | 642 (16.9%) | 567 (18.4%) |
| 15 to 19 Minutes | 423 (11.2%) | 447 (14.5%) |
| 20 to 24 Minutes | 560 (14.8%) | 689 (22.4%) |
| 25 to 29 Minutes | 230 (6.1%) | 188 (6.1%) |
| 30 to 34 Minutes | 272 (7.2%) | 262 (8.5%) |
| 35 to 39 Minutes | 172 (4.5%) | 21 (0.7%) |
| 40 to 44 Minutes | 65 (1.7%) | 48 (1.6%) |
| 45 to 59 Minutes | 302 (8.0%) | 181 (5.9%) |
| 60 to 89 Minutes | 581 (15.3%) | 67 (2.2%) |
| 90 or more Minutes | 203 (5.3%) | 138 (4.5%) |
Time of Departure to Work by Sex in Agoura Hills
The most frequent times of departure to work in Agoura Hills are 7:00 AM to 7:29 AM (651, 17.2%) for males and 8:00 AM to 8:29 AM (676, 22.0%) for females.
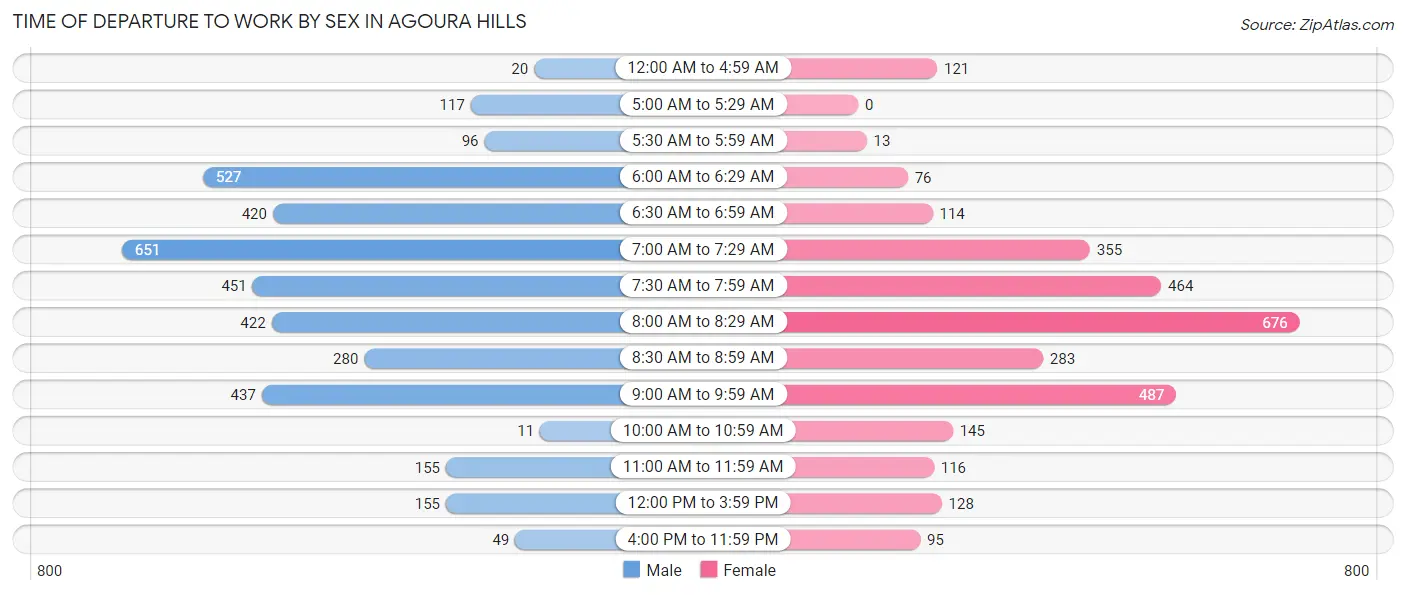
| Time of Departure | Male | Female |
| 12:00 AM to 4:59 AM | 20 (0.5%) | 121 (3.9%) |
| 5:00 AM to 5:29 AM | 117 (3.1%) | 0 (0.0%) |
| 5:30 AM to 5:59 AM | 96 (2.5%) | 13 (0.4%) |
| 6:00 AM to 6:29 AM | 527 (13.9%) | 76 (2.5%) |
| 6:30 AM to 6:59 AM | 420 (11.1%) | 114 (3.7%) |
| 7:00 AM to 7:29 AM | 651 (17.2%) | 355 (11.6%) |
| 7:30 AM to 7:59 AM | 451 (11.9%) | 464 (15.1%) |
| 8:00 AM to 8:29 AM | 422 (11.1%) | 676 (22.0%) |
| 8:30 AM to 8:59 AM | 280 (7.4%) | 283 (9.2%) |
| 9:00 AM to 9:59 AM | 437 (11.5%) | 487 (15.9%) |
| 10:00 AM to 10:59 AM | 11 (0.3%) | 145 (4.7%) |
| 11:00 AM to 11:59 AM | 155 (4.1%) | 116 (3.8%) |
| 12:00 PM to 3:59 PM | 155 (4.1%) | 128 (4.2%) |
| 4:00 PM to 11:59 PM | 49 (1.3%) | 95 (3.1%) |
| Total | 3,791 (100.0%) | 3,073 (100.0%) |
Housing Occupancy in Agoura Hills
Occupancy by Ownership in Agoura Hills
Of the total 7,085 dwellings in Agoura Hills, owner-occupied units account for 5,589 (78.9%), while renter-occupied units make up 1,496 (21.1%).
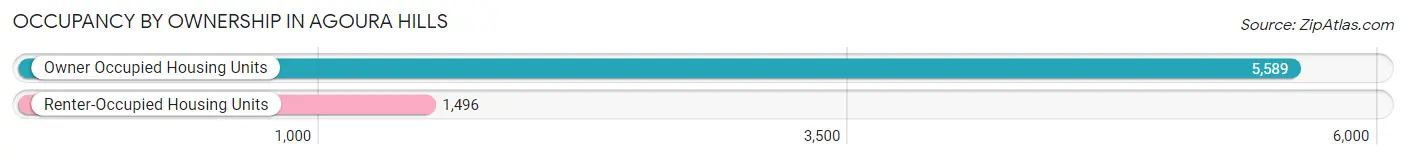
| Occupancy | # Housing Units | % Housing Units |
| Owner Occupied Housing Units | 5,589 | 78.9% |
| Renter-Occupied Housing Units | 1,496 | 21.1% |
| Total Occupied Housing Units | 7,085 | 100.0% |
Occupancy by Household Size in Agoura Hills
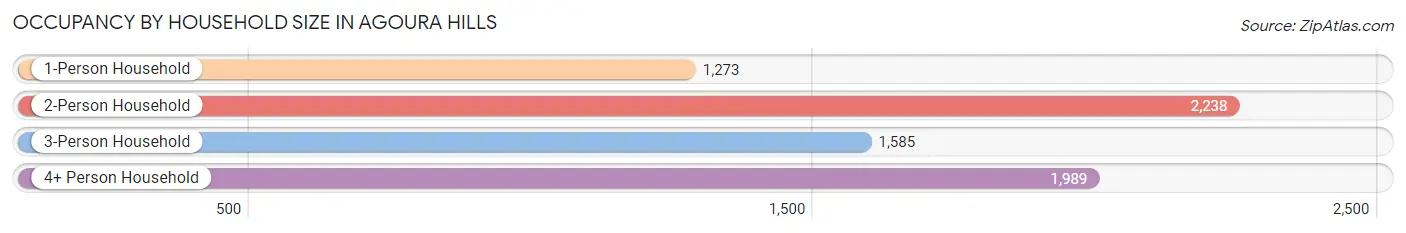
| Household Size | # Housing Units | % Housing Units |
| 1-Person Household | 1,273 | 18.0% |
| 2-Person Household | 2,238 | 31.6% |
| 3-Person Household | 1,585 | 22.4% |
| 4+ Person Household | 1,989 | 28.1% |
| Total Housing Units | 7,085 | 100.0% |
Occupancy by Ownership by Household Size in Agoura Hills
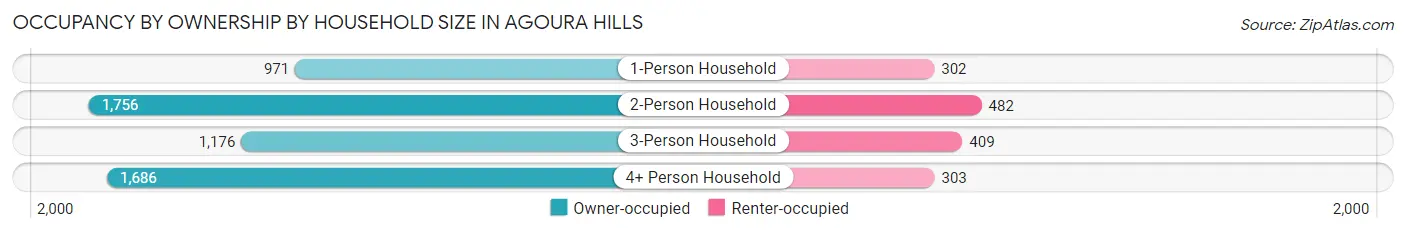
| Household Size | Owner-occupied | Renter-occupied |
| 1-Person Household | 971 (76.3%) | 302 (23.7%) |
| 2-Person Household | 1,756 (78.5%) | 482 (21.5%) |
| 3-Person Household | 1,176 (74.2%) | 409 (25.8%) |
| 4+ Person Household | 1,686 (84.8%) | 303 (15.2%) |
| Total Housing Units | 5,589 (78.9%) | 1,496 (21.1%) |
Occupancy by Educational Attainment in Agoura Hills
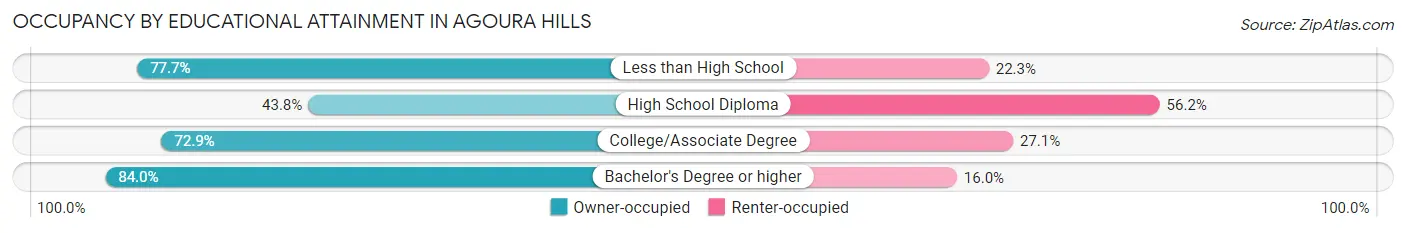
| Household Size | Owner-occupied | Renter-occupied |
| Less than High School | 80 (77.7%) | 23 (22.3%) |
| High School Diploma | 208 (43.8%) | 267 (56.2%) |
| College/Associate Degree | 1,077 (72.9%) | 401 (27.1%) |
| Bachelor's Degree or higher | 4,224 (84.0%) | 805 (16.0%) |
Occupancy by Age of Householder in Agoura Hills
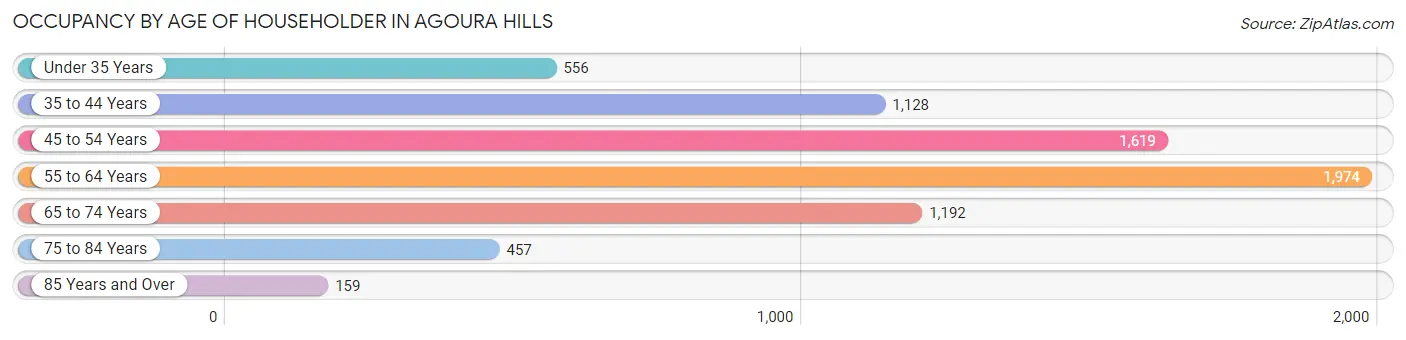
| Age Bracket | # Households | % Households |
| Under 35 Years | 556 | 7.9% |
| 35 to 44 Years | 1,128 | 15.9% |
| 45 to 54 Years | 1,619 | 22.9% |
| 55 to 64 Years | 1,974 | 27.9% |
| 65 to 74 Years | 1,192 | 16.8% |
| 75 to 84 Years | 457 | 6.5% |
| 85 Years and Over | 159 | 2.2% |
| Total | 7,085 | 100.0% |
Housing Finances in Agoura Hills
Median Income by Occupancy in Agoura Hills
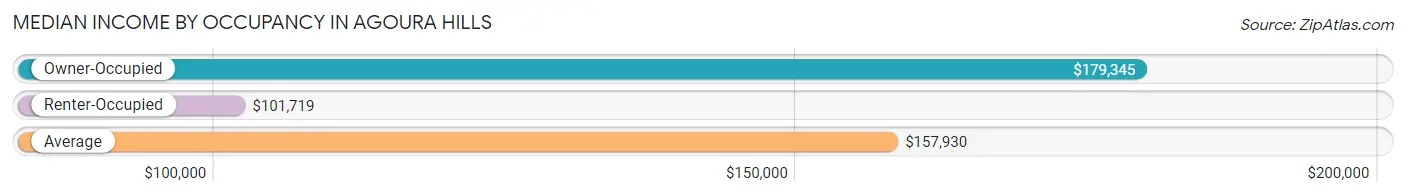
| Occupancy Type | # Households | Median Income |
| Owner-Occupied | 5,589 (78.9%) | $179,345 |
| Renter-Occupied | 1,496 (21.1%) | $101,719 |
| Average | 7,085 (100.0%) | $157,930 |
Occupancy by Householder Income Bracket in Agoura Hills
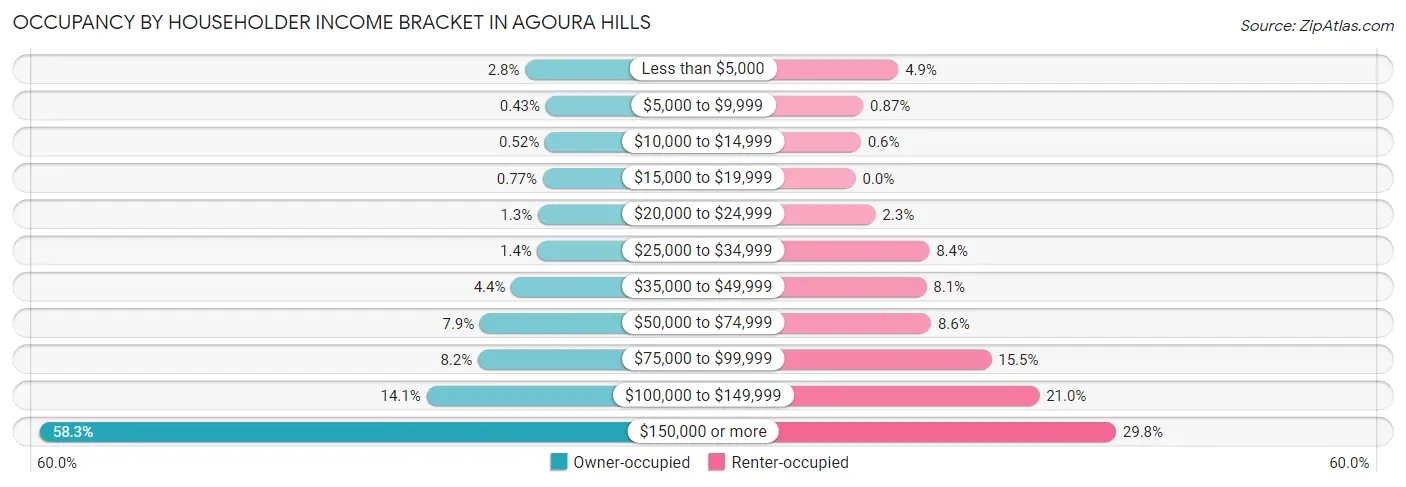
| Income Bracket | Owner-occupied | Renter-occupied |
| Less than $5,000 | 155 (2.8%) | 73 (4.9%) |
| $5,000 to $9,999 | 24 (0.4%) | 13 (0.9%) |
| $10,000 to $14,999 | 29 (0.5%) | 9 (0.6%) |
| $15,000 to $19,999 | 43 (0.8%) | 0 (0.0%) |
| $20,000 to $24,999 | 74 (1.3%) | 34 (2.3%) |
| $25,000 to $34,999 | 76 (1.4%) | 126 (8.4%) |
| $35,000 to $49,999 | 245 (4.4%) | 121 (8.1%) |
| $50,000 to $74,999 | 444 (7.9%) | 129 (8.6%) |
| $75,000 to $99,999 | 457 (8.2%) | 232 (15.5%) |
| $100,000 to $149,999 | 786 (14.1%) | 314 (21.0%) |
| $150,000 or more | 3,256 (58.3%) | 445 (29.7%) |
| Total | 5,589 (100.0%) | 1,496 (100.0%) |
Monthly Housing Cost Tiers in Agoura Hills
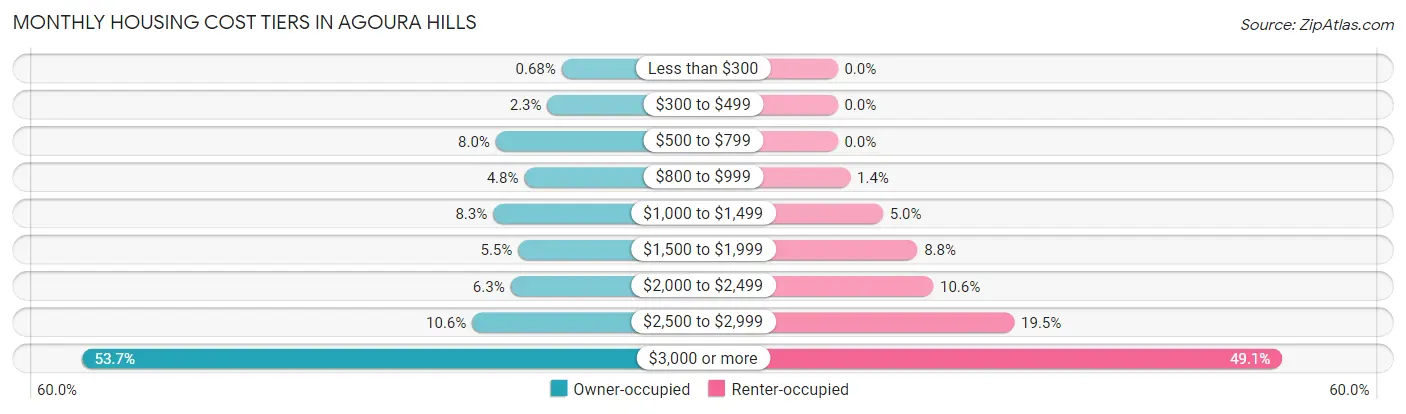
| Monthly Cost | Owner-occupied | Renter-occupied |
| Less than $300 | 38 (0.7%) | 0 (0.0%) |
| $300 to $499 | 126 (2.2%) | 0 (0.0%) |
| $500 to $799 | 445 (8.0%) | 0 (0.0%) |
| $800 to $999 | 268 (4.8%) | 21 (1.4%) |
| $1,000 to $1,499 | 461 (8.3%) | 75 (5.0%) |
| $1,500 to $1,999 | 306 (5.5%) | 132 (8.8%) |
| $2,000 to $2,499 | 353 (6.3%) | 158 (10.6%) |
| $2,500 to $2,999 | 590 (10.6%) | 292 (19.5%) |
| $3,000 or more | 3,002 (53.7%) | 735 (49.1%) |
| Total | 5,589 (100.0%) | 1,496 (100.0%) |
Physical Housing Characteristics in Agoura Hills
Housing Structures in Agoura Hills
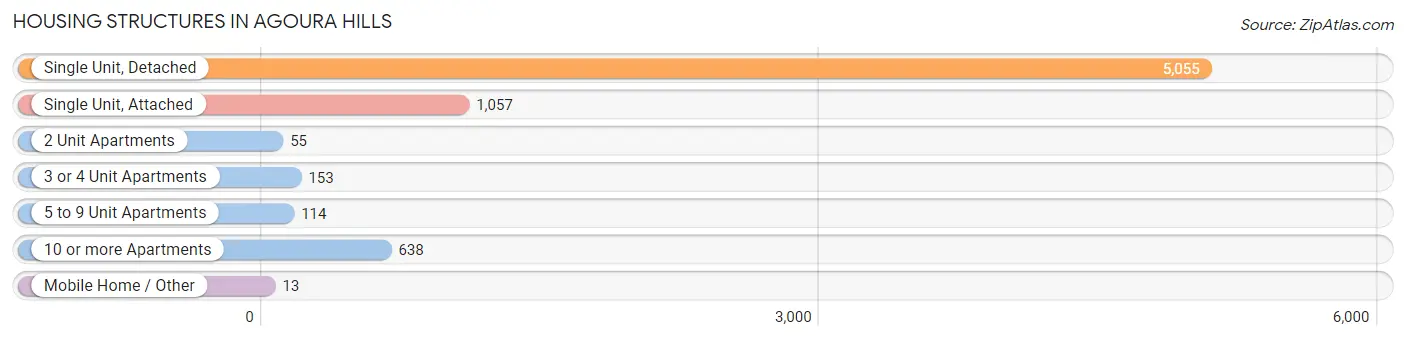
| Structure Type | # Housing Units | % Housing Units |
| Single Unit, Detached | 5,055 | 71.4% |
| Single Unit, Attached | 1,057 | 14.9% |
| 2 Unit Apartments | 55 | 0.8% |
| 3 or 4 Unit Apartments | 153 | 2.2% |
| 5 to 9 Unit Apartments | 114 | 1.6% |
| 10 or more Apartments | 638 | 9.0% |
| Mobile Home / Other | 13 | 0.2% |
| Total | 7,085 | 100.0% |
Housing Structures by Occupancy in Agoura Hills
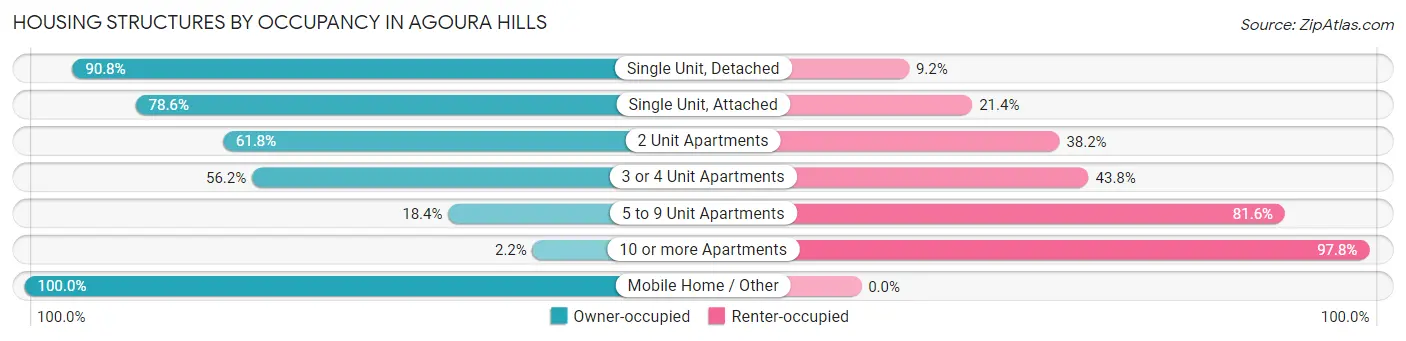
| Structure Type | Owner-occupied | Renter-occupied |
| Single Unit, Detached | 4,590 (90.8%) | 465 (9.2%) |
| Single Unit, Attached | 831 (78.6%) | 226 (21.4%) |
| 2 Unit Apartments | 34 (61.8%) | 21 (38.2%) |
| 3 or 4 Unit Apartments | 86 (56.2%) | 67 (43.8%) |
| 5 to 9 Unit Apartments | 21 (18.4%) | 93 (81.6%) |
| 10 or more Apartments | 14 (2.2%) | 624 (97.8%) |
| Mobile Home / Other | 13 (100.0%) | 0 (0.0%) |
| Total | 5,589 (78.9%) | 1,496 (21.1%) |
Housing Structures by Number of Rooms in Agoura Hills
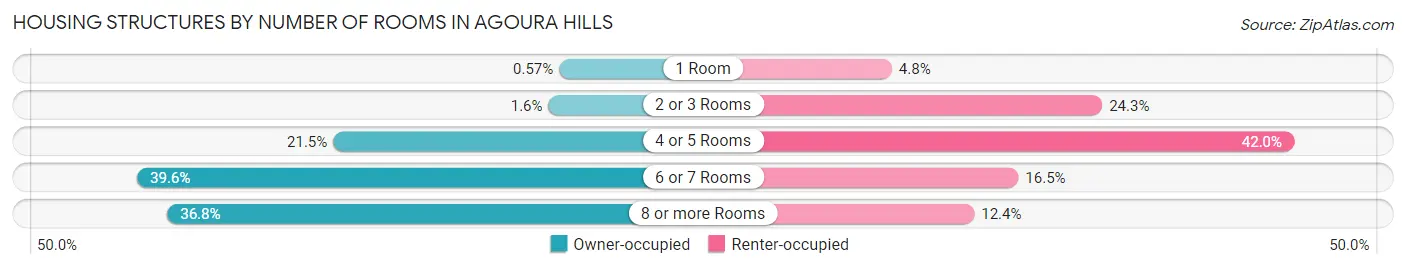
| Number of Rooms | Owner-occupied | Renter-occupied |
| 1 Room | 32 (0.6%) | 72 (4.8%) |
| 2 or 3 Rooms | 87 (1.6%) | 363 (24.3%) |
| 4 or 5 Rooms | 1,200 (21.5%) | 628 (42.0%) |
| 6 or 7 Rooms | 2,213 (39.6%) | 247 (16.5%) |
| 8 or more Rooms | 2,057 (36.8%) | 186 (12.4%) |
| Total | 5,589 (100.0%) | 1,496 (100.0%) |
Housing Structure by Heating Type in Agoura Hills
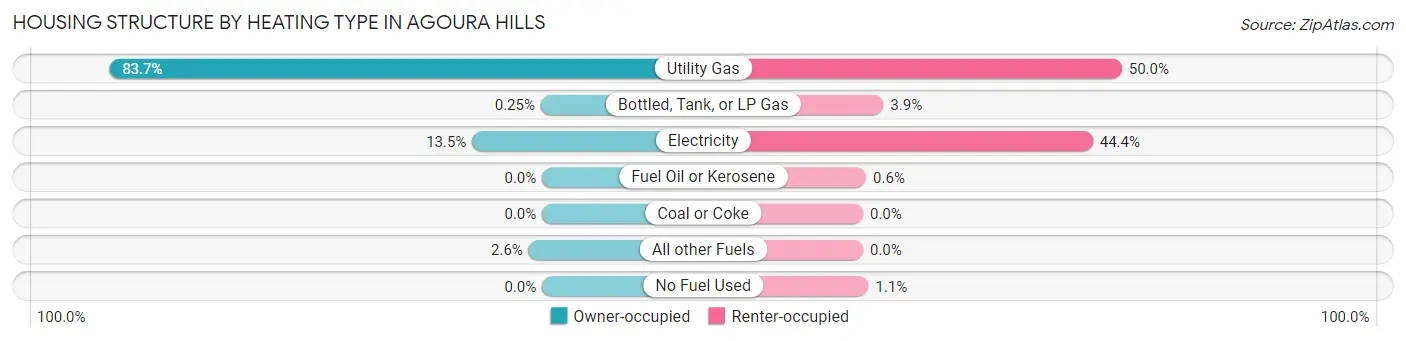
| Heating Type | Owner-occupied | Renter-occupied |
| Utility Gas | 4,675 (83.7%) | 748 (50.0%) |
| Bottled, Tank, or LP Gas | 14 (0.3%) | 59 (3.9%) |
| Electricity | 755 (13.5%) | 664 (44.4%) |
| Fuel Oil or Kerosene | 0 (0.0%) | 9 (0.6%) |
| Coal or Coke | 0 (0.0%) | 0 (0.0%) |
| All other Fuels | 145 (2.6%) | 0 (0.0%) |
| No Fuel Used | 0 (0.0%) | 16 (1.1%) |
| Total | 5,589 (100.0%) | 1,496 (100.0%) |
Household Vehicle Usage in Agoura Hills
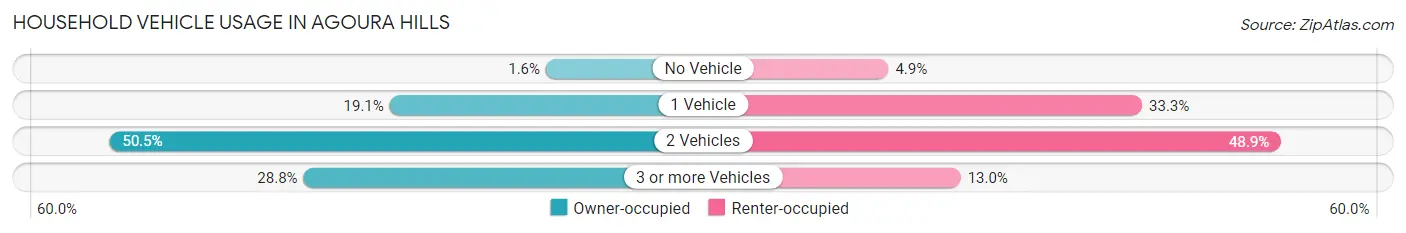
| Vehicles per Household | Owner-occupied | Renter-occupied |
| No Vehicle | 90 (1.6%) | 73 (4.9%) |
| 1 Vehicle | 1,068 (19.1%) | 498 (33.3%) |
| 2 Vehicles | 2,823 (50.5%) | 731 (48.9%) |
| 3 or more Vehicles | 1,608 (28.8%) | 194 (13.0%) |
| Total | 5,589 (100.0%) | 1,496 (100.0%) |
Real Estate & Mortgages in Agoura Hills
Real Estate and Mortgage Overview in Agoura Hills
| Characteristic | Without Mortgage | With Mortgage |
| Housing Units | 1,398 | 4,191 |
| Median Property Value | $994,900 | $964,000 |
| Median Household Income | $138,421 | $2,589 |
| Monthly Housing Costs | $917 | $2,973 |
| Real Estate Taxes | $5,151 | $37 |
Property Value by Mortgage Status in Agoura Hills
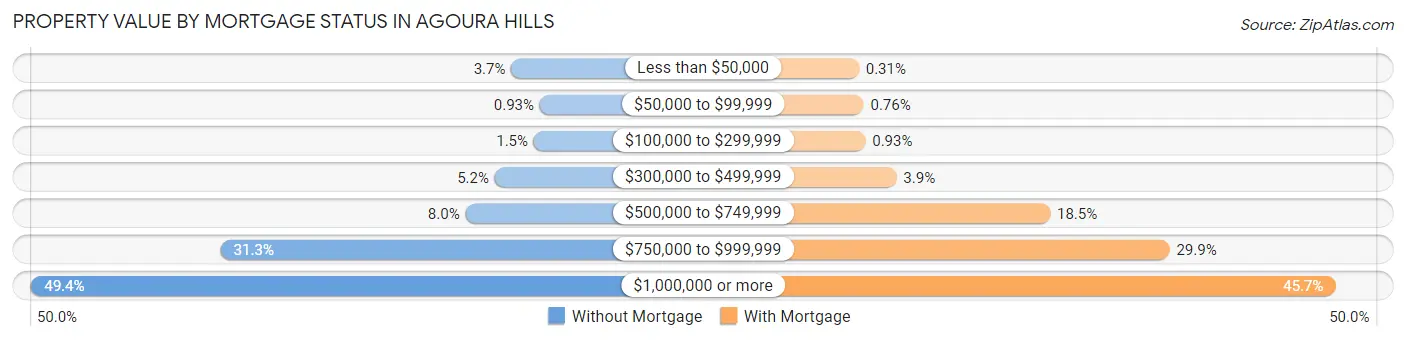
| Property Value | Without Mortgage | With Mortgage |
| Less than $50,000 | 51 (3.6%) | 13 (0.3%) |
| $50,000 to $99,999 | 13 (0.9%) | 32 (0.8%) |
| $100,000 to $299,999 | 21 (1.5%) | 39 (0.9%) |
| $300,000 to $499,999 | 73 (5.2%) | 163 (3.9%) |
| $500,000 to $749,999 | 112 (8.0%) | 776 (18.5%) |
| $750,000 to $999,999 | 438 (31.3%) | 1,253 (29.9%) |
| $1,000,000 or more | 690 (49.4%) | 1,915 (45.7%) |
| Total | 1,398 (100.0%) | 4,191 (100.0%) |
Household Income by Mortgage Status in Agoura Hills
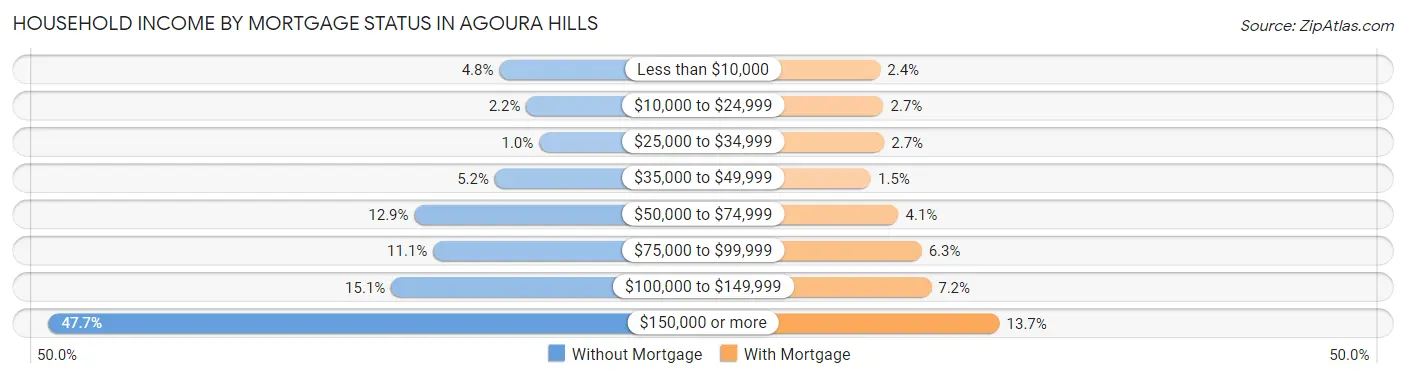
| Household Income | Without Mortgage | With Mortgage |
| Less than $10,000 | 67 (4.8%) | 99 (2.4%) |
| $10,000 to $24,999 | 31 (2.2%) | 112 (2.7%) |
| $25,000 to $34,999 | 14 (1.0%) | 115 (2.7%) |
| $35,000 to $49,999 | 73 (5.2%) | 62 (1.5%) |
| $50,000 to $74,999 | 180 (12.9%) | 172 (4.1%) |
| $75,000 to $99,999 | 155 (11.1%) | 264 (6.3%) |
| $100,000 to $149,999 | 211 (15.1%) | 302 (7.2%) |
| $150,000 or more | 667 (47.7%) | 575 (13.7%) |
| Total | 1,398 (100.0%) | 4,191 (100.0%) |
Property Value to Household Income Ratio in Agoura Hills
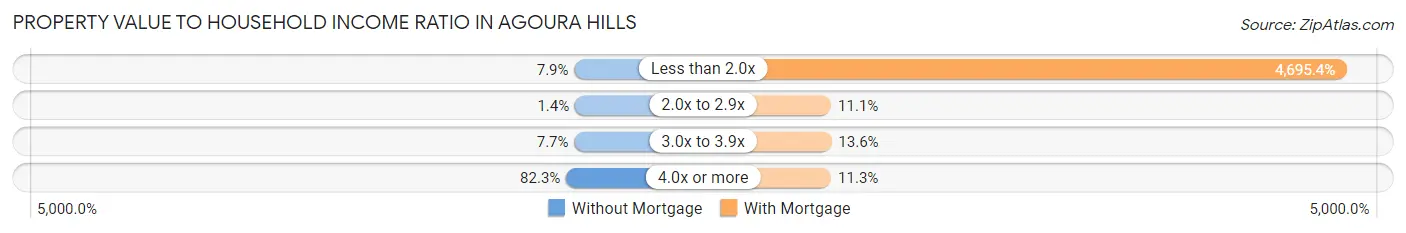
| Value-to-Income Ratio | Without Mortgage | With Mortgage |
| Less than 2.0x | 111 (7.9%) | 196,784 (4,695.4%) |
| 2.0x to 2.9x | 19 (1.4%) | 463 (11.1%) |
| 3.0x to 3.9x | 108 (7.7%) | 570 (13.6%) |
| 4.0x or more | 1,150 (82.3%) | 475 (11.3%) |
| Total | 1,398 (100.0%) | 4,191 (100.0%) |
Real Estate Taxes by Mortgage Status in Agoura Hills
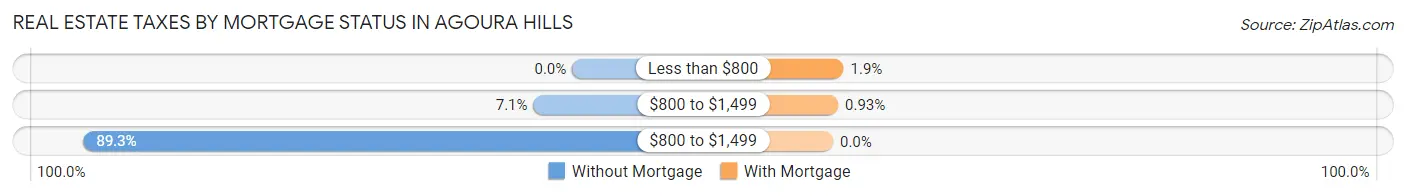
| Property Taxes | Without Mortgage | With Mortgage |
| Less than $800 | 0 (0.0%) | 81 (1.9%) |
| $800 to $1,499 | 99 (7.1%) | 39 (0.9%) |
| $800 to $1,499 | 1,248 (89.3%) | 0 (0.0%) |
| Total | 1,398 (100.0%) | 4,191 (100.0%) |
Health & Disability in Agoura Hills
Health Insurance Coverage by Age in Agoura Hills
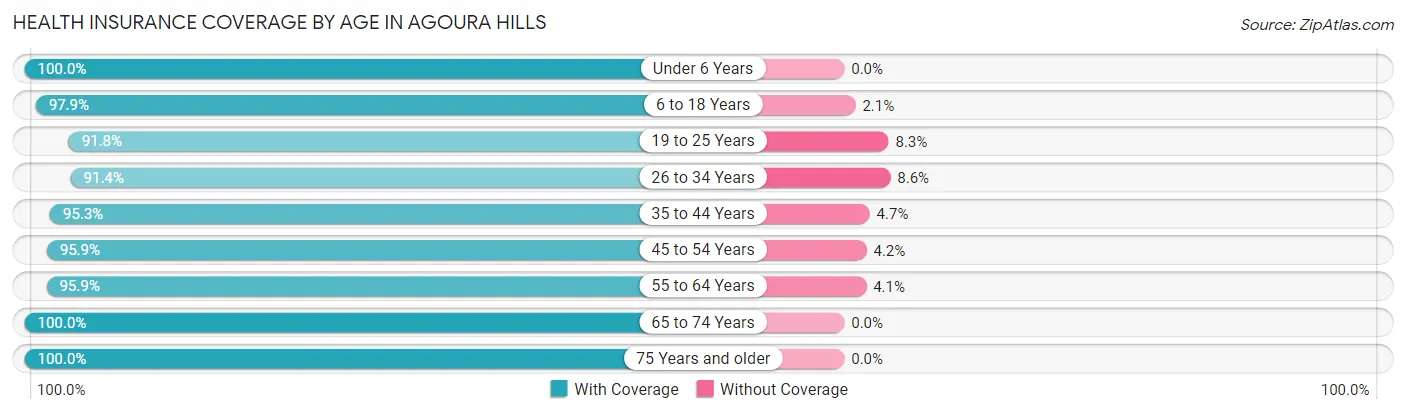
| Age Bracket | With Coverage | Without Coverage |
| Under 6 Years | 735 (100.0%) | 0 (0.0%) |
| 6 to 18 Years | 4,033 (97.9%) | 86 (2.1%) |
| 19 to 25 Years | 1,412 (91.7%) | 127 (8.3%) |
| 26 to 34 Years | 1,298 (91.4%) | 122 (8.6%) |
| 35 to 44 Years | 2,415 (95.3%) | 120 (4.7%) |
| 45 to 54 Years | 2,563 (95.9%) | 111 (4.2%) |
| 55 to 64 Years | 3,562 (95.9%) | 152 (4.1%) |
| 65 to 74 Years | 2,131 (100.0%) | 0 (0.0%) |
| 75 Years and older | 1,114 (100.0%) | 0 (0.0%) |
| Total | 19,263 (96.4%) | 718 (3.6%) |
Health Insurance Coverage by Citizenship Status in Agoura Hills
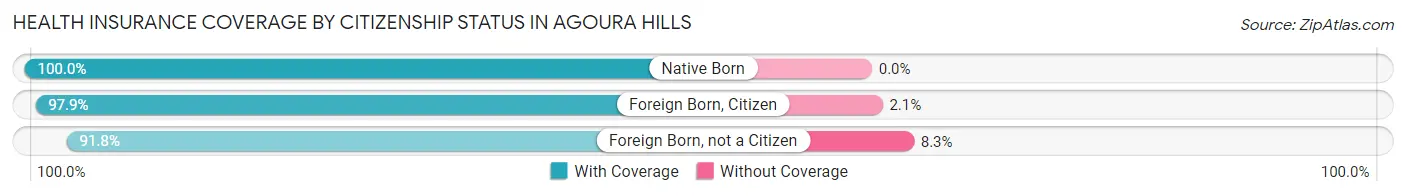
| Citizenship Status | With Coverage | Without Coverage |
| Native Born | 735 (100.0%) | 0 (0.0%) |
| Foreign Born, Citizen | 4,033 (97.9%) | 86 (2.1%) |
| Foreign Born, not a Citizen | 1,412 (91.7%) | 127 (8.3%) |
Health Insurance Coverage by Household Income in Agoura Hills
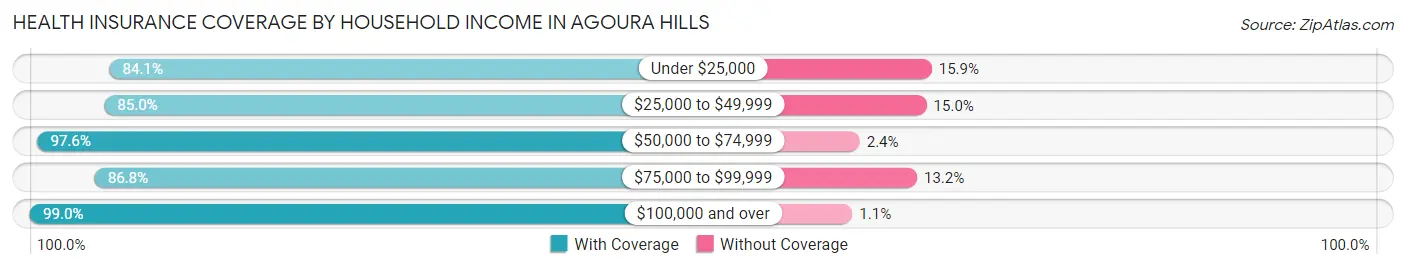
| Household Income | With Coverage | Without Coverage |
| Under $25,000 | 697 (84.1%) | 132 (15.9%) |
| $25,000 to $49,999 | 1,052 (85.0%) | 185 (15.0%) |
| $50,000 to $74,999 | 1,327 (97.6%) | 33 (2.4%) |
| $75,000 to $99,999 | 1,366 (86.8%) | 207 (13.2%) |
| $100,000 and over | 14,803 (99.0%) | 157 (1.1%) |
Public vs Private Health Insurance Coverage by Age in Agoura Hills
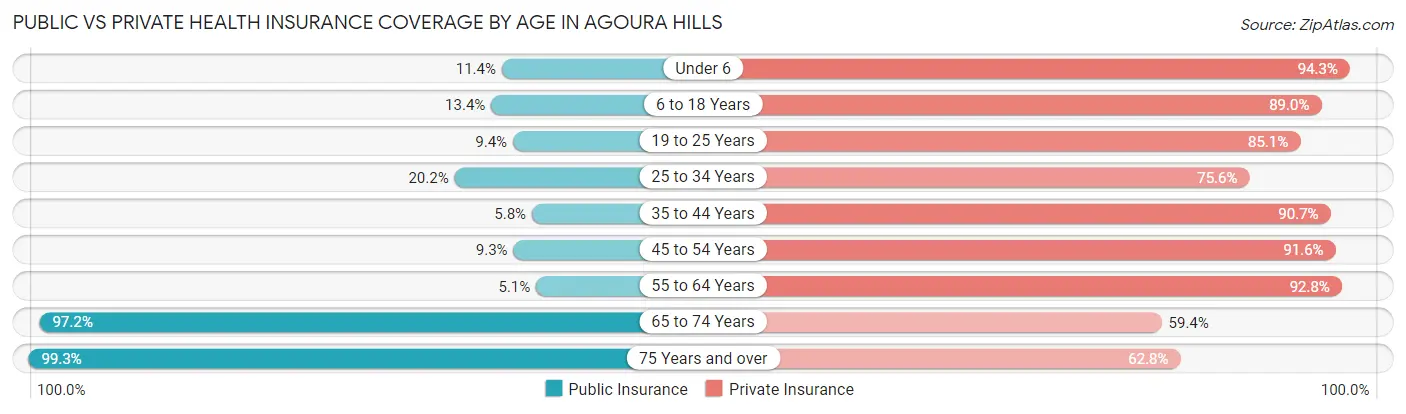
| Age Bracket | Public Insurance | Private Insurance |
| Under 6 | 84 (11.4%) | 693 (94.3%) |
| 6 to 18 Years | 552 (13.4%) | 3,665 (89.0%) |
| 19 to 25 Years | 144 (9.4%) | 1,309 (85.1%) |
| 25 to 34 Years | 287 (20.2%) | 1,074 (75.6%) |
| 35 to 44 Years | 148 (5.8%) | 2,299 (90.7%) |
| 45 to 54 Years | 248 (9.3%) | 2,450 (91.6%) |
| 55 to 64 Years | 188 (5.1%) | 3,446 (92.8%) |
| 65 to 74 Years | 2,072 (97.2%) | 1,265 (59.4%) |
| 75 Years and over | 1,106 (99.3%) | 700 (62.8%) |
| Total | 4,829 (24.2%) | 16,901 (84.6%) |
Disability Status by Sex by Age in Agoura Hills
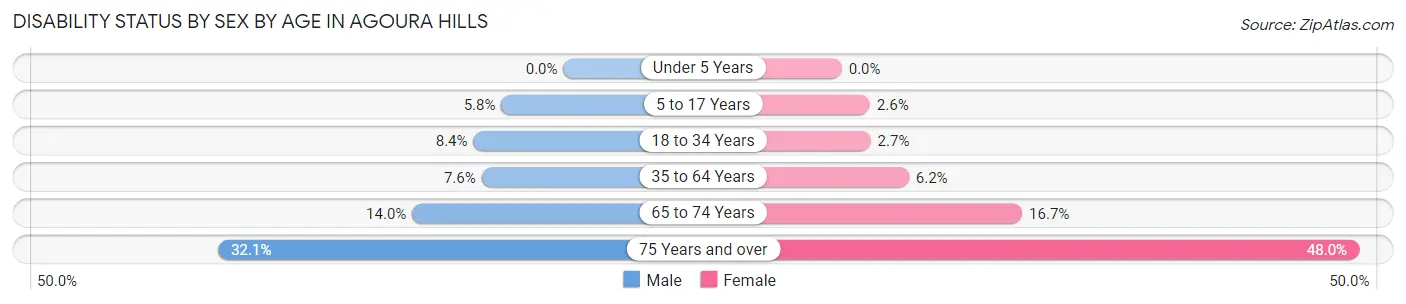
| Age Bracket | Male | Female |
| Under 5 Years | 0 (0.0%) | 0 (0.0%) |
| 5 to 17 Years | 121 (5.8%) | 49 (2.6%) |
| 18 to 34 Years | 139 (8.4%) | 41 (2.7%) |
| 35 to 64 Years | 326 (7.6%) | 288 (6.2%) |
| 65 to 74 Years | 149 (14.0%) | 179 (16.7%) |
| 75 Years and over | 142 (32.1%) | 322 (48.0%) |
Disability Class by Sex by Age in Agoura Hills
Disability Class: Hearing Difficulty
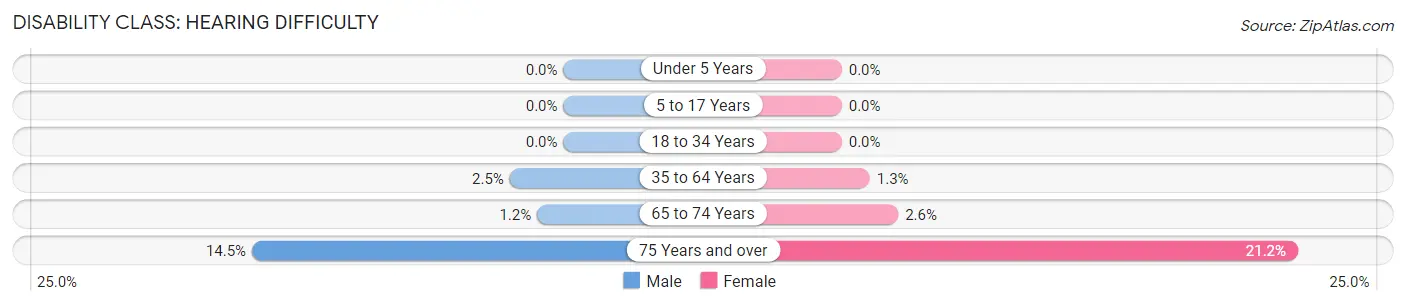
| Age Bracket | Male | Female |
| Under 5 Years | 0 (0.0%) | 0 (0.0%) |
| 5 to 17 Years | 0 (0.0%) | 0 (0.0%) |
| 18 to 34 Years | 0 (0.0%) | 0 (0.0%) |
| 35 to 64 Years | 107 (2.5%) | 60 (1.3%) |
| 65 to 74 Years | 13 (1.2%) | 28 (2.6%) |
| 75 Years and over | 64 (14.4%) | 142 (21.2%) |
Disability Class: Vision Difficulty
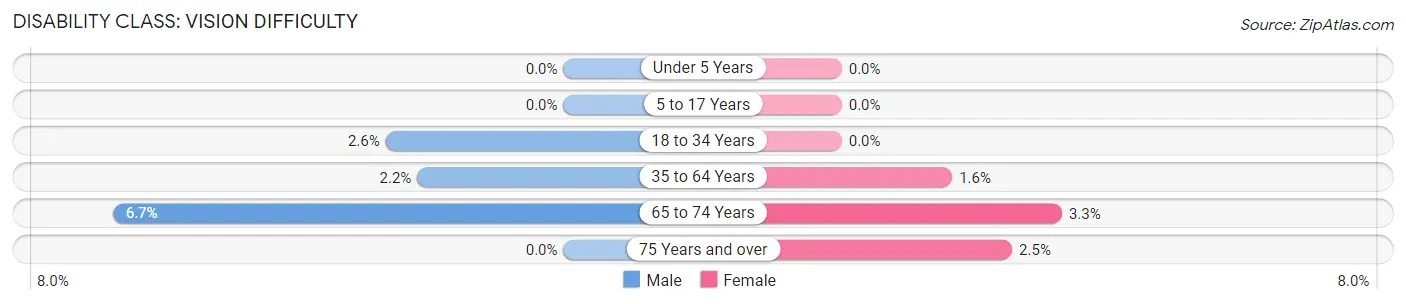
| Age Bracket | Male | Female |
| Under 5 Years | 0 (0.0%) | 0 (0.0%) |
| 5 to 17 Years | 0 (0.0%) | 0 (0.0%) |
| 18 to 34 Years | 44 (2.6%) | 0 (0.0%) |
| 35 to 64 Years | 93 (2.2%) | 76 (1.6%) |
| 65 to 74 Years | 71 (6.7%) | 35 (3.3%) |
| 75 Years and over | 0 (0.0%) | 17 (2.5%) |
Disability Class: Cognitive Difficulty
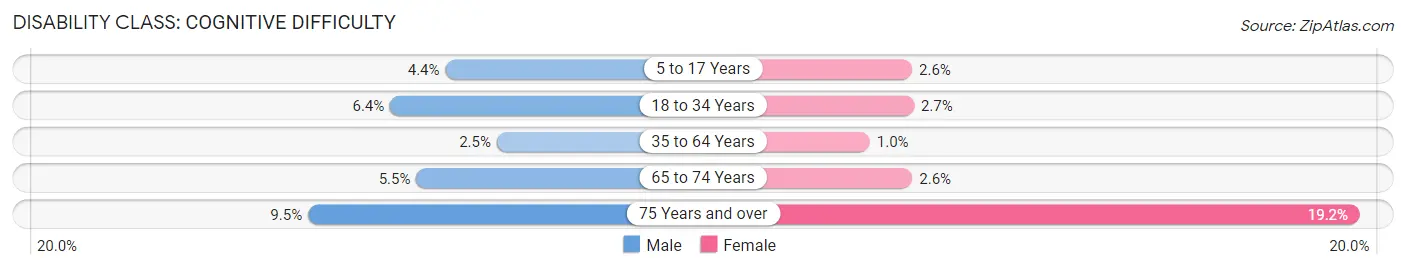
| Age Bracket | Male | Female |
| 5 to 17 Years | 92 (4.4%) | 49 (2.6%) |
| 18 to 34 Years | 107 (6.4%) | 41 (2.7%) |
| 35 to 64 Years | 106 (2.5%) | 48 (1.0%) |
| 65 to 74 Years | 58 (5.5%) | 28 (2.6%) |
| 75 Years and over | 42 (9.5%) | 129 (19.2%) |
Disability Class: Ambulatory Difficulty
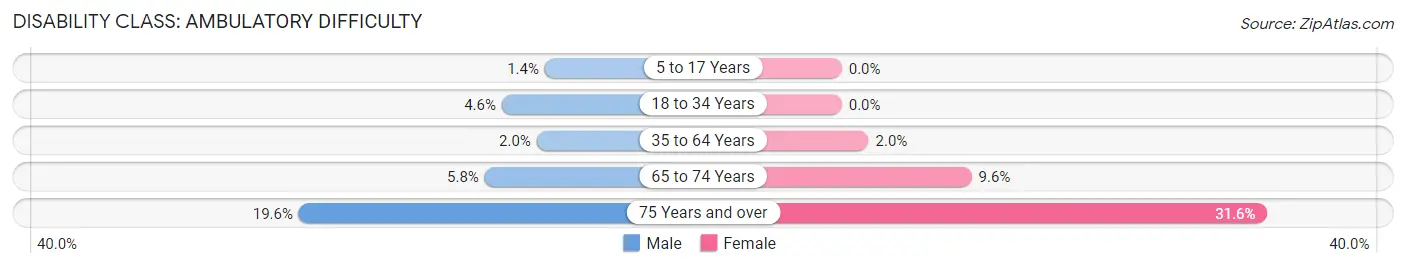
| Age Bracket | Male | Female |
| 5 to 17 Years | 29 (1.4%) | 0 (0.0%) |
| 18 to 34 Years | 76 (4.6%) | 0 (0.0%) |
| 35 to 64 Years | 85 (2.0%) | 92 (2.0%) |
| 65 to 74 Years | 62 (5.8%) | 103 (9.6%) |
| 75 Years and over | 87 (19.6%) | 212 (31.6%) |
Disability Class: Self-Care Difficulty
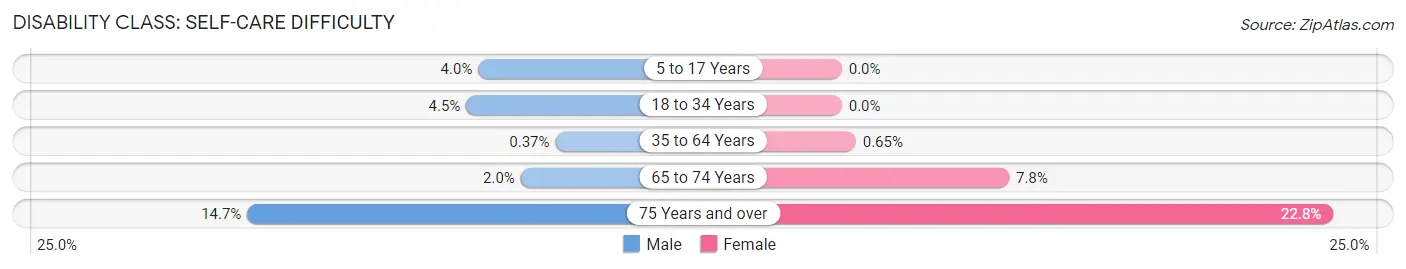
| Age Bracket | Male | Female |
| 5 to 17 Years | 83 (4.0%) | 0 (0.0%) |
| 18 to 34 Years | 75 (4.5%) | 0 (0.0%) |
| 35 to 64 Years | 16 (0.4%) | 30 (0.6%) |
| 65 to 74 Years | 21 (2.0%) | 83 (7.8%) |
| 75 Years and over | 65 (14.7%) | 153 (22.8%) |
Technology Access in Agoura Hills
Computing Device Access in Agoura Hills
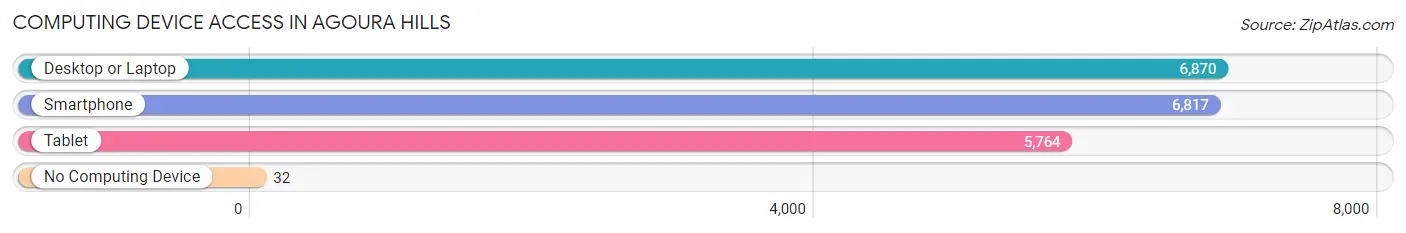
| Device Type | # Households | % Households |
| Desktop or Laptop | 6,870 | 97.0% |
| Smartphone | 6,817 | 96.2% |
| Tablet | 5,764 | 81.4% |
| No Computing Device | 32 | 0.4% |
| Total | 7,085 | 100.0% |
Internet Access in Agoura Hills
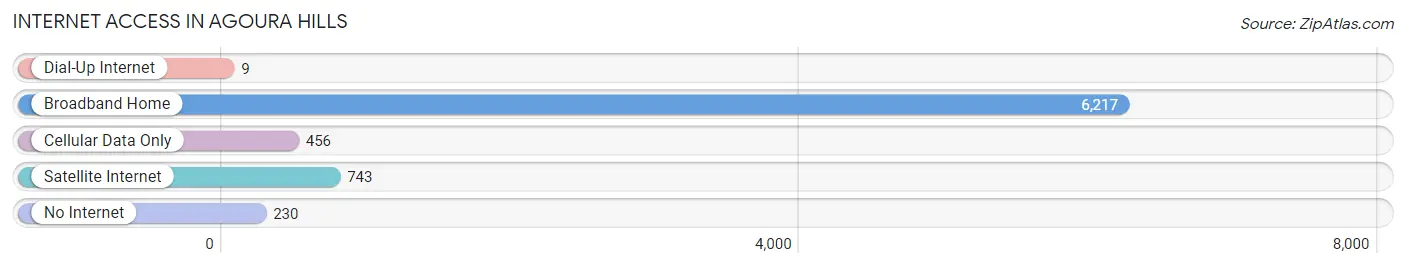
| Internet Type | # Households | % Households |
| Dial-Up Internet | 9 | 0.1% |
| Broadband Home | 6,217 | 87.7% |
| Cellular Data Only | 456 | 6.4% |
| Satellite Internet | 743 | 10.5% |
| No Internet | 230 | 3.3% |
| Total | 7,085 | 100.0% |
Agoura Hills Summary
Agoura Hills is a city located in Los Angeles County, California, United States. It is located in the Conejo Valley, just to the west of the San Fernando Valley. The city is bordered by the Santa Monica Mountains to the south, the Simi Hills to the north, and the Santa Susana Mountains to the east. The population was 20,330 at the 2010 census, up from 20,033 at the 2000 census. It is known for being the home of the famous rock band, The Eagles.
Geography
Agoura Hills is located in the Conejo Valley, which is located in the northwestern part of Los Angeles County. It is bordered by the Santa Monica Mountains to the south, the Simi Hills to the north, and the Santa Susana Mountains to the east. The city is located approximately 30 miles northwest of downtown Los Angeles.
Agoura Hills is located in the western part of the San Fernando Valley. It is bordered by the cities of Calabasas to the east, Westlake Village to the north, and Malibu to the south. The city is located approximately 10 miles from the Pacific Ocean.
The city has a total area of 8.2 square miles, of which 8.1 square miles is land and 0.1 square miles is water.
History
Agoura Hills was originally inhabited by the Chumash Native American tribe. The area was first settled by Europeans in the late 19th century. The area was originally known as Picture City, due to the large number of movie studios in the area. The name was changed to Agoura in 1927, after the local post office was established. The name was changed again to Agoura Hills in 1982.
Agoura Hills was incorporated as a city in 1982. The city has experienced rapid growth since then, with the population increasing from 4,000 in 1982 to 20,000 in 2010.
Economy
Agoura Hills is home to a number of businesses, including technology, finance, and entertainment companies. The city is also home to a number of corporate headquarters, including Dole Food Company, Guitar Center, and Nestle USA.
Agoura Hills is also home to a number of shopping centers, including the Agoura Hills Mall and the Commons at Calabasas. The city is also home to a number of restaurants, including the Cheesecake Factory, California Pizza Kitchen, and the Olive Garden.
Demographics
As of the 2010 census, the population of Agoura Hills was 20,330. The racial makeup of the city was 79.2% White, 5.2% African American, 0.3% Native American, 8.7% Asian, 0.1% Pacific Islander, 3.2% from other races, and 3.3% from two or more races. Hispanic or Latino of any race were 11.2% of the population.
The median income for a household in the city was $90,837, and the median income for a family was $103,844. The per capita income for the city was $41,845. About 4.2% of families and 5.7% of the population were below the poverty line, including 6.2% of those under age 18 and 4.7% of those age 65 or over.
Common Questions
What is Per Capita Income in Agoura Hills?
Per Capita income in Agoura Hills is $75,425.
What is the Median Family Income in Agoura Hills?
Median Family Income in Agoura Hills is $187,550.
What is the Median Household income in Agoura Hills?
Median Household Income in Agoura Hills is $157,930.
What is Income or Wage Gap in Agoura Hills?
Income or Wage Gap in Agoura Hills is 43.5%.
Women in Agoura Hills earn 56.5 cents for every dollar earned by a man.
What is Family Income Deficit in Agoura Hills?
Family Income Deficit in Agoura Hills is $12,632.
Families that are below poverty line in Agoura Hills earn $12,632 less on average than the poverty threshold level.
What is Inequality or Gini Index in Agoura Hills?
Inequality or Gini Index in Agoura Hills is 0.45.
What is the Total Population of Agoura Hills?
Total Population of Agoura Hills is 20,088.
What is the Total Male Population of Agoura Hills?
Total Male Population of Agoura Hills is 9,975.
What is the Total Female Population of Agoura Hills?
Total Female Population of Agoura Hills is 10,113.
What is the Ratio of Males per 100 Females in Agoura Hills?
There are 98.64 Males per 100 Females in Agoura Hills.
What is the Ratio of Females per 100 Males in Agoura Hills?
There are 101.38 Females per 100 Males in Agoura Hills.
What is the Median Population Age in Agoura Hills?
Median Population Age in Agoura Hills is 44.5 Years.
What is the Average Family Size in Agoura Hills
Average Family Size in Agoura Hills is 3.2 People.
What is the Average Household Size in Agoura Hills
Average Household Size in Agoura Hills is 2.8 People.
How Large is the Labor Force in Agoura Hills?
There are 10,346 People in the Labor Forcein in Agoura Hills.
What is the Percentage of People in the Labor Force in Agoura Hills?
63.4% of People are in the Labor Force in Agoura Hills.
What is the Unemployment Rate in Agoura Hills?
Unemployment Rate in Agoura Hills is 5.4%.