Piedmont, CA Map & Demographics
Piedmont Map
Piedmont Overview
$139,921
PER CAPITA INCOME
$250,001
AVG FAMILY INCOME
$250,001
AVG HOUSEHOLD INCOME
34.3%
WAGE / INCOME GAP [ % ]
65.7¢/ $1
WAGE / INCOME GAP [ $ ]
0.43
INEQUALITY / GINI INDEX
11,161
TOTAL POPULATION
5,607
MALE POPULATION
5,554
FEMALE POPULATION
100.95
MALES / 100 FEMALES
99.05
FEMALES / 100 MALES
44.3
MEDIAN AGE
3.3
AVG FAMILY SIZE
2.9
AVG HOUSEHOLD SIZE
5,444
LABOR FORCE [ PEOPLE ]
63.9%
PERCENT IN LABOR FORCE
5.0%
UNEMPLOYMENT RATE
Income in Piedmont
Income Overview in Piedmont
Per Capita Income in Piedmont is $139,921, while median incomes of families and households are $250,001 and $250,001 respectively.
| Characteristic | Number | Measure |
| Per Capita Income | 11,161 | $139,921 |
| Median Family Income | 3,039 | $250,001 |
| Mean Family Income | 3,039 | $439,331 |
| Median Household Income | 3,789 | $250,001 |
| Mean Household Income | 3,789 | $404,409 |
| Income Deficit | 3,039 | $0 |
| Wage / Income Gap (%) | 11,161 | 34.28% |
| Wage / Income Gap ($) | 11,161 | 65.72¢ per $1 |
| Gini / Inequality Index | 11,161 | 0.43 |
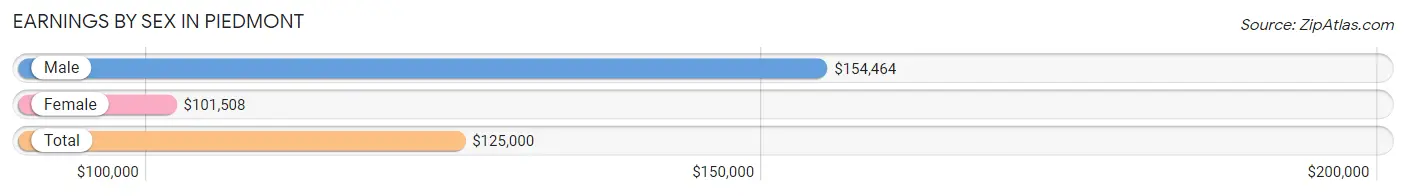
Earnings by Sex in Piedmont
Average Earnings in Piedmont are $125,000, $154,464 for men and $101,508 for women, a difference of 34.3%.
| Sex | Number | Average Earnings |
| Male | 3,226 (54.5%) | $154,464 |
| Female | 2,692 (45.5%) | $101,508 |
| Total | 5,918 (100.0%) | $125,000 |
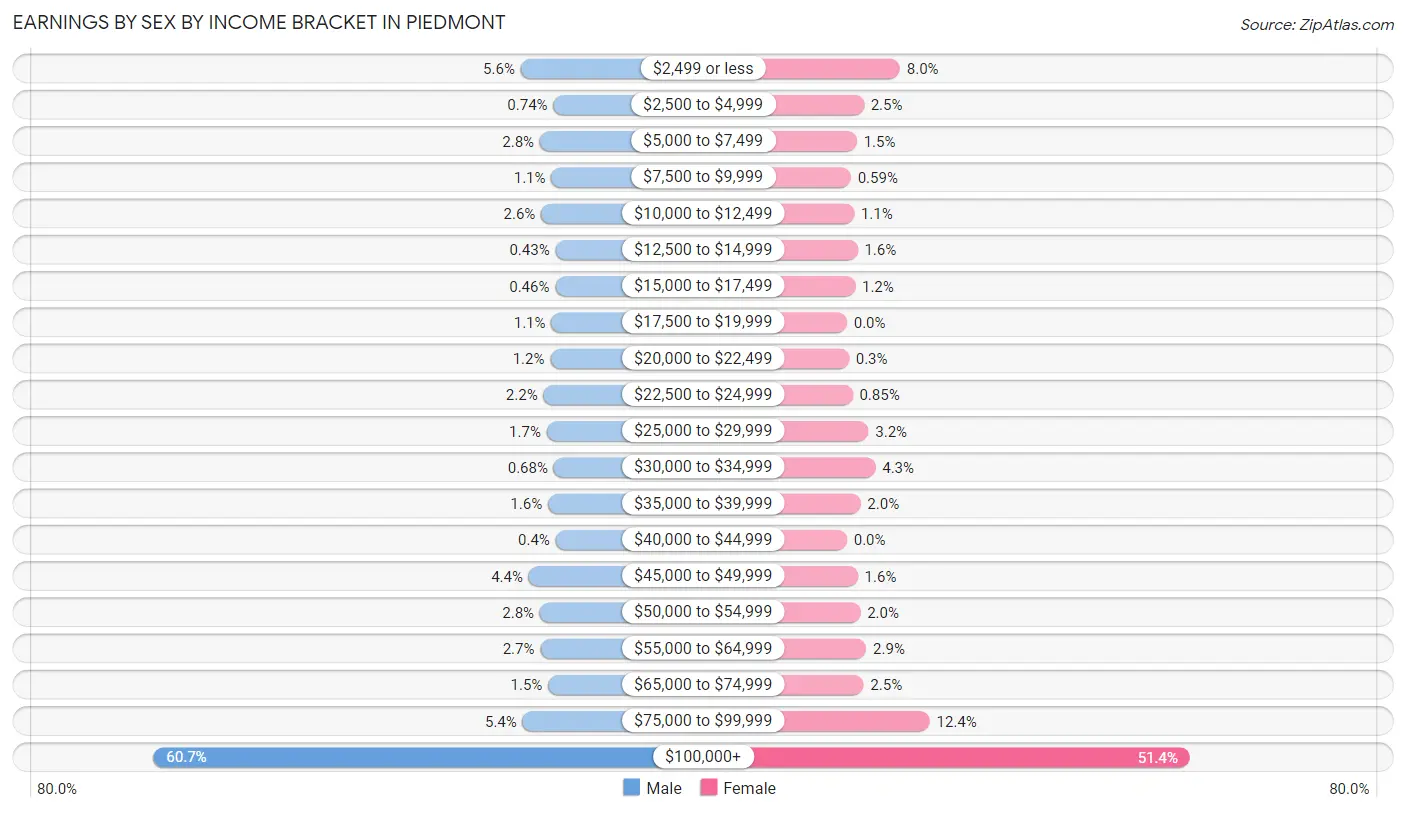
Earnings by Sex by Income Bracket in Piedmont
The most common earnings brackets in Piedmont are $100,000+ for men (1,958 | 60.7%) and $100,000+ for women (1,384 | 51.4%).
| Income | Male | Female |
| $2,499 or less | 182 (5.6%) | 214 (8.0%) |
| $2,500 to $4,999 | 24 (0.7%) | 68 (2.5%) |
| $5,000 to $7,499 | 89 (2.8%) | 40 (1.5%) |
| $7,500 to $9,999 | 34 (1.1%) | 16 (0.6%) |
| $10,000 to $12,499 | 83 (2.6%) | 29 (1.1%) |
| $12,500 to $14,999 | 14 (0.4%) | 43 (1.6%) |
| $15,000 to $17,499 | 15 (0.5%) | 33 (1.2%) |
| $17,500 to $19,999 | 34 (1.1%) | 0 (0.0%) |
| $20,000 to $22,499 | 39 (1.2%) | 8 (0.3%) |
| $22,500 to $24,999 | 72 (2.2%) | 23 (0.9%) |
| $25,000 to $29,999 | 56 (1.7%) | 87 (3.2%) |
| $30,000 to $34,999 | 22 (0.7%) | 115 (4.3%) |
| $35,000 to $39,999 | 50 (1.5%) | 55 (2.0%) |
| $40,000 to $44,999 | 13 (0.4%) | 0 (0.0%) |
| $45,000 to $49,999 | 143 (4.4%) | 44 (1.6%) |
| $50,000 to $54,999 | 89 (2.8%) | 54 (2.0%) |
| $55,000 to $64,999 | 87 (2.7%) | 78 (2.9%) |
| $65,000 to $74,999 | 49 (1.5%) | 67 (2.5%) |
| $75,000 to $99,999 | 173 (5.4%) | 334 (12.4%) |
| $100,000+ | 1,958 (60.7%) | 1,384 (51.4%) |
| Total | 3,226 (100.0%) | 2,692 (100.0%) |
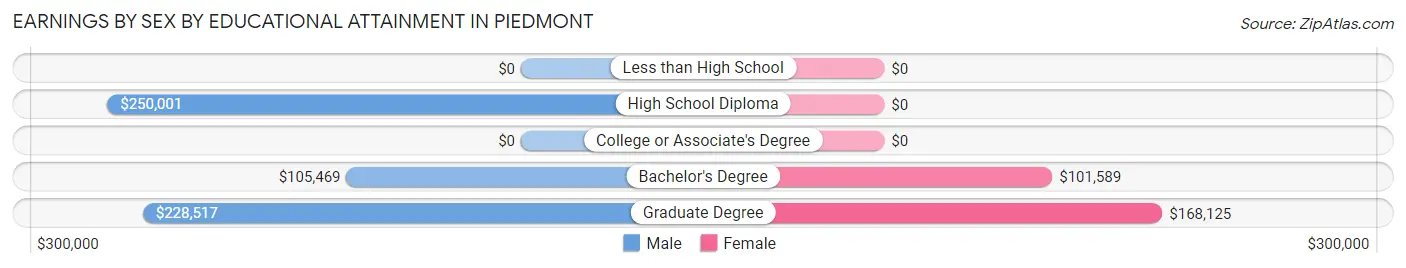
Earnings by Sex by Educational Attainment in Piedmont
Average earnings in Piedmont are $164,324 for men and $114,864 for women, a difference of 30.1%. Men with an educational attainment of high school diploma enjoy the highest average annual earnings of $250,001, while those with bachelor's degree education earn the least with $105,469. Women with an educational attainment of graduate degree earn the most with the average annual earnings of $168,125, while those with bachelor's degree education have the smallest earnings of $101,589.
| Educational Attainment | Male Income | Female Income |
| Less than High School | - | - |
| High School Diploma | $250,001 | $0 |
| College or Associate's Degree | - | - |
| Bachelor's Degree | $105,469 | $101,589 |
| Graduate Degree | $228,517 | $168,125 |
| Total | $164,324 | $114,864 |
Family Income in Piedmont
Family Income Brackets in Piedmont
According to the Piedmont family income data, there are 2,307 families falling into the $200,000+ income range, which is the most common income bracket and makes up 75.9% of all families.
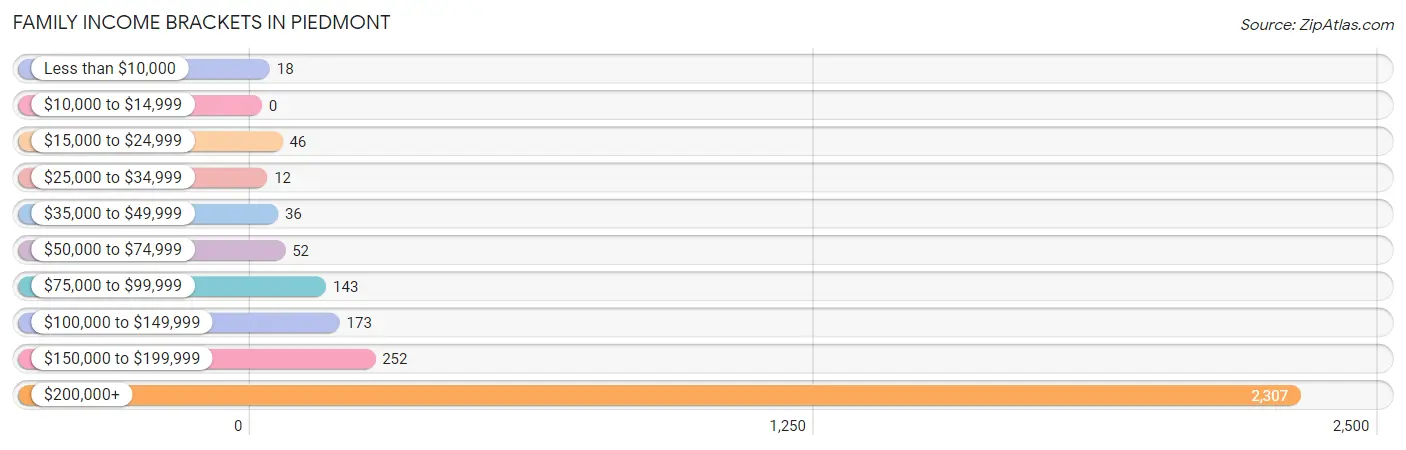
| Income Bracket | # Families | % Families |
| Less than $10,000 | 18 | 0.6% |
| $10,000 to $14,999 | 0 | 0.0% |
| $15,000 to $24,999 | 46 | 1.5% |
| $25,000 to $34,999 | 12 | 0.4% |
| $35,000 to $49,999 | 36 | 1.2% |
| $50,000 to $74,999 | 52 | 1.7% |
| $75,000 to $99,999 | 143 | 4.7% |
| $100,000 to $149,999 | 173 | 5.7% |
| $150,000 to $199,999 | 252 | 8.3% |
| $200,000+ | 2,307 | 75.9% |
Family Income by Famaliy Size in Piedmont
2-person families (1,111 | 36.6%) account for the highest median family income in Piedmont with $250,001 per family, while 2-person families (1,111 | 36.6%) have the highest median income of $125,000 per family member.
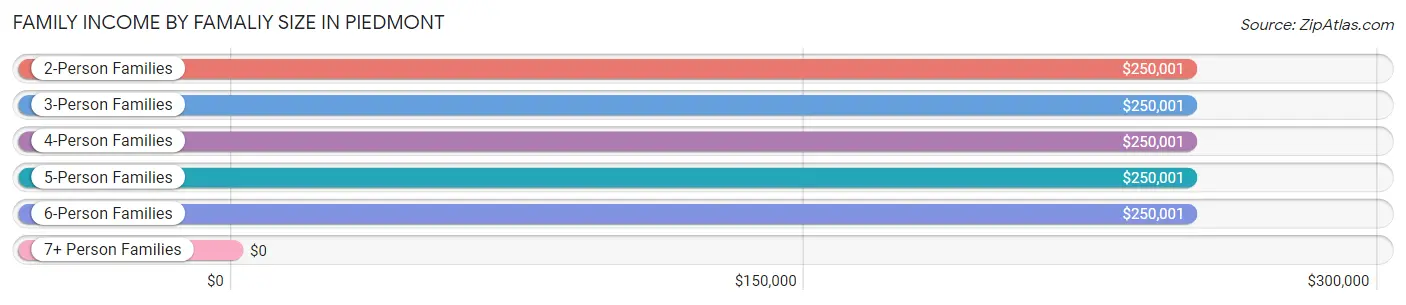
| Income Bracket | # Families | Median Income |
| 2-Person Families | 1,111 (36.6%) | $250,001 |
| 3-Person Families | 664 (21.8%) | $250,001 |
| 4-Person Families | 990 (32.6%) | $250,001 |
| 5-Person Families | 199 (6.6%) | $250,001 |
| 6-Person Families | 49 (1.6%) | $250,001 |
| 7+ Person Families | 26 (0.9%) | $0 |
| Total | 3,039 (100.0%) | $250,001 |
Family Income by Number of Earners in Piedmont
The median family income in Piedmont is $250,001, with families comprising 1 earner (757) having the highest median family income of $250,001, while families with no earners (365) have the lowest median family income of $215,547, accounting for 24.9% and 12.0% of families, respectively.
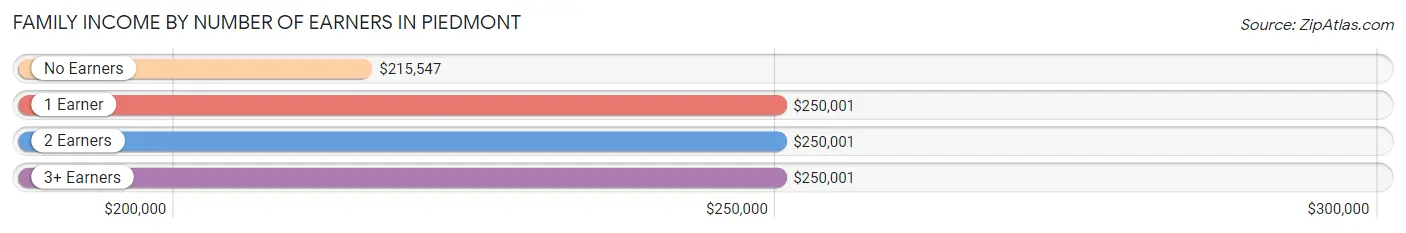
| Number of Earners | # Families | Median Income |
| No Earners | 365 (12.0%) | $215,547 |
| 1 Earner | 757 (24.9%) | $250,001 |
| 2 Earners | 1,561 (51.4%) | $250,001 |
| 3+ Earners | 356 (11.7%) | $250,001 |
| Total | 3,039 (100.0%) | $250,001 |
Household Income in Piedmont
Household Income Brackets in Piedmont
With 2,584 households falling in the category, the $200,000+ income range is the most frequent in Piedmont, accounting for 68.2% of all households. In contrast, only 15 households (0.4%) fall into the less than $10,000 income bracket, making it the least populous group.
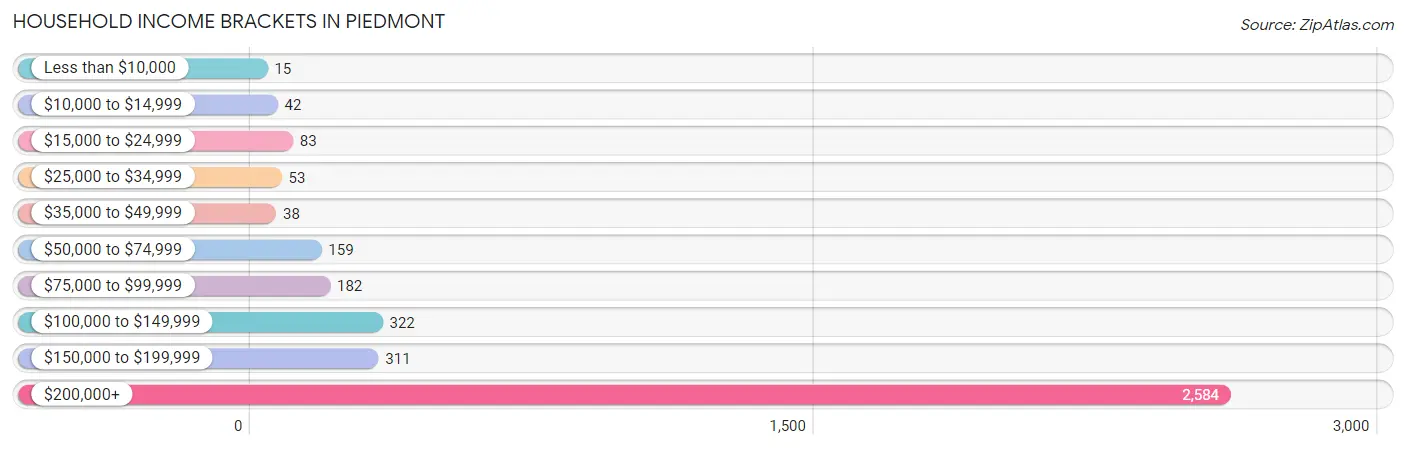
| Income Bracket | # Households | % Households |
| Less than $10,000 | 15 | 0.4% |
| $10,000 to $14,999 | 42 | 1.1% |
| $15,000 to $24,999 | 83 | 2.2% |
| $25,000 to $34,999 | 53 | 1.4% |
| $35,000 to $49,999 | 38 | 1.0% |
| $50,000 to $74,999 | 159 | 4.2% |
| $75,000 to $99,999 | 182 | 4.8% |
| $100,000 to $149,999 | 322 | 8.5% |
| $150,000 to $199,999 | 311 | 8.2% |
| $200,000+ | 2,584 | 68.2% |
Household Income by Householder Age in Piedmont
The median household income in Piedmont is $250,001, with the highest median household income of $250,001 found in the 25 to 44 years age bracket for the primary householder. A total of 842 households (22.2%) fall into this category.
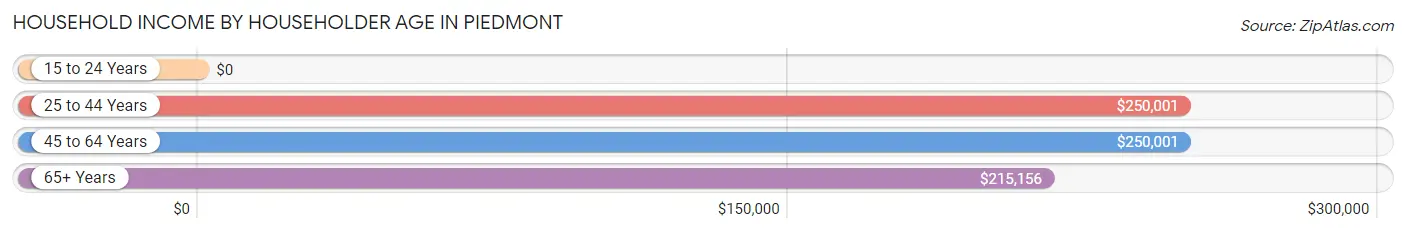
| Income Bracket | # Households | Median Income |
| 15 to 24 Years | 0 (0.0%) | $0 |
| 25 to 44 Years | 842 (22.2%) | $250,001 |
| 45 to 64 Years | 1,489 (39.3%) | $250,001 |
| 65+ Years | 1,458 (38.5%) | $215,156 |
| Total | 3,789 (100.0%) | $250,001 |
Poverty in Piedmont
Income Below Poverty by Sex and Age in Piedmont
With 3.1% poverty level for males and 3.9% for females among the residents of Piedmont, 18 to 24 year old males and 18 to 24 year old females are the most vulnerable to poverty, with 26 males (9.5%) and 54 females (29.3%) in their respective age groups living below the poverty level.
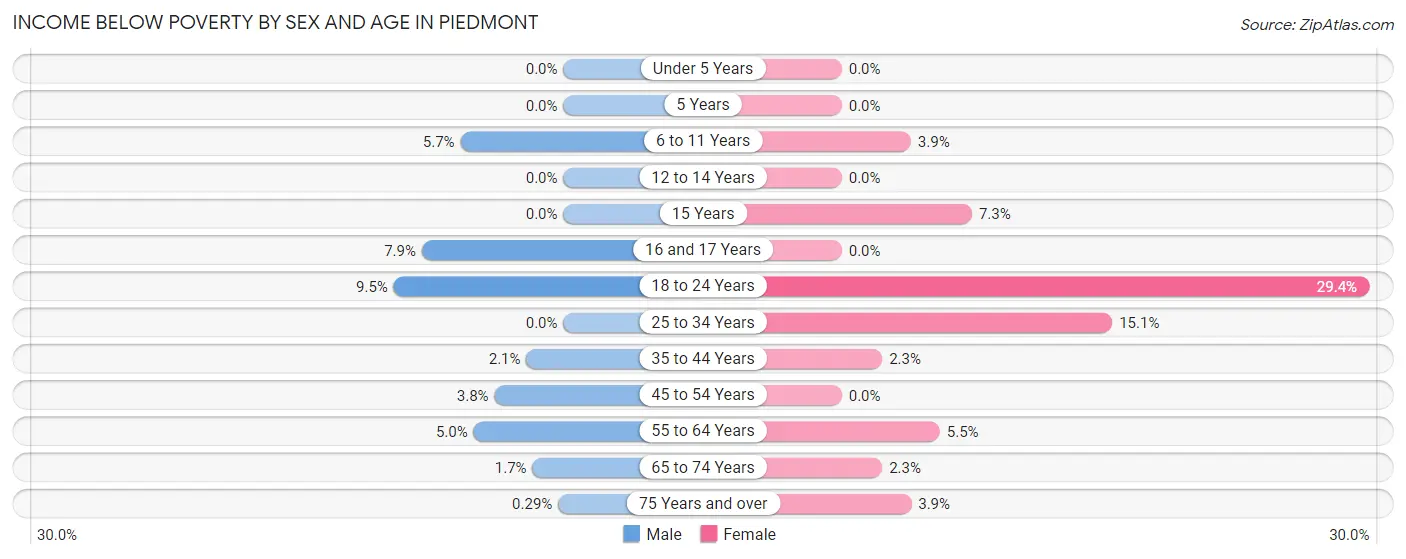
| Age Bracket | Male | Female |
| Under 5 Years | 0 (0.0%) | 0 (0.0%) |
| 5 Years | 0 (0.0%) | 0 (0.0%) |
| 6 to 11 Years | 36 (5.7%) | 19 (3.8%) |
| 12 to 14 Years | 0 (0.0%) | 0 (0.0%) |
| 15 Years | 0 (0.0%) | 10 (7.2%) |
| 16 and 17 Years | 19 (7.9%) | 0 (0.0%) |
| 18 to 24 Years | 26 (9.5%) | 54 (29.3%) |
| 25 to 34 Years | 0 (0.0%) | 53 (15.1%) |
| 35 to 44 Years | 14 (2.1%) | 17 (2.2%) |
| 45 to 54 Years | 40 (3.8%) | 0 (0.0%) |
| 55 to 64 Years | 25 (5.0%) | 25 (5.5%) |
| 65 to 74 Years | 14 (1.7%) | 19 (2.2%) |
| 75 Years and over | 1 (0.3%) | 22 (3.9%) |
| Total | 175 (3.1%) | 219 (3.9%) |
Income Above Poverty by Sex and Age in Piedmont
According to the poverty statistics in Piedmont, males aged under 5 years and females aged under 5 years are the age groups that are most secure financially, with 100.0% of males and 100.0% of females in these age groups living above the poverty line.
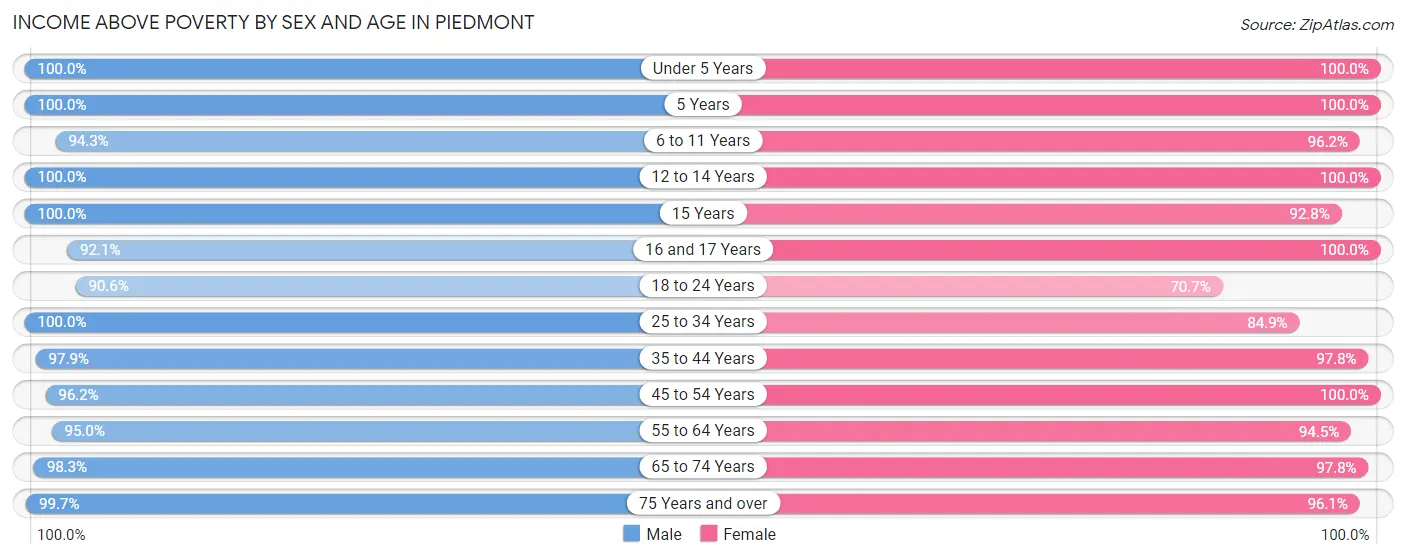
| Age Bracket | Male | Female |
| Under 5 Years | 265 (100.0%) | 365 (100.0%) |
| 5 Years | 64 (100.0%) | 34 (100.0%) |
| 6 to 11 Years | 592 (94.3%) | 475 (96.2%) |
| 12 to 14 Years | 246 (100.0%) | 280 (100.0%) |
| 15 Years | 127 (100.0%) | 128 (92.7%) |
| 16 and 17 Years | 222 (92.1%) | 129 (100.0%) |
| 18 to 24 Years | 249 (90.5%) | 130 (70.7%) |
| 25 to 34 Years | 372 (100.0%) | 299 (84.9%) |
| 35 to 44 Years | 666 (97.9%) | 739 (97.8%) |
| 45 to 54 Years | 1,003 (96.2%) | 949 (100.0%) |
| 55 to 64 Years | 475 (95.0%) | 433 (94.5%) |
| 65 to 74 Years | 802 (98.3%) | 827 (97.8%) |
| 75 Years and over | 349 (99.7%) | 547 (96.1%) |
| Total | 5,432 (96.9%) | 5,335 (96.1%) |
Income Below Poverty Among Married-Couple Families in Piedmont
The poverty statistics for married-couple families in Piedmont show that 1.5% or 42 of the total 2,764 families live below the poverty line. Families with 3 or 4 children have the highest poverty rate of 8.8%, comprising of 17 families. On the other hand, families with 1 or 2 children have the lowest poverty rate of 0.0%, which includes 0 families.
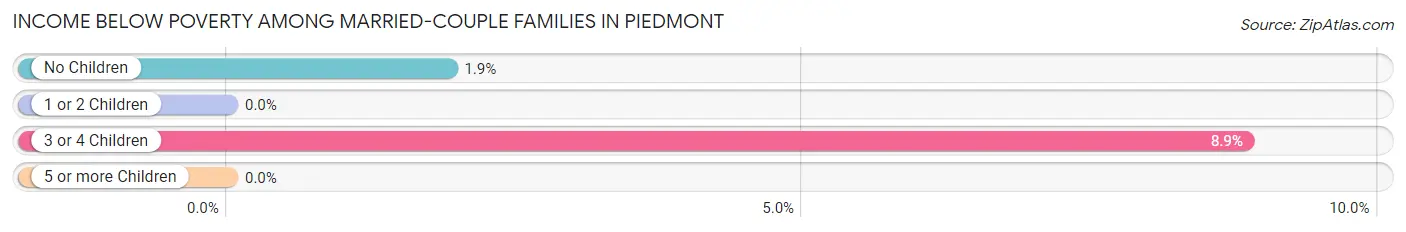
| Children | Above Poverty | Below Poverty |
| No Children | 1,286 (98.1%) | 25 (1.9%) |
| 1 or 2 Children | 1,261 (100.0%) | 0 (0.0%) |
| 3 or 4 Children | 175 (91.1%) | 17 (8.8%) |
| 5 or more Children | 0 (0.0%) | 0 (0.0%) |
| Total | 2,722 (98.5%) | 42 (1.5%) |
Income Below Poverty Among Single-Parent Households in Piedmont
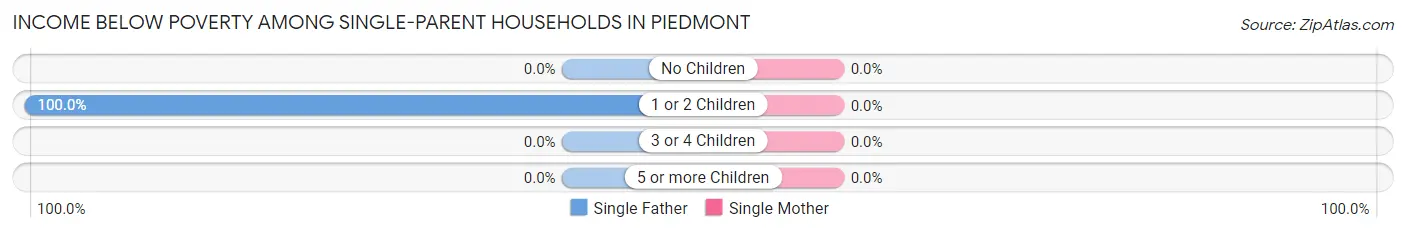
| Children | Single Father | Single Mother |
| No Children | 0 (0.0%) | 0 (0.0%) |
| 1 or 2 Children | 21 (100.0%) | 0 (0.0%) |
| 3 or 4 Children | 0 (0.0%) | 0 (0.0%) |
| 5 or more Children | 0 (0.0%) | 0 (0.0%) |
| Total | 21 (23.3%) | 0 (0.0%) |
Income Below Poverty Among Married-Couple vs Single-Parent Households in Piedmont
The poverty data for Piedmont shows that 42 of the married-couple family households (1.5%) and 21 of the single-parent households (7.6%) are living below the poverty level. Within the married-couple family households, those with 3 or 4 children have the highest poverty rate, with 17 households (8.8%) falling below the poverty line. Among the single-parent households, those with 1 or 2 children have the highest poverty rate, with 21 household (22.1%) living below poverty.
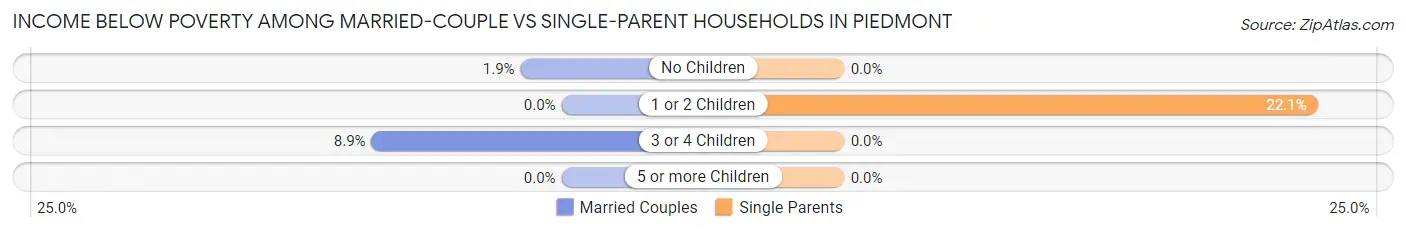
| Children | Married-Couple Families | Single-Parent Households |
| No Children | 25 (1.9%) | 0 (0.0%) |
| 1 or 2 Children | 0 (0.0%) | 21 (22.1%) |
| 3 or 4 Children | 17 (8.8%) | 0 (0.0%) |
| 5 or more Children | 0 (0.0%) | 0 (0.0%) |
| Total | 42 (1.5%) | 21 (7.6%) |
Race in Piedmont
The most populous races in Piedmont are White / Caucasian (7,878 | 70.6%), Asian (2,415 | 21.6%), and Two or more Races (720 | 6.5%).
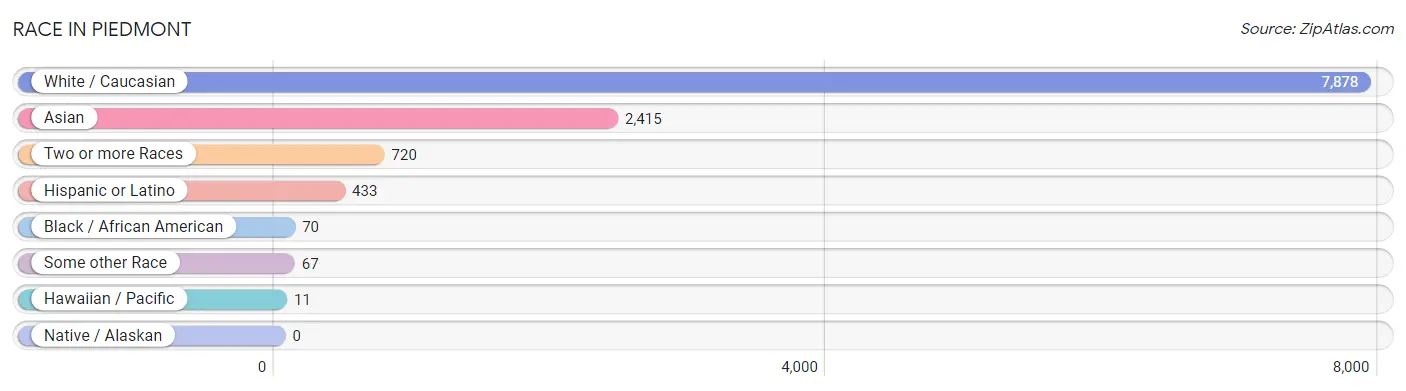
| Race | # Population | % Population |
| Asian | 2,415 | 21.6% |
| Black / African American | 70 | 0.6% |
| Hawaiian / Pacific | 11 | 0.1% |
| Hispanic or Latino | 433 | 3.9% |
| Native / Alaskan | 0 | 0.0% |
| White / Caucasian | 7,878 | 70.6% |
| Two or more Races | 720 | 6.5% |
| Some other Race | 67 | 0.6% |
| Total | 11,161 | 100.0% |
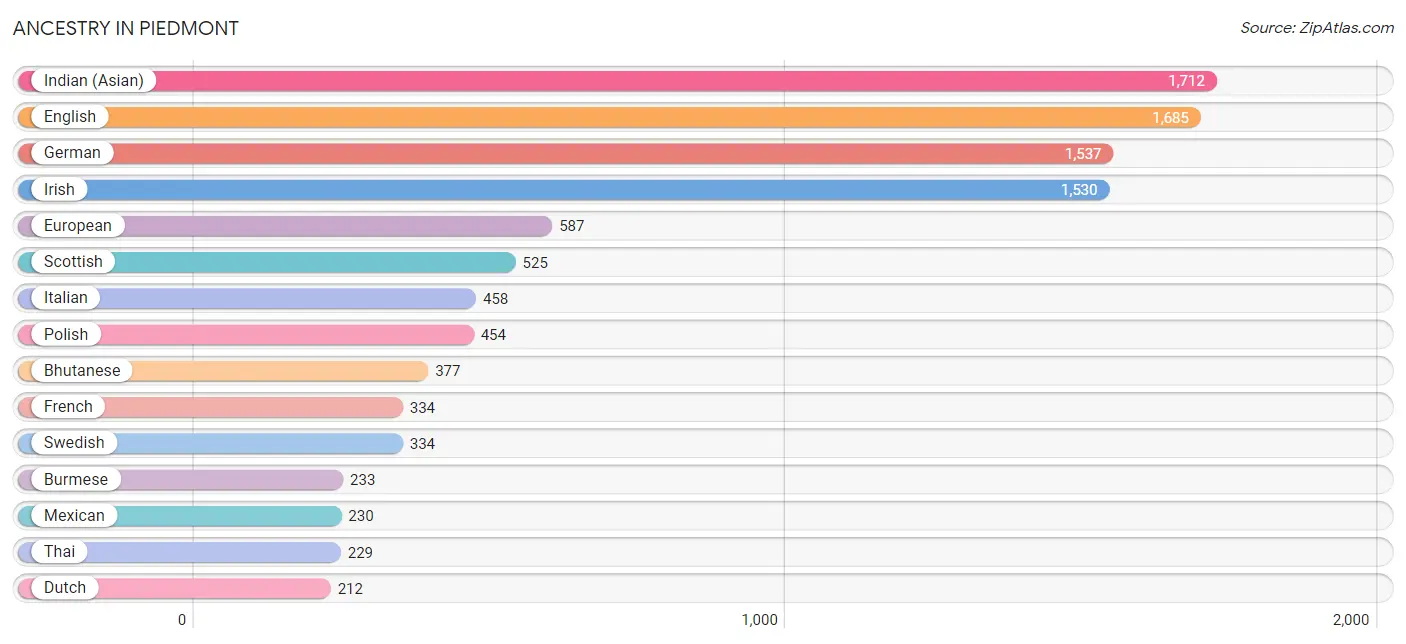
Ancestry in Piedmont
The most populous ancestries reported in Piedmont are Indian (Asian) (1,712 | 15.3%), English (1,685 | 15.1%), German (1,537 | 13.8%), Irish (1,530 | 13.7%), and European (587 | 5.3%), together accounting for 63.2% of all Piedmont residents.
| Ancestry | # Population | % Population |
| Afghan | 83 | 0.7% |
| African | 10 | 0.1% |
| American | 125 | 1.1% |
| Arab | 42 | 0.4% |
| Argentinean | 19 | 0.2% |
| Austrian | 133 | 1.2% |
| Bahamian | 12 | 0.1% |
| Basque | 18 | 0.2% |
| Belgian | 18 | 0.2% |
| Bhutanese | 377 | 3.4% |
| Bolivian | 18 | 0.2% |
| British | 112 | 1.0% |
| Burmese | 233 | 2.1% |
| Cajun | 15 | 0.1% |
| Canadian | 23 | 0.2% |
| Central American | 30 | 0.3% |
| Cherokee | 15 | 0.1% |
| Colombian | 17 | 0.2% |
| Creek | 5 | 0.0% |
| Czech | 20 | 0.2% |
| Danish | 120 | 1.1% |
| Dutch | 212 | 1.9% |
| Eastern European | 105 | 0.9% |
| English | 1,685 | 15.1% |
| European | 587 | 5.3% |
| Filipino | 135 | 1.2% |
| Finnish | 45 | 0.4% |
| French | 334 | 3.0% |
| French Canadian | 57 | 0.5% |
| German | 1,537 | 13.8% |
| Greek | 23 | 0.2% |
| Hungarian | 49 | 0.4% |
| Indian (Asian) | 1,712 | 15.3% |
| Iranian | 18 | 0.2% |
| Irish | 1,530 | 13.7% |
| Italian | 458 | 4.1% |
| Korean | 139 | 1.3% |
| Laotian | 38 | 0.3% |
| Latvian | 83 | 0.7% |
| Lebanese | 19 | 0.2% |
| Lithuanian | 47 | 0.4% |
| Mexican | 230 | 2.1% |
| Native Hawaiian | 11 | 0.1% |
| Nicaraguan | 30 | 0.3% |
| Northern European | 58 | 0.5% |
| Norwegian | 182 | 1.6% |
| Peruvian | 20 | 0.2% |
| Polish | 454 | 4.1% |
| Portuguese | 25 | 0.2% |
| Puerto Rican | 28 | 0.3% |
| Russian | 188 | 1.7% |
| Scandinavian | 18 | 0.2% |
| Scotch-Irish | 97 | 0.9% |
| Scottish | 525 | 4.7% |
| Serbian | 32 | 0.3% |
| Slovak | 13 | 0.1% |
| South American | 74 | 0.7% |
| Spaniard | 46 | 0.4% |
| Spanish | 25 | 0.2% |
| Sri Lankan | 24 | 0.2% |
| Subsaharan African | 10 | 0.1% |
| Swedish | 334 | 3.0% |
| Swiss | 67 | 0.6% |
| Thai | 229 | 2.1% |
| Turkish | 3 | 0.0% |
| Ukrainian | 113 | 1.0% |
| Welsh | 102 | 0.9% |
| Yugoslavian | 38 | 0.3% | View All 68 Rows |
Immigrants in Piedmont
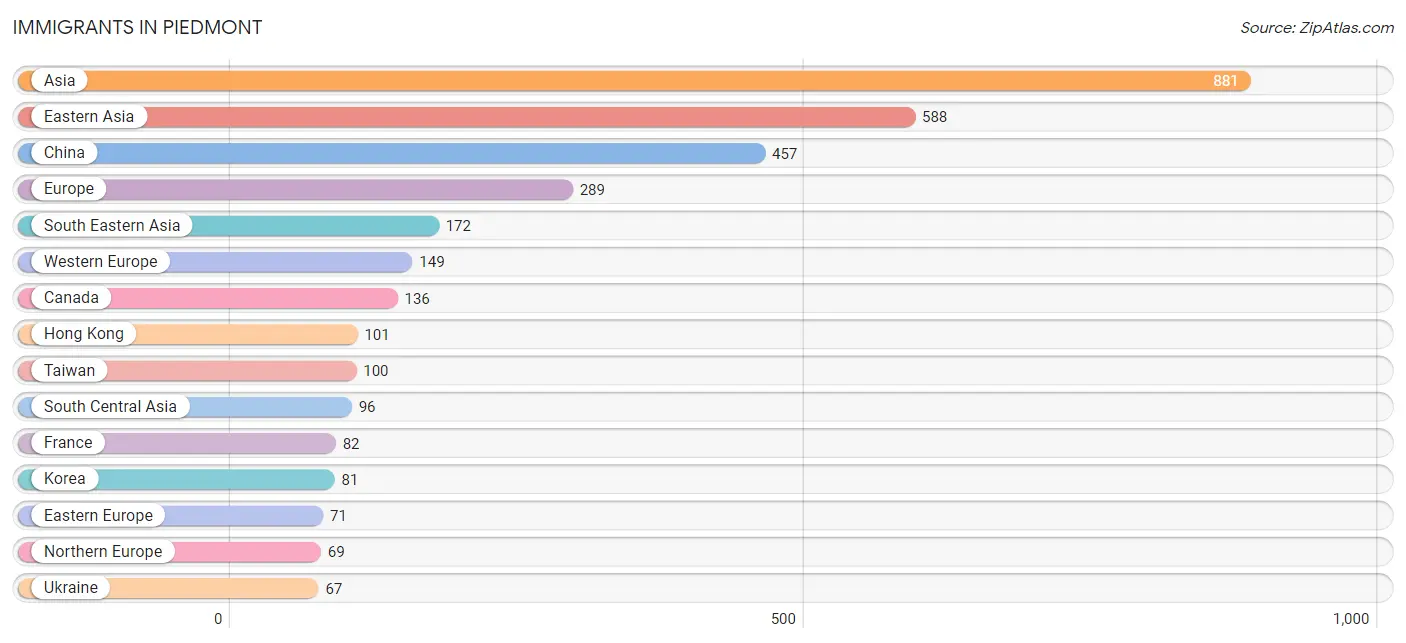
The most numerous immigrant groups reported in Piedmont came from Asia (881 | 7.9%), Eastern Asia (588 | 5.3%), China (457 | 4.1%), Europe (289 | 2.6%), and South Eastern Asia (172 | 1.5%), together accounting for 21.4% of all Piedmont residents.
| Immigration Origin | # Population | % Population |
| Afghanistan | 58 | 0.5% |
| Argentina | 17 | 0.2% |
| Asia | 881 | 7.9% |
| Australia | 20 | 0.2% |
| Belgium | 9 | 0.1% |
| Canada | 136 | 1.2% |
| Central America | 9 | 0.1% |
| China | 457 | 4.1% |
| Czechoslovakia | 4 | 0.0% |
| Eastern Asia | 588 | 5.3% |
| Eastern Europe | 71 | 0.6% |
| England | 47 | 0.4% |
| Europe | 289 | 2.6% |
| France | 82 | 0.7% |
| Germany | 38 | 0.3% |
| Hong Kong | 101 | 0.9% |
| India | 38 | 0.3% |
| Indonesia | 46 | 0.4% |
| Israel | 25 | 0.2% |
| Japan | 50 | 0.4% |
| Korea | 81 | 0.7% |
| Latin America | 46 | 0.4% |
| Mexico | 9 | 0.1% |
| Netherlands | 20 | 0.2% |
| Northern Europe | 69 | 0.6% |
| Oceania | 20 | 0.2% |
| Philippines | 53 | 0.5% |
| Singapore | 9 | 0.1% |
| South America | 37 | 0.3% |
| South Central Asia | 96 | 0.9% |
| South Eastern Asia | 172 | 1.5% |
| Taiwan | 100 | 0.9% |
| Ukraine | 67 | 0.6% |
| Venezuela | 20 | 0.2% |
| Vietnam | 64 | 0.6% |
| Western Asia | 25 | 0.2% |
| Western Europe | 149 | 1.3% | View All 37 Rows |
Sex and Age in Piedmont
Sex and Age in Piedmont
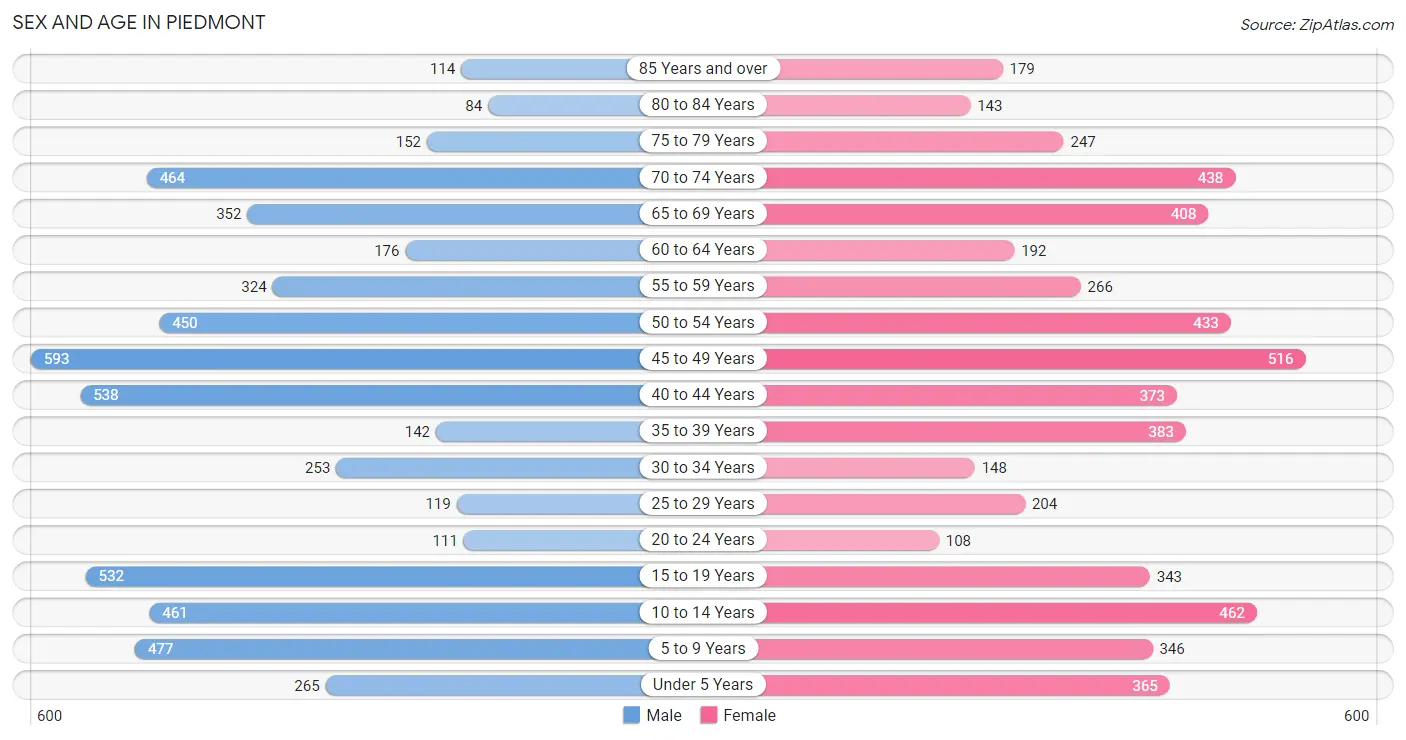
The most populous age groups in Piedmont are 45 to 49 Years (593 | 10.6%) for men and 45 to 49 Years (516 | 9.3%) for women.
| Age Bracket | Male | Female |
| Under 5 Years | 265 (4.7%) | 365 (6.6%) |
| 5 to 9 Years | 477 (8.5%) | 346 (6.2%) |
| 10 to 14 Years | 461 (8.2%) | 462 (8.3%) |
| 15 to 19 Years | 532 (9.5%) | 343 (6.2%) |
| 20 to 24 Years | 111 (2.0%) | 108 (1.9%) |
| 25 to 29 Years | 119 (2.1%) | 204 (3.7%) |
| 30 to 34 Years | 253 (4.5%) | 148 (2.7%) |
| 35 to 39 Years | 142 (2.5%) | 383 (6.9%) |
| 40 to 44 Years | 538 (9.6%) | 373 (6.7%) |
| 45 to 49 Years | 593 (10.6%) | 516 (9.3%) |
| 50 to 54 Years | 450 (8.0%) | 433 (7.8%) |
| 55 to 59 Years | 324 (5.8%) | 266 (4.8%) |
| 60 to 64 Years | 176 (3.1%) | 192 (3.5%) |
| 65 to 69 Years | 352 (6.3%) | 408 (7.3%) |
| 70 to 74 Years | 464 (8.3%) | 438 (7.9%) |
| 75 to 79 Years | 152 (2.7%) | 247 (4.4%) |
| 80 to 84 Years | 84 (1.5%) | 143 (2.6%) |
| 85 Years and over | 114 (2.0%) | 179 (3.2%) |
| Total | 5,607 (100.0%) | 5,554 (100.0%) |
Families and Households in Piedmont
Median Family Size in Piedmont
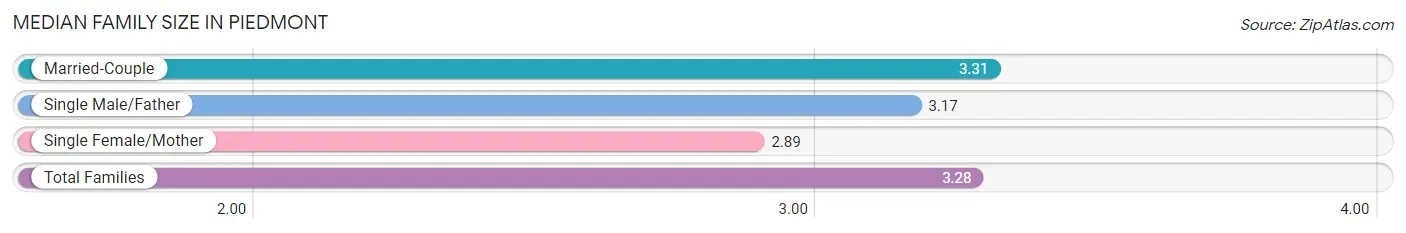
The median family size in Piedmont is 3.28 persons per family, with married-couple families (2,764 | 90.9%) accounting for the largest median family size of 3.31 persons per family. On the other hand, single female/mother families (185 | 6.1%) represent the smallest median family size with 2.89 persons per family.
| Family Type | # Families | Family Size |
| Married-Couple | 2,764 (90.9%) | 3.31 |
| Single Male/Father | 90 (3.0%) | 3.17 |
| Single Female/Mother | 185 (6.1%) | 2.89 |
| Total Families | 3,039 (100.0%) | 3.28 |
Median Household Size in Piedmont
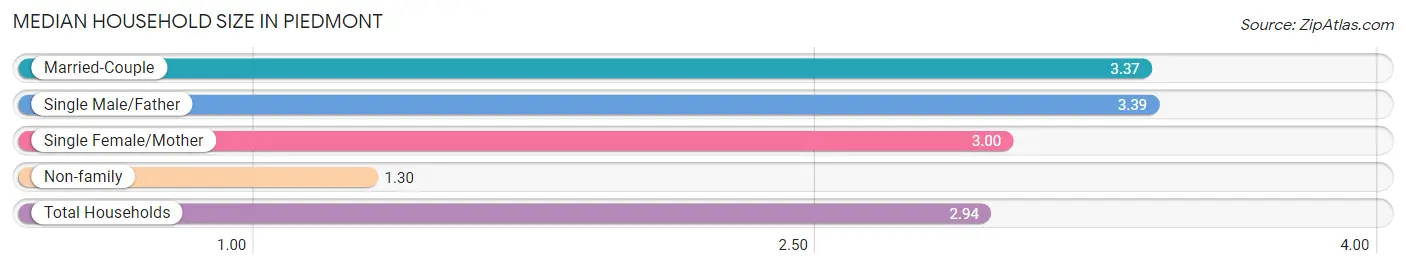
The median household size in Piedmont is 2.94 persons per household, with single male/father households (90 | 2.4%) accounting for the largest median household size of 3.39 persons per household. non-family households (750 | 19.8%) represent the smallest median household size with 1.30 persons per household.
| Household Type | # Households | Household Size |
| Married-Couple | 2,764 (73.0%) | 3.37 |
| Single Male/Father | 90 (2.4%) | 3.39 |
| Single Female/Mother | 185 (4.9%) | 3.00 |
| Non-family | 750 (19.8%) | 1.30 |
| Total Households | 3,789 (100.0%) | 2.94 |
Household Size by Marriage Status in Piedmont
Out of a total of 3,789 households in Piedmont, 3,039 (80.2%) are family households, while 750 (19.8%) are nonfamily households. The most numerous type of family households are 2-person households, comprising 1,093, and the most common type of nonfamily households are 1-person households, comprising 601.
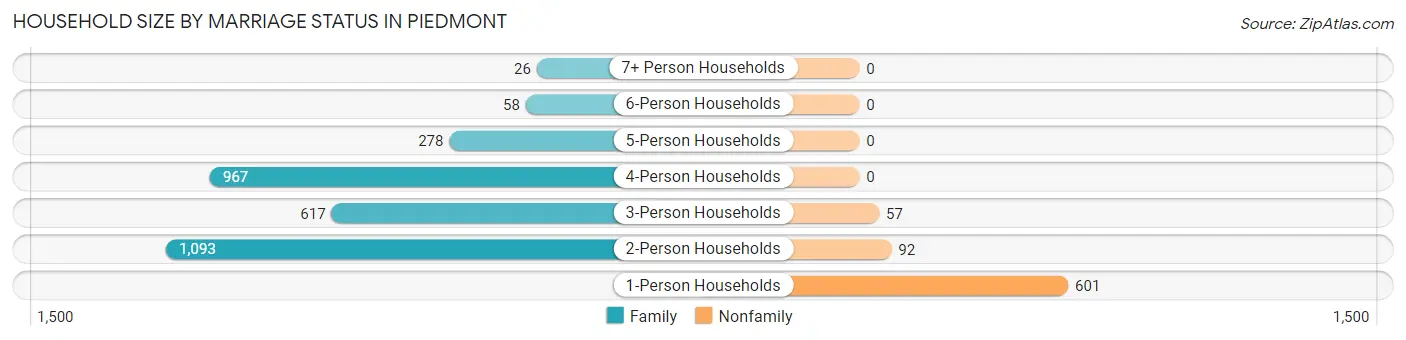
| Household Size | Family Households | Nonfamily Households |
| 1-Person Households | - | 601 (15.9%) |
| 2-Person Households | 1,093 (28.8%) | 92 (2.4%) |
| 3-Person Households | 617 (16.3%) | 57 (1.5%) |
| 4-Person Households | 967 (25.5%) | 0 (0.0%) |
| 5-Person Households | 278 (7.3%) | 0 (0.0%) |
| 6-Person Households | 58 (1.5%) | 0 (0.0%) |
| 7+ Person Households | 26 (0.7%) | 0 (0.0%) |
| Total | 3,039 (80.2%) | 750 (19.8%) |
Female Fertility in Piedmont
Fertility by Age in Piedmont
Average fertility rate in Piedmont is 53.0 births per 1,000 women. Women in the age bracket of 35 to 50 years have the highest fertility rate with 72.0 births per 1,000 women. Women in the age bracket of 35 to 50 years acount for 87.3% of all women with births.
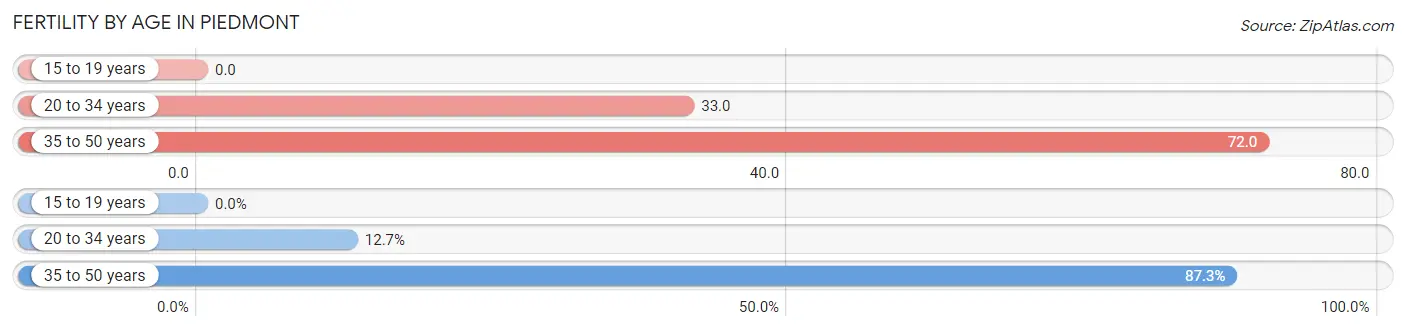
| Age Bracket | Women with Births | Births / 1,000 Women |
| 15 to 19 years | 0 (0.0%) | 0.0 |
| 20 to 34 years | 15 (12.7%) | 33.0 |
| 35 to 50 years | 103 (87.3%) | 72.0 |
| Total | 118 (100.0%) | 53.0 |
Fertility by Age by Marriage Status in Piedmont
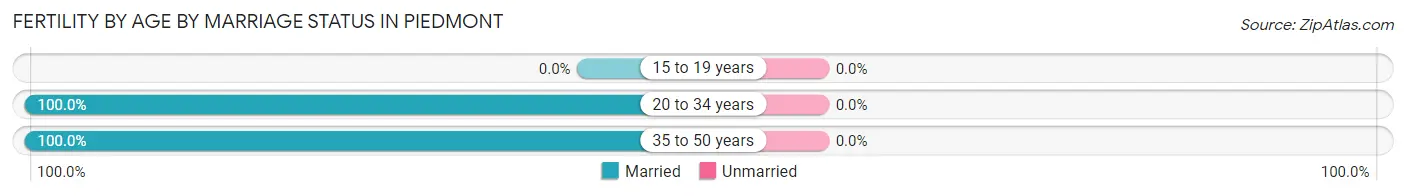
| Age Bracket | Married | Unmarried |
| 15 to 19 years | 0 (0.0%) | 0 (0.0%) |
| 20 to 34 years | 15 (100.0%) | 0 (0.0%) |
| 35 to 50 years | 103 (100.0%) | 0 (0.0%) |
| Total | 118 (100.0%) | 0 (0.0%) |
Fertility by Education in Piedmont
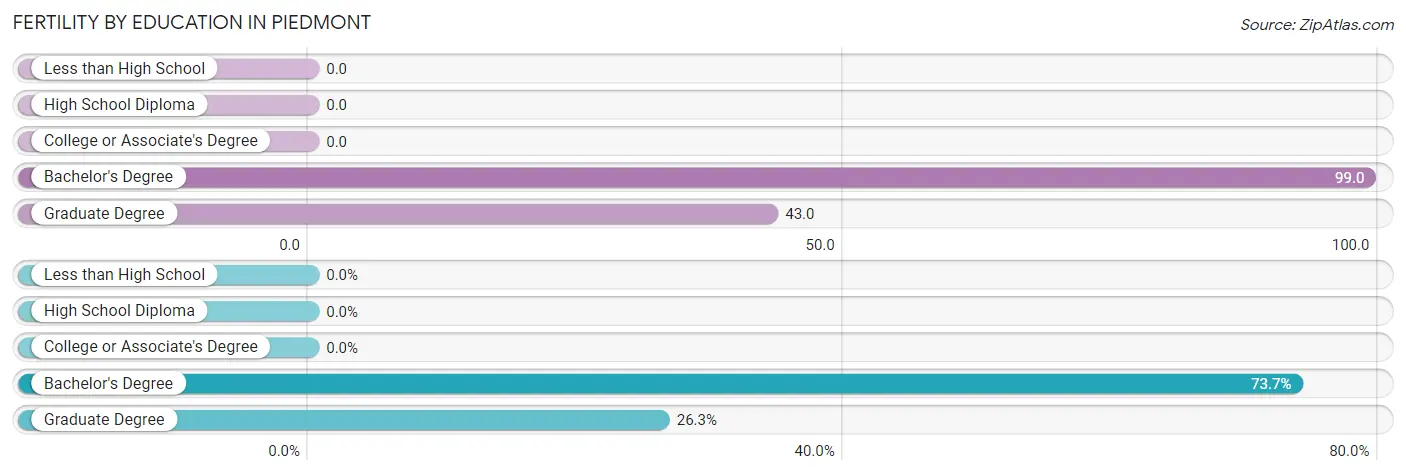
| Educational Attainment | Women with Births | Births / 1,000 Women |
| Less than High School | 0 (0.0%) | 0.0 |
| High School Diploma | 0 (0.0%) | 0.0 |
| College or Associate's Degree | 0 (0.0%) | 0.0 |
| Bachelor's Degree | 87 (73.7%) | 99.0 |
| Graduate Degree | 31 (26.3%) | 43.0 |
| Total | 118 (100.0%) | 53.0 |
Fertility by Education by Marriage Status in Piedmont
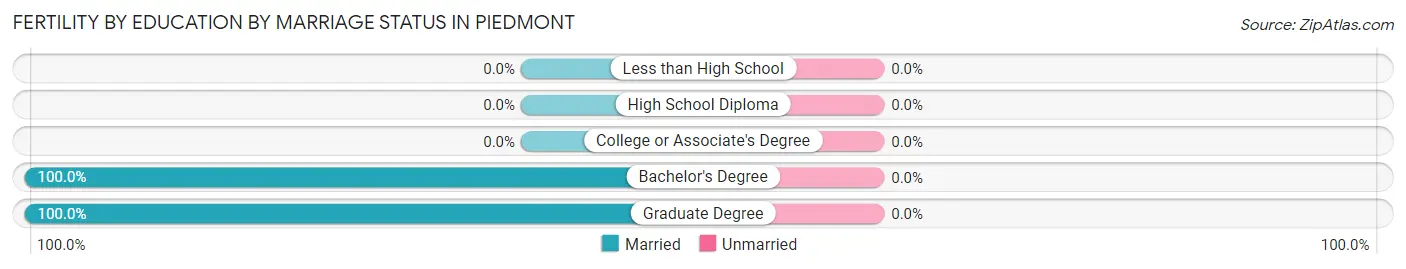
| Educational Attainment | Married | Unmarried |
| Less than High School | 0 (0.0%) | 0 (0.0%) |
| High School Diploma | 0 (0.0%) | 0 (0.0%) |
| College or Associate's Degree | 0 (0.0%) | 0 (0.0%) |
| Bachelor's Degree | 87 (100.0%) | 0 (0.0%) |
| Graduate Degree | 31 (100.0%) | 0 (0.0%) |
| Total | 118 (100.0%) | 0 (0.0%) |
Employment Characteristics in Piedmont
Employment by Class of Employer in Piedmont
Among the 5,074 employed individuals in Piedmont, private company employees (2,969 | 58.5%), not-for-profit organizations (591 | 11.7%), and self-employed (not incorporated) (515 | 10.2%) make up the most common classes of employment.
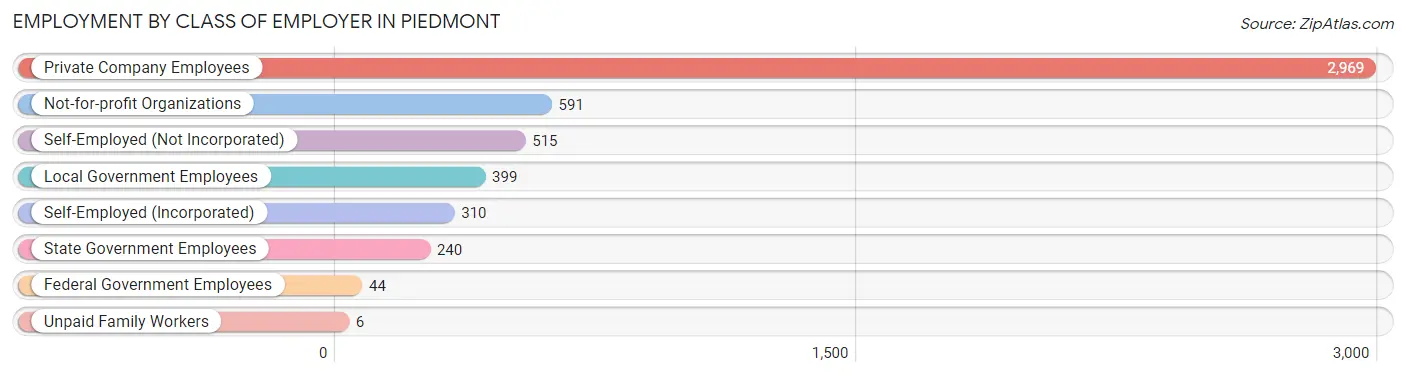
| Employer Class | # Employees | % Employees |
| Private Company Employees | 2,969 | 58.5% |
| Self-Employed (Incorporated) | 310 | 6.1% |
| Self-Employed (Not Incorporated) | 515 | 10.2% |
| Not-for-profit Organizations | 591 | 11.7% |
| Local Government Employees | 399 | 7.9% |
| State Government Employees | 240 | 4.7% |
| Federal Government Employees | 44 | 0.9% |
| Unpaid Family Workers | 6 | 0.1% |
| Total | 5,074 | 100.0% |
Employment Status by Age in Piedmont
According to the labor force statistics for Piedmont, out of the total population over 16 years of age (8,520), 63.9% or 5,444 individuals are in the labor force, with 5.0% or 272 of them unemployed. The age group with the highest labor force participation rate is 35 to 44 years, with 93.0% or 1,335 individuals in the labor force. Within the labor force, the 20 to 24 years age range has the highest percentage of unemployed individuals, with 53.4% or 79 of them being unemployed.
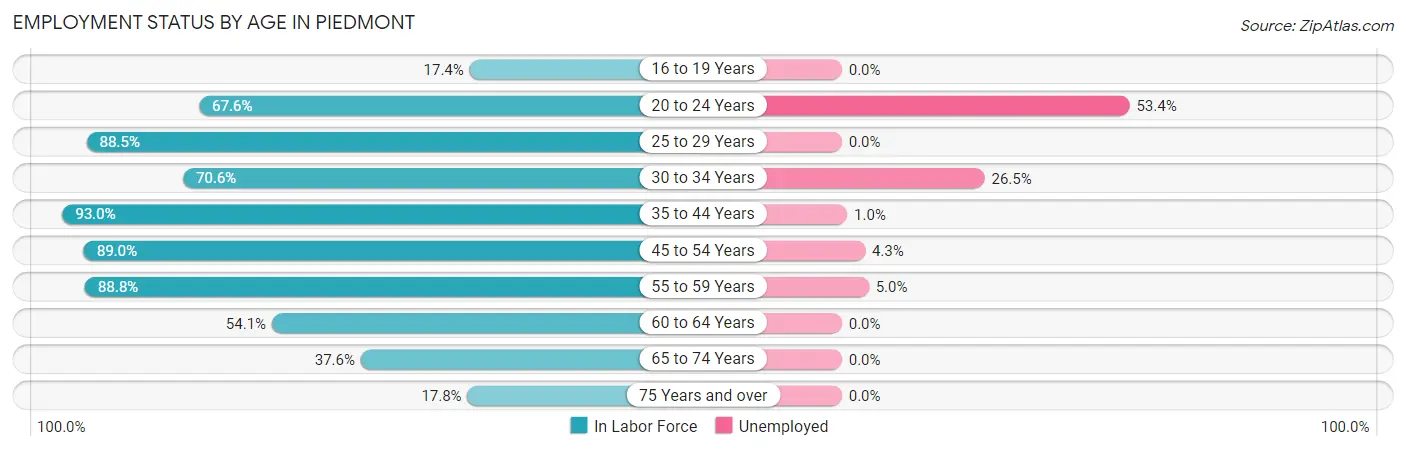
| Age Bracket | In Labor Force | Unemployed |
| 16 to 19 Years | 106 (17.4%) | 0 (0.0%) |
| 20 to 24 Years | 148 (67.6%) | 79 (53.4%) |
| 25 to 29 Years | 286 (88.5%) | 0 (0.0%) |
| 30 to 34 Years | 283 (70.6%) | 75 (26.5%) |
| 35 to 44 Years | 1,335 (93.0%) | 13 (1.0%) |
| 45 to 54 Years | 1,773 (89.0%) | 76 (4.3%) |
| 55 to 59 Years | 524 (88.8%) | 26 (5.0%) |
| 60 to 64 Years | 199 (54.1%) | 0 (0.0%) |
| 65 to 74 Years | 625 (37.6%) | 0 (0.0%) |
| 75 Years and over | 164 (17.8%) | 0 (0.0%) |
| Total | 5,444 (63.9%) | 272 (5.0%) |
Employment Status by Educational Attainment in Piedmont
According to labor force statistics for Piedmont, 86.1% of individuals (4,400) out of the total population between 25 and 64 years of age (5,110) are in the labor force, with 4.3% or 189 of them being unemployed. The group with the highest labor force participation rate are those with the educational attainment of less than high school, with 100.0% or 25 individuals in the labor force. Within the labor force, individuals with bachelor's degree or higher education have the highest percentage of unemployment, with 4.6% or 175 of them being unemployed.
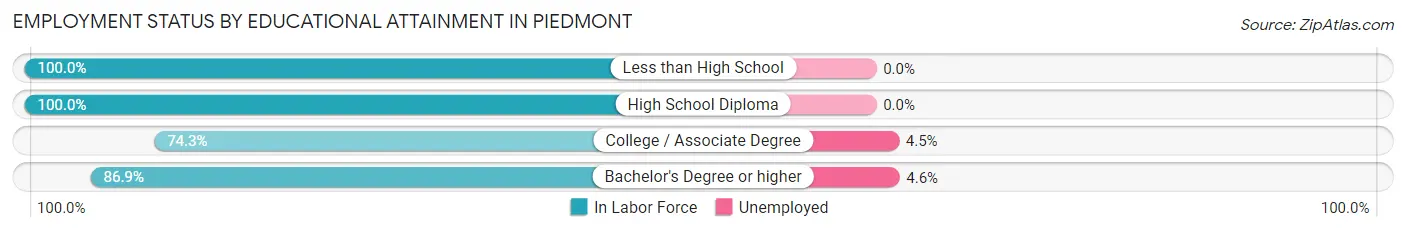
| Educational Attainment | In Labor Force | Unemployed |
| Less than High School | 25 (100.0%) | 0 (0.0%) |
| High School Diploma | 178 (100.0%) | 0 (0.0%) |
| College / Associate Degree | 397 (74.3%) | 24 (4.5%) |
| Bachelor's Degree or higher | 3,800 (86.9%) | 201 (4.6%) |
| Total | 4,400 (86.1%) | 220 (4.3%) |
Employment Occupations by Sex in Piedmont
Management, Business, Science and Arts Occupations
The most common Management, Business, Science and Arts occupations in Piedmont are Community & Social Service (1,152 | 22.3%), Management (1,136 | 22.0%), Business & Financial (627 | 12.1%), Health Diagnosing & Treating (455 | 8.8%), and Legal Services & Support (412 | 8.0%).
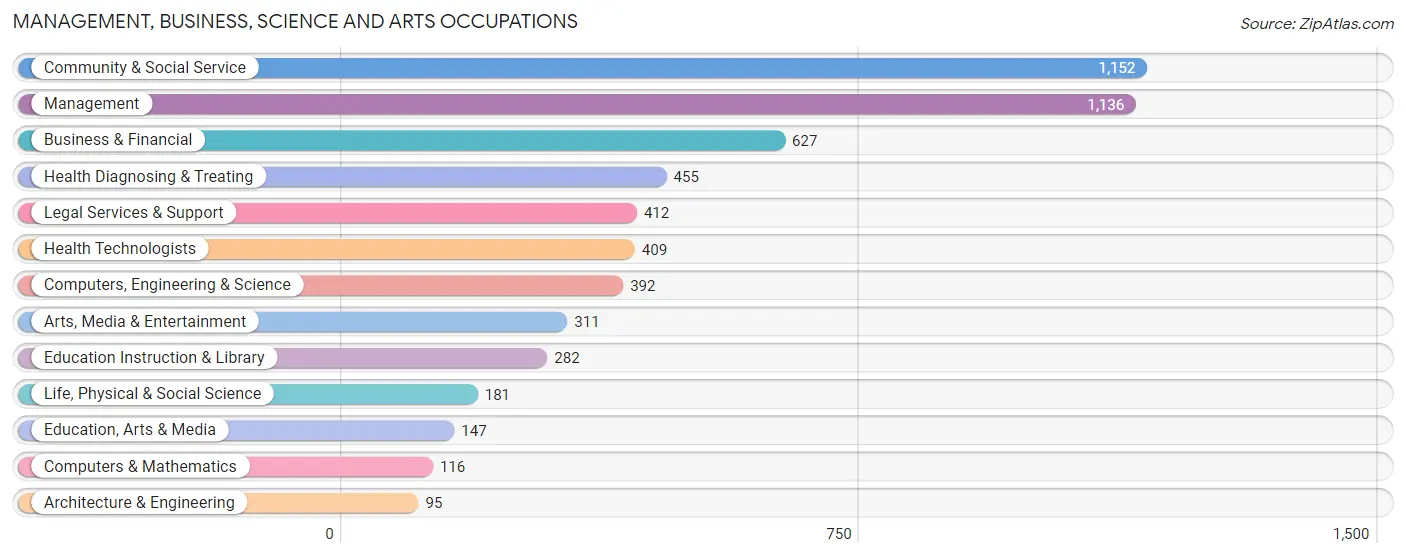
Management, Business, Science and Arts Occupations by Sex
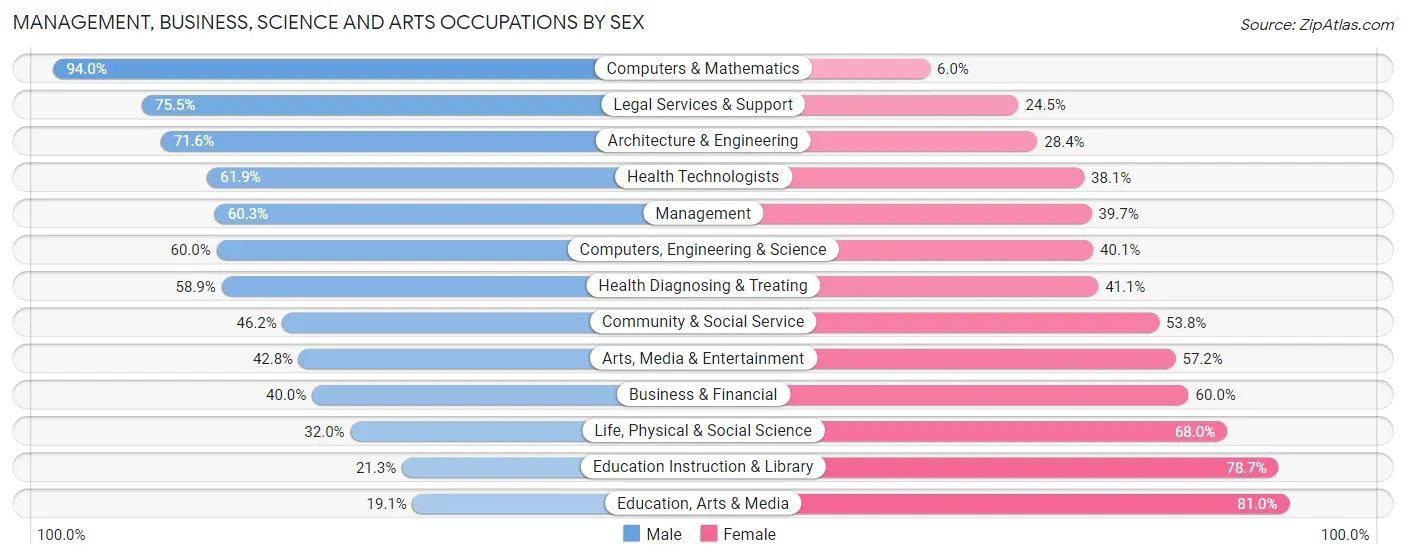
Within the Management, Business, Science and Arts occupations in Piedmont, the most male-oriented occupations are Computers & Mathematics (94.0%), Legal Services & Support (75.5%), and Architecture & Engineering (71.6%), while the most female-oriented occupations are Education, Arts & Media (80.9%), Education Instruction & Library (78.7%), and Life, Physical & Social Science (68.0%).
| Occupation | Male | Female |
| Management | 685 (60.3%) | 451 (39.7%) |
| Business & Financial | 251 (40.0%) | 376 (60.0%) |
| Computers, Engineering & Science | 235 (60.0%) | 157 (40.1%) |
| Computers & Mathematics | 109 (94.0%) | 7 (6.0%) |
| Architecture & Engineering | 68 (71.6%) | 27 (28.4%) |
| Life, Physical & Social Science | 58 (32.0%) | 123 (68.0%) |
| Community & Social Service | 532 (46.2%) | 620 (53.8%) |
| Education, Arts & Media | 28 (19.1%) | 119 (80.9%) |
| Legal Services & Support | 311 (75.5%) | 101 (24.5%) |
| Education Instruction & Library | 60 (21.3%) | 222 (78.7%) |
| Arts, Media & Entertainment | 133 (42.8%) | 178 (57.2%) |
| Health Diagnosing & Treating | 268 (58.9%) | 187 (41.1%) |
| Health Technologists | 253 (61.9%) | 156 (38.1%) |
| Total (Category) | 1,971 (52.4%) | 1,791 (47.6%) |
| Total (Overall) | 2,709 (52.4%) | 2,465 (47.6%) |
Services Occupations
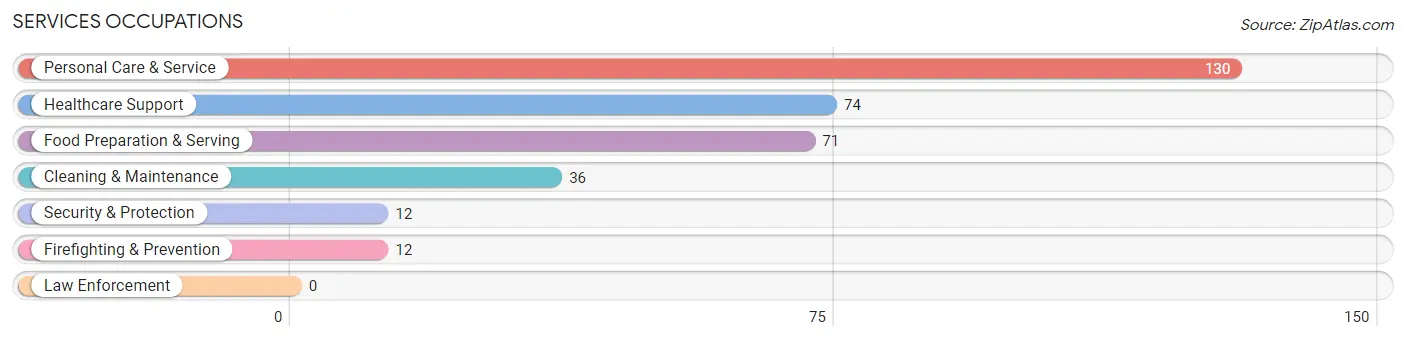
The most common Services occupations in Piedmont are Personal Care & Service (130 | 2.5%), Healthcare Support (74 | 1.4%), Food Preparation & Serving (71 | 1.4%), Cleaning & Maintenance (36 | 0.7%), and Security & Protection (12 | 0.2%).
Services Occupations by Sex
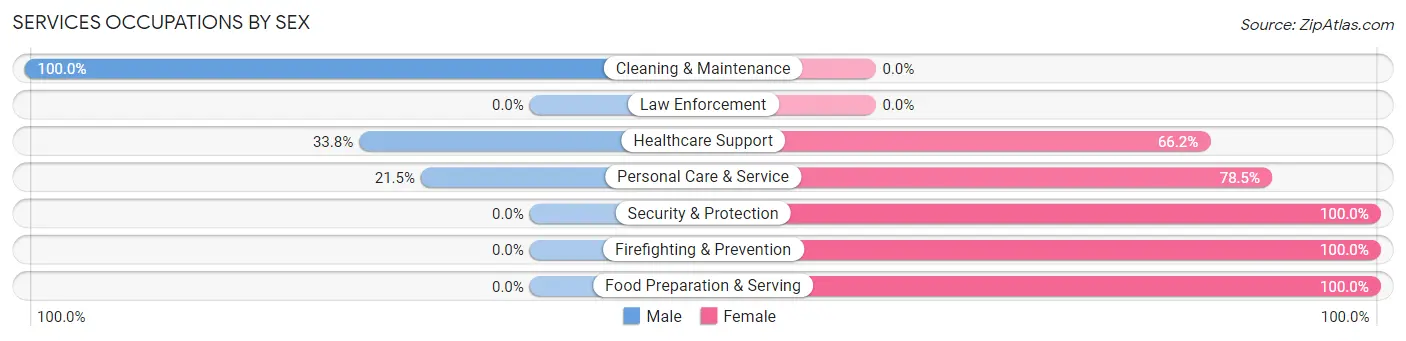
Within the Services occupations in Piedmont, the most male-oriented occupations are Cleaning & Maintenance (100.0%), Healthcare Support (33.8%), and Personal Care & Service (21.5%), while the most female-oriented occupations are Security & Protection (100.0%), Firefighting & Prevention (100.0%), and Food Preparation & Serving (100.0%).
| Occupation | Male | Female |
| Healthcare Support | 25 (33.8%) | 49 (66.2%) |
| Security & Protection | 0 (0.0%) | 12 (100.0%) |
| Firefighting & Prevention | 0 (0.0%) | 12 (100.0%) |
| Law Enforcement | 0 (0.0%) | 0 (0.0%) |
| Food Preparation & Serving | 0 (0.0%) | 71 (100.0%) |
| Cleaning & Maintenance | 36 (100.0%) | 0 (0.0%) |
| Personal Care & Service | 28 (21.5%) | 102 (78.5%) |
| Total (Category) | 89 (27.6%) | 234 (72.5%) |
| Total (Overall) | 2,709 (52.4%) | 2,465 (47.6%) |
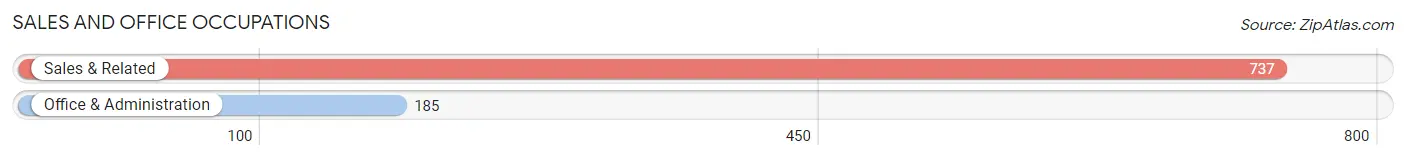
Sales and Office Occupations
The most common Sales and Office occupations in Piedmont are Sales & Related (737 | 14.2%), and Office & Administration (185 | 3.6%).
Sales and Office Occupations by Sex
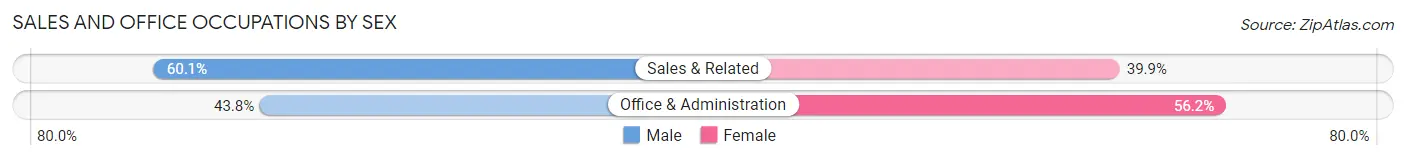
| Occupation | Male | Female |
| Sales & Related | 443 (60.1%) | 294 (39.9%) |
| Office & Administration | 81 (43.8%) | 104 (56.2%) |
| Total (Category) | 524 (56.8%) | 398 (43.2%) |
| Total (Overall) | 2,709 (52.4%) | 2,465 (47.6%) |
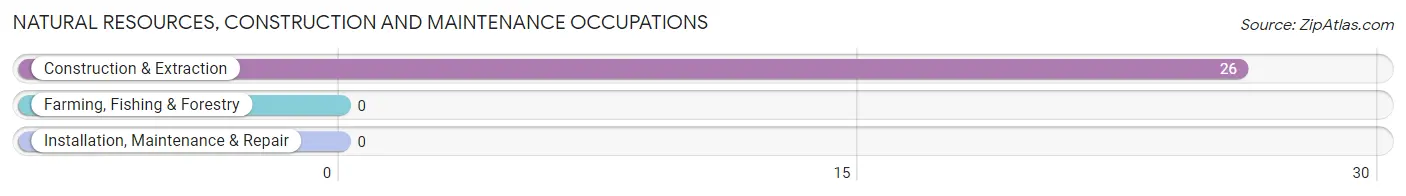
Natural Resources, Construction and Maintenance Occupations
The most common Natural Resources, Construction and Maintenance occupations in Piedmont are , and Construction & Extraction (26 | 0.5%).
Natural Resources, Construction and Maintenance Occupations by Sex
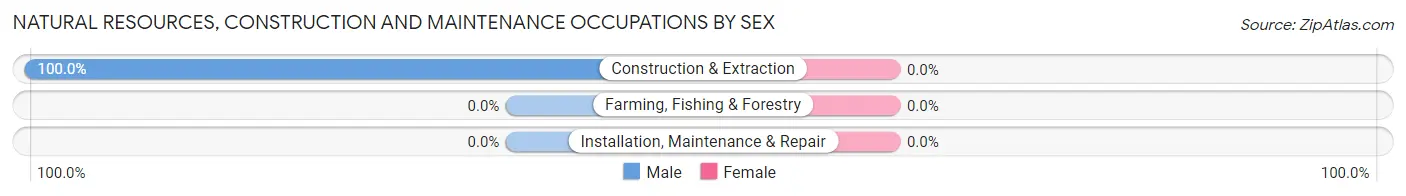
| Occupation | Male | Female |
| Farming, Fishing & Forestry | 0 (0.0%) | 0 (0.0%) |
| Construction & Extraction | 26 (100.0%) | 0 (0.0%) |
| Installation, Maintenance & Repair | 0 (0.0%) | 0 (0.0%) |
| Total (Category) | 26 (100.0%) | 0 (0.0%) |
| Total (Overall) | 2,709 (52.4%) | 2,465 (47.6%) |
Production, Transportation and Moving Occupations
The most common Production, Transportation and Moving occupations in Piedmont are Material Moving (68 | 1.3%), Production (44 | 0.9%), and Transportation (29 | 0.6%).
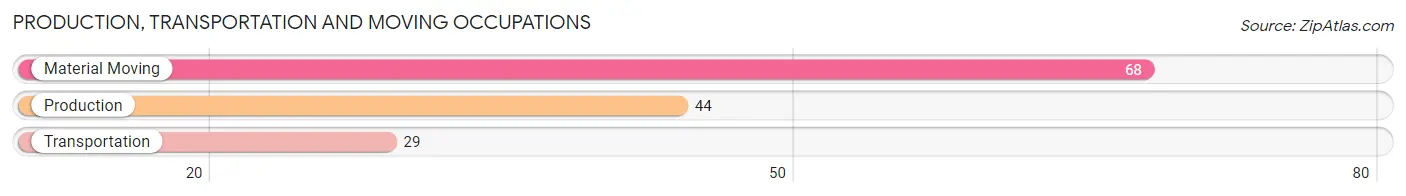
Production, Transportation and Moving Occupations by Sex
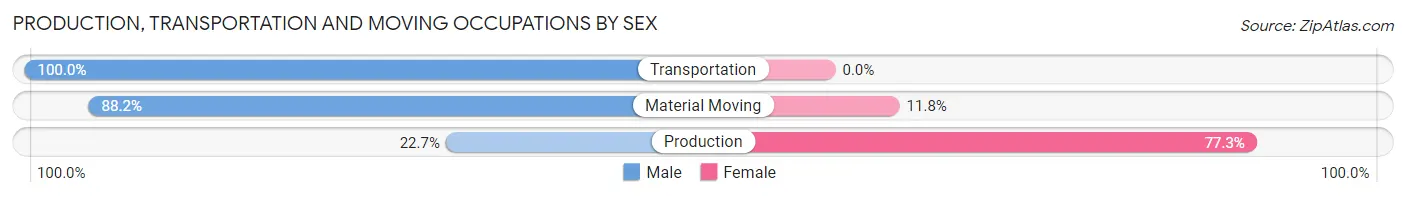
| Occupation | Male | Female |
| Production | 10 (22.7%) | 34 (77.3%) |
| Transportation | 29 (100.0%) | 0 (0.0%) |
| Material Moving | 60 (88.2%) | 8 (11.8%) |
| Total (Category) | 99 (70.2%) | 42 (29.8%) |
| Total (Overall) | 2,709 (52.4%) | 2,465 (47.6%) |
Employment Industries by Sex in Piedmont
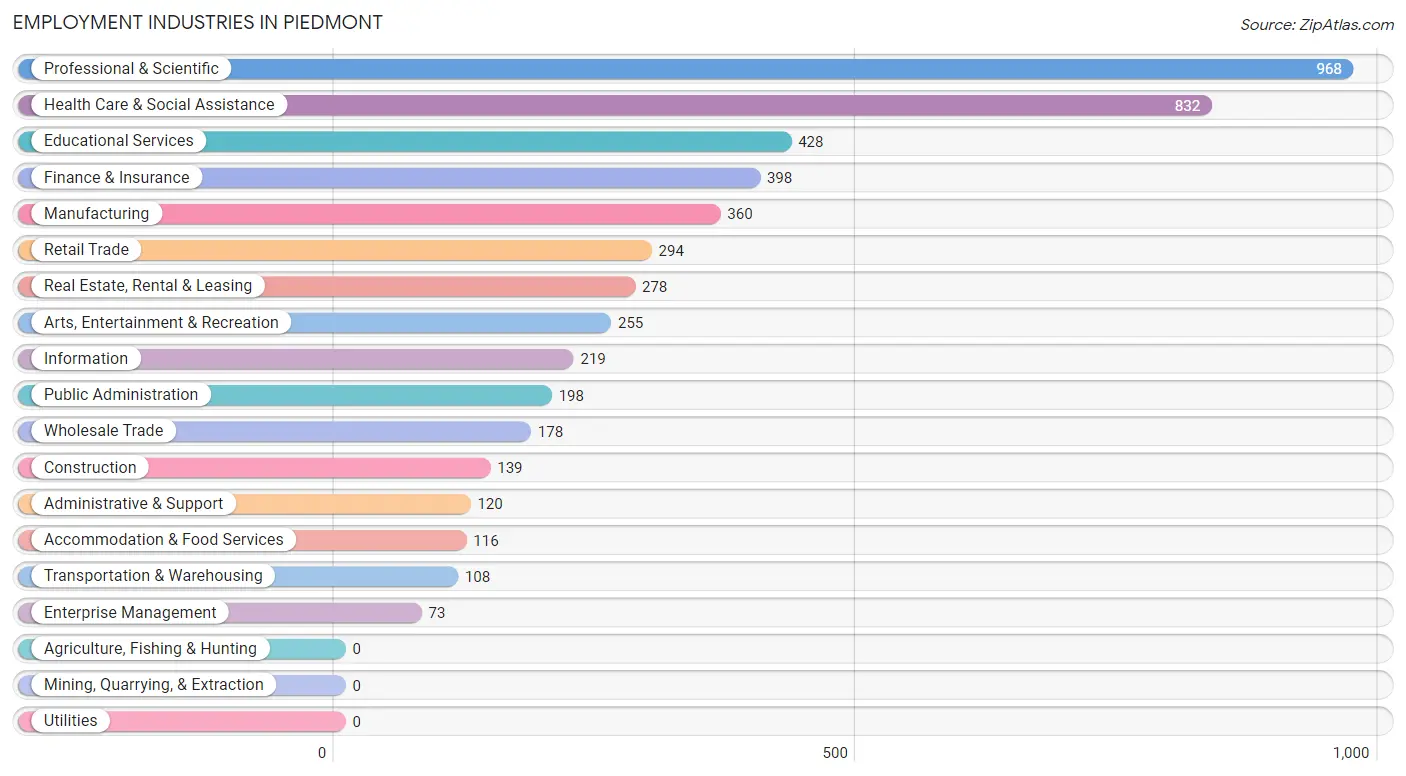
Employment Industries in Piedmont
The major employment industries in Piedmont include Professional & Scientific (968 | 18.7%), Health Care & Social Assistance (832 | 16.1%), Educational Services (428 | 8.3%), Finance & Insurance (398 | 7.7%), and Manufacturing (360 | 7.0%).
Employment Industries by Sex in Piedmont
The Piedmont industries that see more men than women are Finance & Insurance (83.9%), Wholesale Trade (81.5%), and Transportation & Warehousing (77.8%), whereas the industries that tend to have a higher number of women are Enterprise Management (100.0%), Accommodation & Food Services (100.0%), and Educational Services (70.1%).
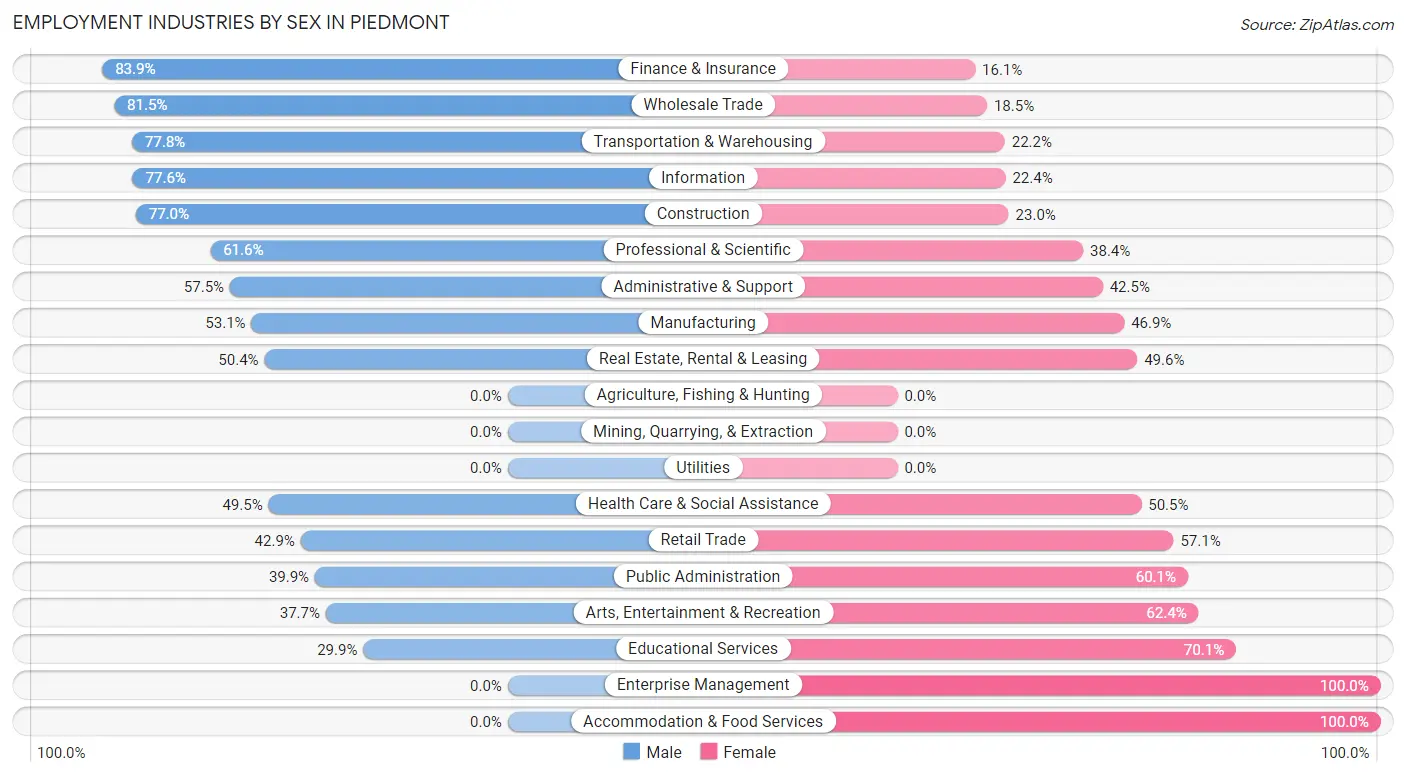
| Industry | Male | Female |
| Agriculture, Fishing & Hunting | 0 (0.0%) | 0 (0.0%) |
| Mining, Quarrying, & Extraction | 0 (0.0%) | 0 (0.0%) |
| Construction | 107 (77.0%) | 32 (23.0%) |
| Manufacturing | 191 (53.1%) | 169 (46.9%) |
| Wholesale Trade | 145 (81.5%) | 33 (18.5%) |
| Retail Trade | 126 (42.9%) | 168 (57.1%) |
| Transportation & Warehousing | 84 (77.8%) | 24 (22.2%) |
| Utilities | 0 (0.0%) | 0 (0.0%) |
| Information | 170 (77.6%) | 49 (22.4%) |
| Finance & Insurance | 334 (83.9%) | 64 (16.1%) |
| Real Estate, Rental & Leasing | 140 (50.4%) | 138 (49.6%) |
| Professional & Scientific | 596 (61.6%) | 372 (38.4%) |
| Enterprise Management | 0 (0.0%) | 73 (100.0%) |
| Administrative & Support | 69 (57.5%) | 51 (42.5%) |
| Educational Services | 128 (29.9%) | 300 (70.1%) |
| Health Care & Social Assistance | 412 (49.5%) | 420 (50.5%) |
| Arts, Entertainment & Recreation | 96 (37.7%) | 159 (62.4%) |
| Accommodation & Food Services | 0 (0.0%) | 116 (100.0%) |
| Public Administration | 79 (39.9%) | 119 (60.1%) |
| Total | 2,709 (52.4%) | 2,465 (47.6%) |
Education in Piedmont
School Enrollment in Piedmont
The most common levels of schooling among the 3,133 students in Piedmont are high school (863 | 27.6%), elementary school (771 | 24.6%), and middle school (729 | 23.3%).
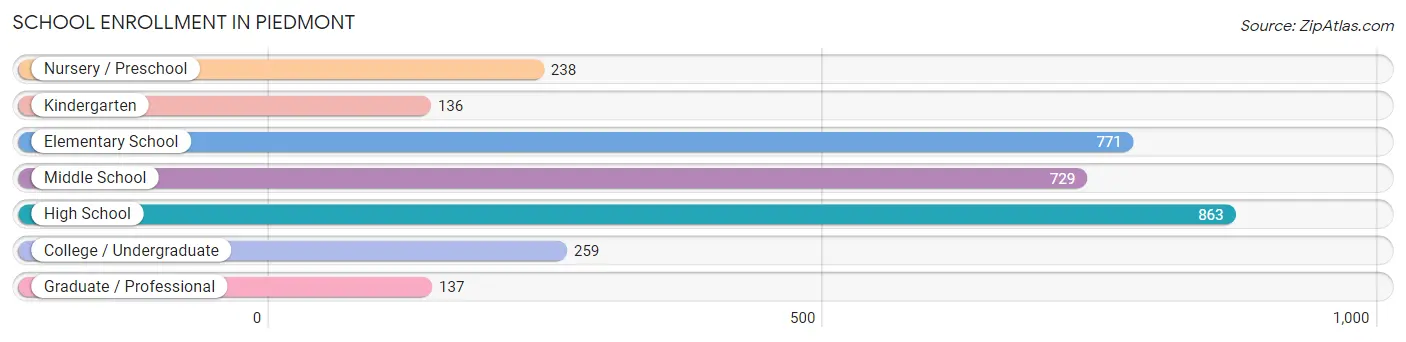
| School Level | # Students | % Students |
| Nursery / Preschool | 238 | 7.6% |
| Kindergarten | 136 | 4.3% |
| Elementary School | 771 | 24.6% |
| Middle School | 729 | 23.3% |
| High School | 863 | 27.6% |
| College / Undergraduate | 259 | 8.3% |
| Graduate / Professional | 137 | 4.4% |
| Total | 3,133 | 100.0% |
School Enrollment by Age by Funding Source in Piedmont
Out of a total of 3,133 students who are enrolled in schools in Piedmont, 489 (15.6%) attend a private institution, while the remaining 2,644 (84.4%) are enrolled in public schools. The age group of 3 to 4 year olds has the highest likelihood of being enrolled in private schools, with 221 (94.4% in the age bracket) enrolled. Conversely, the age group of 5 to 9 year old has the lowest likelihood of being enrolled in a private school, with 809 (99.5% in the age bracket) attending a public institution.
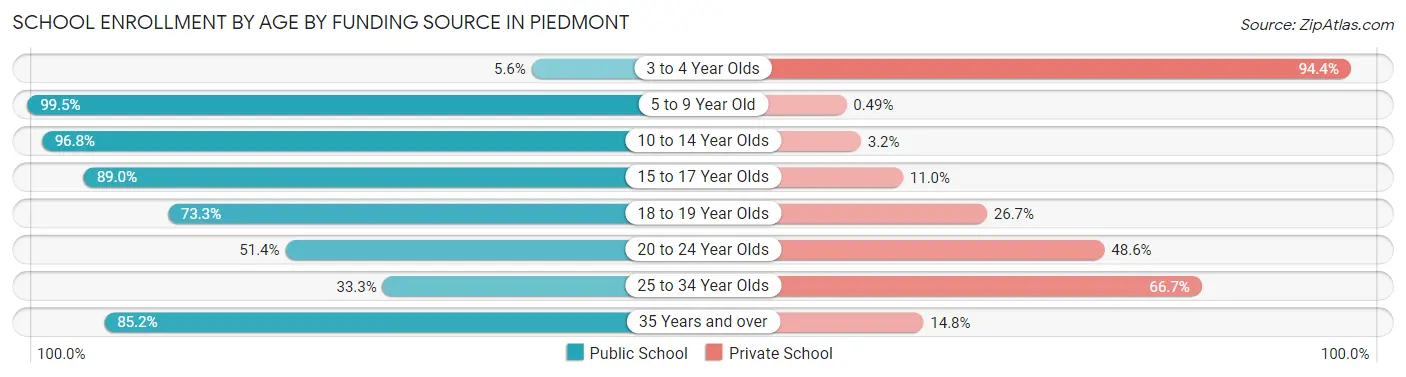
| Age Bracket | Public School | Private School |
| 3 to 4 Year Olds | 13 (5.6%) | 221 (94.4%) |
| 5 to 9 Year Old | 809 (99.5%) | 4 (0.5%) |
| 10 to 14 Year Olds | 880 (96.8%) | 29 (3.2%) |
| 15 to 17 Year Olds | 565 (89.0%) | 70 (11.0%) |
| 18 to 19 Year Olds | 176 (73.3%) | 64 (26.7%) |
| 20 to 24 Year Olds | 54 (51.4%) | 51 (48.6%) |
| 25 to 34 Year Olds | 14 (33.3%) | 28 (66.7%) |
| 35 Years and over | 132 (85.2%) | 23 (14.8%) |
| Total | 2,644 (84.4%) | 489 (15.6%) |
Educational Attainment by Field of Study in Piedmont
Social sciences (1,485 | 20.8%), business (732 | 10.3%), bio, nature & agricultural (672 | 9.4%), psychology (551 | 7.7%), and liberal arts & history (550 | 7.7%) are the most common fields of study among 7,128 individuals in Piedmont who have obtained a bachelor's degree or higher.
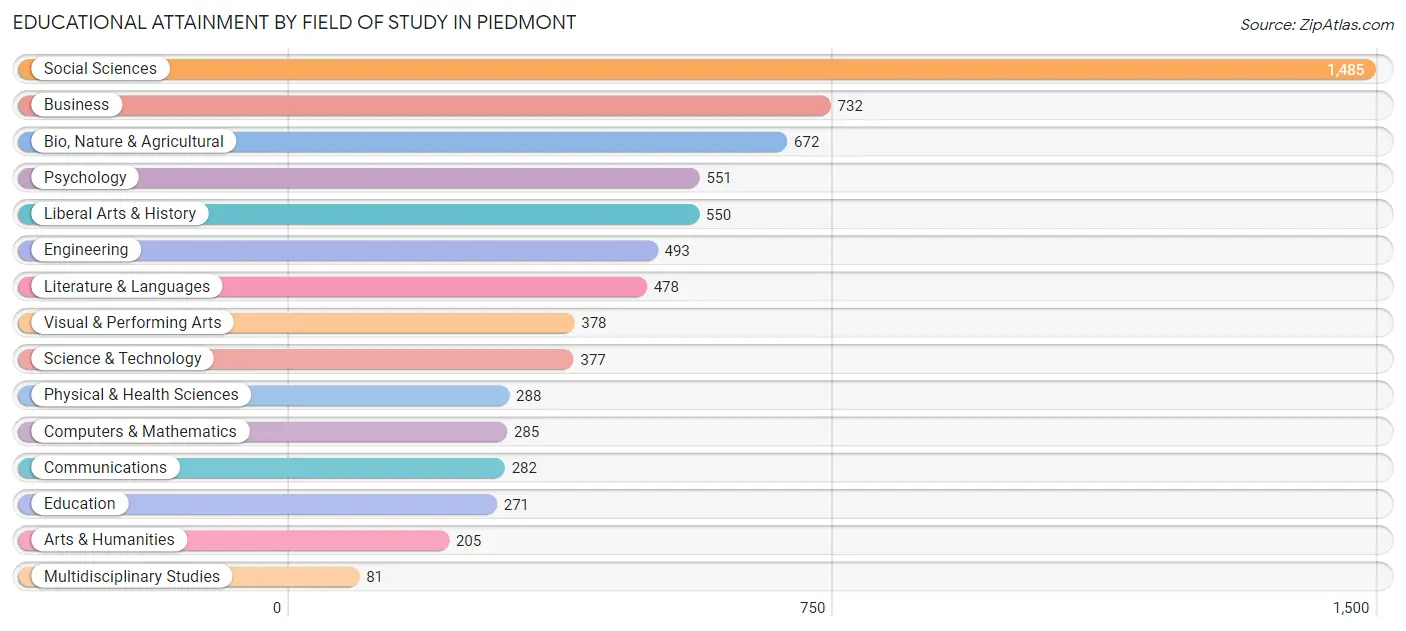
| Field of Study | # Graduates | % Graduates |
| Computers & Mathematics | 285 | 4.0% |
| Bio, Nature & Agricultural | 672 | 9.4% |
| Physical & Health Sciences | 288 | 4.0% |
| Psychology | 551 | 7.7% |
| Social Sciences | 1,485 | 20.8% |
| Engineering | 493 | 6.9% |
| Multidisciplinary Studies | 81 | 1.1% |
| Science & Technology | 377 | 5.3% |
| Business | 732 | 10.3% |
| Education | 271 | 3.8% |
| Literature & Languages | 478 | 6.7% |
| Liberal Arts & History | 550 | 7.7% |
| Visual & Performing Arts | 378 | 5.3% |
| Communications | 282 | 4.0% |
| Arts & Humanities | 205 | 2.9% |
| Total | 7,128 | 100.0% |
Transportation & Commute in Piedmont
Vehicle Availability by Sex in Piedmont
The most prevalent vehicle ownership categories in Piedmont are males with 2 vehicles (1,479, accounting for 55.6%) and females with 2 vehicles (1,244, making up 61.3%).
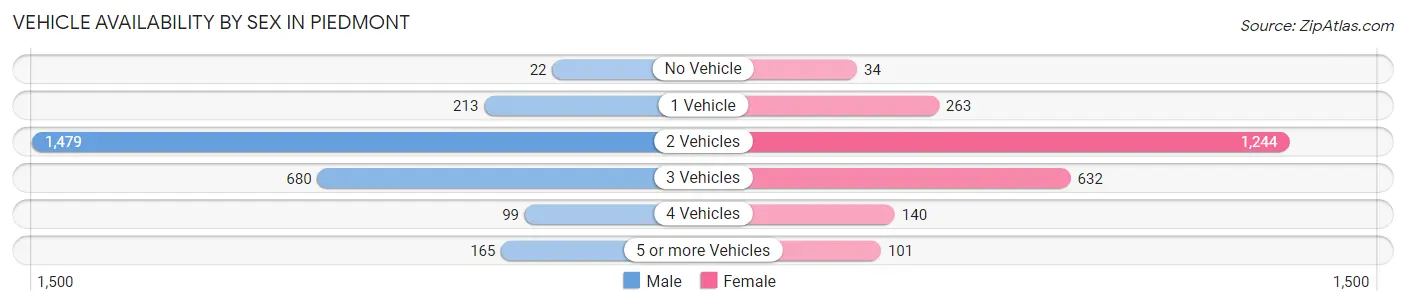
| Vehicles Available | Male | Female |
| No Vehicle | 22 (0.8%) | 34 (1.4%) |
| 1 Vehicle | 213 (8.0%) | 263 (10.9%) |
| 2 Vehicles | 1,479 (55.6%) | 1,244 (51.5%) |
| 3 Vehicles | 680 (25.6%) | 632 (26.2%) |
| 4 Vehicles | 99 (3.7%) | 140 (5.8%) |
| 5 or more Vehicles | 165 (6.2%) | 101 (4.2%) |
| Total | 2,658 (100.0%) | 2,414 (100.0%) |
Commute Time in Piedmont
The most frequently occuring commute durations in Piedmont are 15 to 19 minutes (634 commuters, 18.6%), 30 to 34 minutes (480 commuters, 14.1%), and 10 to 14 minutes (367 commuters, 10.8%).
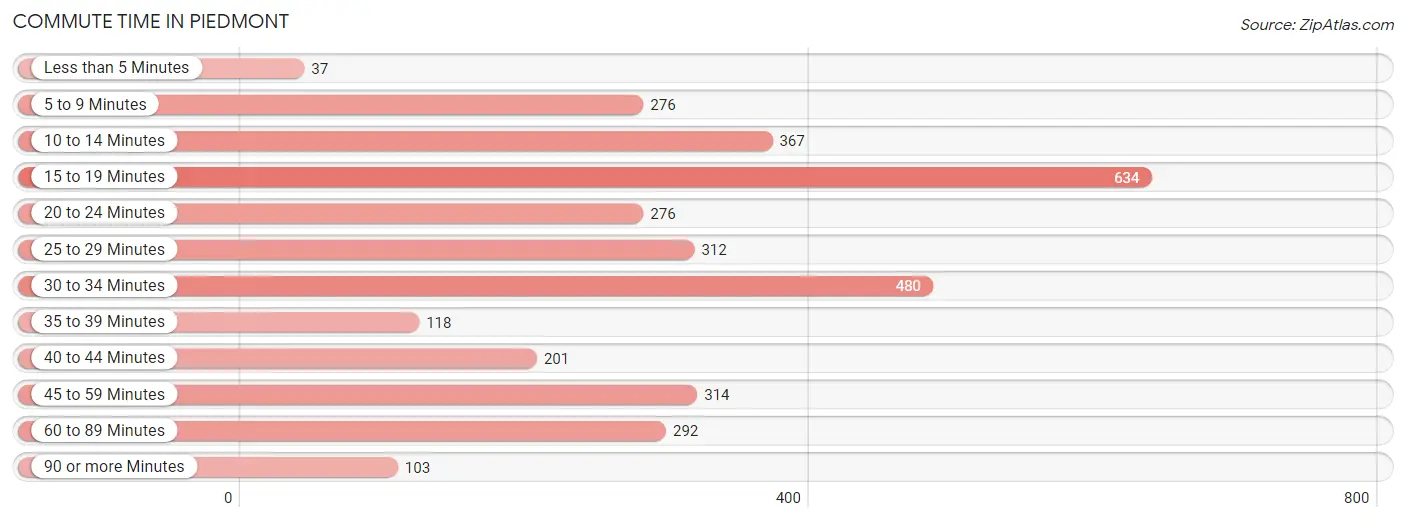
| Commute Time | # Commuters | % Commuters |
| Less than 5 Minutes | 37 | 1.1% |
| 5 to 9 Minutes | 276 | 8.1% |
| 10 to 14 Minutes | 367 | 10.8% |
| 15 to 19 Minutes | 634 | 18.6% |
| 20 to 24 Minutes | 276 | 8.1% |
| 25 to 29 Minutes | 312 | 9.1% |
| 30 to 34 Minutes | 480 | 14.1% |
| 35 to 39 Minutes | 118 | 3.5% |
| 40 to 44 Minutes | 201 | 5.9% |
| 45 to 59 Minutes | 314 | 9.2% |
| 60 to 89 Minutes | 292 | 8.6% |
| 90 or more Minutes | 103 | 3.0% |
Commute Time by Sex in Piedmont
The most common commute times in Piedmont are 15 to 19 minutes (419 commuters, 22.6%) for males and 10 to 14 minutes (215 commuters, 13.9%) for females.
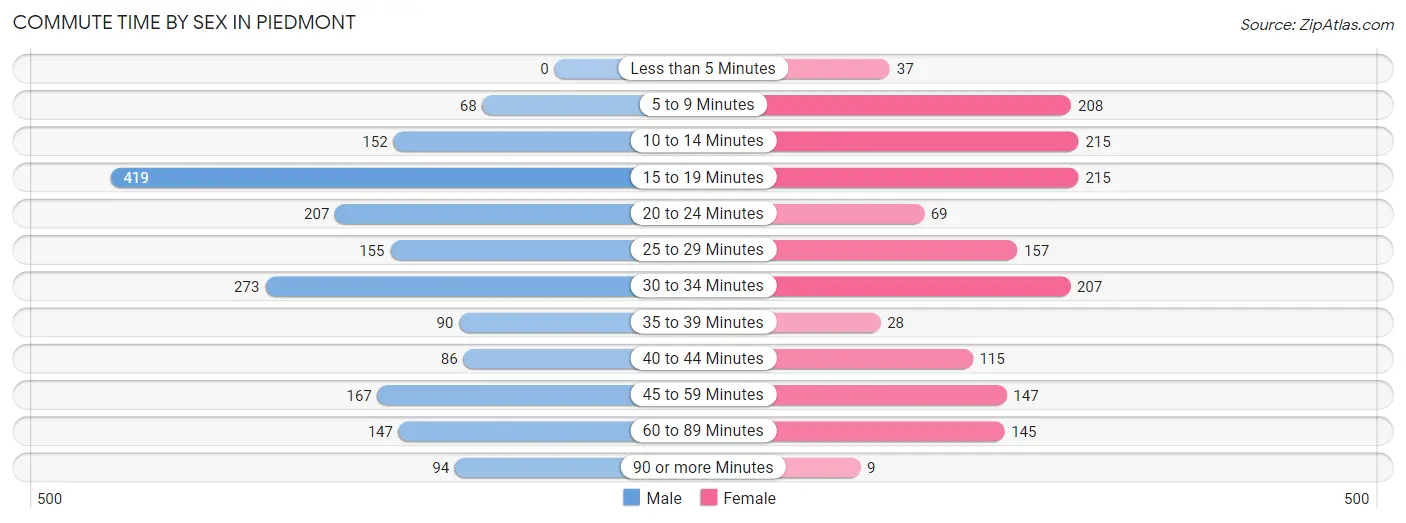
| Commute Time | Male | Female |
| Less than 5 Minutes | 0 (0.0%) | 37 (2.4%) |
| 5 to 9 Minutes | 68 (3.7%) | 208 (13.4%) |
| 10 to 14 Minutes | 152 (8.2%) | 215 (13.9%) |
| 15 to 19 Minutes | 419 (22.6%) | 215 (13.9%) |
| 20 to 24 Minutes | 207 (11.1%) | 69 (4.4%) |
| 25 to 29 Minutes | 155 (8.3%) | 157 (10.1%) |
| 30 to 34 Minutes | 273 (14.7%) | 207 (13.3%) |
| 35 to 39 Minutes | 90 (4.8%) | 28 (1.8%) |
| 40 to 44 Minutes | 86 (4.6%) | 115 (7.4%) |
| 45 to 59 Minutes | 167 (9.0%) | 147 (9.5%) |
| 60 to 89 Minutes | 147 (7.9%) | 145 (9.3%) |
| 90 or more Minutes | 94 (5.1%) | 9 (0.6%) |
Time of Departure to Work by Sex in Piedmont
The most frequent times of departure to work in Piedmont are 8:00 AM to 8:29 AM (415, 22.3%) for males and 8:00 AM to 8:29 AM (327, 21.1%) for females.
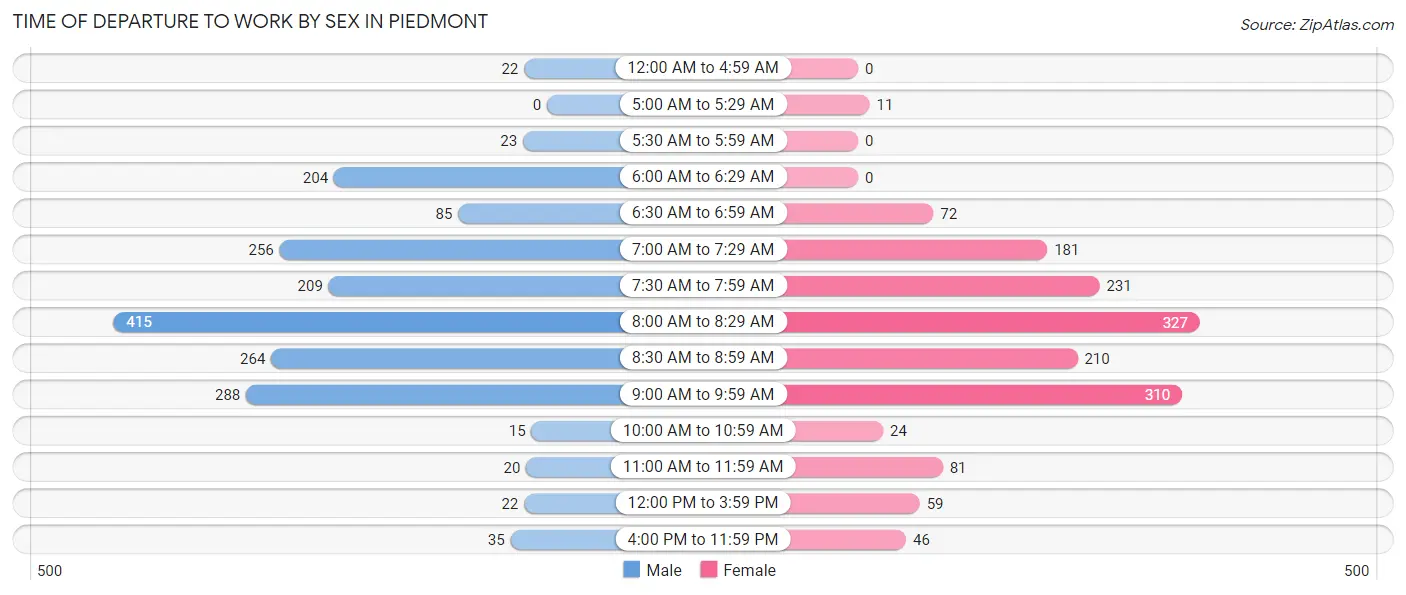
| Time of Departure | Male | Female |
| 12:00 AM to 4:59 AM | 22 (1.2%) | 0 (0.0%) |
| 5:00 AM to 5:29 AM | 0 (0.0%) | 11 (0.7%) |
| 5:30 AM to 5:59 AM | 23 (1.2%) | 0 (0.0%) |
| 6:00 AM to 6:29 AM | 204 (11.0%) | 0 (0.0%) |
| 6:30 AM to 6:59 AM | 85 (4.6%) | 72 (4.6%) |
| 7:00 AM to 7:29 AM | 256 (13.8%) | 181 (11.7%) |
| 7:30 AM to 7:59 AM | 209 (11.3%) | 231 (14.9%) |
| 8:00 AM to 8:29 AM | 415 (22.3%) | 327 (21.1%) |
| 8:30 AM to 8:59 AM | 264 (14.2%) | 210 (13.5%) |
| 9:00 AM to 9:59 AM | 288 (15.5%) | 310 (20.0%) |
| 10:00 AM to 10:59 AM | 15 (0.8%) | 24 (1.5%) |
| 11:00 AM to 11:59 AM | 20 (1.1%) | 81 (5.2%) |
| 12:00 PM to 3:59 PM | 22 (1.2%) | 59 (3.8%) |
| 4:00 PM to 11:59 PM | 35 (1.9%) | 46 (3.0%) |
| Total | 1,858 (100.0%) | 1,552 (100.0%) |
Housing Occupancy in Piedmont
Occupancy by Ownership in Piedmont
Of the total 3,789 dwellings in Piedmont, owner-occupied units account for 3,363 (88.8%), while renter-occupied units make up 426 (11.2%).
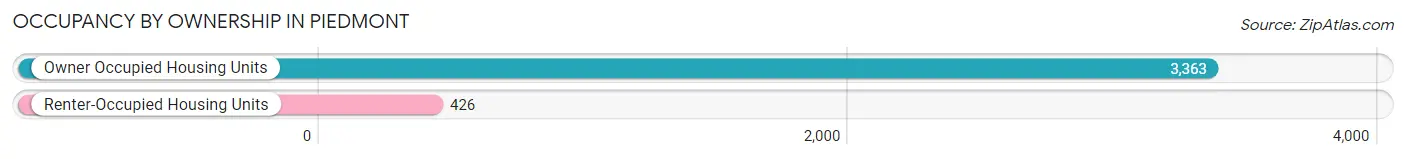
| Occupancy | # Housing Units | % Housing Units |
| Owner Occupied Housing Units | 3,363 | 88.8% |
| Renter-Occupied Housing Units | 426 | 11.2% |
| Total Occupied Housing Units | 3,789 | 100.0% |
Occupancy by Household Size in Piedmont
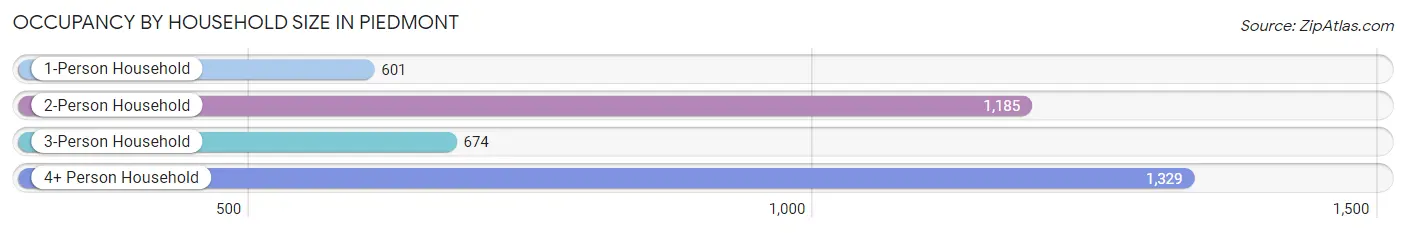
| Household Size | # Housing Units | % Housing Units |
| 1-Person Household | 601 | 15.9% |
| 2-Person Household | 1,185 | 31.3% |
| 3-Person Household | 674 | 17.8% |
| 4+ Person Household | 1,329 | 35.1% |
| Total Housing Units | 3,789 | 100.0% |
Occupancy by Ownership by Household Size in Piedmont
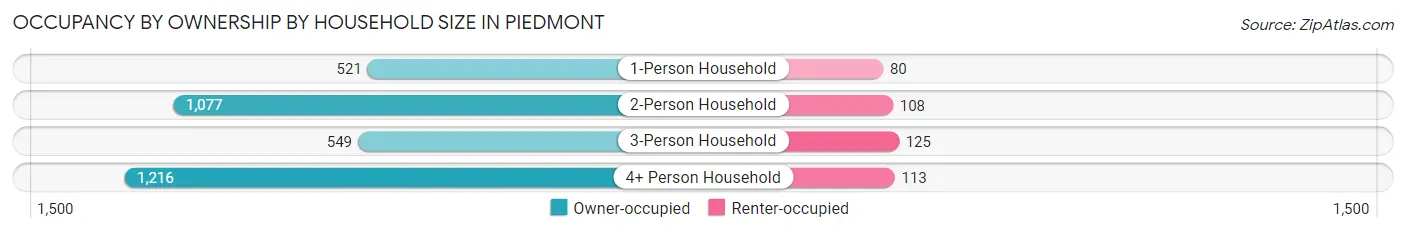
| Household Size | Owner-occupied | Renter-occupied |
| 1-Person Household | 521 (86.7%) | 80 (13.3%) |
| 2-Person Household | 1,077 (90.9%) | 108 (9.1%) |
| 3-Person Household | 549 (81.5%) | 125 (18.5%) |
| 4+ Person Household | 1,216 (91.5%) | 113 (8.5%) |
| Total Housing Units | 3,363 (88.8%) | 426 (11.2%) |
Occupancy by Educational Attainment in Piedmont
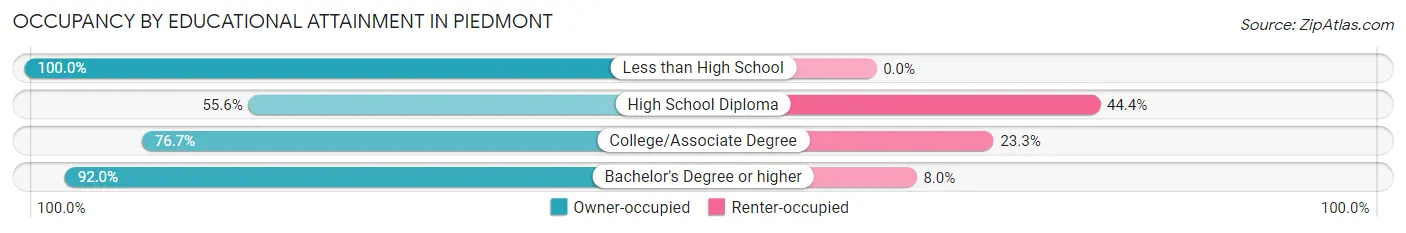
| Household Size | Owner-occupied | Renter-occupied |
| Less than High School | 9 (100.0%) | 0 (0.0%) |
| High School Diploma | 109 (55.6%) | 87 (44.4%) |
| College/Associate Degree | 264 (76.7%) | 80 (23.3%) |
| Bachelor's Degree or higher | 2,981 (92.0%) | 259 (8.0%) |
Occupancy by Age of Householder in Piedmont
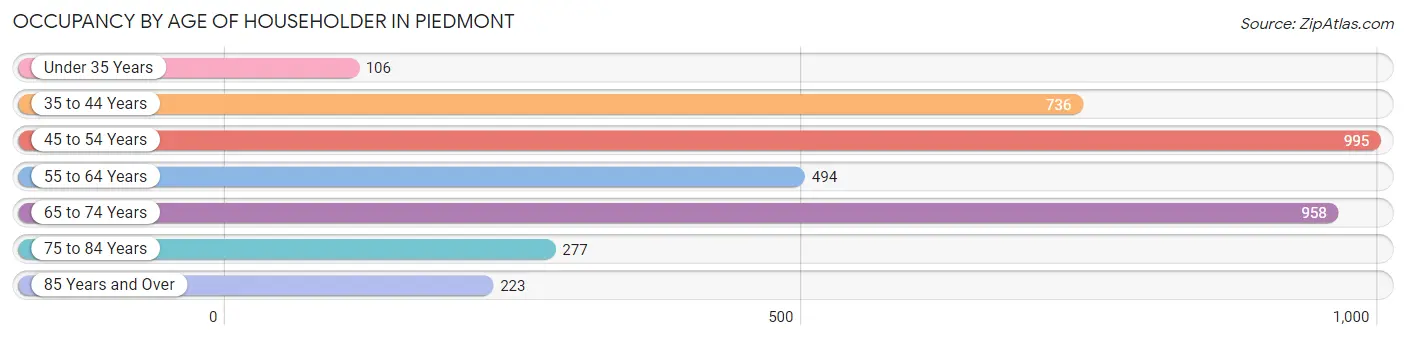
| Age Bracket | # Households | % Households |
| Under 35 Years | 106 | 2.8% |
| 35 to 44 Years | 736 | 19.4% |
| 45 to 54 Years | 995 | 26.3% |
| 55 to 64 Years | 494 | 13.0% |
| 65 to 74 Years | 958 | 25.3% |
| 75 to 84 Years | 277 | 7.3% |
| 85 Years and Over | 223 | 5.9% |
| Total | 3,789 | 100.0% |
Housing Finances in Piedmont
Median Income by Occupancy in Piedmont
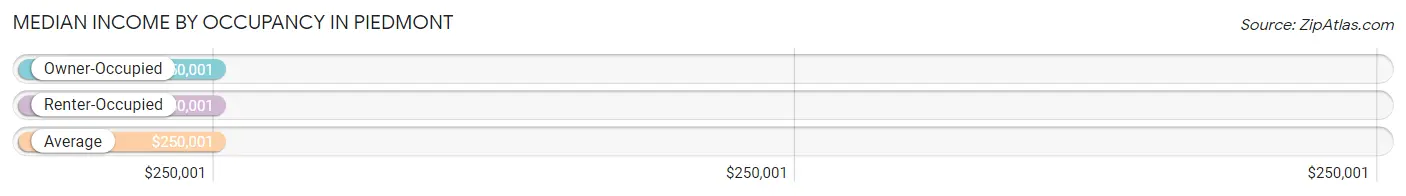
| Occupancy Type | # Households | Median Income |
| Owner-Occupied | 3,363 (88.8%) | $250,001 |
| Renter-Occupied | 426 (11.2%) | $250,001 |
| Average | 3,789 (100.0%) | $250,001 |
Occupancy by Householder Income Bracket in Piedmont
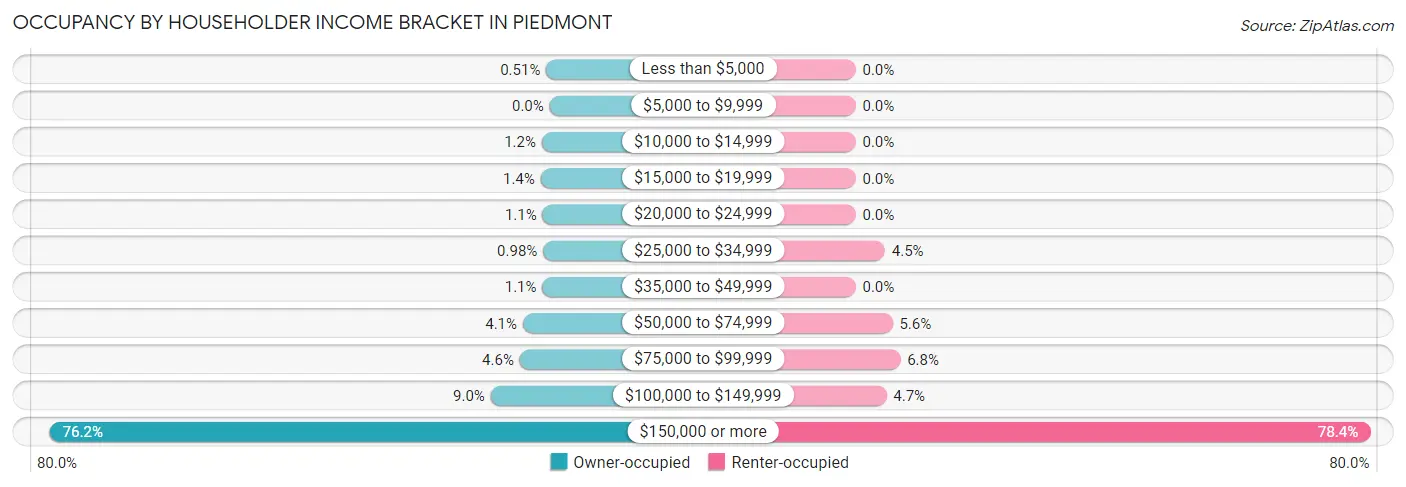
| Income Bracket | Owner-occupied | Renter-occupied |
| Less than $5,000 | 17 (0.5%) | 0 (0.0%) |
| $5,000 to $9,999 | 0 (0.0%) | 0 (0.0%) |
| $10,000 to $14,999 | 40 (1.2%) | 0 (0.0%) |
| $15,000 to $19,999 | 46 (1.4%) | 0 (0.0%) |
| $20,000 to $24,999 | 36 (1.1%) | 0 (0.0%) |
| $25,000 to $34,999 | 33 (1.0%) | 19 (4.5%) |
| $35,000 to $49,999 | 37 (1.1%) | 0 (0.0%) |
| $50,000 to $74,999 | 137 (4.1%) | 24 (5.6%) |
| $75,000 to $99,999 | 153 (4.5%) | 29 (6.8%) |
| $100,000 to $149,999 | 302 (9.0%) | 20 (4.7%) |
| $150,000 or more | 2,562 (76.2%) | 334 (78.4%) |
| Total | 3,363 (100.0%) | 426 (100.0%) |
Monthly Housing Cost Tiers in Piedmont
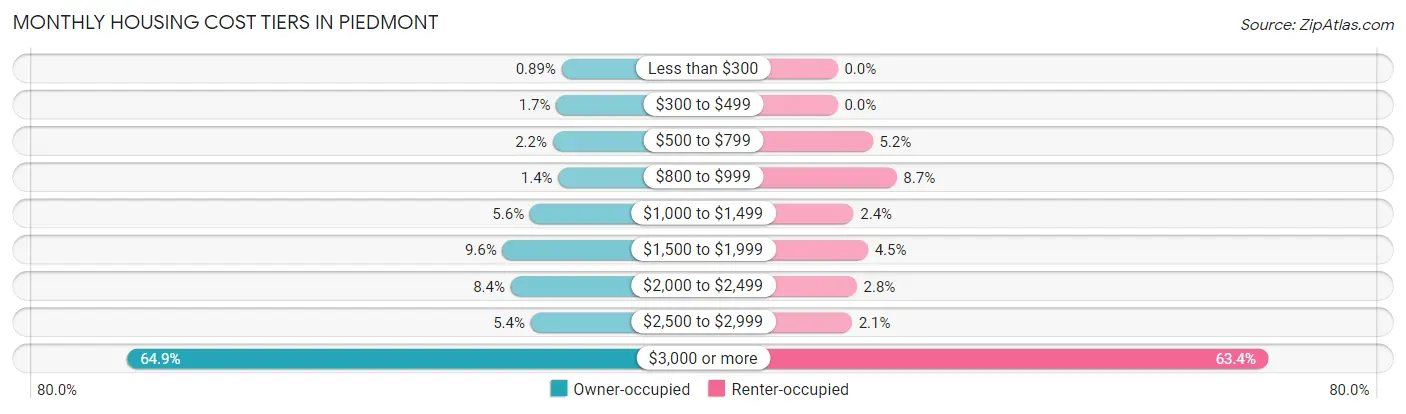
| Monthly Cost | Owner-occupied | Renter-occupied |
| Less than $300 | 30 (0.9%) | 0 (0.0%) |
| $300 to $499 | 56 (1.7%) | 0 (0.0%) |
| $500 to $799 | 74 (2.2%) | 22 (5.2%) |
| $800 to $999 | 46 (1.4%) | 37 (8.7%) |
| $1,000 to $1,499 | 187 (5.6%) | 10 (2.4%) |
| $1,500 to $1,999 | 323 (9.6%) | 19 (4.5%) |
| $2,000 to $2,499 | 282 (8.4%) | 12 (2.8%) |
| $2,500 to $2,999 | 183 (5.4%) | 9 (2.1%) |
| $3,000 or more | 2,182 (64.9%) | 270 (63.4%) |
| Total | 3,363 (100.0%) | 426 (100.0%) |
Physical Housing Characteristics in Piedmont
Housing Structures in Piedmont
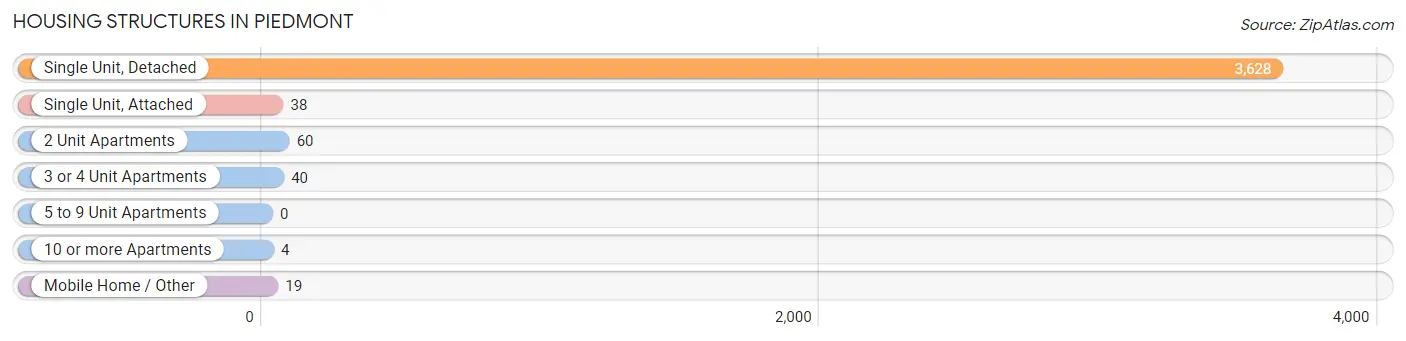
| Structure Type | # Housing Units | % Housing Units |
| Single Unit, Detached | 3,628 | 95.8% |
| Single Unit, Attached | 38 | 1.0% |
| 2 Unit Apartments | 60 | 1.6% |
| 3 or 4 Unit Apartments | 40 | 1.1% |
| 5 to 9 Unit Apartments | 0 | 0.0% |
| 10 or more Apartments | 4 | 0.1% |
| Mobile Home / Other | 19 | 0.5% |
| Total | 3,789 | 100.0% |
Housing Structures by Occupancy in Piedmont
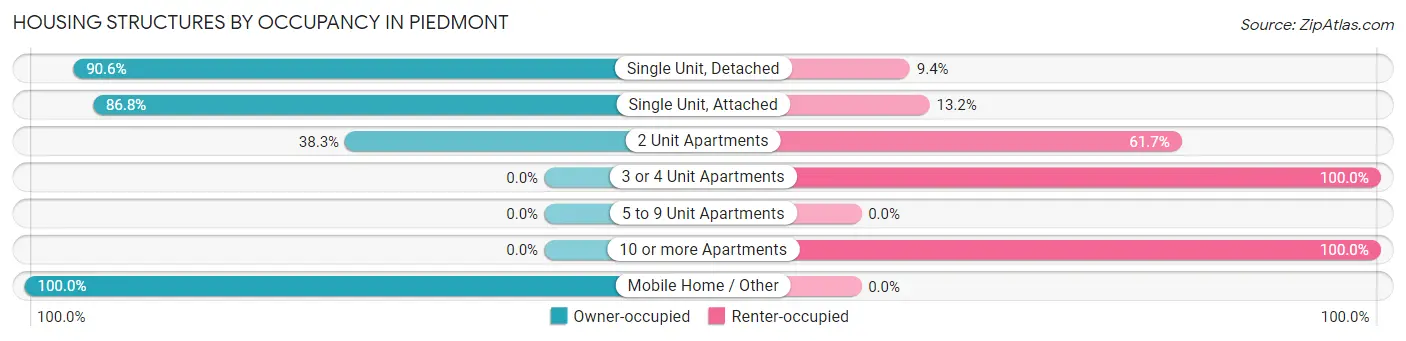
| Structure Type | Owner-occupied | Renter-occupied |
| Single Unit, Detached | 3,288 (90.6%) | 340 (9.4%) |
| Single Unit, Attached | 33 (86.8%) | 5 (13.2%) |
| 2 Unit Apartments | 23 (38.3%) | 37 (61.7%) |
| 3 or 4 Unit Apartments | 0 (0.0%) | 40 (100.0%) |
| 5 to 9 Unit Apartments | 0 (0.0%) | 0 (0.0%) |
| 10 or more Apartments | 0 (0.0%) | 4 (100.0%) |
| Mobile Home / Other | 19 (100.0%) | 0 (0.0%) |
| Total | 3,363 (88.8%) | 426 (11.2%) |
Housing Structures by Number of Rooms in Piedmont
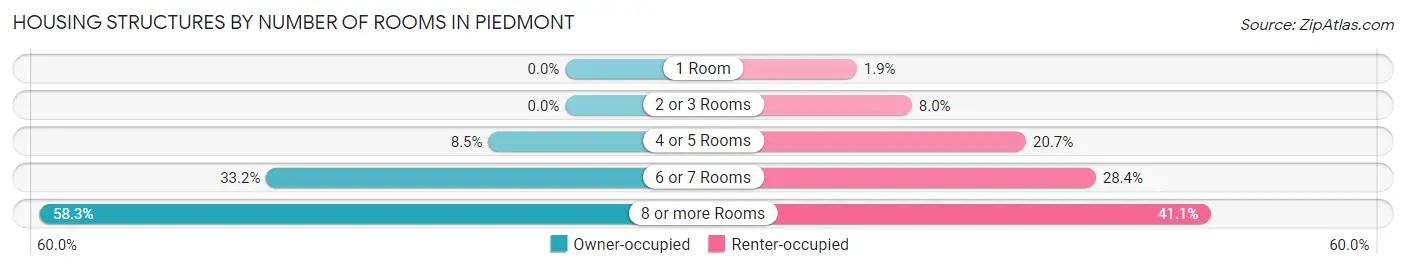
| Number of Rooms | Owner-occupied | Renter-occupied |
| 1 Room | 0 (0.0%) | 8 (1.9%) |
| 2 or 3 Rooms | 0 (0.0%) | 34 (8.0%) |
| 4 or 5 Rooms | 287 (8.5%) | 88 (20.7%) |
| 6 or 7 Rooms | 1,116 (33.2%) | 121 (28.4%) |
| 8 or more Rooms | 1,960 (58.3%) | 175 (41.1%) |
| Total | 3,363 (100.0%) | 426 (100.0%) |
Housing Structure by Heating Type in Piedmont
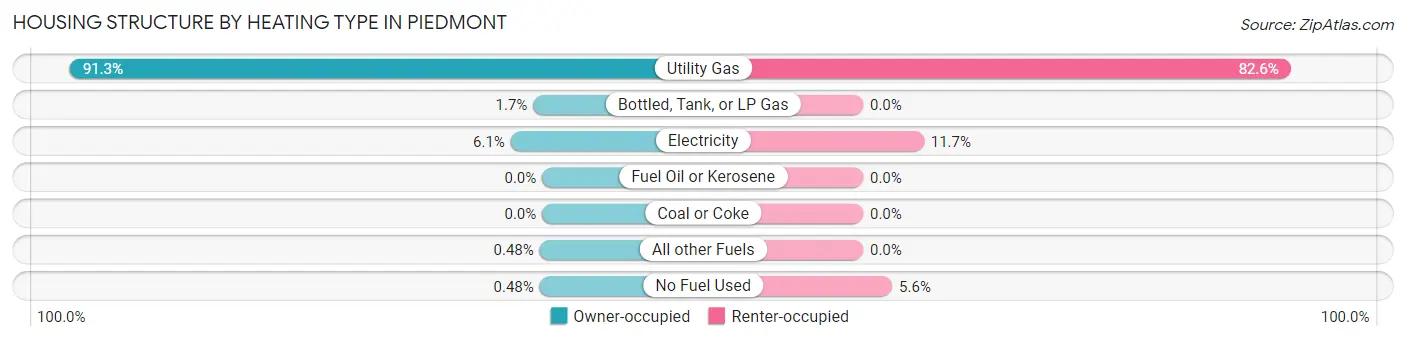
| Heating Type | Owner-occupied | Renter-occupied |
| Utility Gas | 3,069 (91.3%) | 352 (82.6%) |
| Bottled, Tank, or LP Gas | 58 (1.7%) | 0 (0.0%) |
| Electricity | 204 (6.1%) | 50 (11.7%) |
| Fuel Oil or Kerosene | 0 (0.0%) | 0 (0.0%) |
| Coal or Coke | 0 (0.0%) | 0 (0.0%) |
| All other Fuels | 16 (0.5%) | 0 (0.0%) |
| No Fuel Used | 16 (0.5%) | 24 (5.6%) |
| Total | 3,363 (100.0%) | 426 (100.0%) |
Household Vehicle Usage in Piedmont
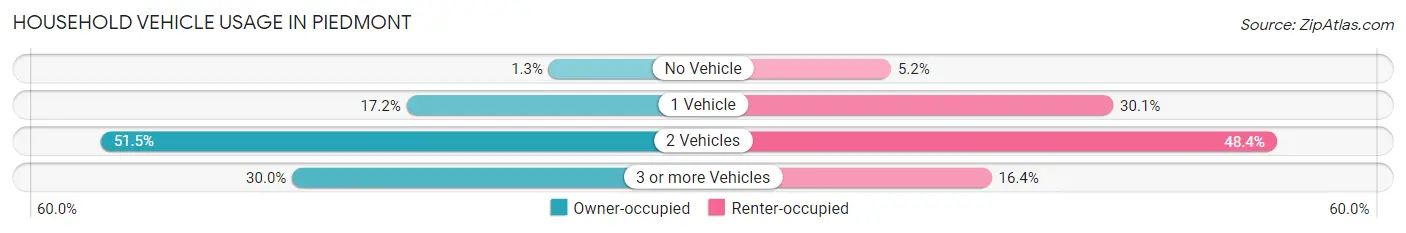
| Vehicles per Household | Owner-occupied | Renter-occupied |
| No Vehicle | 43 (1.3%) | 22 (5.2%) |
| 1 Vehicle | 579 (17.2%) | 128 (30.0%) |
| 2 Vehicles | 1,731 (51.5%) | 206 (48.4%) |
| 3 or more Vehicles | 1,010 (30.0%) | 70 (16.4%) |
| Total | 3,363 (100.0%) | 426 (100.0%) |
Real Estate & Mortgages in Piedmont
Real Estate and Mortgage Overview in Piedmont
| Characteristic | Without Mortgage | With Mortgage |
| Housing Units | 1,168 | 2,195 |
| Median Property Value | $2,000,001 | $2,000,001 |
| Median Household Income | $230,714 | $1,866 |
| Monthly Housing Costs | $1,501 | $1,886 |
| Real Estate Taxes | $10,001 | $21 |
Property Value by Mortgage Status in Piedmont
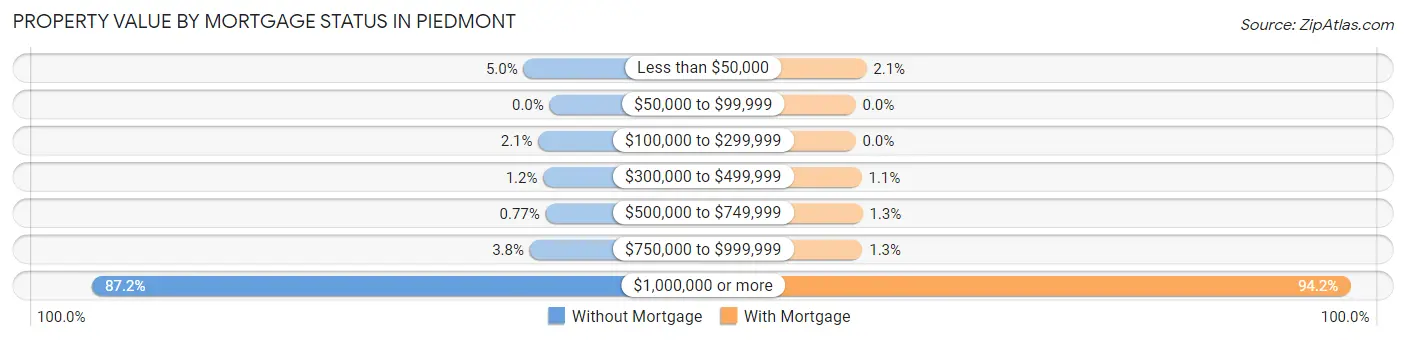
| Property Value | Without Mortgage | With Mortgage |
| Less than $50,000 | 58 (5.0%) | 45 (2.1%) |
| $50,000 to $99,999 | 0 (0.0%) | 0 (0.0%) |
| $100,000 to $299,999 | 25 (2.1%) | 0 (0.0%) |
| $300,000 to $499,999 | 14 (1.2%) | 25 (1.1%) |
| $500,000 to $749,999 | 9 (0.8%) | 29 (1.3%) |
| $750,000 to $999,999 | 44 (3.8%) | 28 (1.3%) |
| $1,000,000 or more | 1,018 (87.2%) | 2,068 (94.2%) |
| Total | 1,168 (100.0%) | 2,195 (100.0%) |
Household Income by Mortgage Status in Piedmont
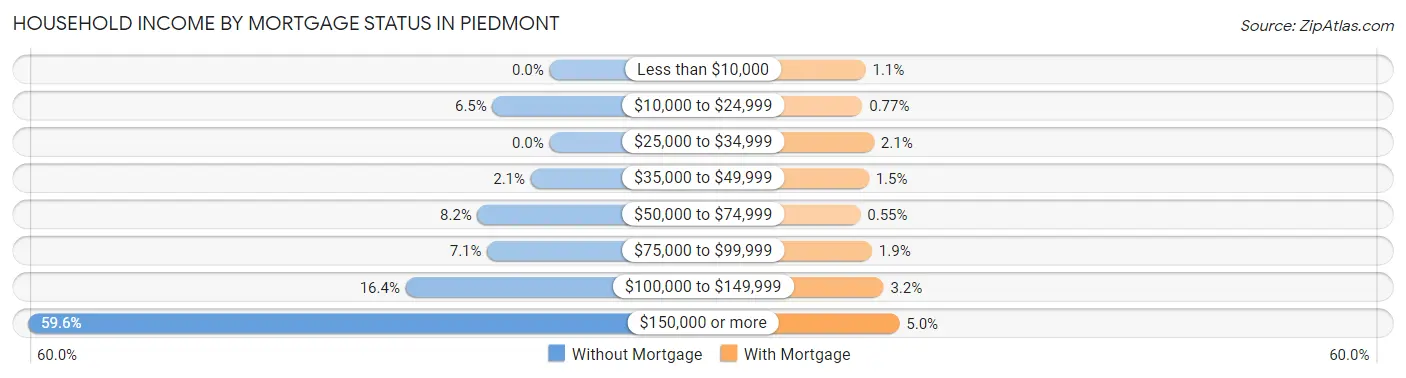
| Household Income | Without Mortgage | With Mortgage |
| Less than $10,000 | 0 (0.0%) | 25 (1.1%) |
| $10,000 to $24,999 | 76 (6.5%) | 17 (0.8%) |
| $25,000 to $34,999 | 0 (0.0%) | 46 (2.1%) |
| $35,000 to $49,999 | 25 (2.1%) | 33 (1.5%) |
| $50,000 to $74,999 | 96 (8.2%) | 12 (0.5%) |
| $75,000 to $99,999 | 83 (7.1%) | 41 (1.9%) |
| $100,000 to $149,999 | 192 (16.4%) | 70 (3.2%) |
| $150,000 or more | 696 (59.6%) | 110 (5.0%) |
| Total | 1,168 (100.0%) | 2,195 (100.0%) |
Property Value to Household Income Ratio in Piedmont
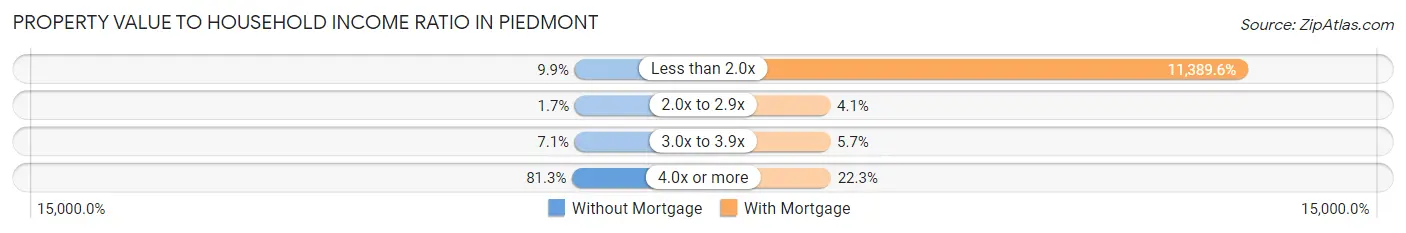
| Value-to-Income Ratio | Without Mortgage | With Mortgage |
| Less than 2.0x | 116 (9.9%) | 250,001 (11,389.6%) |
| 2.0x to 2.9x | 20 (1.7%) | 89 (4.1%) |
| 3.0x to 3.9x | 83 (7.1%) | 126 (5.7%) |
| 4.0x or more | 949 (81.2%) | 490 (22.3%) |
| Total | 1,168 (100.0%) | 2,195 (100.0%) |
Real Estate Taxes by Mortgage Status in Piedmont
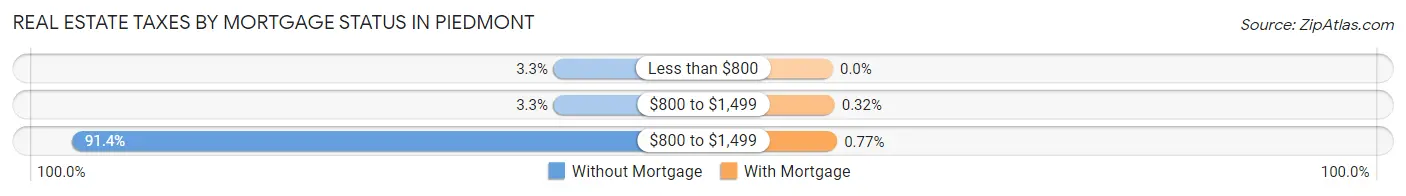
| Property Taxes | Without Mortgage | With Mortgage |
| Less than $800 | 39 (3.3%) | 0 (0.0%) |
| $800 to $1,499 | 39 (3.3%) | 7 (0.3%) |
| $800 to $1,499 | 1,067 (91.3%) | 17 (0.8%) |
| Total | 1,168 (100.0%) | 2,195 (100.0%) |
Health & Disability in Piedmont
Health Insurance Coverage by Age in Piedmont
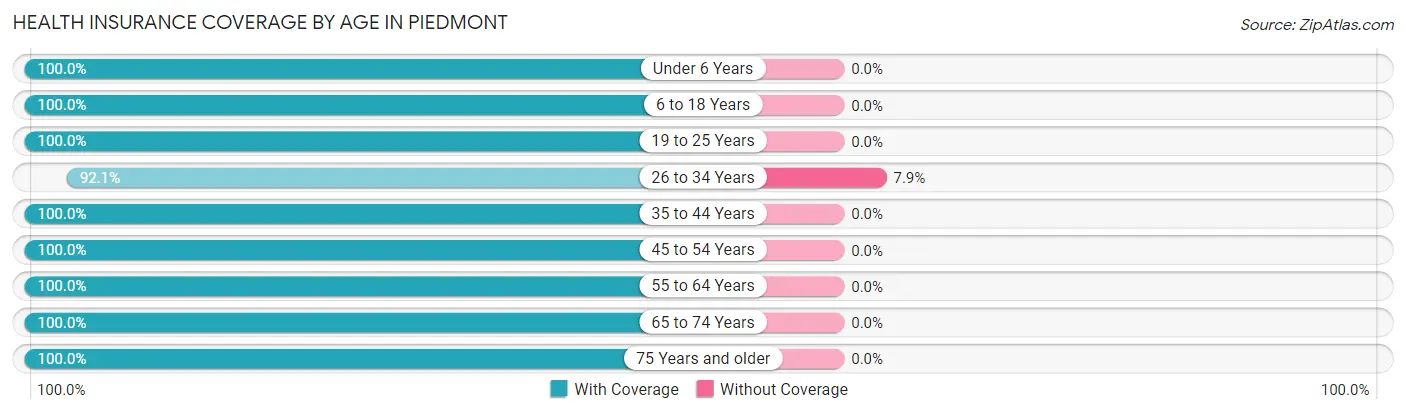
| Age Bracket | With Coverage | Without Coverage |
| Under 6 Years | 728 (100.0%) | 0 (0.0%) |
| 6 to 18 Years | 2,405 (100.0%) | 0 (0.0%) |
| 19 to 25 Years | 388 (100.0%) | 0 (0.0%) |
| 26 to 34 Years | 620 (92.1%) | 53 (7.9%) |
| 35 to 44 Years | 1,436 (100.0%) | 0 (0.0%) |
| 45 to 54 Years | 1,992 (100.0%) | 0 (0.0%) |
| 55 to 64 Years | 958 (100.0%) | 0 (0.0%) |
| 65 to 74 Years | 1,662 (100.0%) | 0 (0.0%) |
| 75 Years and older | 919 (100.0%) | 0 (0.0%) |
| Total | 11,108 (99.5%) | 53 (0.5%) |
Health Insurance Coverage by Citizenship Status in Piedmont

| Citizenship Status | With Coverage | Without Coverage |
| Native Born | 728 (100.0%) | 0 (0.0%) |
| Foreign Born, Citizen | 2,405 (100.0%) | 0 (0.0%) |
| Foreign Born, not a Citizen | 388 (100.0%) | 0 (0.0%) |
Health Insurance Coverage by Household Income in Piedmont
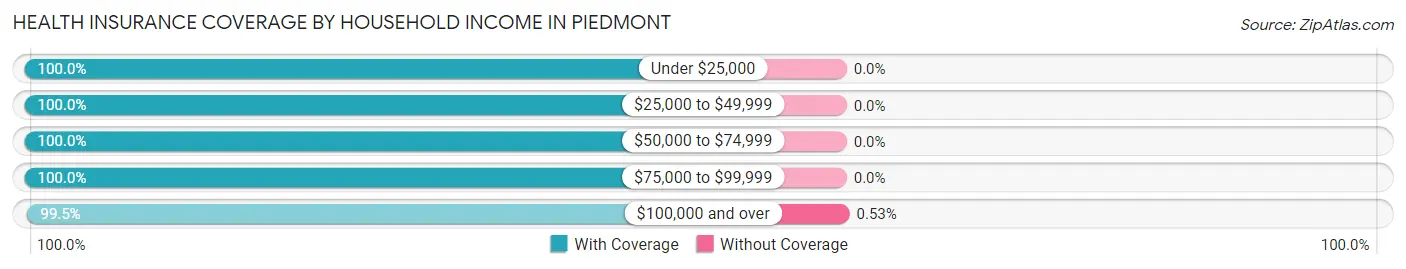
| Household Income | With Coverage | Without Coverage |
| Under $25,000 | 336 (100.0%) | 0 (0.0%) |
| $25,000 to $49,999 | 130 (100.0%) | 0 (0.0%) |
| $50,000 to $74,999 | 275 (100.0%) | 0 (0.0%) |
| $75,000 to $99,999 | 417 (100.0%) | 0 (0.0%) |
| $100,000 and over | 9,945 (99.5%) | 53 (0.5%) |
Public vs Private Health Insurance Coverage by Age in Piedmont
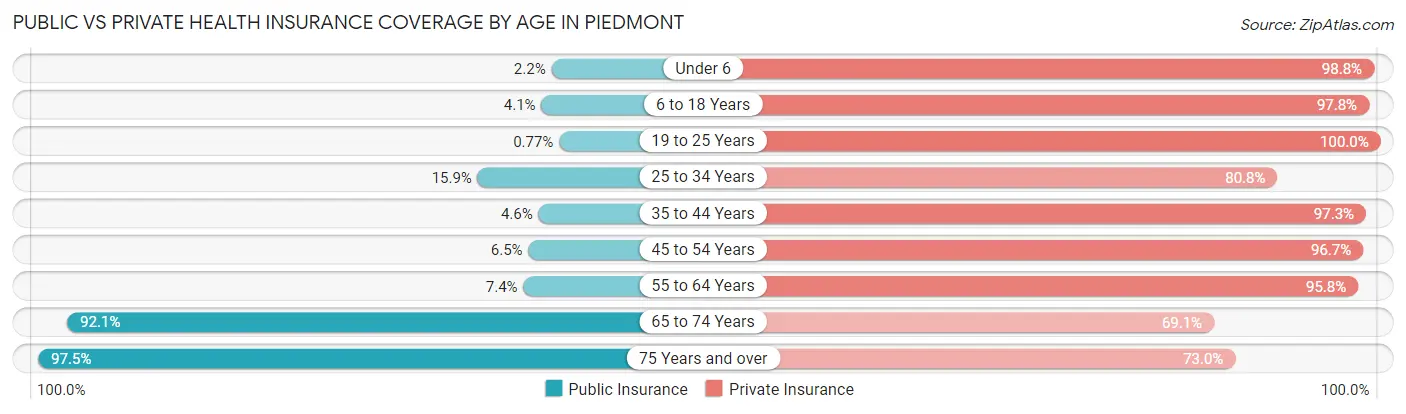
| Age Bracket | Public Insurance | Private Insurance |
| Under 6 | 16 (2.2%) | 719 (98.8%) |
| 6 to 18 Years | 98 (4.1%) | 2,353 (97.8%) |
| 19 to 25 Years | 3 (0.8%) | 388 (100.0%) |
| 25 to 34 Years | 107 (15.9%) | 544 (80.8%) |
| 35 to 44 Years | 66 (4.6%) | 1,397 (97.3%) |
| 45 to 54 Years | 129 (6.5%) | 1,927 (96.7%) |
| 55 to 64 Years | 71 (7.4%) | 918 (95.8%) |
| 65 to 74 Years | 1,531 (92.1%) | 1,148 (69.1%) |
| 75 Years and over | 896 (97.5%) | 671 (73.0%) |
| Total | 2,917 (26.1%) | 10,065 (90.2%) |
Disability Status by Sex by Age in Piedmont
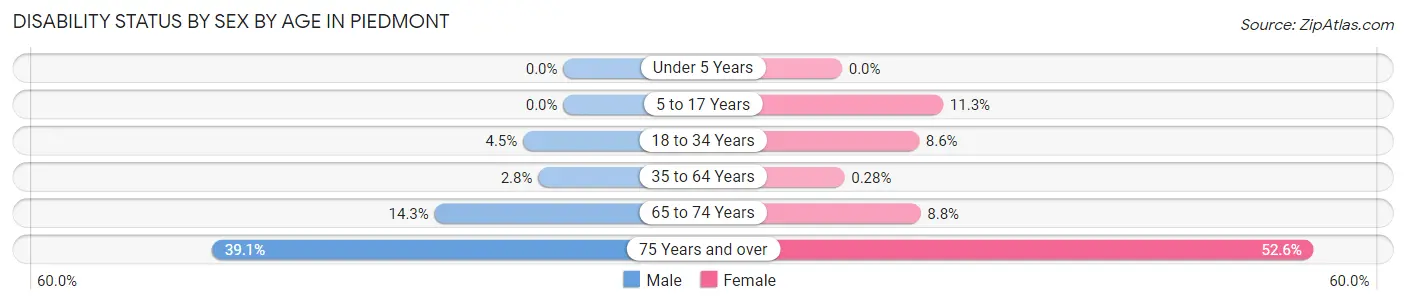
| Age Bracket | Male | Female |
| Under 5 Years | 0 (0.0%) | 0 (0.0%) |
| 5 to 17 Years | 0 (0.0%) | 121 (11.3%) |
| 18 to 34 Years | 29 (4.5%) | 46 (8.6%) |
| 35 to 64 Years | 62 (2.8%) | 6 (0.3%) |
| 65 to 74 Years | 117 (14.3%) | 74 (8.7%) |
| 75 Years and over | 137 (39.1%) | 299 (52.5%) |
Disability Class by Sex by Age in Piedmont
Disability Class: Hearing Difficulty
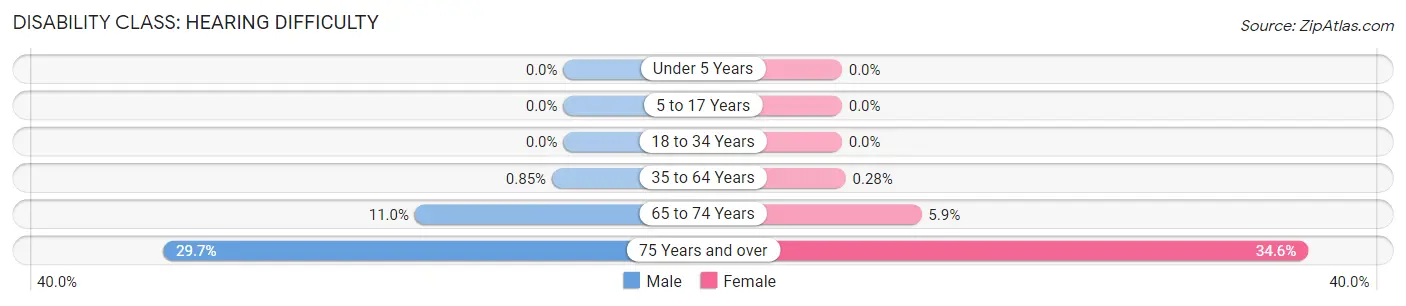
| Age Bracket | Male | Female |
| Under 5 Years | 0 (0.0%) | 0 (0.0%) |
| 5 to 17 Years | 0 (0.0%) | 0 (0.0%) |
| 18 to 34 Years | 0 (0.0%) | 0 (0.0%) |
| 35 to 64 Years | 19 (0.9%) | 6 (0.3%) |
| 65 to 74 Years | 90 (11.0%) | 50 (5.9%) |
| 75 Years and over | 104 (29.7%) | 197 (34.6%) |
Disability Class: Vision Difficulty
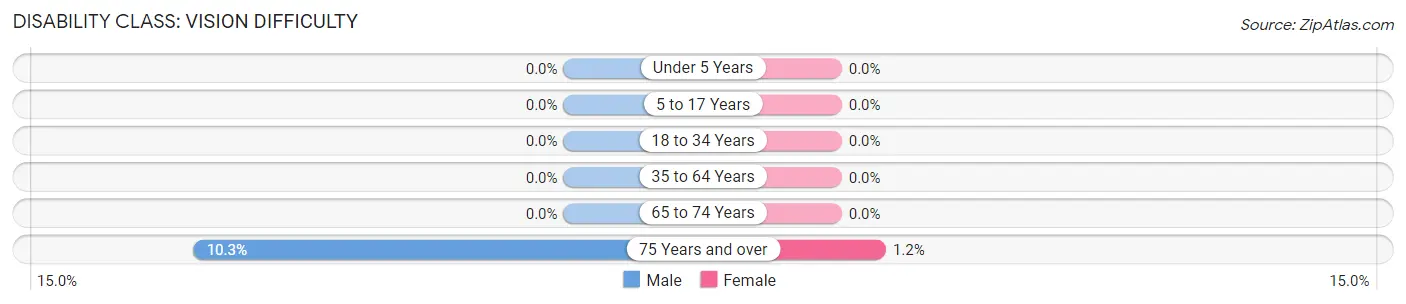
| Age Bracket | Male | Female |
| Under 5 Years | 0 (0.0%) | 0 (0.0%) |
| 5 to 17 Years | 0 (0.0%) | 0 (0.0%) |
| 18 to 34 Years | 0 (0.0%) | 0 (0.0%) |
| 35 to 64 Years | 0 (0.0%) | 0 (0.0%) |
| 65 to 74 Years | 0 (0.0%) | 0 (0.0%) |
| 75 Years and over | 36 (10.3%) | 7 (1.2%) |
Disability Class: Cognitive Difficulty
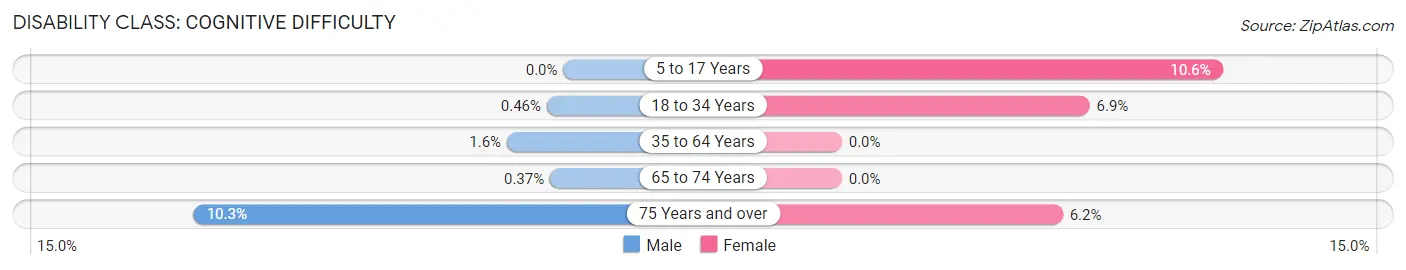
| Age Bracket | Male | Female |
| 5 to 17 Years | 0 (0.0%) | 114 (10.6%) |
| 18 to 34 Years | 3 (0.5%) | 37 (6.9%) |
| 35 to 64 Years | 35 (1.6%) | 0 (0.0%) |
| 65 to 74 Years | 3 (0.4%) | 0 (0.0%) |
| 75 Years and over | 36 (10.3%) | 35 (6.1%) |
Disability Class: Ambulatory Difficulty
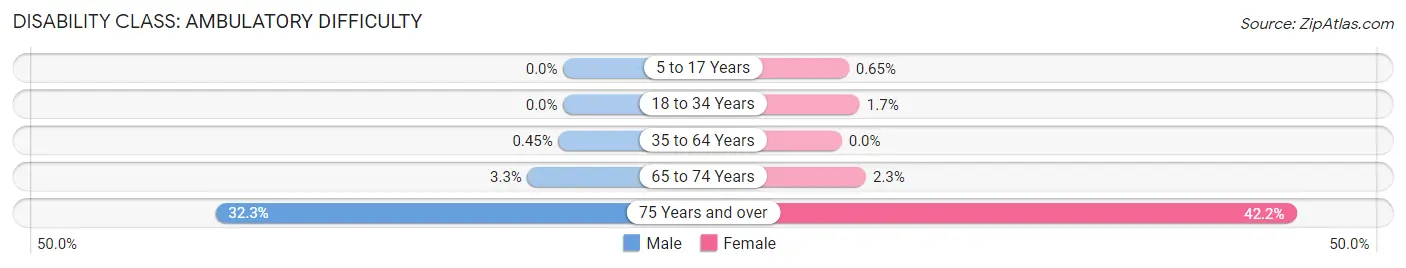
| Age Bracket | Male | Female |
| 5 to 17 Years | 0 (0.0%) | 7 (0.6%) |
| 18 to 34 Years | 0 (0.0%) | 9 (1.7%) |
| 35 to 64 Years | 10 (0.4%) | 0 (0.0%) |
| 65 to 74 Years | 27 (3.3%) | 19 (2.2%) |
| 75 Years and over | 113 (32.3%) | 240 (42.2%) |
Disability Class: Self-Care Difficulty
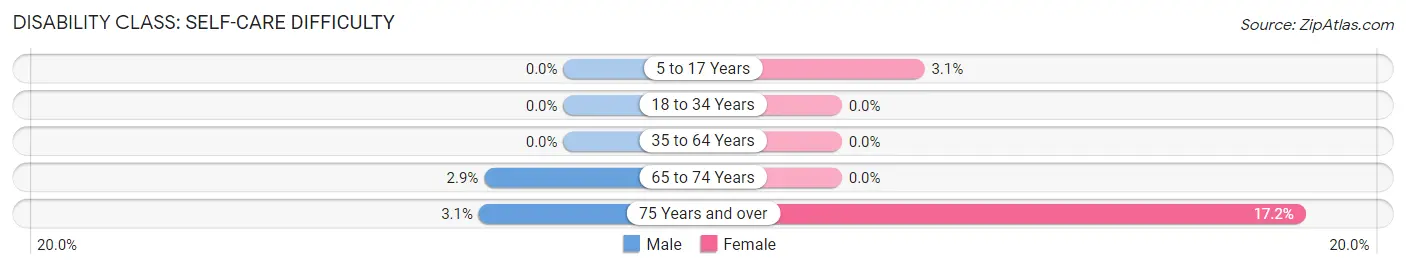
| Age Bracket | Male | Female |
| 5 to 17 Years | 0 (0.0%) | 33 (3.1%) |
| 18 to 34 Years | 0 (0.0%) | 0 (0.0%) |
| 35 to 64 Years | 0 (0.0%) | 0 (0.0%) |
| 65 to 74 Years | 24 (2.9%) | 0 (0.0%) |
| 75 Years and over | 11 (3.1%) | 98 (17.2%) |
Technology Access in Piedmont
Computing Device Access in Piedmont
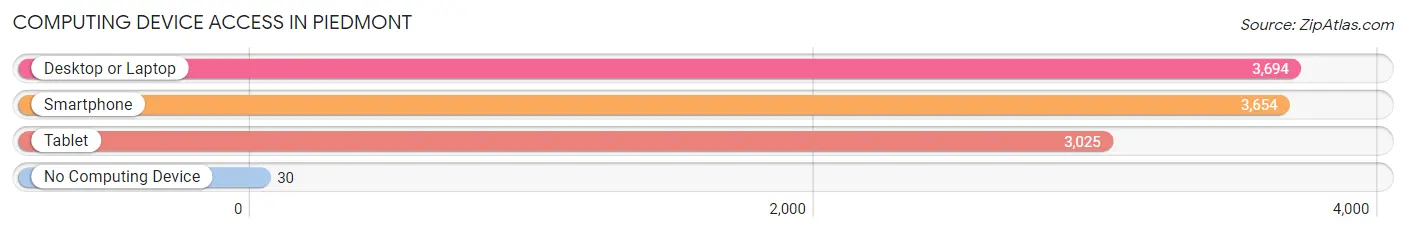
| Device Type | # Households | % Households |
| Desktop or Laptop | 3,694 | 97.5% |
| Smartphone | 3,654 | 96.4% |
| Tablet | 3,025 | 79.8% |
| No Computing Device | 30 | 0.8% |
| Total | 3,789 | 100.0% |
Internet Access in Piedmont
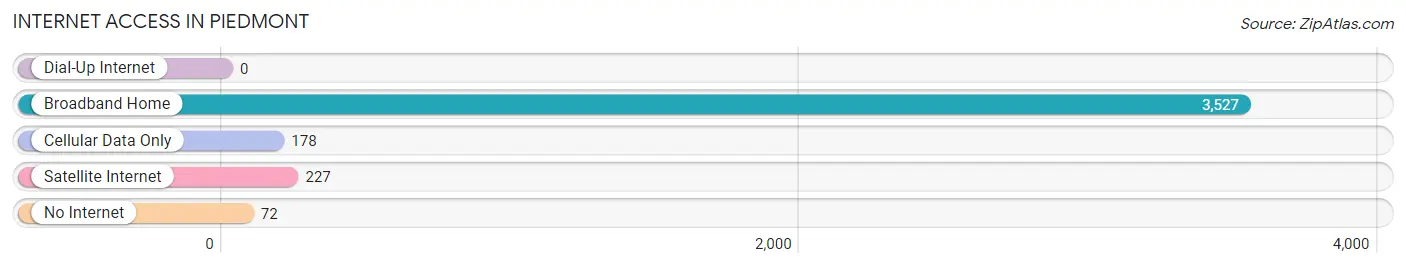
| Internet Type | # Households | % Households |
| Dial-Up Internet | 0 | 0.0% |
| Broadband Home | 3,527 | 93.1% |
| Cellular Data Only | 178 | 4.7% |
| Satellite Internet | 227 | 6.0% |
| No Internet | 72 | 1.9% |
| Total | 3,789 | 100.0% |
Piedmont Summary
Piedmont is a small city located in the East Bay region of the San Francisco Bay Area in Alameda County, California. It is situated between Oakland and Berkeley, and is surrounded by the cities of Oakland, Emeryville, and Berkeley. The city has a population of approximately 11,000 people and covers an area of 2.7 square miles.
History
The area that is now Piedmont was originally inhabited by the Ohlone people, who were the first inhabitants of the San Francisco Bay Area. The Ohlone people lived in the area for thousands of years before the arrival of Europeans.
In the late 1800s, the area was developed by a group of wealthy San Francisco businessmen who wanted to create a residential community away from the hustle and bustle of the city. The group purchased the land and named it Piedmont, after the French word for “foothill”.
The city was incorporated in 1907 and quickly became a popular residential area for wealthy San Franciscans. The city was known for its large, luxurious homes and its quiet, peaceful atmosphere.
Geography
Piedmont is located in the East Bay region of the San Francisco Bay Area in Alameda County, California. It is situated between Oakland and Berkeley, and is surrounded by the cities of Oakland, Emeryville, and Berkeley. The city has a total area of 2.7 square miles, all of which is land.
The city is located on a plateau, which is surrounded by hills and valleys. The city is located at an elevation of about 500 feet above sea level. The climate in Piedmont is mild and temperate, with warm summers and cool winters.
Economy
Piedmont has a strong economy that is largely based on the service industry. The city is home to a number of businesses, including banks, restaurants, retail stores, and professional services. The city also has a number of small businesses, including art galleries, antique stores, and boutiques.
The city is also home to a number of large employers, including the University of California, Berkeley, Kaiser Permanente, and the Lawrence Berkeley National Laboratory.
Demographics
As of the 2010 census, the population of Piedmont was 10,667. The racial makeup of the city was 79.3% White, 8.2% Asian, 6.3% African American, 0.3% Native American, 0.1% Pacific Islander, and 5.8% from other races. The median household income in Piedmont was $150,000, and the median family income was $180,000.
The city is home to a number of educational institutions, including Piedmont High School, Piedmont Middle School, and Piedmont Elementary School. The city is also home to a number of private schools, including Piedmont Montessori School and Piedmont Academy.
Conclusion
Piedmont is a small city located in the East Bay region of the San Francisco Bay Area in Alameda County, California. It is situated between Oakland and Berkeley, and is surrounded by the cities of Oakland, Emeryville, and Berkeley. The city has a population of approximately 11,000 people and covers an area of 2.7 square miles. The city has a strong economy that is largely based on the service industry, and the racial makeup of the city is 79.3% White, 8.2% Asian, 6.3% African American, 0.3% Native American, 0.1% Pacific Islander, and 5.8% from other races. Piedmont is home to a number of educational institutions, including Piedmont High School, Piedmont Middle School, and Piedmont Elementary School. The city is also home to a number of private schools, including Piedmont Montessori School and Piedmont Academy.
Common Questions
What is Per Capita Income in Piedmont?
Per Capita income in Piedmont is $139,921.
What is the Median Family Income in Piedmont?
Median Family Income in Piedmont is $250,001.
What is the Median Household income in Piedmont?
Median Household Income in Piedmont is $250,001.
What is Income or Wage Gap in Piedmont?
Income or Wage Gap in Piedmont is 34.3%.
Women in Piedmont earn 65.7 cents for every dollar earned by a man.
What is Inequality or Gini Index in Piedmont?
Inequality or Gini Index in Piedmont is 0.43.
What is the Total Population of Piedmont?
Total Population of Piedmont is 11,161.
What is the Total Male Population of Piedmont?
Total Male Population of Piedmont is 5,607.
What is the Total Female Population of Piedmont?
Total Female Population of Piedmont is 5,554.
What is the Ratio of Males per 100 Females in Piedmont?
There are 100.95 Males per 100 Females in Piedmont.
What is the Ratio of Females per 100 Males in Piedmont?
There are 99.05 Females per 100 Males in Piedmont.
What is the Median Population Age in Piedmont?
Median Population Age in Piedmont is 44.3 Years.
What is the Average Family Size in Piedmont
Average Family Size in Piedmont is 3.3 People.
What is the Average Household Size in Piedmont
Average Household Size in Piedmont is 2.9 People.
How Large is the Labor Force in Piedmont?
There are 5,444 People in the Labor Forcein in Piedmont.
What is the Percentage of People in the Labor Force in Piedmont?
63.9% of People are in the Labor Force in Piedmont.
What is the Unemployment Rate in Piedmont?
Unemployment Rate in Piedmont is 5.0%.