Lake Almanor Peninsula, CA Map & Demographics
Lake Almanor Peninsula Map
Lake Almanor Peninsula Overview
$56,943
PER CAPITA INCOME
$126,442
AVG FAMILY INCOME
$103,636
AVG HOUSEHOLD INCOME
0.31
INEQUALITY / GINI INDEX
319
TOTAL POPULATION
158
MALE POPULATION
161
FEMALE POPULATION
98.14
MALES / 100 FEMALES
101.90
FEMALES / 100 MALES
65.0
MEDIAN AGE
2.9
AVG FAMILY SIZE
2.2
AVG HOUSEHOLD SIZE
112
LABOR FORCE [ PEOPLE ]
35.6%
PERCENT IN LABOR FORCE
7.1%
UNEMPLOYMENT RATE
Income in Lake Almanor Peninsula
Income Overview in Lake Almanor Peninsula
Per Capita Income in Lake Almanor Peninsula is $56,943, while median incomes of families and households are $126,442 and $103,636 respectively.
| Characteristic | Number | Measure |
| Per Capita Income | 319 | $56,943 |
| Median Family Income | 89 | $126,442 |
| Mean Family Income | 89 | $126,013 |
| Median Household Income | 148 | $103,636 |
| Mean Household Income | 148 | $102,553 |
| Income Deficit | 89 | $0 |
| Wage / Income Gap (%) | 319 | 0.00% |
| Wage / Income Gap ($) | 319 | 100.00¢ per $1 |
| Gini / Inequality Index | 319 | 0.31 |
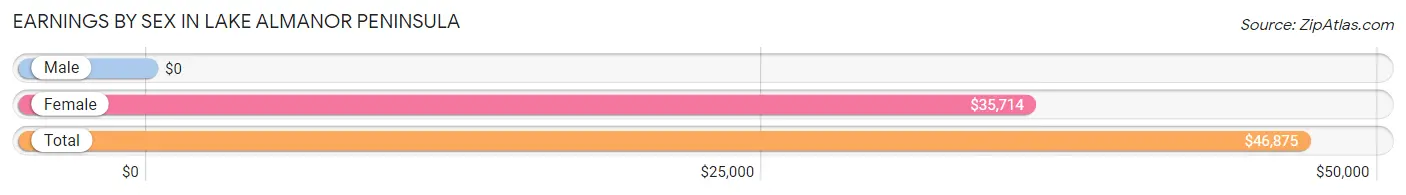
Earnings by Sex in Lake Almanor Peninsula
| Sex | Number | Average Earnings |
| Male | 60 (53.6%) | $0 |
| Female | 52 (46.4%) | $35,714 |
| Total | 112 (100.0%) | $46,875 |
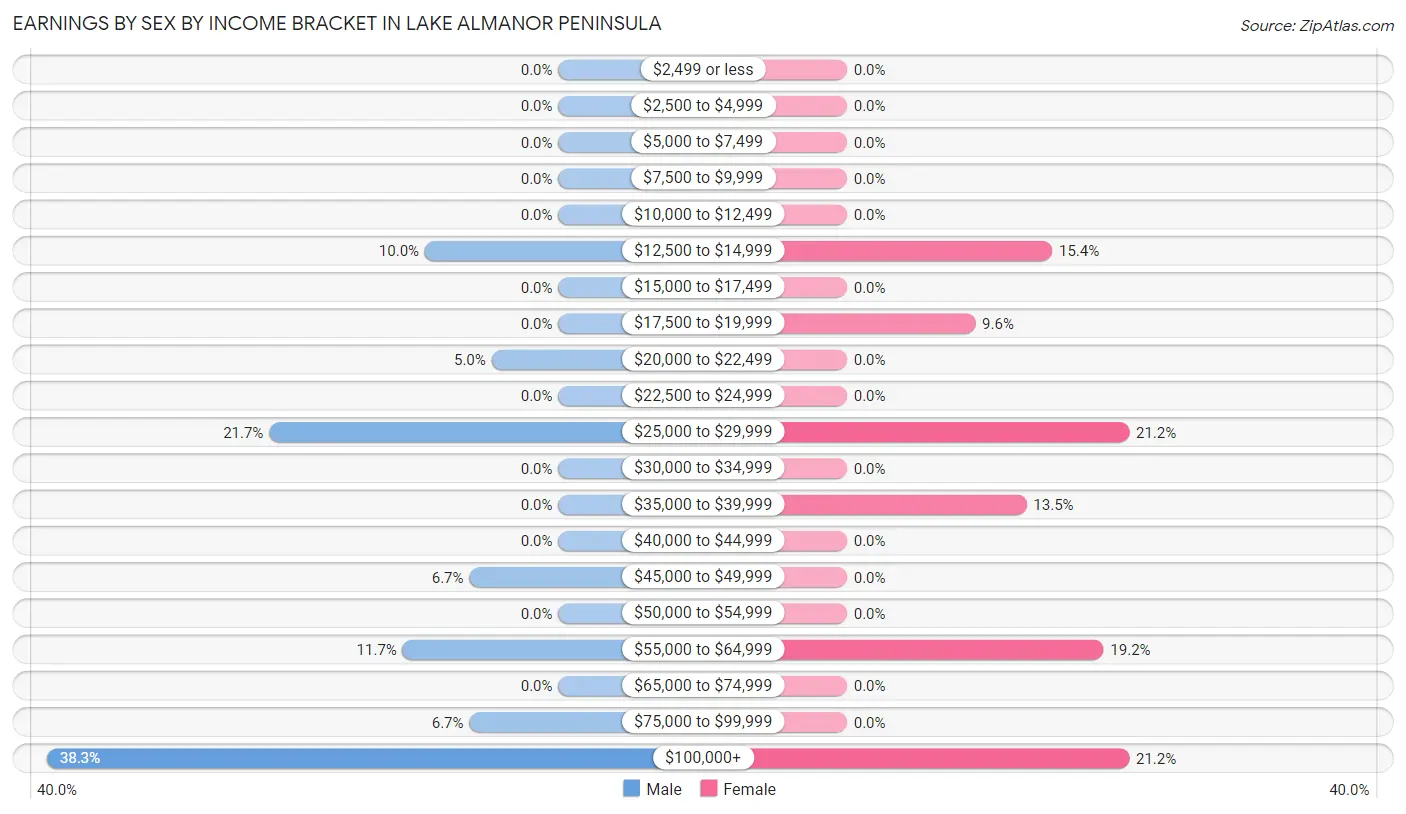
Earnings by Sex by Income Bracket in Lake Almanor Peninsula
The most common earnings brackets in Lake Almanor Peninsula are $100,000+ for men (23 | 38.3%) and $25,000 to $29,999 for women (11 | 21.1%).
| Income | Male | Female |
| $2,499 or less | 0 (0.0%) | 0 (0.0%) |
| $2,500 to $4,999 | 0 (0.0%) | 0 (0.0%) |
| $5,000 to $7,499 | 0 (0.0%) | 0 (0.0%) |
| $7,500 to $9,999 | 0 (0.0%) | 0 (0.0%) |
| $10,000 to $12,499 | 0 (0.0%) | 0 (0.0%) |
| $12,500 to $14,999 | 6 (10.0%) | 8 (15.4%) |
| $15,000 to $17,499 | 0 (0.0%) | 0 (0.0%) |
| $17,500 to $19,999 | 0 (0.0%) | 5 (9.6%) |
| $20,000 to $22,499 | 3 (5.0%) | 0 (0.0%) |
| $22,500 to $24,999 | 0 (0.0%) | 0 (0.0%) |
| $25,000 to $29,999 | 13 (21.7%) | 11 (21.1%) |
| $30,000 to $34,999 | 0 (0.0%) | 0 (0.0%) |
| $35,000 to $39,999 | 0 (0.0%) | 7 (13.5%) |
| $40,000 to $44,999 | 0 (0.0%) | 0 (0.0%) |
| $45,000 to $49,999 | 4 (6.7%) | 0 (0.0%) |
| $50,000 to $54,999 | 0 (0.0%) | 0 (0.0%) |
| $55,000 to $64,999 | 7 (11.7%) | 10 (19.2%) |
| $65,000 to $74,999 | 0 (0.0%) | 0 (0.0%) |
| $75,000 to $99,999 | 4 (6.7%) | 0 (0.0%) |
| $100,000+ | 23 (38.3%) | 11 (21.1%) |
| Total | 60 (100.0%) | 52 (100.0%) |
Earnings by Sex by Educational Attainment in Lake Almanor Peninsula
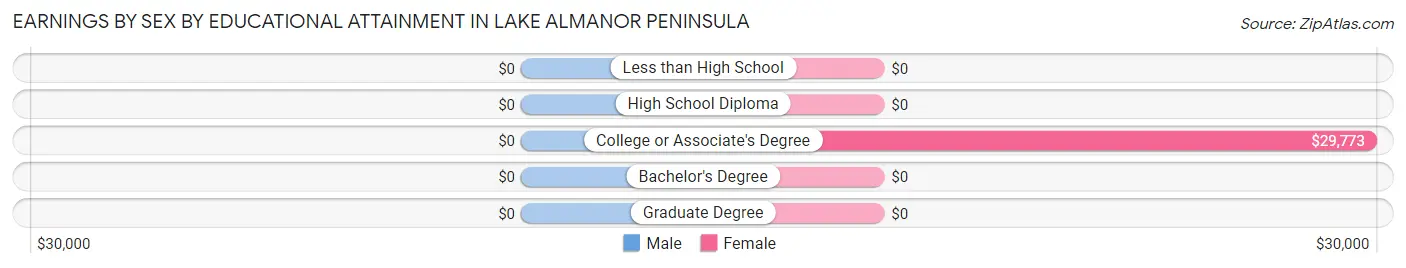
| Educational Attainment | Male Income | Female Income |
| Less than High School | - | - |
| High School Diploma | - | - |
| College or Associate's Degree | - | - |
| Bachelor's Degree | - | - |
| Graduate Degree | - | - |
| Total | - | - |
Family Income in Lake Almanor Peninsula
Family Income Brackets in Lake Almanor Peninsula
According to the Lake Almanor Peninsula family income data, there are 46 families falling into the $100,000 to $149,999 income range, which is the most common income bracket and makes up 51.7% of all families.
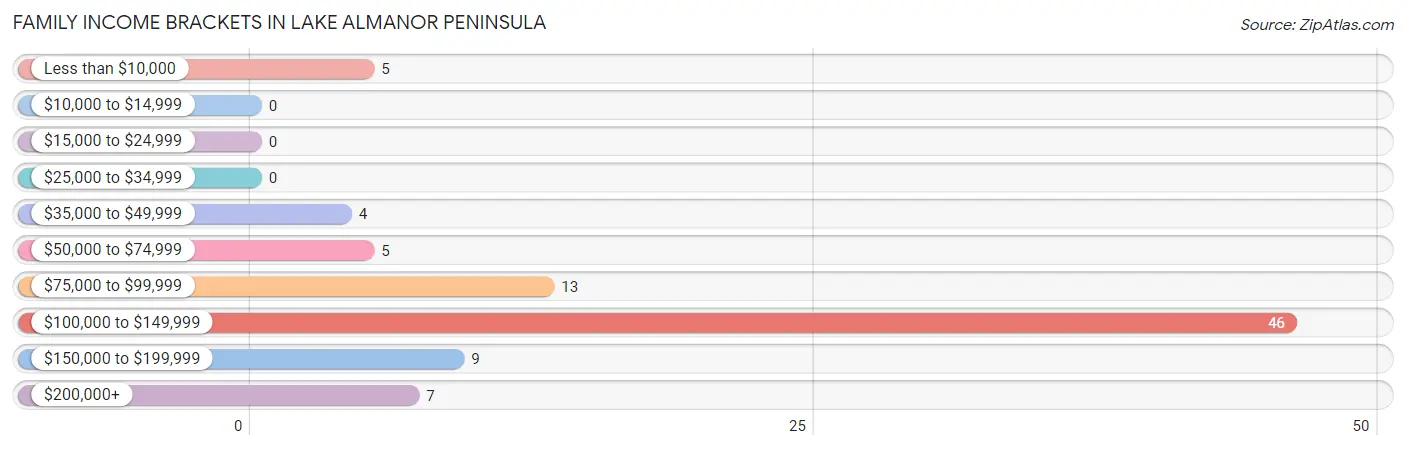
| Income Bracket | # Families | % Families |
| Less than $10,000 | 5 | 5.6% |
| $10,000 to $14,999 | 0 | 0.0% |
| $15,000 to $24,999 | 0 | 0.0% |
| $25,000 to $34,999 | 0 | 0.0% |
| $35,000 to $49,999 | 4 | 4.5% |
| $50,000 to $74,999 | 5 | 5.6% |
| $75,000 to $99,999 | 13 | 14.6% |
| $100,000 to $149,999 | 46 | 51.7% |
| $150,000 to $199,999 | 9 | 10.1% |
| $200,000+ | 7 | 7.9% |
Family Income by Famaliy Size in Lake Almanor Peninsula
3-person families (25 | 28.1%) account for the highest median family income in Lake Almanor Peninsula with $131,771 per family, while 2-person families (64 | 71.9%) have the highest median income of $53,542 per family member.
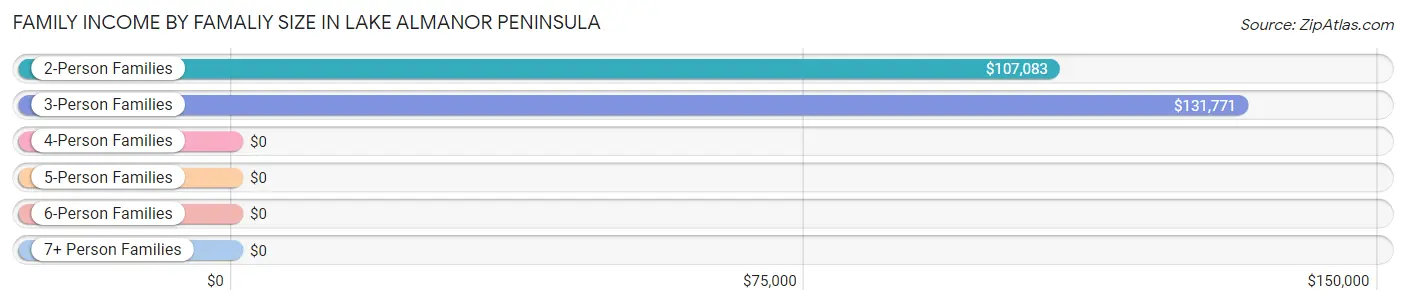
| Income Bracket | # Families | Median Income |
| 2-Person Families | 64 (71.9%) | $107,083 |
| 3-Person Families | 25 (28.1%) | $131,771 |
| 4-Person Families | 0 (0.0%) | $0 |
| 5-Person Families | 0 (0.0%) | $0 |
| 6-Person Families | 0 (0.0%) | $0 |
| 7+ Person Families | 0 (0.0%) | $0 |
| Total | 89 (100.0%) | $126,442 |
Family Income by Number of Earners in Lake Almanor Peninsula
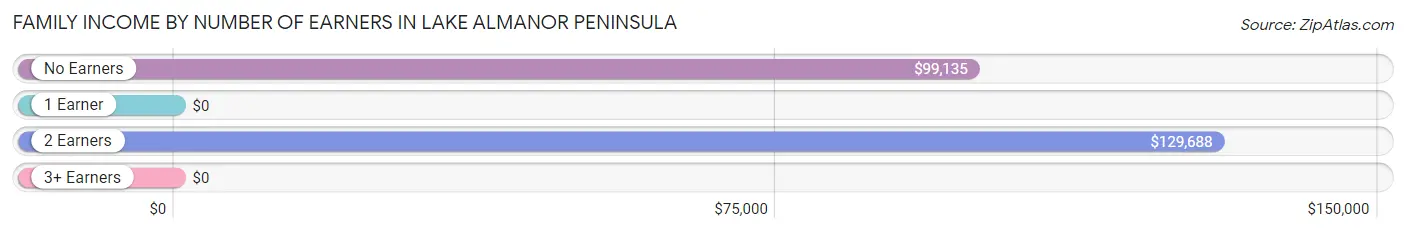
| Number of Earners | # Families | Median Income |
| No Earners | 45 (50.6%) | $99,135 |
| 1 Earner | 13 (14.6%) | $0 |
| 2 Earners | 22 (24.7%) | $129,688 |
| 3+ Earners | 9 (10.1%) | $0 |
| Total | 89 (100.0%) | $126,442 |
Household Income in Lake Almanor Peninsula
Household Income Brackets in Lake Almanor Peninsula
With 63 households falling in the category, the $100,000 to $149,999 income range is the most frequent in Lake Almanor Peninsula, accounting for 42.6% of all households.
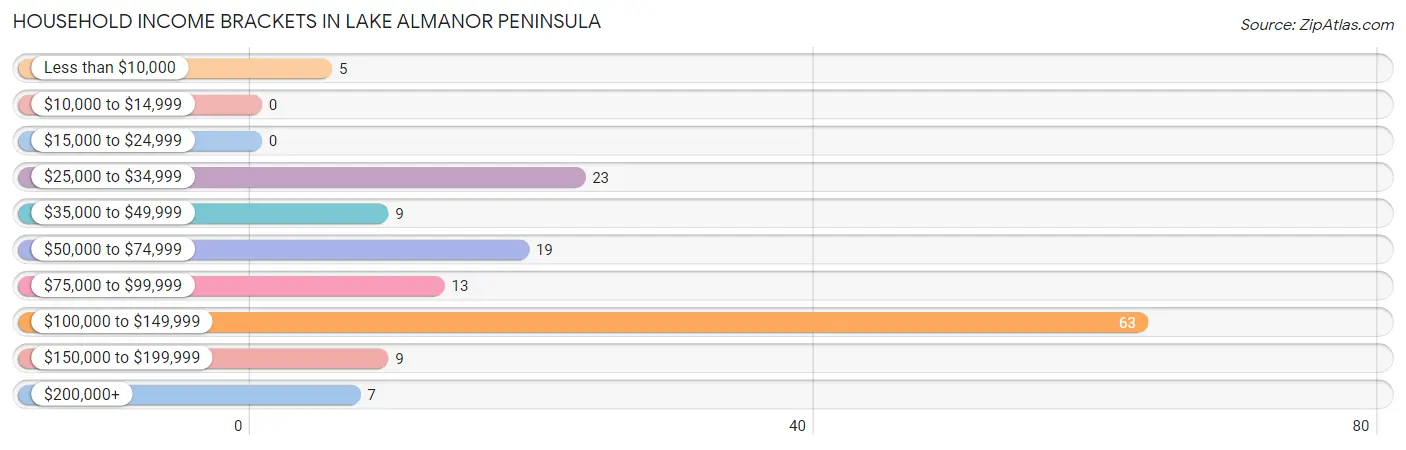
| Income Bracket | # Households | % Households |
| Less than $10,000 | 5 | 3.4% |
| $10,000 to $14,999 | 0 | 0.0% |
| $15,000 to $24,999 | 0 | 0.0% |
| $25,000 to $34,999 | 23 | 15.5% |
| $35,000 to $49,999 | 9 | 6.1% |
| $50,000 to $74,999 | 19 | 12.8% |
| $75,000 to $99,999 | 13 | 8.8% |
| $100,000 to $149,999 | 63 | 42.6% |
| $150,000 to $199,999 | 9 | 6.1% |
| $200,000+ | 7 | 4.7% |
Household Income by Householder Age in Lake Almanor Peninsula
The median household income in Lake Almanor Peninsula is $103,636, with the highest median household income of $99,904 found in the 65+ years age bracket for the primary householder. A total of 81 households (54.7%) fall into this category.
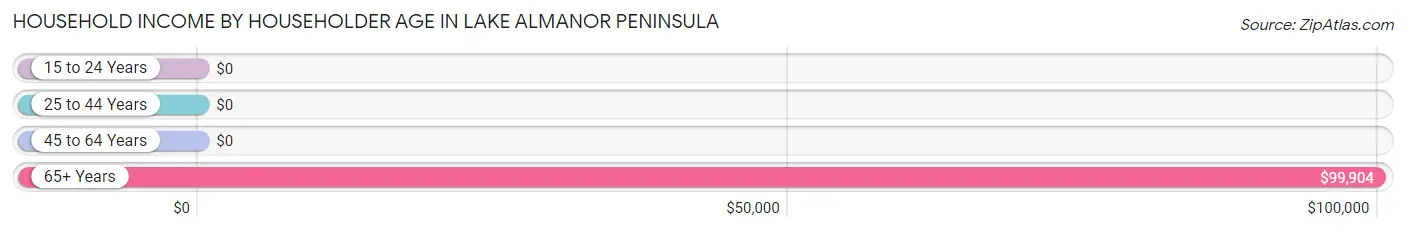
| Income Bracket | # Households | Median Income |
| 15 to 24 Years | 0 (0.0%) | $0 |
| 25 to 44 Years | 15 (10.1%) | $0 |
| 45 to 64 Years | 52 (35.1%) | $0 |
| 65+ Years | 81 (54.7%) | $99,904 |
| Total | 148 (100.0%) | $103,636 |
Poverty in Lake Almanor Peninsula
Income Below Poverty by Sex and Age in Lake Almanor Peninsula
With 3.2% poverty level for males and 3.7% for females among the residents of Lake Almanor Peninsula, 75 year old and over males and 65 to 74 year old females are the most vulnerable to poverty, with 5 males (19.2%) and 6 females (21.4%) in their respective age groups living below the poverty level.
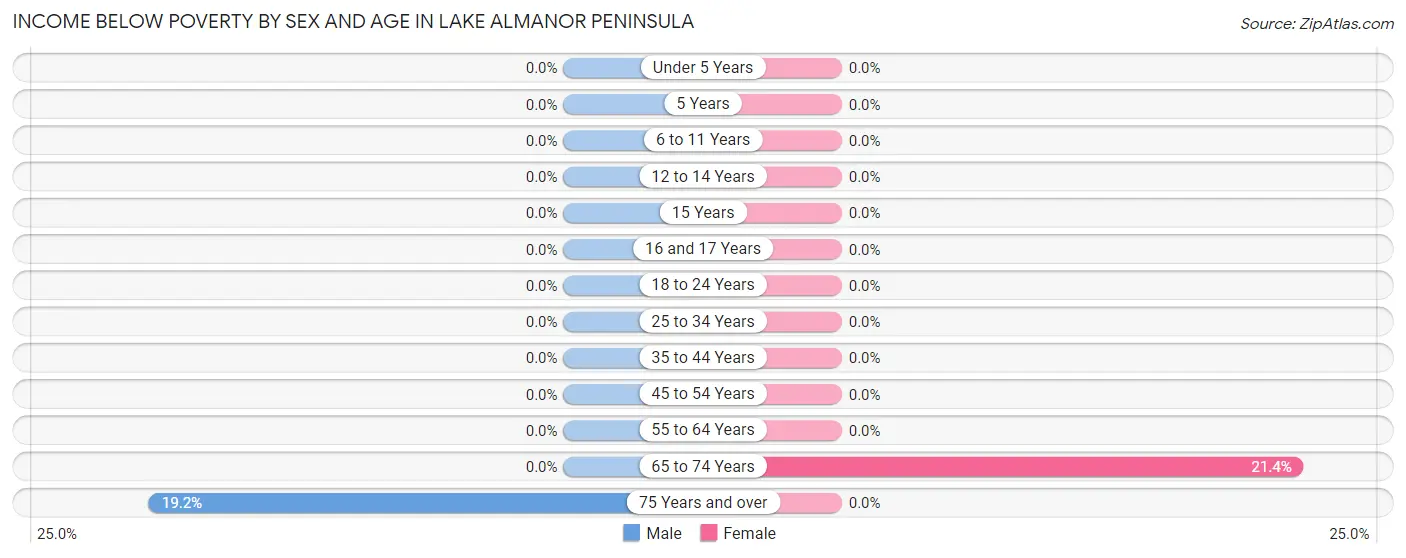
| Age Bracket | Male | Female |
| Under 5 Years | 0 (0.0%) | 0 (0.0%) |
| 5 Years | 0 (0.0%) | 0 (0.0%) |
| 6 to 11 Years | 0 (0.0%) | 0 (0.0%) |
| 12 to 14 Years | 0 (0.0%) | 0 (0.0%) |
| 15 Years | 0 (0.0%) | 0 (0.0%) |
| 16 and 17 Years | 0 (0.0%) | 0 (0.0%) |
| 18 to 24 Years | 0 (0.0%) | 0 (0.0%) |
| 25 to 34 Years | 0 (0.0%) | 0 (0.0%) |
| 35 to 44 Years | 0 (0.0%) | 0 (0.0%) |
| 45 to 54 Years | 0 (0.0%) | 0 (0.0%) |
| 55 to 64 Years | 0 (0.0%) | 0 (0.0%) |
| 65 to 74 Years | 0 (0.0%) | 6 (21.4%) |
| 75 Years and over | 5 (19.2%) | 0 (0.0%) |
| Total | 5 (3.2%) | 6 (3.7%) |
Income Above Poverty by Sex and Age in Lake Almanor Peninsula
According to the poverty statistics in Lake Almanor Peninsula, males aged 6 to 11 years and females aged 25 to 34 years are the age groups that are most secure financially, with 100.0% of males and 100.0% of females in these age groups living above the poverty line.
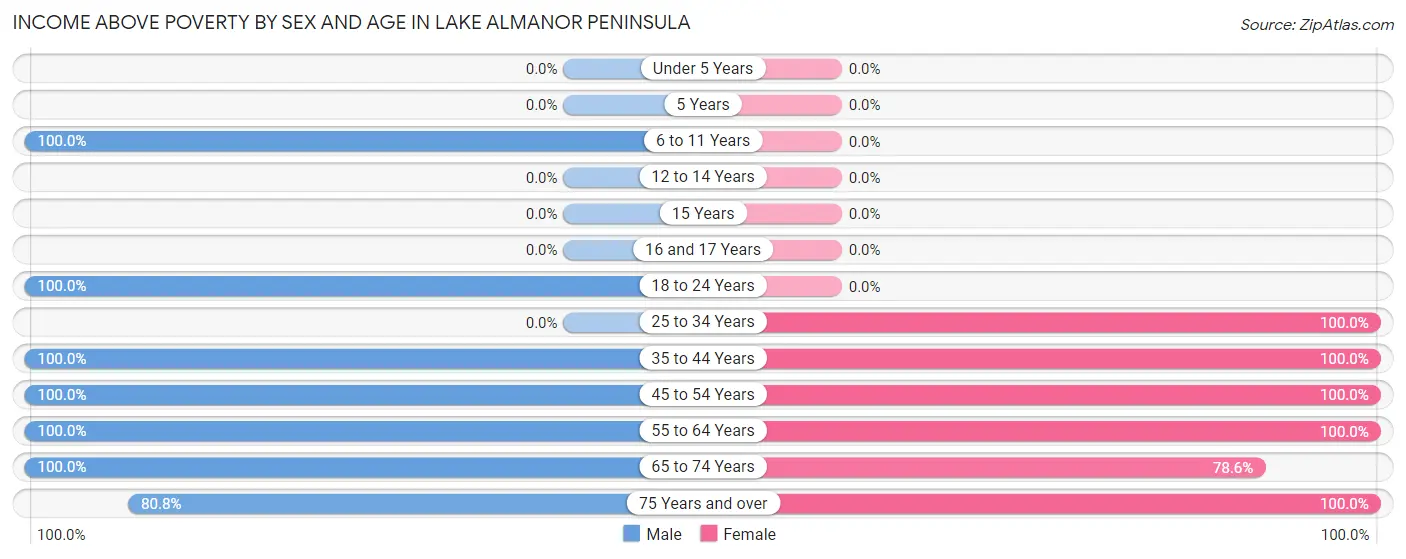
| Age Bracket | Male | Female |
| Under 5 Years | 0 (0.0%) | 0 (0.0%) |
| 5 Years | 0 (0.0%) | 0 (0.0%) |
| 6 to 11 Years | 4 (100.0%) | 0 (0.0%) |
| 12 to 14 Years | 0 (0.0%) | 0 (0.0%) |
| 15 Years | 0 (0.0%) | 0 (0.0%) |
| 16 and 17 Years | 0 (0.0%) | 0 (0.0%) |
| 18 to 24 Years | 6 (100.0%) | 0 (0.0%) |
| 25 to 34 Years | 0 (0.0%) | 7 (100.0%) |
| 35 to 44 Years | 11 (100.0%) | 11 (100.0%) |
| 45 to 54 Years | 6 (100.0%) | 8 (100.0%) |
| 55 to 64 Years | 26 (100.0%) | 80 (100.0%) |
| 65 to 74 Years | 79 (100.0%) | 22 (78.6%) |
| 75 Years and over | 21 (80.8%) | 27 (100.0%) |
| Total | 153 (96.8%) | 155 (96.3%) |
Income Below Poverty Among Married-Couple Families in Lake Almanor Peninsula
The poverty statistics for married-couple families in Lake Almanor Peninsula show that 6.5% or 5 of the total 77 families live below the poverty line. Families with no children have the highest poverty rate of 6.9%, comprising of 5 families. On the other hand, families with 1 or 2 children have the lowest poverty rate of 0.0%, which includes 0 families.
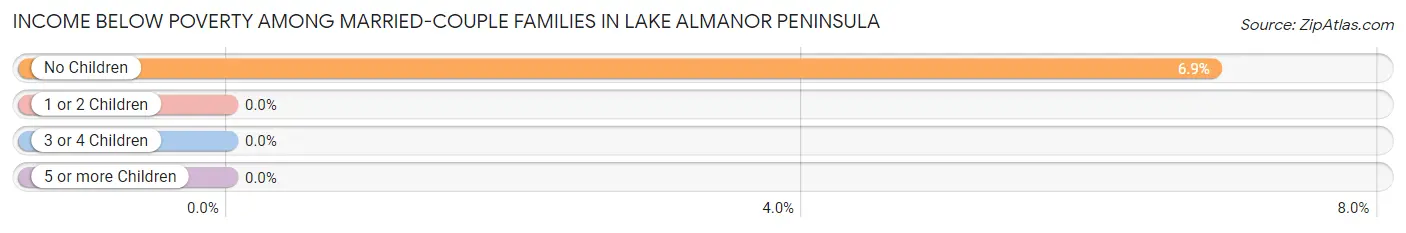
| Children | Above Poverty | Below Poverty |
| No Children | 68 (93.1%) | 5 (6.9%) |
| 1 or 2 Children | 4 (100.0%) | 0 (0.0%) |
| 3 or 4 Children | 0 (0.0%) | 0 (0.0%) |
| 5 or more Children | 0 (0.0%) | 0 (0.0%) |
| Total | 72 (93.5%) | 5 (6.5%) |
Income Below Poverty Among Single-Parent Households in Lake Almanor Peninsula
| Children | Single Father | Single Mother |
| No Children | 0 (0.0%) | 0 (0.0%) |
| 1 or 2 Children | 0 (0.0%) | 0 (0.0%) |
| 3 or 4 Children | 0 (0.0%) | 0 (0.0%) |
| 5 or more Children | 0 (0.0%) | 0 (0.0%) |
| Total | 0 (0.0%) | 0 (0.0%) |
Income Below Poverty Among Married-Couple vs Single-Parent Households in Lake Almanor Peninsula
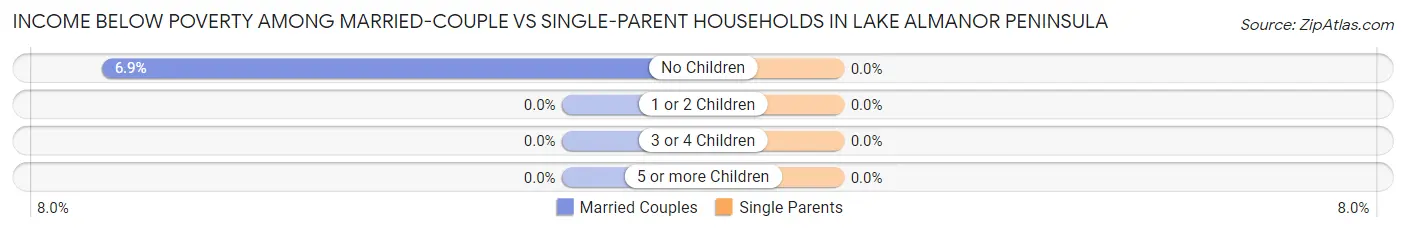
| Children | Married-Couple Families | Single-Parent Households |
| No Children | 5 (6.9%) | 0 (0.0%) |
| 1 or 2 Children | 0 (0.0%) | 0 (0.0%) |
| 3 or 4 Children | 0 (0.0%) | 0 (0.0%) |
| 5 or more Children | 0 (0.0%) | 0 (0.0%) |
| Total | 5 (6.5%) | 0 (0.0%) |
Race in Lake Almanor Peninsula
The most populous races in Lake Almanor Peninsula are White / Caucasian (311 | 97.5%), Hispanic or Latino (35 | 11.0%), and Two or more Races (8 | 2.5%).
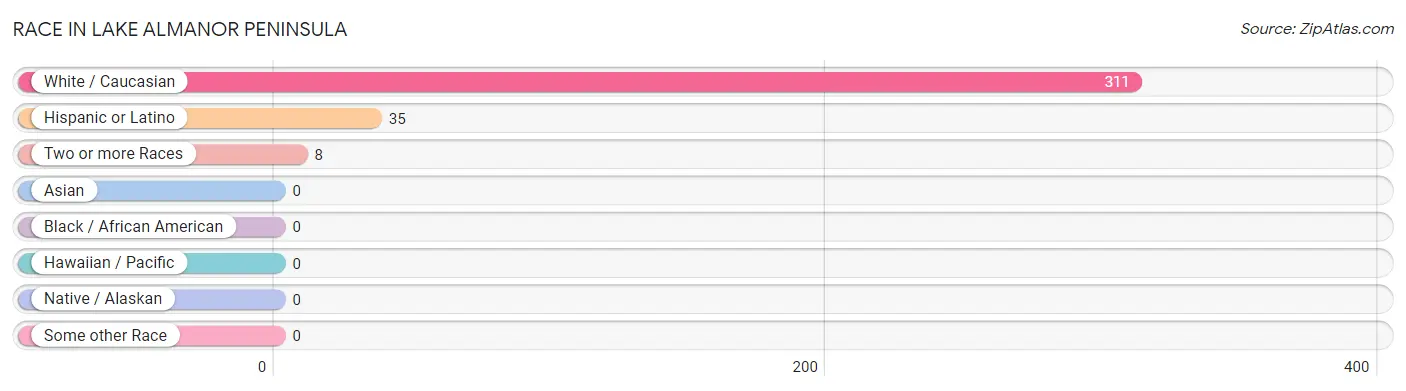
| Race | # Population | % Population |
| Asian | 0 | 0.0% |
| Black / African American | 0 | 0.0% |
| Hawaiian / Pacific | 0 | 0.0% |
| Hispanic or Latino | 35 | 11.0% |
| Native / Alaskan | 0 | 0.0% |
| White / Caucasian | 311 | 97.5% |
| Two or more Races | 8 | 2.5% |
| Some other Race | 0 | 0.0% |
| Total | 319 | 100.0% |
Ancestry in Lake Almanor Peninsula
The most populous ancestries reported in Lake Almanor Peninsula are English (69 | 21.6%), German (50 | 15.7%), Irish (43 | 13.5%), Mexican (27 | 8.5%), and European (25 | 7.8%), together accounting for 67.1% of all Lake Almanor Peninsula residents.
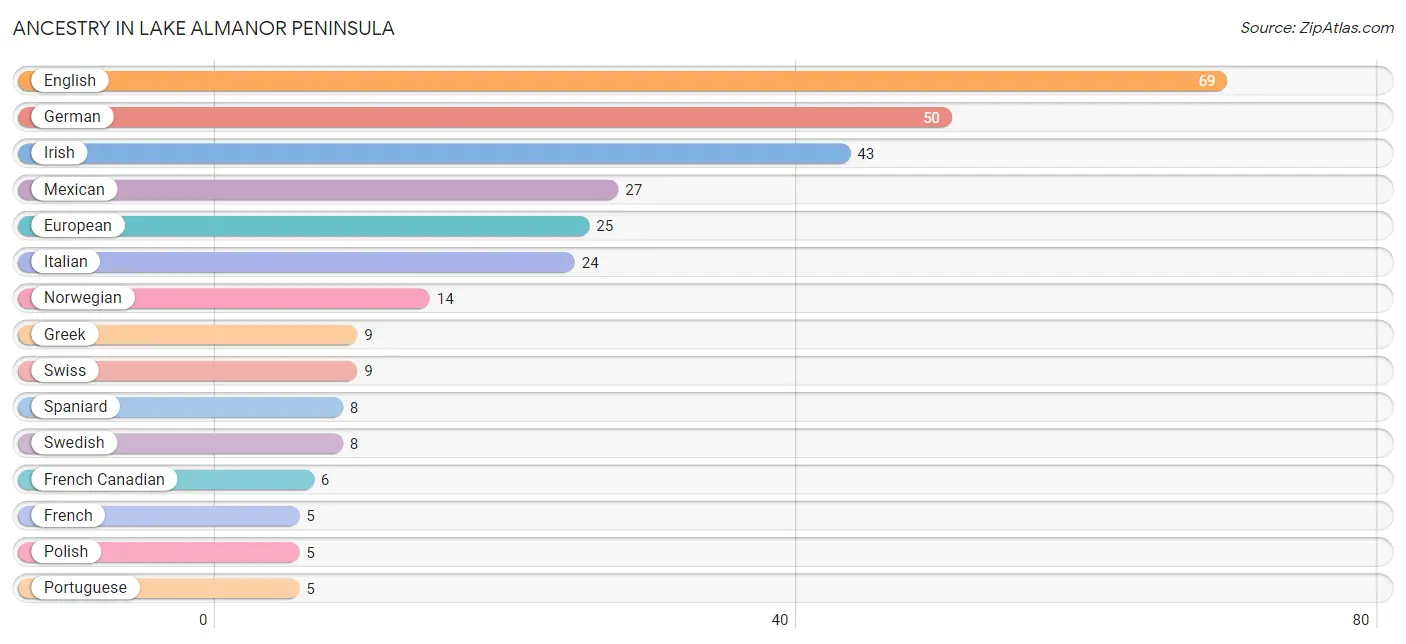
| Ancestry | # Population | % Population |
| English | 69 | 21.6% |
| European | 25 | 7.8% |
| French | 5 | 1.6% |
| French Canadian | 6 | 1.9% |
| German | 50 | 15.7% |
| Greek | 9 | 2.8% |
| Irish | 43 | 13.5% |
| Italian | 24 | 7.5% |
| Mexican | 27 | 8.5% |
| Norwegian | 14 | 4.4% |
| Polish | 5 | 1.6% |
| Portuguese | 5 | 1.6% |
| Spaniard | 8 | 2.5% |
| Swedish | 8 | 2.5% |
| Swiss | 9 | 2.8% | View All 15 Rows |
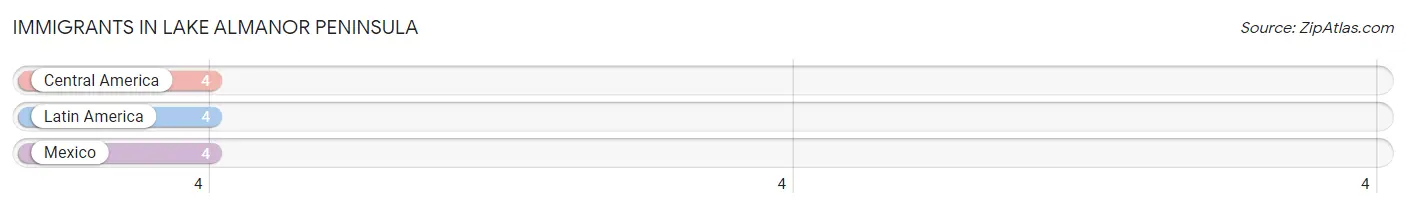
Immigrants in Lake Almanor Peninsula
The most numerous immigrant groups reported in Lake Almanor Peninsula came from Central America (4 | 1.3%), Latin America (4 | 1.3%), and Mexico (4 | 1.3%), together accounting for 3.8% of all Lake Almanor Peninsula residents.
| Immigration Origin | # Population | % Population |
| Central America | 4 | 1.3% |
| Latin America | 4 | 1.3% |
| Mexico | 4 | 1.3% | View All 3 Rows |
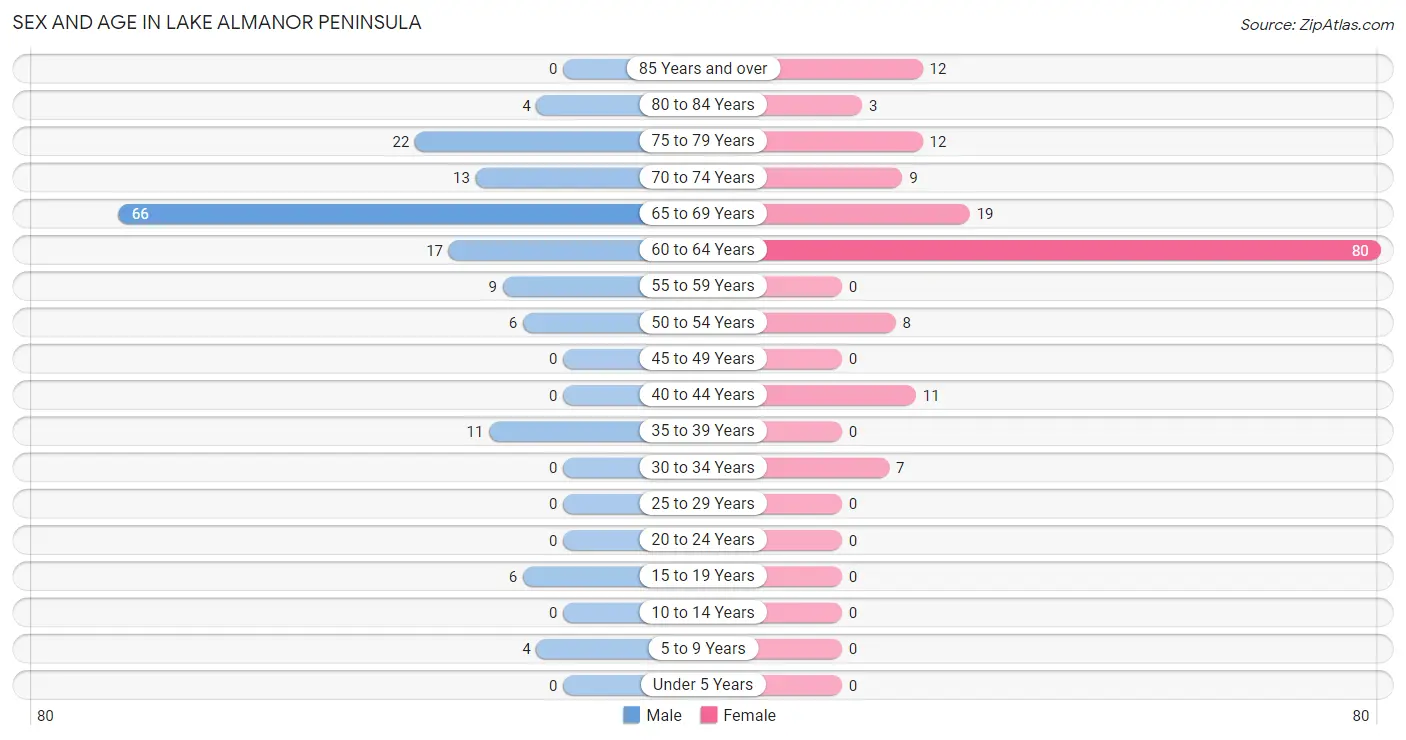
Sex and Age in Lake Almanor Peninsula
Sex and Age in Lake Almanor Peninsula
The most populous age groups in Lake Almanor Peninsula are 65 to 69 Years (66 | 41.8%) for men and 60 to 64 Years (80 | 49.7%) for women.
| Age Bracket | Male | Female |
| Under 5 Years | 0 (0.0%) | 0 (0.0%) |
| 5 to 9 Years | 4 (2.5%) | 0 (0.0%) |
| 10 to 14 Years | 0 (0.0%) | 0 (0.0%) |
| 15 to 19 Years | 6 (3.8%) | 0 (0.0%) |
| 20 to 24 Years | 0 (0.0%) | 0 (0.0%) |
| 25 to 29 Years | 0 (0.0%) | 0 (0.0%) |
| 30 to 34 Years | 0 (0.0%) | 7 (4.3%) |
| 35 to 39 Years | 11 (7.0%) | 0 (0.0%) |
| 40 to 44 Years | 0 (0.0%) | 11 (6.8%) |
| 45 to 49 Years | 0 (0.0%) | 0 (0.0%) |
| 50 to 54 Years | 6 (3.8%) | 8 (5.0%) |
| 55 to 59 Years | 9 (5.7%) | 0 (0.0%) |
| 60 to 64 Years | 17 (10.8%) | 80 (49.7%) |
| 65 to 69 Years | 66 (41.8%) | 19 (11.8%) |
| 70 to 74 Years | 13 (8.2%) | 9 (5.6%) |
| 75 to 79 Years | 22 (13.9%) | 12 (7.4%) |
| 80 to 84 Years | 4 (2.5%) | 3 (1.9%) |
| 85 Years and over | 0 (0.0%) | 12 (7.4%) |
| Total | 158 (100.0%) | 161 (100.0%) |
Families and Households in Lake Almanor Peninsula
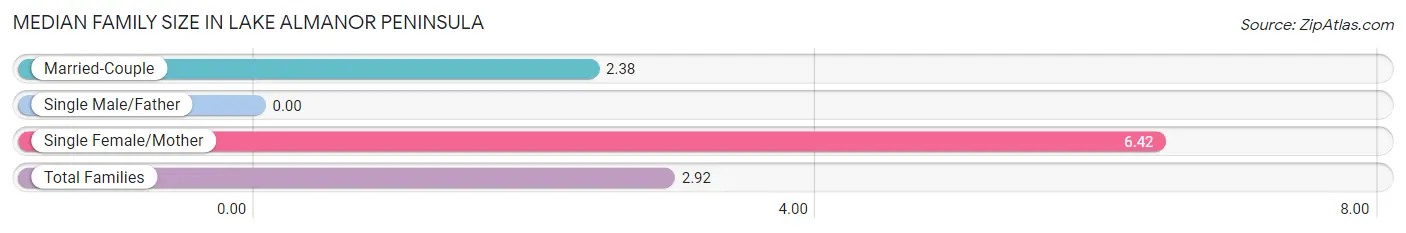
Median Family Size in Lake Almanor Peninsula
| Family Type | # Families | Family Size |
| Married-Couple | 77 (86.5%) | 2.38 |
| Single Male/Father | 0 (0.0%) | - |
| Single Female/Mother | 12 (13.5%) | 6.42 |
| Total Families | 89 (100.0%) | 2.92 |
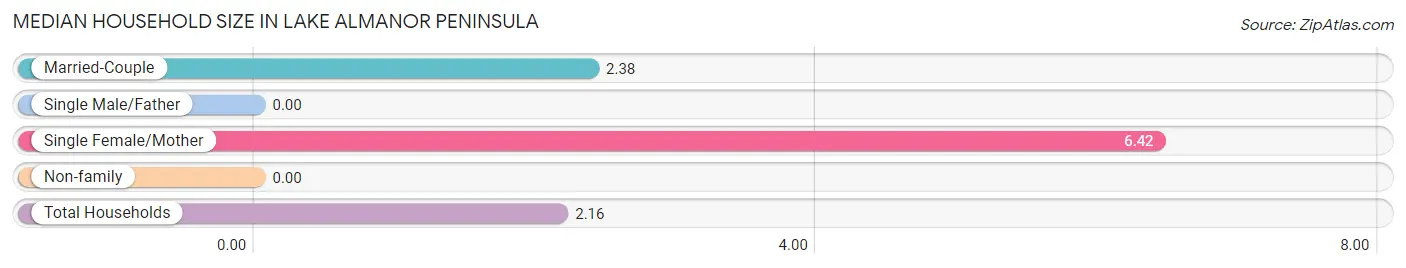
Median Household Size in Lake Almanor Peninsula
| Household Type | # Households | Household Size |
| Married-Couple | 77 (52.0%) | 2.38 |
| Single Male/Father | 0 (0.0%) | - |
| Single Female/Mother | 12 (8.1%) | 6.42 |
| Non-family | 59 (39.9%) | - |
| Total Households | 148 (100.0%) | 2.16 |
Household Size by Marriage Status in Lake Almanor Peninsula
Out of a total of 148 households in Lake Almanor Peninsula, 89 (60.1%) are family households, while 59 (39.9%) are nonfamily households. The most numerous type of family households are 2-person households, comprising 64, and the most common type of nonfamily households are 1-person households, comprising 59.
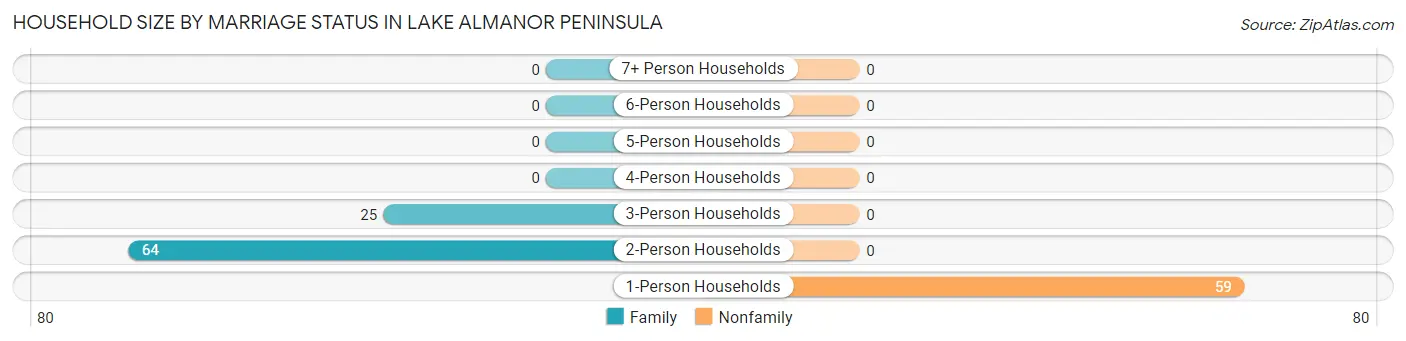
| Household Size | Family Households | Nonfamily Households |
| 1-Person Households | - | 59 (39.9%) |
| 2-Person Households | 64 (43.2%) | 0 (0.0%) |
| 3-Person Households | 25 (16.9%) | 0 (0.0%) |
| 4-Person Households | 0 (0.0%) | 0 (0.0%) |
| 5-Person Households | 0 (0.0%) | 0 (0.0%) |
| 6-Person Households | 0 (0.0%) | 0 (0.0%) |
| 7+ Person Households | 0 (0.0%) | 0 (0.0%) |
| Total | 89 (60.1%) | 59 (39.9%) |
Female Fertility in Lake Almanor Peninsula
Fertility by Age in Lake Almanor Peninsula
| Age Bracket | Women with Births | Births / 1,000 Women |
| 15 to 19 years | 0 (0.0%) | 0.0 |
| 20 to 34 years | 0 (0.0%) | 0.0 |
| 35 to 50 years | 0 (0.0%) | 0.0 |
| Total | 0 (0.0%) | 0.0 |
Fertility by Age by Marriage Status in Lake Almanor Peninsula
| Age Bracket | Married | Unmarried |
| 15 to 19 years | 0 (0.0%) | 0 (0.0%) |
| 20 to 34 years | 0 (0.0%) | 0 (0.0%) |
| 35 to 50 years | 0 (0.0%) | 0 (0.0%) |
| Total | 0 (0.0%) | 0 (0.0%) |
Fertility by Education in Lake Almanor Peninsula
| Educational Attainment | Women with Births | Births / 1,000 Women |
| Less than High School | 0 (0.0%) | 0.0 |
| High School Diploma | 0 (0.0%) | 0.0 |
| College or Associate's Degree | 0 (0.0%) | 0.0 |
| Bachelor's Degree | 0 (0.0%) | 0.0 |
| Graduate Degree | 0 (0.0%) | 0.0 |
| Total | 0 (0.0%) | 0.0 |
Fertility by Education by Marriage Status in Lake Almanor Peninsula
| Educational Attainment | Married | Unmarried |
| Less than High School | 0 (0.0%) | 0 (0.0%) |
| High School Diploma | 0 (0.0%) | 0 (0.0%) |
| College or Associate's Degree | 0 (0.0%) | 0 (0.0%) |
| Bachelor's Degree | 0 (0.0%) | 0 (0.0%) |
| Graduate Degree | 0 (0.0%) | 0 (0.0%) |
| Total | 0 (0.0%) | 0 (0.0%) |
Employment Characteristics in Lake Almanor Peninsula
Employment by Class of Employer in Lake Almanor Peninsula
Among the 104 employed individuals in Lake Almanor Peninsula, private company employees (39 | 37.5%), self-employed (incorporated) (27 | 26.0%), and local government employees (15 | 14.4%) make up the most common classes of employment.
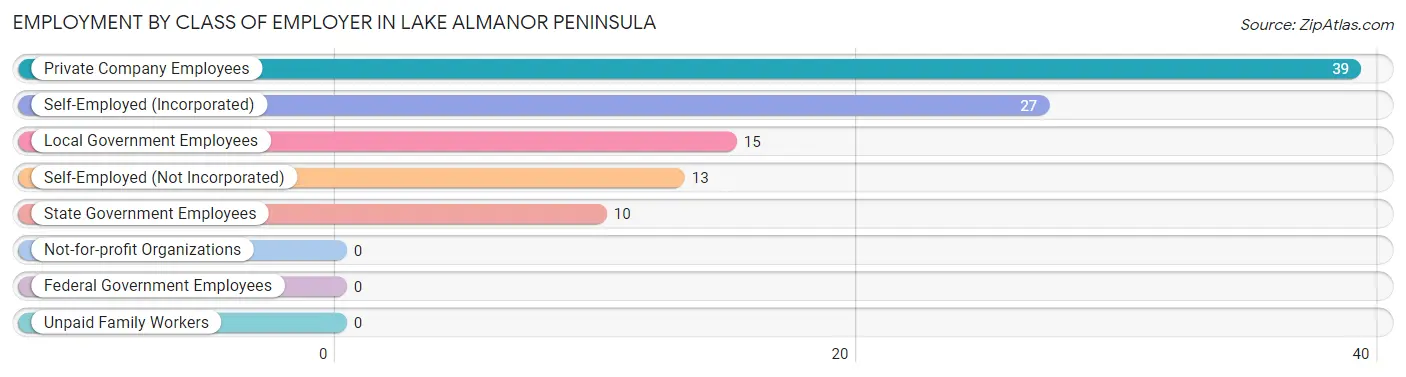
| Employer Class | # Employees | % Employees |
| Private Company Employees | 39 | 37.5% |
| Self-Employed (Incorporated) | 27 | 26.0% |
| Self-Employed (Not Incorporated) | 13 | 12.5% |
| Not-for-profit Organizations | 0 | 0.0% |
| Local Government Employees | 15 | 14.4% |
| State Government Employees | 10 | 9.6% |
| Federal Government Employees | 0 | 0.0% |
| Unpaid Family Workers | 0 | 0.0% |
| Total | 104 | 100.0% |
Employment Status by Age in Lake Almanor Peninsula
According to the labor force statistics for Lake Almanor Peninsula, out of the total population over 16 years of age (315), 35.6% or 112 individuals are in the labor force, with 7.1% or 8 of them unemployed. The age group with the highest labor force participation rate is 16 to 19 years, with 100.0% or 6 individuals in the labor force. Within the labor force, the 60 to 64 years age range has the highest percentage of unemployed individuals, with 20.0% or 8 of them being unemployed.
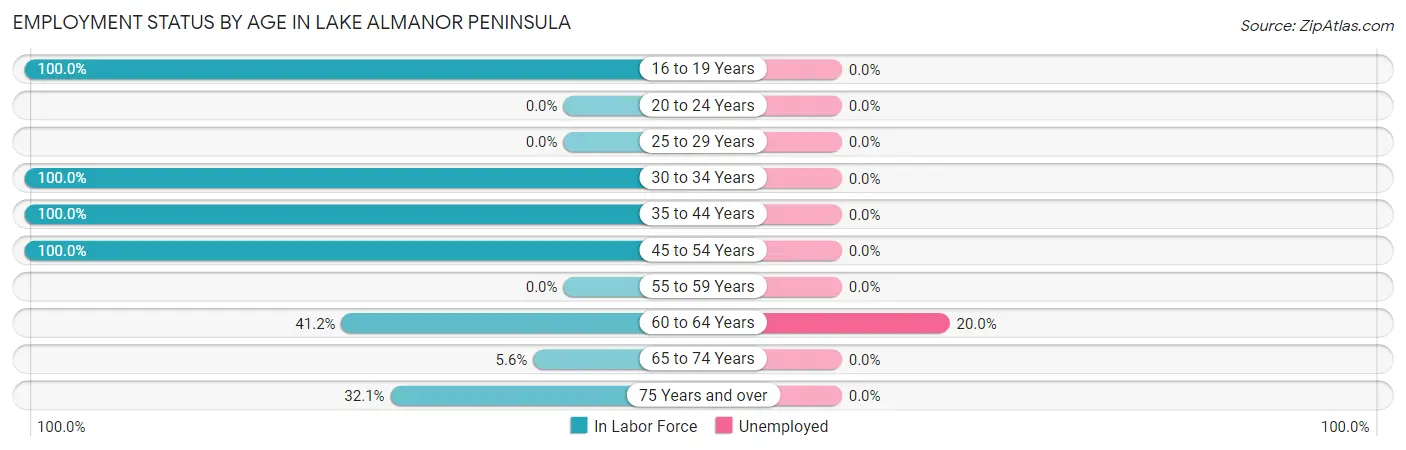
| Age Bracket | In Labor Force | Unemployed |
| 16 to 19 Years | 6 (100.0%) | 0 (0.0%) |
| 20 to 24 Years | 0 (0.0%) | 0 (0.0%) |
| 25 to 29 Years | 0 (0.0%) | 0 (0.0%) |
| 30 to 34 Years | 7 (100.0%) | 0 (0.0%) |
| 35 to 44 Years | 22 (100.0%) | 0 (0.0%) |
| 45 to 54 Years | 14 (100.0%) | 0 (0.0%) |
| 55 to 59 Years | 0 (0.0%) | 0 (0.0%) |
| 60 to 64 Years | 40 (41.2%) | 8 (20.0%) |
| 65 to 74 Years | 6 (5.6%) | 0 (0.0%) |
| 75 Years and over | 17 (32.1%) | 0 (0.0%) |
| Total | 112 (35.6%) | 8 (7.1%) |
Employment Status by Educational Attainment in Lake Almanor Peninsula
According to labor force statistics for Lake Almanor Peninsula, 55.7% of individuals (83) out of the total population between 25 and 64 years of age (149) are in the labor force, with 9.6% or 8 of them being unemployed. The group with the highest labor force participation rate are those with the educational attainment of bachelor's degree or higher, with 72.0% or 36 individuals in the labor force. Within the labor force, individuals with college / associate degree education have the highest percentage of unemployment, with 19.5% or 8 of them being unemployed.
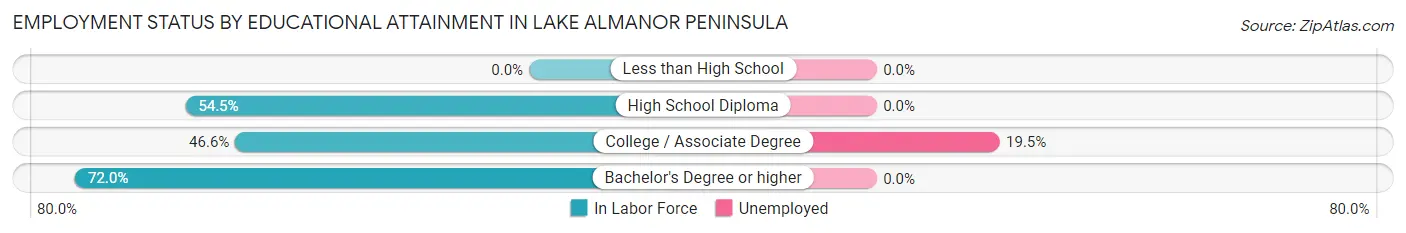
| Educational Attainment | In Labor Force | Unemployed |
| Less than High School | 0 (0.0%) | 0 (0.0%) |
| High School Diploma | 6 (54.5%) | 0 (0.0%) |
| College / Associate Degree | 41 (46.6%) | 17 (19.5%) |
| Bachelor's Degree or higher | 36 (72.0%) | 0 (0.0%) |
| Total | 83 (55.7%) | 14 (9.6%) |
Employment Occupations by Sex in Lake Almanor Peninsula
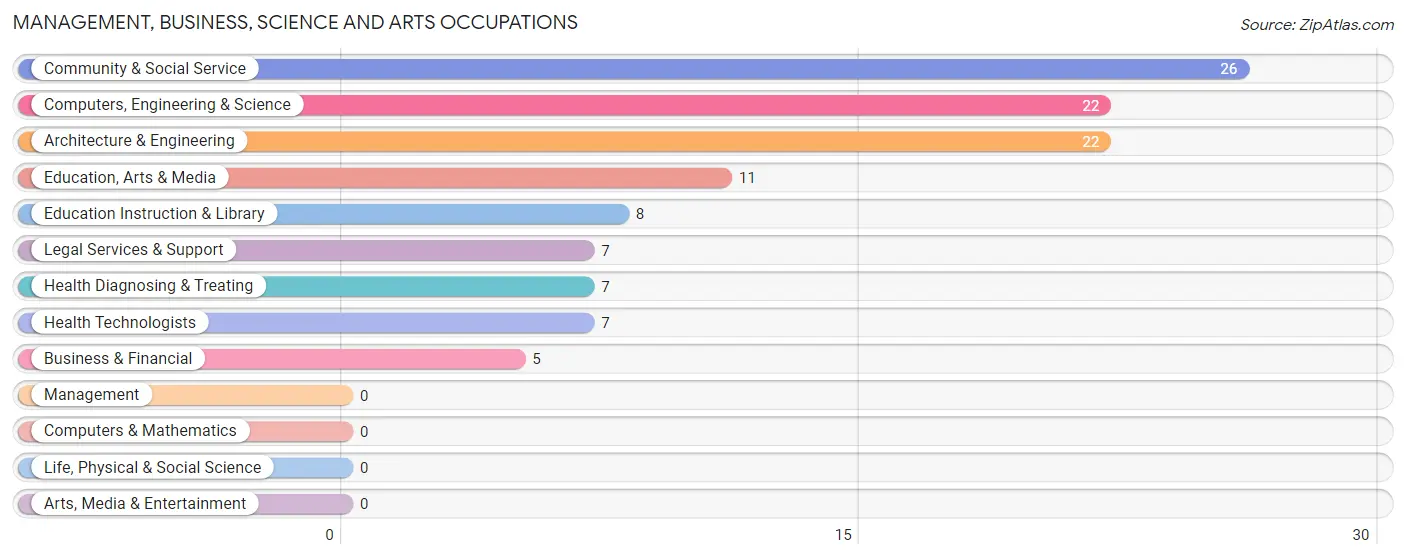
Management, Business, Science and Arts Occupations
The most common Management, Business, Science and Arts occupations in Lake Almanor Peninsula are Community & Social Service (26 | 25.0%), Computers, Engineering & Science (22 | 21.1%), Architecture & Engineering (22 | 21.1%), Education, Arts & Media (11 | 10.6%), and Education Instruction & Library (8 | 7.7%).
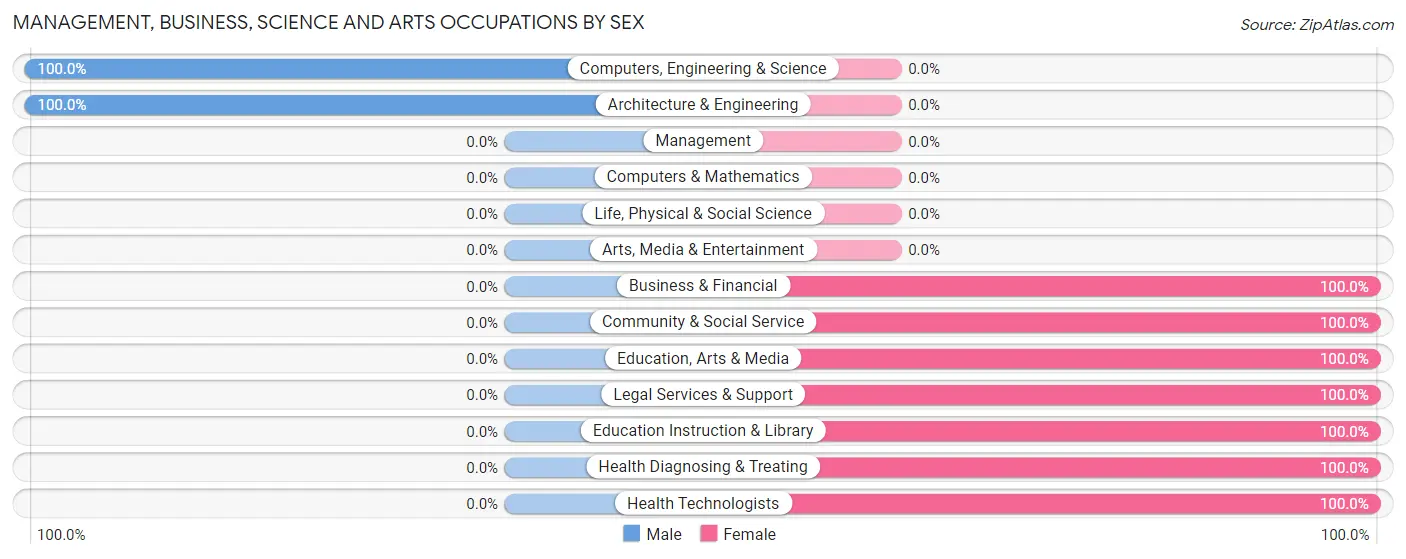
Management, Business, Science and Arts Occupations by Sex
Within the Management, Business, Science and Arts occupations in Lake Almanor Peninsula, the most male-oriented occupations are Computers, Engineering & Science (100.0%), and Architecture & Engineering (100.0%), while the most female-oriented occupations are Business & Financial (100.0%), Community & Social Service (100.0%), and Education, Arts & Media (100.0%).
| Occupation | Male | Female |
| Management | 0 (0.0%) | 0 (0.0%) |
| Business & Financial | 0 (0.0%) | 5 (100.0%) |
| Computers, Engineering & Science | 22 (100.0%) | 0 (0.0%) |
| Computers & Mathematics | 0 (0.0%) | 0 (0.0%) |
| Architecture & Engineering | 22 (100.0%) | 0 (0.0%) |
| Life, Physical & Social Science | 0 (0.0%) | 0 (0.0%) |
| Community & Social Service | 0 (0.0%) | 26 (100.0%) |
| Education, Arts & Media | 0 (0.0%) | 11 (100.0%) |
| Legal Services & Support | 0 (0.0%) | 7 (100.0%) |
| Education Instruction & Library | 0 (0.0%) | 8 (100.0%) |
| Arts, Media & Entertainment | 0 (0.0%) | 0 (0.0%) |
| Health Diagnosing & Treating | 0 (0.0%) | 7 (100.0%) |
| Health Technologists | 0 (0.0%) | 7 (100.0%) |
| Total (Category) | 22 (36.7%) | 38 (63.3%) |
| Total (Overall) | 60 (57.7%) | 44 (42.3%) |
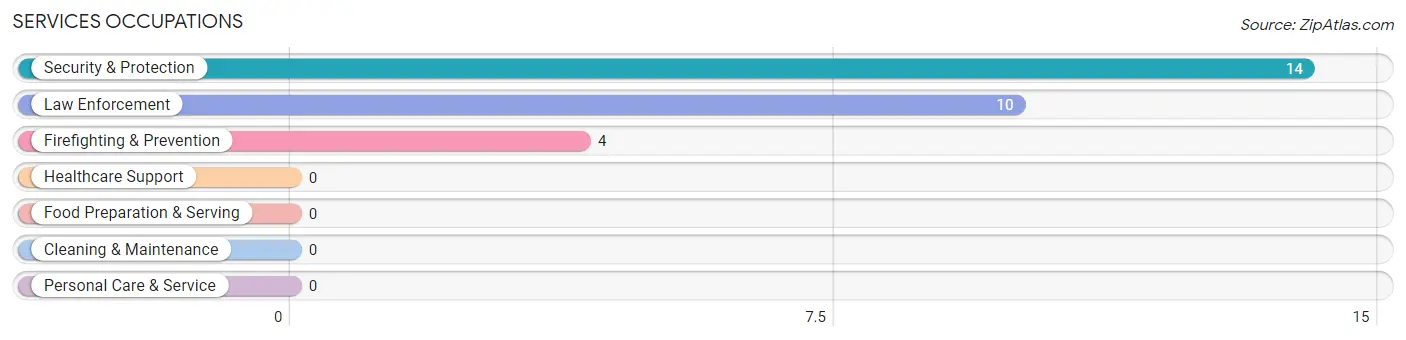
Services Occupations
The most common Services occupations in Lake Almanor Peninsula are Security & Protection (14 | 13.5%), Law Enforcement (10 | 9.6%), and Firefighting & Prevention (4 | 3.8%).
Services Occupations by Sex
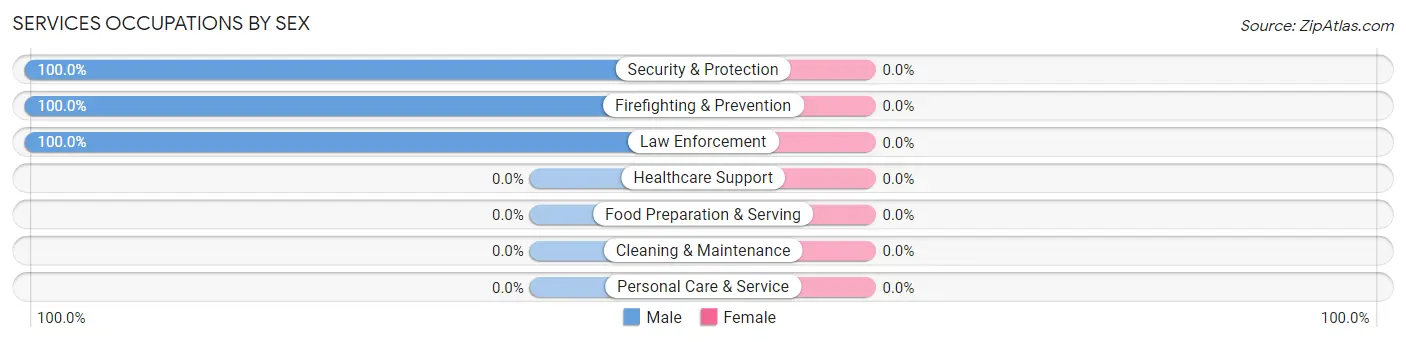
| Occupation | Male | Female |
| Healthcare Support | 0 (0.0%) | 0 (0.0%) |
| Security & Protection | 14 (100.0%) | 0 (0.0%) |
| Firefighting & Prevention | 4 (100.0%) | 0 (0.0%) |
| Law Enforcement | 10 (100.0%) | 0 (0.0%) |
| Food Preparation & Serving | 0 (0.0%) | 0 (0.0%) |
| Cleaning & Maintenance | 0 (0.0%) | 0 (0.0%) |
| Personal Care & Service | 0 (0.0%) | 0 (0.0%) |
| Total (Category) | 14 (100.0%) | 0 (0.0%) |
| Total (Overall) | 60 (57.7%) | 44 (42.3%) |
Sales and Office Occupations
The most common Sales and Office occupations in Lake Almanor Peninsula are Office & Administration (11 | 10.6%), and Sales & Related (3 | 2.9%).
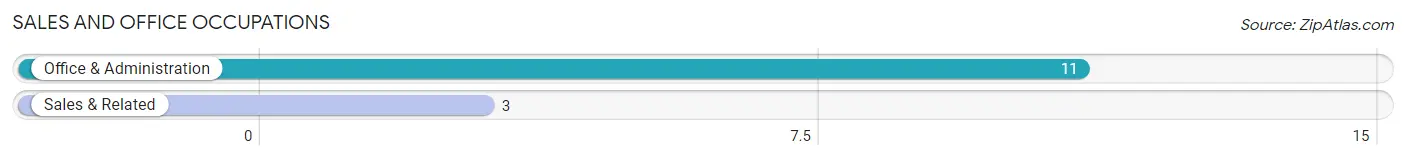
Sales and Office Occupations by Sex
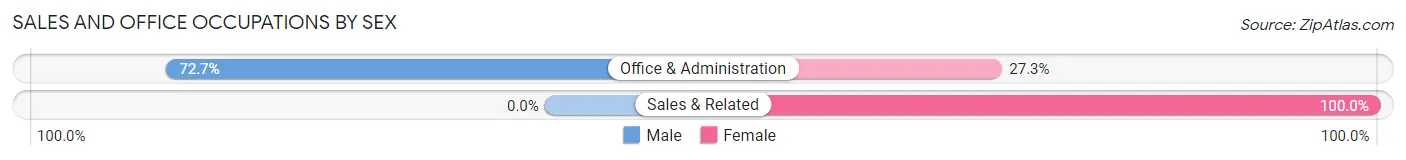
| Occupation | Male | Female |
| Sales & Related | 0 (0.0%) | 3 (100.0%) |
| Office & Administration | 8 (72.7%) | 3 (27.3%) |
| Total (Category) | 8 (57.1%) | 6 (42.9%) |
| Total (Overall) | 60 (57.7%) | 44 (42.3%) |
Natural Resources, Construction and Maintenance Occupations
The most common Natural Resources, Construction and Maintenance occupations in Lake Almanor Peninsula are , and Construction & Extraction (10 | 9.6%).
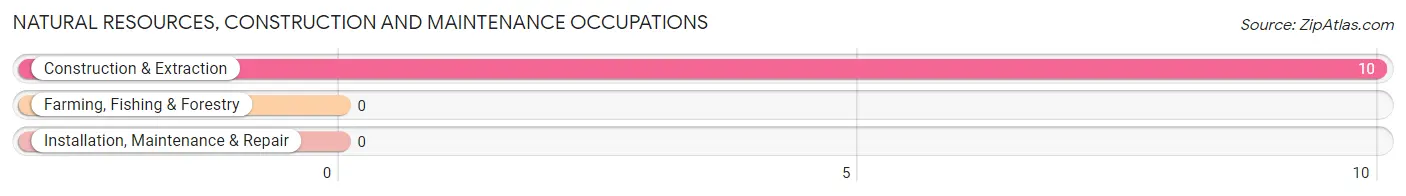
Natural Resources, Construction and Maintenance Occupations by Sex
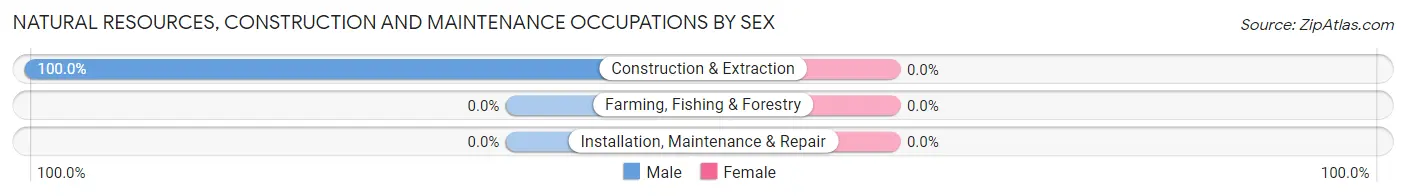
| Occupation | Male | Female |
| Farming, Fishing & Forestry | 0 (0.0%) | 0 (0.0%) |
| Construction & Extraction | 10 (100.0%) | 0 (0.0%) |
| Installation, Maintenance & Repair | 0 (0.0%) | 0 (0.0%) |
| Total (Category) | 10 (100.0%) | 0 (0.0%) |
| Total (Overall) | 60 (57.7%) | 44 (42.3%) |
Production, Transportation and Moving Occupations
The most common Production, Transportation and Moving occupations in Lake Almanor Peninsula are , and Material Moving (6 | 5.8%).
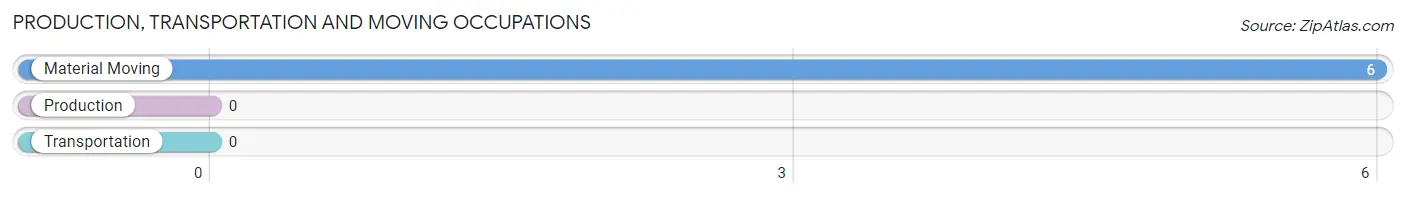
Production, Transportation and Moving Occupations by Sex
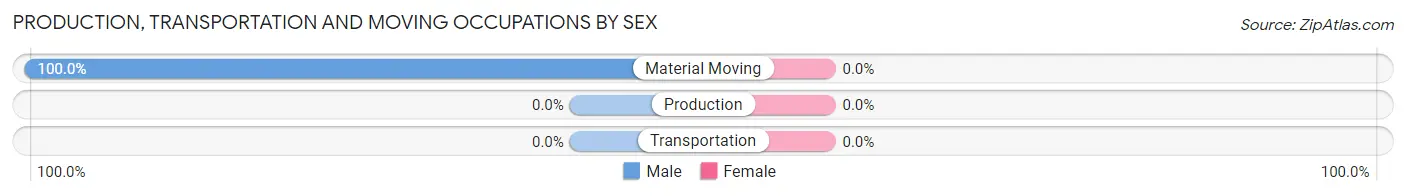
| Occupation | Male | Female |
| Production | 0 (0.0%) | 0 (0.0%) |
| Transportation | 0 (0.0%) | 0 (0.0%) |
| Material Moving | 6 (100.0%) | 0 (0.0%) |
| Total (Category) | 6 (100.0%) | 0 (0.0%) |
| Total (Overall) | 60 (57.7%) | 44 (42.3%) |
Employment Industries by Sex in Lake Almanor Peninsula
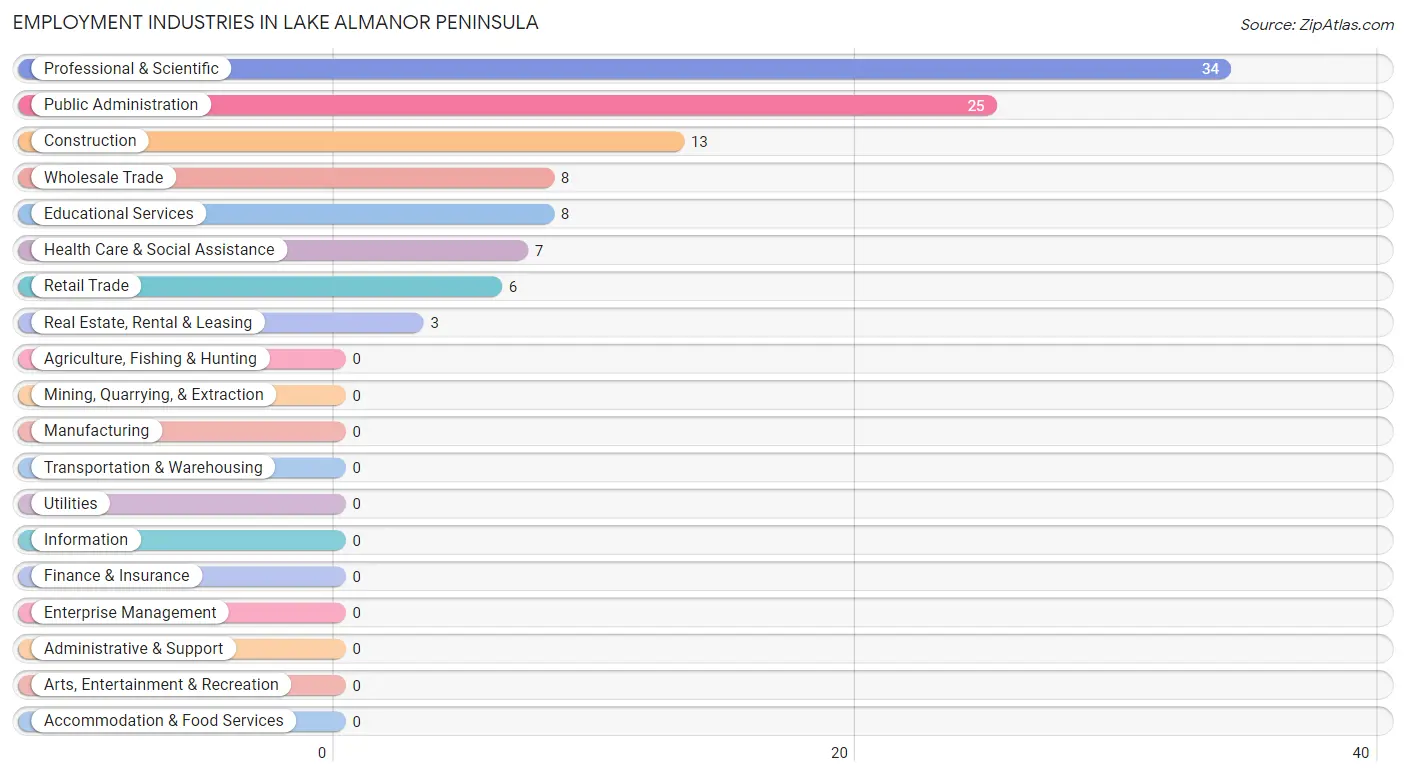
Employment Industries in Lake Almanor Peninsula
The major employment industries in Lake Almanor Peninsula include Professional & Scientific (34 | 32.7%), Public Administration (25 | 24.0%), Construction (13 | 12.5%), Wholesale Trade (8 | 7.7%), and Educational Services (8 | 7.7%).
Employment Industries by Sex in Lake Almanor Peninsula
The Lake Almanor Peninsula industries that see more men than women are Wholesale Trade (100.0%), Retail Trade (100.0%), and Construction (76.9%), whereas the industries that tend to have a higher number of women are Real Estate, Rental & Leasing (100.0%), Educational Services (100.0%), and Health Care & Social Assistance (100.0%).
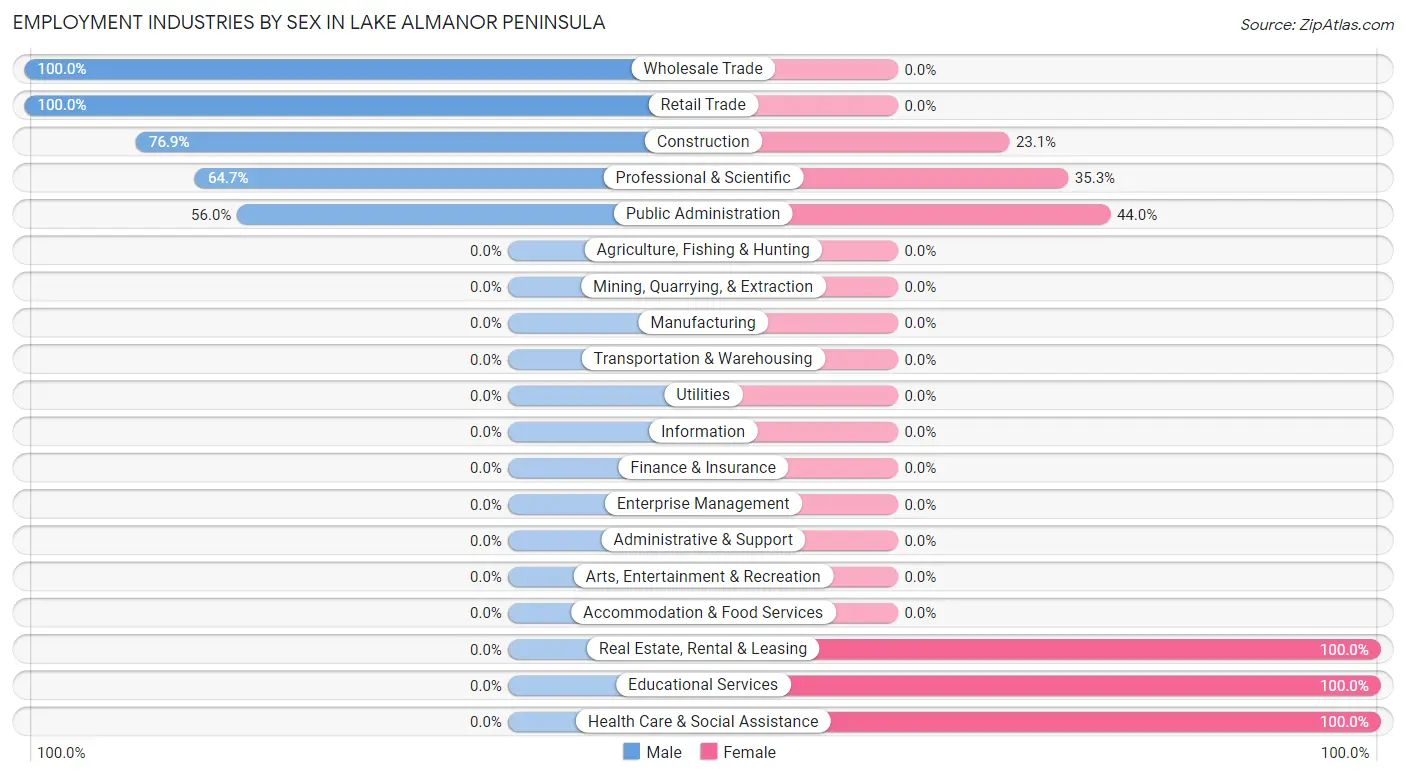
| Industry | Male | Female |
| Agriculture, Fishing & Hunting | 0 (0.0%) | 0 (0.0%) |
| Mining, Quarrying, & Extraction | 0 (0.0%) | 0 (0.0%) |
| Construction | 10 (76.9%) | 3 (23.1%) |
| Manufacturing | 0 (0.0%) | 0 (0.0%) |
| Wholesale Trade | 8 (100.0%) | 0 (0.0%) |
| Retail Trade | 6 (100.0%) | 0 (0.0%) |
| Transportation & Warehousing | 0 (0.0%) | 0 (0.0%) |
| Utilities | 0 (0.0%) | 0 (0.0%) |
| Information | 0 (0.0%) | 0 (0.0%) |
| Finance & Insurance | 0 (0.0%) | 0 (0.0%) |
| Real Estate, Rental & Leasing | 0 (0.0%) | 3 (100.0%) |
| Professional & Scientific | 22 (64.7%) | 12 (35.3%) |
| Enterprise Management | 0 (0.0%) | 0 (0.0%) |
| Administrative & Support | 0 (0.0%) | 0 (0.0%) |
| Educational Services | 0 (0.0%) | 8 (100.0%) |
| Health Care & Social Assistance | 0 (0.0%) | 7 (100.0%) |
| Arts, Entertainment & Recreation | 0 (0.0%) | 0 (0.0%) |
| Accommodation & Food Services | 0 (0.0%) | 0 (0.0%) |
| Public Administration | 14 (56.0%) | 11 (44.0%) |
| Total | 60 (57.7%) | 44 (42.3%) |
Education in Lake Almanor Peninsula
School Enrollment in Lake Almanor Peninsula
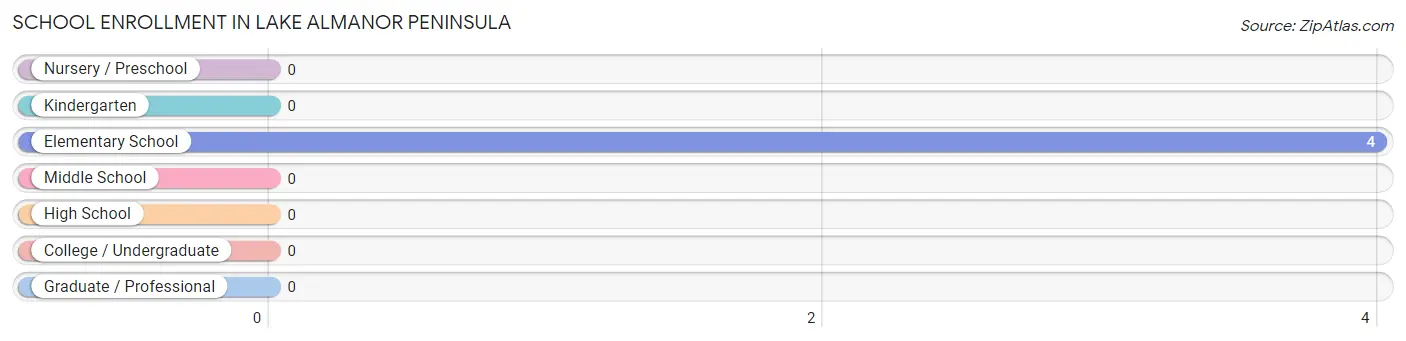
| School Level | # Students | % Students |
| Nursery / Preschool | 0 | 0.0% |
| Kindergarten | 0 | 0.0% |
| Elementary School | 4 | 100.0% |
| Middle School | 0 | 0.0% |
| High School | 0 | 0.0% |
| College / Undergraduate | 0 | 0.0% |
| Graduate / Professional | 0 | 0.0% |
| Total | 4 | 100.0% |
School Enrollment by Age by Funding Source in Lake Almanor Peninsula
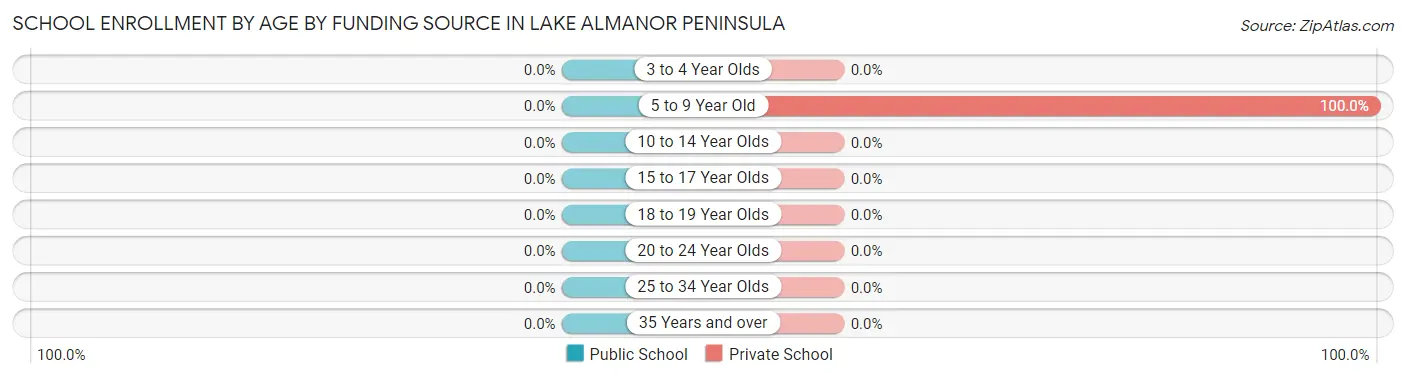
| Age Bracket | Public School | Private School |
| 3 to 4 Year Olds | 0 (0.0%) | 0 (0.0%) |
| 5 to 9 Year Old | 0 (0.0%) | 4 (100.0%) |
| 10 to 14 Year Olds | 0 (0.0%) | 0 (0.0%) |
| 15 to 17 Year Olds | 0 (0.0%) | 0 (0.0%) |
| 18 to 19 Year Olds | 0 (0.0%) | 0 (0.0%) |
| 20 to 24 Year Olds | 0 (0.0%) | 0 (0.0%) |
| 25 to 34 Year Olds | 0 (0.0%) | 0 (0.0%) |
| 35 Years and over | 0 (0.0%) | 0 (0.0%) |
| Total | 0 (0.0%) | 4 (100.0%) |
Educational Attainment by Field of Study in Lake Almanor Peninsula
Engineering (26 | 28.6%), visual & performing arts (14 | 15.4%), psychology (11 | 12.1%), social sciences (7 | 7.7%), and business (7 | 7.7%) are the most common fields of study among 91 individuals in Lake Almanor Peninsula who have obtained a bachelor's degree or higher.
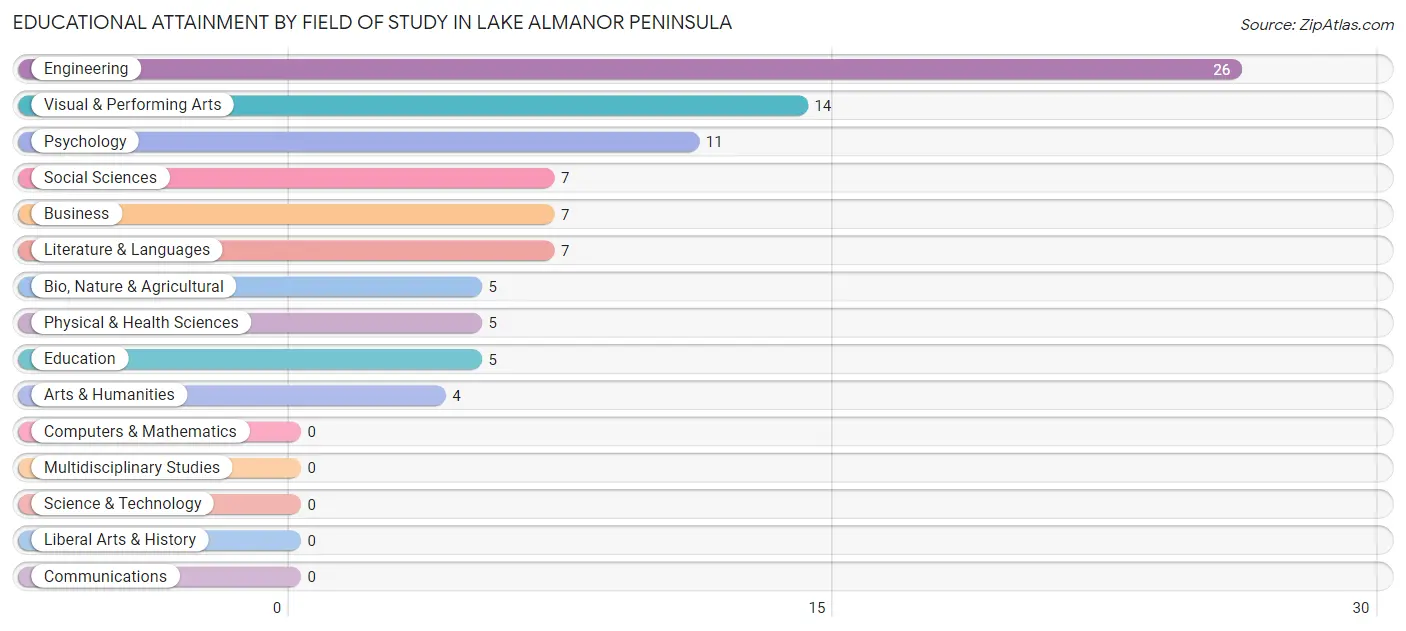
| Field of Study | # Graduates | % Graduates |
| Computers & Mathematics | 0 | 0.0% |
| Bio, Nature & Agricultural | 5 | 5.5% |
| Physical & Health Sciences | 5 | 5.5% |
| Psychology | 11 | 12.1% |
| Social Sciences | 7 | 7.7% |
| Engineering | 26 | 28.6% |
| Multidisciplinary Studies | 0 | 0.0% |
| Science & Technology | 0 | 0.0% |
| Business | 7 | 7.7% |
| Education | 5 | 5.5% |
| Literature & Languages | 7 | 7.7% |
| Liberal Arts & History | 0 | 0.0% |
| Visual & Performing Arts | 14 | 15.4% |
| Communications | 0 | 0.0% |
| Arts & Humanities | 4 | 4.4% |
| Total | 91 | 100.0% |
Transportation & Commute in Lake Almanor Peninsula
Vehicle Availability by Sex in Lake Almanor Peninsula
The most prevalent vehicle ownership categories in Lake Almanor Peninsula are males with 2 vehicles (34, accounting for 56.7%) and females with 2 vehicles (19, making up 77.3%).
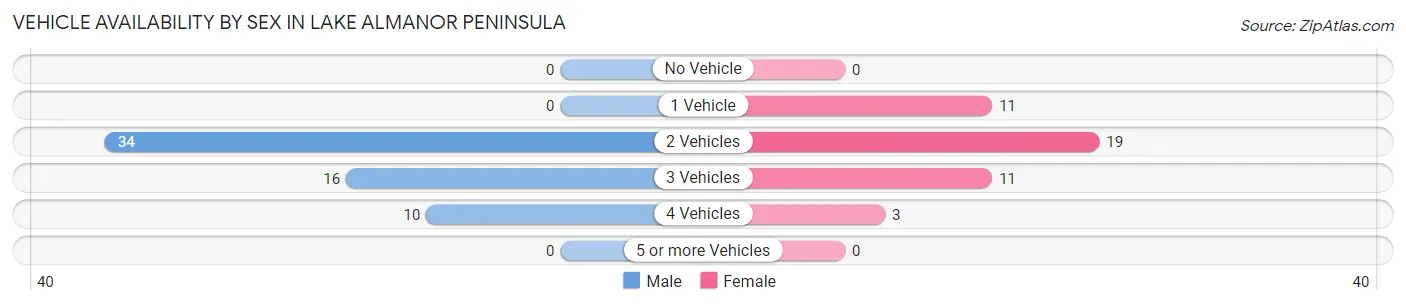
| Vehicles Available | Male | Female |
| No Vehicle | 0 (0.0%) | 0 (0.0%) |
| 1 Vehicle | 0 (0.0%) | 11 (25.0%) |
| 2 Vehicles | 34 (56.7%) | 19 (43.2%) |
| 3 Vehicles | 16 (26.7%) | 11 (25.0%) |
| 4 Vehicles | 10 (16.7%) | 3 (6.8%) |
| 5 or more Vehicles | 0 (0.0%) | 0 (0.0%) |
| Total | 60 (100.0%) | 44 (100.0%) |
Commute Time in Lake Almanor Peninsula
The most frequently occuring commute durations in Lake Almanor Peninsula are 45 to 59 minutes (28 commuters, 35.0%), 10 to 14 minutes (14 commuters, 17.5%), and 15 to 19 minutes (13 commuters, 16.3%).
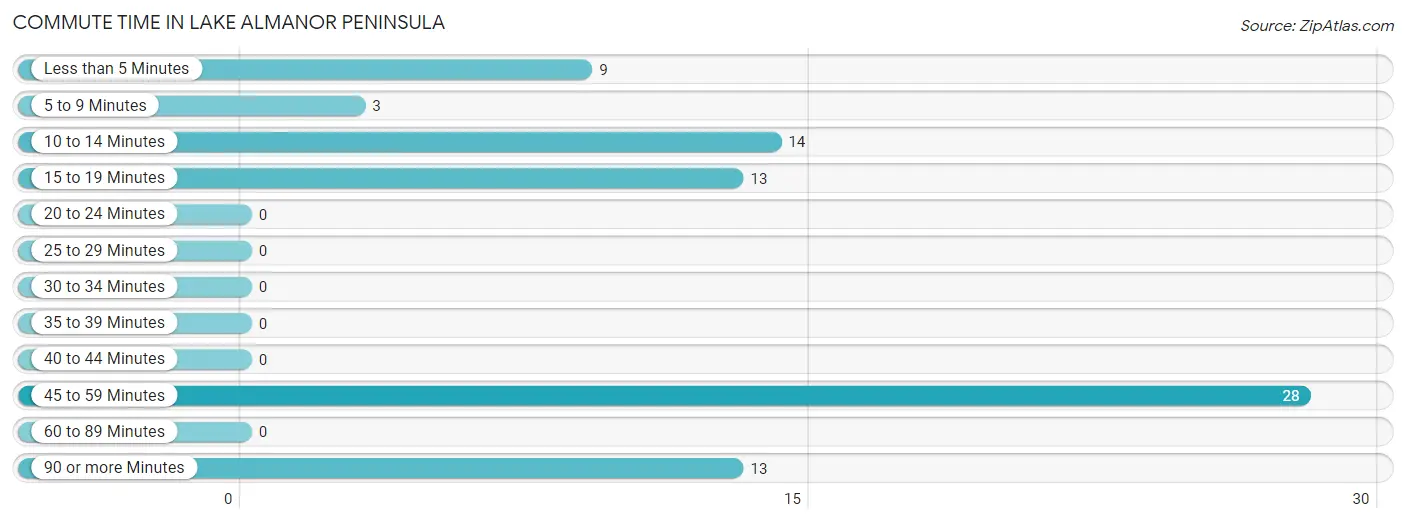
| Commute Time | # Commuters | % Commuters |
| Less than 5 Minutes | 9 | 11.3% |
| 5 to 9 Minutes | 3 | 3.7% |
| 10 to 14 Minutes | 14 | 17.5% |
| 15 to 19 Minutes | 13 | 16.3% |
| 20 to 24 Minutes | 0 | 0.0% |
| 25 to 29 Minutes | 0 | 0.0% |
| 30 to 34 Minutes | 0 | 0.0% |
| 35 to 39 Minutes | 0 | 0.0% |
| 40 to 44 Minutes | 0 | 0.0% |
| 45 to 59 Minutes | 28 | 35.0% |
| 60 to 89 Minutes | 0 | 0.0% |
| 90 or more Minutes | 13 | 16.3% |
Commute Time by Sex in Lake Almanor Peninsula
The most common commute times in Lake Almanor Peninsula are 90 or more minutes (13 commuters, 27.1%) for males and 45 to 59 minutes (18 commuters, 56.2%) for females.
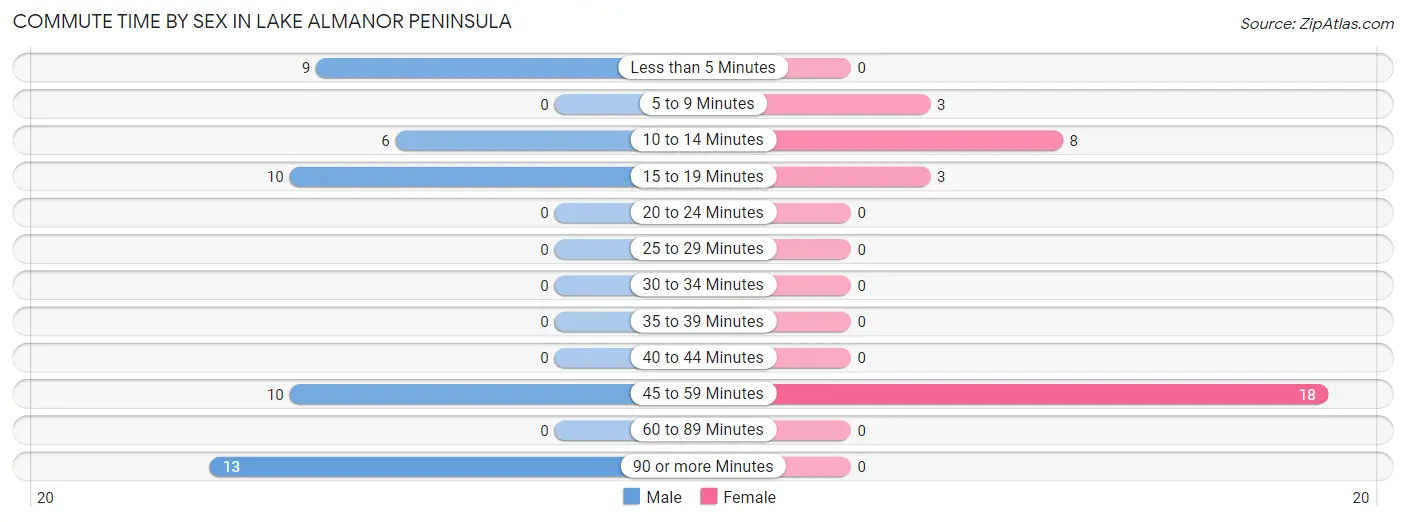
| Commute Time | Male | Female |
| Less than 5 Minutes | 9 (18.8%) | 0 (0.0%) |
| 5 to 9 Minutes | 0 (0.0%) | 3 (9.4%) |
| 10 to 14 Minutes | 6 (12.5%) | 8 (25.0%) |
| 15 to 19 Minutes | 10 (20.8%) | 3 (9.4%) |
| 20 to 24 Minutes | 0 (0.0%) | 0 (0.0%) |
| 25 to 29 Minutes | 0 (0.0%) | 0 (0.0%) |
| 30 to 34 Minutes | 0 (0.0%) | 0 (0.0%) |
| 35 to 39 Minutes | 0 (0.0%) | 0 (0.0%) |
| 40 to 44 Minutes | 0 (0.0%) | 0 (0.0%) |
| 45 to 59 Minutes | 10 (20.8%) | 18 (56.2%) |
| 60 to 89 Minutes | 0 (0.0%) | 0 (0.0%) |
| 90 or more Minutes | 13 (27.1%) | 0 (0.0%) |
Time of Departure to Work by Sex in Lake Almanor Peninsula
The most frequent times of departure to work in Lake Almanor Peninsula are 7:30 AM to 7:59 AM (19, 39.6%) for males and 7:00 AM to 7:29 AM (11, 34.4%) for females.
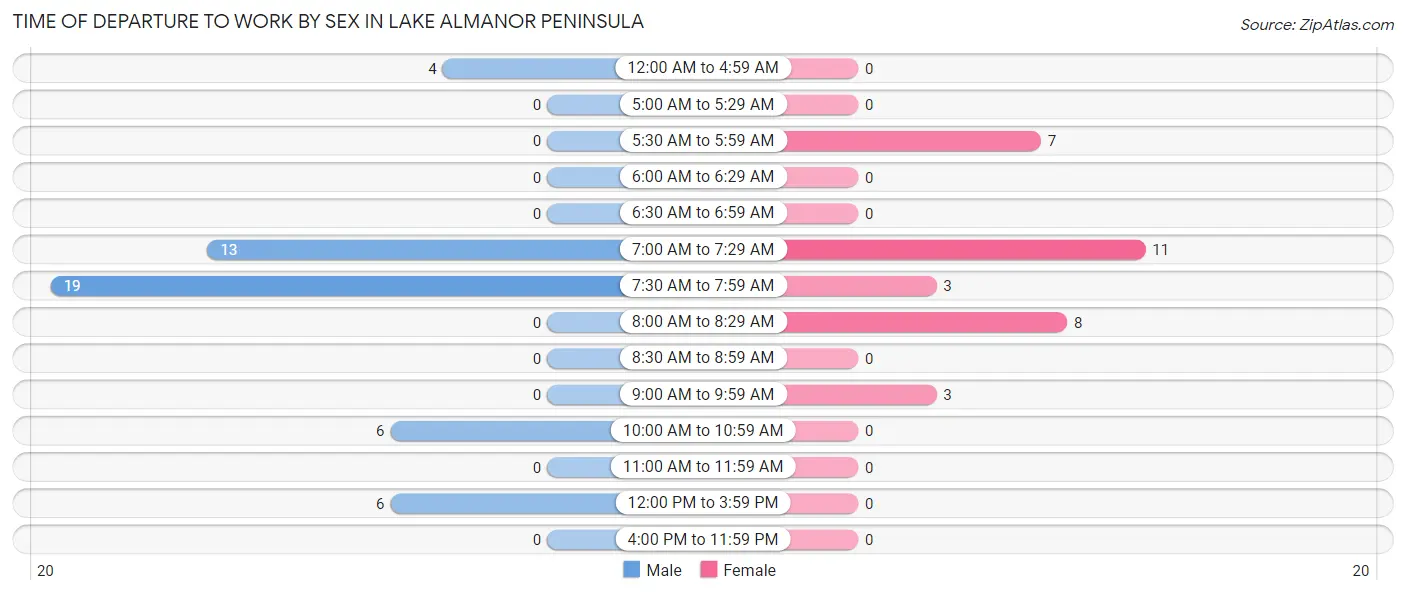
| Time of Departure | Male | Female |
| 12:00 AM to 4:59 AM | 4 (8.3%) | 0 (0.0%) |
| 5:00 AM to 5:29 AM | 0 (0.0%) | 0 (0.0%) |
| 5:30 AM to 5:59 AM | 0 (0.0%) | 7 (21.9%) |
| 6:00 AM to 6:29 AM | 0 (0.0%) | 0 (0.0%) |
| 6:30 AM to 6:59 AM | 0 (0.0%) | 0 (0.0%) |
| 7:00 AM to 7:29 AM | 13 (27.1%) | 11 (34.4%) |
| 7:30 AM to 7:59 AM | 19 (39.6%) | 3 (9.4%) |
| 8:00 AM to 8:29 AM | 0 (0.0%) | 8 (25.0%) |
| 8:30 AM to 8:59 AM | 0 (0.0%) | 0 (0.0%) |
| 9:00 AM to 9:59 AM | 0 (0.0%) | 3 (9.4%) |
| 10:00 AM to 10:59 AM | 6 (12.5%) | 0 (0.0%) |
| 11:00 AM to 11:59 AM | 0 (0.0%) | 0 (0.0%) |
| 12:00 PM to 3:59 PM | 6 (12.5%) | 0 (0.0%) |
| 4:00 PM to 11:59 PM | 0 (0.0%) | 0 (0.0%) |
| Total | 48 (100.0%) | 32 (100.0%) |
Housing Occupancy in Lake Almanor Peninsula
Occupancy by Ownership in Lake Almanor Peninsula
Of the total 148 dwellings in Lake Almanor Peninsula, owner-occupied units account for 140 (94.6%), while renter-occupied units make up 8 (5.4%).
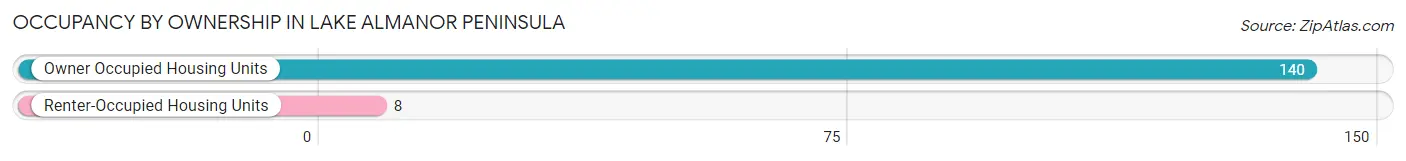
| Occupancy | # Housing Units | % Housing Units |
| Owner Occupied Housing Units | 140 | 94.6% |
| Renter-Occupied Housing Units | 8 | 5.4% |
| Total Occupied Housing Units | 148 | 100.0% |
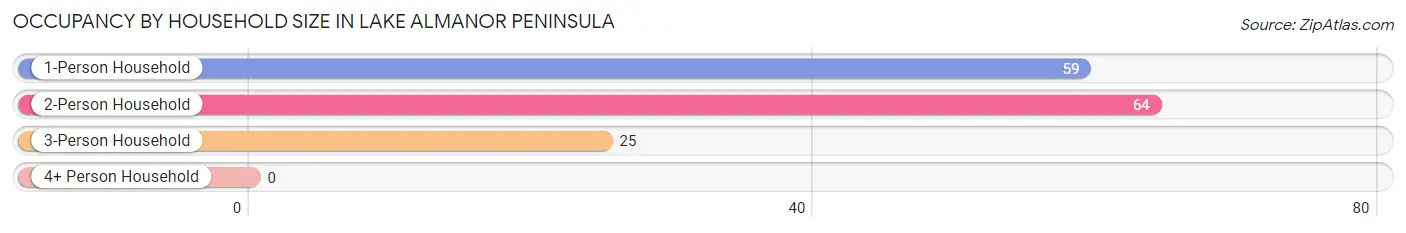
Occupancy by Household Size in Lake Almanor Peninsula
| Household Size | # Housing Units | % Housing Units |
| 1-Person Household | 59 | 39.9% |
| 2-Person Household | 64 | 43.2% |
| 3-Person Household | 25 | 16.9% |
| 4+ Person Household | 0 | 0.0% |
| Total Housing Units | 148 | 100.0% |
Occupancy by Ownership by Household Size in Lake Almanor Peninsula
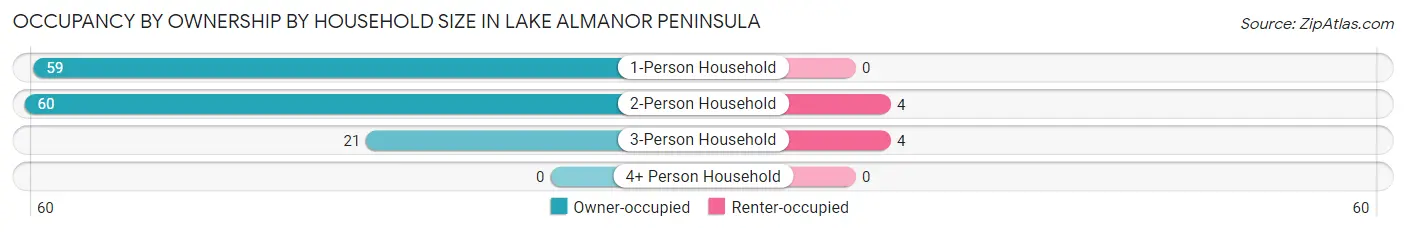
| Household Size | Owner-occupied | Renter-occupied |
| 1-Person Household | 59 (100.0%) | 0 (0.0%) |
| 2-Person Household | 60 (93.8%) | 4 (6.2%) |
| 3-Person Household | 21 (84.0%) | 4 (16.0%) |
| 4+ Person Household | 0 (0.0%) | 0 (0.0%) |
| Total Housing Units | 140 (94.6%) | 8 (5.4%) |
Occupancy by Educational Attainment in Lake Almanor Peninsula
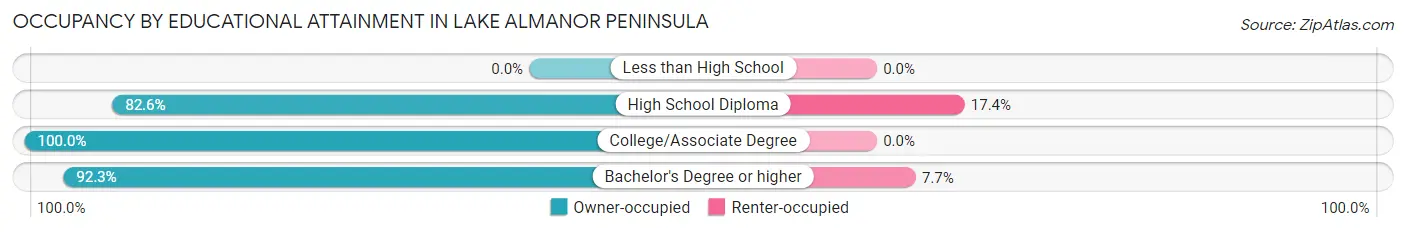
| Household Size | Owner-occupied | Renter-occupied |
| Less than High School | 0 (0.0%) | 0 (0.0%) |
| High School Diploma | 19 (82.6%) | 4 (17.4%) |
| College/Associate Degree | 73 (100.0%) | 0 (0.0%) |
| Bachelor's Degree or higher | 48 (92.3%) | 4 (7.7%) |
Occupancy by Age of Householder in Lake Almanor Peninsula
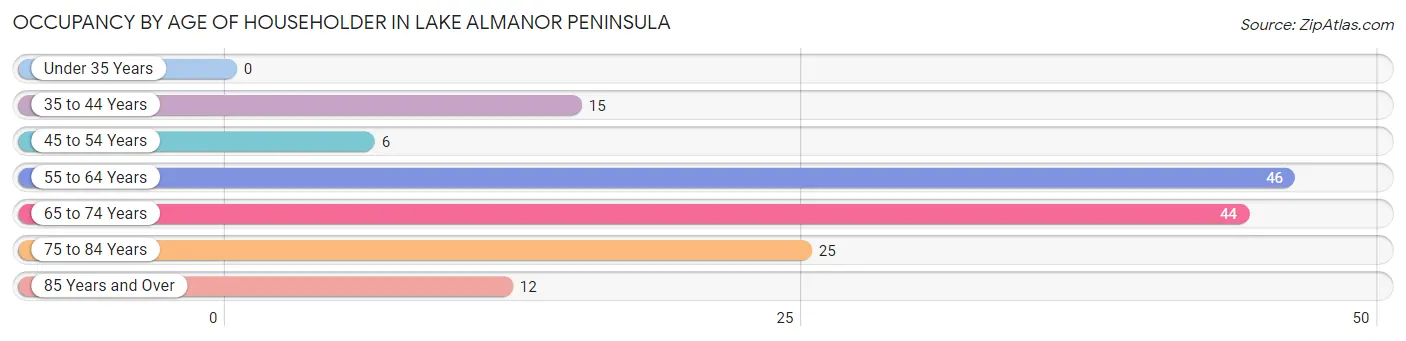
| Age Bracket | # Households | % Households |
| Under 35 Years | 0 | 0.0% |
| 35 to 44 Years | 15 | 10.1% |
| 45 to 54 Years | 6 | 4.1% |
| 55 to 64 Years | 46 | 31.1% |
| 65 to 74 Years | 44 | 29.7% |
| 75 to 84 Years | 25 | 16.9% |
| 85 Years and Over | 12 | 8.1% |
| Total | 148 | 100.0% |
Housing Finances in Lake Almanor Peninsula
Median Income by Occupancy in Lake Almanor Peninsula
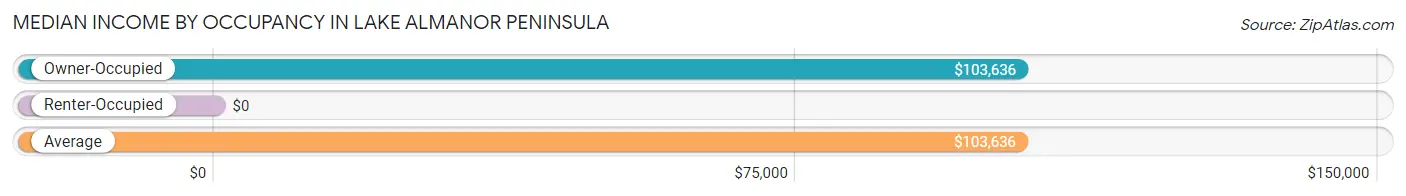
| Occupancy Type | # Households | Median Income |
| Owner-Occupied | 140 (94.6%) | $103,636 |
| Renter-Occupied | 8 (5.4%) | $0 |
| Average | 148 (100.0%) | $103,636 |
Occupancy by Householder Income Bracket in Lake Almanor Peninsula
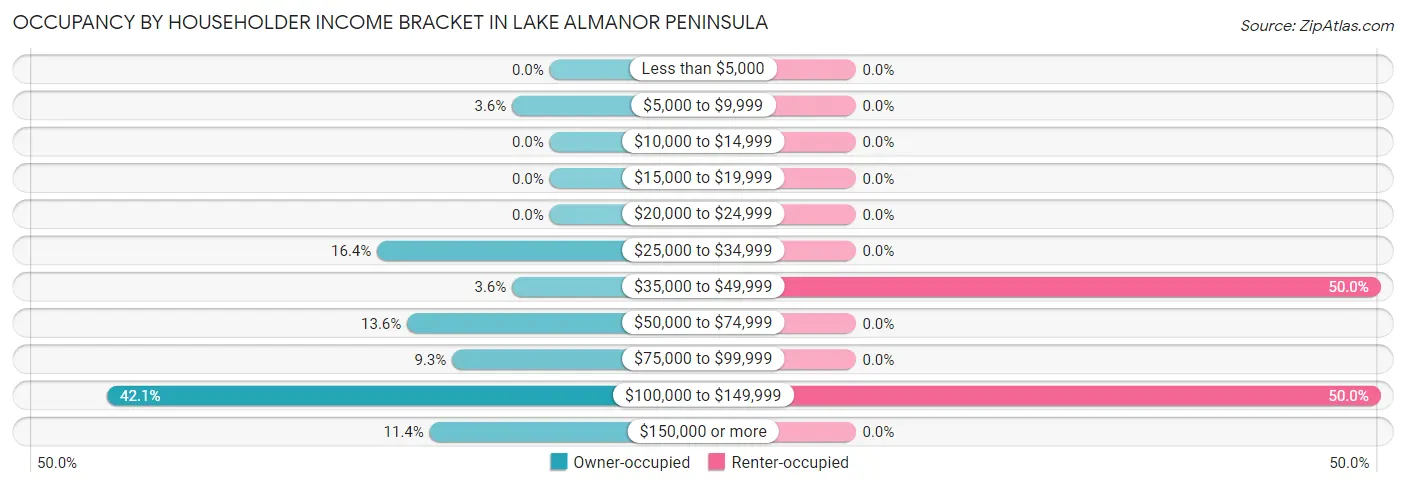
| Income Bracket | Owner-occupied | Renter-occupied |
| Less than $5,000 | 0 (0.0%) | 0 (0.0%) |
| $5,000 to $9,999 | 5 (3.6%) | 0 (0.0%) |
| $10,000 to $14,999 | 0 (0.0%) | 0 (0.0%) |
| $15,000 to $19,999 | 0 (0.0%) | 0 (0.0%) |
| $20,000 to $24,999 | 0 (0.0%) | 0 (0.0%) |
| $25,000 to $34,999 | 23 (16.4%) | 0 (0.0%) |
| $35,000 to $49,999 | 5 (3.6%) | 4 (50.0%) |
| $50,000 to $74,999 | 19 (13.6%) | 0 (0.0%) |
| $75,000 to $99,999 | 13 (9.3%) | 0 (0.0%) |
| $100,000 to $149,999 | 59 (42.1%) | 4 (50.0%) |
| $150,000 or more | 16 (11.4%) | 0 (0.0%) |
| Total | 140 (100.0%) | 8 (100.0%) |
Monthly Housing Cost Tiers in Lake Almanor Peninsula
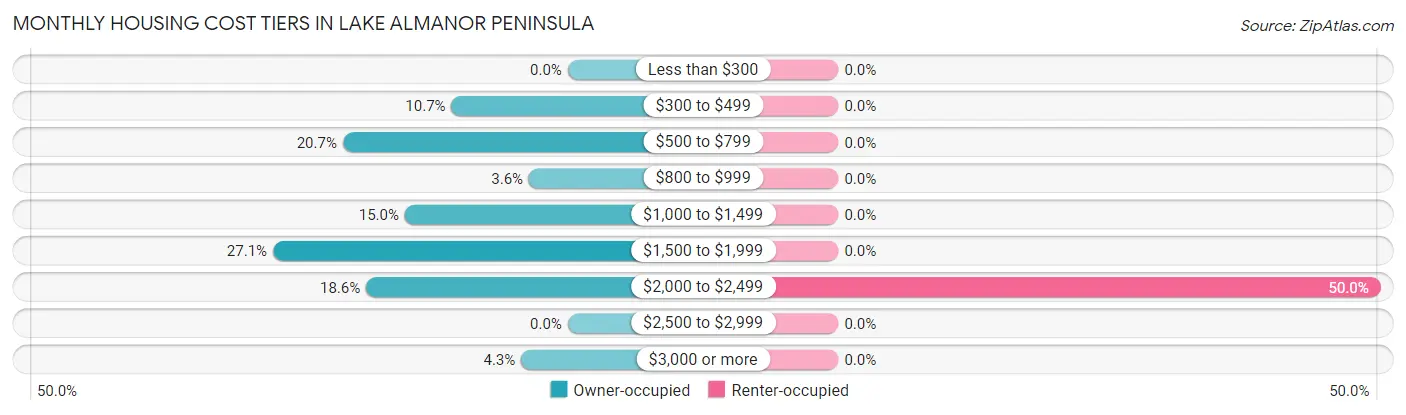
| Monthly Cost | Owner-occupied | Renter-occupied |
| Less than $300 | 0 (0.0%) | 0 (0.0%) |
| $300 to $499 | 15 (10.7%) | 0 (0.0%) |
| $500 to $799 | 29 (20.7%) | 0 (0.0%) |
| $800 to $999 | 5 (3.6%) | 0 (0.0%) |
| $1,000 to $1,499 | 21 (15.0%) | 0 (0.0%) |
| $1,500 to $1,999 | 38 (27.1%) | 0 (0.0%) |
| $2,000 to $2,499 | 26 (18.6%) | 4 (50.0%) |
| $2,500 to $2,999 | 0 (0.0%) | 0 (0.0%) |
| $3,000 or more | 6 (4.3%) | 0 (0.0%) |
| Total | 140 (100.0%) | 8 (100.0%) |
Physical Housing Characteristics in Lake Almanor Peninsula
Housing Structures in Lake Almanor Peninsula
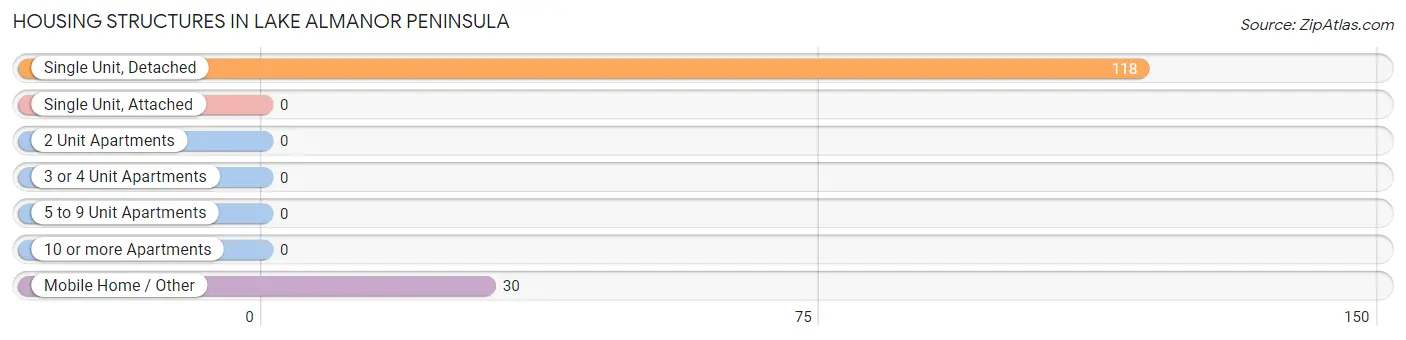
| Structure Type | # Housing Units | % Housing Units |
| Single Unit, Detached | 118 | 79.7% |
| Single Unit, Attached | 0 | 0.0% |
| 2 Unit Apartments | 0 | 0.0% |
| 3 or 4 Unit Apartments | 0 | 0.0% |
| 5 to 9 Unit Apartments | 0 | 0.0% |
| 10 or more Apartments | 0 | 0.0% |
| Mobile Home / Other | 30 | 20.3% |
| Total | 148 | 100.0% |
Housing Structures by Occupancy in Lake Almanor Peninsula
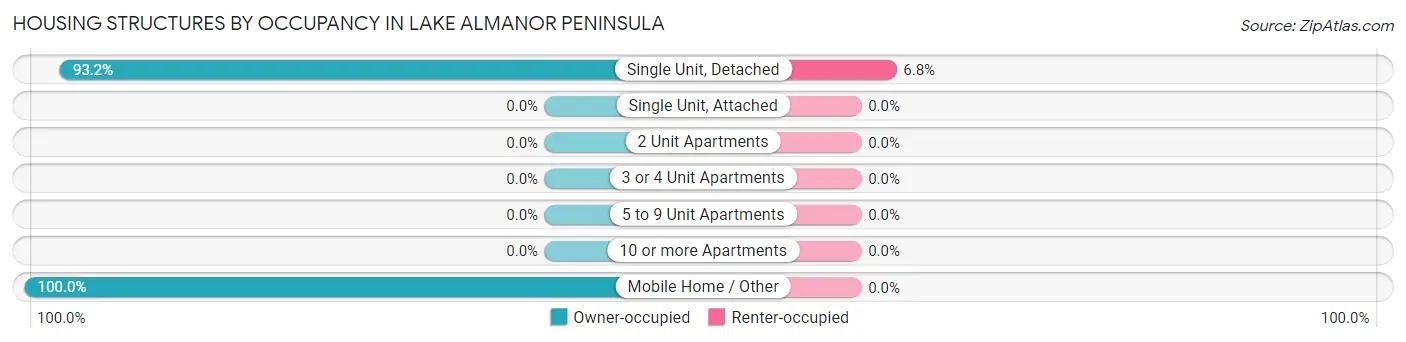
| Structure Type | Owner-occupied | Renter-occupied |
| Single Unit, Detached | 110 (93.2%) | 8 (6.8%) |
| Single Unit, Attached | 0 (0.0%) | 0 (0.0%) |
| 2 Unit Apartments | 0 (0.0%) | 0 (0.0%) |
| 3 or 4 Unit Apartments | 0 (0.0%) | 0 (0.0%) |
| 5 to 9 Unit Apartments | 0 (0.0%) | 0 (0.0%) |
| 10 or more Apartments | 0 (0.0%) | 0 (0.0%) |
| Mobile Home / Other | 30 (100.0%) | 0 (0.0%) |
| Total | 140 (94.6%) | 8 (5.4%) |
Housing Structures by Number of Rooms in Lake Almanor Peninsula
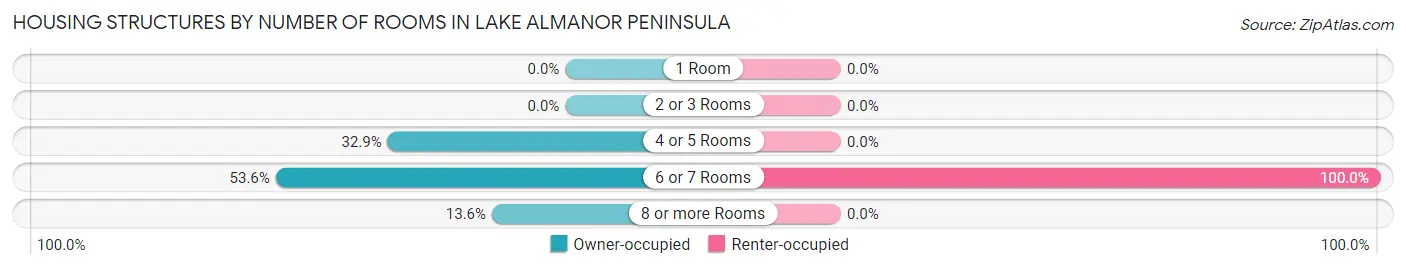
| Number of Rooms | Owner-occupied | Renter-occupied |
| 1 Room | 0 (0.0%) | 0 (0.0%) |
| 2 or 3 Rooms | 0 (0.0%) | 0 (0.0%) |
| 4 or 5 Rooms | 46 (32.9%) | 0 (0.0%) |
| 6 or 7 Rooms | 75 (53.6%) | 8 (100.0%) |
| 8 or more Rooms | 19 (13.6%) | 0 (0.0%) |
| Total | 140 (100.0%) | 8 (100.0%) |
Housing Structure by Heating Type in Lake Almanor Peninsula
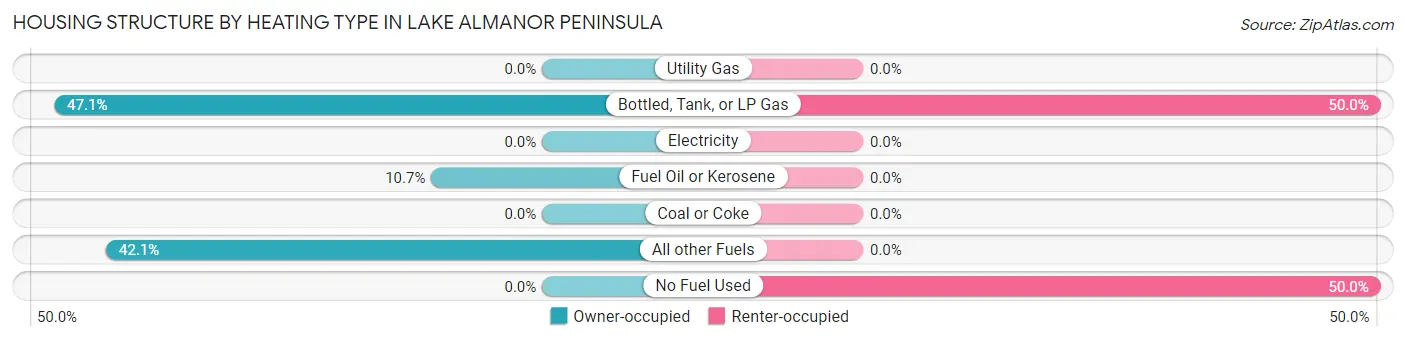
| Heating Type | Owner-occupied | Renter-occupied |
| Utility Gas | 0 (0.0%) | 0 (0.0%) |
| Bottled, Tank, or LP Gas | 66 (47.1%) | 4 (50.0%) |
| Electricity | 0 (0.0%) | 0 (0.0%) |
| Fuel Oil or Kerosene | 15 (10.7%) | 0 (0.0%) |
| Coal or Coke | 0 (0.0%) | 0 (0.0%) |
| All other Fuels | 59 (42.1%) | 0 (0.0%) |
| No Fuel Used | 0 (0.0%) | 4 (50.0%) |
| Total | 140 (100.0%) | 8 (100.0%) |
Household Vehicle Usage in Lake Almanor Peninsula
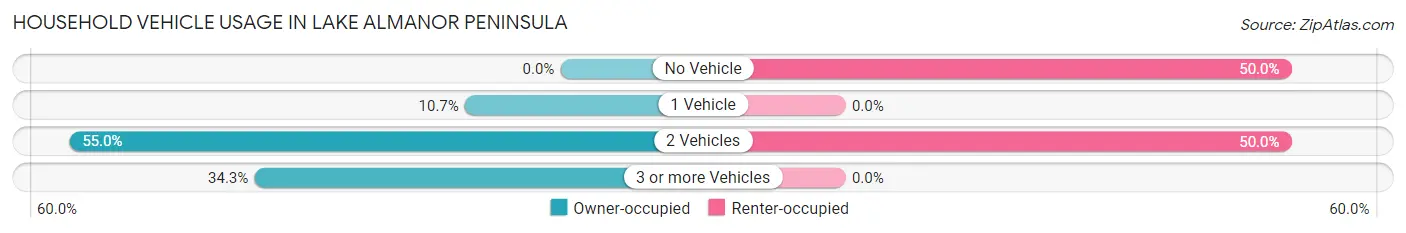
| Vehicles per Household | Owner-occupied | Renter-occupied |
| No Vehicle | 0 (0.0%) | 4 (50.0%) |
| 1 Vehicle | 15 (10.7%) | 0 (0.0%) |
| 2 Vehicles | 77 (55.0%) | 4 (50.0%) |
| 3 or more Vehicles | 48 (34.3%) | 0 (0.0%) |
| Total | 140 (100.0%) | 8 (100.0%) |
Real Estate & Mortgages in Lake Almanor Peninsula
Real Estate and Mortgage Overview in Lake Almanor Peninsula
| Characteristic | Without Mortgage | With Mortgage |
| Housing Units | 65 | 75 |
| Median Property Value | $475,000 | $287,500 |
| Median Household Income | $69,750 | $9 |
| Monthly Housing Costs | $670 | $6 |
| Real Estate Taxes | $4,688 | $12 |
Property Value by Mortgage Status in Lake Almanor Peninsula
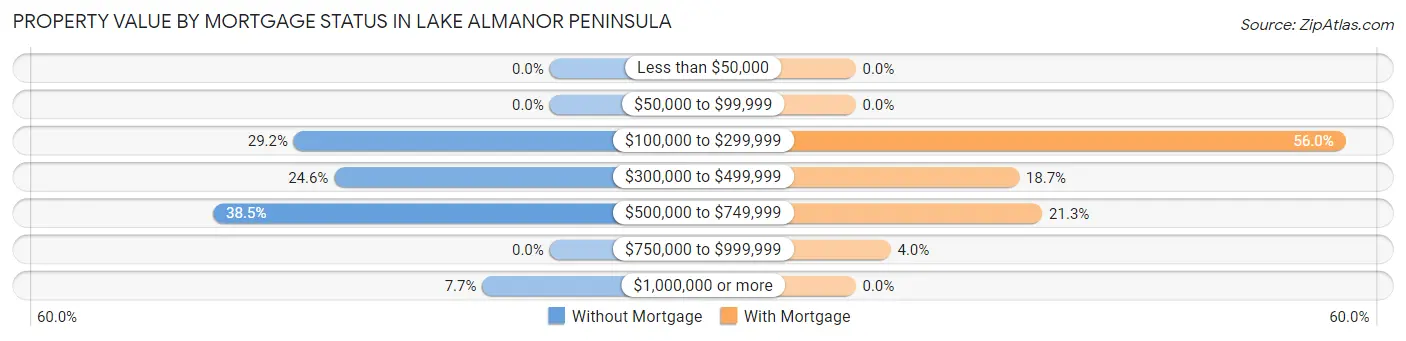
| Property Value | Without Mortgage | With Mortgage |
| Less than $50,000 | 0 (0.0%) | 0 (0.0%) |
| $50,000 to $99,999 | 0 (0.0%) | 0 (0.0%) |
| $100,000 to $299,999 | 19 (29.2%) | 42 (56.0%) |
| $300,000 to $499,999 | 16 (24.6%) | 14 (18.7%) |
| $500,000 to $749,999 | 25 (38.5%) | 16 (21.3%) |
| $750,000 to $999,999 | 0 (0.0%) | 3 (4.0%) |
| $1,000,000 or more | 5 (7.7%) | 0 (0.0%) |
| Total | 65 (100.0%) | 75 (100.0%) |
Household Income by Mortgage Status in Lake Almanor Peninsula
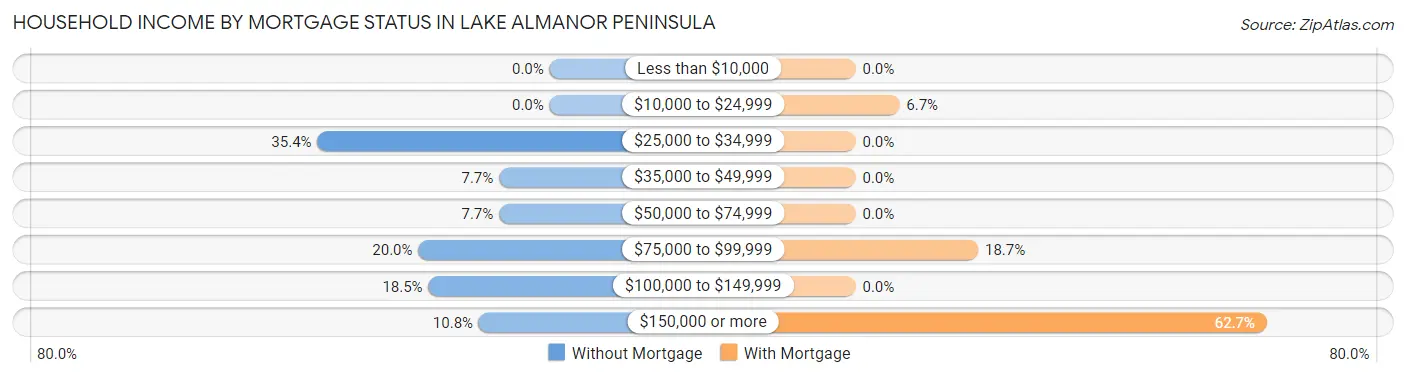
| Household Income | Without Mortgage | With Mortgage |
| Less than $10,000 | 0 (0.0%) | 0 (0.0%) |
| $10,000 to $24,999 | 0 (0.0%) | 5 (6.7%) |
| $25,000 to $34,999 | 23 (35.4%) | 0 (0.0%) |
| $35,000 to $49,999 | 5 (7.7%) | 0 (0.0%) |
| $50,000 to $74,999 | 5 (7.7%) | 0 (0.0%) |
| $75,000 to $99,999 | 13 (20.0%) | 14 (18.7%) |
| $100,000 to $149,999 | 12 (18.5%) | 0 (0.0%) |
| $150,000 or more | 7 (10.8%) | 47 (62.7%) |
| Total | 65 (100.0%) | 75 (100.0%) |
Property Value to Household Income Ratio in Lake Almanor Peninsula
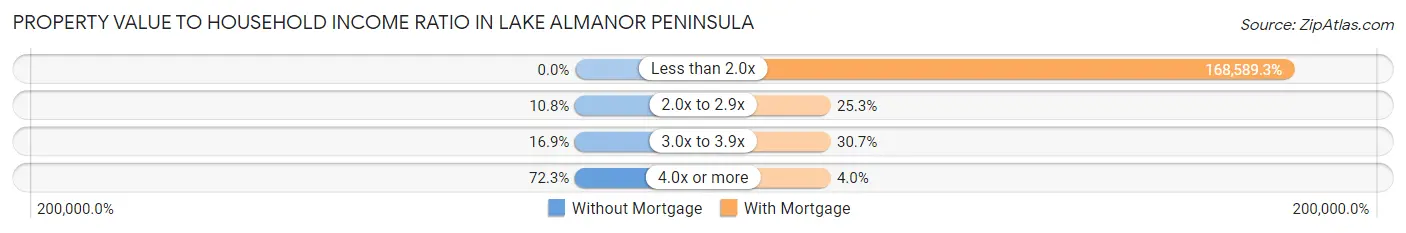
| Value-to-Income Ratio | Without Mortgage | With Mortgage |
| Less than 2.0x | 0 (0.0%) | 126,442 (168,589.3%) |
| 2.0x to 2.9x | 7 (10.8%) | 19 (25.3%) |
| 3.0x to 3.9x | 11 (16.9%) | 23 (30.7%) |
| 4.0x or more | 47 (72.3%) | 3 (4.0%) |
| Total | 65 (100.0%) | 75 (100.0%) |
Real Estate Taxes by Mortgage Status in Lake Almanor Peninsula
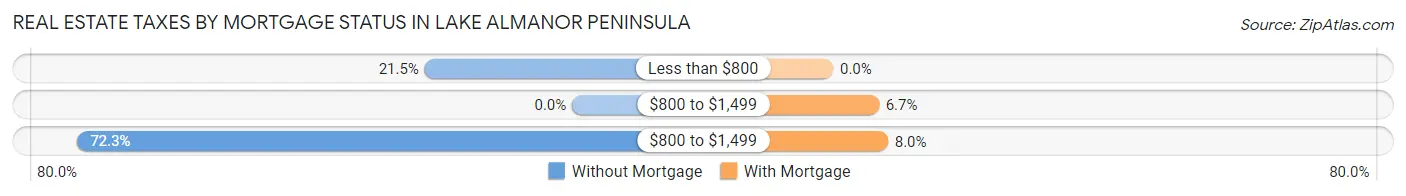
| Property Taxes | Without Mortgage | With Mortgage |
| Less than $800 | 14 (21.5%) | 0 (0.0%) |
| $800 to $1,499 | 0 (0.0%) | 5 (6.7%) |
| $800 to $1,499 | 47 (72.3%) | 6 (8.0%) |
| Total | 65 (100.0%) | 75 (100.0%) |
Health & Disability in Lake Almanor Peninsula
Health Insurance Coverage by Age in Lake Almanor Peninsula
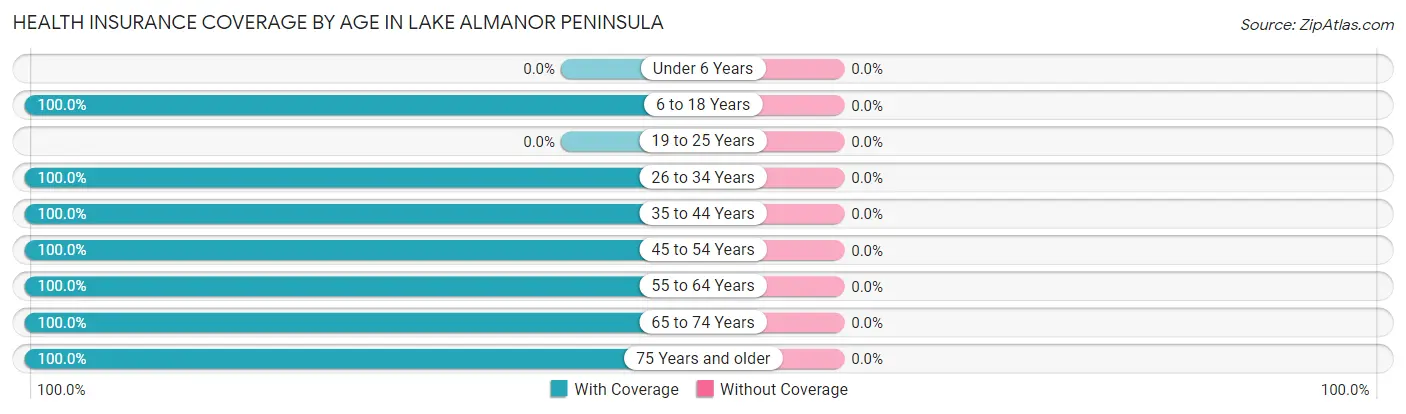
| Age Bracket | With Coverage | Without Coverage |
| Under 6 Years | 0 (0.0%) | 0 (0.0%) |
| 6 to 18 Years | 10 (100.0%) | 0 (0.0%) |
| 19 to 25 Years | 0 (0.0%) | 0 (0.0%) |
| 26 to 34 Years | 7 (100.0%) | 0 (0.0%) |
| 35 to 44 Years | 22 (100.0%) | 0 (0.0%) |
| 45 to 54 Years | 14 (100.0%) | 0 (0.0%) |
| 55 to 64 Years | 106 (100.0%) | 0 (0.0%) |
| 65 to 74 Years | 107 (100.0%) | 0 (0.0%) |
| 75 Years and older | 53 (100.0%) | 0 (0.0%) |
| Total | 319 (100.0%) | 0 (0.0%) |
Health Insurance Coverage by Citizenship Status in Lake Almanor Peninsula

| Citizenship Status | With Coverage | Without Coverage |
| Native Born | 0 (0.0%) | 0 (0.0%) |
| Foreign Born, Citizen | 10 (100.0%) | 0 (0.0%) |
| Foreign Born, not a Citizen | 0 (0.0%) | 0 (0.0%) |
Health Insurance Coverage by Household Income in Lake Almanor Peninsula
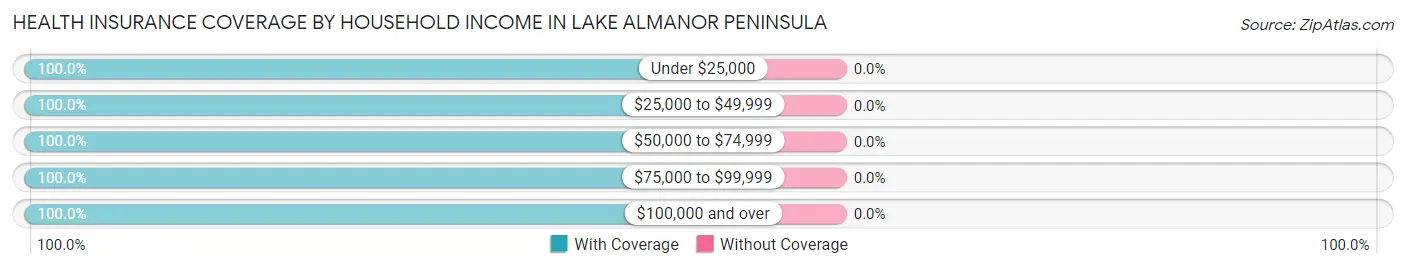
| Household Income | With Coverage | Without Coverage |
| Under $25,000 | 11 (100.0%) | 0 (0.0%) |
| $25,000 to $49,999 | 36 (100.0%) | 0 (0.0%) |
| $50,000 to $74,999 | 24 (100.0%) | 0 (0.0%) |
| $75,000 to $99,999 | 34 (100.0%) | 0 (0.0%) |
| $100,000 and over | 214 (100.0%) | 0 (0.0%) |
Public vs Private Health Insurance Coverage by Age in Lake Almanor Peninsula
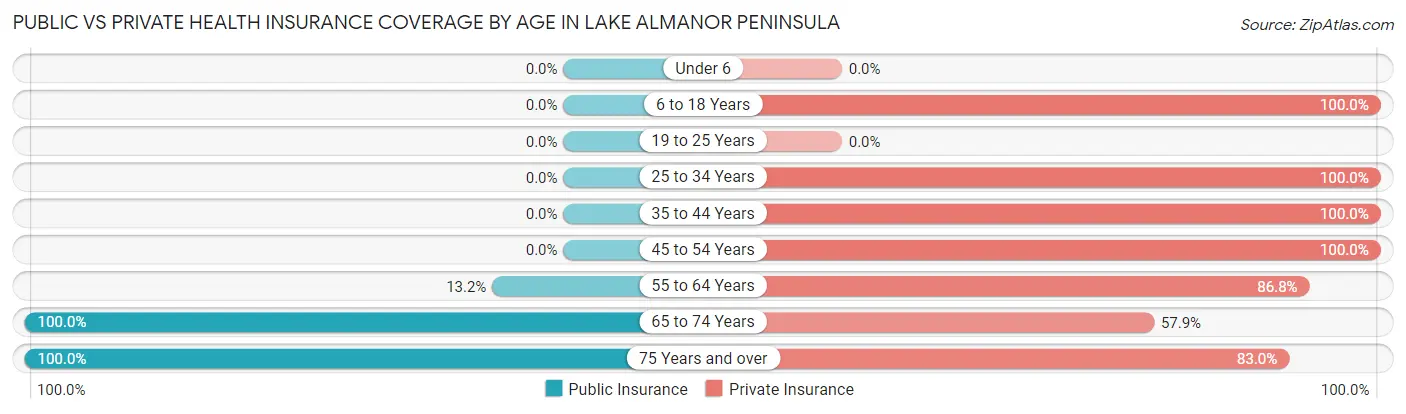
| Age Bracket | Public Insurance | Private Insurance |
| Under 6 | 0 (0.0%) | 0 (0.0%) |
| 6 to 18 Years | 0 (0.0%) | 10 (100.0%) |
| 19 to 25 Years | 0 (0.0%) | 0 (0.0%) |
| 25 to 34 Years | 0 (0.0%) | 7 (100.0%) |
| 35 to 44 Years | 0 (0.0%) | 22 (100.0%) |
| 45 to 54 Years | 0 (0.0%) | 14 (100.0%) |
| 55 to 64 Years | 14 (13.2%) | 92 (86.8%) |
| 65 to 74 Years | 107 (100.0%) | 62 (57.9%) |
| 75 Years and over | 53 (100.0%) | 44 (83.0%) |
| Total | 174 (54.5%) | 251 (78.7%) |
Disability Status by Sex by Age in Lake Almanor Peninsula
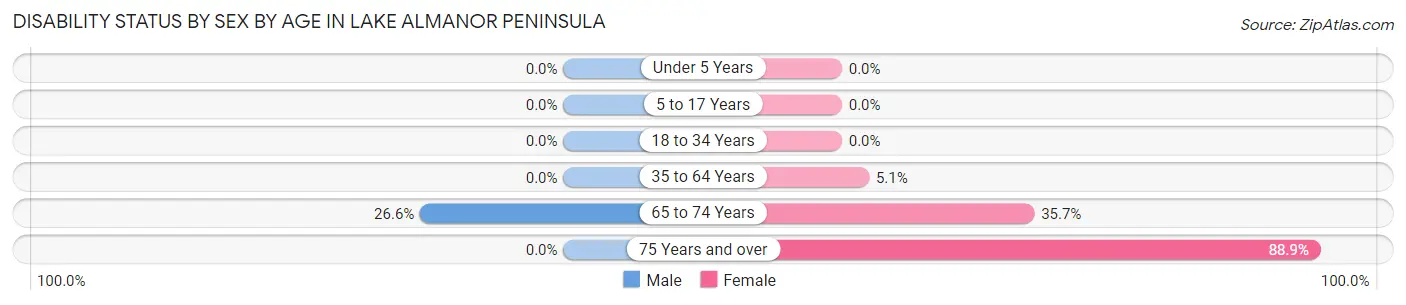
| Age Bracket | Male | Female |
| Under 5 Years | 0 (0.0%) | 0 (0.0%) |
| 5 to 17 Years | 0 (0.0%) | 0 (0.0%) |
| 18 to 34 Years | 0 (0.0%) | 0 (0.0%) |
| 35 to 64 Years | 0 (0.0%) | 5 (5.1%) |
| 65 to 74 Years | 21 (26.6%) | 10 (35.7%) |
| 75 Years and over | 0 (0.0%) | 24 (88.9%) |
Disability Class by Sex by Age in Lake Almanor Peninsula
Disability Class: Hearing Difficulty
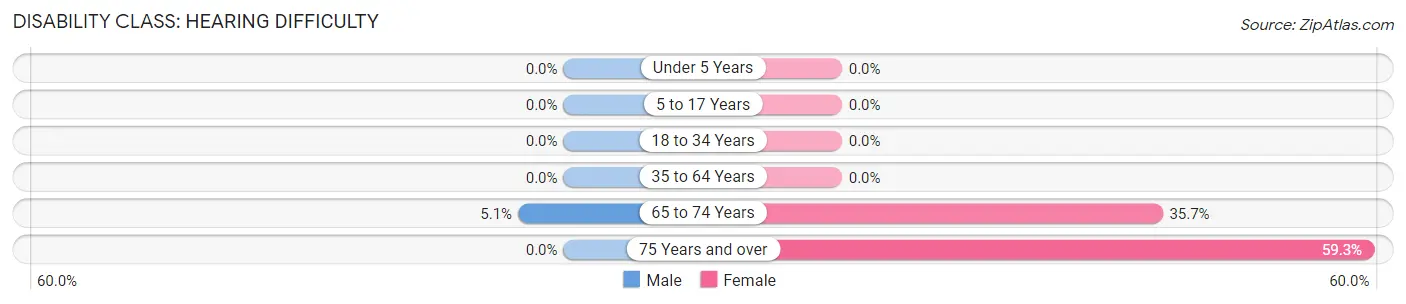
| Age Bracket | Male | Female |
| Under 5 Years | 0 (0.0%) | 0 (0.0%) |
| 5 to 17 Years | 0 (0.0%) | 0 (0.0%) |
| 18 to 34 Years | 0 (0.0%) | 0 (0.0%) |
| 35 to 64 Years | 0 (0.0%) | 0 (0.0%) |
| 65 to 74 Years | 4 (5.1%) | 10 (35.7%) |
| 75 Years and over | 0 (0.0%) | 16 (59.3%) |
Disability Class: Vision Difficulty
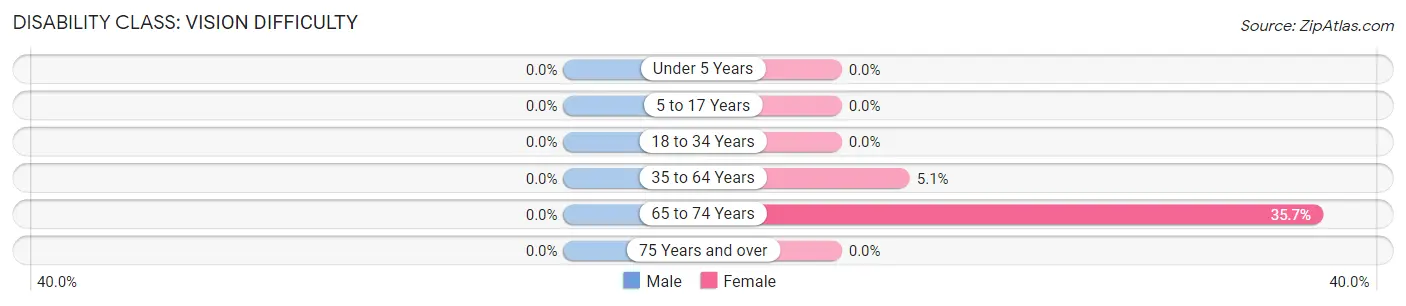
| Age Bracket | Male | Female |
| Under 5 Years | 0 (0.0%) | 0 (0.0%) |
| 5 to 17 Years | 0 (0.0%) | 0 (0.0%) |
| 18 to 34 Years | 0 (0.0%) | 0 (0.0%) |
| 35 to 64 Years | 0 (0.0%) | 5 (5.1%) |
| 65 to 74 Years | 0 (0.0%) | 10 (35.7%) |
| 75 Years and over | 0 (0.0%) | 0 (0.0%) |
Disability Class: Cognitive Difficulty
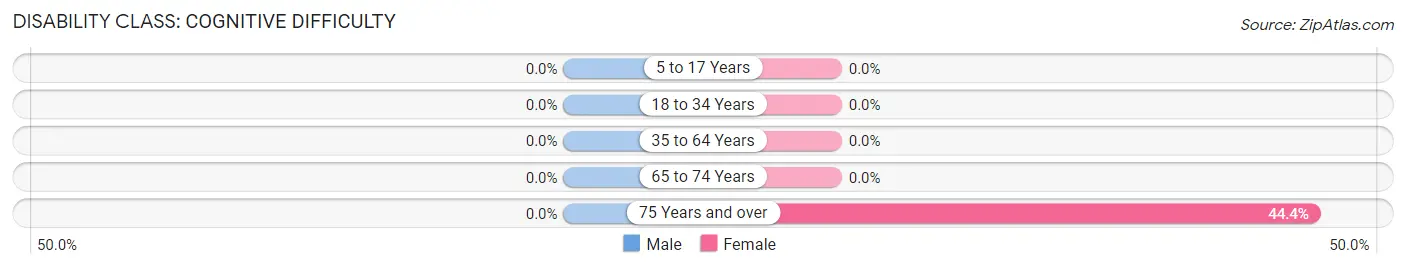
| Age Bracket | Male | Female |
| 5 to 17 Years | 0 (0.0%) | 0 (0.0%) |
| 18 to 34 Years | 0 (0.0%) | 0 (0.0%) |
| 35 to 64 Years | 0 (0.0%) | 0 (0.0%) |
| 65 to 74 Years | 0 (0.0%) | 0 (0.0%) |
| 75 Years and over | 0 (0.0%) | 12 (44.4%) |
Disability Class: Ambulatory Difficulty
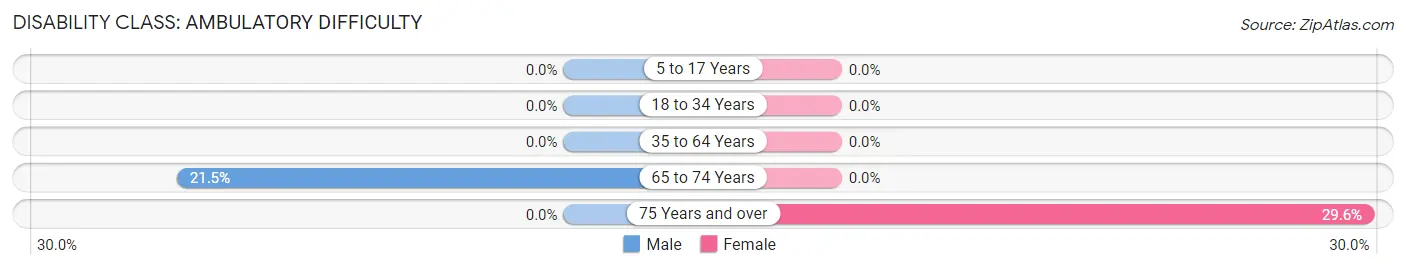
| Age Bracket | Male | Female |
| 5 to 17 Years | 0 (0.0%) | 0 (0.0%) |
| 18 to 34 Years | 0 (0.0%) | 0 (0.0%) |
| 35 to 64 Years | 0 (0.0%) | 0 (0.0%) |
| 65 to 74 Years | 17 (21.5%) | 0 (0.0%) |
| 75 Years and over | 0 (0.0%) | 8 (29.6%) |
Disability Class: Self-Care Difficulty
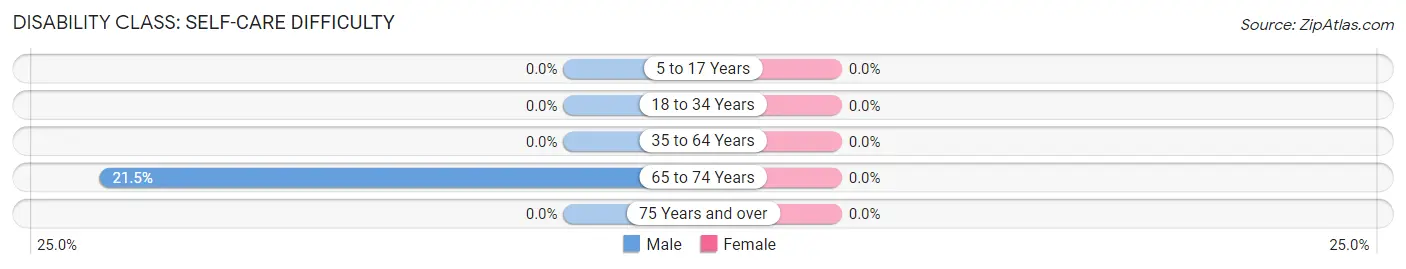
| Age Bracket | Male | Female |
| 5 to 17 Years | 0 (0.0%) | 0 (0.0%) |
| 18 to 34 Years | 0 (0.0%) | 0 (0.0%) |
| 35 to 64 Years | 0 (0.0%) | 0 (0.0%) |
| 65 to 74 Years | 17 (21.5%) | 0 (0.0%) |
| 75 Years and over | 0 (0.0%) | 0 (0.0%) |
Technology Access in Lake Almanor Peninsula
Computing Device Access in Lake Almanor Peninsula
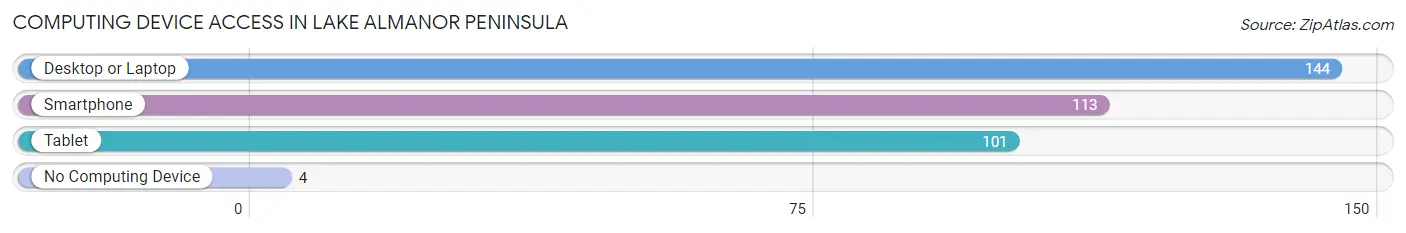
| Device Type | # Households | % Households |
| Desktop or Laptop | 144 | 97.3% |
| Smartphone | 113 | 76.3% |
| Tablet | 101 | 68.2% |
| No Computing Device | 4 | 2.7% |
| Total | 148 | 100.0% |
Internet Access in Lake Almanor Peninsula
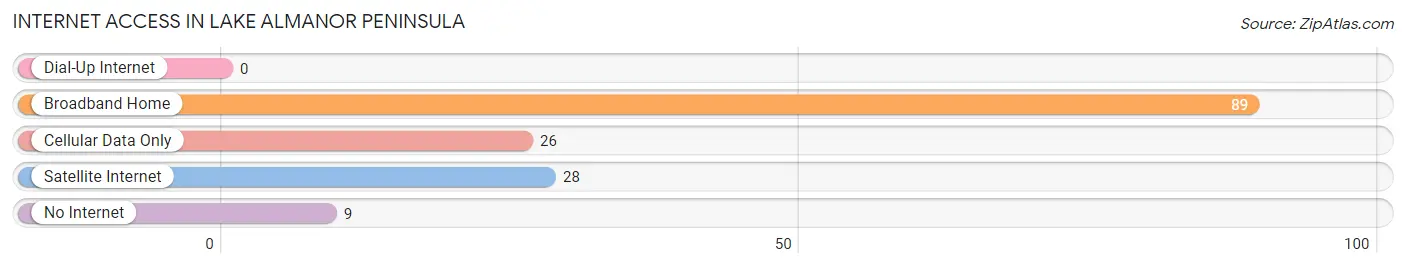
| Internet Type | # Households | % Households |
| Dial-Up Internet | 0 | 0.0% |
| Broadband Home | 89 | 60.1% |
| Cellular Data Only | 26 | 17.6% |
| Satellite Internet | 28 | 18.9% |
| No Internet | 9 | 6.1% |
| Total | 148 | 100.0% |
Lake Almanor Peninsula Summary
Lake Almanor Peninsula is a peninsula located in Plumas County, California, United States. It is situated in the northern Sierra Nevada mountain range, and is surrounded by Lake Almanor, a large reservoir created by the damming of the North Fork of the Feather River. The peninsula is a popular destination for outdoor recreation, including fishing, boating, camping, and hiking.
History
The Lake Almanor Peninsula has a long and varied history. The area was first inhabited by the Maidu people, who lived in the area for thousands of years before the arrival of European settlers. The first Europeans to explore the area were members of the John C. Fremont expedition in 1844. The area was later settled by miners and loggers in the late 19th century, and the town of Almanor was established in 1887.
The area was heavily logged in the early 20th century, and the construction of the Lake Almanor Dam in 1926 created the reservoir that now covers much of the peninsula. The dam was built to provide hydroelectric power to the region, and the lake is now a popular destination for recreational activities.
Geography
The Lake Almanor Peninsula is located in the northern Sierra Nevada mountain range, and is surrounded by Lake Almanor. The peninsula is approximately 10 miles long and 5 miles wide, and is composed of rolling hills and valleys. The highest point on the peninsula is the summit of Mount Lassen, which rises to an elevation of 10,457 feet.
The peninsula is located in a temperate climate, with hot summers and cold winters. The average annual precipitation is approximately 30 inches, and the average annual temperature is around 50 degrees Fahrenheit.
Economy
The economy of the Lake Almanor Peninsula is largely based on tourism and recreation. The area is a popular destination for fishing, boating, camping, and hiking, and the lake is home to a variety of fish species, including trout, bass, and catfish. The peninsula is also home to several resorts and marinas, which provide accommodations and services for visitors.
In addition to tourism, the peninsula is home to several small businesses, including restaurants, stores, and other services. The area is also home to several wineries, which produce a variety of wines from local grapes.
Demographics
As of the 2010 census, the population of the Lake Almanor Peninsula was 1,845. The population is largely white (93.3%), with small percentages of other races, including Native American (2.2%), Asian (1.2%), and African American (0.7%). The median household income is $45,000, and the median age is 44.
The area is home to several small towns, including Almanor, Chester, and Westwood. The towns are largely residential, and the population is largely composed of retirees and vacationers.
Conclusion
The Lake Almanor Peninsula is a popular destination for outdoor recreation, and is home to a variety of businesses and services. The area is largely residential, and the population is largely composed of retirees and vacationers. The area is also home to several wineries, which produce a variety of wines from local grapes. The economy of the area is largely based on tourism and recreation, and the area is a popular destination for fishing, boating, camping, and hiking.
Common Questions
What is Per Capita Income in Lake Almanor Peninsula?
Per Capita income in Lake Almanor Peninsula is $56,943.
What is the Median Family Income in Lake Almanor Peninsula?
Median Family Income in Lake Almanor Peninsula is $126,442.
What is the Median Household income in Lake Almanor Peninsula?
Median Household Income in Lake Almanor Peninsula is $103,636.
What is Inequality or Gini Index in Lake Almanor Peninsula?
Inequality or Gini Index in Lake Almanor Peninsula is 0.31.
What is the Total Population of Lake Almanor Peninsula?
Total Population of Lake Almanor Peninsula is 319.
What is the Total Male Population of Lake Almanor Peninsula?
Total Male Population of Lake Almanor Peninsula is 158.
What is the Total Female Population of Lake Almanor Peninsula?
Total Female Population of Lake Almanor Peninsula is 161.
What is the Ratio of Males per 100 Females in Lake Almanor Peninsula?
There are 98.14 Males per 100 Females in Lake Almanor Peninsula.
What is the Ratio of Females per 100 Males in Lake Almanor Peninsula?
There are 101.90 Females per 100 Males in Lake Almanor Peninsula.
What is the Median Population Age in Lake Almanor Peninsula?
Median Population Age in Lake Almanor Peninsula is 65.0 Years.
What is the Average Family Size in Lake Almanor Peninsula
Average Family Size in Lake Almanor Peninsula is 2.9 People.
What is the Average Household Size in Lake Almanor Peninsula
Average Household Size in Lake Almanor Peninsula is 2.2 People.
How Large is the Labor Force in Lake Almanor Peninsula?
There are 112 People in the Labor Forcein in Lake Almanor Peninsula.
What is the Percentage of People in the Labor Force in Lake Almanor Peninsula?
35.6% of People are in the Labor Force in Lake Almanor Peninsula.
What is the Unemployment Rate in Lake Almanor Peninsula?
Unemployment Rate in Lake Almanor Peninsula is 7.1%.