East Richmond Heights, CA Map & Demographics
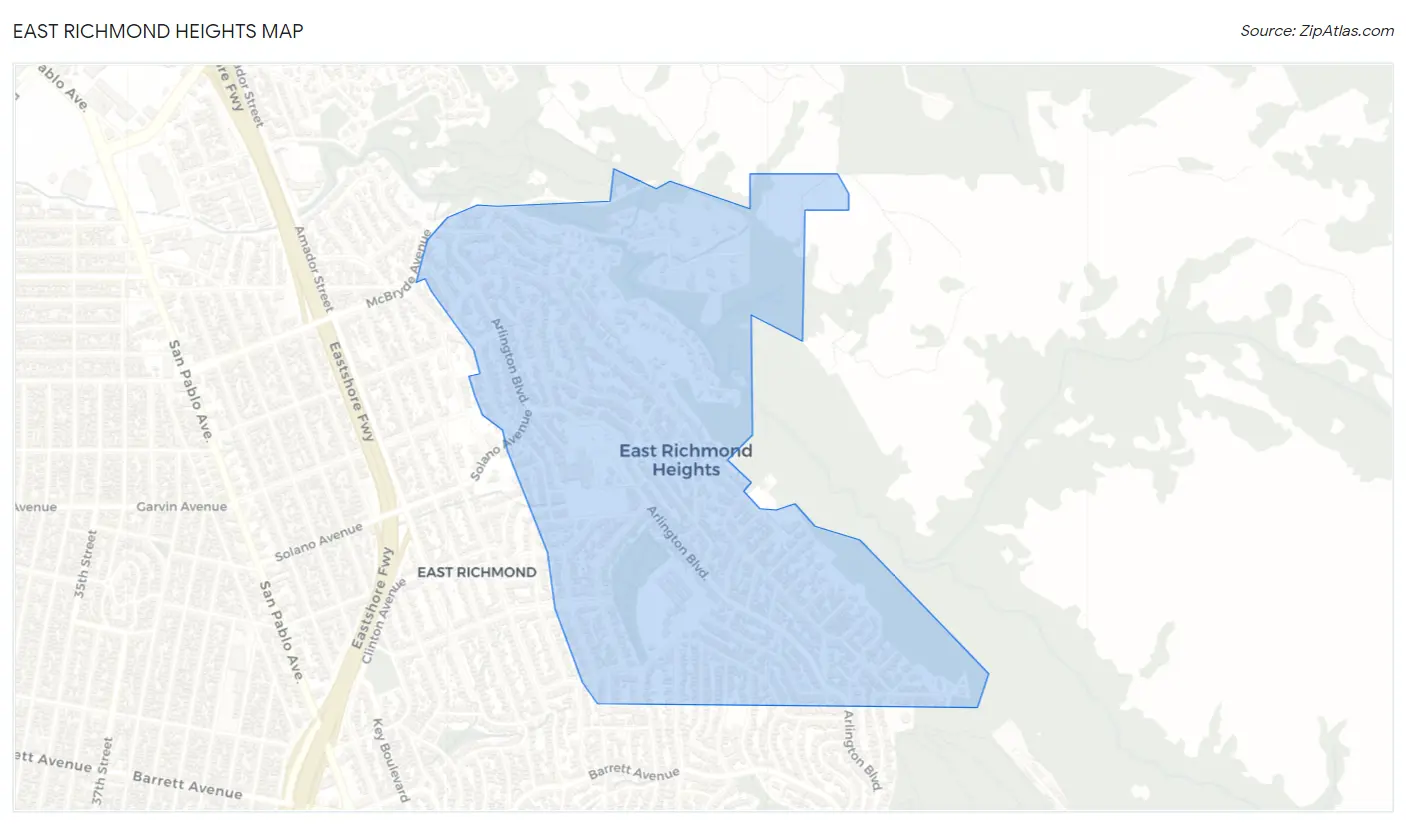
East Richmond Heights Map
East Richmond Heights Overview
$60,157
PER CAPITA INCOME
$140,500
AVG FAMILY INCOME
$112,344
AVG HOUSEHOLD INCOME
1.0%
WAGE / INCOME GAP [ % ]
99.0¢/ $1
WAGE / INCOME GAP [ $ ]
0.44
INEQUALITY / GINI INDEX
3,285
TOTAL POPULATION
1,687
MALE POPULATION
1,598
FEMALE POPULATION
105.57
MALES / 100 FEMALES
94.72
FEMALES / 100 MALES
46.8
MEDIAN AGE
3.0
AVG FAMILY SIZE
2.4
AVG HOUSEHOLD SIZE
1,978
LABOR FORCE [ PEOPLE ]
72.5%
PERCENT IN LABOR FORCE
6.4%
UNEMPLOYMENT RATE
Income in East Richmond Heights
Income Overview in East Richmond Heights
Per Capita Income in East Richmond Heights is $60,157, while median incomes of families and households are $140,500 and $112,344 respectively.
| Characteristic | Number | Measure |
| Per Capita Income | 3,285 | $60,157 |
| Median Family Income | 764 | $140,500 |
| Mean Family Income | 764 | $176,481 |
| Median Household Income | 1,373 | $112,344 |
| Mean Household Income | 1,373 | $142,660 |
| Income Deficit | 764 | $0 |
| Wage / Income Gap (%) | 3,285 | 0.96% |
| Wage / Income Gap ($) | 3,285 | 99.04¢ per $1 |
| Gini / Inequality Index | 3,285 | 0.44 |
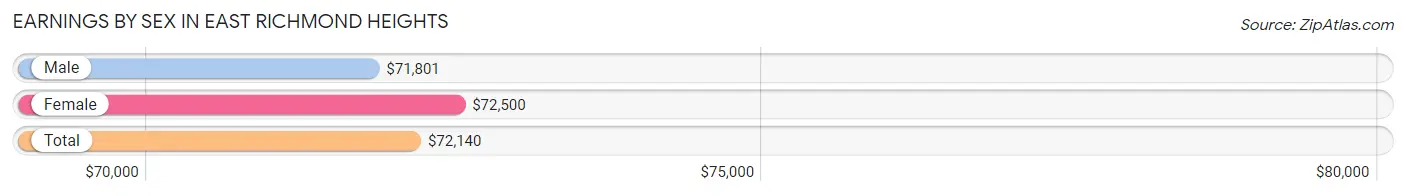
Earnings by Sex in East Richmond Heights
Average Earnings in East Richmond Heights are $72,140, $71,801 for men and $72,500 for women, a difference of 1.0%.
| Sex | Number | Average Earnings |
| Male | 1,003 (50.8%) | $71,801 |
| Female | 972 (49.2%) | $72,500 |
| Total | 1,975 (100.0%) | $72,140 |
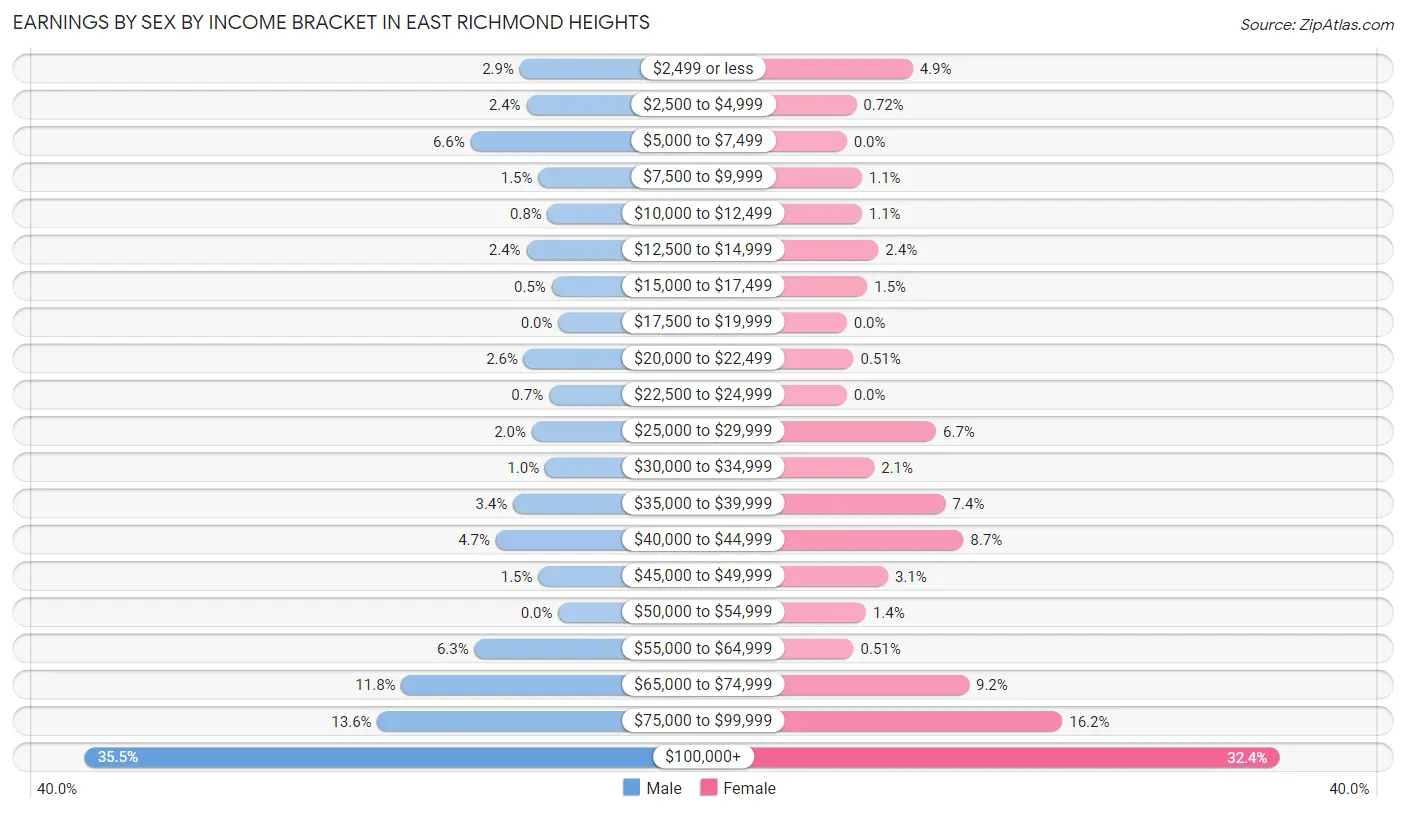
Earnings by Sex by Income Bracket in East Richmond Heights
The most common earnings brackets in East Richmond Heights are $100,000+ for men (356 | 35.5%) and $100,000+ for women (315 | 32.4%).
| Income | Male | Female |
| $2,499 or less | 29 (2.9%) | 48 (4.9%) |
| $2,500 to $4,999 | 24 (2.4%) | 7 (0.7%) |
| $5,000 to $7,499 | 66 (6.6%) | 0 (0.0%) |
| $7,500 to $9,999 | 15 (1.5%) | 11 (1.1%) |
| $10,000 to $12,499 | 8 (0.8%) | 11 (1.1%) |
| $12,500 to $14,999 | 24 (2.4%) | 23 (2.4%) |
| $15,000 to $17,499 | 5 (0.5%) | 15 (1.5%) |
| $17,500 to $19,999 | 0 (0.0%) | 0 (0.0%) |
| $20,000 to $22,499 | 26 (2.6%) | 5 (0.5%) |
| $22,500 to $24,999 | 7 (0.7%) | 0 (0.0%) |
| $25,000 to $29,999 | 20 (2.0%) | 65 (6.7%) |
| $30,000 to $34,999 | 10 (1.0%) | 20 (2.1%) |
| $35,000 to $39,999 | 34 (3.4%) | 72 (7.4%) |
| $40,000 to $44,999 | 47 (4.7%) | 85 (8.7%) |
| $45,000 to $49,999 | 15 (1.5%) | 30 (3.1%) |
| $50,000 to $54,999 | 0 (0.0%) | 14 (1.4%) |
| $55,000 to $64,999 | 63 (6.3%) | 5 (0.5%) |
| $65,000 to $74,999 | 118 (11.8%) | 89 (9.2%) |
| $75,000 to $99,999 | 136 (13.6%) | 157 (16.2%) |
| $100,000+ | 356 (35.5%) | 315 (32.4%) |
| Total | 1,003 (100.0%) | 972 (100.0%) |
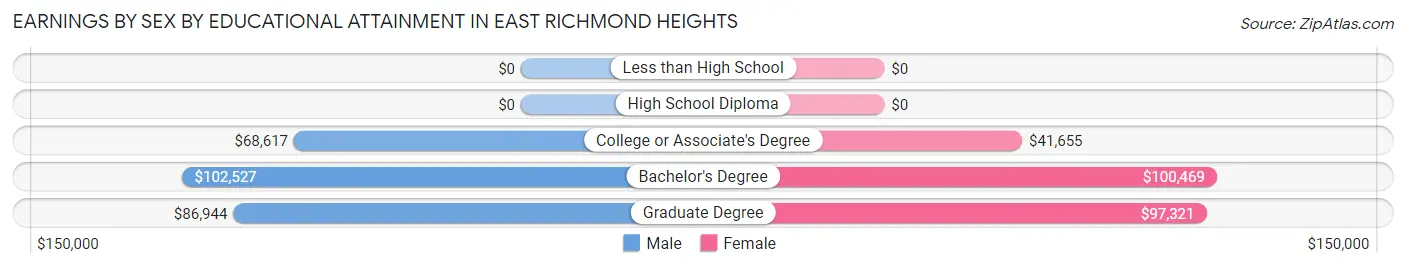
Earnings by Sex by Educational Attainment in East Richmond Heights
Average earnings in East Richmond Heights are $76,667 for men and $72,768 for women, a difference of 5.1%. Men with an educational attainment of bachelor's degree enjoy the highest average annual earnings of $102,527, while those with college or associate's degree education earn the least with $68,617. Women with an educational attainment of bachelor's degree earn the most with the average annual earnings of $100,469, while those with college or associate's degree education have the smallest earnings of $41,655.
| Educational Attainment | Male Income | Female Income |
| Less than High School | - | - |
| High School Diploma | - | - |
| College or Associate's Degree | $68,617 | $41,655 |
| Bachelor's Degree | $102,527 | $100,469 |
| Graduate Degree | $86,944 | $97,321 |
| Total | $76,667 | $72,768 |
Family Income in East Richmond Heights
Family Income Brackets in East Richmond Heights
According to the East Richmond Heights family income data, there are 213 families falling into the $200,000+ income range, which is the most common income bracket and makes up 27.9% of all families.
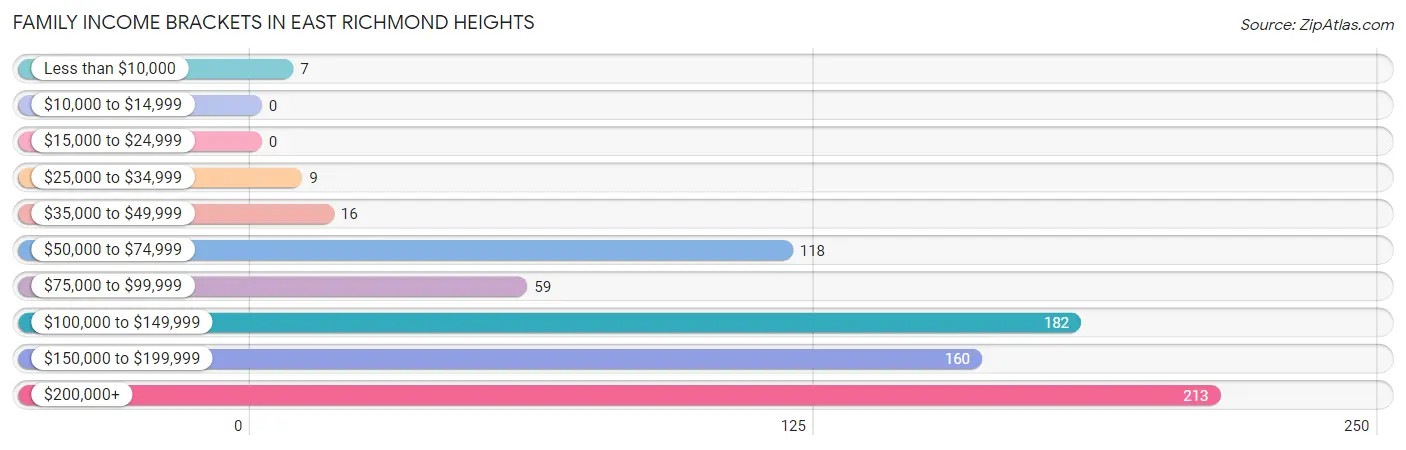
| Income Bracket | # Families | % Families |
| Less than $10,000 | 7 | 0.9% |
| $10,000 to $14,999 | 0 | 0.0% |
| $15,000 to $24,999 | 0 | 0.0% |
| $25,000 to $34,999 | 9 | 1.2% |
| $35,000 to $49,999 | 16 | 2.1% |
| $50,000 to $74,999 | 118 | 15.4% |
| $75,000 to $99,999 | 59 | 7.7% |
| $100,000 to $149,999 | 182 | 23.8% |
| $150,000 to $199,999 | 160 | 20.9% |
| $200,000+ | 213 | 27.9% |
Family Income by Famaliy Size in East Richmond Heights
5-person families (32 | 4.2%) account for the highest median family income in East Richmond Heights with $176,923 per family, while 2-person families (470 | 61.5%) have the highest median income of $58,684 per family member.
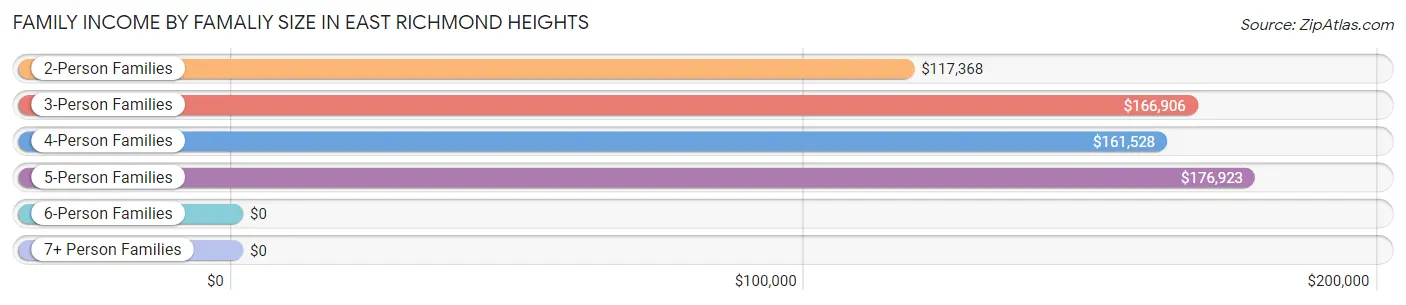
| Income Bracket | # Families | Median Income |
| 2-Person Families | 470 (61.5%) | $117,368 |
| 3-Person Families | 145 (19.0%) | $166,906 |
| 4-Person Families | 61 (8.0%) | $161,528 |
| 5-Person Families | 32 (4.2%) | $176,923 |
| 6-Person Families | 11 (1.4%) | $0 |
| 7+ Person Families | 45 (5.9%) | $0 |
| Total | 764 (100.0%) | $140,500 |
Family Income by Number of Earners in East Richmond Heights
The median family income in East Richmond Heights is $140,500, with families comprising 2 earners (407) having the highest median family income of $179,886, while families with no earners (88) have the lowest median family income of $66,591, accounting for 53.3% and 11.5% of families, respectively.
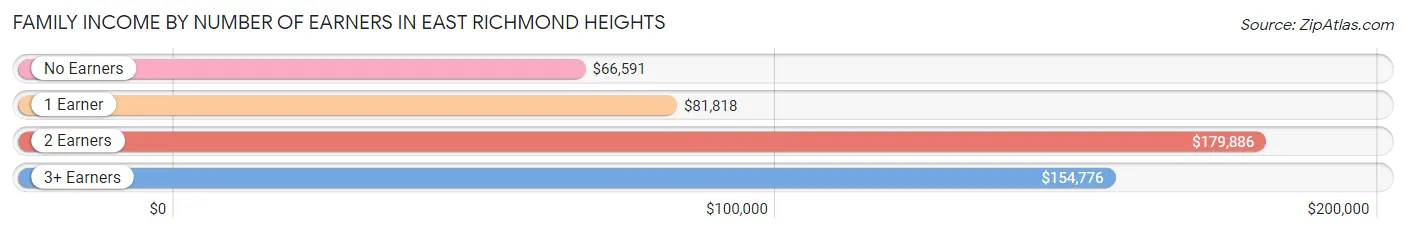
| Number of Earners | # Families | Median Income |
| No Earners | 88 (11.5%) | $66,591 |
| 1 Earner | 198 (25.9%) | $81,818 |
| 2 Earners | 407 (53.3%) | $179,886 |
| 3+ Earners | 71 (9.3%) | $154,776 |
| Total | 764 (100.0%) | $140,500 |
Household Income in East Richmond Heights
Household Income Brackets in East Richmond Heights
With 308 households falling in the category, the $100,000 to $149,999 income range is the most frequent in East Richmond Heights, accounting for 22.4% of all households. In contrast, only 5 households (0.4%) fall into the $10,000 to $14,999 income bracket, making it the least populous group.
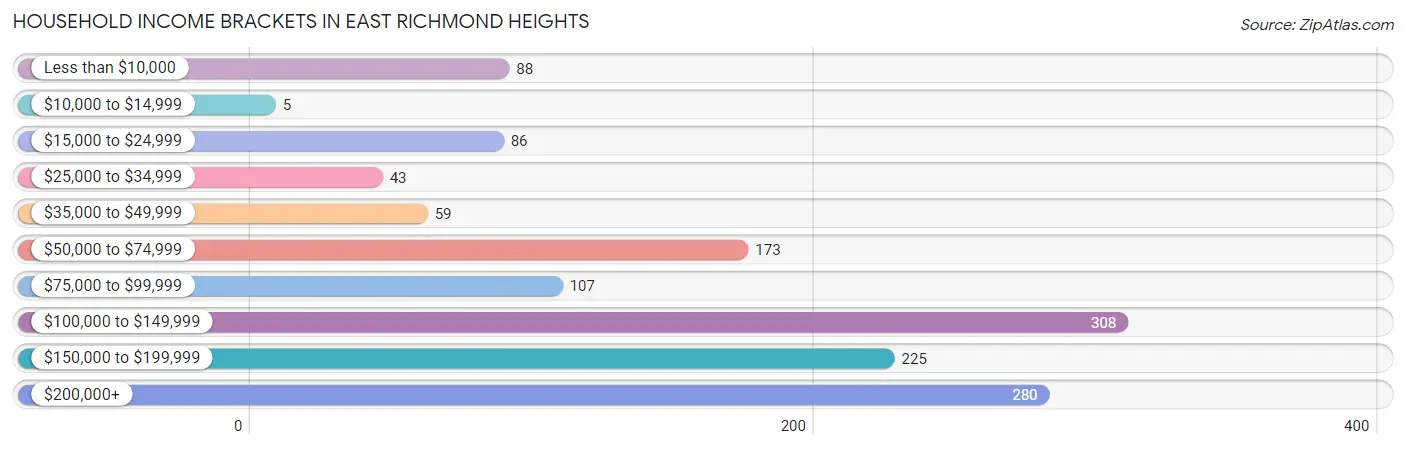
| Income Bracket | # Households | % Households |
| Less than $10,000 | 88 | 6.4% |
| $10,000 to $14,999 | 5 | 0.4% |
| $15,000 to $24,999 | 86 | 6.3% |
| $25,000 to $34,999 | 43 | 3.1% |
| $35,000 to $49,999 | 59 | 4.3% |
| $50,000 to $74,999 | 173 | 12.6% |
| $75,000 to $99,999 | 107 | 7.8% |
| $100,000 to $149,999 | 308 | 22.4% |
| $150,000 to $199,999 | 225 | 16.4% |
| $200,000+ | 280 | 20.4% |
Household Income by Householder Age in East Richmond Heights
The median household income in East Richmond Heights is $112,344, with the highest median household income of $167,407 found in the 25 to 44 years age bracket for the primary householder. A total of 260 households (18.9%) fall into this category.
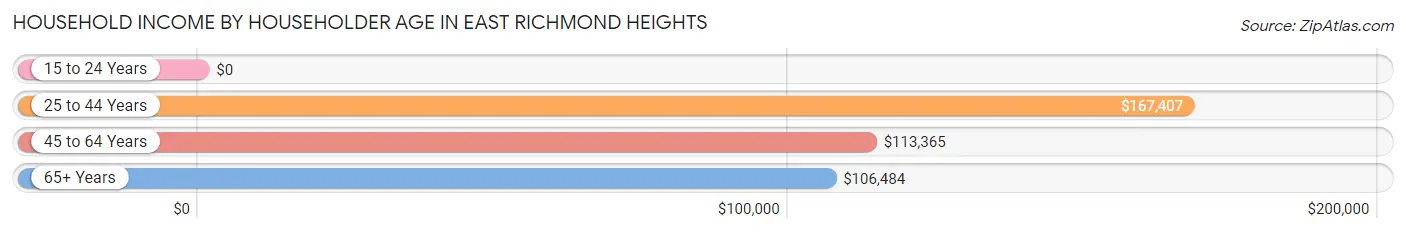
| Income Bracket | # Households | Median Income |
| 15 to 24 Years | 0 (0.0%) | $0 |
| 25 to 44 Years | 260 (18.9%) | $167,407 |
| 45 to 64 Years | 548 (39.9%) | $113,365 |
| 65+ Years | 565 (41.1%) | $106,484 |
| Total | 1,373 (100.0%) | $112,344 |
Poverty in East Richmond Heights
Income Below Poverty by Sex and Age in East Richmond Heights
With 4.9% poverty level for males and 6.1% for females among the residents of East Richmond Heights, 18 to 24 year old males and 12 to 14 year old females are the most vulnerable to poverty, with 11 males (22.0%) and 7 females (41.2%) in their respective age groups living below the poverty level.
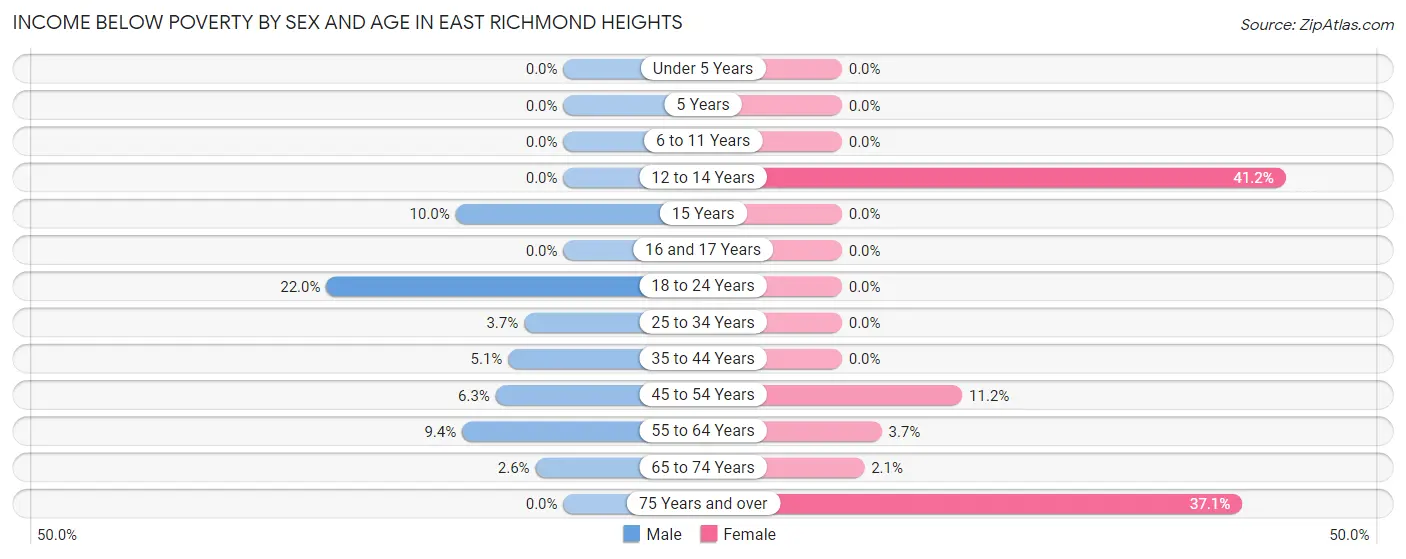
| Age Bracket | Male | Female |
| Under 5 Years | 0 (0.0%) | 0 (0.0%) |
| 5 Years | 0 (0.0%) | 0 (0.0%) |
| 6 to 11 Years | 0 (0.0%) | 0 (0.0%) |
| 12 to 14 Years | 0 (0.0%) | 7 (41.2%) |
| 15 Years | 7 (10.0%) | 0 (0.0%) |
| 16 and 17 Years | 0 (0.0%) | 0 (0.0%) |
| 18 to 24 Years | 11 (22.0%) | 0 (0.0%) |
| 25 to 34 Years | 8 (3.6%) | 0 (0.0%) |
| 35 to 44 Years | 11 (5.1%) | 0 (0.0%) |
| 45 to 54 Years | 15 (6.3%) | 22 (11.2%) |
| 55 to 64 Years | 22 (9.4%) | 11 (3.7%) |
| 65 to 74 Years | 7 (2.6%) | 6 (2.1%) |
| 75 Years and over | 0 (0.0%) | 52 (37.1%) |
| Total | 81 (4.9%) | 98 (6.1%) |
Income Above Poverty by Sex and Age in East Richmond Heights
According to the poverty statistics in East Richmond Heights, males aged under 5 years and females aged under 5 years are the age groups that are most secure financially, with 100.0% of males and 100.0% of females in these age groups living above the poverty line.
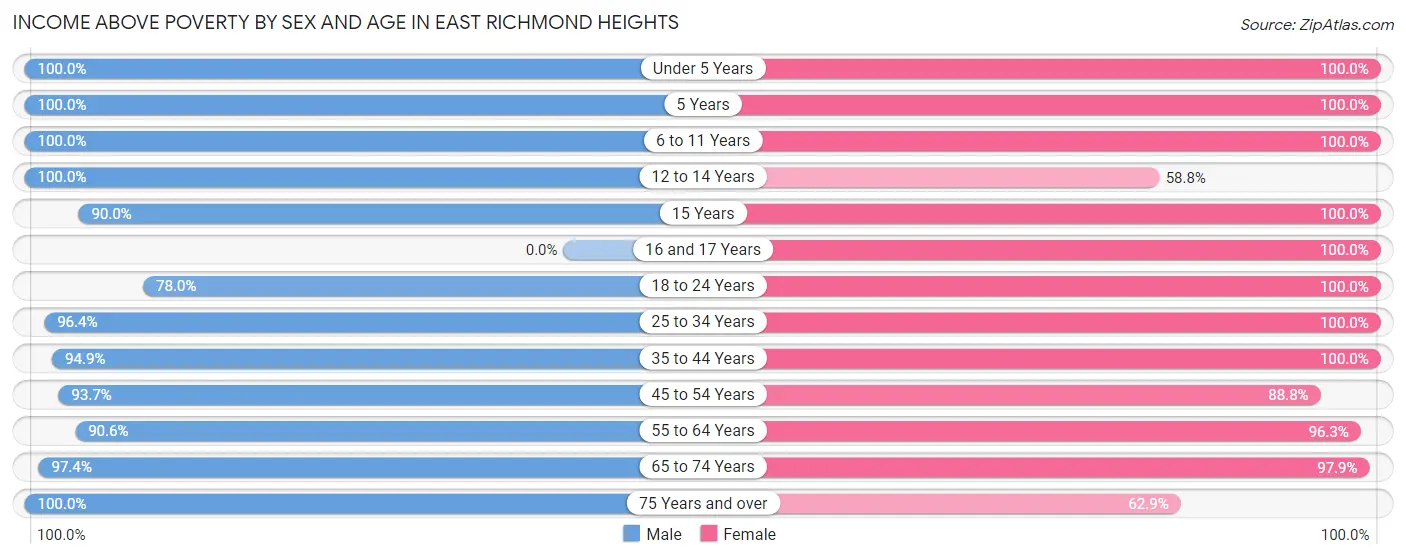
| Age Bracket | Male | Female |
| Under 5 Years | 88 (100.0%) | 68 (100.0%) |
| 5 Years | 18 (100.0%) | 10 (100.0%) |
| 6 to 11 Years | 136 (100.0%) | 95 (100.0%) |
| 12 to 14 Years | 29 (100.0%) | 10 (58.8%) |
| 15 Years | 63 (90.0%) | 8 (100.0%) |
| 16 and 17 Years | 0 (0.0%) | 17 (100.0%) |
| 18 to 24 Years | 39 (78.0%) | 7 (100.0%) |
| 25 to 34 Years | 211 (96.4%) | 201 (100.0%) |
| 35 to 44 Years | 204 (94.9%) | 252 (100.0%) |
| 45 to 54 Years | 224 (93.7%) | 175 (88.8%) |
| 55 to 64 Years | 212 (90.6%) | 287 (96.3%) |
| 65 to 74 Years | 263 (97.4%) | 282 (97.9%) |
| 75 Years and over | 99 (100.0%) | 88 (62.9%) |
| Total | 1,586 (95.1%) | 1,500 (93.9%) |
Income Below Poverty Among Married-Couple Families in East Richmond Heights

| Children | Above Poverty | Below Poverty |
| No Children | 427 (100.0%) | 0 (0.0%) |
| 1 or 2 Children | 146 (100.0%) | 0 (0.0%) |
| 3 or 4 Children | 69 (100.0%) | 0 (0.0%) |
| 5 or more Children | 6 (100.0%) | 0 (0.0%) |
| Total | 648 (100.0%) | 0 (0.0%) |
Income Below Poverty Among Single-Parent Households in East Richmond Heights
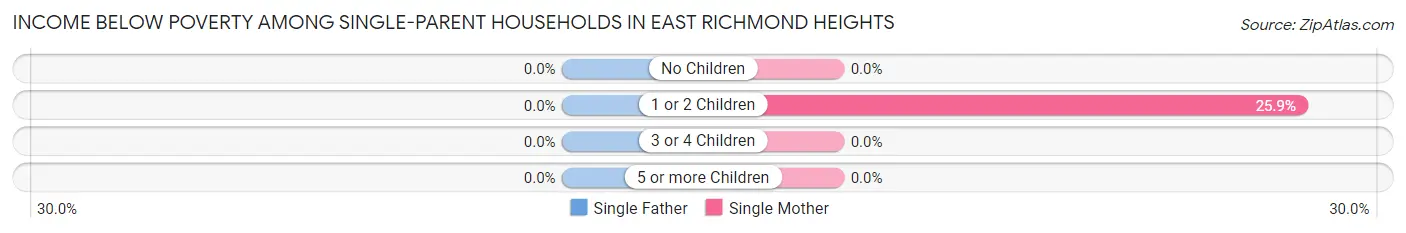
| Children | Single Father | Single Mother |
| No Children | 0 (0.0%) | 0 (0.0%) |
| 1 or 2 Children | 0 (0.0%) | 7 (25.9%) |
| 3 or 4 Children | 0 (0.0%) | 0 (0.0%) |
| 5 or more Children | 0 (0.0%) | 0 (0.0%) |
| Total | 0 (0.0%) | 7 (7.4%) |
Income Below Poverty Among Married-Couple vs Single-Parent Households in East Richmond Heights
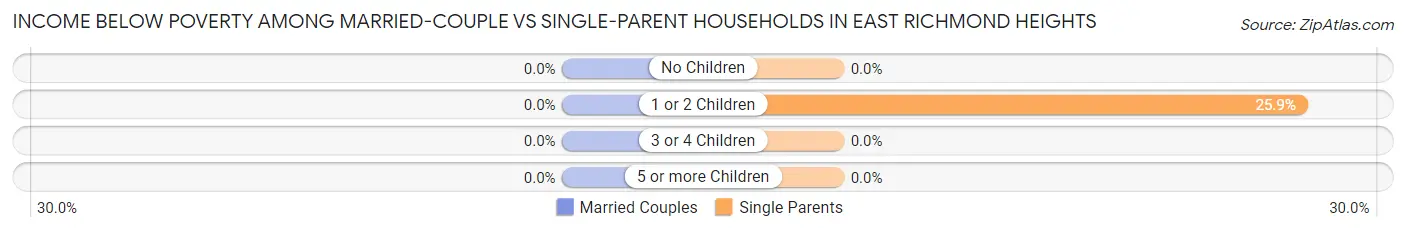
| Children | Married-Couple Families | Single-Parent Households |
| No Children | 0 (0.0%) | 0 (0.0%) |
| 1 or 2 Children | 0 (0.0%) | 7 (25.9%) |
| 3 or 4 Children | 0 (0.0%) | 0 (0.0%) |
| 5 or more Children | 0 (0.0%) | 0 (0.0%) |
| Total | 0 (0.0%) | 7 (6.0%) |
Race in East Richmond Heights
The most populous races in East Richmond Heights are White / Caucasian (1,910 | 58.1%), Hispanic or Latino (644 | 19.6%), and Two or more Races (602 | 18.3%).
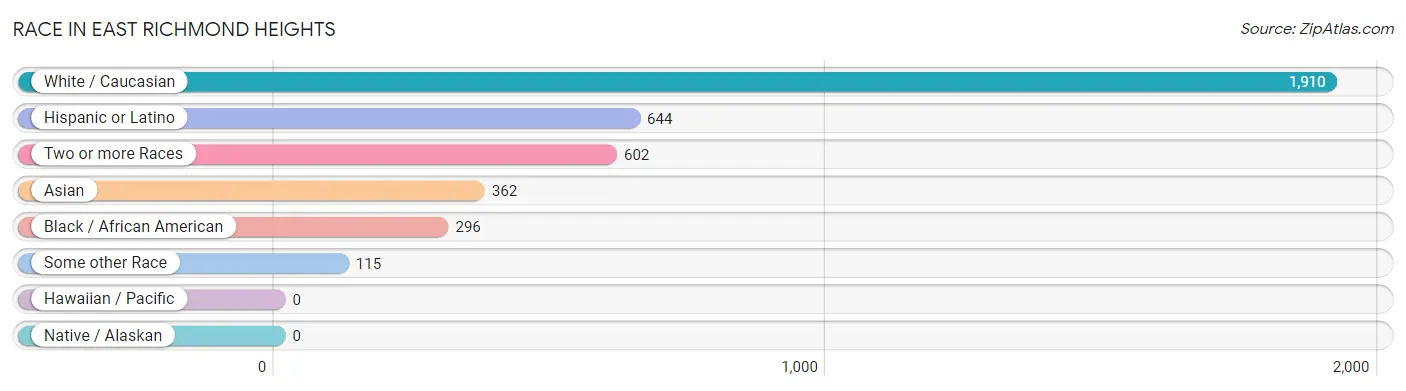
| Race | # Population | % Population |
| Asian | 362 | 11.0% |
| Black / African American | 296 | 9.0% |
| Hawaiian / Pacific | 0 | 0.0% |
| Hispanic or Latino | 644 | 19.6% |
| Native / Alaskan | 0 | 0.0% |
| White / Caucasian | 1,910 | 58.1% |
| Two or more Races | 602 | 18.3% |
| Some other Race | 115 | 3.5% |
| Total | 3,285 | 100.0% |
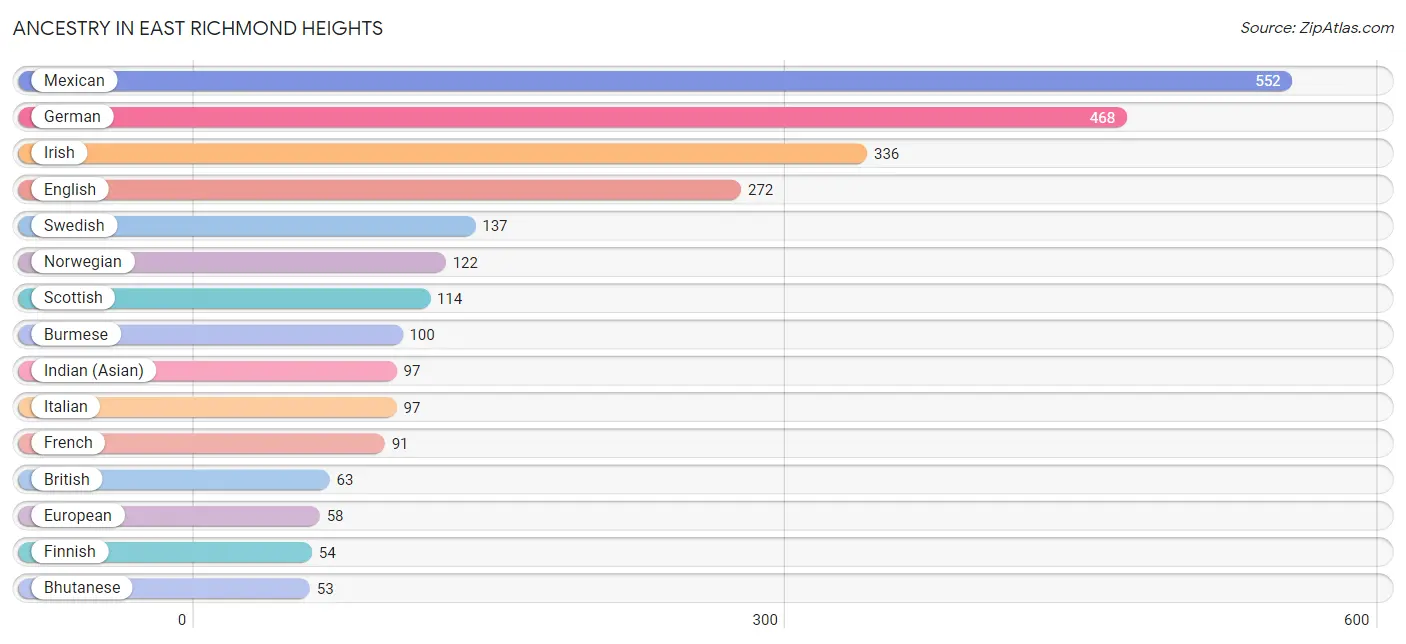
Ancestry in East Richmond Heights
The most populous ancestries reported in East Richmond Heights are Mexican (552 | 16.8%), German (468 | 14.2%), Irish (336 | 10.2%), English (272 | 8.3%), and Swedish (137 | 4.2%), together accounting for 53.7% of all East Richmond Heights residents.
| Ancestry | # Population | % Population |
| American | 28 | 0.9% |
| Arab | 22 | 0.7% |
| Armenian | 21 | 0.6% |
| Austrian | 5 | 0.2% |
| Bhutanese | 53 | 1.6% |
| Blackfeet | 8 | 0.2% |
| British | 63 | 1.9% |
| Burmese | 100 | 3.0% |
| Central American | 24 | 0.7% |
| Cherokee | 15 | 0.5% |
| Costa Rican | 2 | 0.1% |
| Danish | 4 | 0.1% |
| Dominican | 10 | 0.3% |
| Dutch | 13 | 0.4% |
| Eastern European | 27 | 0.8% |
| Egyptian | 22 | 0.7% |
| English | 272 | 8.3% |
| European | 58 | 1.8% |
| Filipino | 33 | 1.0% |
| Finnish | 54 | 1.6% |
| French | 91 | 2.8% |
| French Canadian | 48 | 1.5% |
| German | 468 | 14.2% |
| Indian (Asian) | 97 | 2.9% |
| Iranian | 42 | 1.3% |
| Irish | 336 | 10.2% |
| Israeli | 5 | 0.2% |
| Italian | 97 | 2.9% |
| Korean | 35 | 1.1% |
| Mexican | 552 | 16.8% |
| Nigerian | 15 | 0.5% |
| Norwegian | 122 | 3.7% |
| Peruvian | 16 | 0.5% |
| Polish | 45 | 1.4% |
| Portuguese | 53 | 1.6% |
| Russian | 35 | 1.1% |
| Salvadoran | 22 | 0.7% |
| Scandinavian | 9 | 0.3% |
| Scotch-Irish | 10 | 0.3% |
| Scottish | 114 | 3.5% |
| Sioux | 20 | 0.6% |
| Slavic | 8 | 0.2% |
| Slovak | 7 | 0.2% |
| South American | 16 | 0.5% |
| South American Indian | 8 | 0.2% |
| Spaniard | 32 | 1.0% |
| Spanish | 9 | 0.3% |
| Sri Lankan | 36 | 1.1% |
| Subsaharan African | 15 | 0.5% |
| Swedish | 137 | 4.2% |
| Swiss | 21 | 0.6% |
| Thai | 17 | 0.5% |
| Ukrainian | 26 | 0.8% |
| Welsh | 36 | 1.1% |
| West Indian | 34 | 1.0% | View All 55 Rows |
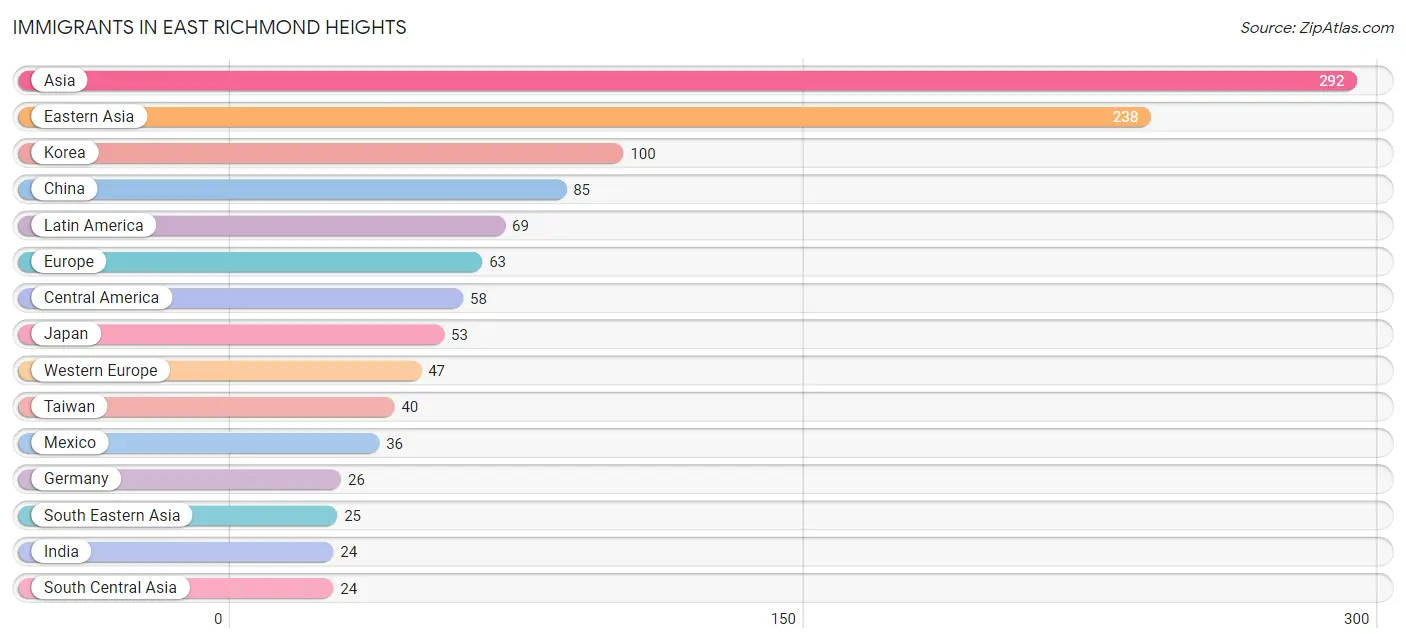
Immigrants in East Richmond Heights
The most numerous immigrant groups reported in East Richmond Heights came from Asia (292 | 8.9%), Eastern Asia (238 | 7.2%), Korea (100 | 3.0%), China (85 | 2.6%), and Latin America (69 | 2.1%), together accounting for 23.9% of all East Richmond Heights residents.
| Immigration Origin | # Population | % Population |
| Africa | 15 | 0.5% |
| Asia | 292 | 8.9% |
| Austria | 6 | 0.2% |
| Brazil | 11 | 0.3% |
| Canada | 10 | 0.3% |
| Central America | 58 | 1.8% |
| China | 85 | 2.6% |
| Eastern Asia | 238 | 7.2% |
| El Salvador | 22 | 0.7% |
| Europe | 63 | 1.9% |
| France | 10 | 0.3% |
| Germany | 26 | 0.8% |
| Hong Kong | 11 | 0.3% |
| India | 24 | 0.7% |
| Israel | 5 | 0.2% |
| Italy | 7 | 0.2% |
| Japan | 53 | 1.6% |
| Korea | 100 | 3.0% |
| Latin America | 69 | 2.1% |
| Mexico | 36 | 1.1% |
| Nigeria | 15 | 0.5% |
| Northern Europe | 9 | 0.3% |
| Philippines | 8 | 0.2% |
| South America | 11 | 0.3% |
| South Central Asia | 24 | 0.7% |
| South Eastern Asia | 25 | 0.8% |
| Southern Europe | 7 | 0.2% |
| Sweden | 9 | 0.3% |
| Switzerland | 5 | 0.2% |
| Taiwan | 40 | 1.2% |
| Vietnam | 17 | 0.5% |
| Western Africa | 15 | 0.5% |
| Western Asia | 5 | 0.2% |
| Western Europe | 47 | 1.4% | View All 34 Rows |
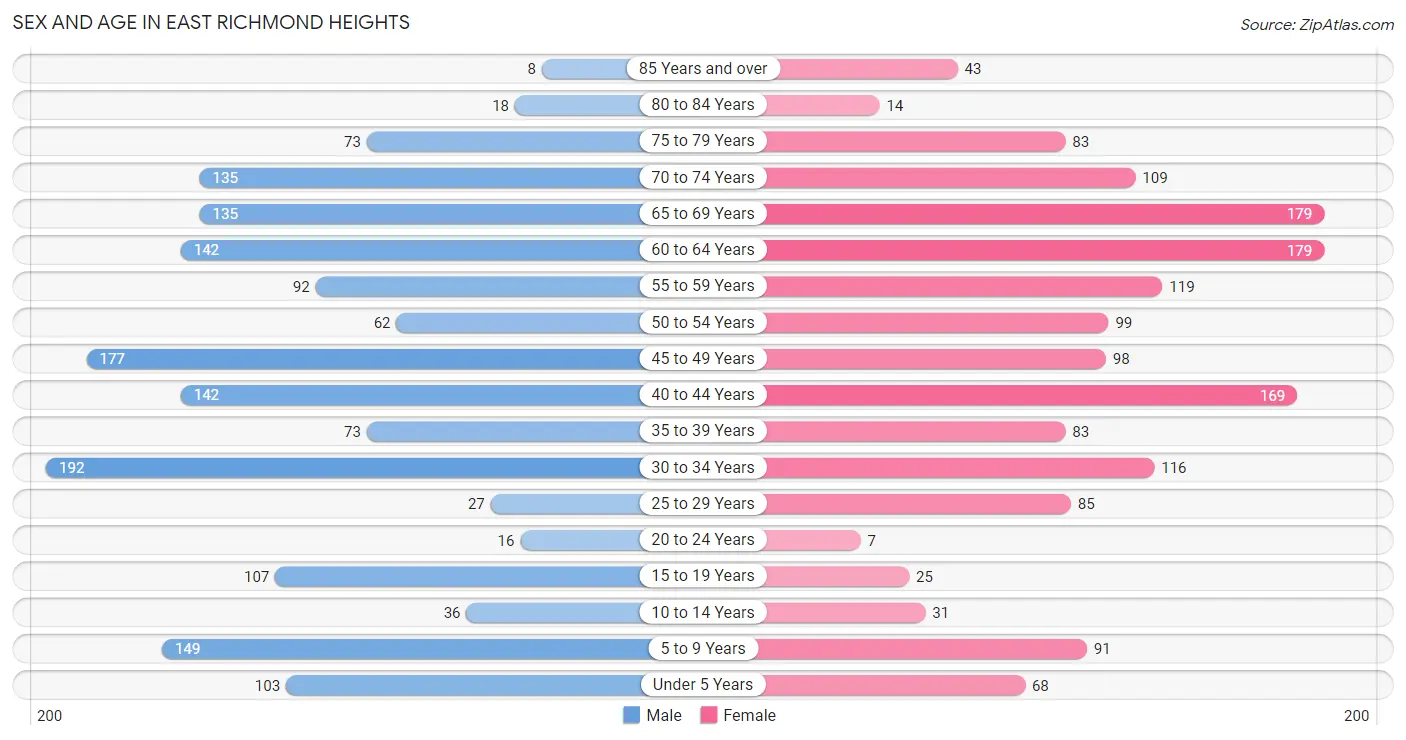
Sex and Age in East Richmond Heights
Sex and Age in East Richmond Heights
The most populous age groups in East Richmond Heights are 30 to 34 Years (192 | 11.4%) for men and 60 to 64 Years (179 | 11.2%) for women.
| Age Bracket | Male | Female |
| Under 5 Years | 103 (6.1%) | 68 (4.3%) |
| 5 to 9 Years | 149 (8.8%) | 91 (5.7%) |
| 10 to 14 Years | 36 (2.1%) | 31 (1.9%) |
| 15 to 19 Years | 107 (6.3%) | 25 (1.6%) |
| 20 to 24 Years | 16 (0.9%) | 7 (0.4%) |
| 25 to 29 Years | 27 (1.6%) | 85 (5.3%) |
| 30 to 34 Years | 192 (11.4%) | 116 (7.3%) |
| 35 to 39 Years | 73 (4.3%) | 83 (5.2%) |
| 40 to 44 Years | 142 (8.4%) | 169 (10.6%) |
| 45 to 49 Years | 177 (10.5%) | 98 (6.1%) |
| 50 to 54 Years | 62 (3.7%) | 99 (6.2%) |
| 55 to 59 Years | 92 (5.4%) | 119 (7.4%) |
| 60 to 64 Years | 142 (8.4%) | 179 (11.2%) |
| 65 to 69 Years | 135 (8.0%) | 179 (11.2%) |
| 70 to 74 Years | 135 (8.0%) | 109 (6.8%) |
| 75 to 79 Years | 73 (4.3%) | 83 (5.2%) |
| 80 to 84 Years | 18 (1.1%) | 14 (0.9%) |
| 85 Years and over | 8 (0.5%) | 43 (2.7%) |
| Total | 1,687 (100.0%) | 1,598 (100.0%) |
Families and Households in East Richmond Heights
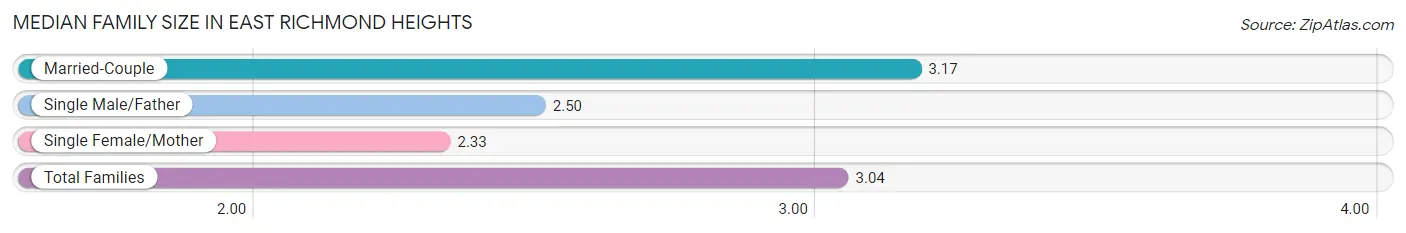
Median Family Size in East Richmond Heights
The median family size in East Richmond Heights is 3.04 persons per family, with married-couple families (648 | 84.8%) accounting for the largest median family size of 3.17 persons per family. On the other hand, single female/mother families (94 | 12.3%) represent the smallest median family size with 2.33 persons per family.
| Family Type | # Families | Family Size |
| Married-Couple | 648 (84.8%) | 3.17 |
| Single Male/Father | 22 (2.9%) | 2.50 |
| Single Female/Mother | 94 (12.3%) | 2.33 |
| Total Families | 764 (100.0%) | 3.04 |
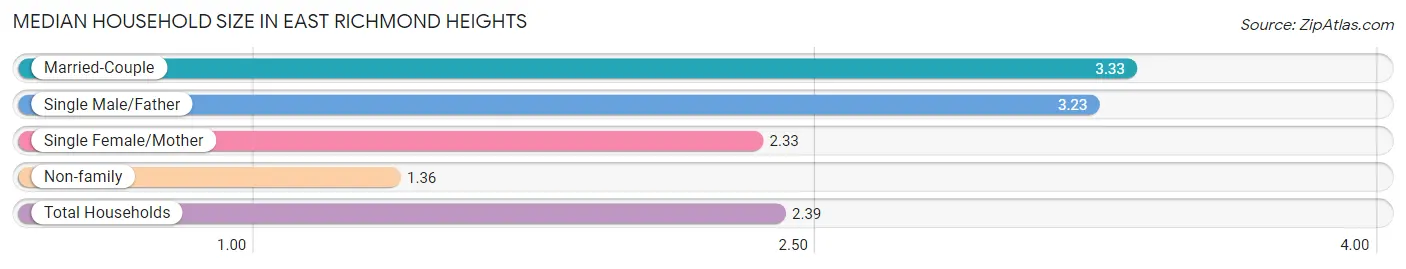
Median Household Size in East Richmond Heights
The median household size in East Richmond Heights is 2.39 persons per household, with married-couple households (648 | 47.2%) accounting for the largest median household size of 3.33 persons per household. non-family households (609 | 44.4%) represent the smallest median household size with 1.36 persons per household.
| Household Type | # Households | Household Size |
| Married-Couple | 648 (47.2%) | 3.33 |
| Single Male/Father | 22 (1.6%) | 3.23 |
| Single Female/Mother | 94 (6.9%) | 2.33 |
| Non-family | 609 (44.4%) | 1.36 |
| Total Households | 1,373 (100.0%) | 2.39 |
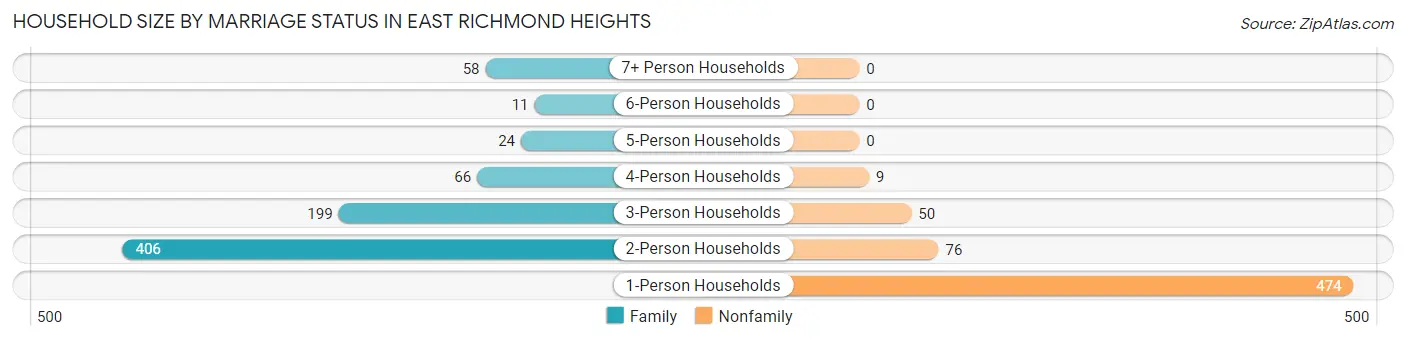
Household Size by Marriage Status in East Richmond Heights
Out of a total of 1,373 households in East Richmond Heights, 764 (55.6%) are family households, while 609 (44.4%) are nonfamily households. The most numerous type of family households are 2-person households, comprising 406, and the most common type of nonfamily households are 1-person households, comprising 474.
| Household Size | Family Households | Nonfamily Households |
| 1-Person Households | - | 474 (34.5%) |
| 2-Person Households | 406 (29.6%) | 76 (5.5%) |
| 3-Person Households | 199 (14.5%) | 50 (3.6%) |
| 4-Person Households | 66 (4.8%) | 9 (0.7%) |
| 5-Person Households | 24 (1.8%) | 0 (0.0%) |
| 6-Person Households | 11 (0.8%) | 0 (0.0%) |
| 7+ Person Households | 58 (4.2%) | 0 (0.0%) |
| Total | 764 (55.6%) | 609 (44.4%) |
Female Fertility in East Richmond Heights
Fertility by Age in East Richmond Heights
Average fertility rate in East Richmond Heights is 25.0 births per 1,000 women. Women in the age bracket of 35 to 50 years have the highest fertility rate with 41.0 births per 1,000 women. Women in the age bracket of 35 to 50 years acount for 100.0% of all women with births.
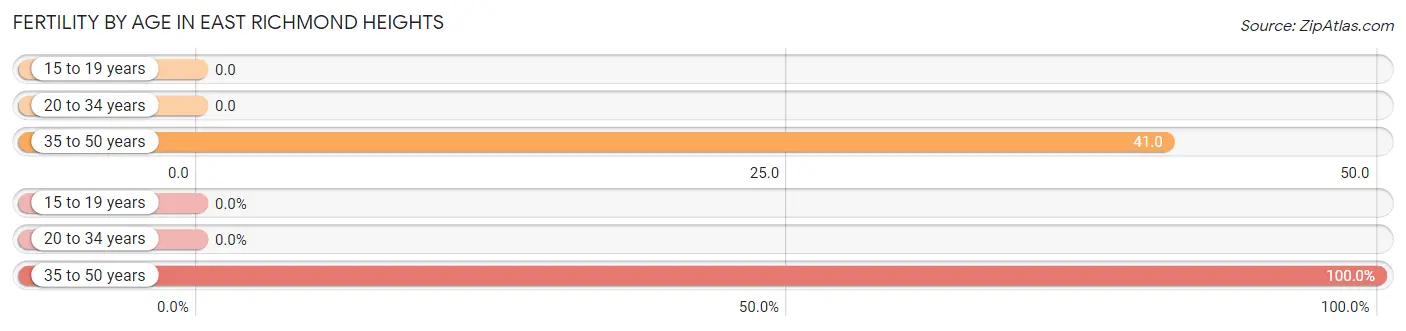
| Age Bracket | Women with Births | Births / 1,000 Women |
| 15 to 19 years | 0 (0.0%) | 0.0 |
| 20 to 34 years | 0 (0.0%) | 0.0 |
| 35 to 50 years | 15 (100.0%) | 41.0 |
| Total | 15 (100.0%) | 25.0 |
Fertility by Age by Marriage Status in East Richmond Heights
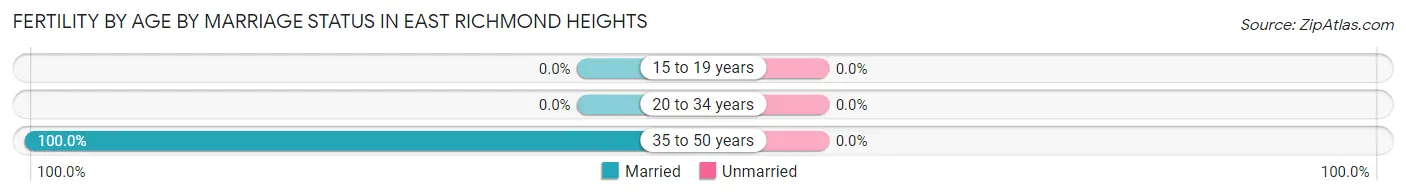
| Age Bracket | Married | Unmarried |
| 15 to 19 years | 0 (0.0%) | 0 (0.0%) |
| 20 to 34 years | 0 (0.0%) | 0 (0.0%) |
| 35 to 50 years | 15 (100.0%) | 0 (0.0%) |
| Total | 15 (100.0%) | 0 (0.0%) |
Fertility by Education in East Richmond Heights
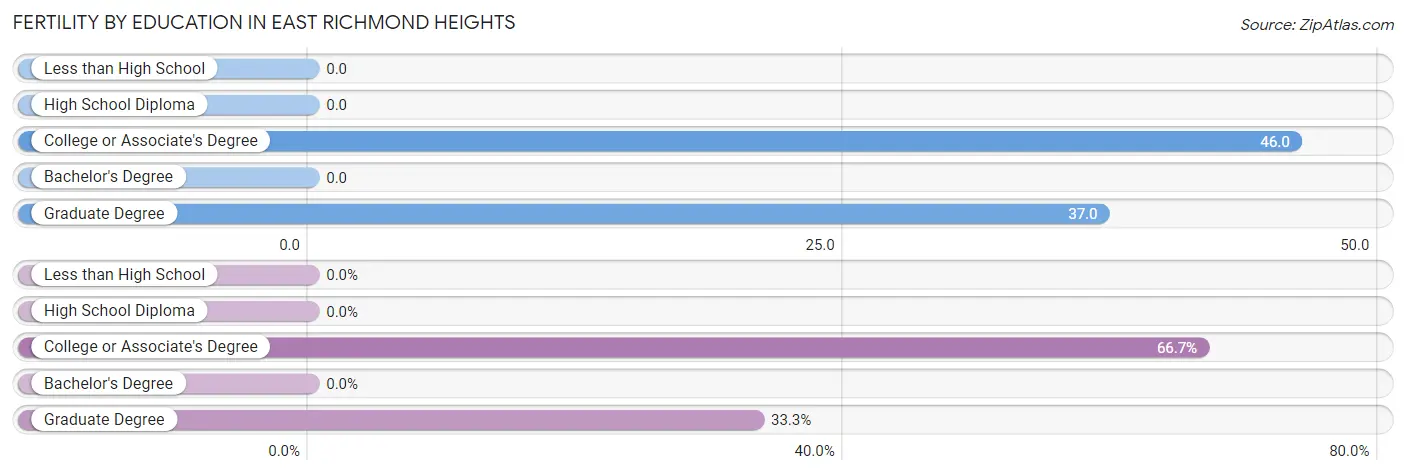
| Educational Attainment | Women with Births | Births / 1,000 Women |
| Less than High School | 0 (0.0%) | 0.0 |
| High School Diploma | 0 (0.0%) | 0.0 |
| College or Associate's Degree | 10 (66.7%) | 46.0 |
| Bachelor's Degree | 0 (0.0%) | 0.0 |
| Graduate Degree | 5 (33.3%) | 37.0 |
| Total | 15 (100.0%) | 25.0 |
Fertility by Education by Marriage Status in East Richmond Heights
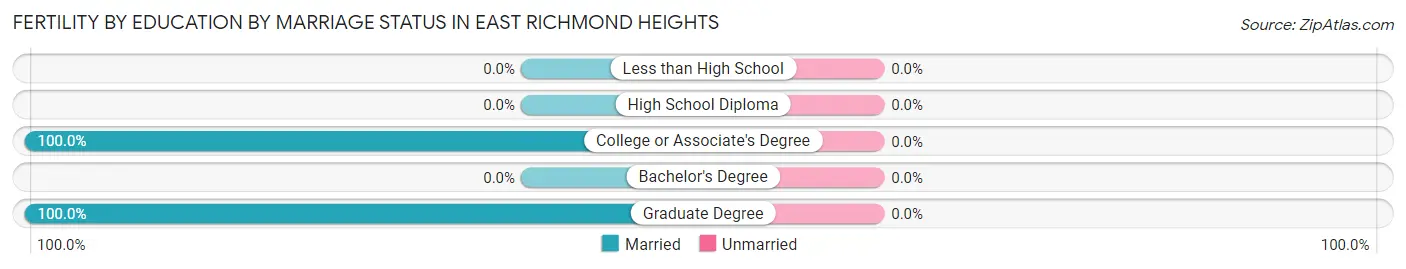
| Educational Attainment | Married | Unmarried |
| Less than High School | 0 (0.0%) | 0 (0.0%) |
| High School Diploma | 0 (0.0%) | 0 (0.0%) |
| College or Associate's Degree | 10 (100.0%) | 0 (0.0%) |
| Bachelor's Degree | 0 (0.0%) | 0 (0.0%) |
| Graduate Degree | 5 (100.0%) | 0 (0.0%) |
| Total | 15 (100.0%) | 0 (0.0%) |
Employment Characteristics in East Richmond Heights
Employment by Class of Employer in East Richmond Heights
Among the 1,791 employed individuals in East Richmond Heights, private company employees (999 | 55.8%), self-employed (not incorporated) (318 | 17.8%), and not-for-profit organizations (178 | 9.9%) make up the most common classes of employment.
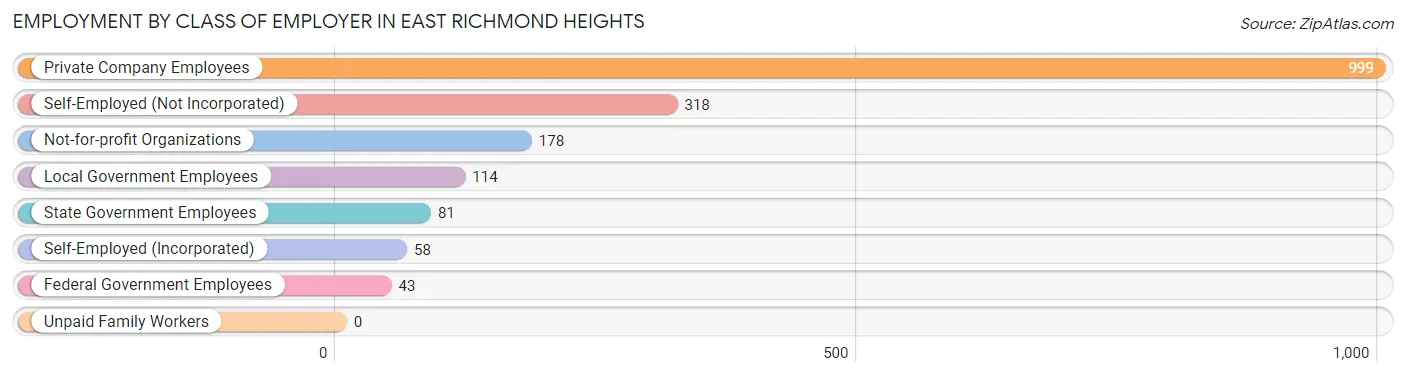
| Employer Class | # Employees | % Employees |
| Private Company Employees | 999 | 55.8% |
| Self-Employed (Incorporated) | 58 | 3.2% |
| Self-Employed (Not Incorporated) | 318 | 17.8% |
| Not-for-profit Organizations | 178 | 9.9% |
| Local Government Employees | 114 | 6.4% |
| State Government Employees | 81 | 4.5% |
| Federal Government Employees | 43 | 2.4% |
| Unpaid Family Workers | 0 | 0.0% |
| Total | 1,791 | 100.0% |
Employment Status by Age in East Richmond Heights
According to the labor force statistics for East Richmond Heights, out of the total population over 16 years of age (2,728), 72.5% or 1,978 individuals are in the labor force, with 6.4% or 127 of them unemployed. The age group with the highest labor force participation rate is 20 to 24 years, with 100.0% or 23 individuals in the labor force. Within the labor force, the 30 to 34 years age range has the highest percentage of unemployed individuals, with 21.4% or 55 of them being unemployed.
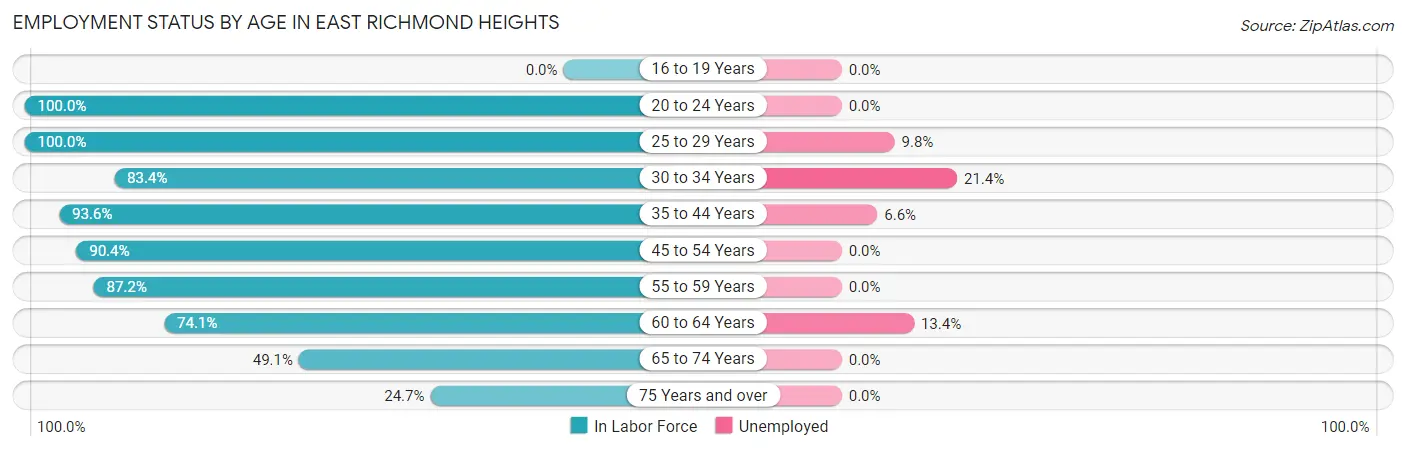
| Age Bracket | In Labor Force | Unemployed |
| 16 to 19 Years | 0 (0.0%) | 0 (0.0%) |
| 20 to 24 Years | 23 (100.0%) | 0 (0.0%) |
| 25 to 29 Years | 112 (100.0%) | 11 (9.8%) |
| 30 to 34 Years | 257 (83.4%) | 55 (21.4%) |
| 35 to 44 Years | 437 (93.6%) | 29 (6.6%) |
| 45 to 54 Years | 394 (90.4%) | 0 (0.0%) |
| 55 to 59 Years | 184 (87.2%) | 0 (0.0%) |
| 60 to 64 Years | 238 (74.1%) | 32 (13.4%) |
| 65 to 74 Years | 274 (49.1%) | 0 (0.0%) |
| 75 Years and over | 59 (24.7%) | 0 (0.0%) |
| Total | 1,978 (72.5%) | 127 (6.4%) |
Employment Status by Educational Attainment in East Richmond Heights
According to labor force statistics for East Richmond Heights, 87.4% of individuals (1,621) out of the total population between 25 and 64 years of age (1,855) are in the labor force, with 7.8% or 126 of them being unemployed. The group with the highest labor force participation rate are those with the educational attainment of bachelor's degree or higher, with 92.9% or 1,010 individuals in the labor force. Within the labor force, individuals with high school diploma education have the highest percentage of unemployment, with 27.4% or 31 of them being unemployed.
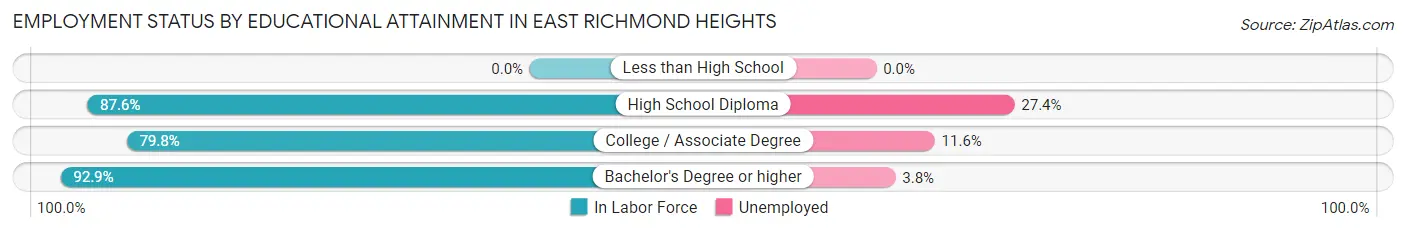
| Educational Attainment | In Labor Force | Unemployed |
| Less than High School | 0 (0.0%) | 0 (0.0%) |
| High School Diploma | 113 (87.6%) | 35 (27.4%) |
| College / Associate Degree | 499 (79.8%) | 72 (11.6%) |
| Bachelor's Degree or higher | 1,010 (92.9%) | 41 (3.8%) |
| Total | 1,621 (87.4%) | 145 (7.8%) |
Employment Occupations by Sex in East Richmond Heights
Management, Business, Science and Arts Occupations
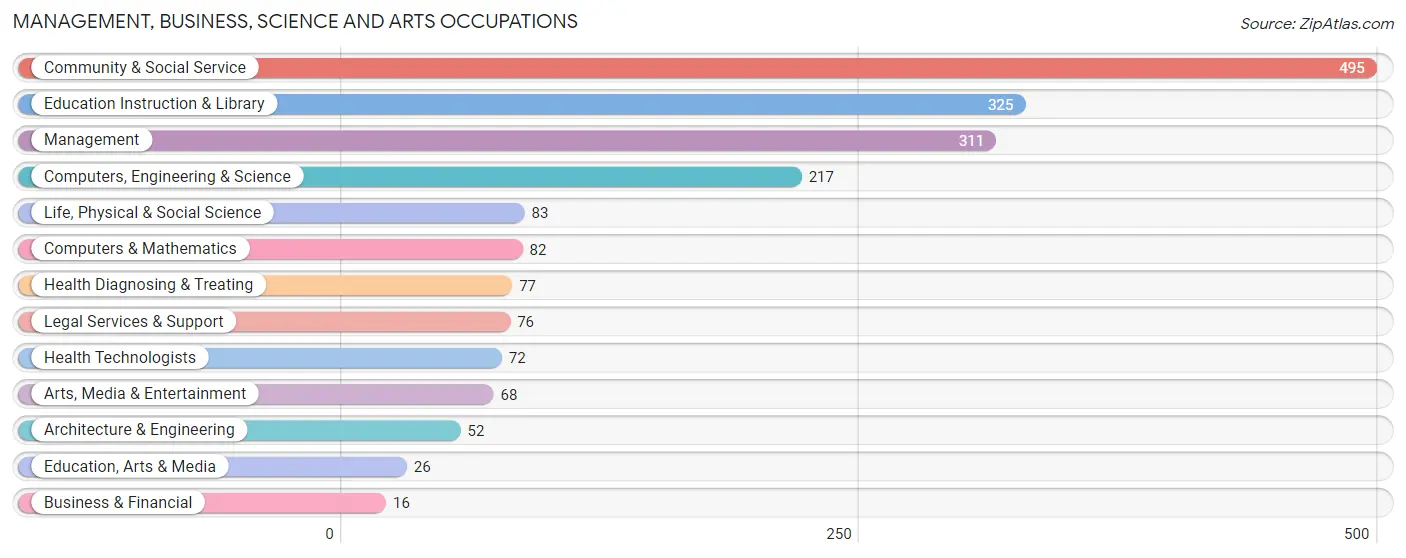
The most common Management, Business, Science and Arts occupations in East Richmond Heights are Community & Social Service (495 | 26.7%), Education Instruction & Library (325 | 17.6%), Management (311 | 16.8%), Computers, Engineering & Science (217 | 11.7%), and Life, Physical & Social Science (83 | 4.5%).
Management, Business, Science and Arts Occupations by Sex
Within the Management, Business, Science and Arts occupations in East Richmond Heights, the most male-oriented occupations are Computers & Mathematics (82.9%), Legal Services & Support (68.4%), and Education Instruction & Library (64.9%), while the most female-oriented occupations are Education, Arts & Media (100.0%), Health Diagnosing & Treating (80.5%), and Health Technologists (79.2%).
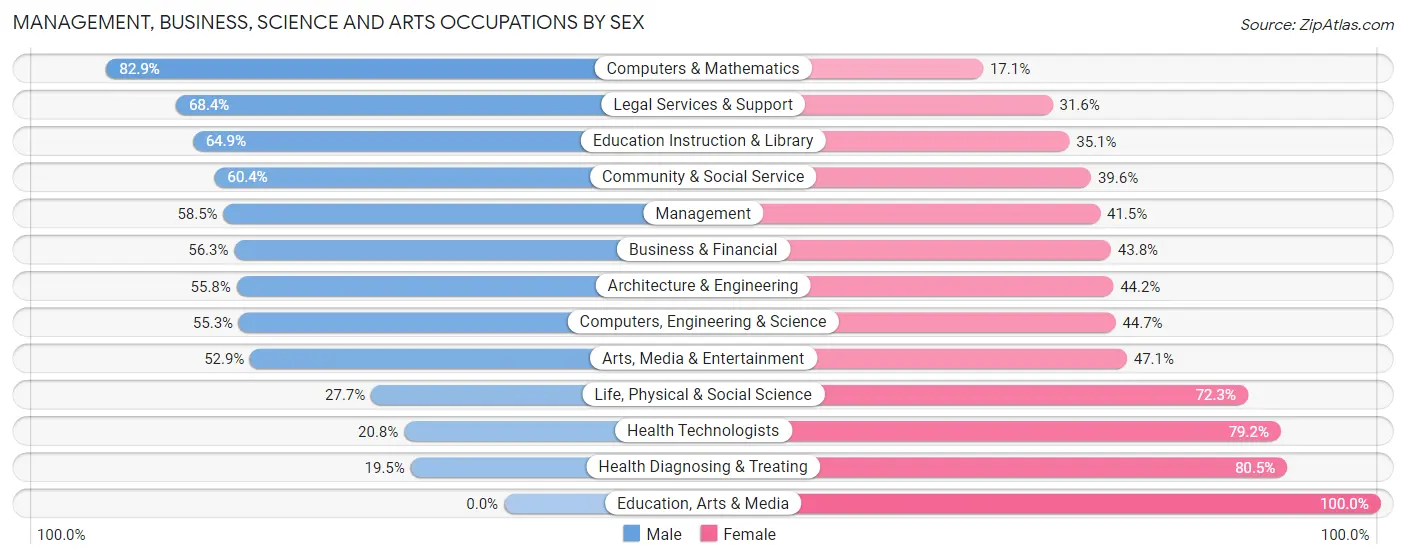
| Occupation | Male | Female |
| Management | 182 (58.5%) | 129 (41.5%) |
| Business & Financial | 9 (56.2%) | 7 (43.8%) |
| Computers, Engineering & Science | 120 (55.3%) | 97 (44.7%) |
| Computers & Mathematics | 68 (82.9%) | 14 (17.1%) |
| Architecture & Engineering | 29 (55.8%) | 23 (44.2%) |
| Life, Physical & Social Science | 23 (27.7%) | 60 (72.3%) |
| Community & Social Service | 299 (60.4%) | 196 (39.6%) |
| Education, Arts & Media | 0 (0.0%) | 26 (100.0%) |
| Legal Services & Support | 52 (68.4%) | 24 (31.6%) |
| Education Instruction & Library | 211 (64.9%) | 114 (35.1%) |
| Arts, Media & Entertainment | 36 (52.9%) | 32 (47.1%) |
| Health Diagnosing & Treating | 15 (19.5%) | 62 (80.5%) |
| Health Technologists | 15 (20.8%) | 57 (79.2%) |
| Total (Category) | 625 (56.0%) | 491 (44.0%) |
| Total (Overall) | 920 (49.7%) | 931 (50.3%) |
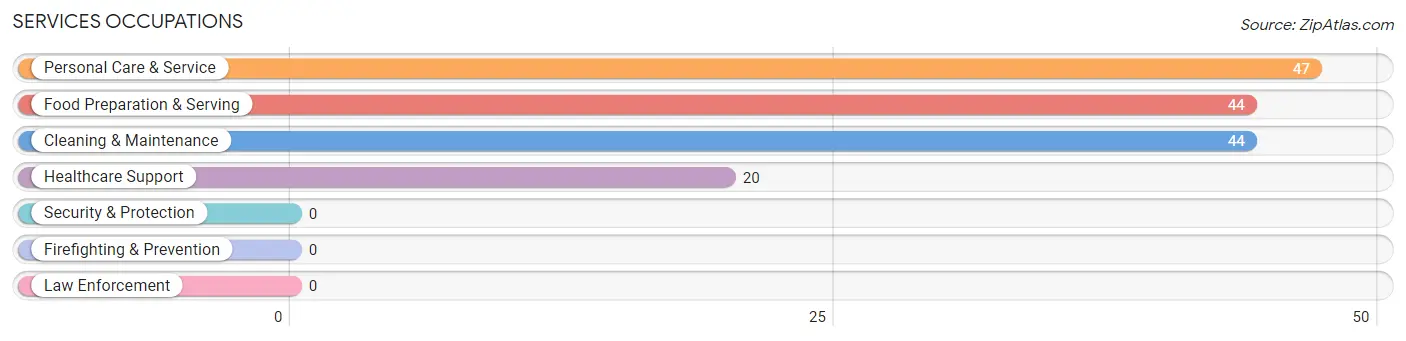
Services Occupations
The most common Services occupations in East Richmond Heights are Personal Care & Service (47 | 2.5%), Food Preparation & Serving (44 | 2.4%), Cleaning & Maintenance (44 | 2.4%), and Healthcare Support (20 | 1.1%).
Services Occupations by Sex
Within the Services occupations in East Richmond Heights, the most male-oriented occupations are Food Preparation & Serving (65.9%), and Personal Care & Service (27.7%), while the most female-oriented occupations are Healthcare Support (100.0%), Cleaning & Maintenance (100.0%), and Personal Care & Service (72.3%).
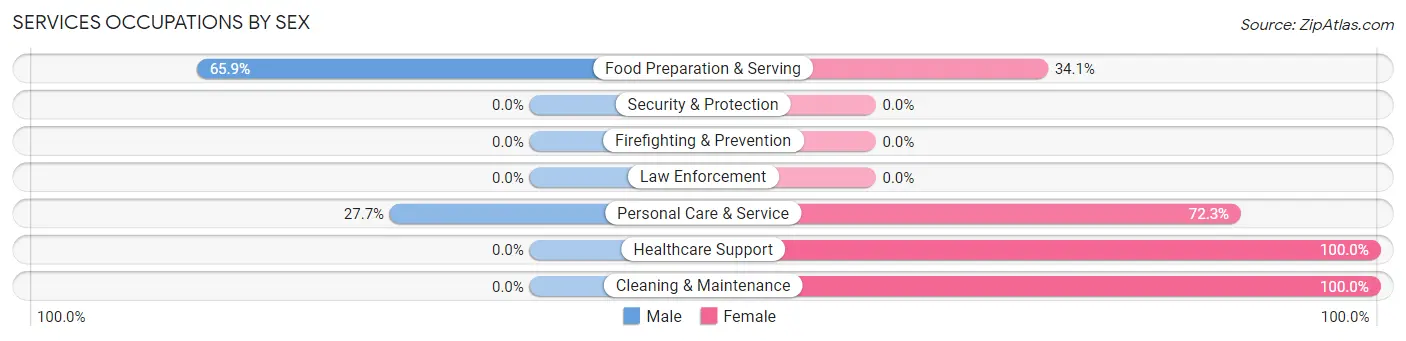
| Occupation | Male | Female |
| Healthcare Support | 0 (0.0%) | 20 (100.0%) |
| Security & Protection | 0 (0.0%) | 0 (0.0%) |
| Firefighting & Prevention | 0 (0.0%) | 0 (0.0%) |
| Law Enforcement | 0 (0.0%) | 0 (0.0%) |
| Food Preparation & Serving | 29 (65.9%) | 15 (34.1%) |
| Cleaning & Maintenance | 0 (0.0%) | 44 (100.0%) |
| Personal Care & Service | 13 (27.7%) | 34 (72.3%) |
| Total (Category) | 42 (27.1%) | 113 (72.9%) |
| Total (Overall) | 920 (49.7%) | 931 (50.3%) |
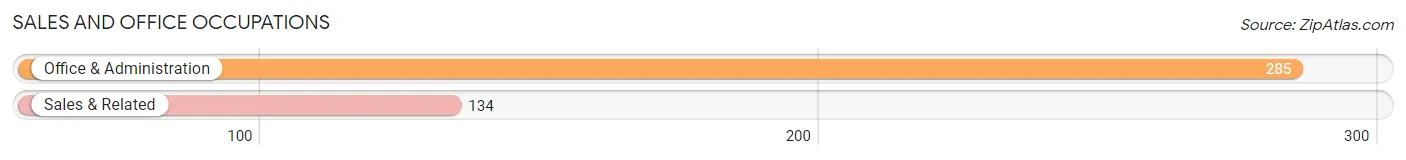
Sales and Office Occupations
The most common Sales and Office occupations in East Richmond Heights are Office & Administration (285 | 15.4%), and Sales & Related (134 | 7.2%).
Sales and Office Occupations by Sex
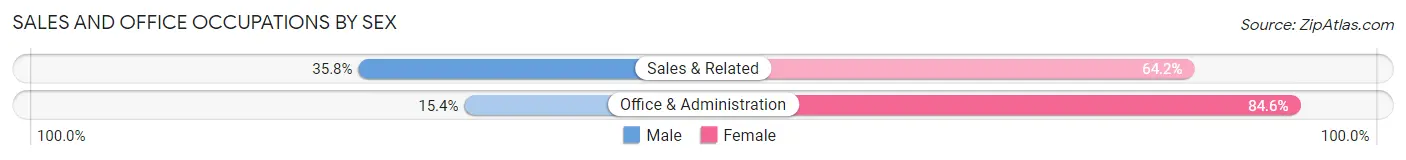
| Occupation | Male | Female |
| Sales & Related | 48 (35.8%) | 86 (64.2%) |
| Office & Administration | 44 (15.4%) | 241 (84.6%) |
| Total (Category) | 92 (22.0%) | 327 (78.0%) |
| Total (Overall) | 920 (49.7%) | 931 (50.3%) |
Natural Resources, Construction and Maintenance Occupations
The most common Natural Resources, Construction and Maintenance occupations in East Richmond Heights are Construction & Extraction (73 | 3.9%), and Installation, Maintenance & Repair (10 | 0.5%).
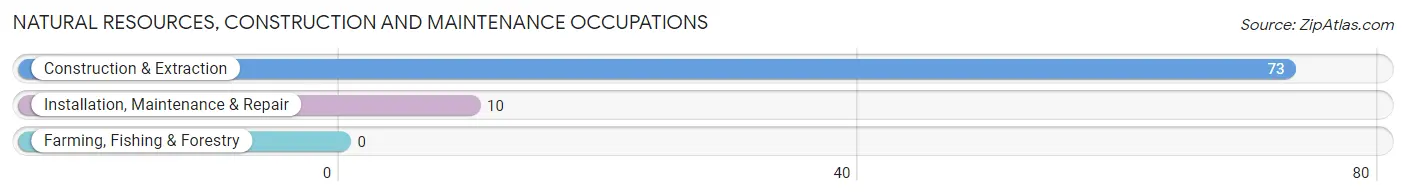
Natural Resources, Construction and Maintenance Occupations by Sex
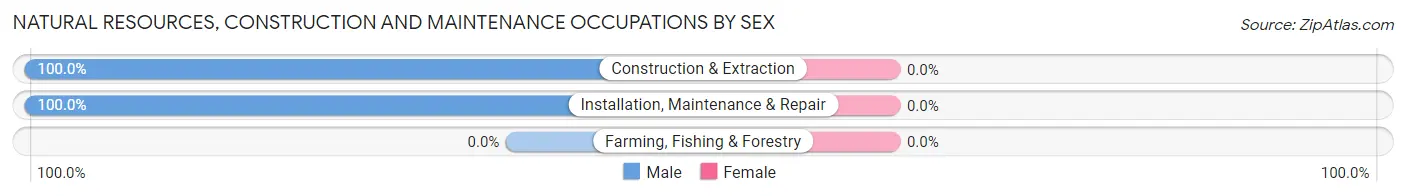
| Occupation | Male | Female |
| Farming, Fishing & Forestry | 0 (0.0%) | 0 (0.0%) |
| Construction & Extraction | 73 (100.0%) | 0 (0.0%) |
| Installation, Maintenance & Repair | 10 (100.0%) | 0 (0.0%) |
| Total (Category) | 83 (100.0%) | 0 (0.0%) |
| Total (Overall) | 920 (49.7%) | 931 (50.3%) |
Production, Transportation and Moving Occupations
The most common Production, Transportation and Moving occupations in East Richmond Heights are Production (56 | 3.0%), Transportation (17 | 0.9%), and Material Moving (5 | 0.3%).
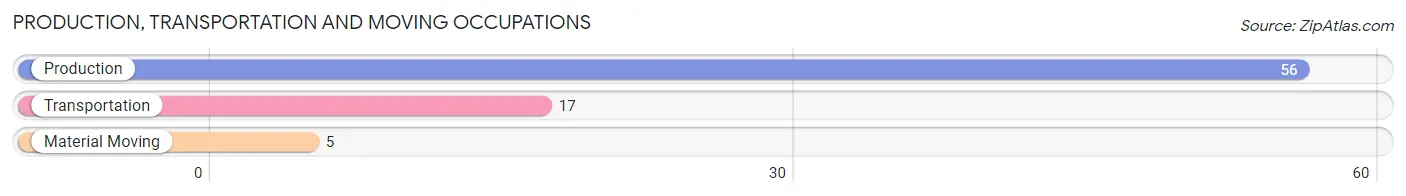
Production, Transportation and Moving Occupations by Sex
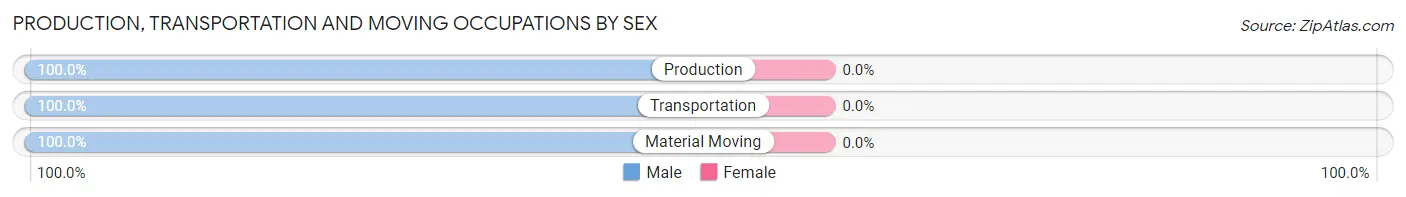
| Occupation | Male | Female |
| Production | 56 (100.0%) | 0 (0.0%) |
| Transportation | 17 (100.0%) | 0 (0.0%) |
| Material Moving | 5 (100.0%) | 0 (0.0%) |
| Total (Category) | 78 (100.0%) | 0 (0.0%) |
| Total (Overall) | 920 (49.7%) | 931 (50.3%) |
Employment Industries by Sex in East Richmond Heights
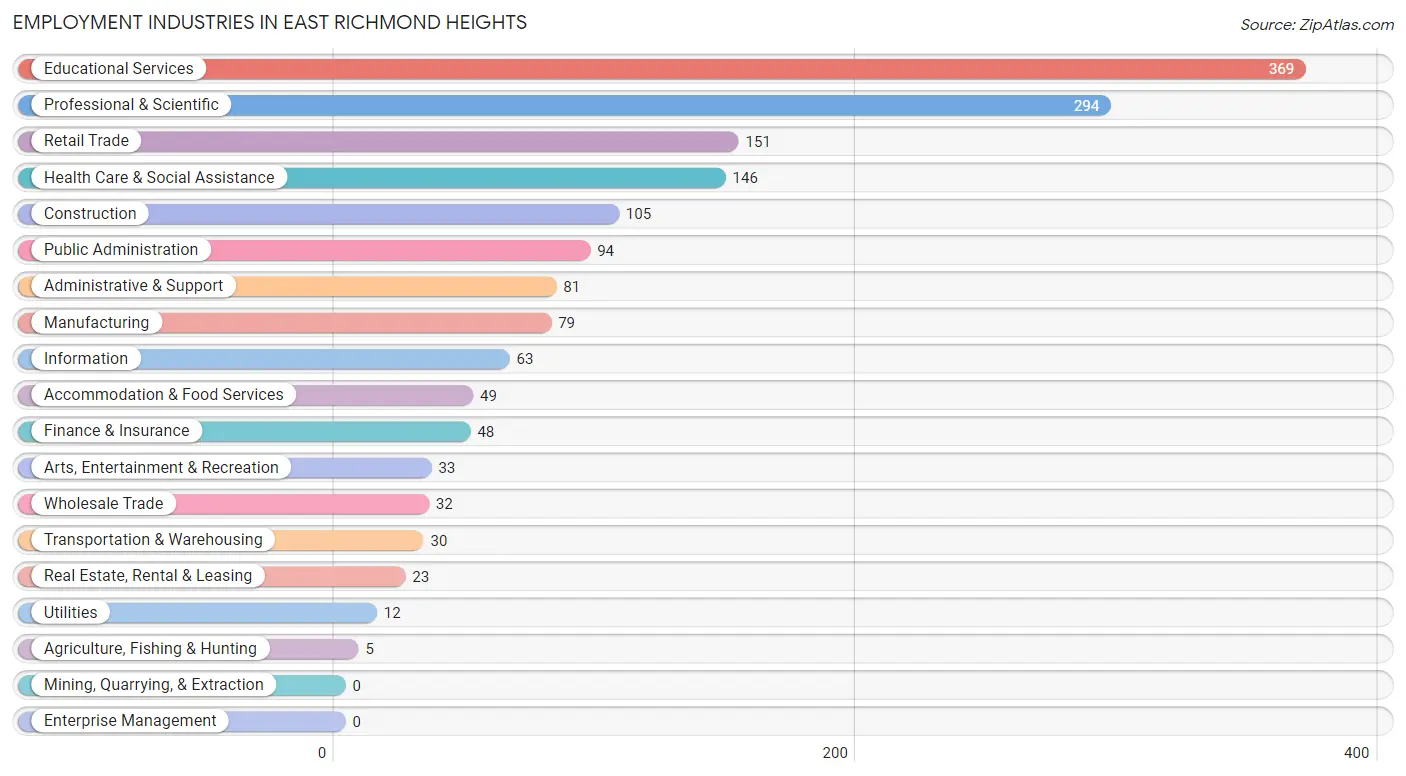
Employment Industries in East Richmond Heights
The major employment industries in East Richmond Heights include Educational Services (369 | 19.9%), Professional & Scientific (294 | 15.9%), Retail Trade (151 | 8.2%), Health Care & Social Assistance (146 | 7.9%), and Construction (105 | 5.7%).
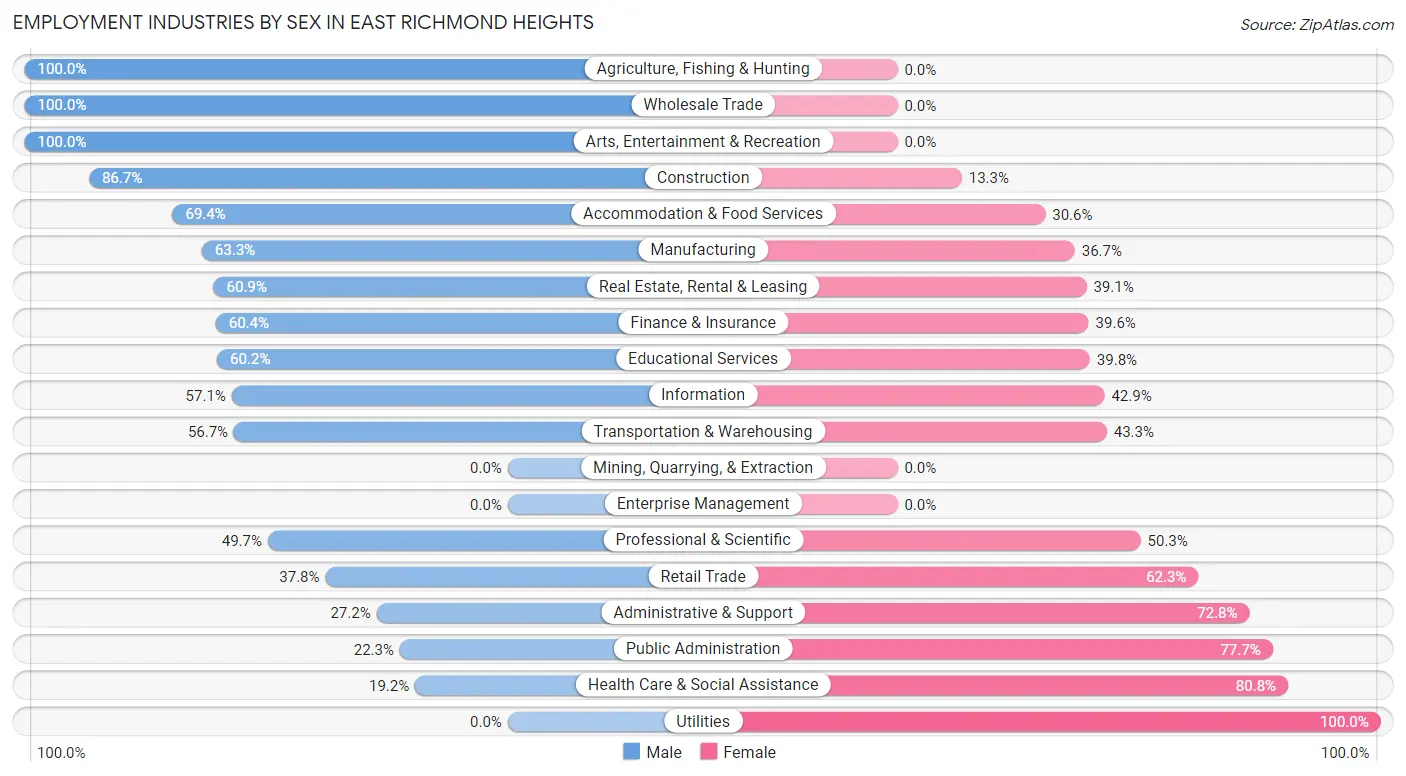
Employment Industries by Sex in East Richmond Heights
The East Richmond Heights industries that see more men than women are Agriculture, Fishing & Hunting (100.0%), Wholesale Trade (100.0%), and Arts, Entertainment & Recreation (100.0%), whereas the industries that tend to have a higher number of women are Utilities (100.0%), Health Care & Social Assistance (80.8%), and Public Administration (77.7%).
| Industry | Male | Female |
| Agriculture, Fishing & Hunting | 5 (100.0%) | 0 (0.0%) |
| Mining, Quarrying, & Extraction | 0 (0.0%) | 0 (0.0%) |
| Construction | 91 (86.7%) | 14 (13.3%) |
| Manufacturing | 50 (63.3%) | 29 (36.7%) |
| Wholesale Trade | 32 (100.0%) | 0 (0.0%) |
| Retail Trade | 57 (37.8%) | 94 (62.3%) |
| Transportation & Warehousing | 17 (56.7%) | 13 (43.3%) |
| Utilities | 0 (0.0%) | 12 (100.0%) |
| Information | 36 (57.1%) | 27 (42.9%) |
| Finance & Insurance | 29 (60.4%) | 19 (39.6%) |
| Real Estate, Rental & Leasing | 14 (60.9%) | 9 (39.1%) |
| Professional & Scientific | 146 (49.7%) | 148 (50.3%) |
| Enterprise Management | 0 (0.0%) | 0 (0.0%) |
| Administrative & Support | 22 (27.2%) | 59 (72.8%) |
| Educational Services | 222 (60.2%) | 147 (39.8%) |
| Health Care & Social Assistance | 28 (19.2%) | 118 (80.8%) |
| Arts, Entertainment & Recreation | 33 (100.0%) | 0 (0.0%) |
| Accommodation & Food Services | 34 (69.4%) | 15 (30.6%) |
| Public Administration | 21 (22.3%) | 73 (77.7%) |
| Total | 920 (49.7%) | 931 (50.3%) |
Education in East Richmond Heights
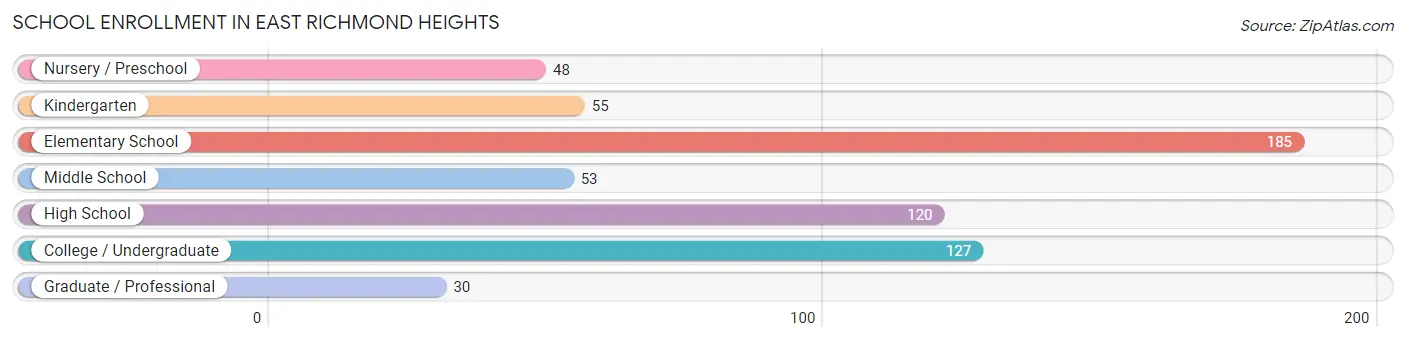
School Enrollment in East Richmond Heights
The most common levels of schooling among the 618 students in East Richmond Heights are elementary school (185 | 29.9%), college / undergraduate (127 | 20.5%), and high school (120 | 19.4%).
| School Level | # Students | % Students |
| Nursery / Preschool | 48 | 7.8% |
| Kindergarten | 55 | 8.9% |
| Elementary School | 185 | 29.9% |
| Middle School | 53 | 8.6% |
| High School | 120 | 19.4% |
| College / Undergraduate | 127 | 20.5% |
| Graduate / Professional | 30 | 4.9% |
| Total | 618 | 100.0% |
School Enrollment by Age by Funding Source in East Richmond Heights
Out of a total of 618 students who are enrolled in schools in East Richmond Heights, 213 (34.5%) attend a private institution, while the remaining 405 (65.5%) are enrolled in public schools. The age group of 3 to 4 year olds has the highest likelihood of being enrolled in private schools, with 48 (88.9% in the age bracket) enrolled. Conversely, the age group of 5 to 9 year old has the lowest likelihood of being enrolled in a private school, with 200 (85.5% in the age bracket) attending a public institution.
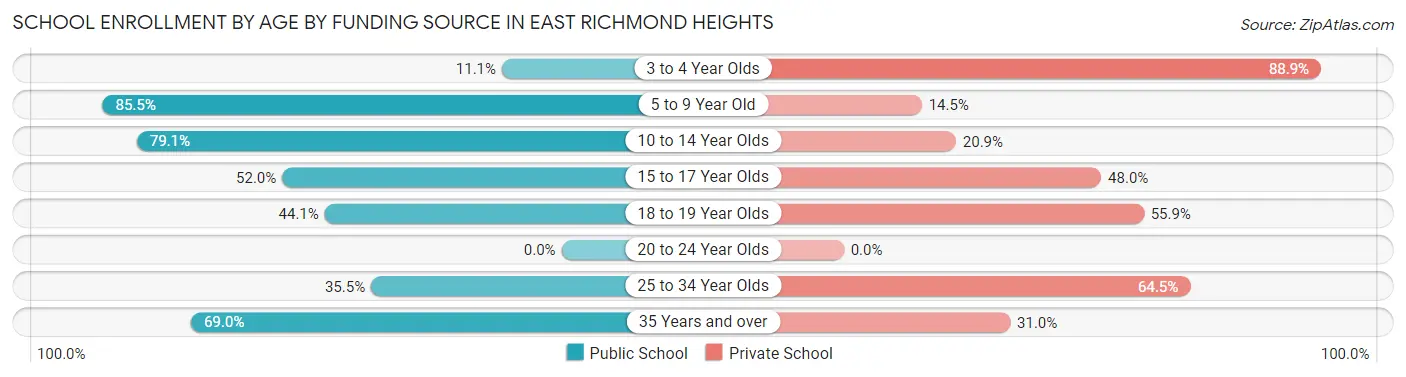
| Age Bracket | Public School | Private School |
| 3 to 4 Year Olds | 6 (11.1%) | 48 (88.9%) |
| 5 to 9 Year Old | 200 (85.5%) | 34 (14.5%) |
| 10 to 14 Year Olds | 53 (79.1%) | 14 (20.9%) |
| 15 to 17 Year Olds | 51 (52.0%) | 47 (48.0%) |
| 18 to 19 Year Olds | 15 (44.1%) | 19 (55.9%) |
| 20 to 24 Year Olds | 0 (0.0%) | 0 (0.0%) |
| 25 to 34 Year Olds | 11 (35.5%) | 20 (64.5%) |
| 35 Years and over | 69 (69.0%) | 31 (31.0%) |
| Total | 405 (65.5%) | 213 (34.5%) |
Educational Attainment by Field of Study in East Richmond Heights
Visual & performing arts (300 | 18.8%), social sciences (238 | 14.9%), psychology (158 | 9.9%), literature & languages (138 | 8.7%), and science & technology (126 | 7.9%) are the most common fields of study among 1,594 individuals in East Richmond Heights who have obtained a bachelor's degree or higher.
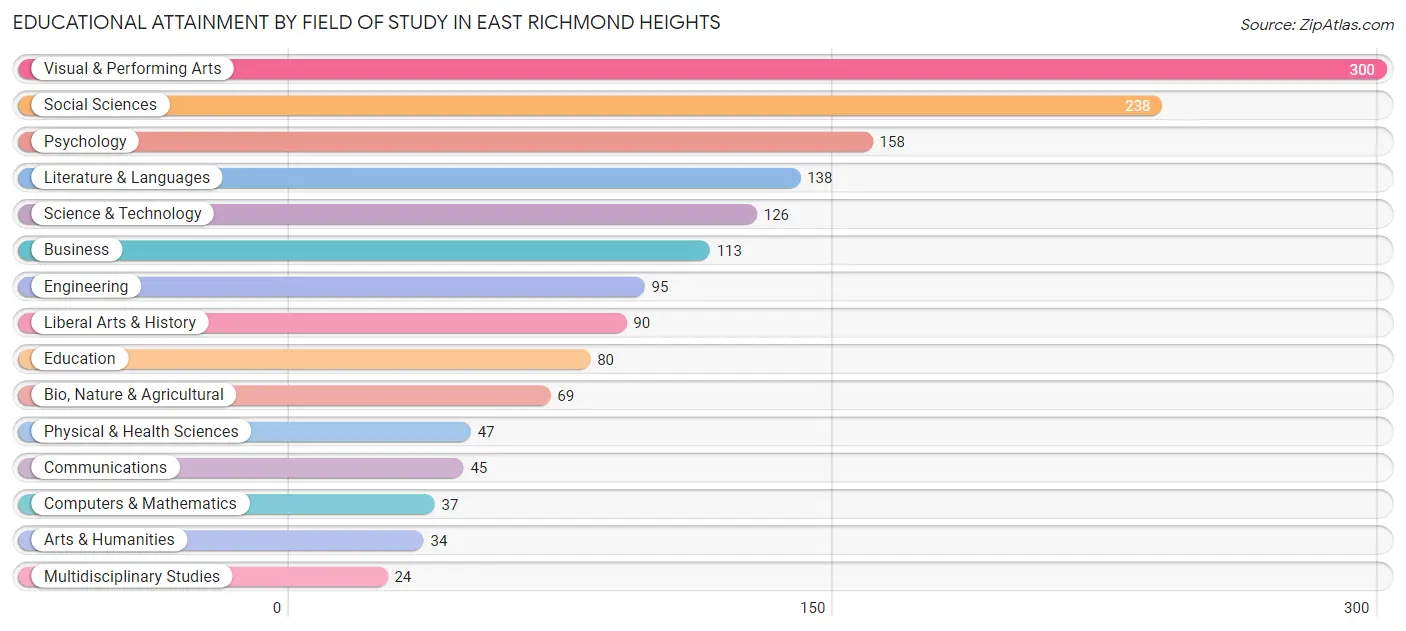
| Field of Study | # Graduates | % Graduates |
| Computers & Mathematics | 37 | 2.3% |
| Bio, Nature & Agricultural | 69 | 4.3% |
| Physical & Health Sciences | 47 | 2.9% |
| Psychology | 158 | 9.9% |
| Social Sciences | 238 | 14.9% |
| Engineering | 95 | 6.0% |
| Multidisciplinary Studies | 24 | 1.5% |
| Science & Technology | 126 | 7.9% |
| Business | 113 | 7.1% |
| Education | 80 | 5.0% |
| Literature & Languages | 138 | 8.7% |
| Liberal Arts & History | 90 | 5.7% |
| Visual & Performing Arts | 300 | 18.8% |
| Communications | 45 | 2.8% |
| Arts & Humanities | 34 | 2.1% |
| Total | 1,594 | 100.0% |
Transportation & Commute in East Richmond Heights
Vehicle Availability by Sex in East Richmond Heights
The most prevalent vehicle ownership categories in East Richmond Heights are males with 2 vehicles (339, accounting for 37.2%) and females with 2 vehicles (321, making up 38.5%).
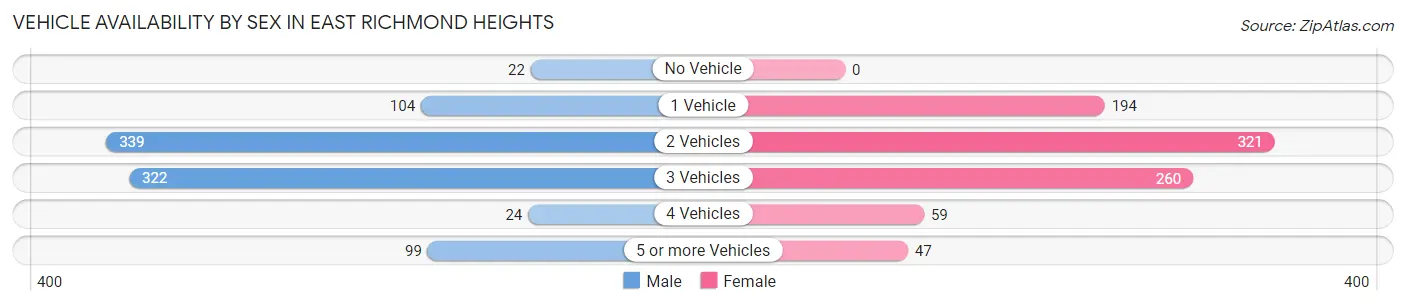
| Vehicles Available | Male | Female |
| No Vehicle | 22 (2.4%) | 0 (0.0%) |
| 1 Vehicle | 104 (11.4%) | 194 (22.0%) |
| 2 Vehicles | 339 (37.2%) | 321 (36.4%) |
| 3 Vehicles | 322 (35.4%) | 260 (29.5%) |
| 4 Vehicles | 24 (2.6%) | 59 (6.7%) |
| 5 or more Vehicles | 99 (10.9%) | 47 (5.3%) |
| Total | 910 (100.0%) | 881 (100.0%) |
Commute Time in East Richmond Heights
The most frequently occuring commute durations in East Richmond Heights are 45 to 59 minutes (324 commuters, 23.2%), 15 to 19 minutes (234 commuters, 16.8%), and 60 to 89 minutes (194 commuters, 13.9%).
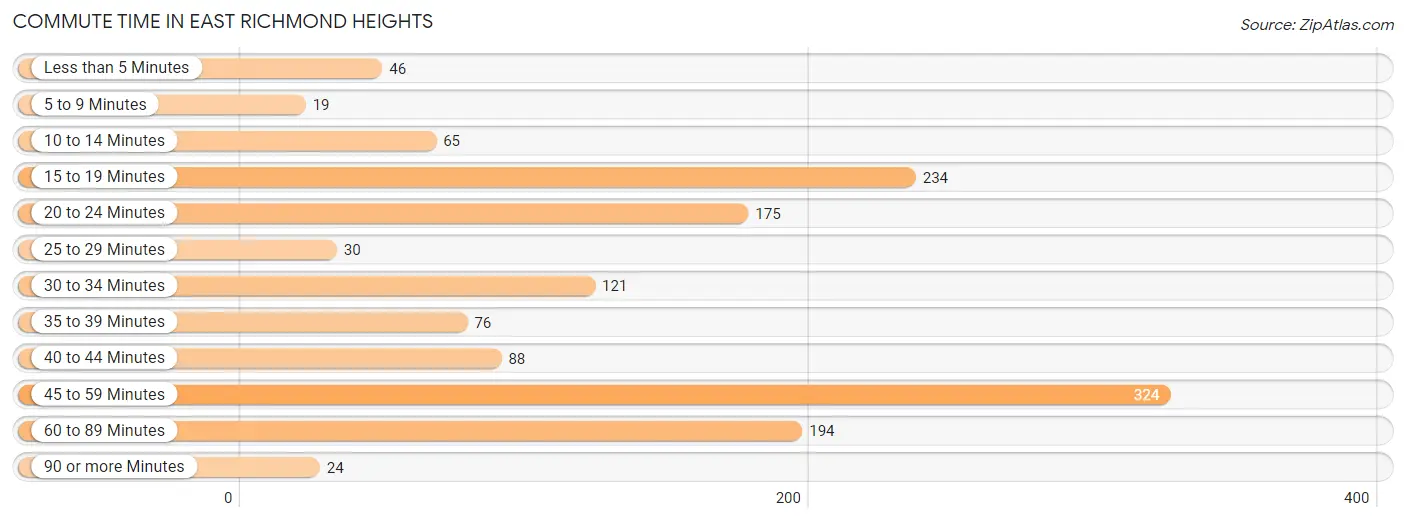
| Commute Time | # Commuters | % Commuters |
| Less than 5 Minutes | 46 | 3.3% |
| 5 to 9 Minutes | 19 | 1.4% |
| 10 to 14 Minutes | 65 | 4.7% |
| 15 to 19 Minutes | 234 | 16.8% |
| 20 to 24 Minutes | 175 | 12.5% |
| 25 to 29 Minutes | 30 | 2.1% |
| 30 to 34 Minutes | 121 | 8.7% |
| 35 to 39 Minutes | 76 | 5.4% |
| 40 to 44 Minutes | 88 | 6.3% |
| 45 to 59 Minutes | 324 | 23.2% |
| 60 to 89 Minutes | 194 | 13.9% |
| 90 or more Minutes | 24 | 1.7% |
Commute Time by Sex in East Richmond Heights
The most common commute times in East Richmond Heights are 45 to 59 minutes (223 commuters, 31.1%) for males and 15 to 19 minutes (171 commuters, 25.2%) for females.
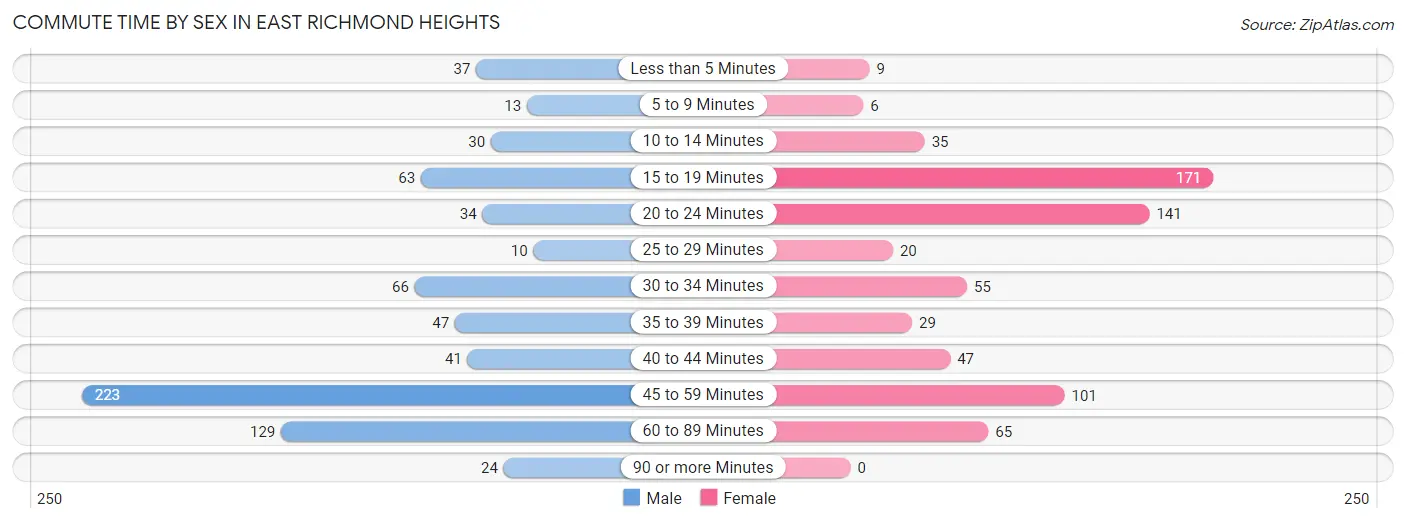
| Commute Time | Male | Female |
| Less than 5 Minutes | 37 (5.2%) | 9 (1.3%) |
| 5 to 9 Minutes | 13 (1.8%) | 6 (0.9%) |
| 10 to 14 Minutes | 30 (4.2%) | 35 (5.1%) |
| 15 to 19 Minutes | 63 (8.8%) | 171 (25.2%) |
| 20 to 24 Minutes | 34 (4.7%) | 141 (20.8%) |
| 25 to 29 Minutes | 10 (1.4%) | 20 (2.9%) |
| 30 to 34 Minutes | 66 (9.2%) | 55 (8.1%) |
| 35 to 39 Minutes | 47 (6.6%) | 29 (4.3%) |
| 40 to 44 Minutes | 41 (5.7%) | 47 (6.9%) |
| 45 to 59 Minutes | 223 (31.1%) | 101 (14.9%) |
| 60 to 89 Minutes | 129 (18.0%) | 65 (9.6%) |
| 90 or more Minutes | 24 (3.4%) | 0 (0.0%) |
Time of Departure to Work by Sex in East Richmond Heights
The most frequent times of departure to work in East Richmond Heights are 6:30 AM to 6:59 AM (108, 15.1%) for males and 7:30 AM to 7:59 AM (145, 21.3%) for females.
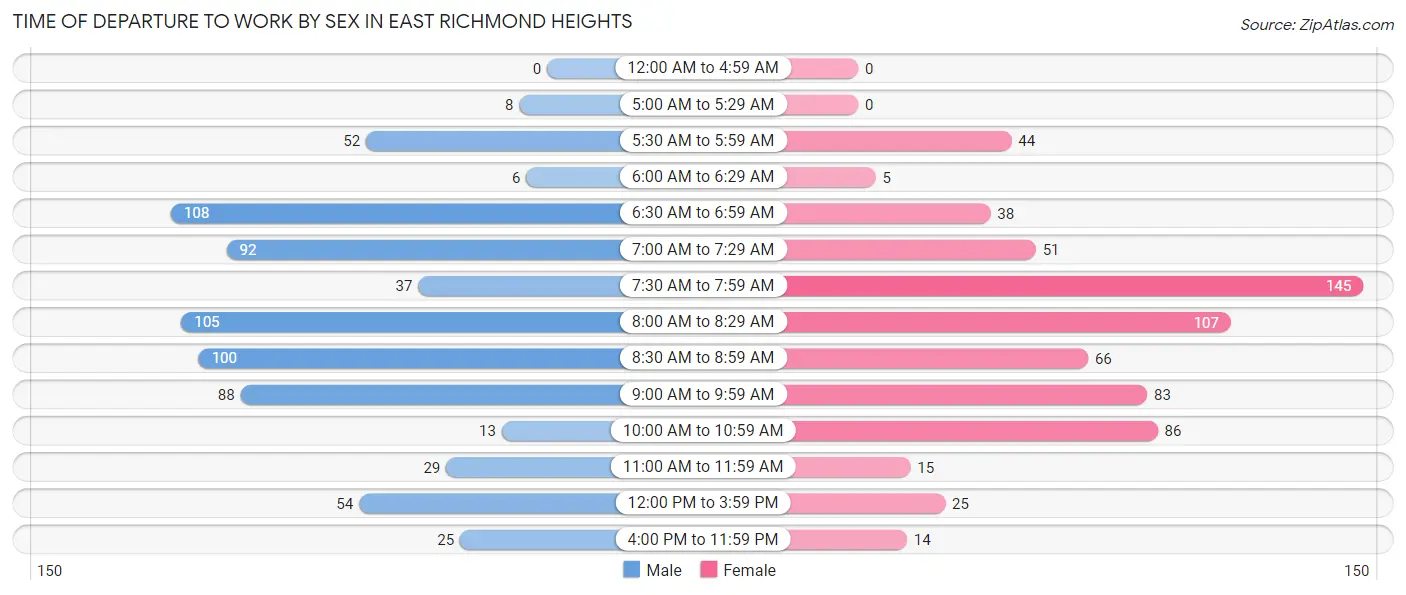
| Time of Departure | Male | Female |
| 12:00 AM to 4:59 AM | 0 (0.0%) | 0 (0.0%) |
| 5:00 AM to 5:29 AM | 8 (1.1%) | 0 (0.0%) |
| 5:30 AM to 5:59 AM | 52 (7.2%) | 44 (6.5%) |
| 6:00 AM to 6:29 AM | 6 (0.8%) | 5 (0.7%) |
| 6:30 AM to 6:59 AM | 108 (15.1%) | 38 (5.6%) |
| 7:00 AM to 7:29 AM | 92 (12.8%) | 51 (7.5%) |
| 7:30 AM to 7:59 AM | 37 (5.2%) | 145 (21.3%) |
| 8:00 AM to 8:29 AM | 105 (14.6%) | 107 (15.8%) |
| 8:30 AM to 8:59 AM | 100 (14.0%) | 66 (9.7%) |
| 9:00 AM to 9:59 AM | 88 (12.3%) | 83 (12.2%) |
| 10:00 AM to 10:59 AM | 13 (1.8%) | 86 (12.7%) |
| 11:00 AM to 11:59 AM | 29 (4.0%) | 15 (2.2%) |
| 12:00 PM to 3:59 PM | 54 (7.5%) | 25 (3.7%) |
| 4:00 PM to 11:59 PM | 25 (3.5%) | 14 (2.1%) |
| Total | 717 (100.0%) | 679 (100.0%) |
Housing Occupancy in East Richmond Heights
Occupancy by Ownership in East Richmond Heights
Of the total 1,373 dwellings in East Richmond Heights, owner-occupied units account for 1,111 (80.9%), while renter-occupied units make up 262 (19.1%).
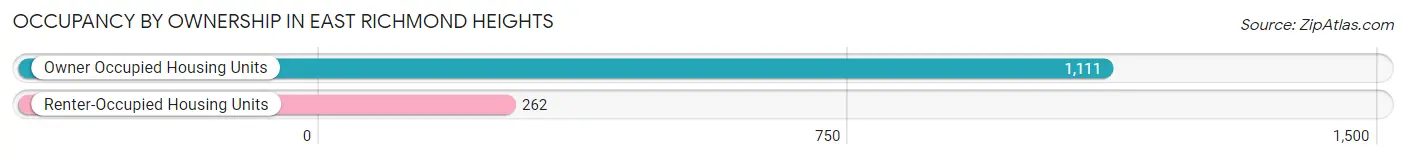
| Occupancy | # Housing Units | % Housing Units |
| Owner Occupied Housing Units | 1,111 | 80.9% |
| Renter-Occupied Housing Units | 262 | 19.1% |
| Total Occupied Housing Units | 1,373 | 100.0% |
Occupancy by Household Size in East Richmond Heights
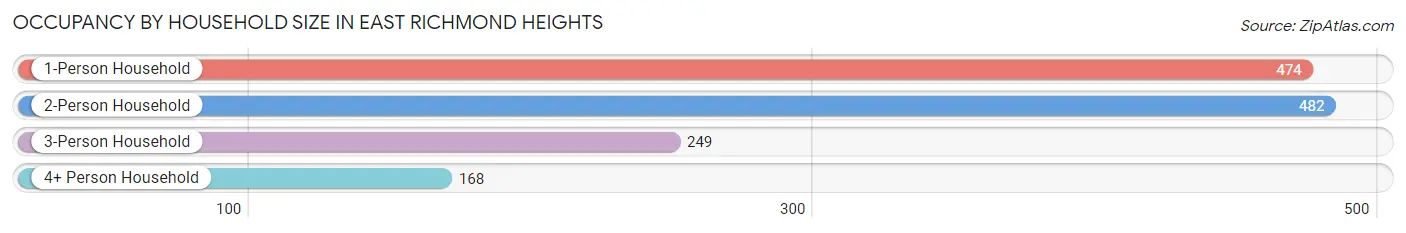
| Household Size | # Housing Units | % Housing Units |
| 1-Person Household | 474 | 34.5% |
| 2-Person Household | 482 | 35.1% |
| 3-Person Household | 249 | 18.1% |
| 4+ Person Household | 168 | 12.2% |
| Total Housing Units | 1,373 | 100.0% |
Occupancy by Ownership by Household Size in East Richmond Heights
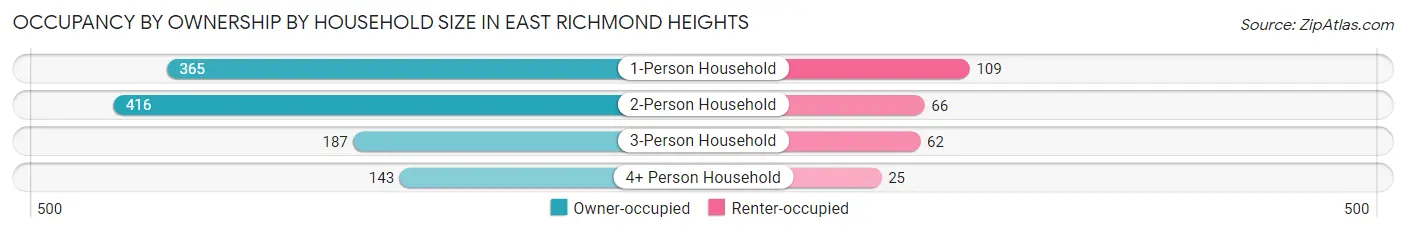
| Household Size | Owner-occupied | Renter-occupied |
| 1-Person Household | 365 (77.0%) | 109 (23.0%) |
| 2-Person Household | 416 (86.3%) | 66 (13.7%) |
| 3-Person Household | 187 (75.1%) | 62 (24.9%) |
| 4+ Person Household | 143 (85.1%) | 25 (14.9%) |
| Total Housing Units | 1,111 (80.9%) | 262 (19.1%) |
Occupancy by Educational Attainment in East Richmond Heights
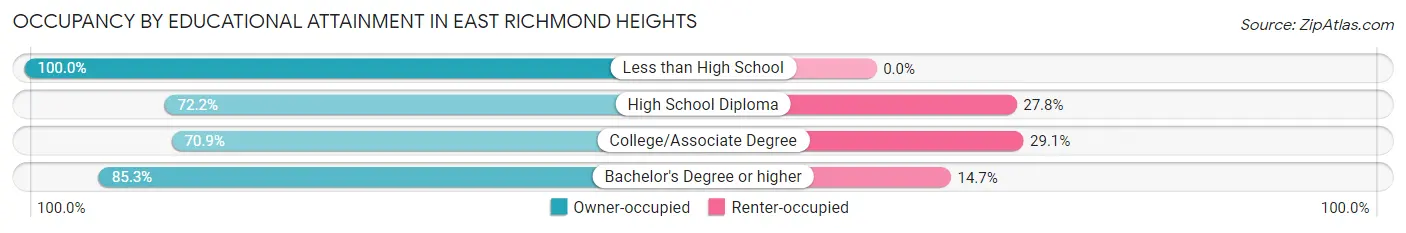
| Household Size | Owner-occupied | Renter-occupied |
| Less than High School | 63 (100.0%) | 0 (0.0%) |
| High School Diploma | 78 (72.2%) | 30 (27.8%) |
| College/Associate Degree | 270 (70.9%) | 111 (29.1%) |
| Bachelor's Degree or higher | 700 (85.3%) | 121 (14.7%) |
Occupancy by Age of Householder in East Richmond Heights
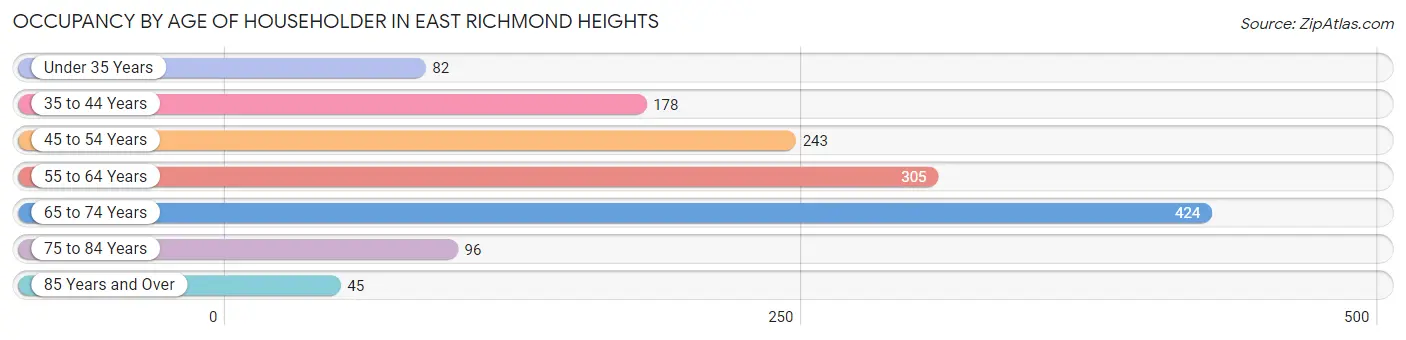
| Age Bracket | # Households | % Households |
| Under 35 Years | 82 | 6.0% |
| 35 to 44 Years | 178 | 13.0% |
| 45 to 54 Years | 243 | 17.7% |
| 55 to 64 Years | 305 | 22.2% |
| 65 to 74 Years | 424 | 30.9% |
| 75 to 84 Years | 96 | 7.0% |
| 85 Years and Over | 45 | 3.3% |
| Total | 1,373 | 100.0% |
Housing Finances in East Richmond Heights
Median Income by Occupancy in East Richmond Heights
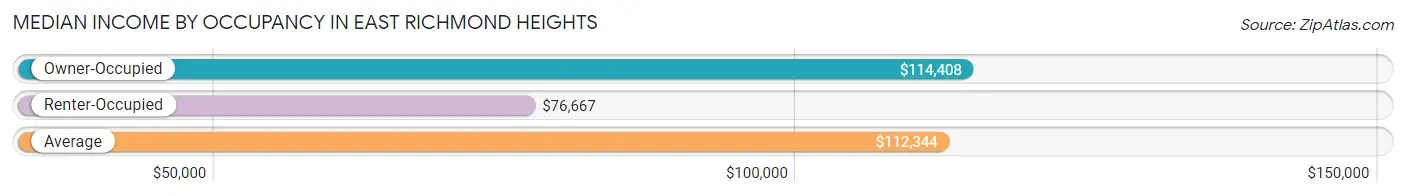
| Occupancy Type | # Households | Median Income |
| Owner-Occupied | 1,111 (80.9%) | $114,408 |
| Renter-Occupied | 262 (19.1%) | $76,667 |
| Average | 1,373 (100.0%) | $112,344 |
Occupancy by Householder Income Bracket in East Richmond Heights
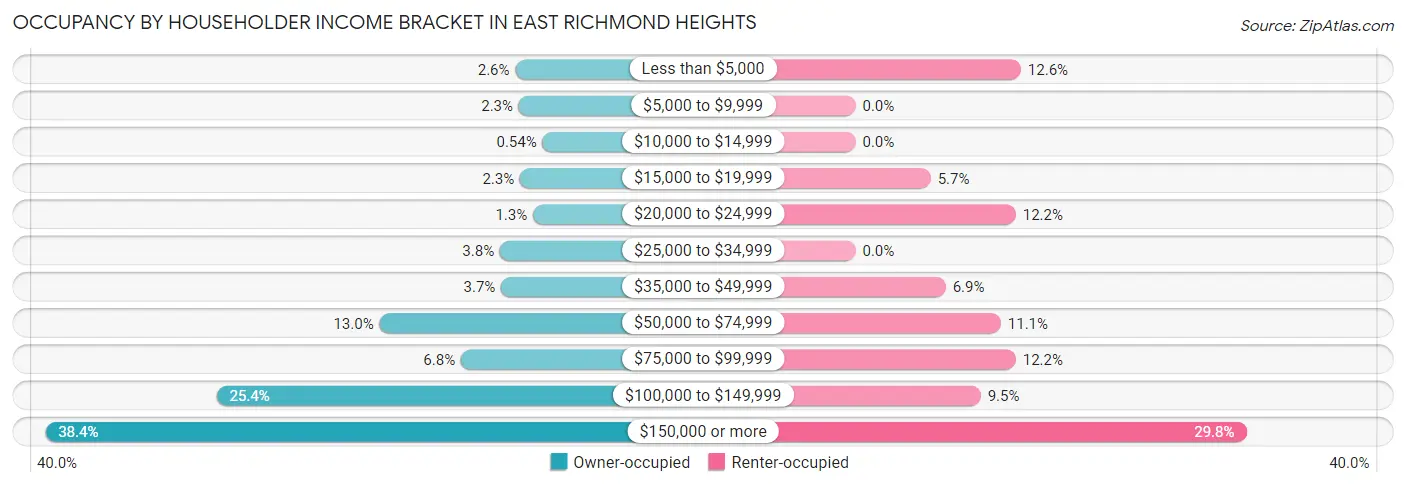
| Income Bracket | Owner-occupied | Renter-occupied |
| Less than $5,000 | 29 (2.6%) | 33 (12.6%) |
| $5,000 to $9,999 | 26 (2.3%) | 0 (0.0%) |
| $10,000 to $14,999 | 6 (0.5%) | 0 (0.0%) |
| $15,000 to $19,999 | 25 (2.2%) | 15 (5.7%) |
| $20,000 to $24,999 | 14 (1.3%) | 32 (12.2%) |
| $25,000 to $34,999 | 42 (3.8%) | 0 (0.0%) |
| $35,000 to $49,999 | 41 (3.7%) | 18 (6.9%) |
| $50,000 to $74,999 | 144 (13.0%) | 29 (11.1%) |
| $75,000 to $99,999 | 75 (6.8%) | 32 (12.2%) |
| $100,000 to $149,999 | 282 (25.4%) | 25 (9.5%) |
| $150,000 or more | 427 (38.4%) | 78 (29.8%) |
| Total | 1,111 (100.0%) | 262 (100.0%) |
Monthly Housing Cost Tiers in East Richmond Heights
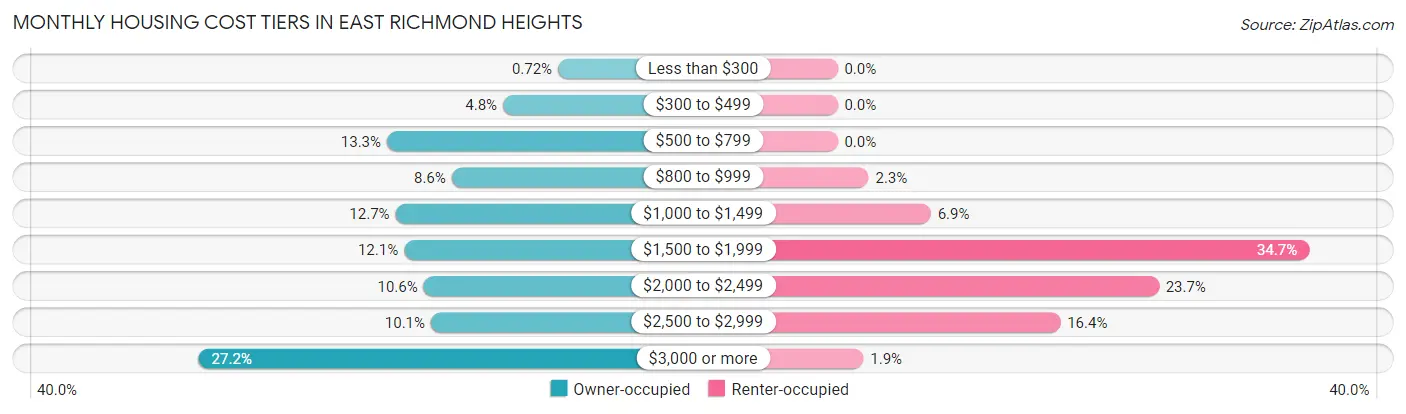
| Monthly Cost | Owner-occupied | Renter-occupied |
| Less than $300 | 8 (0.7%) | 0 (0.0%) |
| $300 to $499 | 53 (4.8%) | 0 (0.0%) |
| $500 to $799 | 148 (13.3%) | 0 (0.0%) |
| $800 to $999 | 95 (8.6%) | 6 (2.3%) |
| $1,000 to $1,499 | 141 (12.7%) | 18 (6.9%) |
| $1,500 to $1,999 | 134 (12.1%) | 91 (34.7%) |
| $2,000 to $2,499 | 118 (10.6%) | 62 (23.7%) |
| $2,500 to $2,999 | 112 (10.1%) | 43 (16.4%) |
| $3,000 or more | 302 (27.2%) | 5 (1.9%) |
| Total | 1,111 (100.0%) | 262 (100.0%) |
Physical Housing Characteristics in East Richmond Heights
Housing Structures in East Richmond Heights
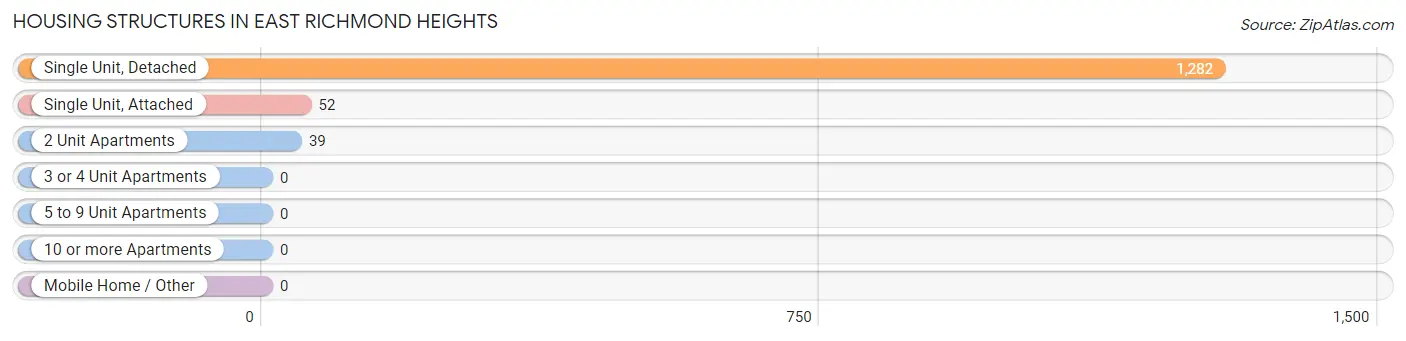
| Structure Type | # Housing Units | % Housing Units |
| Single Unit, Detached | 1,282 | 93.4% |
| Single Unit, Attached | 52 | 3.8% |
| 2 Unit Apartments | 39 | 2.8% |
| 3 or 4 Unit Apartments | 0 | 0.0% |
| 5 to 9 Unit Apartments | 0 | 0.0% |
| 10 or more Apartments | 0 | 0.0% |
| Mobile Home / Other | 0 | 0.0% |
| Total | 1,373 | 100.0% |
Housing Structures by Occupancy in East Richmond Heights
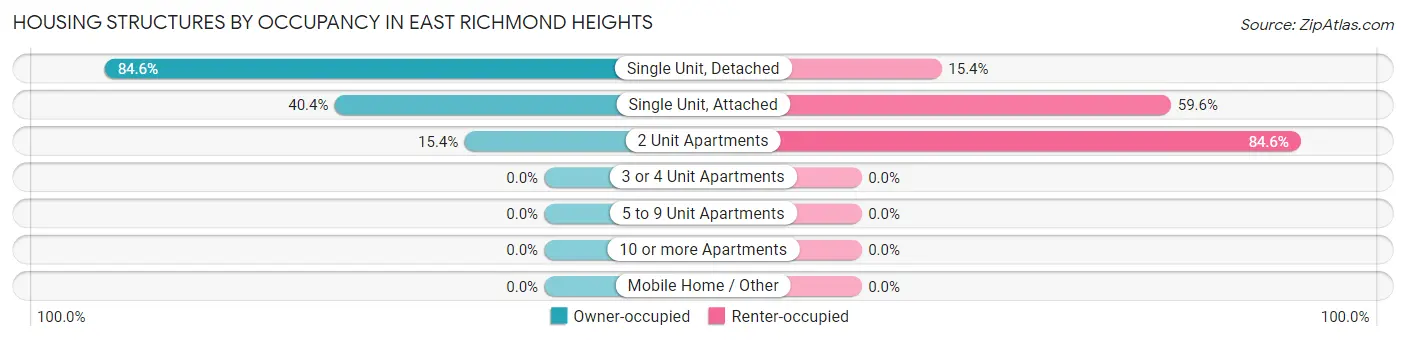
| Structure Type | Owner-occupied | Renter-occupied |
| Single Unit, Detached | 1,084 (84.6%) | 198 (15.4%) |
| Single Unit, Attached | 21 (40.4%) | 31 (59.6%) |
| 2 Unit Apartments | 6 (15.4%) | 33 (84.6%) |
| 3 or 4 Unit Apartments | 0 (0.0%) | 0 (0.0%) |
| 5 to 9 Unit Apartments | 0 (0.0%) | 0 (0.0%) |
| 10 or more Apartments | 0 (0.0%) | 0 (0.0%) |
| Mobile Home / Other | 0 (0.0%) | 0 (0.0%) |
| Total | 1,111 (80.9%) | 262 (19.1%) |
Housing Structures by Number of Rooms in East Richmond Heights
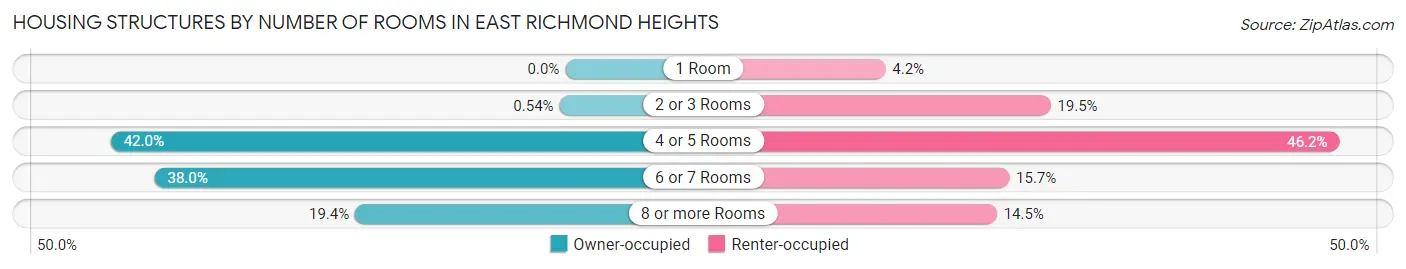
| Number of Rooms | Owner-occupied | Renter-occupied |
| 1 Room | 0 (0.0%) | 11 (4.2%) |
| 2 or 3 Rooms | 6 (0.5%) | 51 (19.5%) |
| 4 or 5 Rooms | 467 (42.0%) | 121 (46.2%) |
| 6 or 7 Rooms | 422 (38.0%) | 41 (15.7%) |
| 8 or more Rooms | 216 (19.4%) | 38 (14.5%) |
| Total | 1,111 (100.0%) | 262 (100.0%) |
Housing Structure by Heating Type in East Richmond Heights
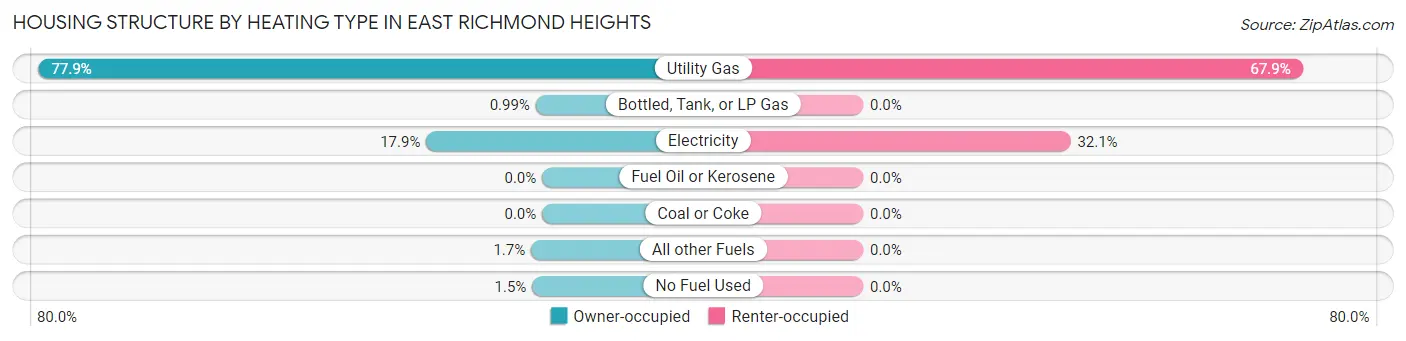
| Heating Type | Owner-occupied | Renter-occupied |
| Utility Gas | 865 (77.9%) | 178 (67.9%) |
| Bottled, Tank, or LP Gas | 11 (1.0%) | 0 (0.0%) |
| Electricity | 199 (17.9%) | 84 (32.1%) |
| Fuel Oil or Kerosene | 0 (0.0%) | 0 (0.0%) |
| Coal or Coke | 0 (0.0%) | 0 (0.0%) |
| All other Fuels | 19 (1.7%) | 0 (0.0%) |
| No Fuel Used | 17 (1.5%) | 0 (0.0%) |
| Total | 1,111 (100.0%) | 262 (100.0%) |
Household Vehicle Usage in East Richmond Heights
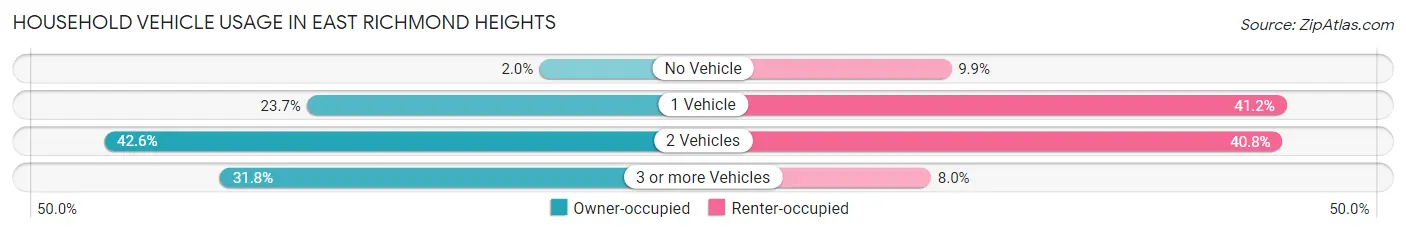
| Vehicles per Household | Owner-occupied | Renter-occupied |
| No Vehicle | 22 (2.0%) | 26 (9.9%) |
| 1 Vehicle | 263 (23.7%) | 108 (41.2%) |
| 2 Vehicles | 473 (42.6%) | 107 (40.8%) |
| 3 or more Vehicles | 353 (31.8%) | 21 (8.0%) |
| Total | 1,111 (100.0%) | 262 (100.0%) |
Real Estate & Mortgages in East Richmond Heights
Real Estate and Mortgage Overview in East Richmond Heights
| Characteristic | Without Mortgage | With Mortgage |
| Housing Units | 399 | 712 |
| Median Property Value | $810,400 | $880,200 |
| Median Household Income | $110,781 | $332 |
| Monthly Housing Costs | $771 | $302 |
| Real Estate Taxes | $4,680 | $10 |
Property Value by Mortgage Status in East Richmond Heights
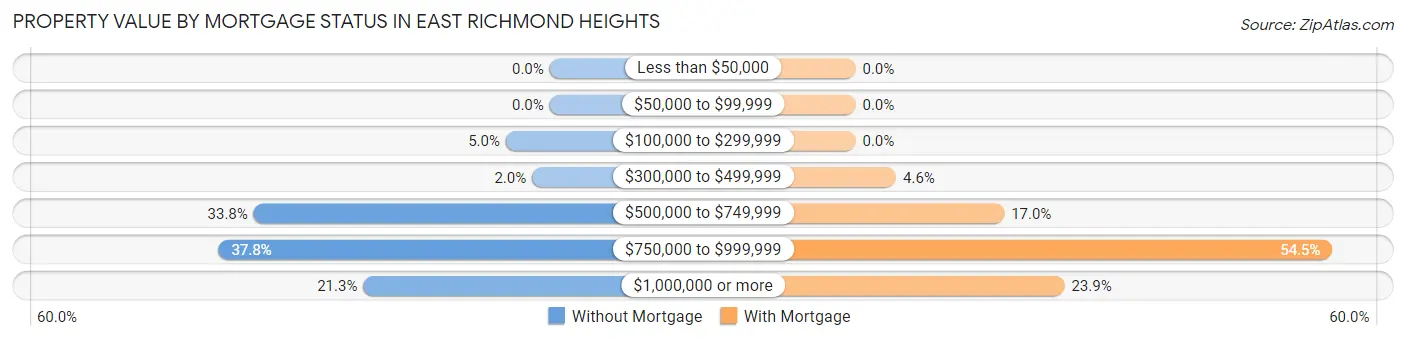
| Property Value | Without Mortgage | With Mortgage |
| Less than $50,000 | 0 (0.0%) | 0 (0.0%) |
| $50,000 to $99,999 | 0 (0.0%) | 0 (0.0%) |
| $100,000 to $299,999 | 20 (5.0%) | 0 (0.0%) |
| $300,000 to $499,999 | 8 (2.0%) | 33 (4.6%) |
| $500,000 to $749,999 | 135 (33.8%) | 121 (17.0%) |
| $750,000 to $999,999 | 151 (37.8%) | 388 (54.5%) |
| $1,000,000 or more | 85 (21.3%) | 170 (23.9%) |
| Total | 399 (100.0%) | 712 (100.0%) |
Household Income by Mortgage Status in East Richmond Heights
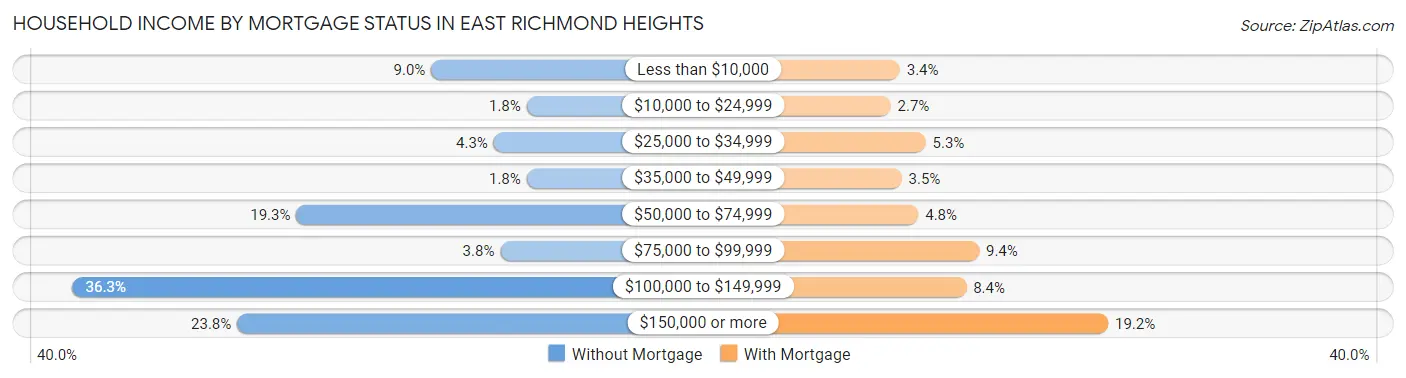
| Household Income | Without Mortgage | With Mortgage |
| Less than $10,000 | 36 (9.0%) | 24 (3.4%) |
| $10,000 to $24,999 | 7 (1.8%) | 19 (2.7%) |
| $25,000 to $34,999 | 17 (4.3%) | 38 (5.3%) |
| $35,000 to $49,999 | 7 (1.8%) | 25 (3.5%) |
| $50,000 to $74,999 | 77 (19.3%) | 34 (4.8%) |
| $75,000 to $99,999 | 15 (3.8%) | 67 (9.4%) |
| $100,000 to $149,999 | 145 (36.3%) | 60 (8.4%) |
| $150,000 or more | 95 (23.8%) | 137 (19.2%) |
| Total | 399 (100.0%) | 712 (100.0%) |
Property Value to Household Income Ratio in East Richmond Heights
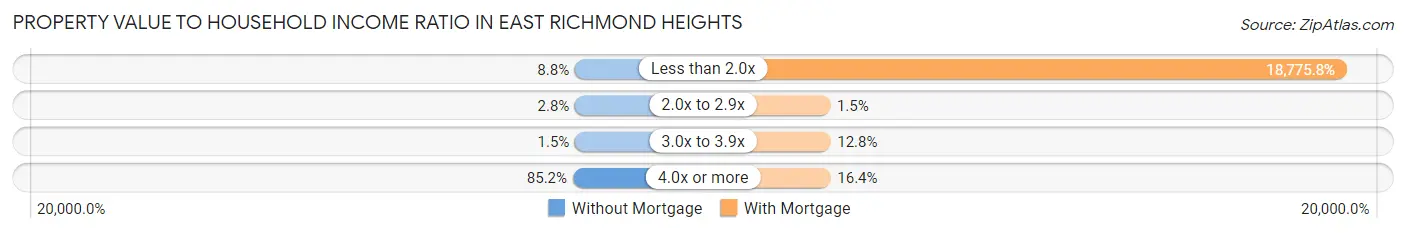
| Value-to-Income Ratio | Without Mortgage | With Mortgage |
| Less than 2.0x | 35 (8.8%) | 133,684 (18,775.8%) |
| 2.0x to 2.9x | 11 (2.8%) | 11 (1.5%) |
| 3.0x to 3.9x | 6 (1.5%) | 91 (12.8%) |
| 4.0x or more | 340 (85.2%) | 117 (16.4%) |
| Total | 399 (100.0%) | 712 (100.0%) |
Real Estate Taxes by Mortgage Status in East Richmond Heights
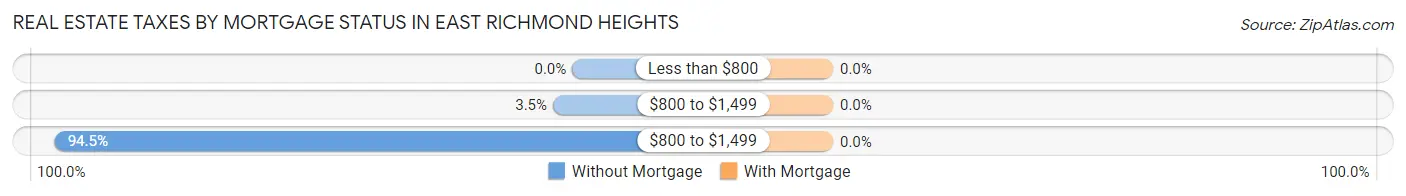
| Property Taxes | Without Mortgage | With Mortgage |
| Less than $800 | 0 (0.0%) | 0 (0.0%) |
| $800 to $1,499 | 14 (3.5%) | 0 (0.0%) |
| $800 to $1,499 | 377 (94.5%) | 0 (0.0%) |
| Total | 399 (100.0%) | 712 (100.0%) |
Health & Disability in East Richmond Heights
Health Insurance Coverage by Age in East Richmond Heights
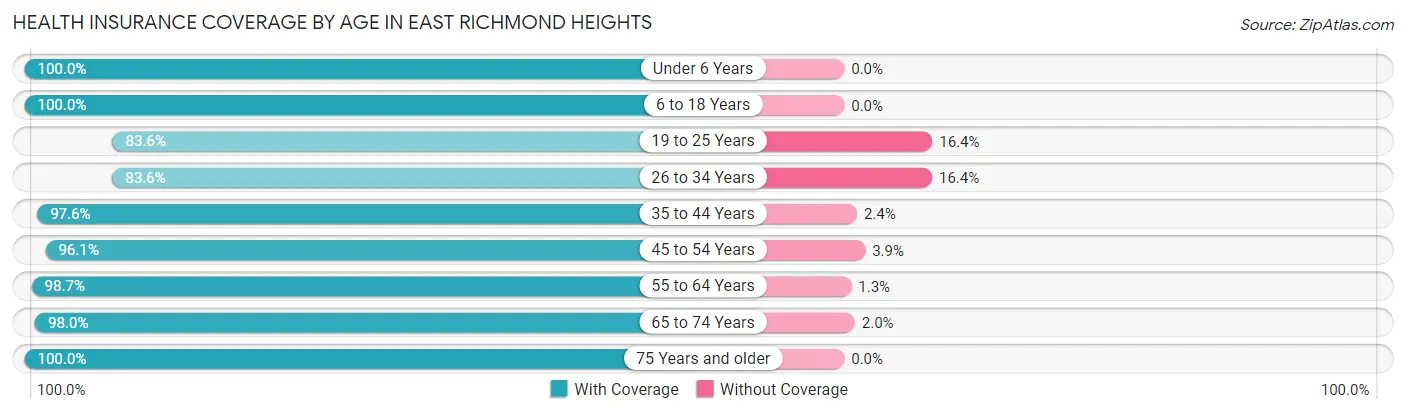
| Age Bracket | With Coverage | Without Coverage |
| Under 6 Years | 199 (100.0%) | 0 (0.0%) |
| 6 to 18 Years | 391 (100.0%) | 0 (0.0%) |
| 19 to 25 Years | 56 (83.6%) | 11 (16.4%) |
| 26 to 34 Years | 327 (83.6%) | 64 (16.4%) |
| 35 to 44 Years | 456 (97.6%) | 11 (2.4%) |
| 45 to 54 Years | 419 (96.1%) | 17 (3.9%) |
| 55 to 64 Years | 525 (98.7%) | 7 (1.3%) |
| 65 to 74 Years | 547 (98.0%) | 11 (2.0%) |
| 75 Years and older | 239 (100.0%) | 0 (0.0%) |
| Total | 3,159 (96.3%) | 121 (3.7%) |
Health Insurance Coverage by Citizenship Status in East Richmond Heights
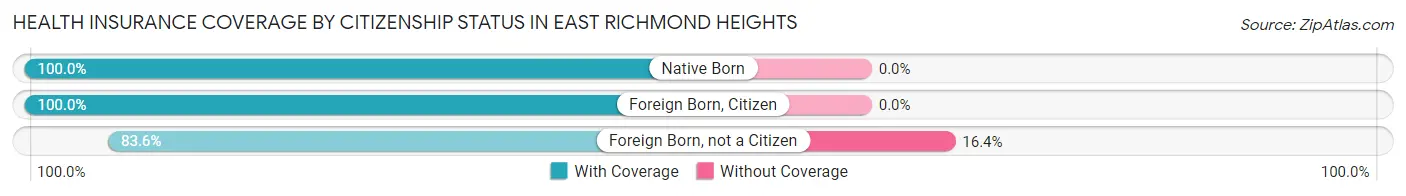
| Citizenship Status | With Coverage | Without Coverage |
| Native Born | 199 (100.0%) | 0 (0.0%) |
| Foreign Born, Citizen | 391 (100.0%) | 0 (0.0%) |
| Foreign Born, not a Citizen | 56 (83.6%) | 11 (16.4%) |
Health Insurance Coverage by Household Income in East Richmond Heights
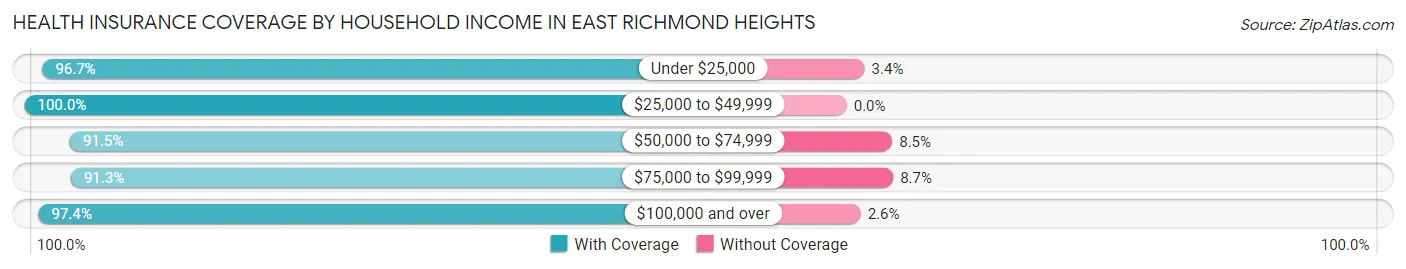
| Household Income | With Coverage | Without Coverage |
| Under $25,000 | 202 (96.7%) | 7 (3.4%) |
| $25,000 to $49,999 | 124 (100.0%) | 0 (0.0%) |
| $50,000 to $74,999 | 333 (91.5%) | 31 (8.5%) |
| $75,000 to $99,999 | 231 (91.3%) | 22 (8.7%) |
| $100,000 and over | 2,267 (97.4%) | 61 (2.6%) |
Public vs Private Health Insurance Coverage by Age in East Richmond Heights
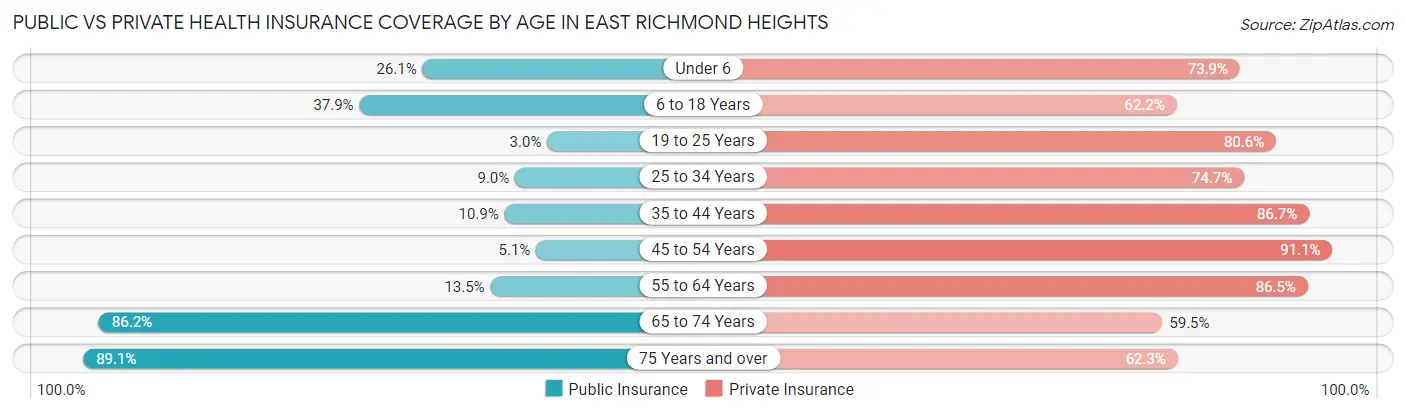
| Age Bracket | Public Insurance | Private Insurance |
| Under 6 | 52 (26.1%) | 147 (73.9%) |
| 6 to 18 Years | 148 (37.9%) | 243 (62.2%) |
| 19 to 25 Years | 2 (3.0%) | 54 (80.6%) |
| 25 to 34 Years | 35 (8.9%) | 292 (74.7%) |
| 35 to 44 Years | 51 (10.9%) | 405 (86.7%) |
| 45 to 54 Years | 22 (5.1%) | 397 (91.1%) |
| 55 to 64 Years | 72 (13.5%) | 460 (86.5%) |
| 65 to 74 Years | 481 (86.2%) | 332 (59.5%) |
| 75 Years and over | 213 (89.1%) | 149 (62.3%) |
| Total | 1,076 (32.8%) | 2,479 (75.6%) |
Disability Status by Sex by Age in East Richmond Heights
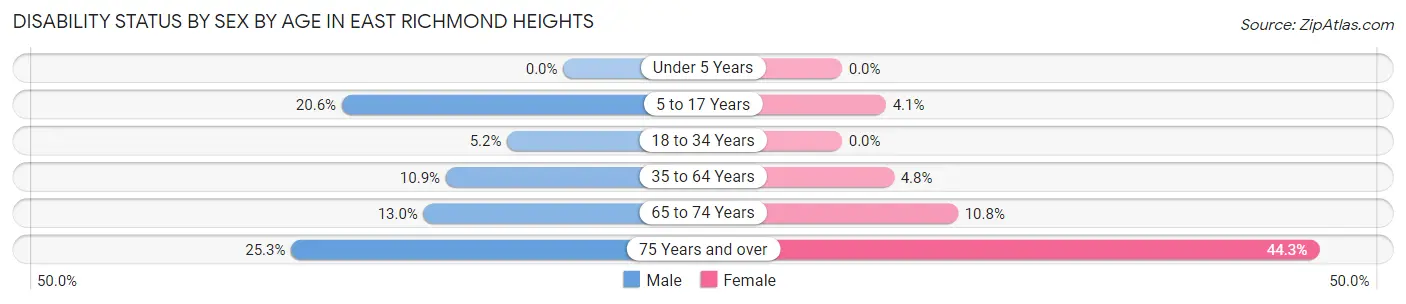
| Age Bracket | Male | Female |
| Under 5 Years | 0 (0.0%) | 0 (0.0%) |
| 5 to 17 Years | 52 (20.5%) | 6 (4.1%) |
| 18 to 34 Years | 14 (5.2%) | 0 (0.0%) |
| 35 to 64 Years | 75 (10.9%) | 36 (4.8%) |
| 65 to 74 Years | 35 (13.0%) | 31 (10.8%) |
| 75 Years and over | 25 (25.3%) | 62 (44.3%) |
Disability Class by Sex by Age in East Richmond Heights
Disability Class: Hearing Difficulty
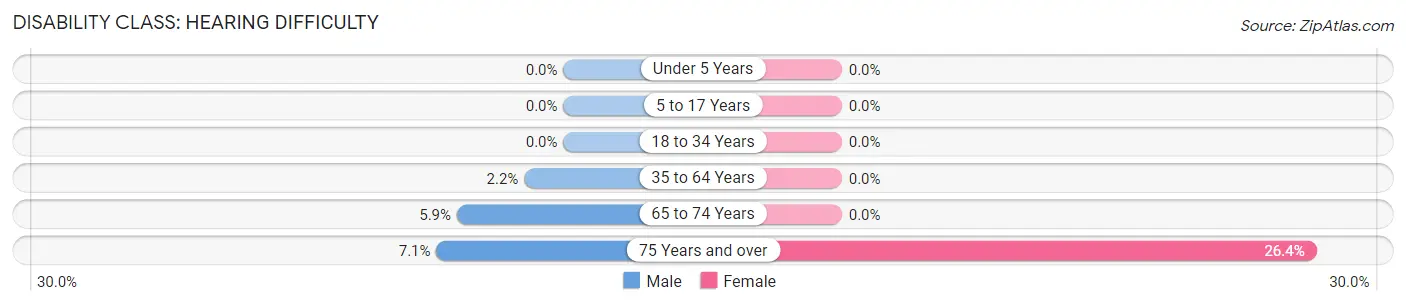
| Age Bracket | Male | Female |
| Under 5 Years | 0 (0.0%) | 0 (0.0%) |
| 5 to 17 Years | 0 (0.0%) | 0 (0.0%) |
| 18 to 34 Years | 0 (0.0%) | 0 (0.0%) |
| 35 to 64 Years | 15 (2.2%) | 0 (0.0%) |
| 65 to 74 Years | 16 (5.9%) | 0 (0.0%) |
| 75 Years and over | 7 (7.1%) | 37 (26.4%) |
Disability Class: Vision Difficulty
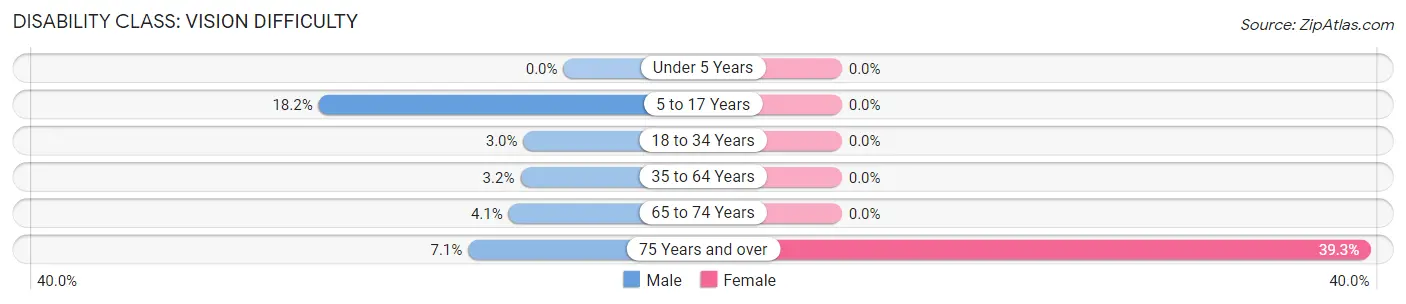
| Age Bracket | Male | Female |
| Under 5 Years | 0 (0.0%) | 0 (0.0%) |
| 5 to 17 Years | 46 (18.2%) | 0 (0.0%) |
| 18 to 34 Years | 8 (3.0%) | 0 (0.0%) |
| 35 to 64 Years | 22 (3.2%) | 0 (0.0%) |
| 65 to 74 Years | 11 (4.1%) | 0 (0.0%) |
| 75 Years and over | 7 (7.1%) | 55 (39.3%) |
Disability Class: Cognitive Difficulty
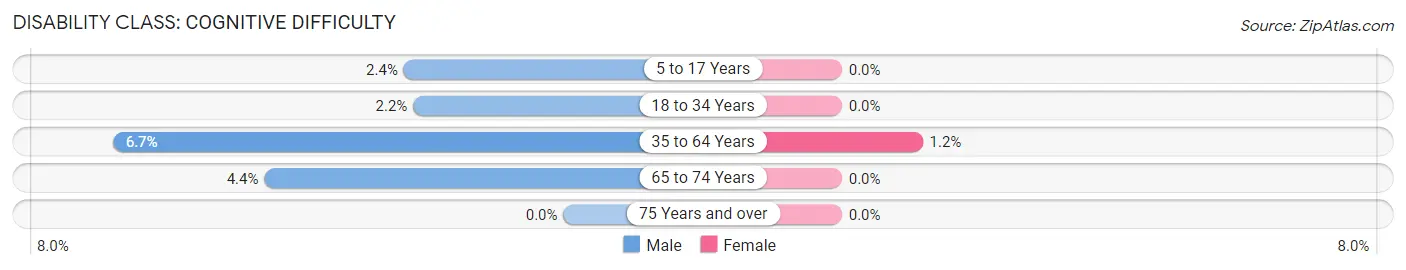
| Age Bracket | Male | Female |
| 5 to 17 Years | 6 (2.4%) | 0 (0.0%) |
| 18 to 34 Years | 6 (2.2%) | 0 (0.0%) |
| 35 to 64 Years | 46 (6.7%) | 9 (1.2%) |
| 65 to 74 Years | 12 (4.4%) | 0 (0.0%) |
| 75 Years and over | 0 (0.0%) | 0 (0.0%) |
Disability Class: Ambulatory Difficulty
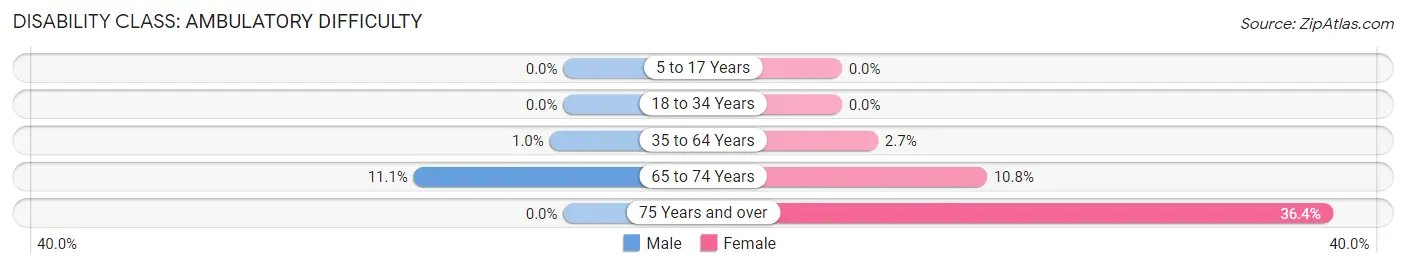
| Age Bracket | Male | Female |
| 5 to 17 Years | 0 (0.0%) | 0 (0.0%) |
| 18 to 34 Years | 0 (0.0%) | 0 (0.0%) |
| 35 to 64 Years | 7 (1.0%) | 20 (2.7%) |
| 65 to 74 Years | 30 (11.1%) | 31 (10.8%) |
| 75 Years and over | 0 (0.0%) | 51 (36.4%) |
Disability Class: Self-Care Difficulty
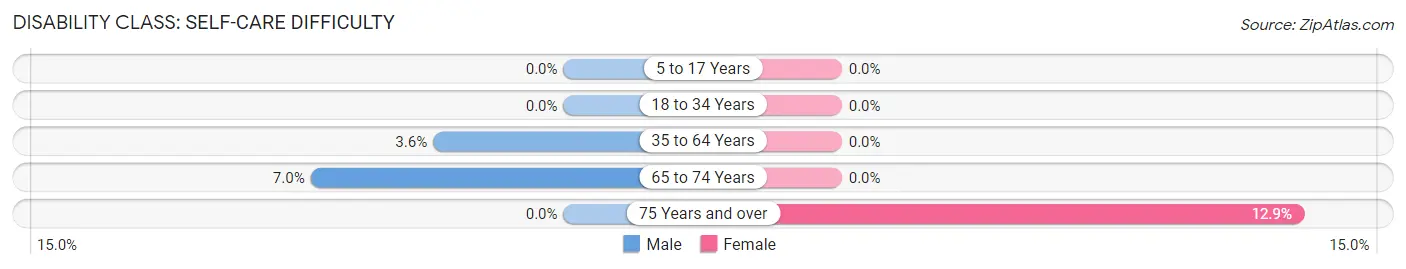
| Age Bracket | Male | Female |
| 5 to 17 Years | 0 (0.0%) | 0 (0.0%) |
| 18 to 34 Years | 0 (0.0%) | 0 (0.0%) |
| 35 to 64 Years | 25 (3.6%) | 0 (0.0%) |
| 65 to 74 Years | 19 (7.0%) | 0 (0.0%) |
| 75 Years and over | 0 (0.0%) | 18 (12.9%) |
Technology Access in East Richmond Heights
Computing Device Access in East Richmond Heights
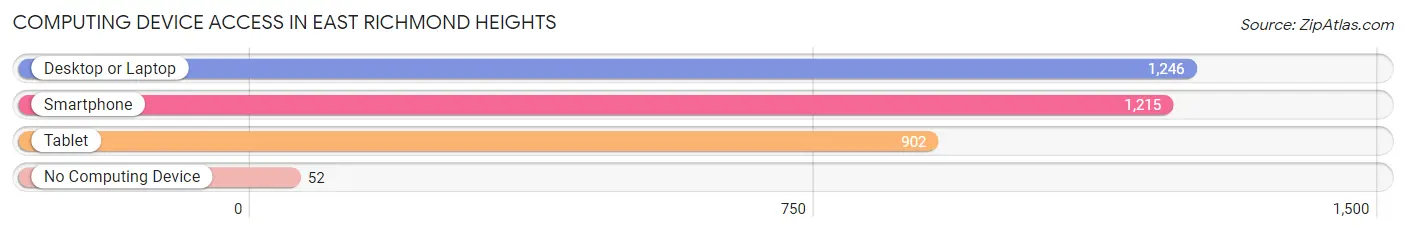
| Device Type | # Households | % Households |
| Desktop or Laptop | 1,246 | 90.7% |
| Smartphone | 1,215 | 88.5% |
| Tablet | 902 | 65.7% |
| No Computing Device | 52 | 3.8% |
| Total | 1,373 | 100.0% |
Internet Access in East Richmond Heights
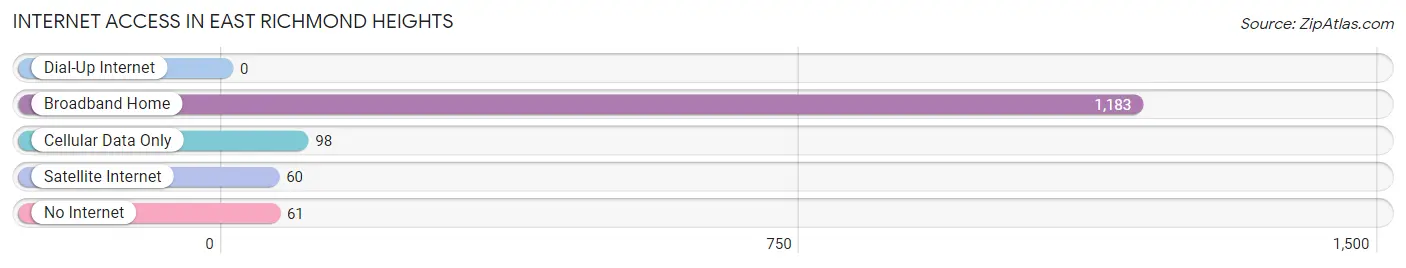
| Internet Type | # Households | % Households |
| Dial-Up Internet | 0 | 0.0% |
| Broadband Home | 1,183 | 86.2% |
| Cellular Data Only | 98 | 7.1% |
| Satellite Internet | 60 | 4.4% |
| No Internet | 61 | 4.4% |
| Total | 1,373 | 100.0% |
East Richmond Heights Summary
Richmond Heights is a small, unincorporated community located in Contra Costa County, California. It is situated in the East Bay region of the San Francisco Bay Area, just south of the city of Richmond. The community is bordered by the cities of El Sobrante to the north, San Pablo to the east, and Pinole to the south.
History
East Richmond Heights was originally part of the Rancho San Pablo, a Mexican land grant given to the widow of Don Ignacio Martinez in 1823. The area was later developed by the East Bay Electric Railway Company in the early 1900s. The company built a streetcar line that ran from Richmond to El Sobrante, and the area around the line was developed into a residential neighborhood.
In the 1920s, the area was annexed by the city of Richmond. The area was then re-annexed by the city of El Sobrante in the 1950s. In the 1960s, the area was re-annexed by the city of Richmond, and it has remained part of the city ever since.
Geography
East Richmond Heights is located in the East Bay region of the San Francisco Bay Area. It is situated in the hills of Contra Costa County, just south of the city of Richmond. The community is bordered by the cities of El Sobrante to the north, San Pablo to the east, and Pinole to the south.
The area is characterized by rolling hills and valleys, with elevations ranging from sea level to over 500 feet. The area is home to a variety of wildlife, including deer, coyotes, and mountain lions.
Economy
East Richmond Heights is primarily a residential community, with no major commercial or industrial businesses. The area is home to a variety of small businesses, including restaurants, convenience stores, and auto repair shops.
The area is also home to a number of educational institutions, including the Contra Costa Community College District, Contra Costa College, and the University of California, Berkeley.
Demographics
As of the 2010 census, East Richmond Heights had a population of 8,845. The population is primarily African American (47.3%), followed by White (31.2%), Asian (14.2%), and Hispanic or Latino (7.3%). The median household income is $60,945, and the median age is 39.
Conclusion
East Richmond Heights is a small, unincorporated community located in Contra Costa County, California. It is situated in the East Bay region of the San Francisco Bay Area, just south of the city of Richmond. The community is bordered by the cities of El Sobrante to the north, San Pablo to the east, and Pinole to the south. The area is primarily residential, with no major commercial or industrial businesses. The population is primarily African American, followed by White, Asian, and Hispanic or Latino. The median household income is $60,945, and the median age is 39.
Common Questions
What is Per Capita Income in East Richmond Heights?
Per Capita income in East Richmond Heights is $60,157.
What is the Median Family Income in East Richmond Heights?
Median Family Income in East Richmond Heights is $140,500.
What is the Median Household income in East Richmond Heights?
Median Household Income in East Richmond Heights is $112,344.
What is Income or Wage Gap in East Richmond Heights?
Income or Wage Gap in East Richmond Heights is 1.0%.
Women in East Richmond Heights earn 99.0 cents for every dollar earned by a man.
What is Inequality or Gini Index in East Richmond Heights?
Inequality or Gini Index in East Richmond Heights is 0.44.
What is the Total Population of East Richmond Heights?
Total Population of East Richmond Heights is 3,285.
What is the Total Male Population of East Richmond Heights?
Total Male Population of East Richmond Heights is 1,687.
What is the Total Female Population of East Richmond Heights?
Total Female Population of East Richmond Heights is 1,598.
What is the Ratio of Males per 100 Females in East Richmond Heights?
There are 105.57 Males per 100 Females in East Richmond Heights.
What is the Ratio of Females per 100 Males in East Richmond Heights?
There are 94.72 Females per 100 Males in East Richmond Heights.
What is the Median Population Age in East Richmond Heights?
Median Population Age in East Richmond Heights is 46.8 Years.
What is the Average Family Size in East Richmond Heights
Average Family Size in East Richmond Heights is 3.0 People.
What is the Average Household Size in East Richmond Heights
Average Household Size in East Richmond Heights is 2.4 People.
How Large is the Labor Force in East Richmond Heights?
There are 1,978 People in the Labor Forcein in East Richmond Heights.
What is the Percentage of People in the Labor Force in East Richmond Heights?
72.5% of People are in the Labor Force in East Richmond Heights.
What is the Unemployment Rate in East Richmond Heights?
Unemployment Rate in East Richmond Heights is 6.4%.