Zip Codes with the Highest Percentage of Population Employed in Legal Services & Support in San Bernardino, CA
RELATED REPORTS & OPTIONS
Legal Services & Support
San Bernardino
Compare Zip Codes
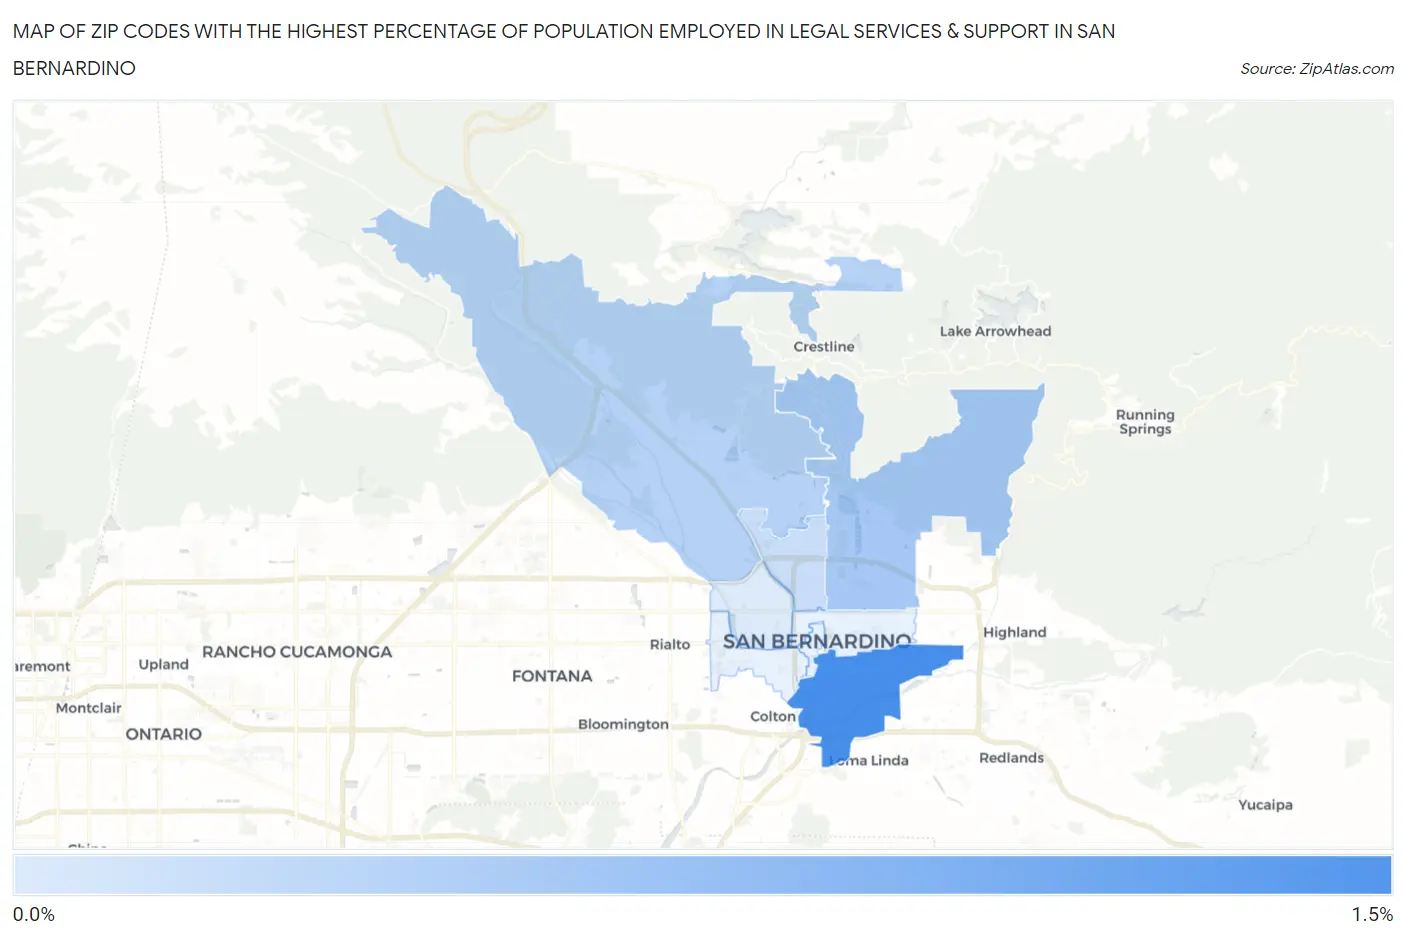
Map of Zip Codes with the Highest Percentage of Population Employed in Legal Services & Support in San Bernardino
0.21%
1.2%
Zip Codes with the Highest Percentage of Population Employed in Legal Services & Support in San Bernardino, CA
| Zip Code | % Employed | vs State | vs National | |
| 1. | 92408 | 1.2% | 1.3%(-0.060)#536 | 1.2%(+0.015)#6,510 |
| 2. | 92404 | 0.58% | 1.3%(-0.679)#875 | 1.2%(-0.605)#11,704 |
| 3. | 92407 | 0.47% | 1.3%(-0.793)#964 | 1.2%(-0.719)#13,064 |
| 4. | 92405 | 0.34% | 1.3%(-0.916)#1,046 | 1.2%(-0.841)#14,553 |
| 5. | 92411 | 0.21% | 1.3%(-1.05)#1,112 | 1.2%(-0.974)#16,093 |
1
Common Questions
What are the Top 5 Zip Codes with the Highest Percentage of Population Employed in Legal Services & Support in San Bernardino, CA?
Top 5 Zip Codes with the Highest Percentage of Population Employed in Legal Services & Support in San Bernardino, CA are:
What zip code has the Highest Percentage of Population Employed in Legal Services & Support in San Bernardino, CA?
92408 has the Highest Percentage of Population Employed in Legal Services & Support in San Bernardino, CA with 1.2%.
What is the Percentage of Population Employed in Legal Services & Support in San Bernardino, CA?
Percentage of Population Employed in Legal Services & Support in San Bernardino is 0.41%.
What is the Percentage of Population Employed in Legal Services & Support in California?
Percentage of Population Employed in Legal Services & Support in California is 1.3%.
What is the Percentage of Population Employed in Legal Services & Support in the United States?
Percentage of Population Employed in Legal Services & Support in the United States is 1.2%.