La Canada Flintridge, CA Map & Demographics
La Canada Flintridge Overview
$99,697
PER CAPITA INCOME
$233,782
AVG FAMILY INCOME
$210,625
AVG HOUSEHOLD INCOME
42.6%
WAGE / INCOME GAP [ % ]
57.4¢/ $1
WAGE / INCOME GAP [ $ ]
$12,006
FAMILY INCOME DEFICIT
0.47
INEQUALITY / GINI INDEX
20,378
TOTAL POPULATION
10,125
MALE POPULATION
10,253
FEMALE POPULATION
98.75
MALES / 100 FEMALES
101.26
FEMALES / 100 MALES
45.1
MEDIAN AGE
3.4
AVG FAMILY SIZE
3.1
AVG HOUSEHOLD SIZE
9,020
LABOR FORCE [ PEOPLE ]
57.9%
PERCENT IN LABOR FORCE
4.5%
UNEMPLOYMENT RATE
La Canada Flintridge Zip Codes
La Canada Flintridge Area Codes
Income in La Canada Flintridge
Income Overview in La Canada Flintridge
Per Capita Income in La Canada Flintridge is $99,697, while median incomes of families and households are $233,782 and $210,625 respectively.
| Characteristic | Number | Measure |
| Per Capita Income | 20,378 | $99,697 |
| Median Family Income | 5,590 | $233,782 |
| Mean Family Income | 5,590 | $329,227 |
| Median Household Income | 6,451 | $210,625 |
| Mean Household Income | 6,451 | $310,947 |
| Income Deficit | 5,590 | $12,006 |
| Wage / Income Gap (%) | 20,378 | 42.58% |
| Wage / Income Gap ($) | 20,378 | 57.42¢ per $1 |
| Gini / Inequality Index | 20,378 | 0.47 |
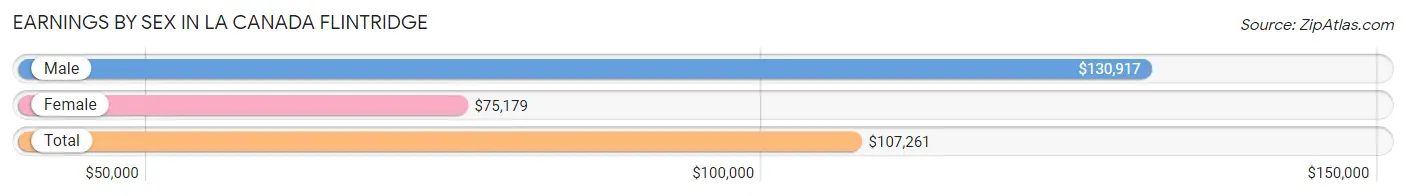
Earnings by Sex in La Canada Flintridge
Average Earnings in La Canada Flintridge are $107,261, $130,917 for men and $75,179 for women, a difference of 42.6%.
| Sex | Number | Average Earnings |
| Male | 5,227 (56.2%) | $130,917 |
| Female | 4,078 (43.8%) | $75,179 |
| Total | 9,305 (100.0%) | $107,261 |
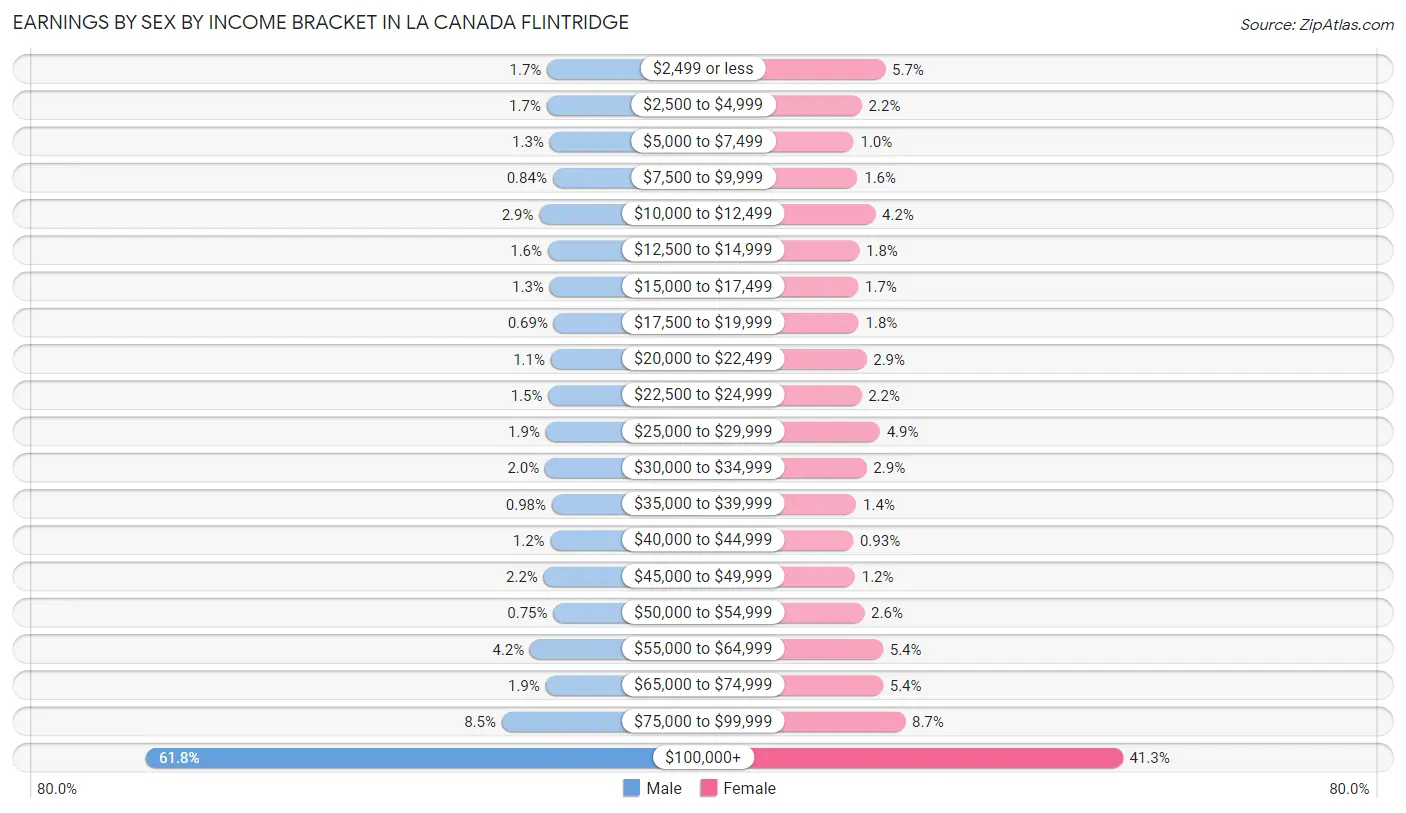
Earnings by Sex by Income Bracket in La Canada Flintridge
The most common earnings brackets in La Canada Flintridge are $100,000+ for men (3,229 | 61.8%) and $100,000+ for women (1,685 | 41.3%).
| Income | Male | Female |
| $2,499 or less | 88 (1.7%) | 234 (5.7%) |
| $2,500 to $4,999 | 91 (1.7%) | 91 (2.2%) |
| $5,000 to $7,499 | 68 (1.3%) | 41 (1.0%) |
| $7,500 to $9,999 | 44 (0.8%) | 64 (1.6%) |
| $10,000 to $12,499 | 149 (2.9%) | 173 (4.2%) |
| $12,500 to $14,999 | 82 (1.6%) | 75 (1.8%) |
| $15,000 to $17,499 | 68 (1.3%) | 69 (1.7%) |
| $17,500 to $19,999 | 36 (0.7%) | 72 (1.8%) |
| $20,000 to $22,499 | 59 (1.1%) | 119 (2.9%) |
| $22,500 to $24,999 | 79 (1.5%) | 88 (2.2%) |
| $25,000 to $29,999 | 99 (1.9%) | 201 (4.9%) |
| $30,000 to $34,999 | 104 (2.0%) | 120 (2.9%) |
| $35,000 to $39,999 | 51 (1.0%) | 57 (1.4%) |
| $40,000 to $44,999 | 62 (1.2%) | 38 (0.9%) |
| $45,000 to $49,999 | 115 (2.2%) | 49 (1.2%) |
| $50,000 to $54,999 | 39 (0.7%) | 106 (2.6%) |
| $55,000 to $64,999 | 221 (4.2%) | 220 (5.4%) |
| $65,000 to $74,999 | 100 (1.9%) | 220 (5.4%) |
| $75,000 to $99,999 | 443 (8.5%) | 356 (8.7%) |
| $100,000+ | 3,229 (61.8%) | 1,685 (41.3%) |
| Total | 5,227 (100.0%) | 4,078 (100.0%) |
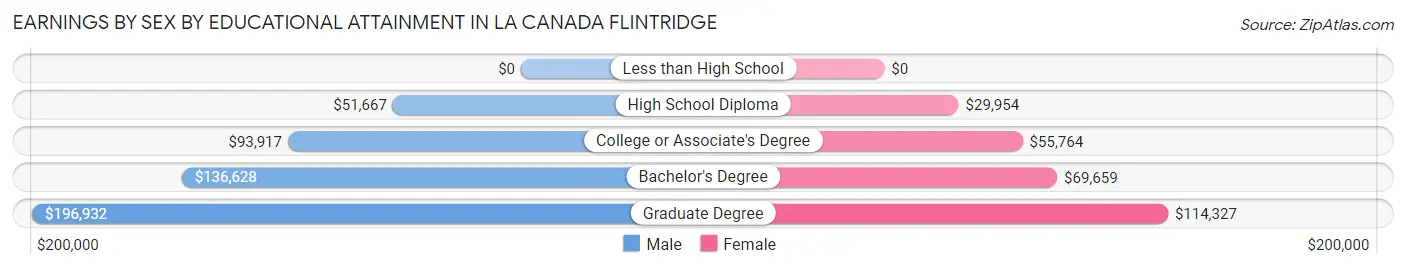
Earnings by Sex by Educational Attainment in La Canada Flintridge
Average earnings in La Canada Flintridge are $137,839 for men and $82,644 for women, a difference of 40.0%. Men with an educational attainment of graduate degree enjoy the highest average annual earnings of $196,932, while those with high school diploma education earn the least with $51,667. Women with an educational attainment of graduate degree earn the most with the average annual earnings of $114,327, while those with high school diploma education have the smallest earnings of $29,954.
| Educational Attainment | Male Income | Female Income |
| Less than High School | - | - |
| High School Diploma | $51,667 | $29,954 |
| College or Associate's Degree | $93,917 | $55,764 |
| Bachelor's Degree | $136,628 | $69,659 |
| Graduate Degree | $196,932 | $114,327 |
| Total | $137,839 | $82,644 |
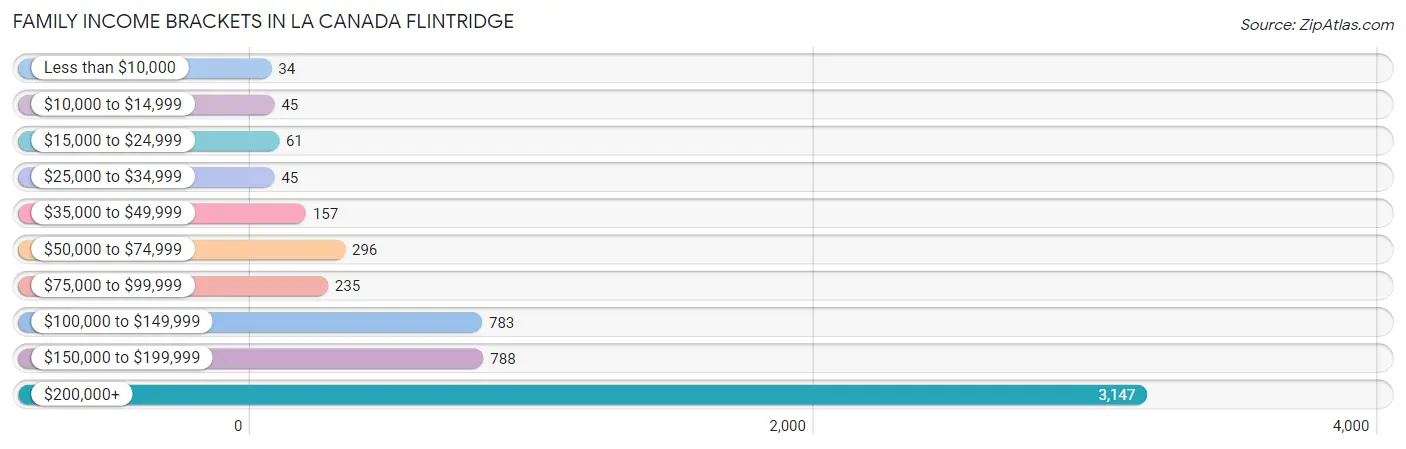
Family Income in La Canada Flintridge
Family Income Brackets in La Canada Flintridge
According to the La Canada Flintridge family income data, there are 3,147 families falling into the $200,000+ income range, which is the most common income bracket and makes up 56.3% of all families. Conversely, the less than $10,000 income bracket is the least frequent group with only 34 families (0.6%) belonging to this category.
| Income Bracket | # Families | % Families |
| Less than $10,000 | 34 | 0.6% |
| $10,000 to $14,999 | 45 | 0.8% |
| $15,000 to $24,999 | 61 | 1.1% |
| $25,000 to $34,999 | 45 | 0.8% |
| $35,000 to $49,999 | 157 | 2.8% |
| $50,000 to $74,999 | 296 | 5.3% |
| $75,000 to $99,999 | 235 | 4.2% |
| $100,000 to $149,999 | 783 | 14.0% |
| $150,000 to $199,999 | 788 | 14.1% |
| $200,000+ | 3,147 | 56.3% |
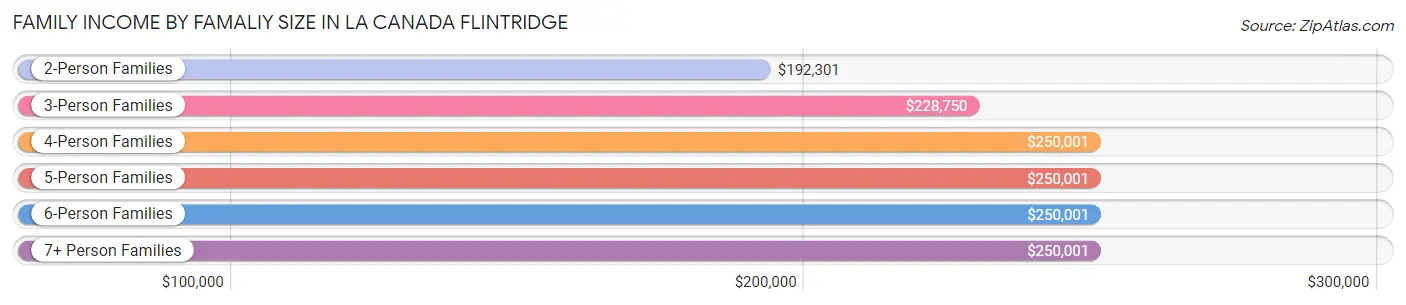
Family Income by Famaliy Size in La Canada Flintridge
4-person families (1,664 | 29.8%) account for the highest median family income in La Canada Flintridge with $250,001 per family, while 2-person families (2,039 | 36.5%) have the highest median income of $96,150 per family member.
| Income Bracket | # Families | Median Income |
| 2-Person Families | 2,039 (36.5%) | $192,301 |
| 3-Person Families | 1,056 (18.9%) | $228,750 |
| 4-Person Families | 1,664 (29.8%) | $250,001 |
| 5-Person Families | 702 (12.6%) | $250,001 |
| 6-Person Families | 64 (1.1%) | $250,001 |
| 7+ Person Families | 65 (1.2%) | $250,001 |
| Total | 5,590 (100.0%) | $233,782 |
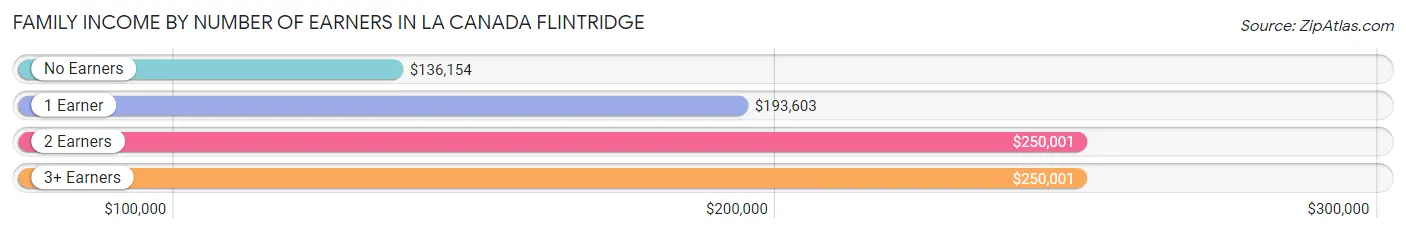
Family Income by Number of Earners in La Canada Flintridge
The median family income in La Canada Flintridge is $233,782, with families comprising 2 earners (2,500) having the highest median family income of $250,001, while families with no earners (824) have the lowest median family income of $136,154, accounting for 44.7% and 14.7% of families, respectively.
| Number of Earners | # Families | Median Income |
| No Earners | 824 (14.7%) | $136,154 |
| 1 Earner | 1,755 (31.4%) | $193,603 |
| 2 Earners | 2,500 (44.7%) | $250,001 |
| 3+ Earners | 511 (9.1%) | $250,001 |
| Total | 5,590 (100.0%) | $233,782 |
Household Income in La Canada Flintridge
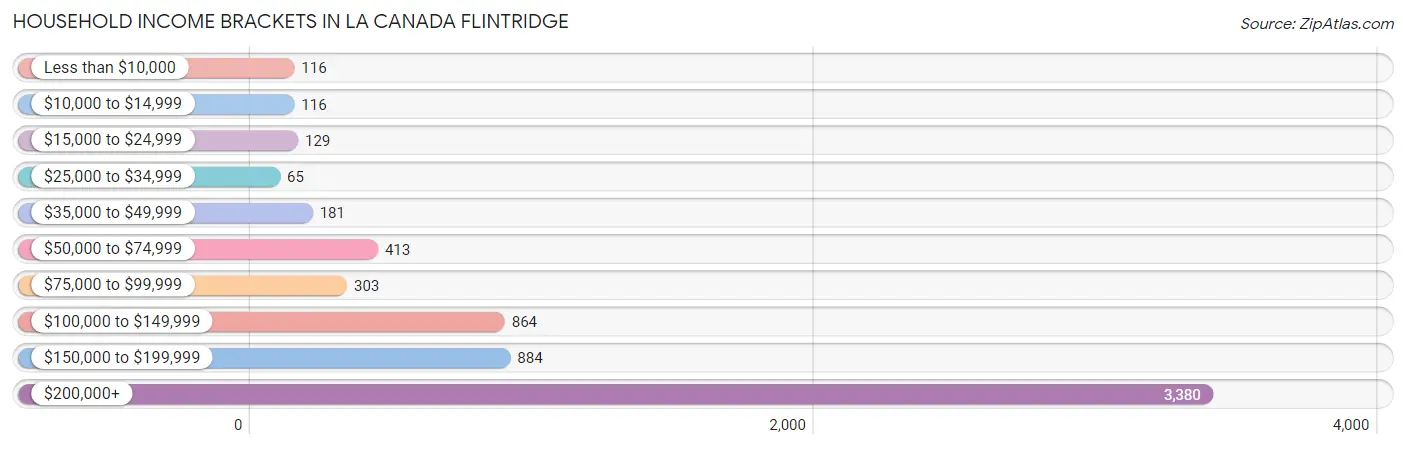
Household Income Brackets in La Canada Flintridge
With 3,380 households falling in the category, the $200,000+ income range is the most frequent in La Canada Flintridge, accounting for 52.4% of all households. In contrast, only 65 households (1.0%) fall into the $25,000 to $34,999 income bracket, making it the least populous group.
| Income Bracket | # Households | % Households |
| Less than $10,000 | 116 | 1.8% |
| $10,000 to $14,999 | 116 | 1.8% |
| $15,000 to $24,999 | 129 | 2.0% |
| $25,000 to $34,999 | 65 | 1.0% |
| $35,000 to $49,999 | 181 | 2.8% |
| $50,000 to $74,999 | 413 | 6.4% |
| $75,000 to $99,999 | 303 | 4.7% |
| $100,000 to $149,999 | 864 | 13.4% |
| $150,000 to $199,999 | 884 | 13.7% |
| $200,000+ | 3,380 | 52.4% |
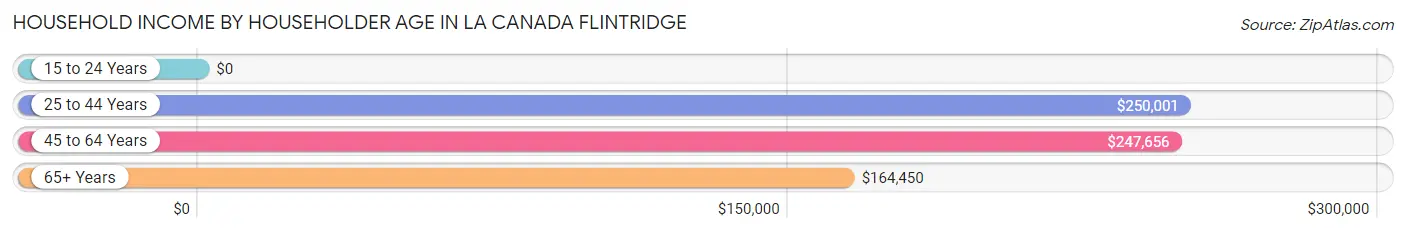
Household Income by Householder Age in La Canada Flintridge
The median household income in La Canada Flintridge is $210,625, with the highest median household income of $250,001 found in the 25 to 44 years age bracket for the primary householder. A total of 1,150 households (17.8%) fall into this category. Meanwhile, the 15 to 24 years age bracket for the primary householder has the lowest median household income of $0, with 19 households (0.3%) in this group.
| Income Bracket | # Households | Median Income |
| 15 to 24 Years | 19 (0.3%) | $0 |
| 25 to 44 Years | 1,150 (17.8%) | $250,001 |
| 45 to 64 Years | 3,157 (48.9%) | $247,656 |
| 65+ Years | 2,125 (32.9%) | $164,450 |
| Total | 6,451 (100.0%) | $210,625 |
Poverty in La Canada Flintridge
Income Below Poverty by Sex and Age in La Canada Flintridge
With 2.6% poverty level for males and 3.9% for females among the residents of La Canada Flintridge, 18 to 24 year old males and 55 to 64 year old females are the most vulnerable to poverty, with 81 males (10.3%) and 167 females (11.5%) in their respective age groups living below the poverty level.
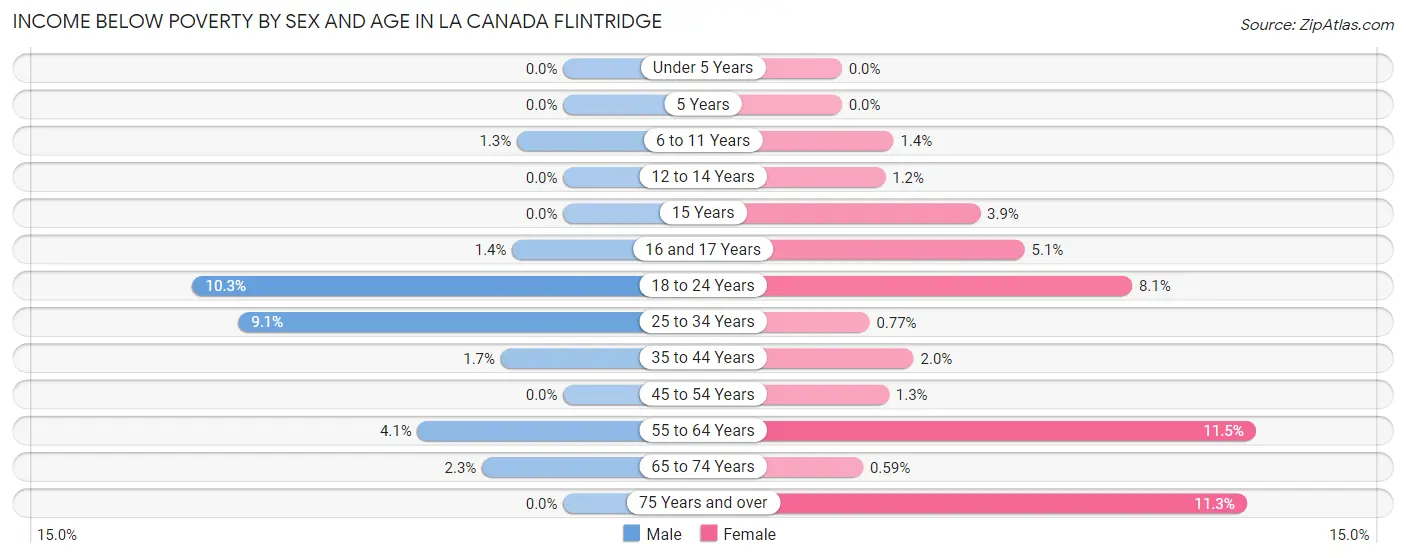
| Age Bracket | Male | Female |
| Under 5 Years | 0 (0.0%) | 0 (0.0%) |
| 5 Years | 0 (0.0%) | 0 (0.0%) |
| 6 to 11 Years | 12 (1.3%) | 12 (1.4%) |
| 12 to 14 Years | 0 (0.0%) | 9 (1.2%) |
| 15 Years | 0 (0.0%) | 9 (3.8%) |
| 16 and 17 Years | 6 (1.4%) | 23 (5.1%) |
| 18 to 24 Years | 81 (10.3%) | 27 (8.1%) |
| 25 to 34 Years | 66 (9.0%) | 4 (0.8%) |
| 35 to 44 Years | 17 (1.7%) | 23 (2.0%) |
| 45 to 54 Years | 0 (0.0%) | 23 (1.3%) |
| 55 to 64 Years | 60 (4.1%) | 167 (11.5%) |
| 65 to 74 Years | 23 (2.3%) | 7 (0.6%) |
| 75 Years and over | 0 (0.0%) | 97 (11.3%) |
| Total | 265 (2.6%) | 401 (3.9%) |
Income Above Poverty by Sex and Age in La Canada Flintridge
According to the poverty statistics in La Canada Flintridge, males aged under 5 years and females aged under 5 years are the age groups that are most secure financially, with 100.0% of males and 100.0% of females in these age groups living above the poverty line.
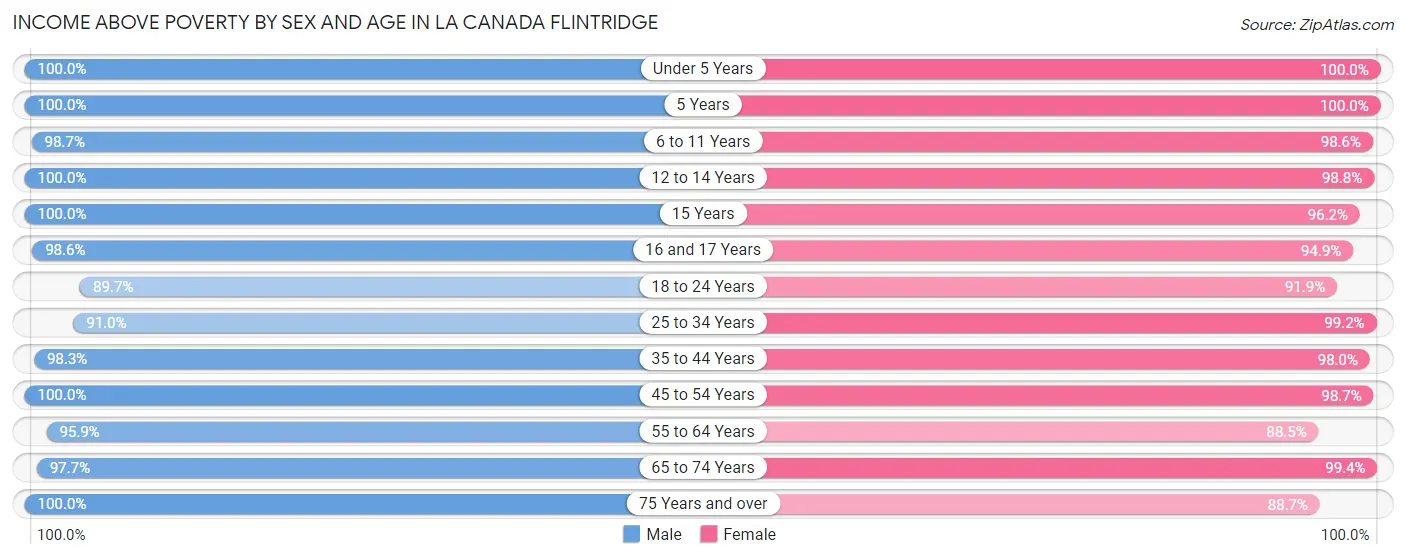
| Age Bracket | Male | Female |
| Under 5 Years | 346 (100.0%) | 564 (100.0%) |
| 5 Years | 120 (100.0%) | 142 (100.0%) |
| 6 to 11 Years | 919 (98.7%) | 821 (98.6%) |
| 12 to 14 Years | 651 (100.0%) | 736 (98.8%) |
| 15 Years | 221 (100.0%) | 225 (96.2%) |
| 16 and 17 Years | 417 (98.6%) | 429 (94.9%) |
| 18 to 24 Years | 704 (89.7%) | 307 (91.9%) |
| 25 to 34 Years | 663 (90.9%) | 516 (99.2%) |
| 35 to 44 Years | 959 (98.3%) | 1,125 (98.0%) |
| 45 to 54 Years | 1,673 (100.0%) | 1,734 (98.7%) |
| 55 to 64 Years | 1,417 (95.9%) | 1,283 (88.5%) |
| 65 to 74 Years | 994 (97.7%) | 1,182 (99.4%) |
| 75 Years and over | 776 (100.0%) | 764 (88.7%) |
| Total | 9,860 (97.4%) | 9,828 (96.1%) |
Income Below Poverty Among Married-Couple Families in La Canada Flintridge
The poverty statistics for married-couple families in La Canada Flintridge show that 0.9% or 48 of the total 5,063 families live below the poverty line. Families with no children have the highest poverty rate of 1.5%, comprising of 40 families. On the other hand, families with 3 or 4 children have the lowest poverty rate of 0.0%, which includes 0 families.
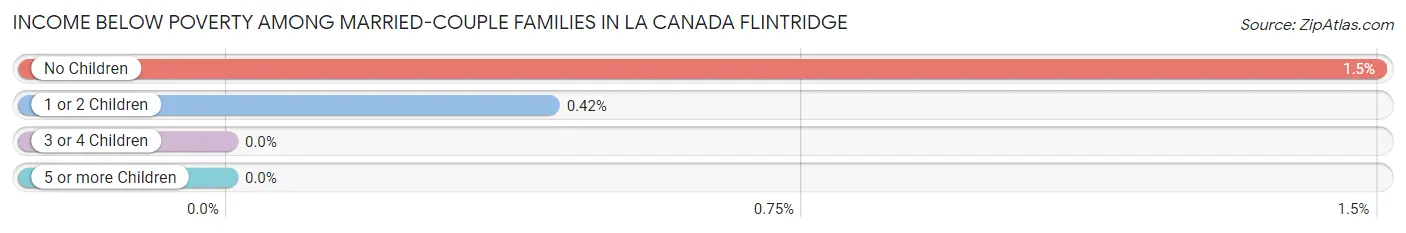
| Children | Above Poverty | Below Poverty |
| No Children | 2,622 (98.5%) | 40 (1.5%) |
| 1 or 2 Children | 1,878 (99.6%) | 8 (0.4%) |
| 3 or 4 Children | 465 (100.0%) | 0 (0.0%) |
| 5 or more Children | 50 (100.0%) | 0 (0.0%) |
| Total | 5,015 (99.1%) | 48 (0.9%) |
Income Below Poverty Among Single-Parent Households in La Canada Flintridge
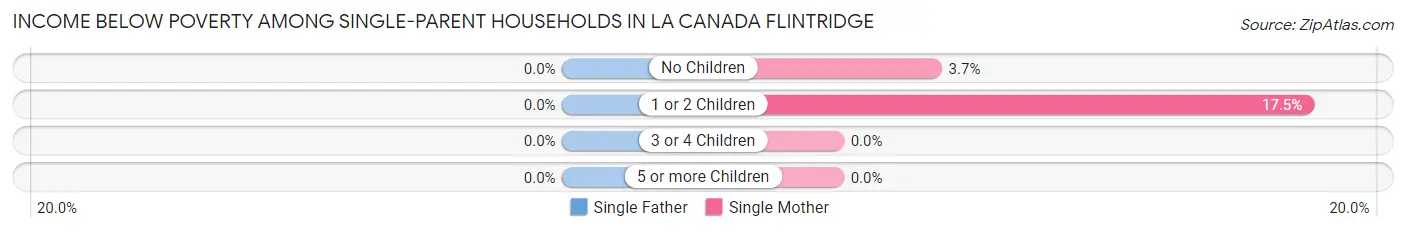
| Children | Single Father | Single Mother |
| No Children | 0 (0.0%) | 5 (3.6%) |
| 1 or 2 Children | 0 (0.0%) | 48 (17.5%) |
| 3 or 4 Children | 0 (0.0%) | 0 (0.0%) |
| 5 or more Children | 0 (0.0%) | 0 (0.0%) |
| Total | 0 (0.0%) | 53 (12.9%) |
Income Below Poverty Among Married-Couple vs Single-Parent Households in La Canada Flintridge
The poverty data for La Canada Flintridge shows that 48 of the married-couple family households (0.9%) and 53 of the single-parent households (10.1%) are living below the poverty level. Within the married-couple family households, those with no children have the highest poverty rate, with 40 households (1.5%) falling below the poverty line. Among the single-parent households, those with 1 or 2 children have the highest poverty rate, with 48 household (13.8%) living below poverty.
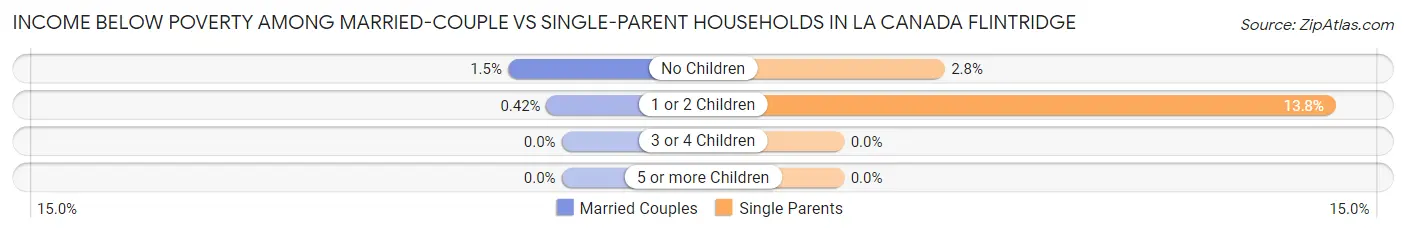
| Children | Married-Couple Families | Single-Parent Households |
| No Children | 40 (1.5%) | 5 (2.8%) |
| 1 or 2 Children | 8 (0.4%) | 48 (13.8%) |
| 3 or 4 Children | 0 (0.0%) | 0 (0.0%) |
| 5 or more Children | 0 (0.0%) | 0 (0.0%) |
| Total | 48 (0.9%) | 53 (10.1%) |
Race in La Canada Flintridge
The most populous races in La Canada Flintridge are White / Caucasian (11,893 | 58.4%), Asian (6,245 | 30.6%), and Hispanic or Latino (2,004 | 9.8%).
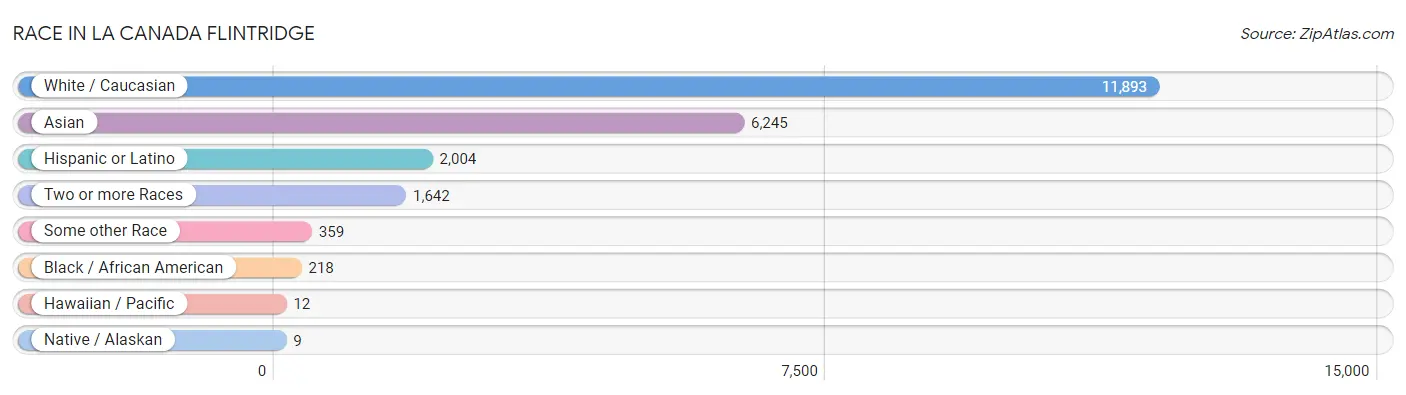
| Race | # Population | % Population |
| Asian | 6,245 | 30.6% |
| Black / African American | 218 | 1.1% |
| Hawaiian / Pacific | 12 | 0.1% |
| Hispanic or Latino | 2,004 | 9.8% |
| Native / Alaskan | 9 | 0.0% |
| White / Caucasian | 11,893 | 58.4% |
| Two or more Races | 1,642 | 8.1% |
| Some other Race | 359 | 1.8% |
| Total | 20,378 | 100.0% |
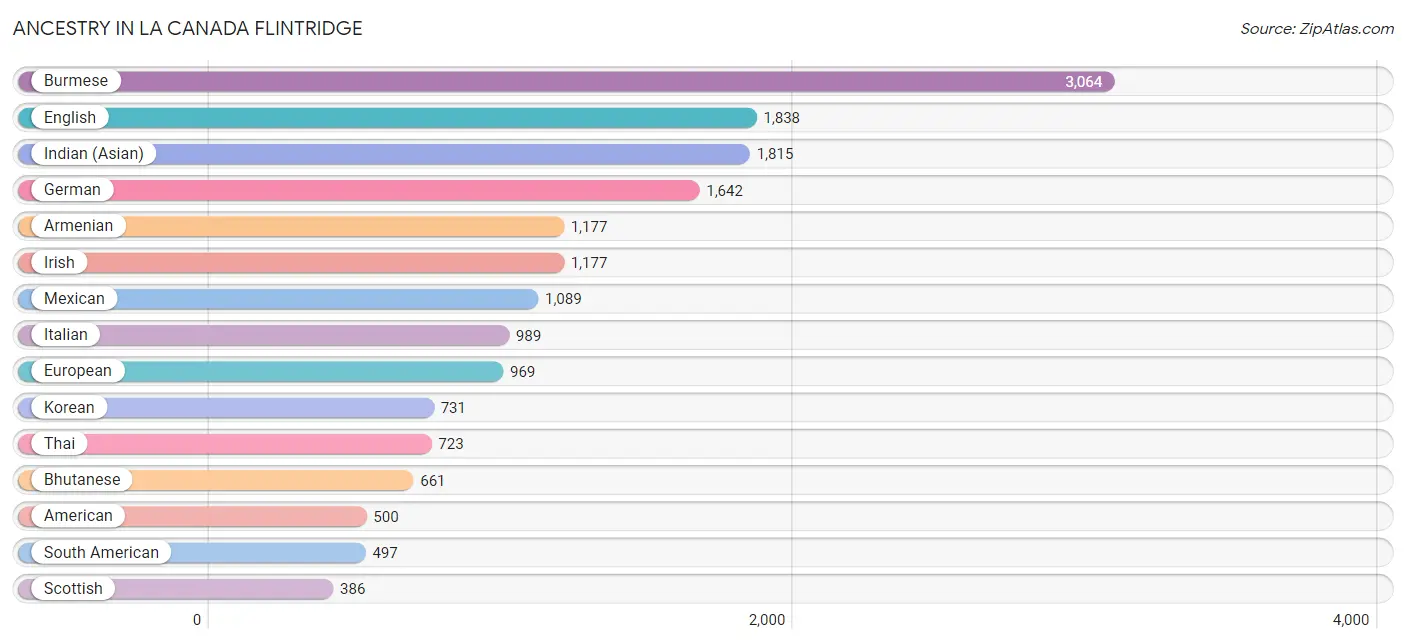
Ancestry in La Canada Flintridge
The most populous ancestries reported in La Canada Flintridge are Burmese (3,064 | 15.0%), English (1,838 | 9.0%), Indian (Asian) (1,815 | 8.9%), German (1,642 | 8.1%), and Armenian (1,177 | 5.8%), together accounting for 46.8% of all La Canada Flintridge residents.
| Ancestry | # Population | % Population |
| Albanian | 9 | 0.0% |
| American | 500 | 2.5% |
| Apache | 12 | 0.1% |
| Arab | 203 | 1.0% |
| Argentinean | 80 | 0.4% |
| Armenian | 1,177 | 5.8% |
| Australian | 25 | 0.1% |
| Austrian | 38 | 0.2% |
| Basque | 5 | 0.0% |
| Belgian | 9 | 0.0% |
| Bhutanese | 661 | 3.2% |
| British | 298 | 1.5% |
| Burmese | 3,064 | 15.0% |
| Canadian | 109 | 0.5% |
| Celtic | 7 | 0.0% |
| Central American | 84 | 0.4% |
| Cherokee | 17 | 0.1% |
| Chickasaw | 9 | 0.0% |
| Chilean | 46 | 0.2% |
| Chippewa | 3 | 0.0% |
| Choctaw | 11 | 0.1% |
| Colombian | 251 | 1.2% |
| Costa Rican | 15 | 0.1% |
| Croatian | 29 | 0.1% |
| Cuban | 97 | 0.5% |
| Czech | 11 | 0.1% |
| Danish | 168 | 0.8% |
| Dominican | 68 | 0.3% |
| Dutch | 182 | 0.9% |
| Eastern European | 127 | 0.6% |
| Ecuadorian | 99 | 0.5% |
| Egyptian | 70 | 0.3% |
| English | 1,838 | 9.0% |
| European | 969 | 4.8% |
| Filipino | 128 | 0.6% |
| Finnish | 12 | 0.1% |
| French | 345 | 1.7% |
| French Canadian | 74 | 0.4% |
| German | 1,642 | 8.1% |
| Greek | 79 | 0.4% |
| Guatemalan | 26 | 0.1% |
| Hungarian | 104 | 0.5% |
| Icelander | 29 | 0.1% |
| Indian (Asian) | 1,815 | 8.9% |
| Iranian | 228 | 1.1% |
| Irish | 1,177 | 5.8% |
| Iroquois | 18 | 0.1% |
| Israeli | 12 | 0.1% |
| Italian | 989 | 4.9% |
| Japanese | 142 | 0.7% |
| Korean | 731 | 3.6% |
| Lebanese | 56 | 0.3% |
| Lithuanian | 45 | 0.2% |
| Maltese | 12 | 0.1% |
| Mexican | 1,089 | 5.3% |
| Mexican American Indian | 17 | 0.1% |
| Native Hawaiian | 45 | 0.2% |
| Nicaraguan | 2 | 0.0% |
| Northern European | 118 | 0.6% |
| Norwegian | 218 | 1.1% |
| Pakistani | 18 | 0.1% |
| Peruvian | 8 | 0.0% |
| Polish | 226 | 1.1% |
| Portuguese | 143 | 0.7% |
| Pueblo | 27 | 0.1% |
| Puerto Rican | 31 | 0.2% |
| Romanian | 20 | 0.1% |
| Russian | 132 | 0.6% |
| Salvadoran | 41 | 0.2% |
| Scandinavian | 53 | 0.3% |
| Scotch-Irish | 61 | 0.3% |
| Scottish | 386 | 1.9% |
| Sioux | 4 | 0.0% |
| Slovak | 11 | 0.1% |
| South American | 497 | 2.4% |
| Spaniard | 7 | 0.0% |
| Spanish | 47 | 0.2% |
| Sri Lankan | 264 | 1.3% |
| Swedish | 261 | 1.3% |
| Swiss | 110 | 0.5% |
| Thai | 723 | 3.5% |
| Ukrainian | 144 | 0.7% |
| Venezuelan | 13 | 0.1% |
| Welsh | 90 | 0.4% | View All 84 Rows |
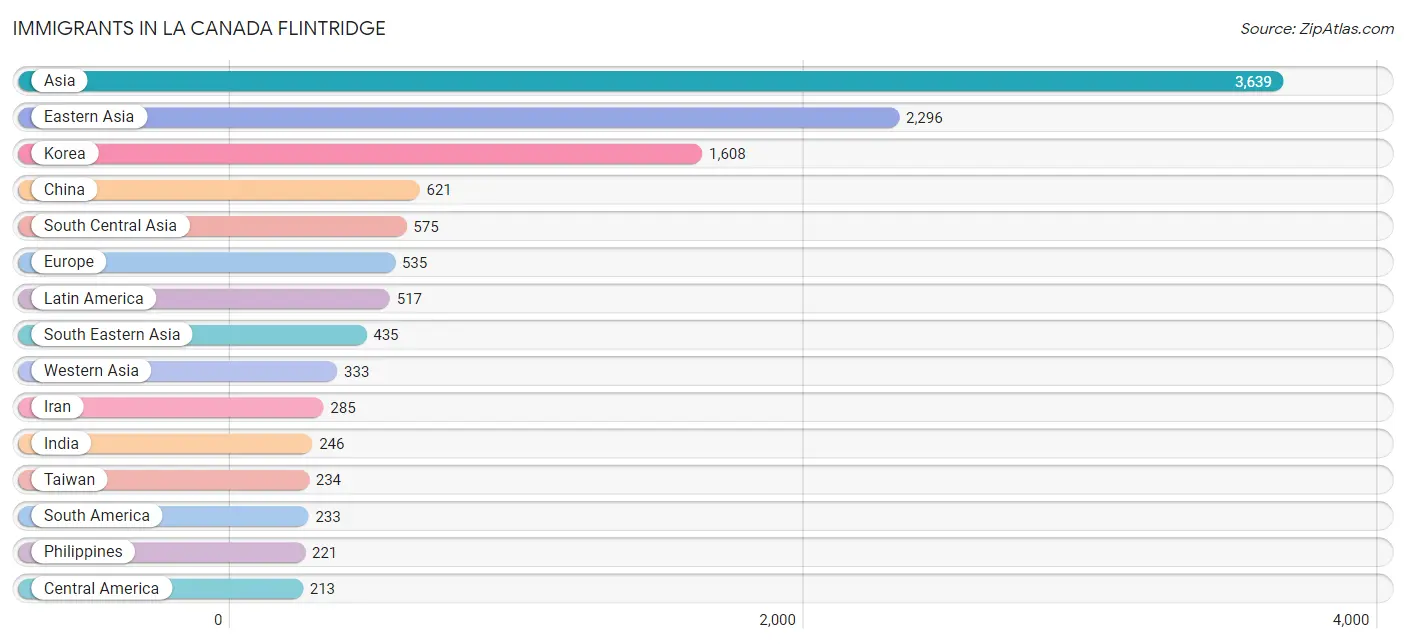
Immigrants in La Canada Flintridge
The most numerous immigrant groups reported in La Canada Flintridge came from Asia (3,639 | 17.9%), Eastern Asia (2,296 | 11.3%), Korea (1,608 | 7.9%), China (621 | 3.0%), and South Central Asia (575 | 2.8%), together accounting for 42.9% of all La Canada Flintridge residents.
| Immigration Origin | # Population | % Population |
| Africa | 212 | 1.0% |
| Albania | 9 | 0.0% |
| Argentina | 17 | 0.1% |
| Armenia | 86 | 0.4% |
| Asia | 3,639 | 17.9% |
| Australia | 59 | 0.3% |
| Austria | 21 | 0.1% |
| Belgium | 16 | 0.1% |
| Belize | 9 | 0.0% |
| Brazil | 10 | 0.1% |
| Cambodia | 36 | 0.2% |
| Canada | 193 | 0.9% |
| Caribbean | 71 | 0.4% |
| Central America | 213 | 1.1% |
| China | 621 | 3.0% |
| Colombia | 169 | 0.8% |
| Costa Rica | 15 | 0.1% |
| Cuba | 38 | 0.2% |
| Denmark | 31 | 0.2% |
| Dominican Republic | 33 | 0.2% |
| Eastern Africa | 72 | 0.4% |
| Eastern Asia | 2,296 | 11.3% |
| Eastern Europe | 105 | 0.5% |
| Egypt | 52 | 0.3% |
| El Salvador | 25 | 0.1% |
| England | 42 | 0.2% |
| Europe | 535 | 2.6% |
| France | 6 | 0.0% |
| Germany | 101 | 0.5% |
| Greece | 6 | 0.0% |
| Guatemala | 17 | 0.1% |
| Hong Kong | 54 | 0.3% |
| Hungary | 10 | 0.1% |
| India | 246 | 1.2% |
| Iran | 285 | 1.4% |
| Iraq | 11 | 0.1% |
| Ireland | 13 | 0.1% |
| Israel | 16 | 0.1% |
| Italy | 37 | 0.2% |
| Japan | 67 | 0.3% |
| Jordan | 4 | 0.0% |
| Korea | 1,608 | 7.9% |
| Kuwait | 11 | 0.1% |
| Latin America | 517 | 2.5% |
| Lebanon | 21 | 0.1% |
| Liberia | 8 | 0.0% |
| Lithuania | 24 | 0.1% |
| Malaysia | 9 | 0.0% |
| Mexico | 145 | 0.7% |
| Middle Africa | 11 | 0.1% |
| Morocco | 42 | 0.2% |
| Nicaragua | 2 | 0.0% |
| Northern Africa | 94 | 0.5% |
| Northern Europe | 180 | 0.9% |
| Norway | 8 | 0.0% |
| Oceania | 59 | 0.3% |
| Pakistan | 9 | 0.0% |
| Peru | 15 | 0.1% |
| Philippines | 221 | 1.1% |
| Portugal | 12 | 0.1% |
| Romania | 20 | 0.1% |
| Russia | 8 | 0.0% |
| Scotland | 19 | 0.1% |
| South Africa | 26 | 0.1% |
| South America | 233 | 1.1% |
| South Central Asia | 575 | 2.8% |
| South Eastern Asia | 435 | 2.1% |
| Southern Europe | 80 | 0.4% |
| Sri Lanka | 35 | 0.2% |
| Switzerland | 10 | 0.1% |
| Syria | 37 | 0.2% |
| Taiwan | 234 | 1.1% |
| Thailand | 16 | 0.1% |
| Uganda | 46 | 0.2% |
| Ukraine | 34 | 0.2% |
| Venezuela | 22 | 0.1% |
| Vietnam | 133 | 0.6% |
| Western Africa | 8 | 0.0% |
| Western Asia | 333 | 1.6% |
| Western Europe | 170 | 0.8% |
| Zimbabwe | 13 | 0.1% | View All 81 Rows |
Sex and Age in La Canada Flintridge
Sex and Age in La Canada Flintridge
The most populous age groups in La Canada Flintridge are 10 to 14 Years (989 | 9.8%) for men and 10 to 14 Years (1,113 | 10.9%) for women.
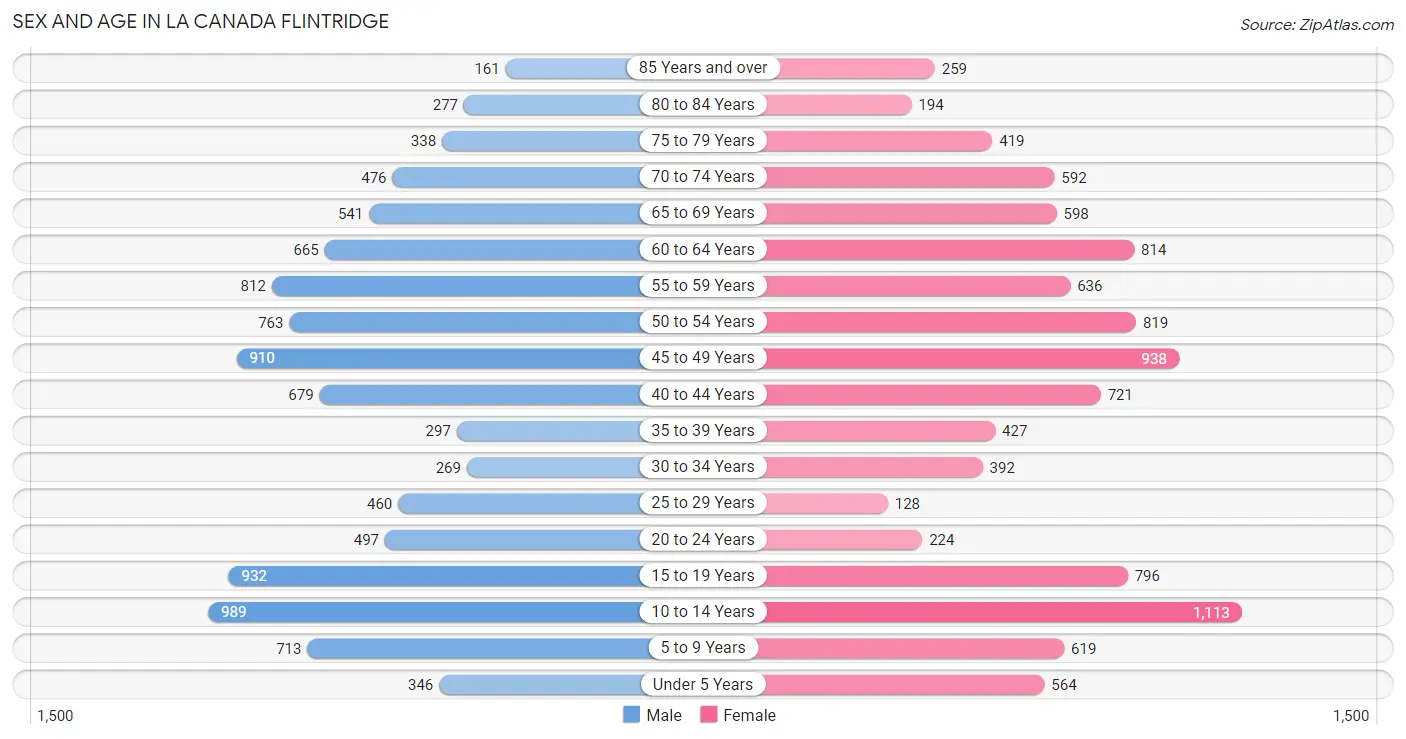
| Age Bracket | Male | Female |
| Under 5 Years | 346 (3.4%) | 564 (5.5%) |
| 5 to 9 Years | 713 (7.0%) | 619 (6.0%) |
| 10 to 14 Years | 989 (9.8%) | 1,113 (10.9%) |
| 15 to 19 Years | 932 (9.2%) | 796 (7.8%) |
| 20 to 24 Years | 497 (4.9%) | 224 (2.2%) |
| 25 to 29 Years | 460 (4.5%) | 128 (1.3%) |
| 30 to 34 Years | 269 (2.7%) | 392 (3.8%) |
| 35 to 39 Years | 297 (2.9%) | 427 (4.2%) |
| 40 to 44 Years | 679 (6.7%) | 721 (7.0%) |
| 45 to 49 Years | 910 (9.0%) | 938 (9.1%) |
| 50 to 54 Years | 763 (7.5%) | 819 (8.0%) |
| 55 to 59 Years | 812 (8.0%) | 636 (6.2%) |
| 60 to 64 Years | 665 (6.6%) | 814 (7.9%) |
| 65 to 69 Years | 541 (5.3%) | 598 (5.8%) |
| 70 to 74 Years | 476 (4.7%) | 592 (5.8%) |
| 75 to 79 Years | 338 (3.3%) | 419 (4.1%) |
| 80 to 84 Years | 277 (2.7%) | 194 (1.9%) |
| 85 Years and over | 161 (1.6%) | 259 (2.5%) |
| Total | 10,125 (100.0%) | 10,253 (100.0%) |
Families and Households in La Canada Flintridge
Median Family Size in La Canada Flintridge
The median family size in La Canada Flintridge is 3.39 persons per family, with married-couple families (5,063 | 90.6%) accounting for the largest median family size of 3.42 persons per family. On the other hand, single male/father families (116 | 2.1%) represent the smallest median family size with 2.96 persons per family.
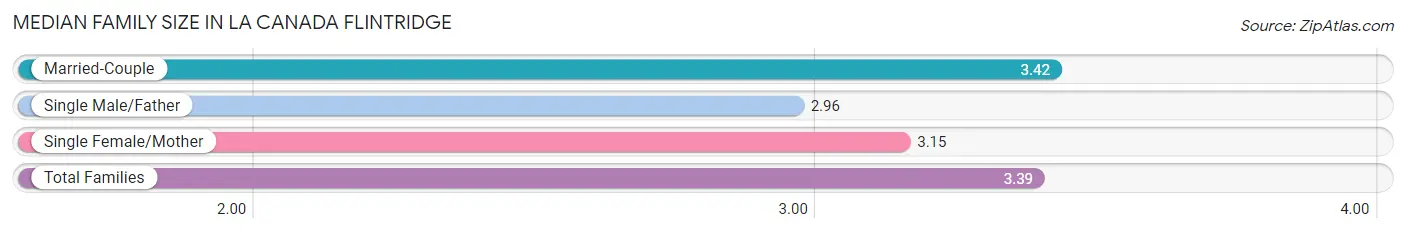
| Family Type | # Families | Family Size |
| Married-Couple | 5,063 (90.6%) | 3.42 |
| Single Male/Father | 116 (2.1%) | 2.96 |
| Single Female/Mother | 411 (7.3%) | 3.15 |
| Total Families | 5,590 (100.0%) | 3.39 |
Median Household Size in La Canada Flintridge
The median household size in La Canada Flintridge is 3.15 persons per household, with married-couple households (5,063 | 78.5%) accounting for the largest median household size of 3.47 persons per household. non-family households (861 | 13.4%) represent the smallest median household size with 1.22 persons per household.
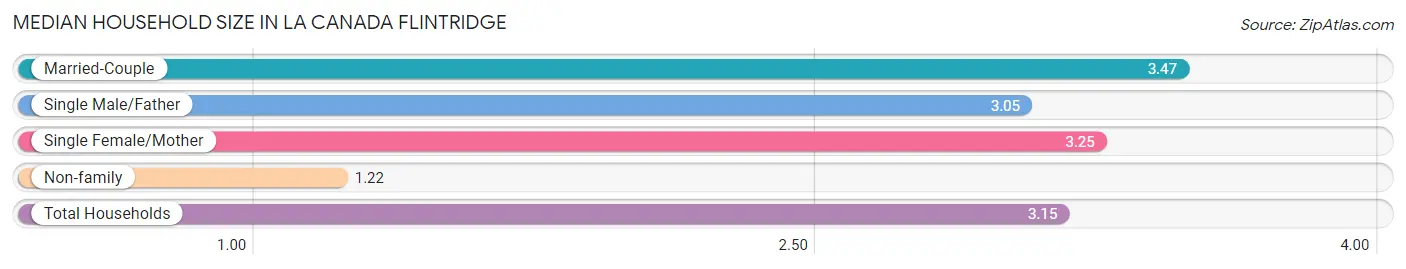
| Household Type | # Households | Household Size |
| Married-Couple | 5,063 (78.5%) | 3.47 |
| Single Male/Father | 116 (1.8%) | 3.05 |
| Single Female/Mother | 411 (6.4%) | 3.25 |
| Non-family | 861 (13.4%) | 1.22 |
| Total Households | 6,451 (100.0%) | 3.15 |
Household Size by Marriage Status in La Canada Flintridge
Out of a total of 6,451 households in La Canada Flintridge, 5,590 (86.7%) are family households, while 861 (13.4%) are nonfamily households. The most numerous type of family households are 2-person households, comprising 1,937, and the most common type of nonfamily households are 1-person households, comprising 702.
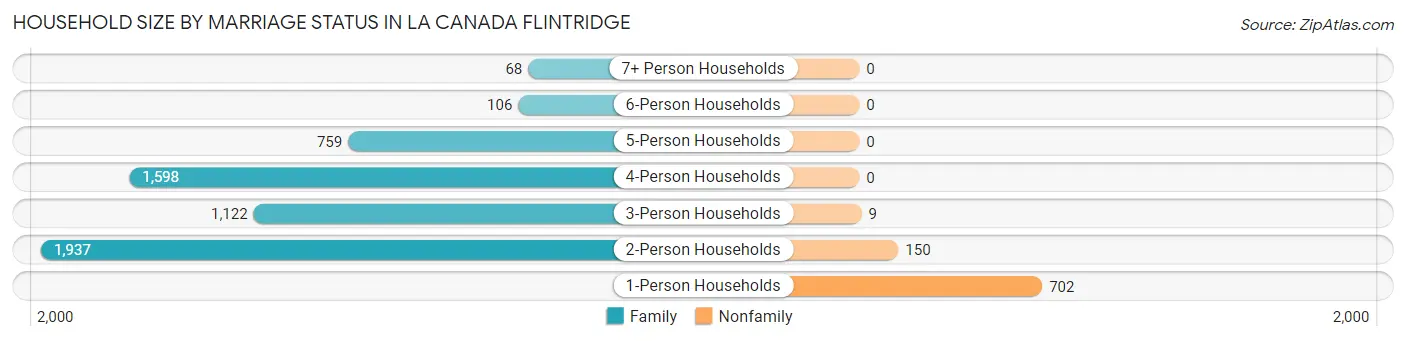
| Household Size | Family Households | Nonfamily Households |
| 1-Person Households | - | 702 (10.9%) |
| 2-Person Households | 1,937 (30.0%) | 150 (2.3%) |
| 3-Person Households | 1,122 (17.4%) | 9 (0.1%) |
| 4-Person Households | 1,598 (24.8%) | 0 (0.0%) |
| 5-Person Households | 759 (11.8%) | 0 (0.0%) |
| 6-Person Households | 106 (1.6%) | 0 (0.0%) |
| 7+ Person Households | 68 (1.1%) | 0 (0.0%) |
| Total | 5,590 (86.7%) | 861 (13.4%) |
Female Fertility in La Canada Flintridge
Fertility by Age in La Canada Flintridge
Average fertility rate in La Canada Flintridge is 44.0 births per 1,000 women. Women in the age bracket of 20 to 34 years have the highest fertility rate with 78.0 births per 1,000 women. Women in the age bracket of 35 to 50 years acount for 64.8% of all women with births.
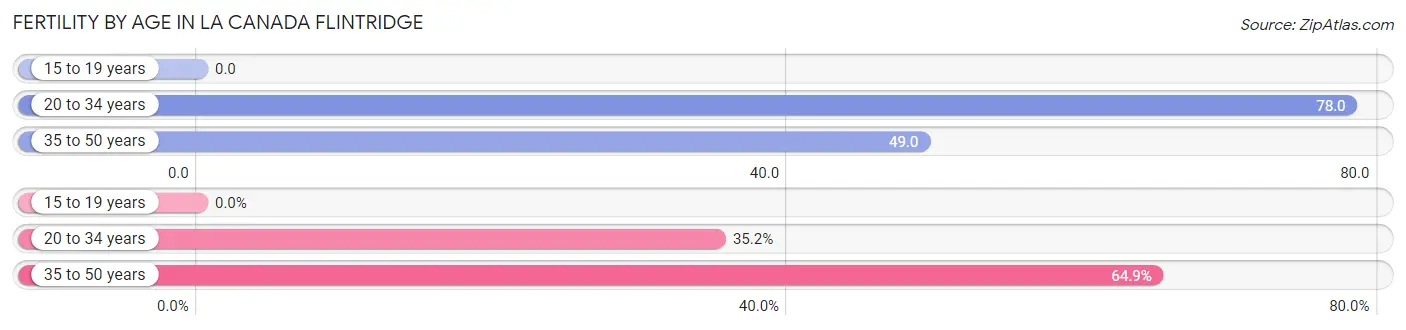
| Age Bracket | Women with Births | Births / 1,000 Women |
| 15 to 19 years | 0 (0.0%) | 0.0 |
| 20 to 34 years | 58 (35.1%) | 78.0 |
| 35 to 50 years | 107 (64.8%) | 49.0 |
| Total | 165 (100.0%) | 44.0 |
Fertility by Age by Marriage Status in La Canada Flintridge
55.8% of women with births (165) in La Canada Flintridge are married. The highest percentage of unmarried women with births falls into 35 to 50 years age bracket with 68.2% of them unmarried at the time of birth, while the lowest percentage of unmarried women with births belong to 20 to 34 years age bracket with 0.0% of them unmarried.
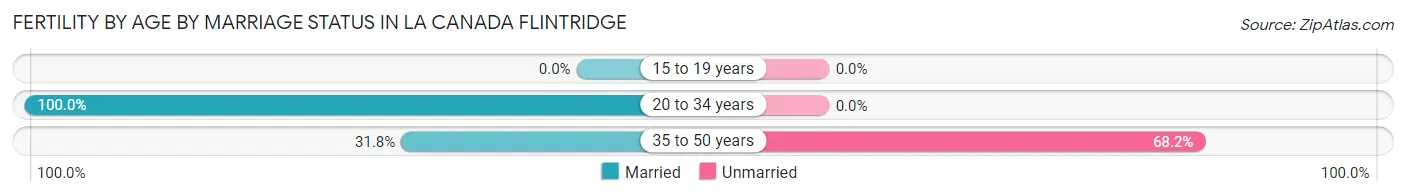
| Age Bracket | Married | Unmarried |
| 15 to 19 years | 0 (0.0%) | 0 (0.0%) |
| 20 to 34 years | 58 (100.0%) | 0 (0.0%) |
| 35 to 50 years | 34 (31.8%) | 73 (68.2%) |
| Total | 92 (55.8%) | 73 (44.2%) |
Fertility by Education in La Canada Flintridge
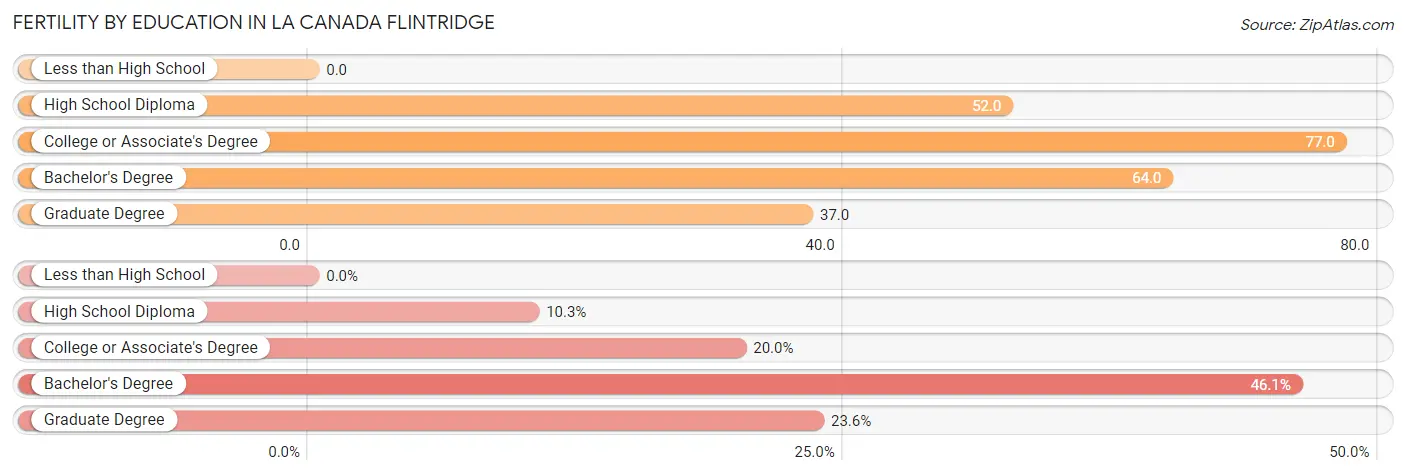
| Educational Attainment | Women with Births | Births / 1,000 Women |
| Less than High School | 0 (0.0%) | 0.0 |
| High School Diploma | 17 (10.3%) | 52.0 |
| College or Associate's Degree | 33 (20.0%) | 77.0 |
| Bachelor's Degree | 76 (46.1%) | 64.0 |
| Graduate Degree | 39 (23.6%) | 37.0 |
| Total | 165 (100.0%) | 44.0 |
Fertility by Education by Marriage Status in La Canada Flintridge
44.2% of women with births in La Canada Flintridge are unmarried. Women with the educational attainment of graduate degree are most likely to be married with 100.0% of them married at childbirth, while women with the educational attainment of college or associate's degree are least likely to be married with 100.0% of them unmarried at childbirth.
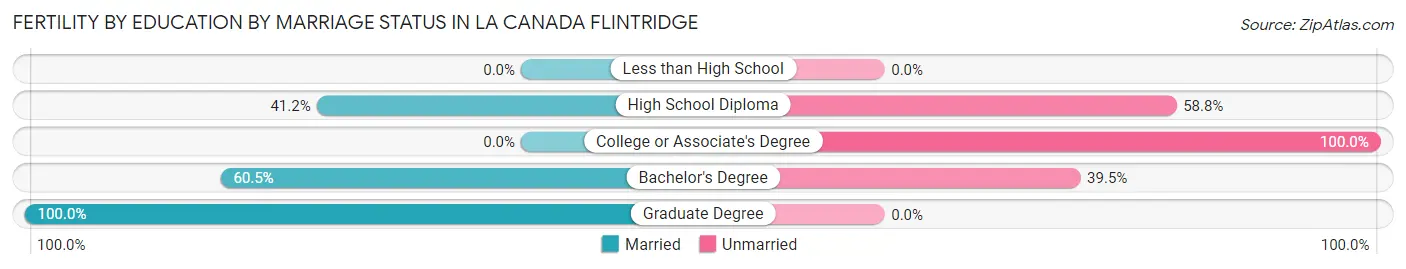
| Educational Attainment | Married | Unmarried |
| Less than High School | 0 (0.0%) | 0 (0.0%) |
| High School Diploma | 7 (41.2%) | 10 (58.8%) |
| College or Associate's Degree | 0 (0.0%) | 33 (100.0%) |
| Bachelor's Degree | 46 (60.5%) | 30 (39.5%) |
| Graduate Degree | 39 (100.0%) | 0 (0.0%) |
| Total | 92 (55.8%) | 73 (44.2%) |
Employment Characteristics in La Canada Flintridge
Employment by Class of Employer in La Canada Flintridge
Among the 8,540 employed individuals in La Canada Flintridge, private company employees (4,587 | 53.7%), self-employed (not incorporated) (1,103 | 12.9%), and not-for-profit organizations (1,078 | 12.6%) make up the most common classes of employment.
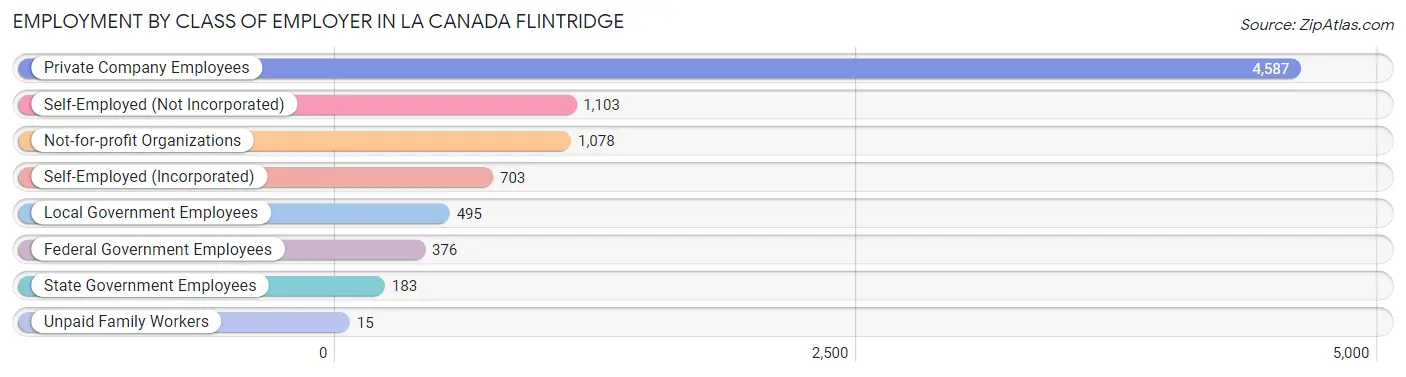
| Employer Class | # Employees | % Employees |
| Private Company Employees | 4,587 | 53.7% |
| Self-Employed (Incorporated) | 703 | 8.2% |
| Self-Employed (Not Incorporated) | 1,103 | 12.9% |
| Not-for-profit Organizations | 1,078 | 12.6% |
| Local Government Employees | 495 | 5.8% |
| State Government Employees | 183 | 2.1% |
| Federal Government Employees | 376 | 4.4% |
| Unpaid Family Workers | 15 | 0.2% |
| Total | 8,540 | 100.0% |
Employment Status by Age in La Canada Flintridge
According to the labor force statistics for La Canada Flintridge, out of the total population over 16 years of age (15,579), 57.9% or 9,020 individuals are in the labor force, with 4.5% or 406 of them unemployed. The age group with the highest labor force participation rate is 35 to 44 years, with 86.3% or 1,833 individuals in the labor force. Within the labor force, the 25 to 29 years age range has the highest percentage of unemployed individuals, with 28.9% or 139 of them being unemployed.
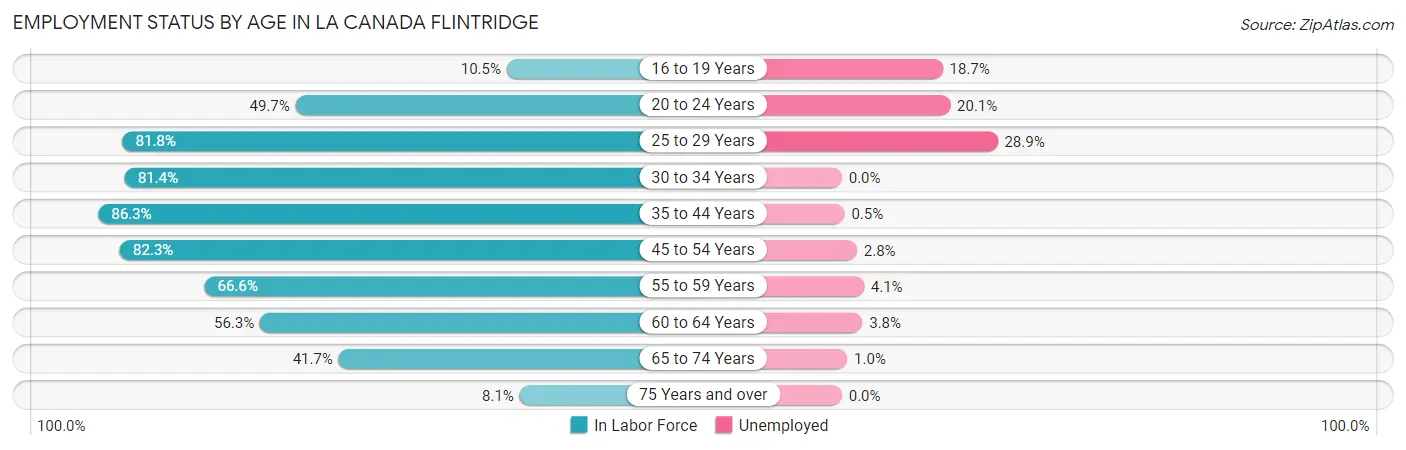
| Age Bracket | In Labor Force | Unemployed |
| 16 to 19 Years | 134 (10.5%) | 25 (18.7%) |
| 20 to 24 Years | 358 (49.7%) | 72 (20.1%) |
| 25 to 29 Years | 481 (81.8%) | 139 (28.9%) |
| 30 to 34 Years | 538 (81.4%) | 0 (0.0%) |
| 35 to 44 Years | 1,833 (86.3%) | 9 (0.5%) |
| 45 to 54 Years | 2,823 (82.3%) | 79 (2.8%) |
| 55 to 59 Years | 964 (66.6%) | 40 (4.1%) |
| 60 to 64 Years | 833 (56.3%) | 32 (3.8%) |
| 65 to 74 Years | 920 (41.7%) | 9 (1.0%) |
| 75 Years and over | 133 (8.1%) | 0 (0.0%) |
| Total | 9,020 (57.9%) | 406 (4.5%) |
Employment Status by Educational Attainment in La Canada Flintridge
According to labor force statistics for La Canada Flintridge, 76.8% of individuals (7,473) out of the total population between 25 and 64 years of age (9,730) are in the labor force, with 4.0% or 299 of them being unemployed. The group with the highest labor force participation rate are those with the educational attainment of bachelor's degree or higher, with 81.8% or 6,077 individuals in the labor force. Within the labor force, individuals with college / associate degree education have the highest percentage of unemployment, with 4.6% or 41 of them being unemployed.
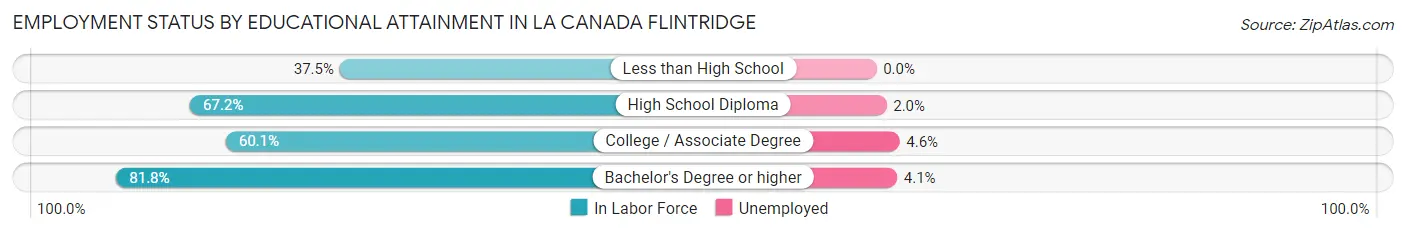
| Educational Attainment | In Labor Force | Unemployed |
| Less than High School | 51 (37.5%) | 0 (0.0%) |
| High School Diploma | 447 (67.2%) | 13 (2.0%) |
| College / Associate Degree | 902 (60.1%) | 69 (4.6%) |
| Bachelor's Degree or higher | 6,077 (81.8%) | 305 (4.1%) |
| Total | 7,473 (76.8%) | 389 (4.0%) |
Employment Occupations by Sex in La Canada Flintridge
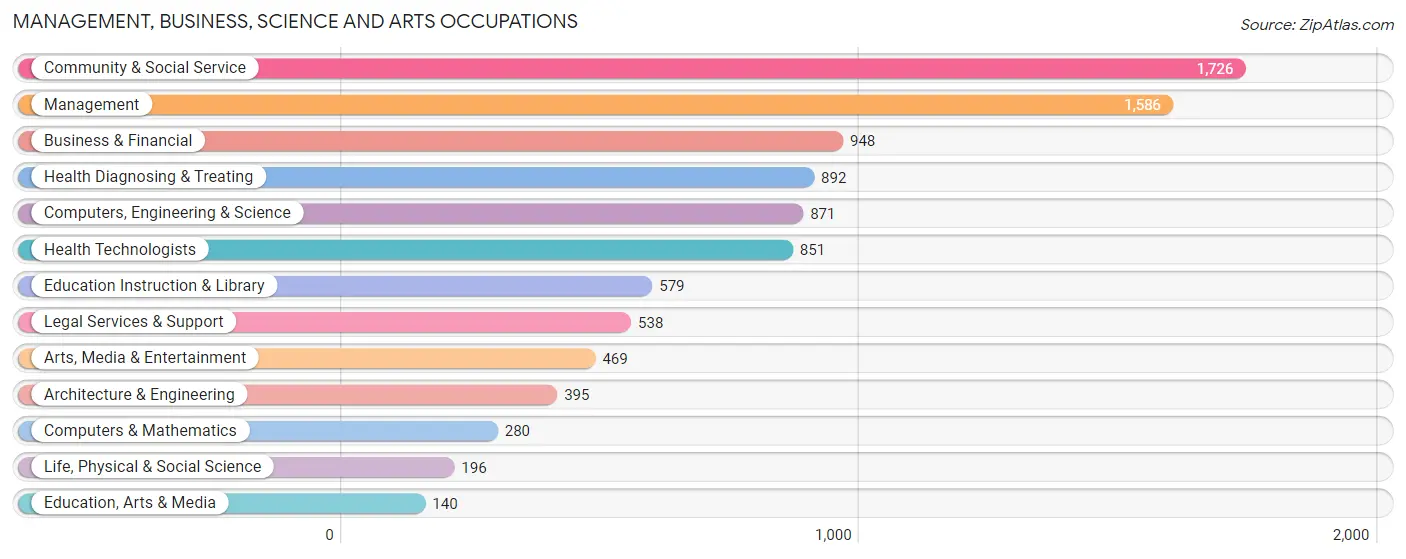
Management, Business, Science and Arts Occupations
The most common Management, Business, Science and Arts occupations in La Canada Flintridge are Community & Social Service (1,726 | 20.1%), Management (1,586 | 18.4%), Business & Financial (948 | 11.0%), Health Diagnosing & Treating (892 | 10.4%), and Computers, Engineering & Science (871 | 10.1%).
Management, Business, Science and Arts Occupations by Sex
Within the Management, Business, Science and Arts occupations in La Canada Flintridge, the most male-oriented occupations are Computers & Mathematics (91.1%), Architecture & Engineering (71.9%), and Computers, Engineering & Science (68.4%), while the most female-oriented occupations are Education, Arts & Media (76.4%), Life, Physical & Social Science (70.9%), and Education Instruction & Library (63.7%).
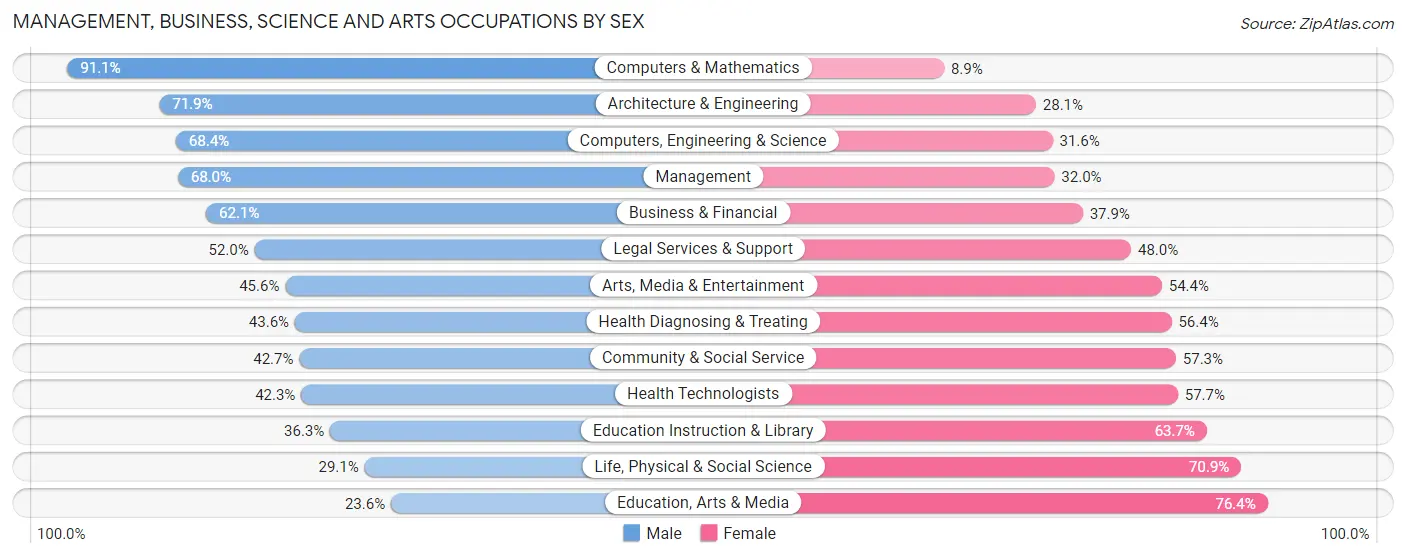
| Occupation | Male | Female |
| Management | 1,079 (68.0%) | 507 (32.0%) |
| Business & Financial | 589 (62.1%) | 359 (37.9%) |
| Computers, Engineering & Science | 596 (68.4%) | 275 (31.6%) |
| Computers & Mathematics | 255 (91.1%) | 25 (8.9%) |
| Architecture & Engineering | 284 (71.9%) | 111 (28.1%) |
| Life, Physical & Social Science | 57 (29.1%) | 139 (70.9%) |
| Community & Social Service | 737 (42.7%) | 989 (57.3%) |
| Education, Arts & Media | 33 (23.6%) | 107 (76.4%) |
| Legal Services & Support | 280 (52.0%) | 258 (48.0%) |
| Education Instruction & Library | 210 (36.3%) | 369 (63.7%) |
| Arts, Media & Entertainment | 214 (45.6%) | 255 (54.4%) |
| Health Diagnosing & Treating | 389 (43.6%) | 503 (56.4%) |
| Health Technologists | 360 (42.3%) | 491 (57.7%) |
| Total (Category) | 3,390 (56.3%) | 2,633 (43.7%) |
| Total (Overall) | 4,827 (56.1%) | 3,782 (43.9%) |
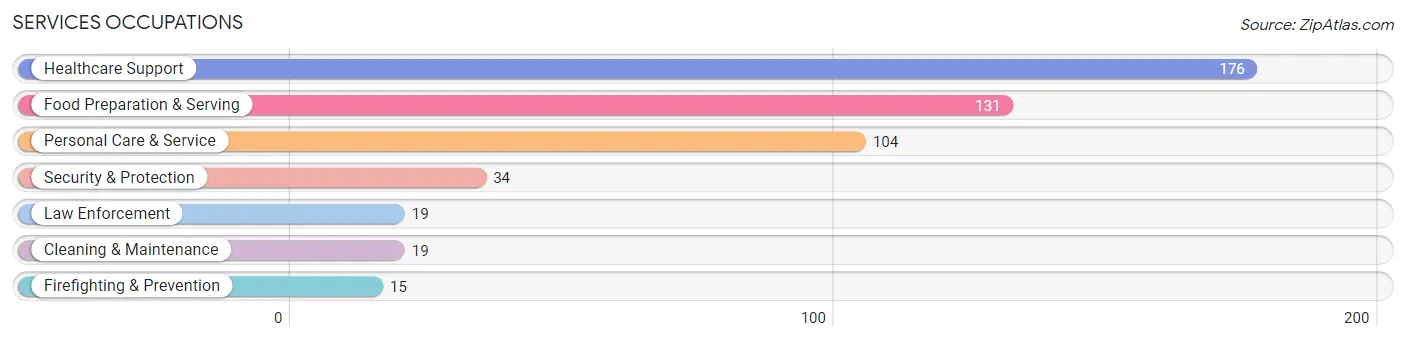
Services Occupations
The most common Services occupations in La Canada Flintridge are Healthcare Support (176 | 2.0%), Food Preparation & Serving (131 | 1.5%), Personal Care & Service (104 | 1.2%), Security & Protection (34 | 0.4%), and Law Enforcement (19 | 0.2%).
Services Occupations by Sex
Within the Services occupations in La Canada Flintridge, the most male-oriented occupations are Security & Protection (100.0%), Firefighting & Prevention (100.0%), and Law Enforcement (100.0%), while the most female-oriented occupations are Personal Care & Service (82.7%), Healthcare Support (75.6%), and Food Preparation & Serving (38.9%).
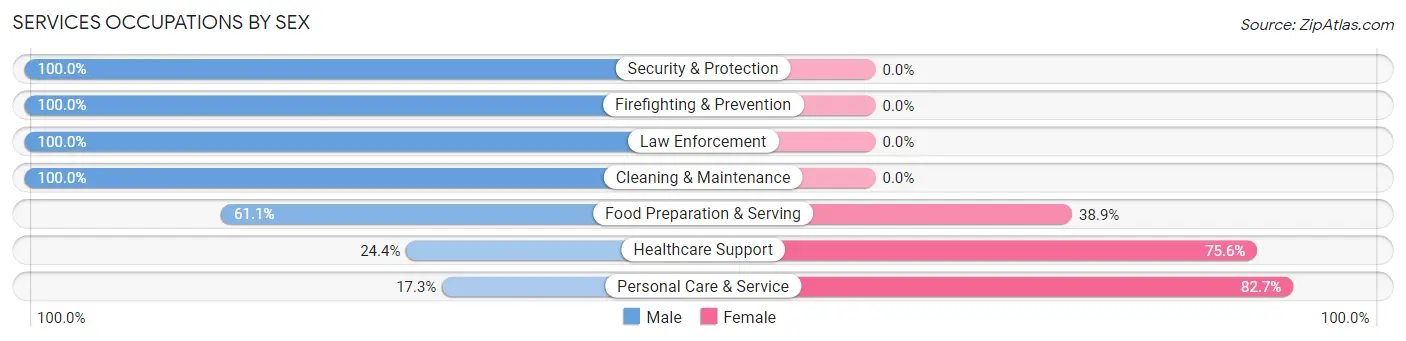
| Occupation | Male | Female |
| Healthcare Support | 43 (24.4%) | 133 (75.6%) |
| Security & Protection | 34 (100.0%) | 0 (0.0%) |
| Firefighting & Prevention | 15 (100.0%) | 0 (0.0%) |
| Law Enforcement | 19 (100.0%) | 0 (0.0%) |
| Food Preparation & Serving | 80 (61.1%) | 51 (38.9%) |
| Cleaning & Maintenance | 19 (100.0%) | 0 (0.0%) |
| Personal Care & Service | 18 (17.3%) | 86 (82.7%) |
| Total (Category) | 194 (41.8%) | 270 (58.2%) |
| Total (Overall) | 4,827 (56.1%) | 3,782 (43.9%) |
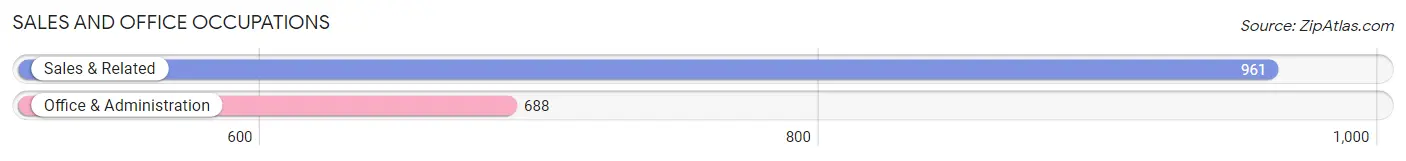
Sales and Office Occupations
The most common Sales and Office occupations in La Canada Flintridge are Sales & Related (961 | 11.2%), and Office & Administration (688 | 8.0%).
Sales and Office Occupations by Sex
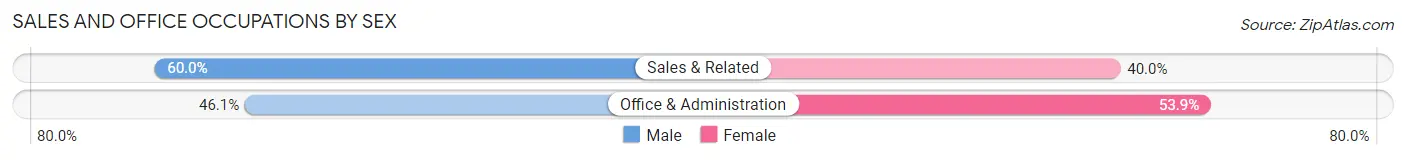
| Occupation | Male | Female |
| Sales & Related | 577 (60.0%) | 384 (40.0%) |
| Office & Administration | 317 (46.1%) | 371 (53.9%) |
| Total (Category) | 894 (54.2%) | 755 (45.8%) |
| Total (Overall) | 4,827 (56.1%) | 3,782 (43.9%) |
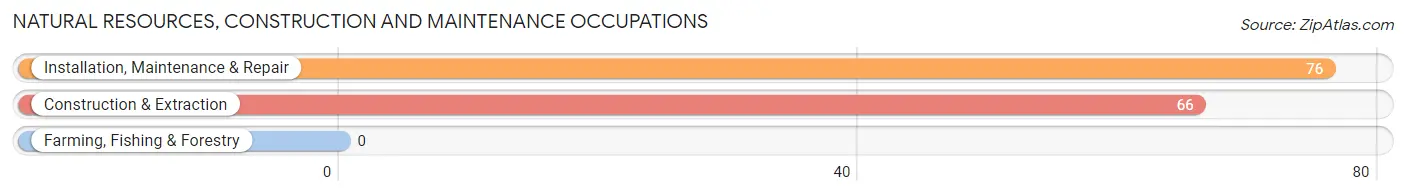
Natural Resources, Construction and Maintenance Occupations
The most common Natural Resources, Construction and Maintenance occupations in La Canada Flintridge are Installation, Maintenance & Repair (76 | 0.9%), and Construction & Extraction (66 | 0.8%).
Natural Resources, Construction and Maintenance Occupations by Sex
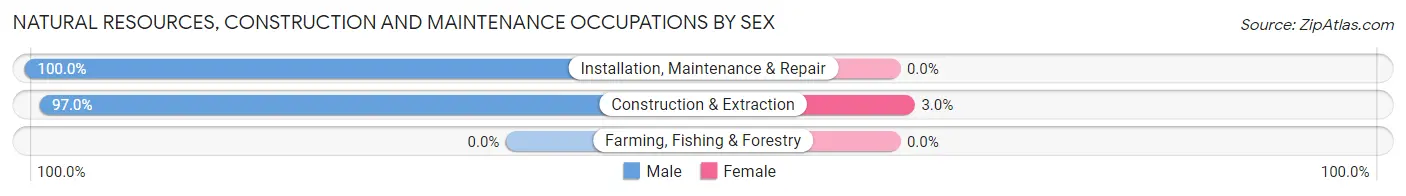
| Occupation | Male | Female |
| Farming, Fishing & Forestry | 0 (0.0%) | 0 (0.0%) |
| Construction & Extraction | 64 (97.0%) | 2 (3.0%) |
| Installation, Maintenance & Repair | 76 (100.0%) | 0 (0.0%) |
| Total (Category) | 140 (98.6%) | 2 (1.4%) |
| Total (Overall) | 4,827 (56.1%) | 3,782 (43.9%) |
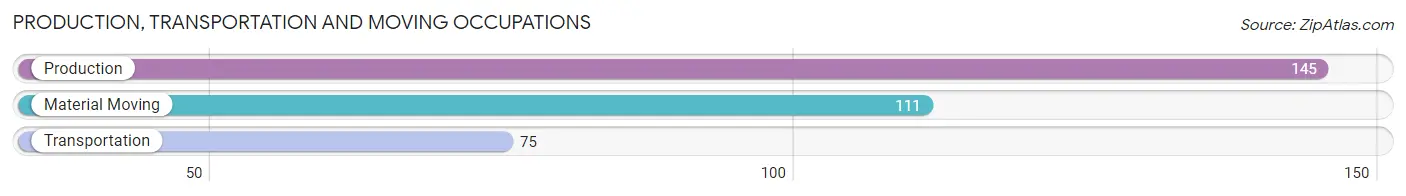
Production, Transportation and Moving Occupations
The most common Production, Transportation and Moving occupations in La Canada Flintridge are Production (145 | 1.7%), Material Moving (111 | 1.3%), and Transportation (75 | 0.9%).
Production, Transportation and Moving Occupations by Sex
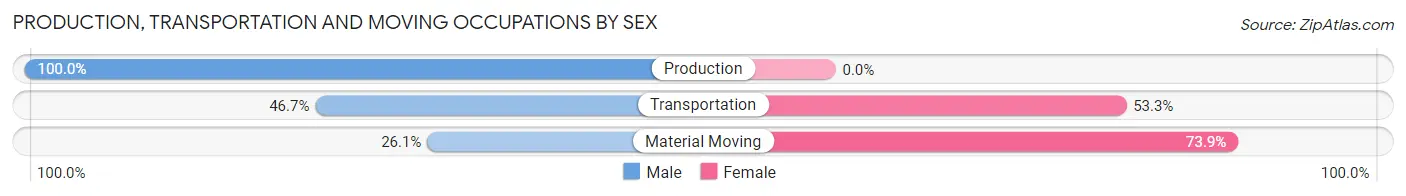
| Occupation | Male | Female |
| Production | 145 (100.0%) | 0 (0.0%) |
| Transportation | 35 (46.7%) | 40 (53.3%) |
| Material Moving | 29 (26.1%) | 82 (73.9%) |
| Total (Category) | 209 (63.1%) | 122 (36.9%) |
| Total (Overall) | 4,827 (56.1%) | 3,782 (43.9%) |
Employment Industries by Sex in La Canada Flintridge
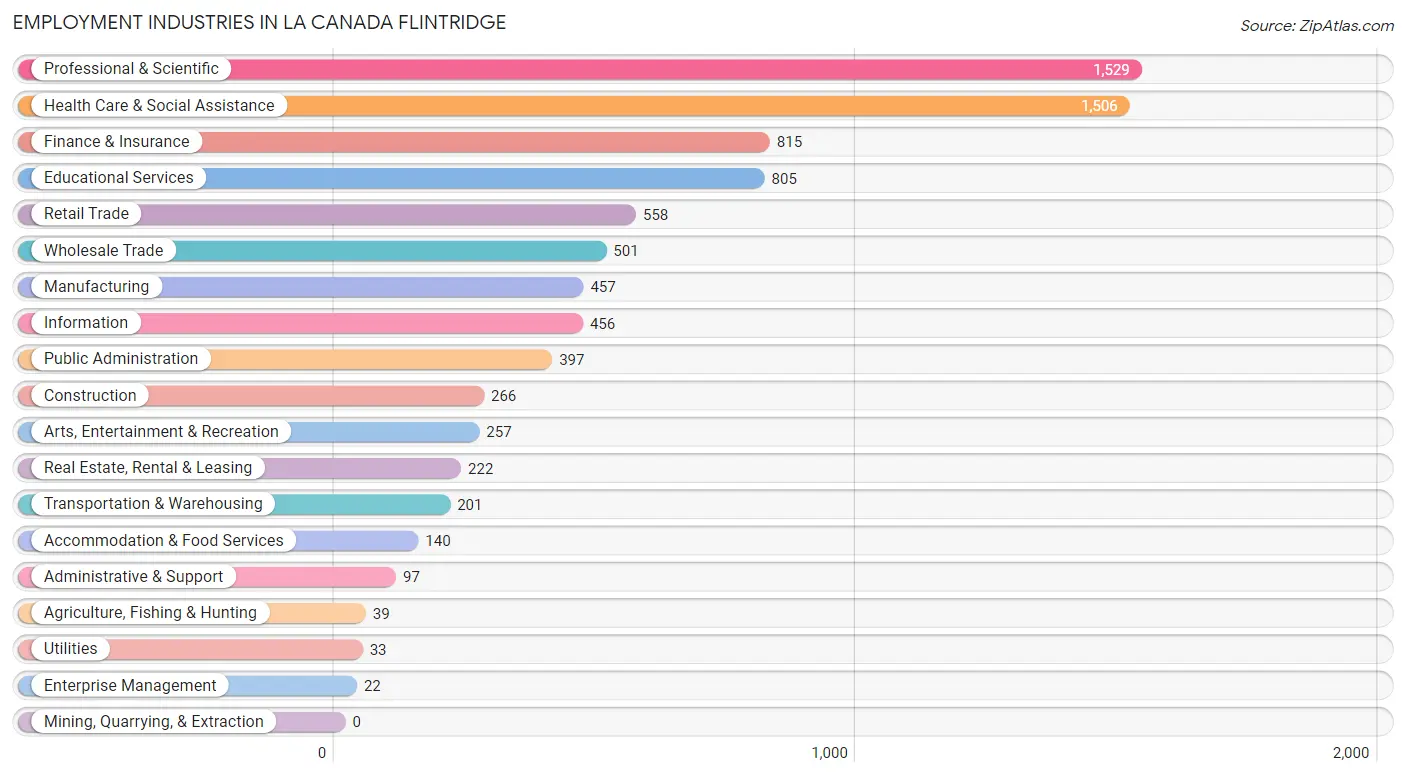
Employment Industries in La Canada Flintridge
The major employment industries in La Canada Flintridge include Professional & Scientific (1,529 | 17.8%), Health Care & Social Assistance (1,506 | 17.5%), Finance & Insurance (815 | 9.5%), Educational Services (805 | 9.3%), and Retail Trade (558 | 6.5%).
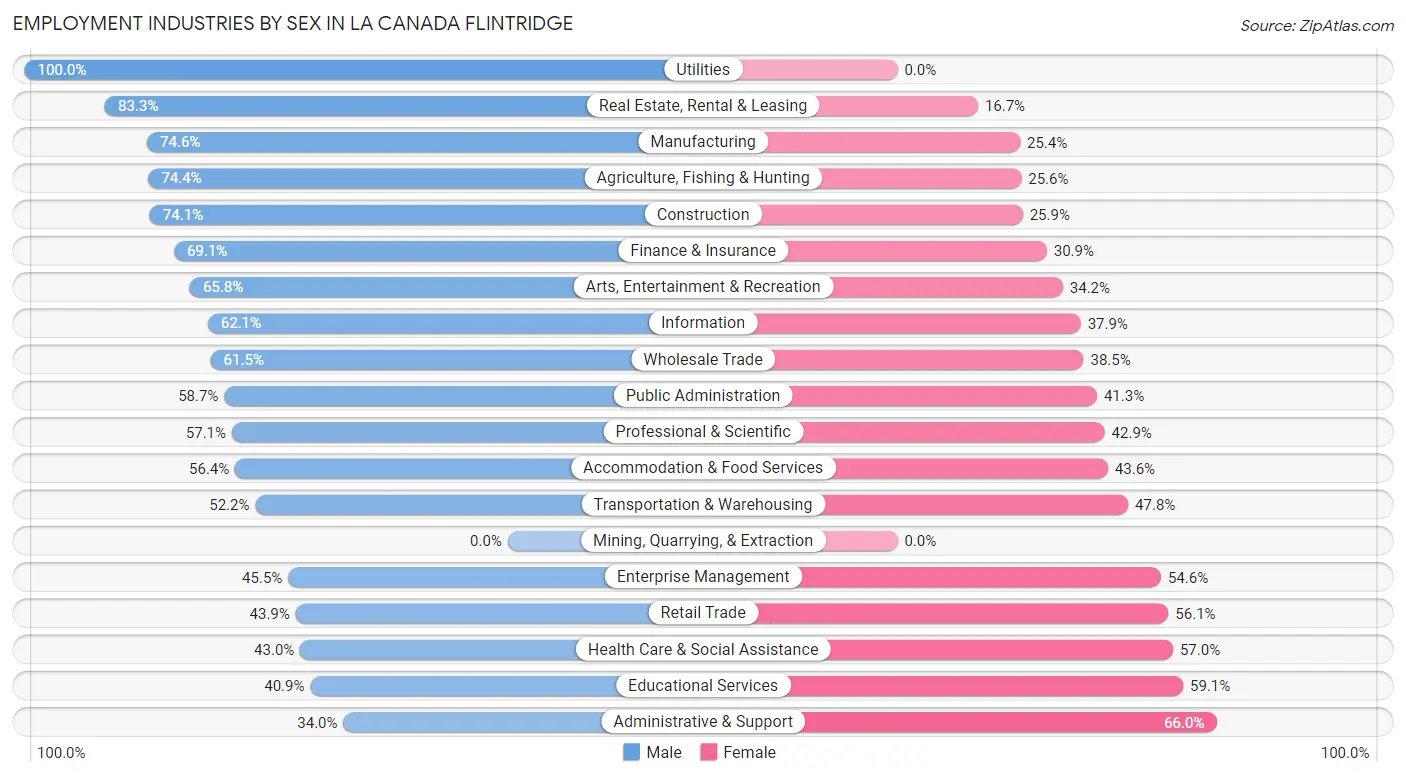
Employment Industries by Sex in La Canada Flintridge
The La Canada Flintridge industries that see more men than women are Utilities (100.0%), Real Estate, Rental & Leasing (83.3%), and Manufacturing (74.6%), whereas the industries that tend to have a higher number of women are Administrative & Support (66.0%), Educational Services (59.1%), and Health Care & Social Assistance (57.0%).
| Industry | Male | Female |
| Agriculture, Fishing & Hunting | 29 (74.4%) | 10 (25.6%) |
| Mining, Quarrying, & Extraction | 0 (0.0%) | 0 (0.0%) |
| Construction | 197 (74.1%) | 69 (25.9%) |
| Manufacturing | 341 (74.6%) | 116 (25.4%) |
| Wholesale Trade | 308 (61.5%) | 193 (38.5%) |
| Retail Trade | 245 (43.9%) | 313 (56.1%) |
| Transportation & Warehousing | 105 (52.2%) | 96 (47.8%) |
| Utilities | 33 (100.0%) | 0 (0.0%) |
| Information | 283 (62.1%) | 173 (37.9%) |
| Finance & Insurance | 563 (69.1%) | 252 (30.9%) |
| Real Estate, Rental & Leasing | 185 (83.3%) | 37 (16.7%) |
| Professional & Scientific | 873 (57.1%) | 656 (42.9%) |
| Enterprise Management | 10 (45.5%) | 12 (54.5%) |
| Administrative & Support | 33 (34.0%) | 64 (66.0%) |
| Educational Services | 329 (40.9%) | 476 (59.1%) |
| Health Care & Social Assistance | 647 (43.0%) | 859 (57.0%) |
| Arts, Entertainment & Recreation | 169 (65.8%) | 88 (34.2%) |
| Accommodation & Food Services | 79 (56.4%) | 61 (43.6%) |
| Public Administration | 233 (58.7%) | 164 (41.3%) |
| Total | 4,827 (56.1%) | 3,782 (43.9%) |
Education in La Canada Flintridge
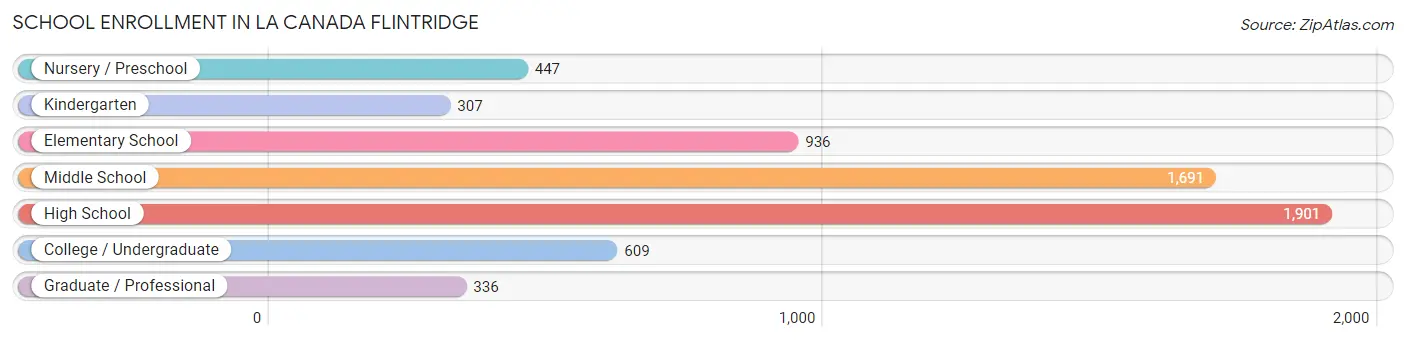
School Enrollment in La Canada Flintridge
The most common levels of schooling among the 6,227 students in La Canada Flintridge are high school (1,901 | 30.5%), middle school (1,691 | 27.2%), and elementary school (936 | 15.0%).
| School Level | # Students | % Students |
| Nursery / Preschool | 447 | 7.2% |
| Kindergarten | 307 | 4.9% |
| Elementary School | 936 | 15.0% |
| Middle School | 1,691 | 27.2% |
| High School | 1,901 | 30.5% |
| College / Undergraduate | 609 | 9.8% |
| Graduate / Professional | 336 | 5.4% |
| Total | 6,227 | 100.0% |
School Enrollment by Age by Funding Source in La Canada Flintridge
Out of a total of 6,227 students who are enrolled in schools in La Canada Flintridge, 1,146 (18.4%) attend a private institution, while the remaining 5,081 (81.6%) are enrolled in public schools. The age group of 35 years and over has the highest likelihood of being enrolled in private schools, with 152 (57.4% in the age bracket) enrolled. Conversely, the age group of 10 to 14 year olds has the lowest likelihood of being enrolled in a private school, with 1,812 (90.5% in the age bracket) attending a public institution.
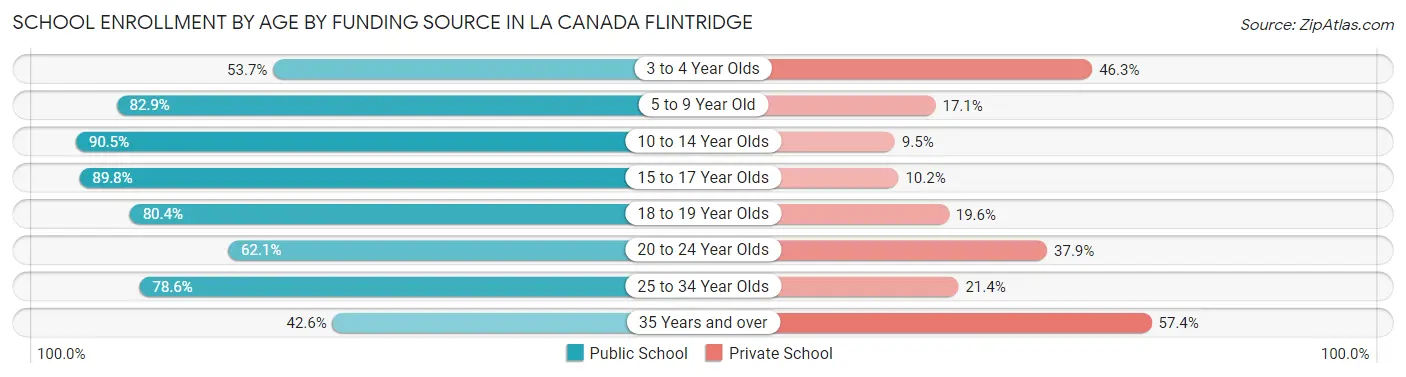
| Age Bracket | Public School | Private School |
| 3 to 4 Year Olds | 203 (53.7%) | 175 (46.3%) |
| 5 to 9 Year Old | 1,066 (82.9%) | 220 (17.1%) |
| 10 to 14 Year Olds | 1,812 (90.5%) | 191 (9.5%) |
| 15 to 17 Year Olds | 1,187 (89.8%) | 135 (10.2%) |
| 18 to 19 Year Olds | 308 (80.4%) | 75 (19.6%) |
| 20 to 24 Year Olds | 259 (62.1%) | 158 (37.9%) |
| 25 to 34 Year Olds | 136 (78.6%) | 37 (21.4%) |
| 35 Years and over | 113 (42.6%) | 152 (57.4%) |
| Total | 5,081 (81.6%) | 1,146 (18.4%) |
Educational Attainment by Field of Study in La Canada Flintridge
Business (2,118 | 19.8%), social sciences (1,706 | 15.9%), engineering (937 | 8.7%), bio, nature & agricultural (819 | 7.6%), and science & technology (763 | 7.1%) are the most common fields of study among 10,709 individuals in La Canada Flintridge who have obtained a bachelor's degree or higher.
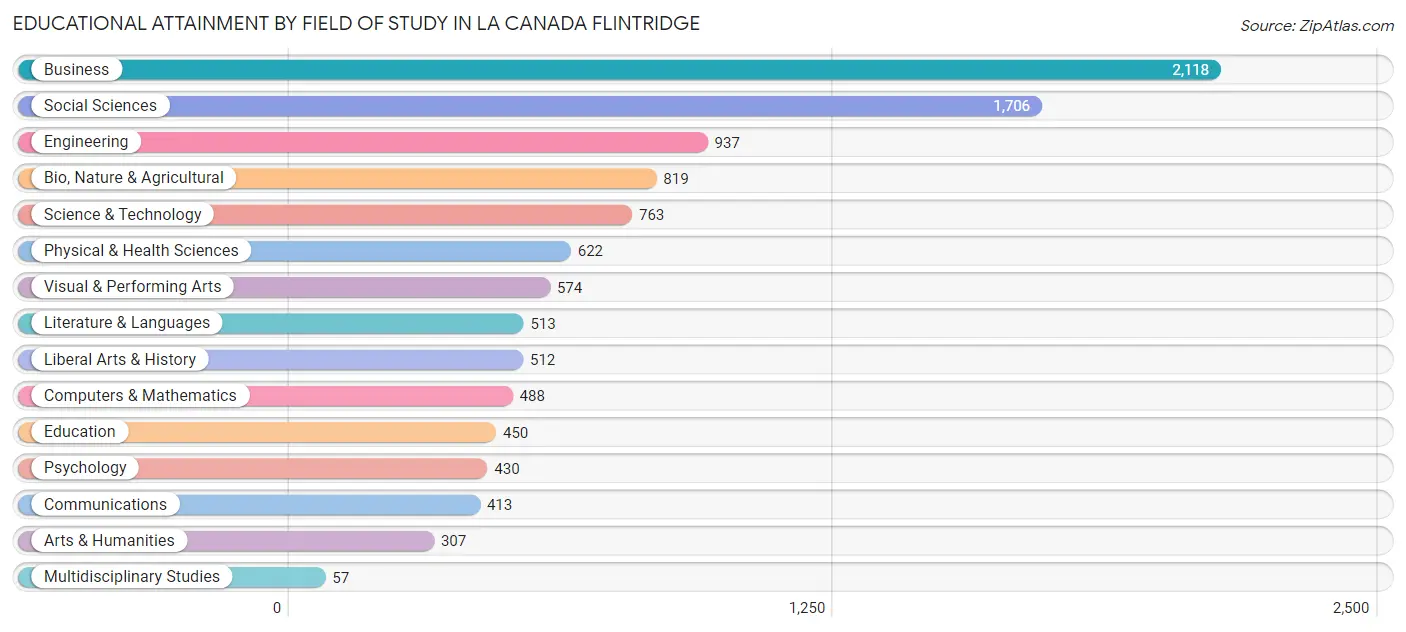
| Field of Study | # Graduates | % Graduates |
| Computers & Mathematics | 488 | 4.6% |
| Bio, Nature & Agricultural | 819 | 7.6% |
| Physical & Health Sciences | 622 | 5.8% |
| Psychology | 430 | 4.0% |
| Social Sciences | 1,706 | 15.9% |
| Engineering | 937 | 8.7% |
| Multidisciplinary Studies | 57 | 0.5% |
| Science & Technology | 763 | 7.1% |
| Business | 2,118 | 19.8% |
| Education | 450 | 4.2% |
| Literature & Languages | 513 | 4.8% |
| Liberal Arts & History | 512 | 4.8% |
| Visual & Performing Arts | 574 | 5.4% |
| Communications | 413 | 3.9% |
| Arts & Humanities | 307 | 2.9% |
| Total | 10,709 | 100.0% |
Transportation & Commute in La Canada Flintridge
Vehicle Availability by Sex in La Canada Flintridge
The most prevalent vehicle ownership categories in La Canada Flintridge are males with 2 vehicles (2,097, accounting for 43.6%) and females with 2 vehicles (1,596, making up 56.5%).
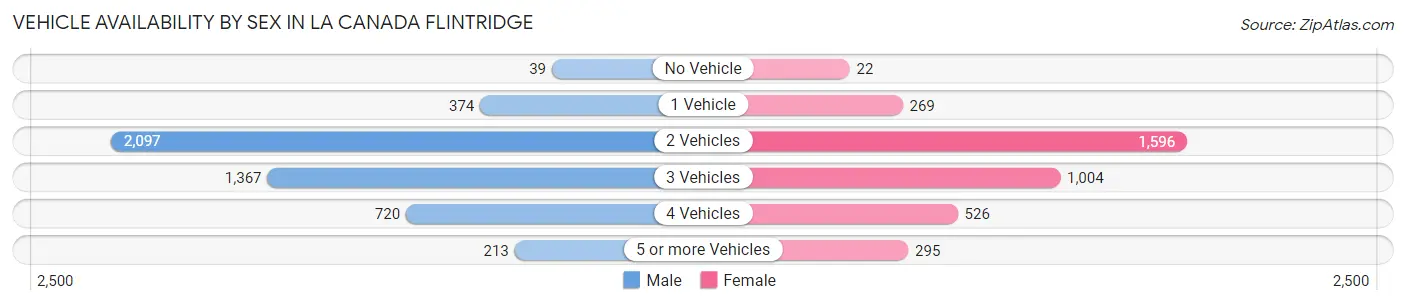
| Vehicles Available | Male | Female |
| No Vehicle | 39 (0.8%) | 22 (0.6%) |
| 1 Vehicle | 374 (7.8%) | 269 (7.2%) |
| 2 Vehicles | 2,097 (43.6%) | 1,596 (43.0%) |
| 3 Vehicles | 1,367 (28.4%) | 1,004 (27.1%) |
| 4 Vehicles | 720 (15.0%) | 526 (14.2%) |
| 5 or more Vehicles | 213 (4.4%) | 295 (8.0%) |
| Total | 4,810 (100.0%) | 3,712 (100.0%) |
Commute Time in La Canada Flintridge
The most frequently occuring commute durations in La Canada Flintridge are 30 to 34 minutes (1,141 commuters, 17.7%), 10 to 14 minutes (804 commuters, 12.5%), and 20 to 24 minutes (749 commuters, 11.6%).
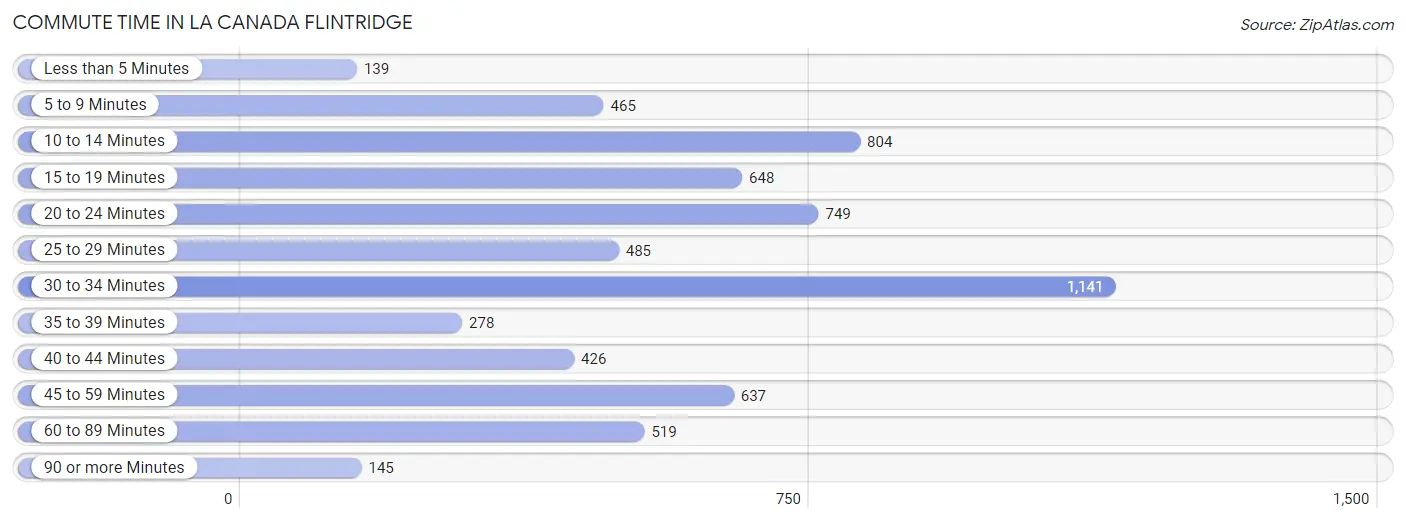
| Commute Time | # Commuters | % Commuters |
| Less than 5 Minutes | 139 | 2.2% |
| 5 to 9 Minutes | 465 | 7.2% |
| 10 to 14 Minutes | 804 | 12.5% |
| 15 to 19 Minutes | 648 | 10.1% |
| 20 to 24 Minutes | 749 | 11.6% |
| 25 to 29 Minutes | 485 | 7.5% |
| 30 to 34 Minutes | 1,141 | 17.7% |
| 35 to 39 Minutes | 278 | 4.3% |
| 40 to 44 Minutes | 426 | 6.6% |
| 45 to 59 Minutes | 637 | 9.9% |
| 60 to 89 Minutes | 519 | 8.1% |
| 90 or more Minutes | 145 | 2.2% |
Commute Time by Sex in La Canada Flintridge
The most common commute times in La Canada Flintridge are 20 to 24 minutes (538 commuters, 14.6%) for males and 30 to 34 minutes (619 commuters, 22.5%) for females.
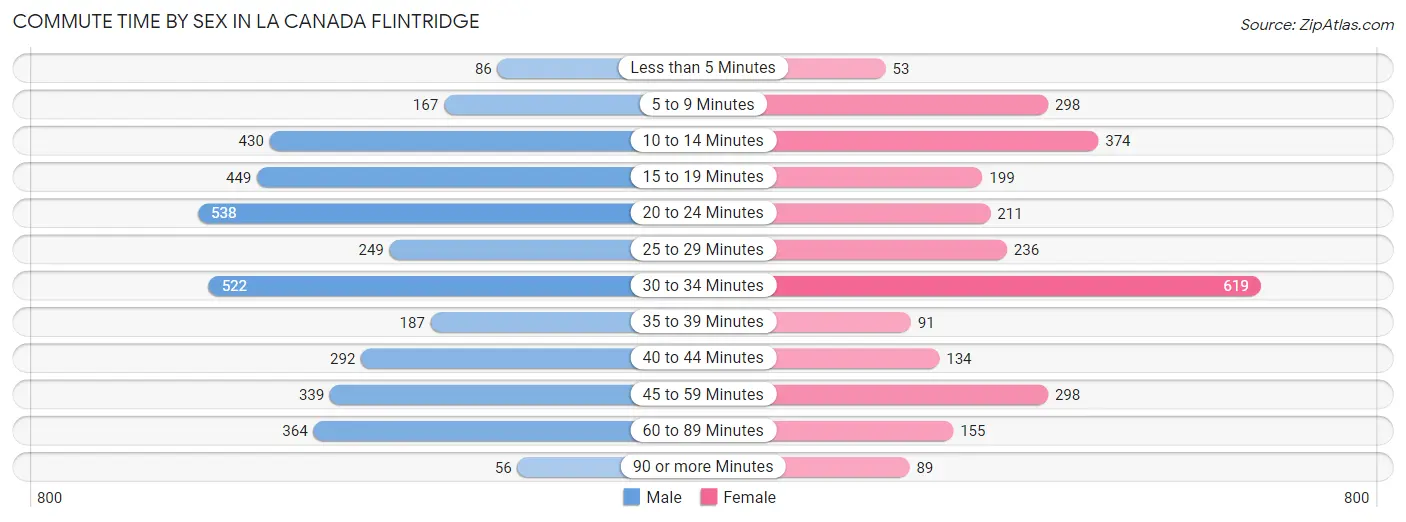
| Commute Time | Male | Female |
| Less than 5 Minutes | 86 (2.3%) | 53 (1.9%) |
| 5 to 9 Minutes | 167 (4.5%) | 298 (10.8%) |
| 10 to 14 Minutes | 430 (11.7%) | 374 (13.6%) |
| 15 to 19 Minutes | 449 (12.2%) | 199 (7.2%) |
| 20 to 24 Minutes | 538 (14.6%) | 211 (7.6%) |
| 25 to 29 Minutes | 249 (6.8%) | 236 (8.6%) |
| 30 to 34 Minutes | 522 (14.2%) | 619 (22.5%) |
| 35 to 39 Minutes | 187 (5.1%) | 91 (3.3%) |
| 40 to 44 Minutes | 292 (7.9%) | 134 (4.9%) |
| 45 to 59 Minutes | 339 (9.2%) | 298 (10.8%) |
| 60 to 89 Minutes | 364 (9.9%) | 155 (5.6%) |
| 90 or more Minutes | 56 (1.5%) | 89 (3.2%) |
Time of Departure to Work by Sex in La Canada Flintridge
The most frequent times of departure to work in La Canada Flintridge are 8:00 AM to 8:29 AM (766, 20.8%) for males and 9:00 AM to 9:59 AM (520, 18.9%) for females.
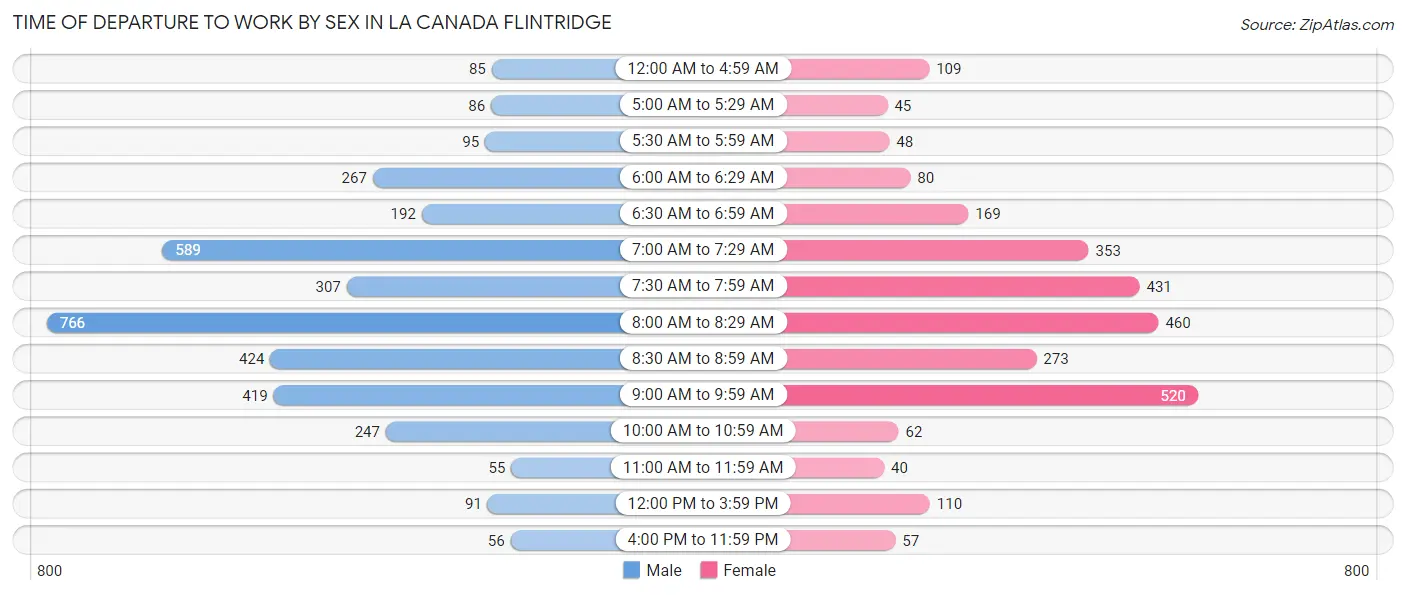
| Time of Departure | Male | Female |
| 12:00 AM to 4:59 AM | 85 (2.3%) | 109 (4.0%) |
| 5:00 AM to 5:29 AM | 86 (2.3%) | 45 (1.6%) |
| 5:30 AM to 5:59 AM | 95 (2.6%) | 48 (1.7%) |
| 6:00 AM to 6:29 AM | 267 (7.3%) | 80 (2.9%) |
| 6:30 AM to 6:59 AM | 192 (5.2%) | 169 (6.1%) |
| 7:00 AM to 7:29 AM | 589 (16.0%) | 353 (12.8%) |
| 7:30 AM to 7:59 AM | 307 (8.3%) | 431 (15.6%) |
| 8:00 AM to 8:29 AM | 766 (20.8%) | 460 (16.7%) |
| 8:30 AM to 8:59 AM | 424 (11.5%) | 273 (9.9%) |
| 9:00 AM to 9:59 AM | 419 (11.4%) | 520 (18.9%) |
| 10:00 AM to 10:59 AM | 247 (6.7%) | 62 (2.2%) |
| 11:00 AM to 11:59 AM | 55 (1.5%) | 40 (1.5%) |
| 12:00 PM to 3:59 PM | 91 (2.5%) | 110 (4.0%) |
| 4:00 PM to 11:59 PM | 56 (1.5%) | 57 (2.1%) |
| Total | 3,679 (100.0%) | 2,757 (100.0%) |
Housing Occupancy in La Canada Flintridge
Occupancy by Ownership in La Canada Flintridge
Of the total 6,451 dwellings in La Canada Flintridge, owner-occupied units account for 5,739 (89.0%), while renter-occupied units make up 712 (11.0%).
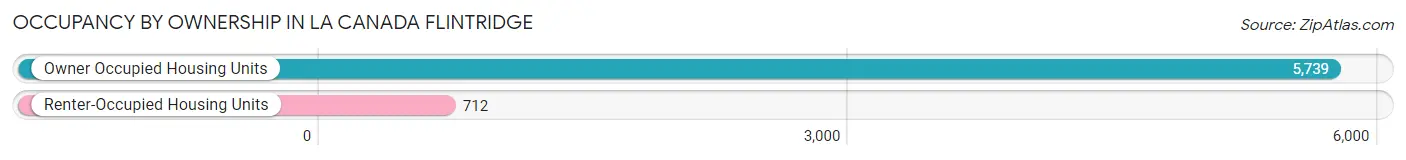
| Occupancy | # Housing Units | % Housing Units |
| Owner Occupied Housing Units | 5,739 | 89.0% |
| Renter-Occupied Housing Units | 712 | 11.0% |
| Total Occupied Housing Units | 6,451 | 100.0% |
Occupancy by Household Size in La Canada Flintridge
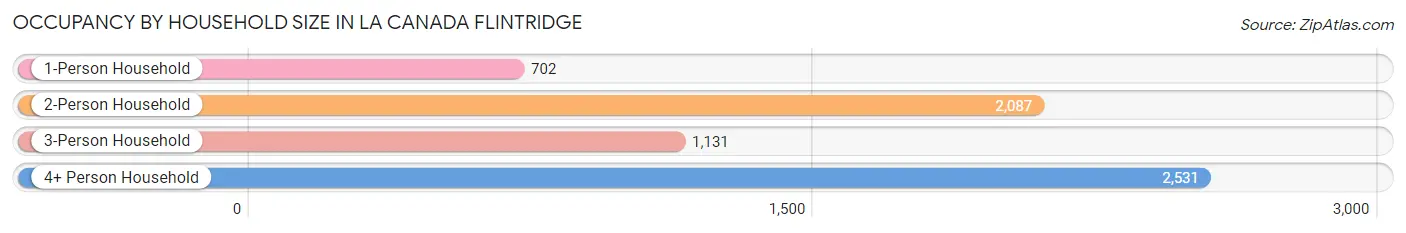
| Household Size | # Housing Units | % Housing Units |
| 1-Person Household | 702 | 10.9% |
| 2-Person Household | 2,087 | 32.4% |
| 3-Person Household | 1,131 | 17.5% |
| 4+ Person Household | 2,531 | 39.2% |
| Total Housing Units | 6,451 | 100.0% |
Occupancy by Ownership by Household Size in La Canada Flintridge
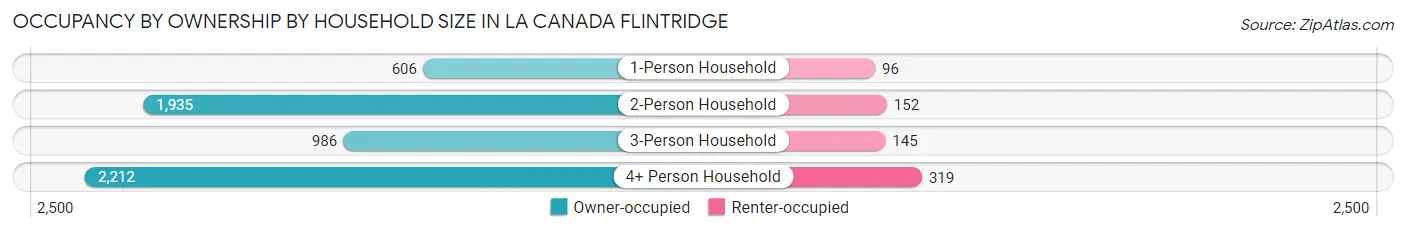
| Household Size | Owner-occupied | Renter-occupied |
| 1-Person Household | 606 (86.3%) | 96 (13.7%) |
| 2-Person Household | 1,935 (92.7%) | 152 (7.3%) |
| 3-Person Household | 986 (87.2%) | 145 (12.8%) |
| 4+ Person Household | 2,212 (87.4%) | 319 (12.6%) |
| Total Housing Units | 5,739 (89.0%) | 712 (11.0%) |
Occupancy by Educational Attainment in La Canada Flintridge
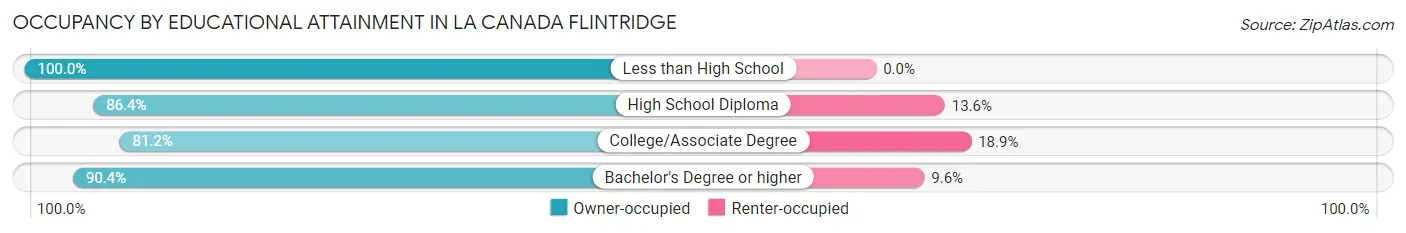
| Household Size | Owner-occupied | Renter-occupied |
| Less than High School | 34 (100.0%) | 0 (0.0%) |
| High School Diploma | 311 (86.4%) | 49 (13.6%) |
| College/Associate Degree | 732 (81.1%) | 170 (18.9%) |
| Bachelor's Degree or higher | 4,662 (90.4%) | 493 (9.6%) |
Occupancy by Age of Householder in La Canada Flintridge
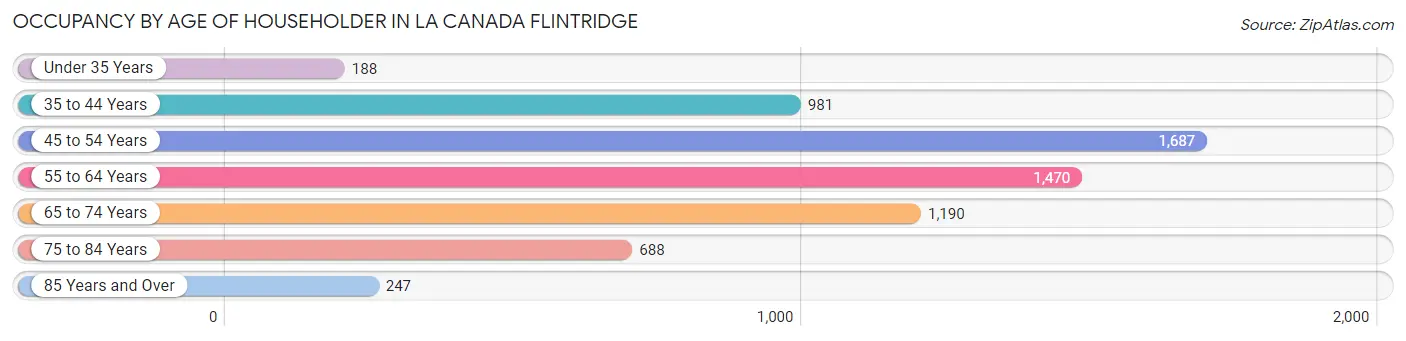
| Age Bracket | # Households | % Households |
| Under 35 Years | 188 | 2.9% |
| 35 to 44 Years | 981 | 15.2% |
| 45 to 54 Years | 1,687 | 26.2% |
| 55 to 64 Years | 1,470 | 22.8% |
| 65 to 74 Years | 1,190 | 18.4% |
| 75 to 84 Years | 688 | 10.7% |
| 85 Years and Over | 247 | 3.8% |
| Total | 6,451 | 100.0% |
Housing Finances in La Canada Flintridge
Median Income by Occupancy in La Canada Flintridge
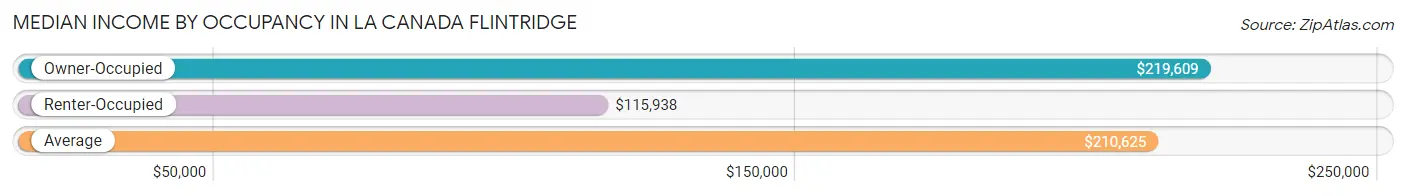
| Occupancy Type | # Households | Median Income |
| Owner-Occupied | 5,739 (89.0%) | $219,609 |
| Renter-Occupied | 712 (11.0%) | $115,938 |
| Average | 6,451 (100.0%) | $210,625 |
Occupancy by Householder Income Bracket in La Canada Flintridge
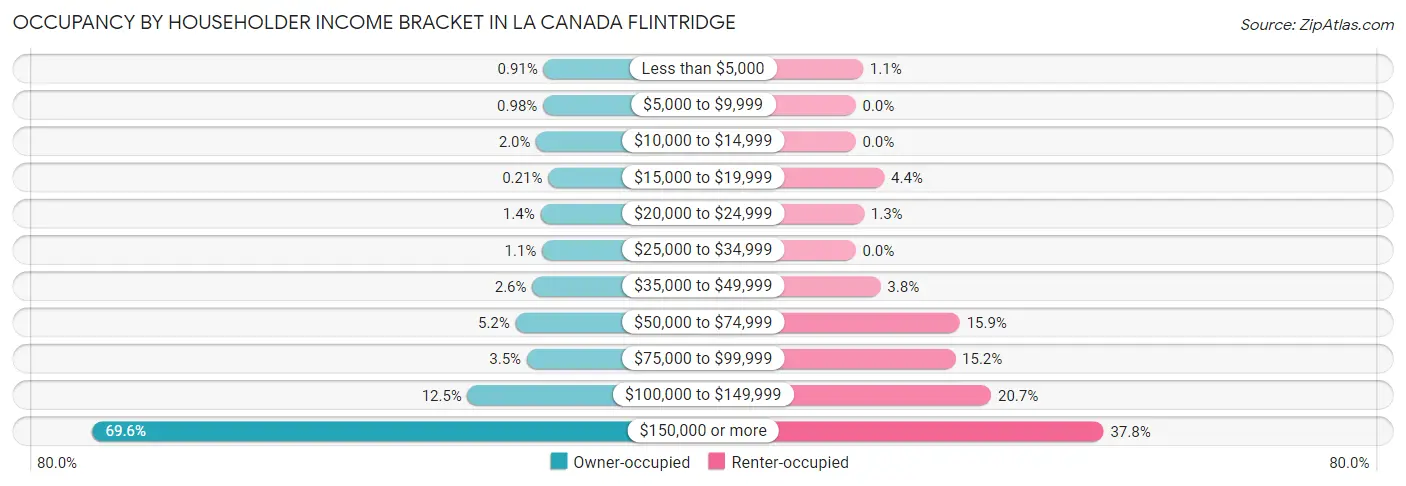
| Income Bracket | Owner-occupied | Renter-occupied |
| Less than $5,000 | 52 (0.9%) | 8 (1.1%) |
| $5,000 to $9,999 | 56 (1.0%) | 0 (0.0%) |
| $10,000 to $14,999 | 116 (2.0%) | 0 (0.0%) |
| $15,000 to $19,999 | 12 (0.2%) | 31 (4.3%) |
| $20,000 to $24,999 | 80 (1.4%) | 9 (1.3%) |
| $25,000 to $34,999 | 65 (1.1%) | 0 (0.0%) |
| $35,000 to $49,999 | 151 (2.6%) | 27 (3.8%) |
| $50,000 to $74,999 | 297 (5.2%) | 113 (15.9%) |
| $75,000 to $99,999 | 198 (3.5%) | 108 (15.2%) |
| $100,000 to $149,999 | 716 (12.5%) | 147 (20.6%) |
| $150,000 or more | 3,996 (69.6%) | 269 (37.8%) |
| Total | 5,739 (100.0%) | 712 (100.0%) |
Monthly Housing Cost Tiers in La Canada Flintridge
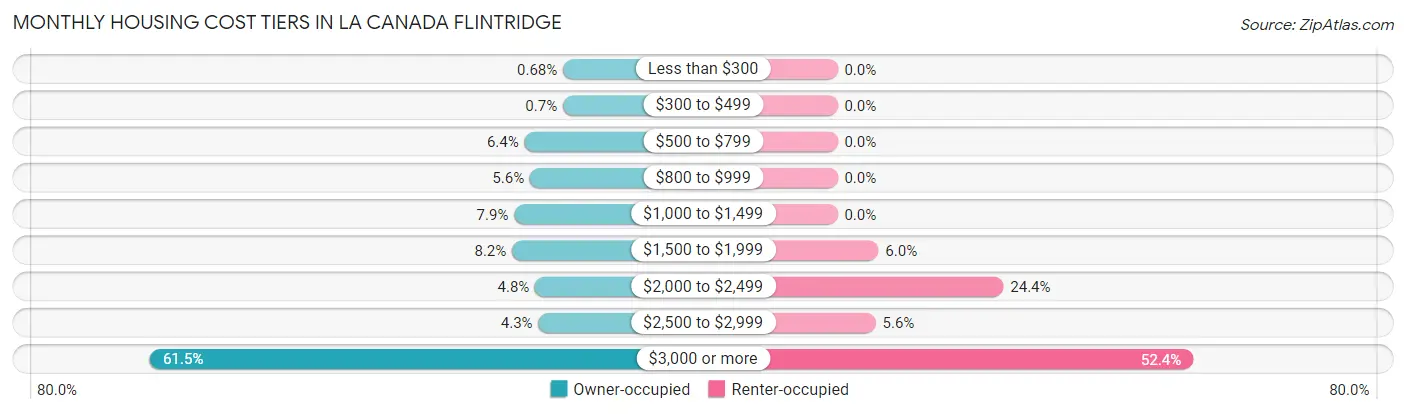
| Monthly Cost | Owner-occupied | Renter-occupied |
| Less than $300 | 39 (0.7%) | 0 (0.0%) |
| $300 to $499 | 40 (0.7%) | 0 (0.0%) |
| $500 to $799 | 365 (6.4%) | 0 (0.0%) |
| $800 to $999 | 319 (5.6%) | 0 (0.0%) |
| $1,000 to $1,499 | 452 (7.9%) | 0 (0.0%) |
| $1,500 to $1,999 | 470 (8.2%) | 43 (6.0%) |
| $2,000 to $2,499 | 275 (4.8%) | 174 (24.4%) |
| $2,500 to $2,999 | 248 (4.3%) | 40 (5.6%) |
| $3,000 or more | 3,531 (61.5%) | 373 (52.4%) |
| Total | 5,739 (100.0%) | 712 (100.0%) |
Physical Housing Characteristics in La Canada Flintridge
Housing Structures in La Canada Flintridge
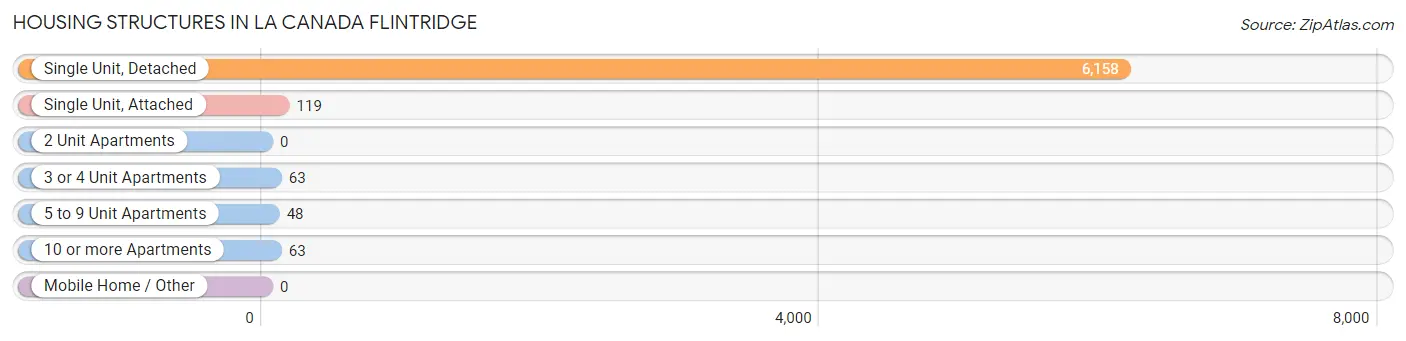
| Structure Type | # Housing Units | % Housing Units |
| Single Unit, Detached | 6,158 | 95.5% |
| Single Unit, Attached | 119 | 1.8% |
| 2 Unit Apartments | 0 | 0.0% |
| 3 or 4 Unit Apartments | 63 | 1.0% |
| 5 to 9 Unit Apartments | 48 | 0.7% |
| 10 or more Apartments | 63 | 1.0% |
| Mobile Home / Other | 0 | 0.0% |
| Total | 6,451 | 100.0% |
Housing Structures by Occupancy in La Canada Flintridge
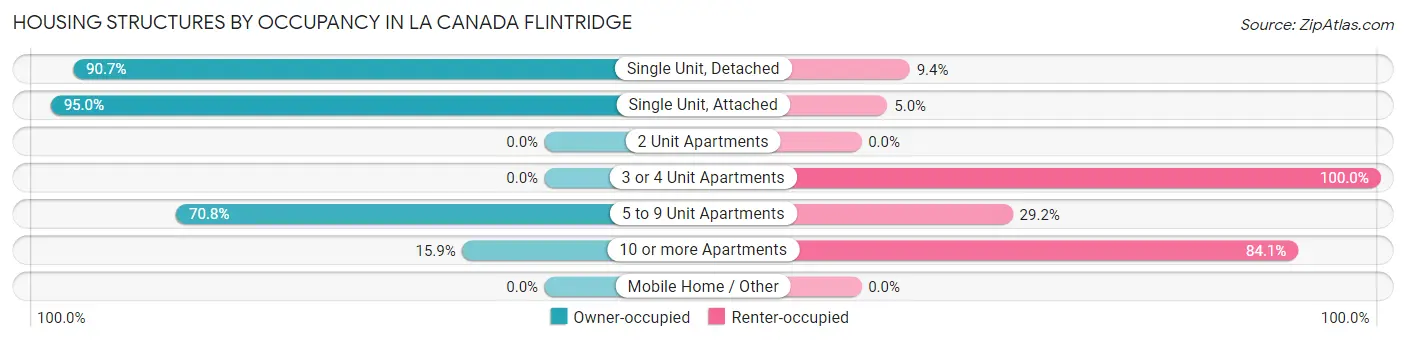
| Structure Type | Owner-occupied | Renter-occupied |
| Single Unit, Detached | 5,582 (90.6%) | 576 (9.3%) |
| Single Unit, Attached | 113 (95.0%) | 6 (5.0%) |
| 2 Unit Apartments | 0 (0.0%) | 0 (0.0%) |
| 3 or 4 Unit Apartments | 0 (0.0%) | 63 (100.0%) |
| 5 to 9 Unit Apartments | 34 (70.8%) | 14 (29.2%) |
| 10 or more Apartments | 10 (15.9%) | 53 (84.1%) |
| Mobile Home / Other | 0 (0.0%) | 0 (0.0%) |
| Total | 5,739 (89.0%) | 712 (11.0%) |
Housing Structures by Number of Rooms in La Canada Flintridge
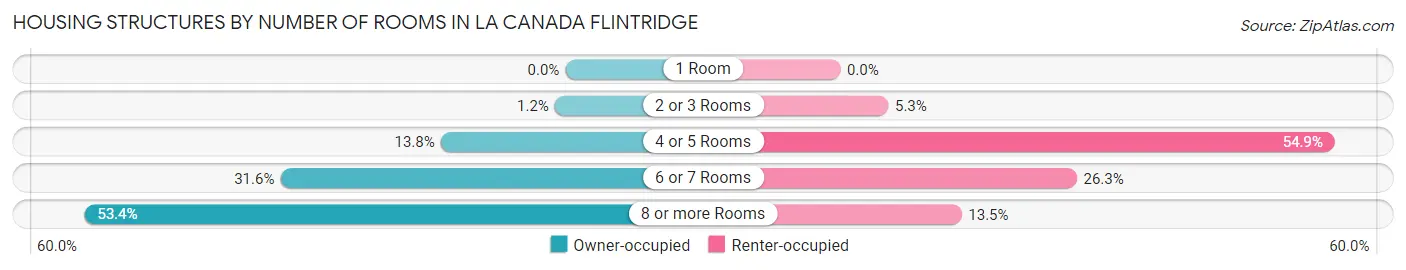
| Number of Rooms | Owner-occupied | Renter-occupied |
| 1 Room | 0 (0.0%) | 0 (0.0%) |
| 2 or 3 Rooms | 67 (1.2%) | 38 (5.3%) |
| 4 or 5 Rooms | 794 (13.8%) | 391 (54.9%) |
| 6 or 7 Rooms | 1,815 (31.6%) | 187 (26.3%) |
| 8 or more Rooms | 3,063 (53.4%) | 96 (13.5%) |
| Total | 5,739 (100.0%) | 712 (100.0%) |
Housing Structure by Heating Type in La Canada Flintridge
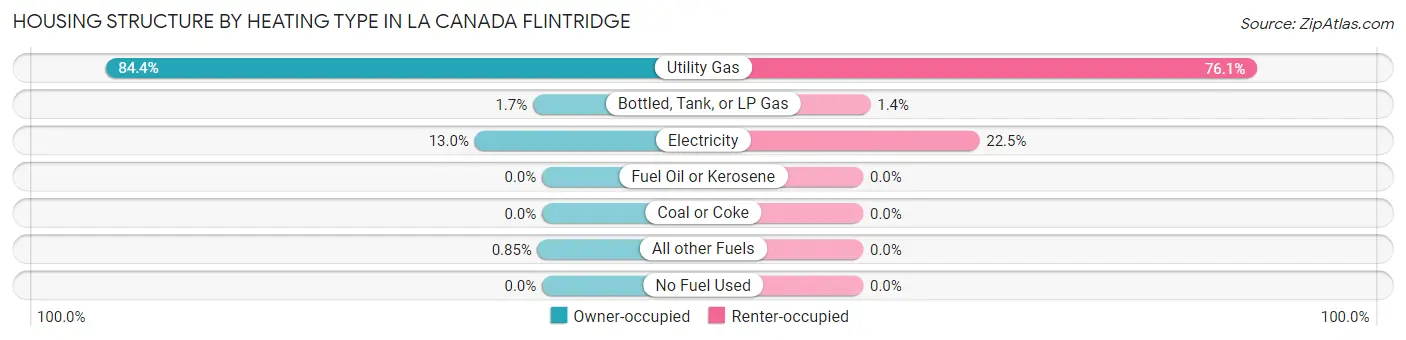
| Heating Type | Owner-occupied | Renter-occupied |
| Utility Gas | 4,843 (84.4%) | 542 (76.1%) |
| Bottled, Tank, or LP Gas | 100 (1.7%) | 10 (1.4%) |
| Electricity | 747 (13.0%) | 160 (22.5%) |
| Fuel Oil or Kerosene | 0 (0.0%) | 0 (0.0%) |
| Coal or Coke | 0 (0.0%) | 0 (0.0%) |
| All other Fuels | 49 (0.9%) | 0 (0.0%) |
| No Fuel Used | 0 (0.0%) | 0 (0.0%) |
| Total | 5,739 (100.0%) | 712 (100.0%) |
Household Vehicle Usage in La Canada Flintridge
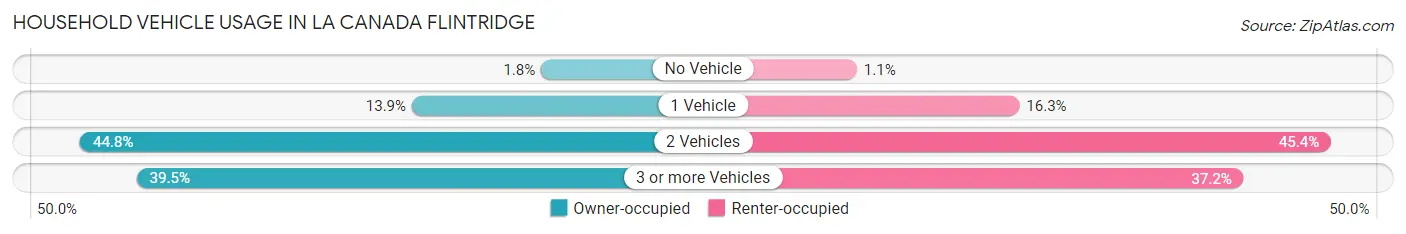
| Vehicles per Household | Owner-occupied | Renter-occupied |
| No Vehicle | 103 (1.8%) | 8 (1.1%) |
| 1 Vehicle | 795 (13.9%) | 116 (16.3%) |
| 2 Vehicles | 2,572 (44.8%) | 323 (45.4%) |
| 3 or more Vehicles | 2,269 (39.5%) | 265 (37.2%) |
| Total | 5,739 (100.0%) | 712 (100.0%) |
Real Estate & Mortgages in La Canada Flintridge
Real Estate and Mortgage Overview in La Canada Flintridge
| Characteristic | Without Mortgage | With Mortgage |
| Housing Units | 1,850 | 3,889 |
| Median Property Value | $1,703,300 | $2,000,001 |
| Median Household Income | $177,841 | $2,977 |
| Monthly Housing Costs | $1,231 | $3,451 |
| Real Estate Taxes | $7,933 | $12 |
Property Value by Mortgage Status in La Canada Flintridge
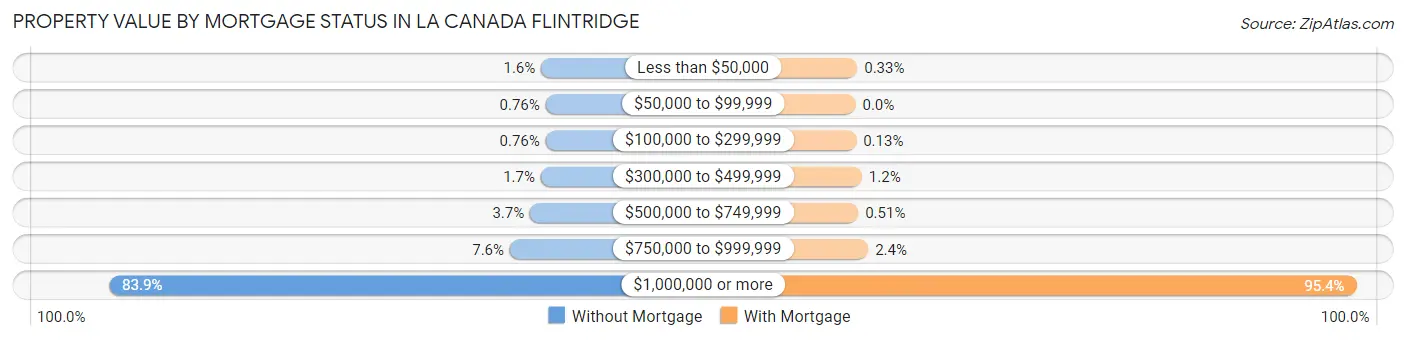
| Property Value | Without Mortgage | With Mortgage |
| Less than $50,000 | 30 (1.6%) | 13 (0.3%) |
| $50,000 to $99,999 | 14 (0.8%) | 0 (0.0%) |
| $100,000 to $299,999 | 14 (0.8%) | 5 (0.1%) |
| $300,000 to $499,999 | 31 (1.7%) | 47 (1.2%) |
| $500,000 to $749,999 | 69 (3.7%) | 20 (0.5%) |
| $750,000 to $999,999 | 140 (7.6%) | 94 (2.4%) |
| $1,000,000 or more | 1,552 (83.9%) | 3,710 (95.4%) |
| Total | 1,850 (100.0%) | 3,889 (100.0%) |
Household Income by Mortgage Status in La Canada Flintridge
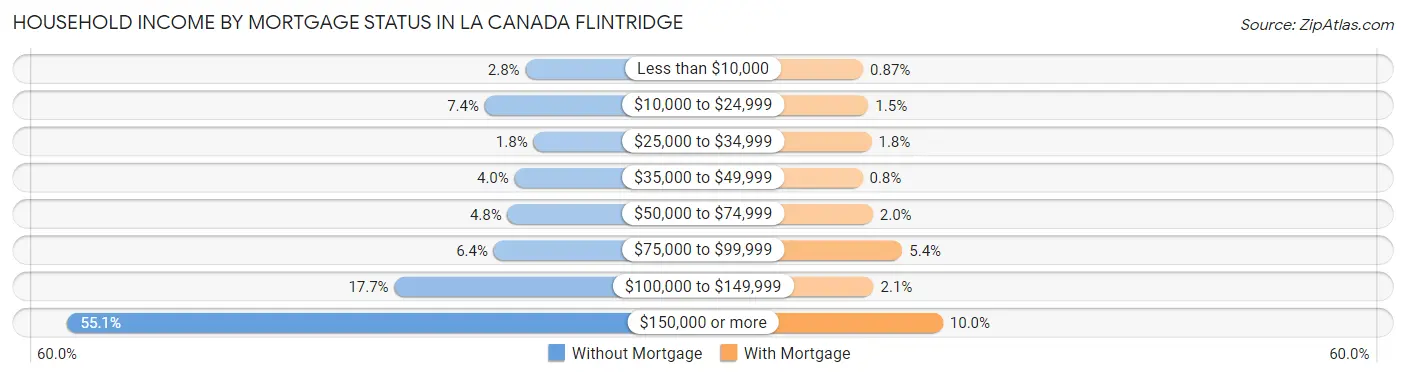
| Household Income | Without Mortgage | With Mortgage |
| Less than $10,000 | 51 (2.8%) | 34 (0.9%) |
| $10,000 to $24,999 | 137 (7.4%) | 57 (1.5%) |
| $25,000 to $34,999 | 34 (1.8%) | 71 (1.8%) |
| $35,000 to $49,999 | 74 (4.0%) | 31 (0.8%) |
| $50,000 to $74,999 | 89 (4.8%) | 77 (2.0%) |
| $75,000 to $99,999 | 118 (6.4%) | 208 (5.3%) |
| $100,000 to $149,999 | 328 (17.7%) | 80 (2.1%) |
| $150,000 or more | 1,019 (55.1%) | 388 (10.0%) |
| Total | 1,850 (100.0%) | 3,889 (100.0%) |
Property Value to Household Income Ratio in La Canada Flintridge
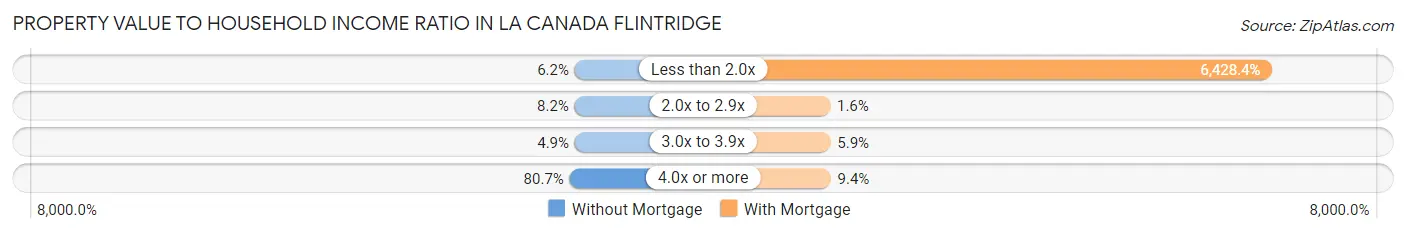
| Value-to-Income Ratio | Without Mortgage | With Mortgage |
| Less than 2.0x | 115 (6.2%) | 250,001 (6,428.4%) |
| 2.0x to 2.9x | 152 (8.2%) | 62 (1.6%) |
| 3.0x to 3.9x | 90 (4.9%) | 229 (5.9%) |
| 4.0x or more | 1,493 (80.7%) | 366 (9.4%) |
| Total | 1,850 (100.0%) | 3,889 (100.0%) |
Real Estate Taxes by Mortgage Status in La Canada Flintridge
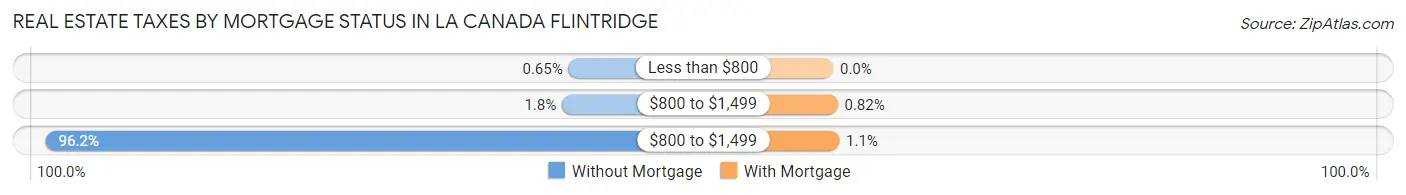
| Property Taxes | Without Mortgage | With Mortgage |
| Less than $800 | 12 (0.6%) | 0 (0.0%) |
| $800 to $1,499 | 34 (1.8%) | 32 (0.8%) |
| $800 to $1,499 | 1,779 (96.2%) | 43 (1.1%) |
| Total | 1,850 (100.0%) | 3,889 (100.0%) |
Health & Disability in La Canada Flintridge
Health Insurance Coverage by Age in La Canada Flintridge
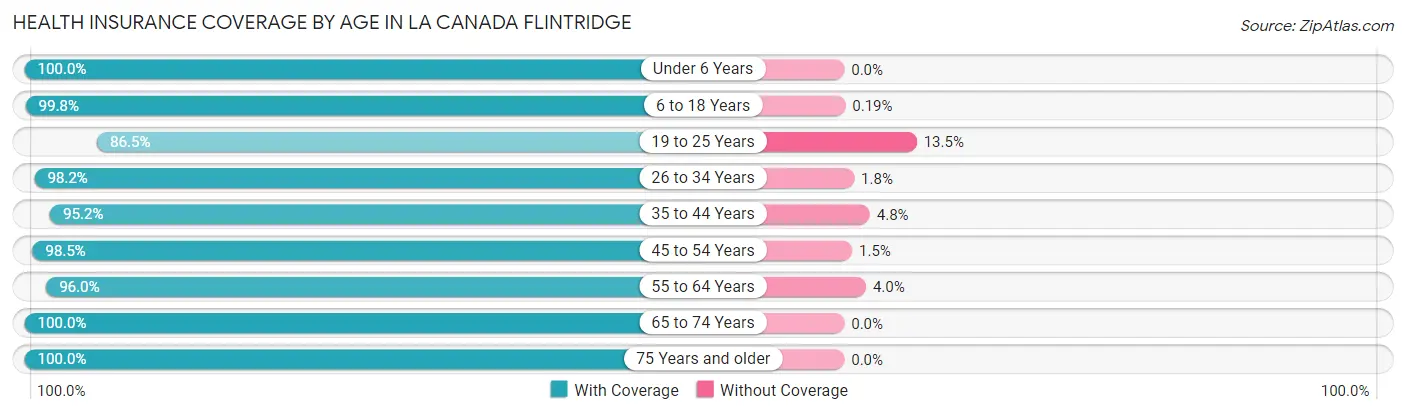
| Age Bracket | With Coverage | Without Coverage |
| Under 6 Years | 1,172 (100.0%) | 0 (0.0%) |
| 6 to 18 Years | 4,824 (99.8%) | 9 (0.2%) |
| 19 to 25 Years | 871 (86.5%) | 136 (13.5%) |
| 26 to 34 Years | 1,011 (98.2%) | 19 (1.8%) |
| 35 to 44 Years | 2,023 (95.2%) | 101 (4.8%) |
| 45 to 54 Years | 3,380 (98.5%) | 50 (1.5%) |
| 55 to 64 Years | 2,802 (96.0%) | 118 (4.0%) |
| 65 to 74 Years | 2,206 (100.0%) | 0 (0.0%) |
| 75 Years and older | 1,637 (100.0%) | 0 (0.0%) |
| Total | 19,926 (97.9%) | 433 (2.1%) |
Health Insurance Coverage by Citizenship Status in La Canada Flintridge
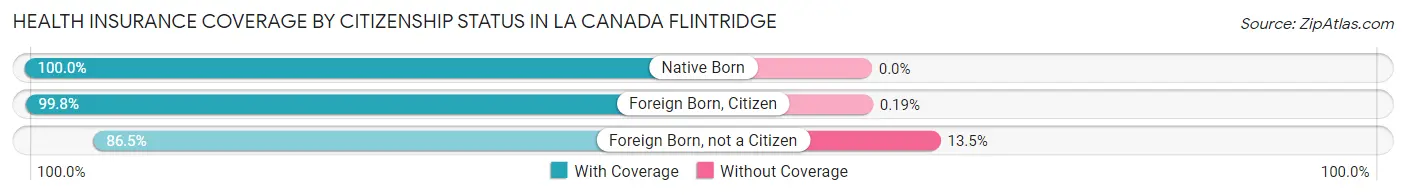
| Citizenship Status | With Coverage | Without Coverage |
| Native Born | 1,172 (100.0%) | 0 (0.0%) |
| Foreign Born, Citizen | 4,824 (99.8%) | 9 (0.2%) |
| Foreign Born, not a Citizen | 871 (86.5%) | 136 (13.5%) |
Health Insurance Coverage by Household Income in La Canada Flintridge
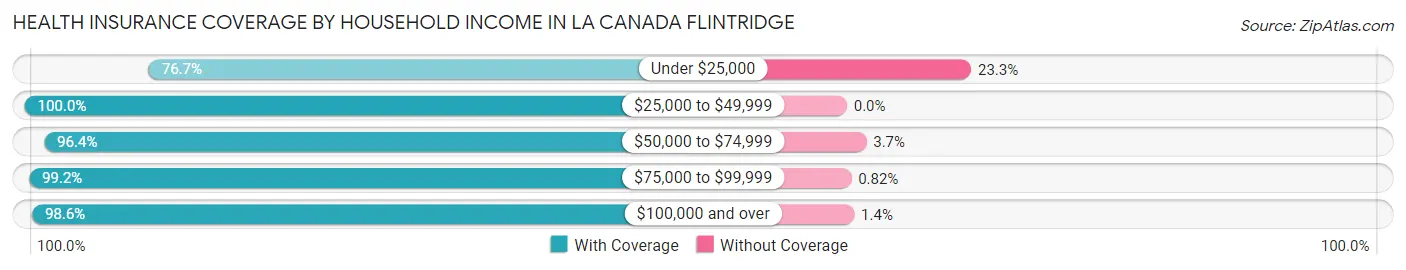
| Household Income | With Coverage | Without Coverage |
| Under $25,000 | 468 (76.7%) | 142 (23.3%) |
| $25,000 to $49,999 | 597 (100.0%) | 0 (0.0%) |
| $50,000 to $74,999 | 1,134 (96.4%) | 43 (3.6%) |
| $75,000 to $99,999 | 844 (99.2%) | 7 (0.8%) |
| $100,000 and over | 16,849 (98.6%) | 235 (1.4%) |
Public vs Private Health Insurance Coverage by Age in La Canada Flintridge
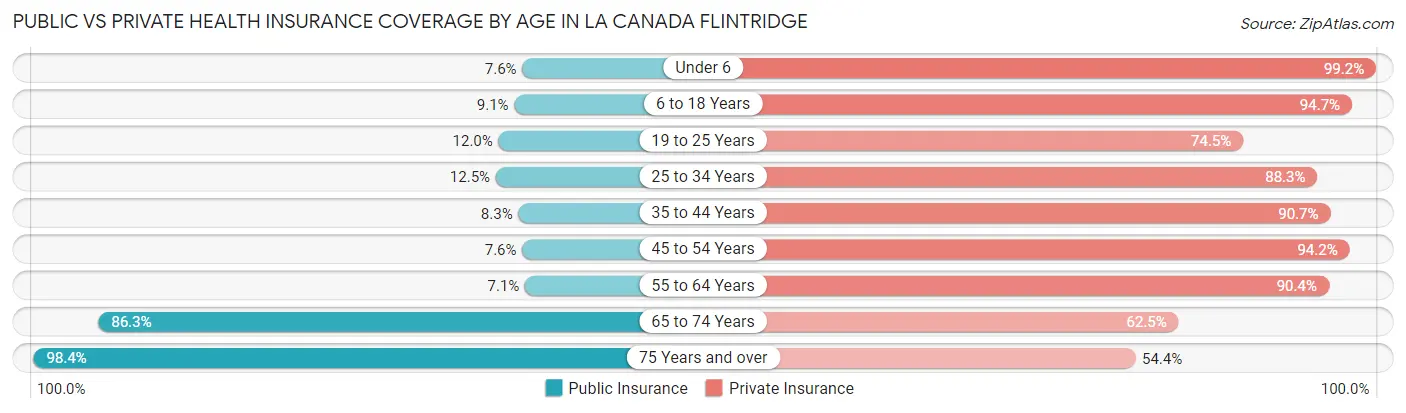
| Age Bracket | Public Insurance | Private Insurance |
| Under 6 | 89 (7.6%) | 1,162 (99.2%) |
| 6 to 18 Years | 439 (9.1%) | 4,576 (94.7%) |
| 19 to 25 Years | 121 (12.0%) | 750 (74.5%) |
| 25 to 34 Years | 129 (12.5%) | 909 (88.2%) |
| 35 to 44 Years | 177 (8.3%) | 1,926 (90.7%) |
| 45 to 54 Years | 261 (7.6%) | 3,232 (94.2%) |
| 55 to 64 Years | 207 (7.1%) | 2,639 (90.4%) |
| 65 to 74 Years | 1,904 (86.3%) | 1,379 (62.5%) |
| 75 Years and over | 1,610 (98.4%) | 891 (54.4%) |
| Total | 4,937 (24.2%) | 17,464 (85.8%) |
Disability Status by Sex by Age in La Canada Flintridge
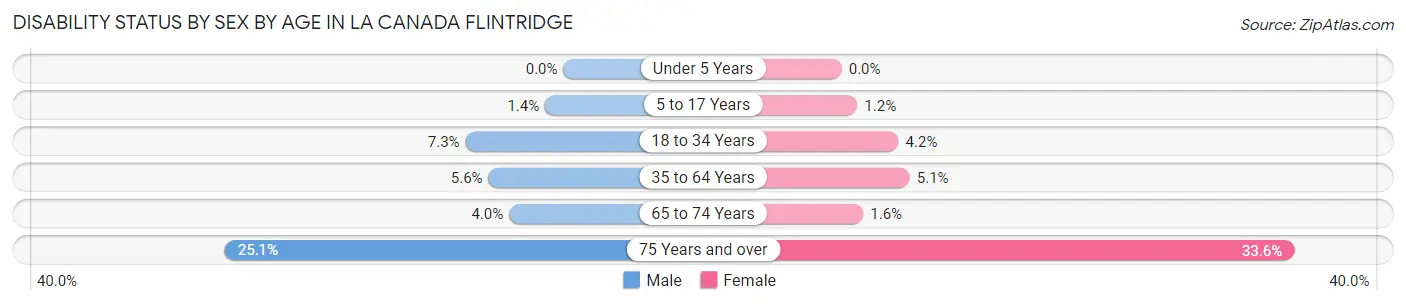
| Age Bracket | Male | Female |
| Under 5 Years | 0 (0.0%) | 0 (0.0%) |
| 5 to 17 Years | 32 (1.4%) | 28 (1.2%) |
| 18 to 34 Years | 110 (7.3%) | 36 (4.2%) |
| 35 to 64 Years | 229 (5.6%) | 220 (5.1%) |
| 65 to 74 Years | 41 (4.0%) | 19 (1.6%) |
| 75 Years and over | 195 (25.1%) | 289 (33.6%) |
Disability Class by Sex by Age in La Canada Flintridge
Disability Class: Hearing Difficulty
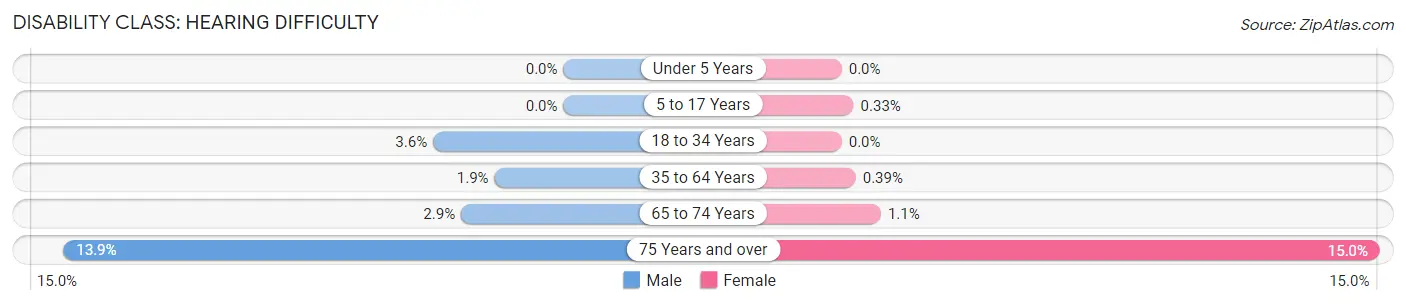
| Age Bracket | Male | Female |
| Under 5 Years | 0 (0.0%) | 0 (0.0%) |
| 5 to 17 Years | 0 (0.0%) | 8 (0.3%) |
| 18 to 34 Years | 55 (3.6%) | 0 (0.0%) |
| 35 to 64 Years | 79 (1.9%) | 17 (0.4%) |
| 65 to 74 Years | 29 (2.9%) | 13 (1.1%) |
| 75 Years and over | 108 (13.9%) | 129 (15.0%) |
Disability Class: Vision Difficulty
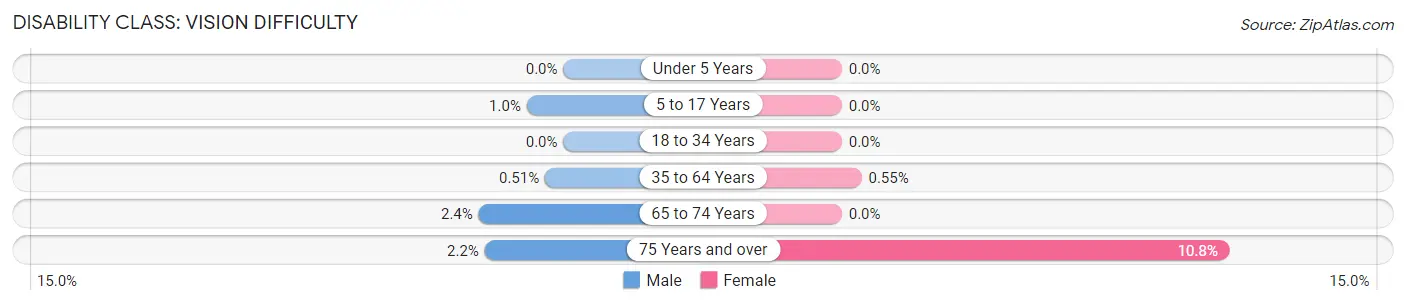
| Age Bracket | Male | Female |
| Under 5 Years | 0 (0.0%) | 0 (0.0%) |
| 5 to 17 Years | 24 (1.0%) | 0 (0.0%) |
| 18 to 34 Years | 0 (0.0%) | 0 (0.0%) |
| 35 to 64 Years | 21 (0.5%) | 24 (0.5%) |
| 65 to 74 Years | 24 (2.4%) | 0 (0.0%) |
| 75 Years and over | 17 (2.2%) | 93 (10.8%) |
Disability Class: Cognitive Difficulty
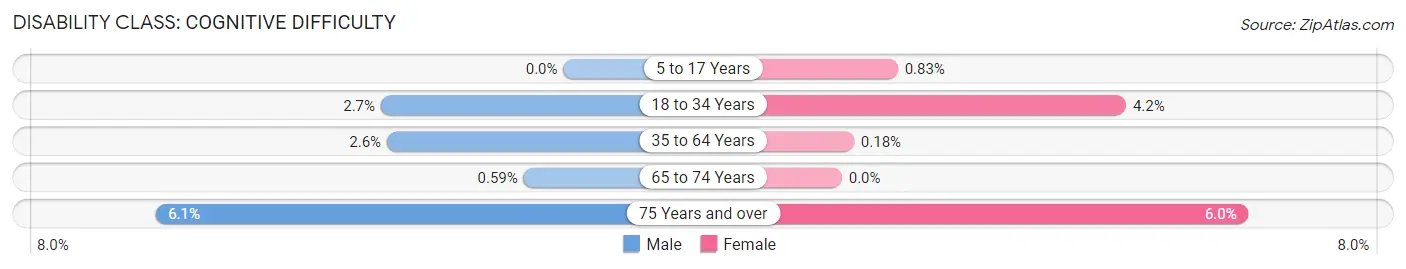
| Age Bracket | Male | Female |
| 5 to 17 Years | 0 (0.0%) | 20 (0.8%) |
| 18 to 34 Years | 41 (2.7%) | 36 (4.2%) |
| 35 to 64 Years | 108 (2.6%) | 8 (0.2%) |
| 65 to 74 Years | 6 (0.6%) | 0 (0.0%) |
| 75 Years and over | 47 (6.1%) | 52 (6.0%) |
Disability Class: Ambulatory Difficulty
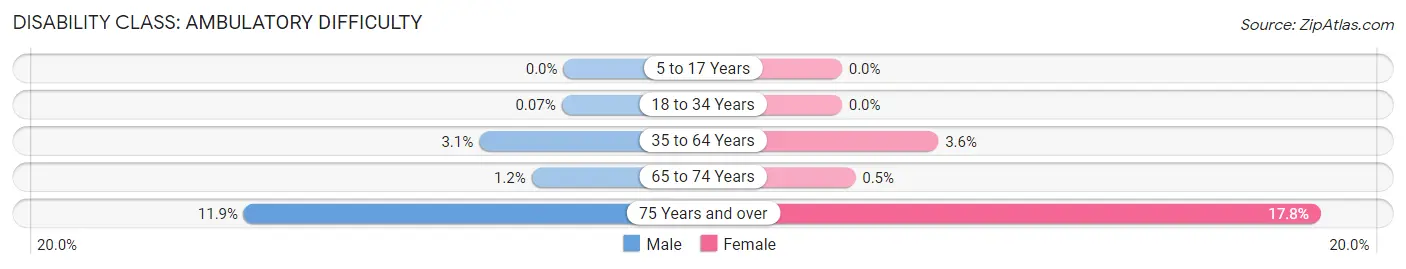
| Age Bracket | Male | Female |
| 5 to 17 Years | 0 (0.0%) | 0 (0.0%) |
| 18 to 34 Years | 1 (0.1%) | 0 (0.0%) |
| 35 to 64 Years | 129 (3.1%) | 156 (3.6%) |
| 65 to 74 Years | 12 (1.2%) | 6 (0.5%) |
| 75 Years and over | 92 (11.9%) | 153 (17.8%) |
Disability Class: Self-Care Difficulty
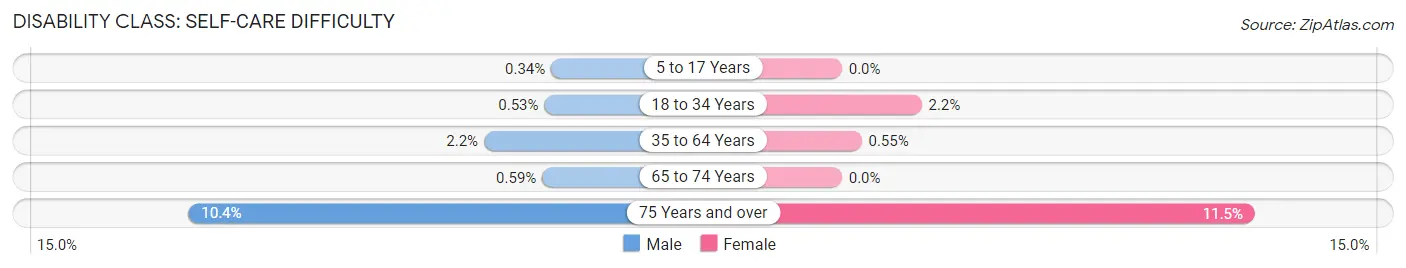
| Age Bracket | Male | Female |
| 5 to 17 Years | 8 (0.3%) | 0 (0.0%) |
| 18 to 34 Years | 8 (0.5%) | 19 (2.2%) |
| 35 to 64 Years | 91 (2.2%) | 24 (0.5%) |
| 65 to 74 Years | 6 (0.6%) | 0 (0.0%) |
| 75 Years and over | 81 (10.4%) | 99 (11.5%) |
Technology Access in La Canada Flintridge
Computing Device Access in La Canada Flintridge
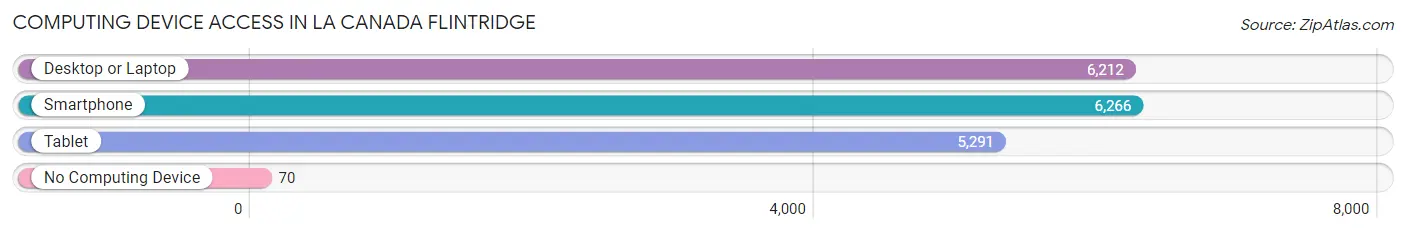
| Device Type | # Households | % Households |
| Desktop or Laptop | 6,212 | 96.3% |
| Smartphone | 6,266 | 97.1% |
| Tablet | 5,291 | 82.0% |
| No Computing Device | 70 | 1.1% |
| Total | 6,451 | 100.0% |
Internet Access in La Canada Flintridge
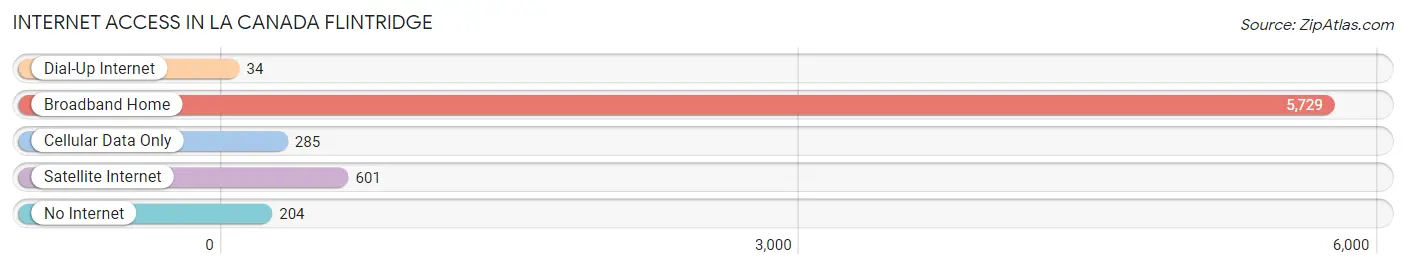
| Internet Type | # Households | % Households |
| Dial-Up Internet | 34 | 0.5% |
| Broadband Home | 5,729 | 88.8% |
| Cellular Data Only | 285 | 4.4% |
| Satellite Internet | 601 | 9.3% |
| No Internet | 204 | 3.2% |
| Total | 6,451 | 100.0% |
La Canada Flintridge Summary
La Canada Flintridge is a city located in Los Angeles County, California. It is situated in the foothills of the San Gabriel Mountains, and is part of the Crescenta Valley. The city is bordered by the Angeles National Forest to the north, La Crescenta to the east, Pasadena to the south, and Glendale to the west. La Canada Flintridge is home to approximately 20,000 people, and is known for its quiet, suburban atmosphere.
History
The area that is now La Canada Flintridge was originally inhabited by the Tongva people, who were later displaced by Spanish settlers in the late 18th century. The area was part of the Rancho La Canada land grant, which was given to the Verdugo family in 1845. The area was then subdivided and sold off in the late 19th century, and the city of La Canada Flintridge was officially incorporated in 1976.
Geography
La Canada Flintridge is located in the foothills of the San Gabriel Mountains, and is part of the Crescenta Valley. The city is bordered by the Angeles National Forest to the north, La Crescenta to the east, Pasadena to the south, and Glendale to the west. The city covers an area of 8.2 square miles, and has an elevation of 1,400 feet.
Climate
La Canada Flintridge has a Mediterranean climate, with hot, dry summers and mild, wet winters. The average high temperature in the summer is around 85°F, and the average low temperature in the winter is around 45°F. The city receives an average of 15 inches of rain per year.
Economy
La Canada Flintridge is home to a variety of businesses, including retail stores, restaurants, and professional services. The city is also home to several large employers, including Jet Propulsion Laboratory, Northrop Grumman, and the Jet Propulsion Laboratory.
Demographics
As of the 2010 census, La Canada Flintridge had a population of 20,246. The racial makeup of the city was 75.3% White, 1.2% African American, 0.3% Native American, 17.2% Asian, 0.1% Pacific Islander, 3.2% from other races, and 3.0% from two or more races. The median household income was $107,817, and the median family income was $125,845.
Conclusion
La Canada Flintridge is a city located in Los Angeles County, California. It is situated in the foothills of the San Gabriel Mountains, and is part of the Crescenta Valley. The city is bordered by the Angeles National Forest to the north, La Crescenta to the east, Pasadena to the south, and Glendale to the west. La Canada Flintridge is home to approximately 20,000 people, and is known for its quiet, suburban atmosphere. The city has a Mediterranean climate, and is home to a variety of businesses, including retail stores, restaurants, and professional services. The population of La Canada Flintridge is predominantly White, with a median household income of $107,817.
Common Questions
What is Per Capita Income in La Canada Flintridge?
Per Capita income in La Canada Flintridge is $99,697.
What is the Median Family Income in La Canada Flintridge?
Median Family Income in La Canada Flintridge is $233,782.
What is the Median Household income in La Canada Flintridge?
Median Household Income in La Canada Flintridge is $210,625.
What is Income or Wage Gap in La Canada Flintridge?
Income or Wage Gap in La Canada Flintridge is 42.6%.
Women in La Canada Flintridge earn 57.4 cents for every dollar earned by a man.
What is Family Income Deficit in La Canada Flintridge?
Family Income Deficit in La Canada Flintridge is $12,006.
Families that are below poverty line in La Canada Flintridge earn $12,006 less on average than the poverty threshold level.
What is Inequality or Gini Index in La Canada Flintridge?
Inequality or Gini Index in La Canada Flintridge is 0.47.
What is the Total Population of La Canada Flintridge?
Total Population of La Canada Flintridge is 20,378.
What is the Total Male Population of La Canada Flintridge?
Total Male Population of La Canada Flintridge is 10,125.
What is the Total Female Population of La Canada Flintridge?
Total Female Population of La Canada Flintridge is 10,253.
What is the Ratio of Males per 100 Females in La Canada Flintridge?
There are 98.75 Males per 100 Females in La Canada Flintridge.
What is the Ratio of Females per 100 Males in La Canada Flintridge?
There are 101.26 Females per 100 Males in La Canada Flintridge.
What is the Median Population Age in La Canada Flintridge?
Median Population Age in La Canada Flintridge is 45.1 Years.
What is the Average Family Size in La Canada Flintridge
Average Family Size in La Canada Flintridge is 3.4 People.
What is the Average Household Size in La Canada Flintridge
Average Household Size in La Canada Flintridge is 3.1 People.
How Large is the Labor Force in La Canada Flintridge?
There are 9,020 People in the Labor Forcein in La Canada Flintridge.
What is the Percentage of People in the Labor Force in La Canada Flintridge?
57.9% of People are in the Labor Force in La Canada Flintridge.
What is the Unemployment Rate in La Canada Flintridge?
Unemployment Rate in La Canada Flintridge is 4.5%.