Mount Hermon, CA Map & Demographics
Mount Hermon Map
Mount Hermon Overview
$62,340
PER CAPITA INCOME
$153,456
AVG FAMILY INCOME
$152,632
AVG HOUSEHOLD INCOME
17.0%
WAGE / INCOME GAP [ % ]
83.0¢/ $1
WAGE / INCOME GAP [ $ ]
0.29
INEQUALITY / GINI INDEX
1,174
TOTAL POPULATION
514
MALE POPULATION
660
FEMALE POPULATION
77.88
MALES / 100 FEMALES
128.40
FEMALES / 100 MALES
44.3
MEDIAN AGE
2.4
AVG FAMILY SIZE
2.3
AVG HOUSEHOLD SIZE
666
LABOR FORCE [ PEOPLE ]
67.1%
PERCENT IN LABOR FORCE
Mount Hermon Zip Codes
Mount Hermon Area Codes
Income in Mount Hermon
Income Overview in Mount Hermon
Per Capita Income in Mount Hermon is $62,340, while median incomes of families and households are $153,456 and $152,632 respectively.
| Characteristic | Number | Measure |
| Per Capita Income | 1,174 | $62,340 |
| Median Family Income | 457 | $153,456 |
| Mean Family Income | 457 | $142,817 |
| Median Household Income | 506 | $152,632 |
| Mean Household Income | 506 | $148,286 |
| Income Deficit | 457 | $0 |
| Wage / Income Gap (%) | 1,174 | 16.98% |
| Wage / Income Gap ($) | 1,174 | 83.02¢ per $1 |
| Gini / Inequality Index | 1,174 | 0.29 |
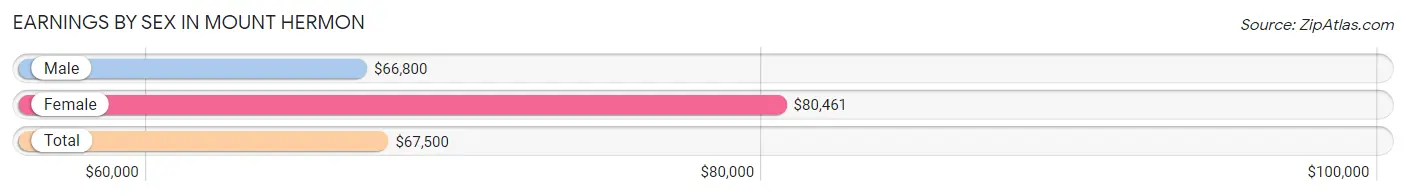
Earnings by Sex in Mount Hermon
Average Earnings in Mount Hermon are $67,500, $66,800 for men and $80,461 for women, a difference of 17.0%.
| Sex | Number | Average Earnings |
| Male | 258 (37.8%) | $66,800 |
| Female | 424 (62.2%) | $80,461 |
| Total | 682 (100.0%) | $67,500 |
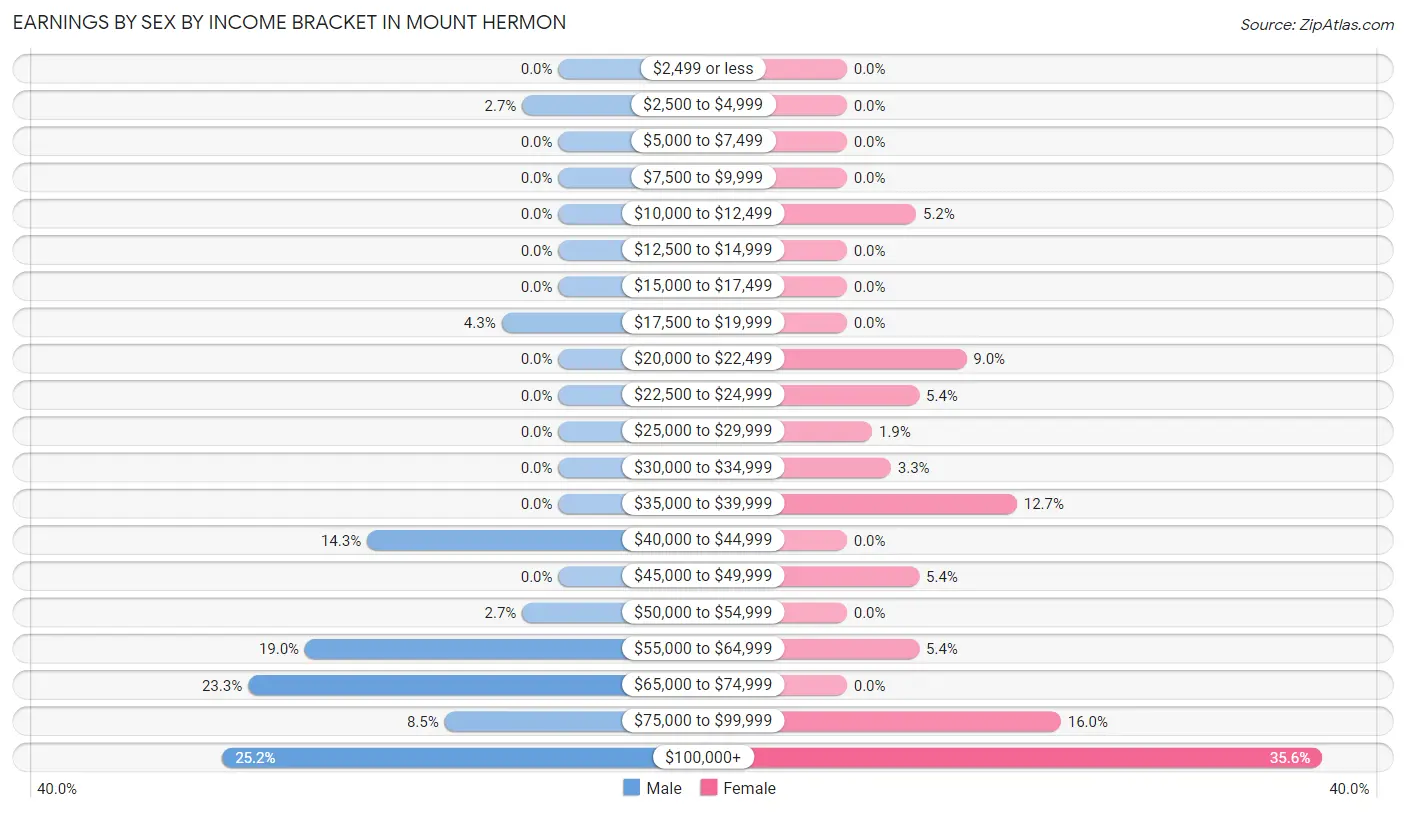
Earnings by Sex by Income Bracket in Mount Hermon
The most common earnings brackets in Mount Hermon are $100,000+ for men (65 | 25.2%) and $100,000+ for women (151 | 35.6%).
| Income | Male | Female |
| $2,499 or less | 0 (0.0%) | 0 (0.0%) |
| $2,500 to $4,999 | 7 (2.7%) | 0 (0.0%) |
| $5,000 to $7,499 | 0 (0.0%) | 0 (0.0%) |
| $7,500 to $9,999 | 0 (0.0%) | 0 (0.0%) |
| $10,000 to $12,499 | 0 (0.0%) | 22 (5.2%) |
| $12,500 to $14,999 | 0 (0.0%) | 0 (0.0%) |
| $15,000 to $17,499 | 0 (0.0%) | 0 (0.0%) |
| $17,500 to $19,999 | 11 (4.3%) | 0 (0.0%) |
| $20,000 to $22,499 | 0 (0.0%) | 38 (9.0%) |
| $22,500 to $24,999 | 0 (0.0%) | 23 (5.4%) |
| $25,000 to $29,999 | 0 (0.0%) | 8 (1.9%) |
| $30,000 to $34,999 | 0 (0.0%) | 14 (3.3%) |
| $35,000 to $39,999 | 0 (0.0%) | 54 (12.7%) |
| $40,000 to $44,999 | 37 (14.3%) | 0 (0.0%) |
| $45,000 to $49,999 | 0 (0.0%) | 23 (5.4%) |
| $50,000 to $54,999 | 7 (2.7%) | 0 (0.0%) |
| $55,000 to $64,999 | 49 (19.0%) | 23 (5.4%) |
| $65,000 to $74,999 | 60 (23.3%) | 0 (0.0%) |
| $75,000 to $99,999 | 22 (8.5%) | 68 (16.0%) |
| $100,000+ | 65 (25.2%) | 151 (35.6%) |
| Total | 258 (100.0%) | 424 (100.0%) |
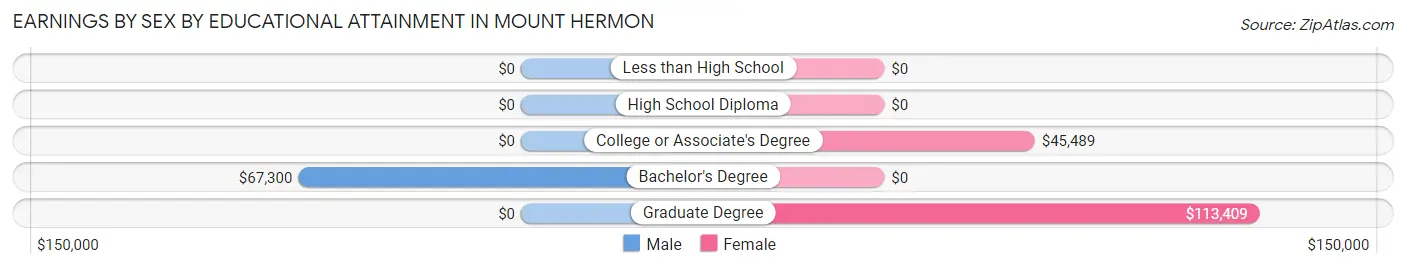
Earnings by Sex by Educational Attainment in Mount Hermon
Average earnings in Mount Hermon are $67,250 for men and $80,461 for women, a difference of 16.4%. Men with an educational attainment of bachelor's degree enjoy the highest average annual earnings of $67,300, while those with bachelor's degree education earn the least with $67,300. Women with an educational attainment of graduate degree earn the most with the average annual earnings of $113,409, while those with college or associate's degree education have the smallest earnings of $45,489.
| Educational Attainment | Male Income | Female Income |
| Less than High School | - | - |
| High School Diploma | - | - |
| College or Associate's Degree | - | - |
| Bachelor's Degree | $67,300 | $0 |
| Graduate Degree | - | - |
| Total | $67,250 | $80,461 |
Family Income in Mount Hermon
Family Income Brackets in Mount Hermon
According to the Mount Hermon family income data, there are 177 families falling into the $150,000 to $199,999 income range, which is the most common income bracket and makes up 38.7% of all families.
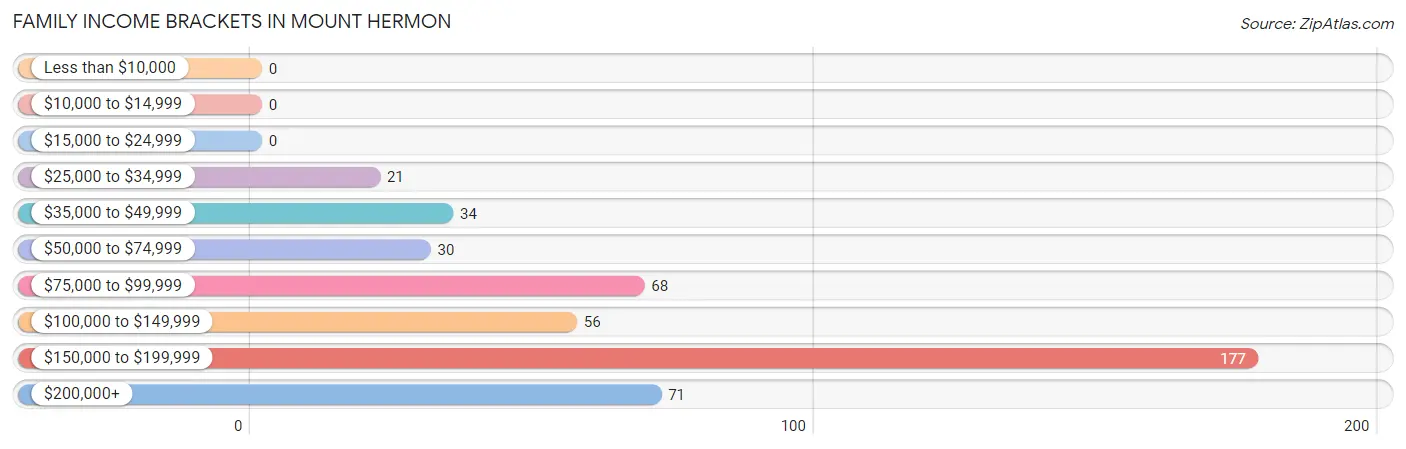
| Income Bracket | # Families | % Families |
| Less than $10,000 | 0 | 0.0% |
| $10,000 to $14,999 | 0 | 0.0% |
| $15,000 to $24,999 | 0 | 0.0% |
| $25,000 to $34,999 | 21 | 4.6% |
| $35,000 to $49,999 | 34 | 7.4% |
| $50,000 to $74,999 | 30 | 6.6% |
| $75,000 to $99,999 | 68 | 14.9% |
| $100,000 to $149,999 | 56 | 12.3% |
| $150,000 to $199,999 | 177 | 38.7% |
| $200,000+ | 71 | 15.5% |
Family Income by Famaliy Size in Mount Hermon
3-person families (60 | 13.1%) account for the highest median family income in Mount Hermon with $222,283 per family, while 3-person families (60 | 13.1%) have the highest median income of $74,094 per family member.
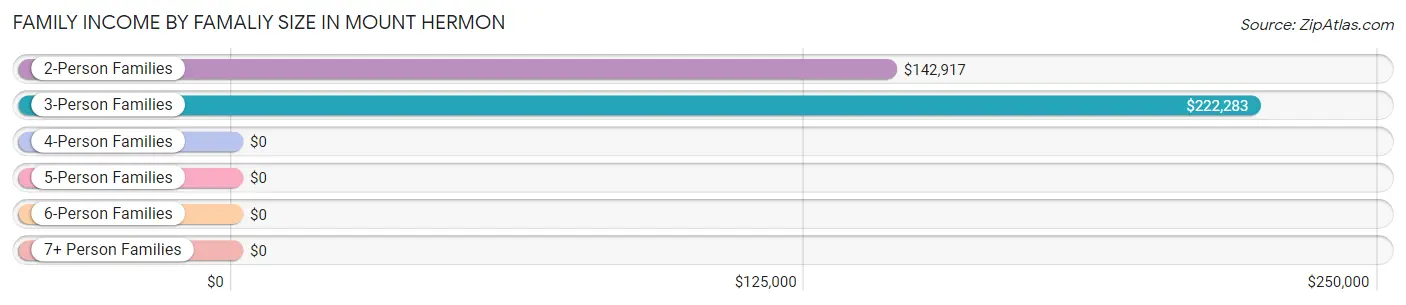
| Income Bracket | # Families | Median Income |
| 2-Person Families | 317 (69.4%) | $142,917 |
| 3-Person Families | 60 (13.1%) | $222,283 |
| 4-Person Families | 80 (17.5%) | $0 |
| 5-Person Families | 0 (0.0%) | $0 |
| 6-Person Families | 0 (0.0%) | $0 |
| 7+ Person Families | 0 (0.0%) | $0 |
| Total | 457 (100.0%) | $153,456 |
Family Income by Number of Earners in Mount Hermon
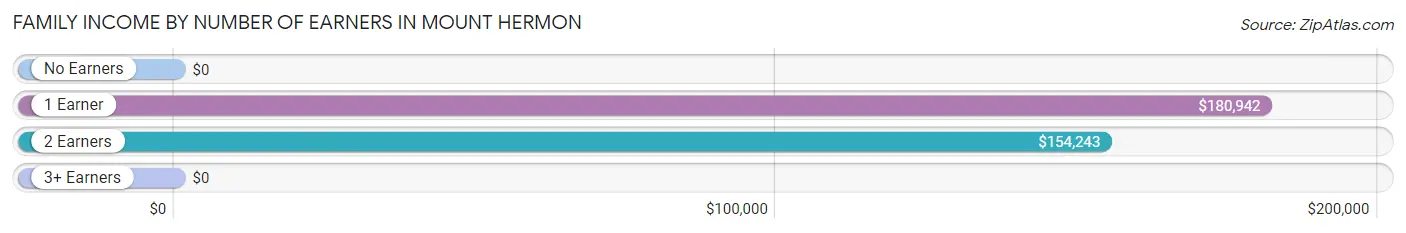
| Number of Earners | # Families | Median Income |
| No Earners | 100 (21.9%) | $0 |
| 1 Earner | 128 (28.0%) | $180,942 |
| 2 Earners | 227 (49.7%) | $154,243 |
| 3+ Earners | 2 (0.4%) | $0 |
| Total | 457 (100.0%) | $153,456 |
Household Income in Mount Hermon
Household Income Brackets in Mount Hermon
With 171 households falling in the category, the $150,000 to $199,999 income range is the most frequent in Mount Hermon, accounting for 33.8% of all households.
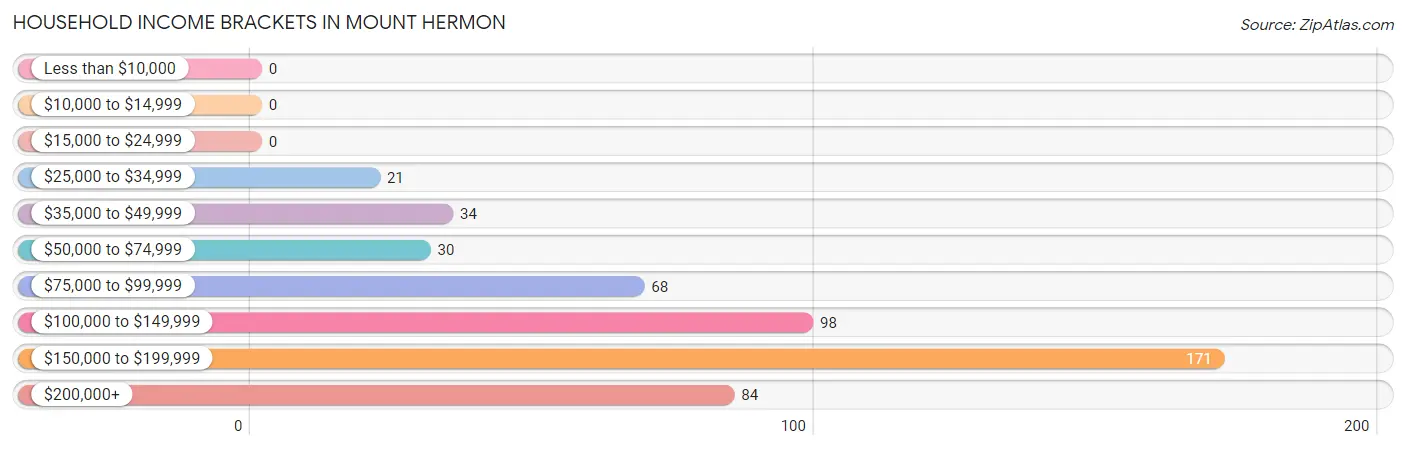
| Income Bracket | # Households | % Households |
| Less than $10,000 | 0 | 0.0% |
| $10,000 to $14,999 | 0 | 0.0% |
| $15,000 to $24,999 | 0 | 0.0% |
| $25,000 to $34,999 | 21 | 4.2% |
| $35,000 to $49,999 | 34 | 6.7% |
| $50,000 to $74,999 | 30 | 5.9% |
| $75,000 to $99,999 | 68 | 13.4% |
| $100,000 to $149,999 | 98 | 19.4% |
| $150,000 to $199,999 | 171 | 33.8% |
| $200,000+ | 84 | 16.6% |
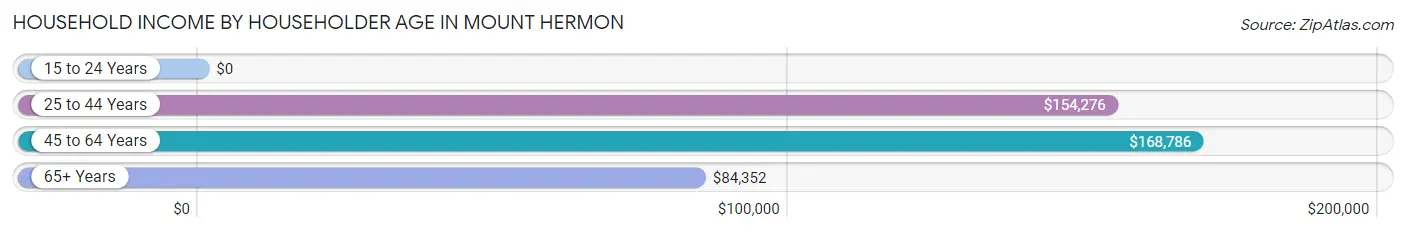
Household Income by Householder Age in Mount Hermon
The median household income in Mount Hermon is $152,632, with the highest median household income of $168,786 found in the 45 to 64 years age bracket for the primary householder. A total of 192 households (37.9%) fall into this category.
| Income Bracket | # Households | Median Income |
| 15 to 24 Years | 0 (0.0%) | $0 |
| 25 to 44 Years | 182 (36.0%) | $154,276 |
| 45 to 64 Years | 192 (37.9%) | $168,786 |
| 65+ Years | 132 (26.1%) | $84,352 |
| Total | 506 (100.0%) | $152,632 |
Poverty in Mount Hermon
Income Below Poverty by Sex and Age in Mount Hermon
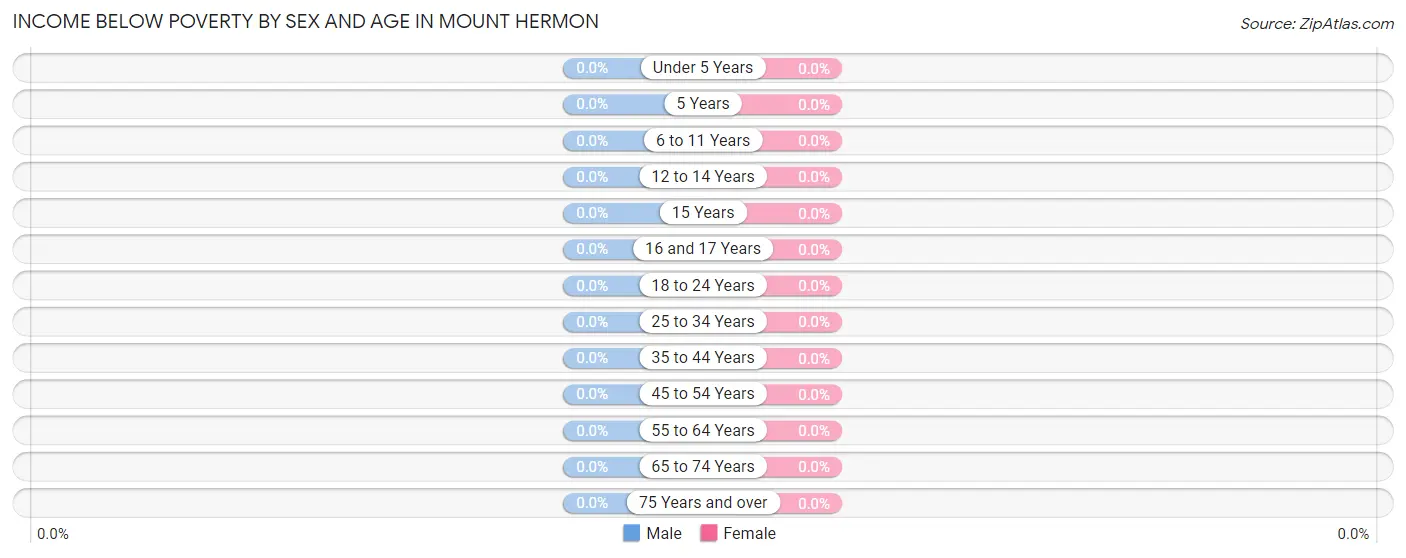
| Age Bracket | Male | Female |
| Under 5 Years | 0 (0.0%) | 0 (0.0%) |
| 5 Years | 0 (0.0%) | 0 (0.0%) |
| 6 to 11 Years | 0 (0.0%) | 0 (0.0%) |
| 12 to 14 Years | 0 (0.0%) | 0 (0.0%) |
| 15 Years | 0 (0.0%) | 0 (0.0%) |
| 16 and 17 Years | 0 (0.0%) | 0 (0.0%) |
| 18 to 24 Years | 0 (0.0%) | 0 (0.0%) |
| 25 to 34 Years | 0 (0.0%) | 0 (0.0%) |
| 35 to 44 Years | 0 (0.0%) | 0 (0.0%) |
| 45 to 54 Years | 0 (0.0%) | 0 (0.0%) |
| 55 to 64 Years | 0 (0.0%) | 0 (0.0%) |
| 65 to 74 Years | 0 (0.0%) | 0 (0.0%) |
| 75 Years and over | 0 (0.0%) | 0 (0.0%) |
| Total | 0 (0.0%) | 0 (0.0%) |
Income Above Poverty by Sex and Age in Mount Hermon
According to the poverty statistics in Mount Hermon, males aged under 5 years and females aged under 5 years are the age groups that are most secure financially, with 100.0% of males and 100.0% of females in these age groups living above the poverty line.
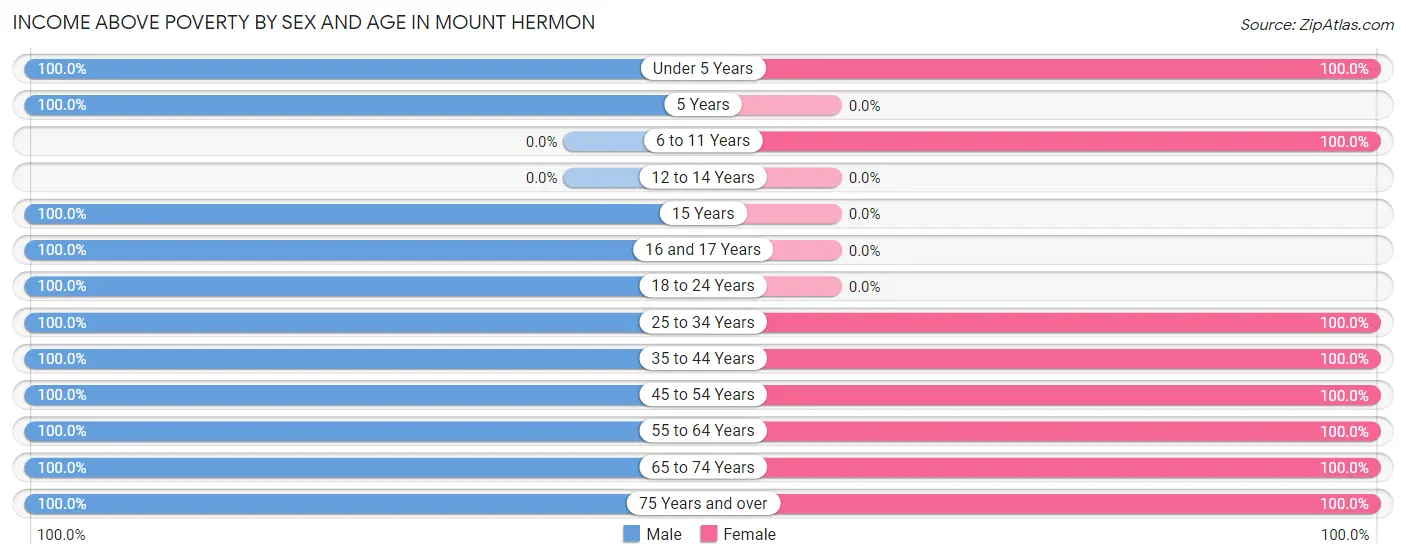
| Age Bracket | Male | Female |
| Under 5 Years | 53 (100.0%) | 35 (100.0%) |
| 5 Years | 9 (100.0%) | 0 (0.0%) |
| 6 to 11 Years | 0 (0.0%) | 76 (100.0%) |
| 12 to 14 Years | 0 (0.0%) | 0 (0.0%) |
| 15 Years | 8 (100.0%) | 0 (0.0%) |
| 16 and 17 Years | 2 (100.0%) | 0 (0.0%) |
| 18 to 24 Years | 7 (100.0%) | 0 (0.0%) |
| 25 to 34 Years | 88 (100.0%) | 180 (100.0%) |
| 35 to 44 Years | 66 (100.0%) | 72 (100.0%) |
| 45 to 54 Years | 65 (100.0%) | 44 (100.0%) |
| 55 to 64 Years | 36 (100.0%) | 123 (100.0%) |
| 65 to 74 Years | 101 (100.0%) | 103 (100.0%) |
| 75 Years and over | 79 (100.0%) | 27 (100.0%) |
| Total | 514 (100.0%) | 660 (100.0%) |
Income Below Poverty Among Married-Couple Families in Mount Hermon
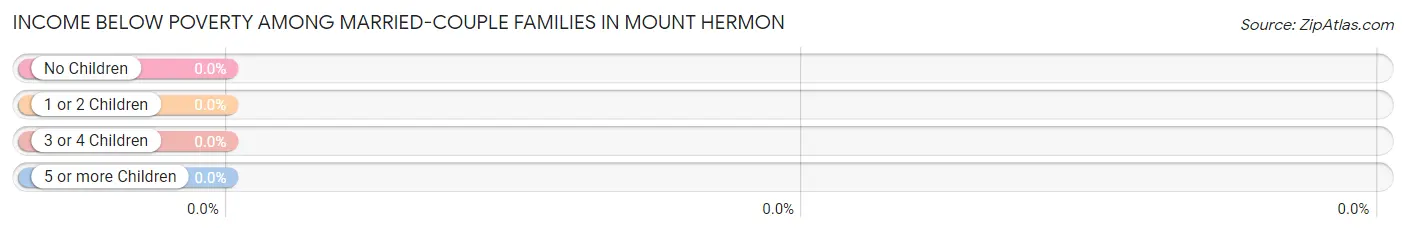
| Children | Above Poverty | Below Poverty |
| No Children | 327 (100.0%) | 0 (0.0%) |
| 1 or 2 Children | 115 (100.0%) | 0 (0.0%) |
| 3 or 4 Children | 0 (0.0%) | 0 (0.0%) |
| 5 or more Children | 0 (0.0%) | 0 (0.0%) |
| Total | 442 (100.0%) | 0 (0.0%) |
Income Below Poverty Among Single-Parent Households in Mount Hermon
| Children | Single Father | Single Mother |
| No Children | 0 (0.0%) | 0 (0.0%) |
| 1 or 2 Children | 0 (0.0%) | 0 (0.0%) |
| 3 or 4 Children | 0 (0.0%) | 0 (0.0%) |
| 5 or more Children | 0 (0.0%) | 0 (0.0%) |
| Total | 0 (0.0%) | 0 (0.0%) |
Income Below Poverty Among Married-Couple vs Single-Parent Households in Mount Hermon
| Children | Married-Couple Families | Single-Parent Households |
| No Children | 0 (0.0%) | 0 (0.0%) |
| 1 or 2 Children | 0 (0.0%) | 0 (0.0%) |
| 3 or 4 Children | 0 (0.0%) | 0 (0.0%) |
| 5 or more Children | 0 (0.0%) | 0 (0.0%) |
| Total | 0 (0.0%) | 0 (0.0%) |
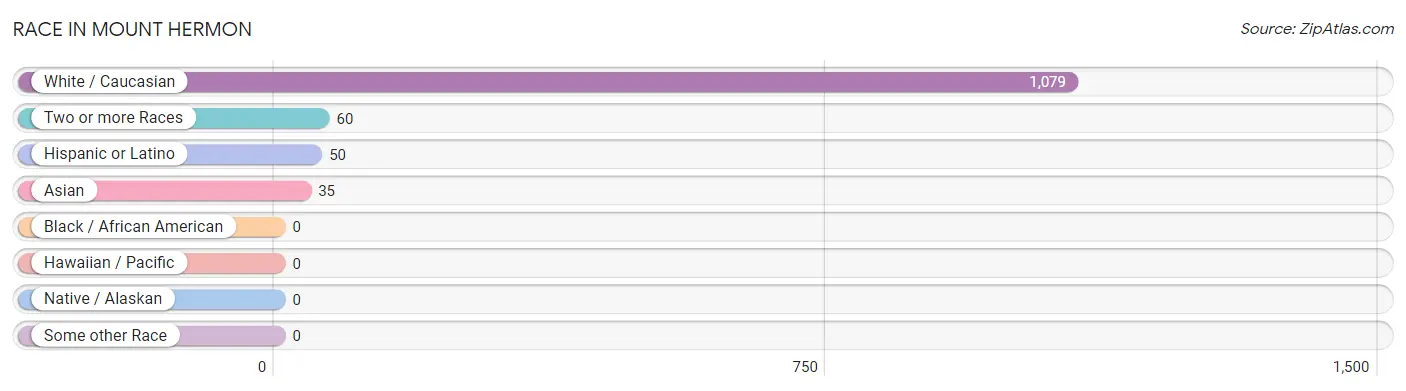
Race in Mount Hermon
The most populous races in Mount Hermon are White / Caucasian (1,079 | 91.9%), Two or more Races (60 | 5.1%), and Hispanic or Latino (50 | 4.3%).
| Race | # Population | % Population |
| Asian | 35 | 3.0% |
| Black / African American | 0 | 0.0% |
| Hawaiian / Pacific | 0 | 0.0% |
| Hispanic or Latino | 50 | 4.3% |
| Native / Alaskan | 0 | 0.0% |
| White / Caucasian | 1,079 | 91.9% |
| Two or more Races | 60 | 5.1% |
| Some other Race | 0 | 0.0% |
| Total | 1,174 | 100.0% |
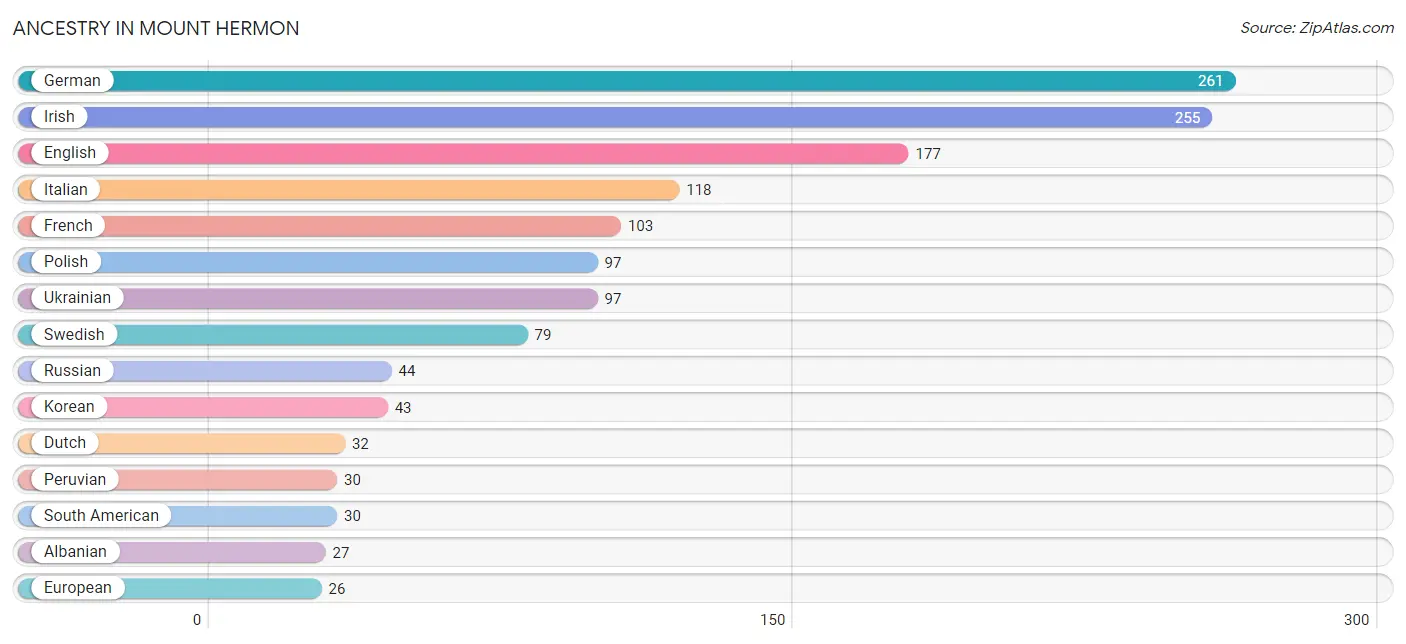
Ancestry in Mount Hermon
The most populous ancestries reported in Mount Hermon are German (261 | 22.2%), Irish (255 | 21.7%), English (177 | 15.1%), Italian (118 | 10.1%), and French (103 | 8.8%), together accounting for 77.9% of all Mount Hermon residents.
| Ancestry | # Population | % Population |
| Albanian | 27 | 2.3% |
| Burmese | 22 | 1.9% |
| Comanche | 17 | 1.5% |
| Danish | 24 | 2.0% |
| Dutch | 32 | 2.7% |
| English | 177 | 15.1% |
| European | 26 | 2.2% |
| French | 103 | 8.8% |
| German | 261 | 22.2% |
| Hungarian | 17 | 1.5% |
| Indian (Asian) | 13 | 1.1% |
| Irish | 255 | 21.7% |
| Italian | 118 | 10.1% |
| Korean | 43 | 3.7% |
| Mexican | 20 | 1.7% |
| Peruvian | 30 | 2.6% |
| Polish | 97 | 8.3% |
| Russian | 44 | 3.7% |
| Scottish | 26 | 2.2% |
| South American | 30 | 2.6% |
| Swedish | 79 | 6.7% |
| Swiss | 9 | 0.8% |
| Ukrainian | 97 | 8.3% | View All 23 Rows |
Immigrants in Mount Hermon
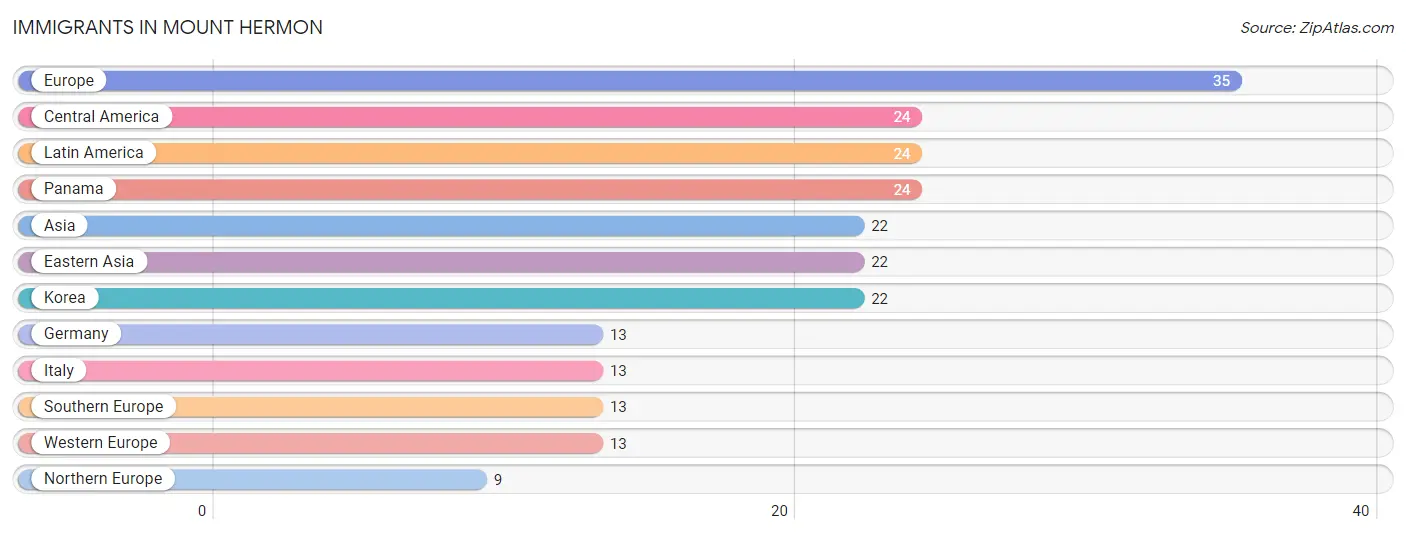
The most numerous immigrant groups reported in Mount Hermon came from Europe (35 | 3.0%), Central America (24 | 2.0%), Latin America (24 | 2.0%), Panama (24 | 2.0%), and Asia (22 | 1.9%), together accounting for 11.0% of all Mount Hermon residents.
| Immigration Origin | # Population | % Population |
| Asia | 22 | 1.9% |
| Central America | 24 | 2.0% |
| Eastern Asia | 22 | 1.9% |
| Europe | 35 | 3.0% |
| Germany | 13 | 1.1% |
| Italy | 13 | 1.1% |
| Korea | 22 | 1.9% |
| Latin America | 24 | 2.0% |
| Northern Europe | 9 | 0.8% |
| Panama | 24 | 2.0% |
| Southern Europe | 13 | 1.1% |
| Western Europe | 13 | 1.1% | View All 12 Rows |
Sex and Age in Mount Hermon
Sex and Age in Mount Hermon
The most populous age groups in Mount Hermon are 70 to 74 Years (80 | 15.6%) for men and 25 to 29 Years (134 | 20.3%) for women.
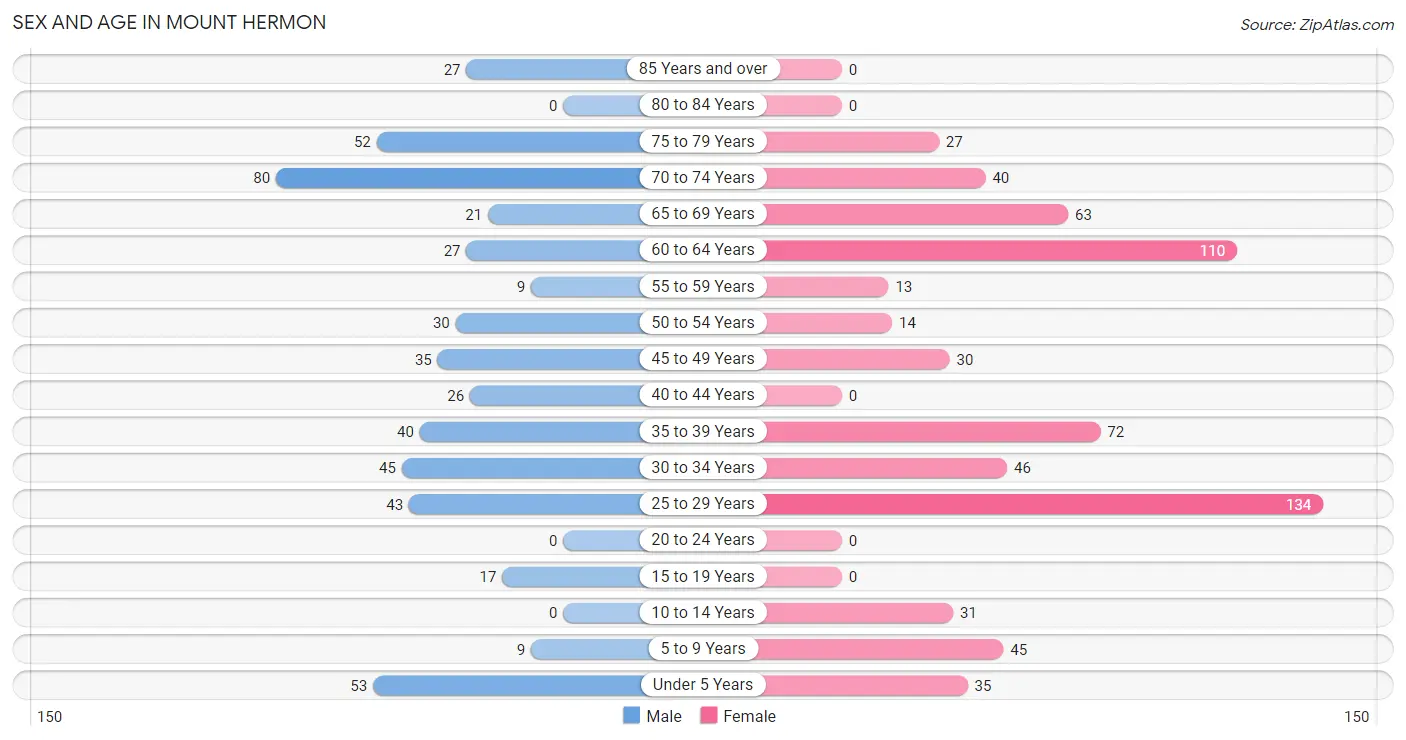
| Age Bracket | Male | Female |
| Under 5 Years | 53 (10.3%) | 35 (5.3%) |
| 5 to 9 Years | 9 (1.8%) | 45 (6.8%) |
| 10 to 14 Years | 0 (0.0%) | 31 (4.7%) |
| 15 to 19 Years | 17 (3.3%) | 0 (0.0%) |
| 20 to 24 Years | 0 (0.0%) | 0 (0.0%) |
| 25 to 29 Years | 43 (8.4%) | 134 (20.3%) |
| 30 to 34 Years | 45 (8.7%) | 46 (7.0%) |
| 35 to 39 Years | 40 (7.8%) | 72 (10.9%) |
| 40 to 44 Years | 26 (5.1%) | 0 (0.0%) |
| 45 to 49 Years | 35 (6.8%) | 30 (4.5%) |
| 50 to 54 Years | 30 (5.8%) | 14 (2.1%) |
| 55 to 59 Years | 9 (1.8%) | 13 (2.0%) |
| 60 to 64 Years | 27 (5.2%) | 110 (16.7%) |
| 65 to 69 Years | 21 (4.1%) | 63 (9.6%) |
| 70 to 74 Years | 80 (15.6%) | 40 (6.1%) |
| 75 to 79 Years | 52 (10.1%) | 27 (4.1%) |
| 80 to 84 Years | 0 (0.0%) | 0 (0.0%) |
| 85 Years and over | 27 (5.2%) | 0 (0.0%) |
| Total | 514 (100.0%) | 660 (100.0%) |
Families and Households in Mount Hermon
Median Family Size in Mount Hermon
The median family size in Mount Hermon is 2.38 persons per family, with single male/father families (2 | 0.4%) accounting for the largest median family size of 8.5 persons per family. On the other hand, single female/mother families (13 | 2.8%) represent the smallest median family size with 2.15 persons per family.
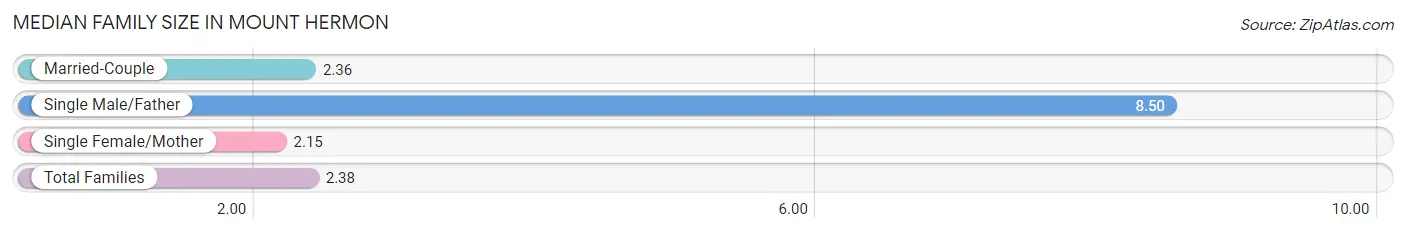
| Family Type | # Families | Family Size |
| Married-Couple | 442 (96.7%) | 2.36 |
| Single Male/Father | 2 (0.4%) | 8.50 |
| Single Female/Mother | 13 (2.8%) | 2.15 |
| Total Families | 457 (100.0%) | 2.38 |
Median Household Size in Mount Hermon
The median household size in Mount Hermon is 2.32 persons per household, with single male/father households (2 | 0.4%) accounting for the largest median household size of 8.5 persons per household. non-family households (49 | 9.7%) represent the smallest median household size with 1.47 persons per household.
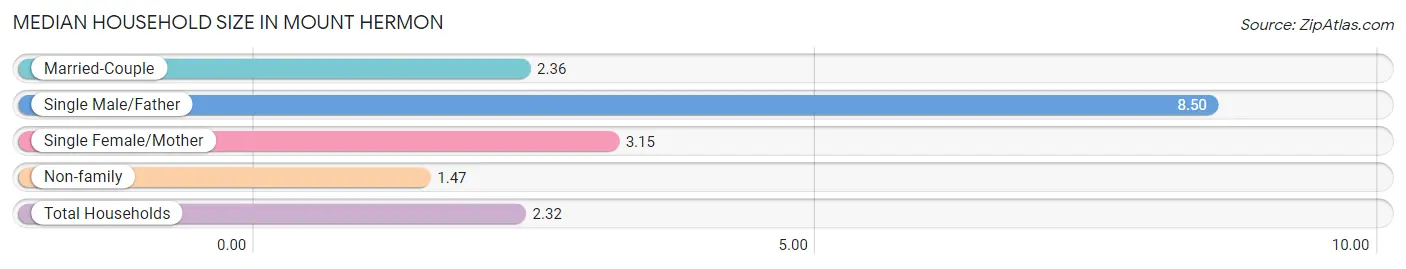
| Household Type | # Households | Household Size |
| Married-Couple | 442 (87.4%) | 2.36 |
| Single Male/Father | 2 (0.4%) | 8.50 |
| Single Female/Mother | 13 (2.6%) | 3.15 |
| Non-family | 49 (9.7%) | 1.47 |
| Total Households | 506 (100.0%) | 2.32 |
Household Size by Marriage Status in Mount Hermon
Out of a total of 506 households in Mount Hermon, 457 (90.3%) are family households, while 49 (9.7%) are nonfamily households. The most numerous type of family households are 2-person households, comprising 304, and the most common type of nonfamily households are 1-person households, comprising 27.
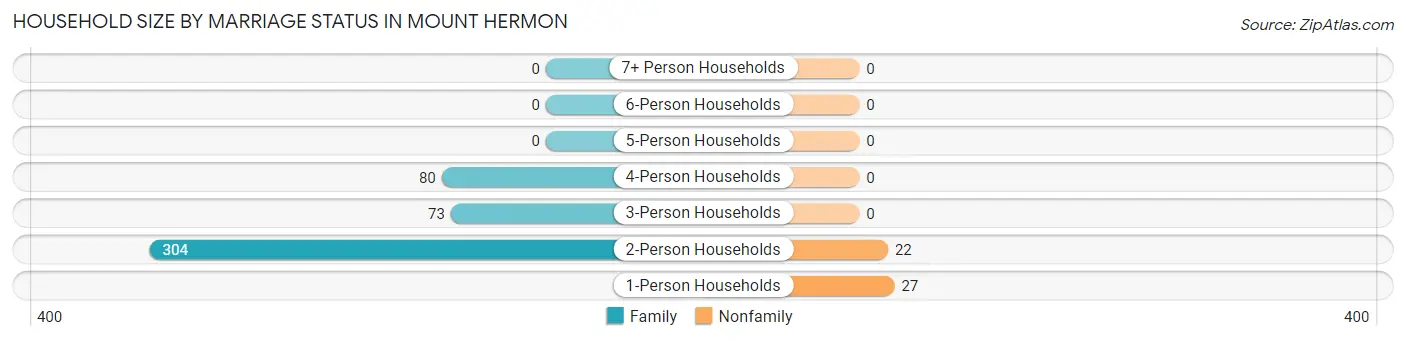
| Household Size | Family Households | Nonfamily Households |
| 1-Person Households | - | 27 (5.3%) |
| 2-Person Households | 304 (60.1%) | 22 (4.3%) |
| 3-Person Households | 73 (14.4%) | 0 (0.0%) |
| 4-Person Households | 80 (15.8%) | 0 (0.0%) |
| 5-Person Households | 0 (0.0%) | 0 (0.0%) |
| 6-Person Households | 0 (0.0%) | 0 (0.0%) |
| 7+ Person Households | 0 (0.0%) | 0 (0.0%) |
| Total | 457 (90.3%) | 49 (9.7%) |
Female Fertility in Mount Hermon
Fertility by Age in Mount Hermon
Average fertility rate in Mount Hermon is 149.0 births per 1,000 women. Women in the age bracket of 20 to 34 years have the highest fertility rate with 189.0 births per 1,000 women. Women in the age bracket of 20 to 34 years acount for 80.9% of all women with births.
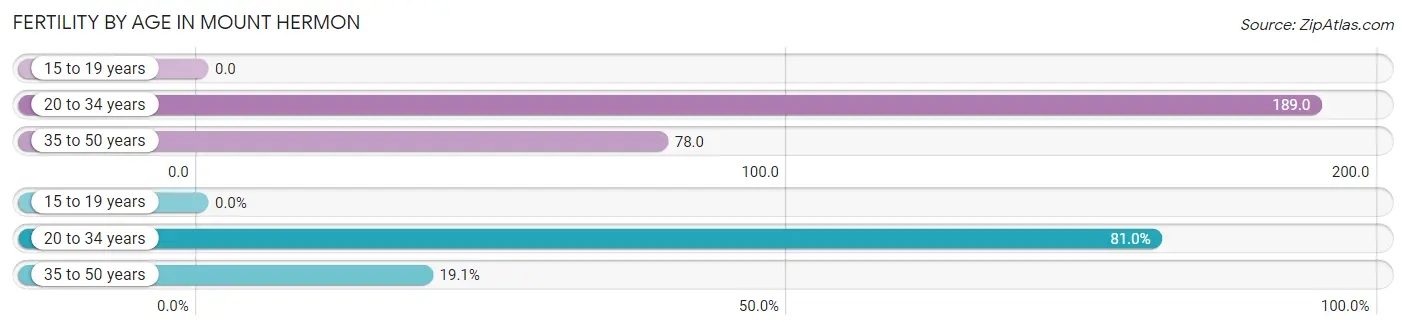
| Age Bracket | Women with Births | Births / 1,000 Women |
| 15 to 19 years | 0 (0.0%) | 0.0 |
| 20 to 34 years | 34 (80.9%) | 189.0 |
| 35 to 50 years | 8 (19.1%) | 78.0 |
| Total | 42 (100.0%) | 149.0 |
Fertility by Age by Marriage Status in Mount Hermon
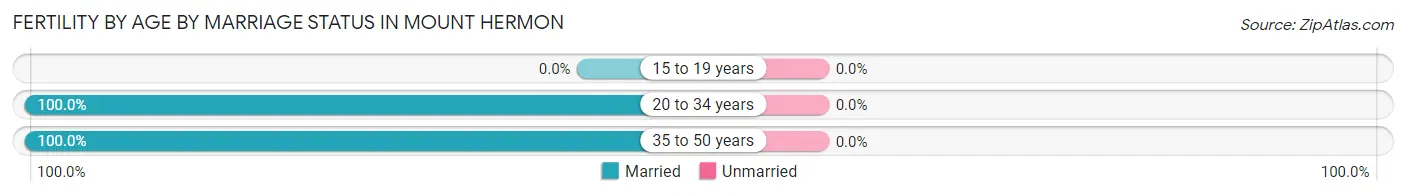
| Age Bracket | Married | Unmarried |
| 15 to 19 years | 0 (0.0%) | 0 (0.0%) |
| 20 to 34 years | 34 (100.0%) | 0 (0.0%) |
| 35 to 50 years | 8 (100.0%) | 0 (0.0%) |
| Total | 42 (100.0%) | 0 (0.0%) |
Fertility by Education in Mount Hermon
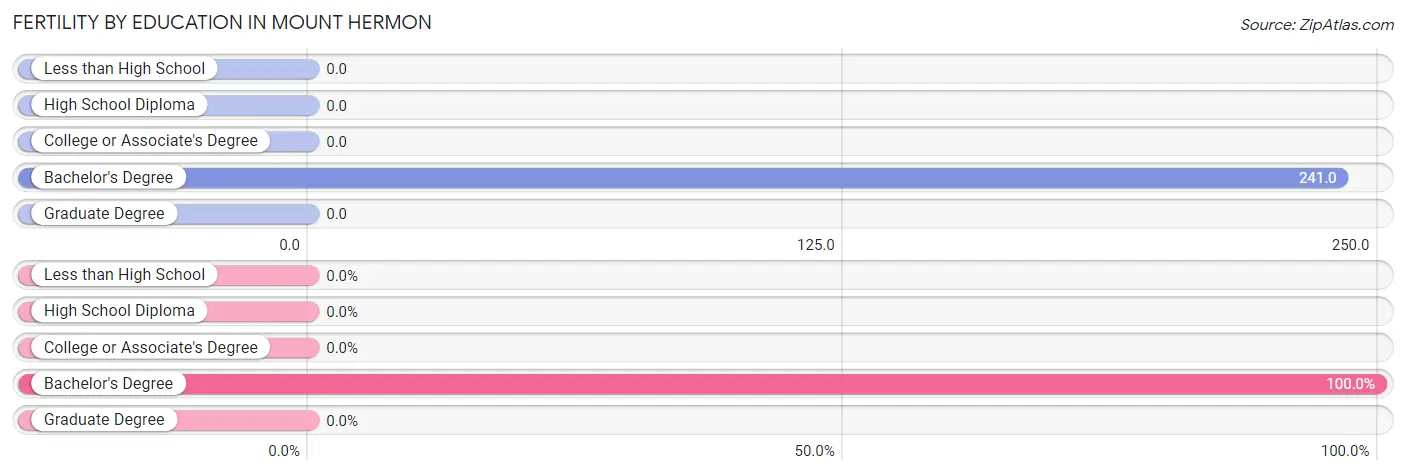
| Educational Attainment | Women with Births | Births / 1,000 Women |
| Less than High School | 0 (0.0%) | 0.0 |
| High School Diploma | 0 (0.0%) | 0.0 |
| College or Associate's Degree | 0 (0.0%) | 0.0 |
| Bachelor's Degree | 42 (100.0%) | 241.0 |
| Graduate Degree | 0 (0.0%) | 0.0 |
| Total | 42 (100.0%) | 149.0 |
Fertility by Education by Marriage Status in Mount Hermon
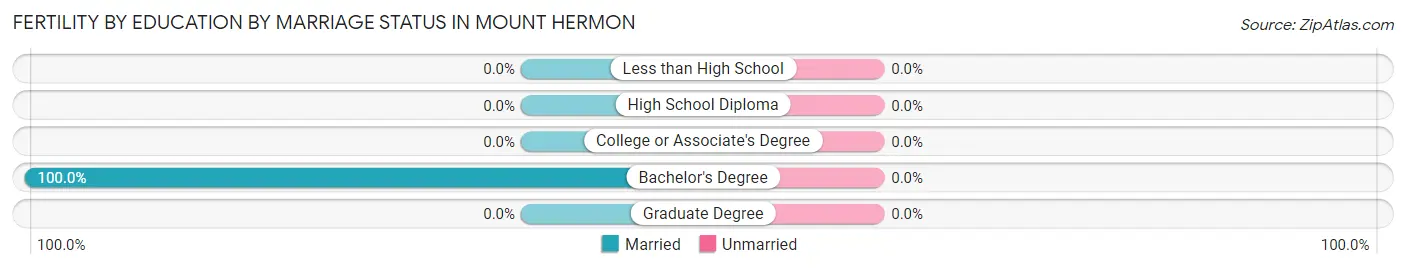
| Educational Attainment | Married | Unmarried |
| Less than High School | 0 (0.0%) | 0 (0.0%) |
| High School Diploma | 0 (0.0%) | 0 (0.0%) |
| College or Associate's Degree | 0 (0.0%) | 0 (0.0%) |
| Bachelor's Degree | 42 (100.0%) | 0 (0.0%) |
| Graduate Degree | 0 (0.0%) | 0 (0.0%) |
| Total | 42 (100.0%) | 0 (0.0%) |
Employment Characteristics in Mount Hermon
Employment by Class of Employer in Mount Hermon
Among the 626 employed individuals in Mount Hermon, private company employees (359 | 57.4%), not-for-profit organizations (80 | 12.8%), and self-employed (not incorporated) (61 | 9.7%) make up the most common classes of employment.
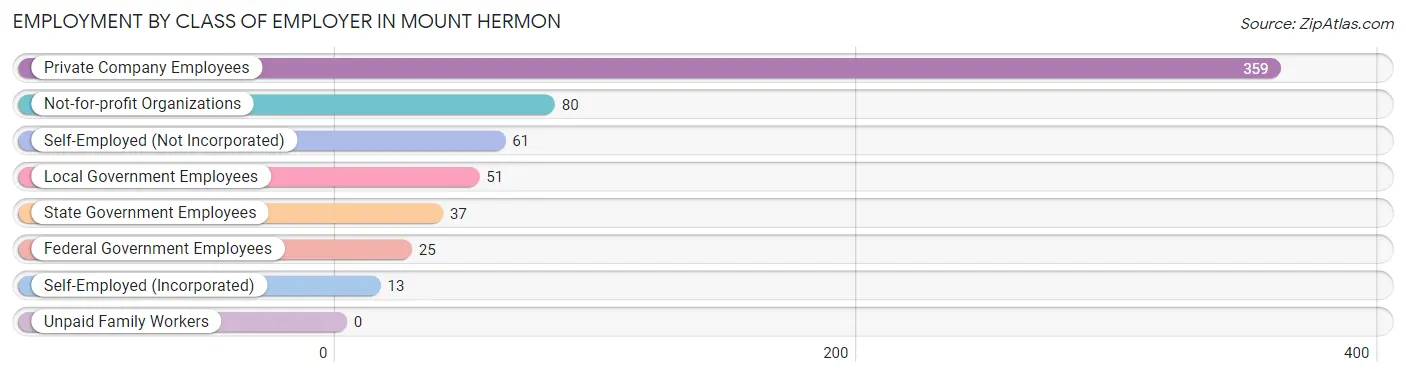
| Employer Class | # Employees | % Employees |
| Private Company Employees | 359 | 57.4% |
| Self-Employed (Incorporated) | 13 | 2.1% |
| Self-Employed (Not Incorporated) | 61 | 9.7% |
| Not-for-profit Organizations | 80 | 12.8% |
| Local Government Employees | 51 | 8.2% |
| State Government Employees | 37 | 5.9% |
| Federal Government Employees | 25 | 4.0% |
| Unpaid Family Workers | 0 | 0.0% |
| Total | 626 | 100.0% |
Employment Status by Age in Mount Hermon
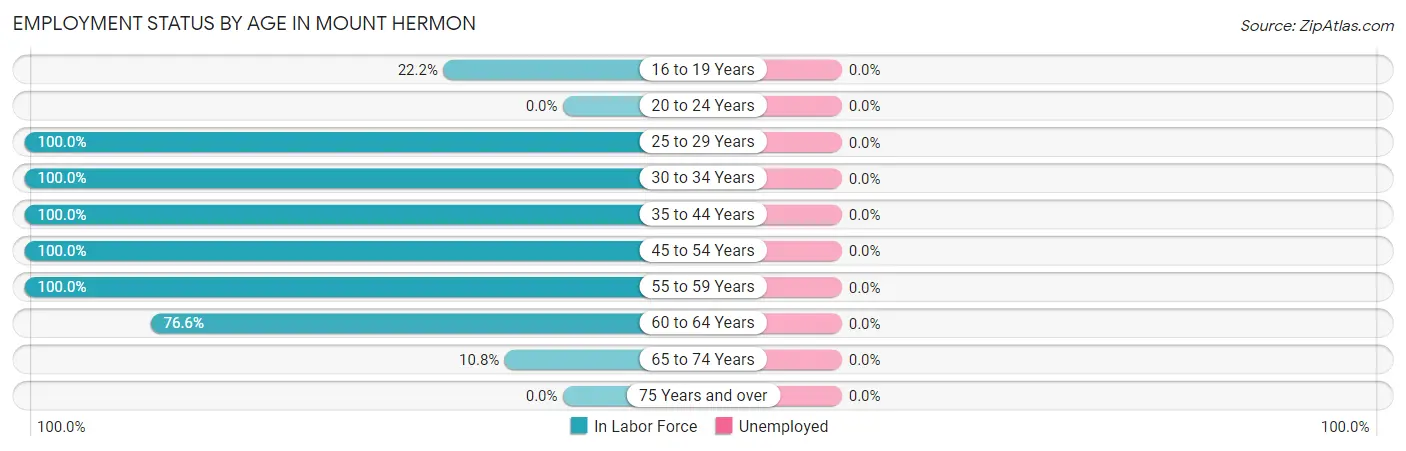
| Age Bracket | In Labor Force | Unemployed |
| 16 to 19 Years | 2 (22.2%) | 0 (0.0%) |
| 20 to 24 Years | 0 (0.0%) | 0 (0.0%) |
| 25 to 29 Years | 177 (100.0%) | 0 (0.0%) |
| 30 to 34 Years | 91 (100.0%) | 0 (0.0%) |
| 35 to 44 Years | 138 (100.0%) | 0 (0.0%) |
| 45 to 54 Years | 109 (100.0%) | 0 (0.0%) |
| 55 to 59 Years | 22 (100.0%) | 0 (0.0%) |
| 60 to 64 Years | 105 (76.6%) | 0 (0.0%) |
| 65 to 74 Years | 22 (10.8%) | 0 (0.0%) |
| 75 Years and over | 0 (0.0%) | 0 (0.0%) |
| Total | 666 (67.1%) | 0 (0.0%) |
Employment Status by Educational Attainment in Mount Hermon
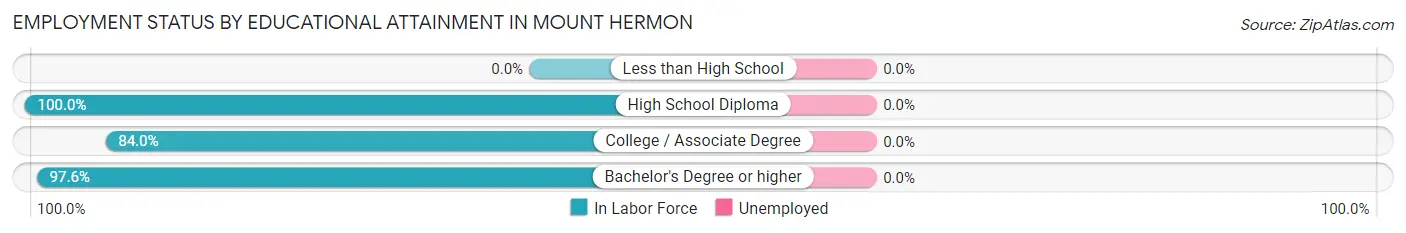
| Educational Attainment | In Labor Force | Unemployed |
| Less than High School | 0 (0.0%) | 0 (0.0%) |
| High School Diploma | 6 (100.0%) | 0 (0.0%) |
| College / Associate Degree | 100 (84.0%) | 0 (0.0%) |
| Bachelor's Degree or higher | 536 (97.6%) | 0 (0.0%) |
| Total | 642 (95.3%) | 0 (0.0%) |
Employment Occupations by Sex in Mount Hermon
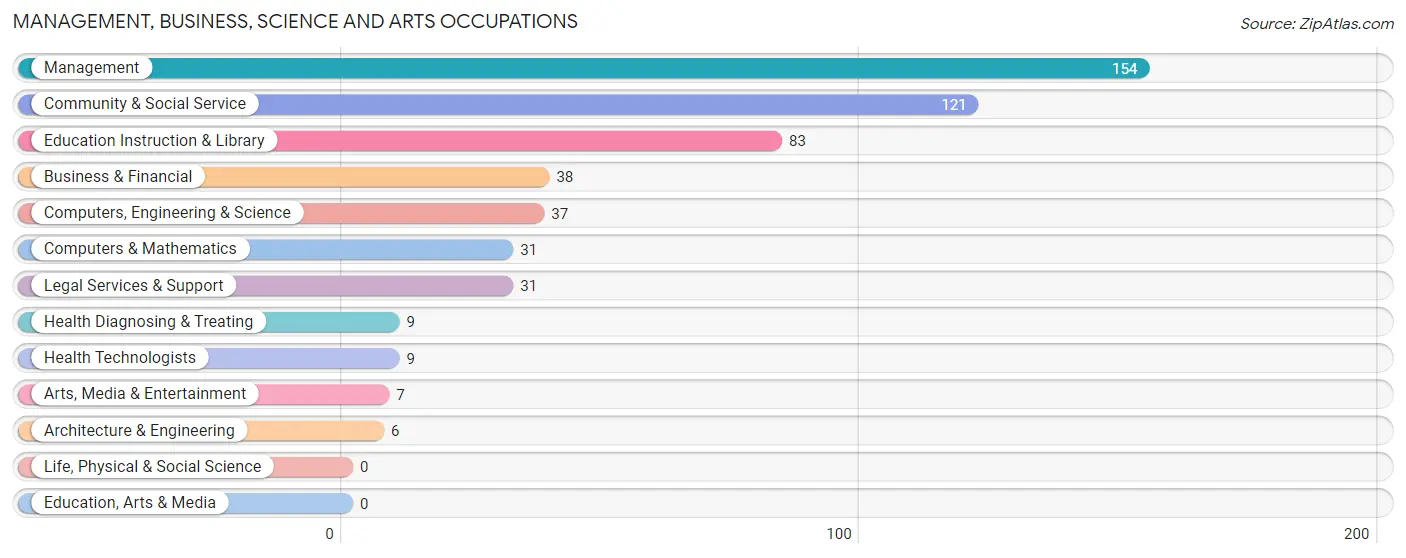
Management, Business, Science and Arts Occupations
The most common Management, Business, Science and Arts occupations in Mount Hermon are Management (154 | 24.0%), Community & Social Service (121 | 18.9%), Education Instruction & Library (83 | 13.0%), Business & Financial (38 | 5.9%), and Computers, Engineering & Science (37 | 5.8%).
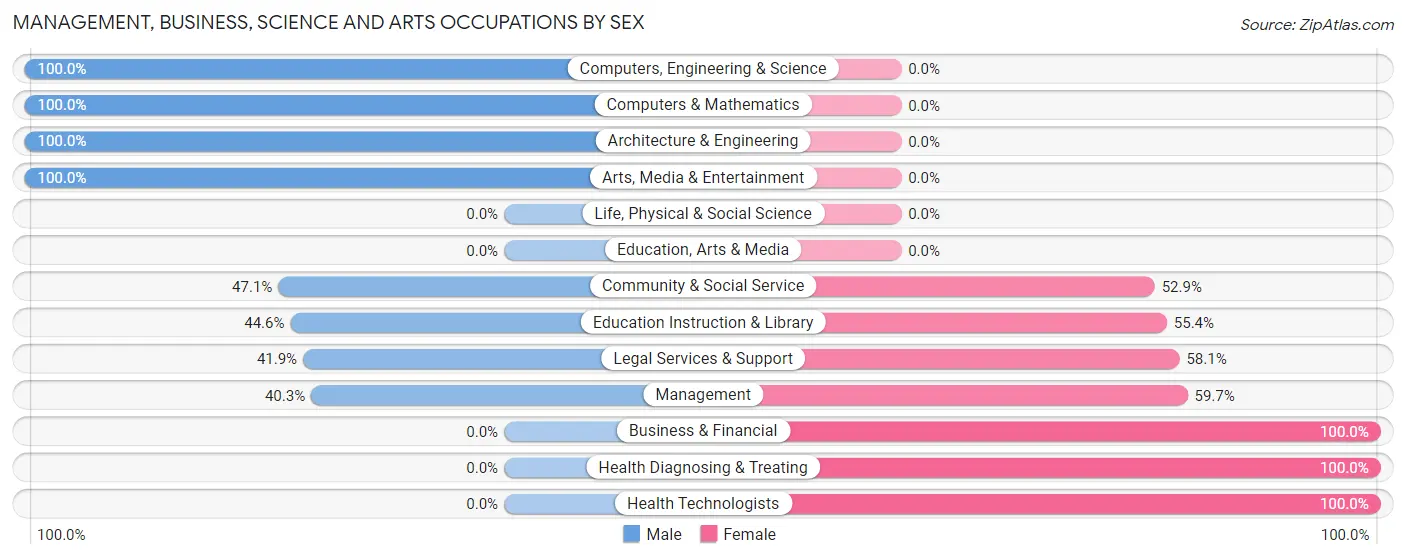
Management, Business, Science and Arts Occupations by Sex
Within the Management, Business, Science and Arts occupations in Mount Hermon, the most male-oriented occupations are Computers, Engineering & Science (100.0%), Computers & Mathematics (100.0%), and Architecture & Engineering (100.0%), while the most female-oriented occupations are Business & Financial (100.0%), Health Diagnosing & Treating (100.0%), and Health Technologists (100.0%).
| Occupation | Male | Female |
| Management | 62 (40.3%) | 92 (59.7%) |
| Business & Financial | 0 (0.0%) | 38 (100.0%) |
| Computers, Engineering & Science | 37 (100.0%) | 0 (0.0%) |
| Computers & Mathematics | 31 (100.0%) | 0 (0.0%) |
| Architecture & Engineering | 6 (100.0%) | 0 (0.0%) |
| Life, Physical & Social Science | 0 (0.0%) | 0 (0.0%) |
| Community & Social Service | 57 (47.1%) | 64 (52.9%) |
| Education, Arts & Media | 0 (0.0%) | 0 (0.0%) |
| Legal Services & Support | 13 (41.9%) | 18 (58.1%) |
| Education Instruction & Library | 37 (44.6%) | 46 (55.4%) |
| Arts, Media & Entertainment | 7 (100.0%) | 0 (0.0%) |
| Health Diagnosing & Treating | 0 (0.0%) | 9 (100.0%) |
| Health Technologists | 0 (0.0%) | 9 (100.0%) |
| Total (Category) | 156 (43.4%) | 203 (56.6%) |
| Total (Overall) | 226 (35.3%) | 415 (64.7%) |
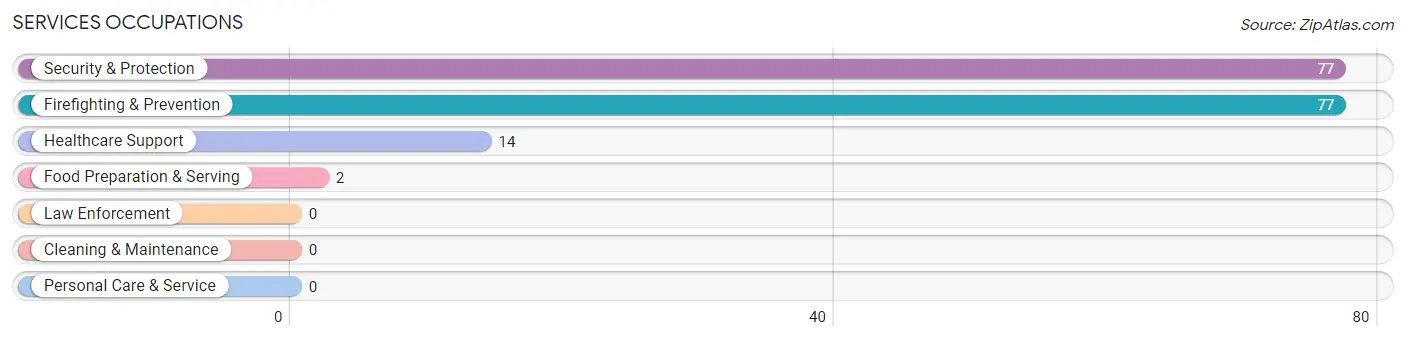
Services Occupations
The most common Services occupations in Mount Hermon are Security & Protection (77 | 12.0%), Firefighting & Prevention (77 | 12.0%), Healthcare Support (14 | 2.2%), and Food Preparation & Serving (2 | 0.3%).
Services Occupations by Sex
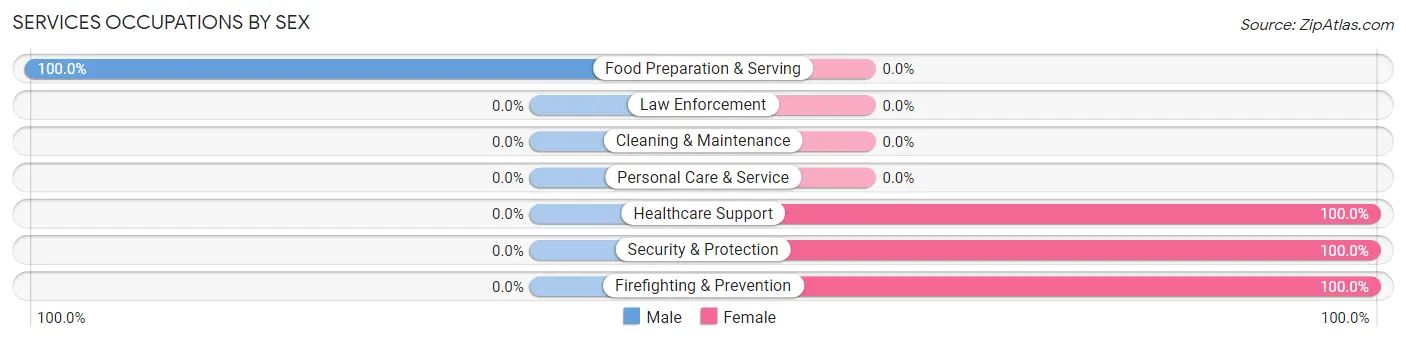
| Occupation | Male | Female |
| Healthcare Support | 0 (0.0%) | 14 (100.0%) |
| Security & Protection | 0 (0.0%) | 77 (100.0%) |
| Firefighting & Prevention | 0 (0.0%) | 77 (100.0%) |
| Law Enforcement | 0 (0.0%) | 0 (0.0%) |
| Food Preparation & Serving | 2 (100.0%) | 0 (0.0%) |
| Cleaning & Maintenance | 0 (0.0%) | 0 (0.0%) |
| Personal Care & Service | 0 (0.0%) | 0 (0.0%) |
| Total (Category) | 2 (2.1%) | 91 (97.9%) |
| Total (Overall) | 226 (35.3%) | 415 (64.7%) |
Sales and Office Occupations
The most common Sales and Office occupations in Mount Hermon are Office & Administration (114 | 17.8%), and Sales & Related (15 | 2.3%).
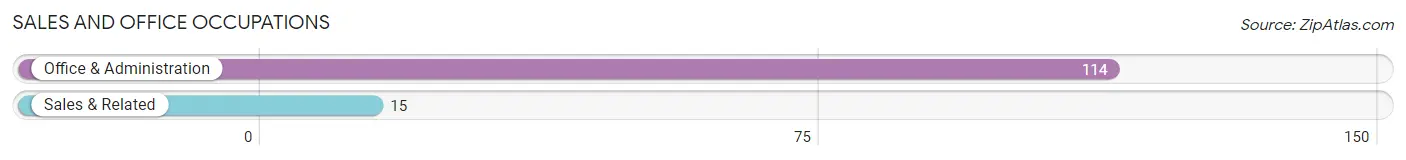
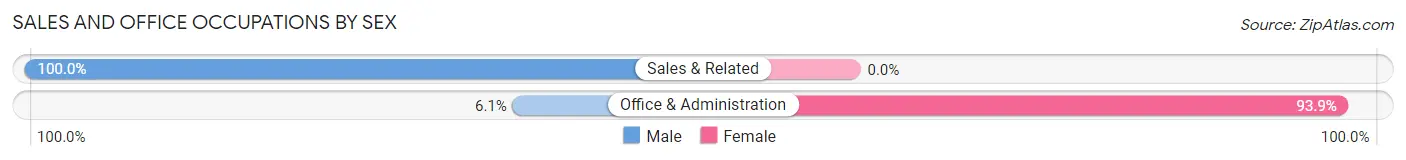
Sales and Office Occupations by Sex
| Occupation | Male | Female |
| Sales & Related | 15 (100.0%) | 0 (0.0%) |
| Office & Administration | 7 (6.1%) | 107 (93.9%) |
| Total (Category) | 22 (17.1%) | 107 (83.0%) |
| Total (Overall) | 226 (35.3%) | 415 (64.7%) |
Natural Resources, Construction and Maintenance Occupations
The most common Natural Resources, Construction and Maintenance occupations in Mount Hermon are , and Construction & Extraction (46 | 7.2%).
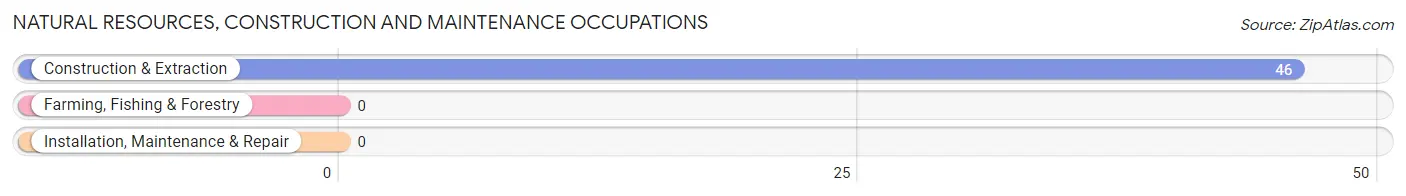
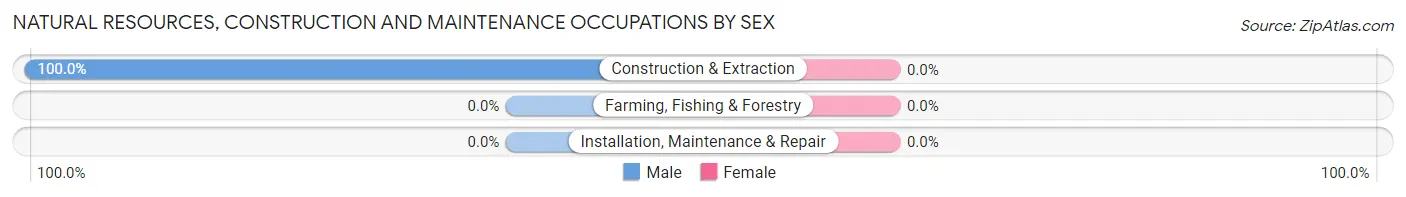
Natural Resources, Construction and Maintenance Occupations by Sex
| Occupation | Male | Female |
| Farming, Fishing & Forestry | 0 (0.0%) | 0 (0.0%) |
| Construction & Extraction | 46 (100.0%) | 0 (0.0%) |
| Installation, Maintenance & Repair | 0 (0.0%) | 0 (0.0%) |
| Total (Category) | 46 (100.0%) | 0 (0.0%) |
| Total (Overall) | 226 (35.3%) | 415 (64.7%) |
Production, Transportation and Moving Occupations
The most common Production, Transportation and Moving occupations in Mount Hermon are , and Production (14 | 2.2%).
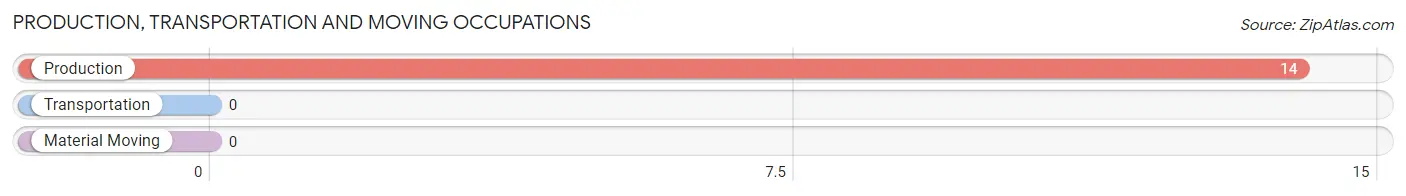
Production, Transportation and Moving Occupations by Sex
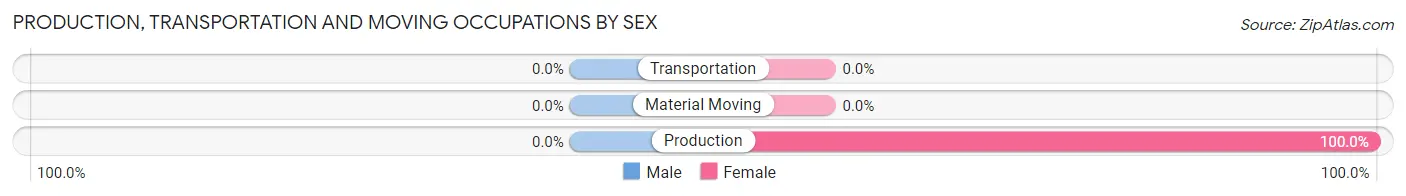
| Occupation | Male | Female |
| Production | 0 (0.0%) | 14 (100.0%) |
| Transportation | 0 (0.0%) | 0 (0.0%) |
| Material Moving | 0 (0.0%) | 0 (0.0%) |
| Total (Category) | 0 (0.0%) | 14 (100.0%) |
| Total (Overall) | 226 (35.3%) | 415 (64.7%) |
Employment Industries by Sex in Mount Hermon
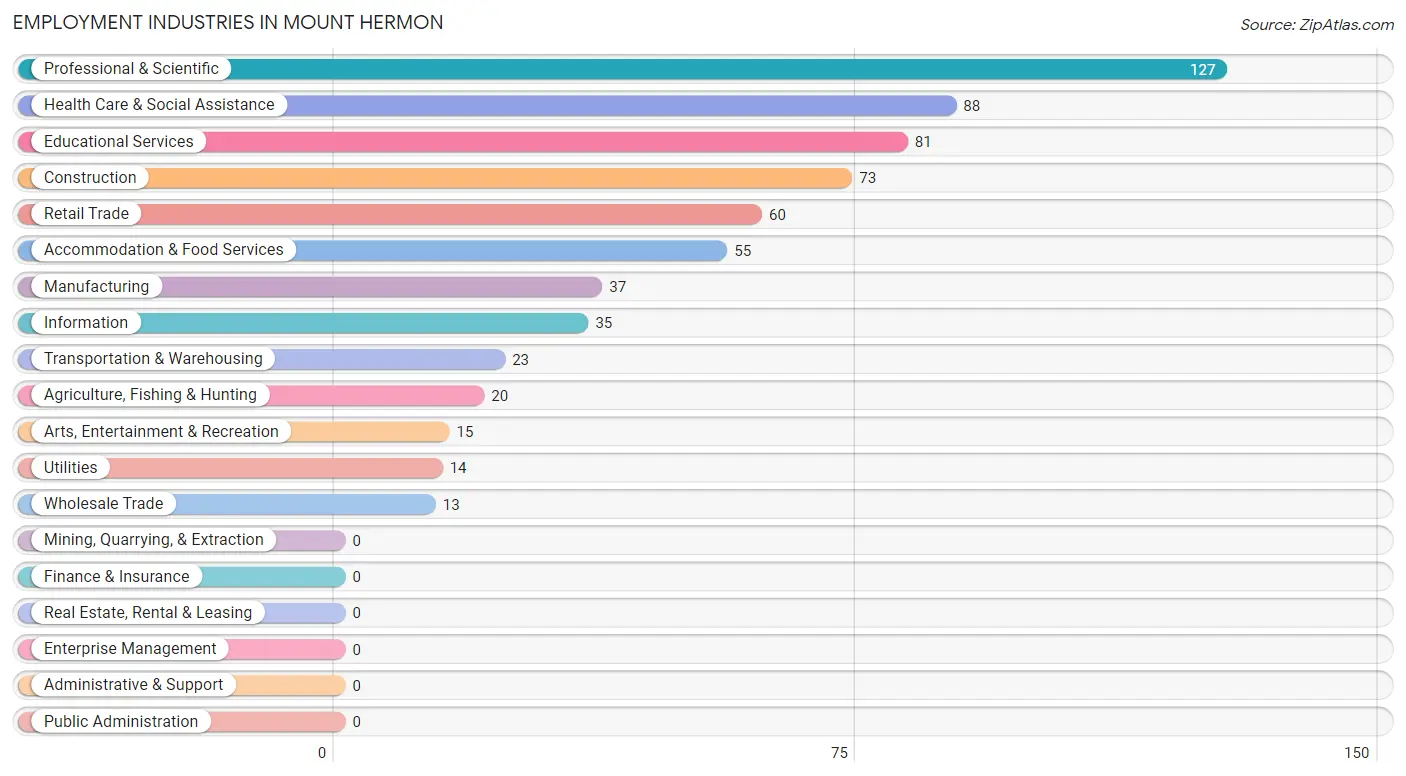
Employment Industries in Mount Hermon
The major employment industries in Mount Hermon include Professional & Scientific (127 | 19.8%), Health Care & Social Assistance (88 | 13.7%), Educational Services (81 | 12.6%), Construction (73 | 11.4%), and Retail Trade (60 | 9.4%).
Employment Industries by Sex in Mount Hermon
The Mount Hermon industries that see more men than women are Information (100.0%), Construction (82.2%), and Educational Services (54.3%), whereas the industries that tend to have a higher number of women are Agriculture, Fishing & Hunting (100.0%), Wholesale Trade (100.0%), and Transportation & Warehousing (100.0%).
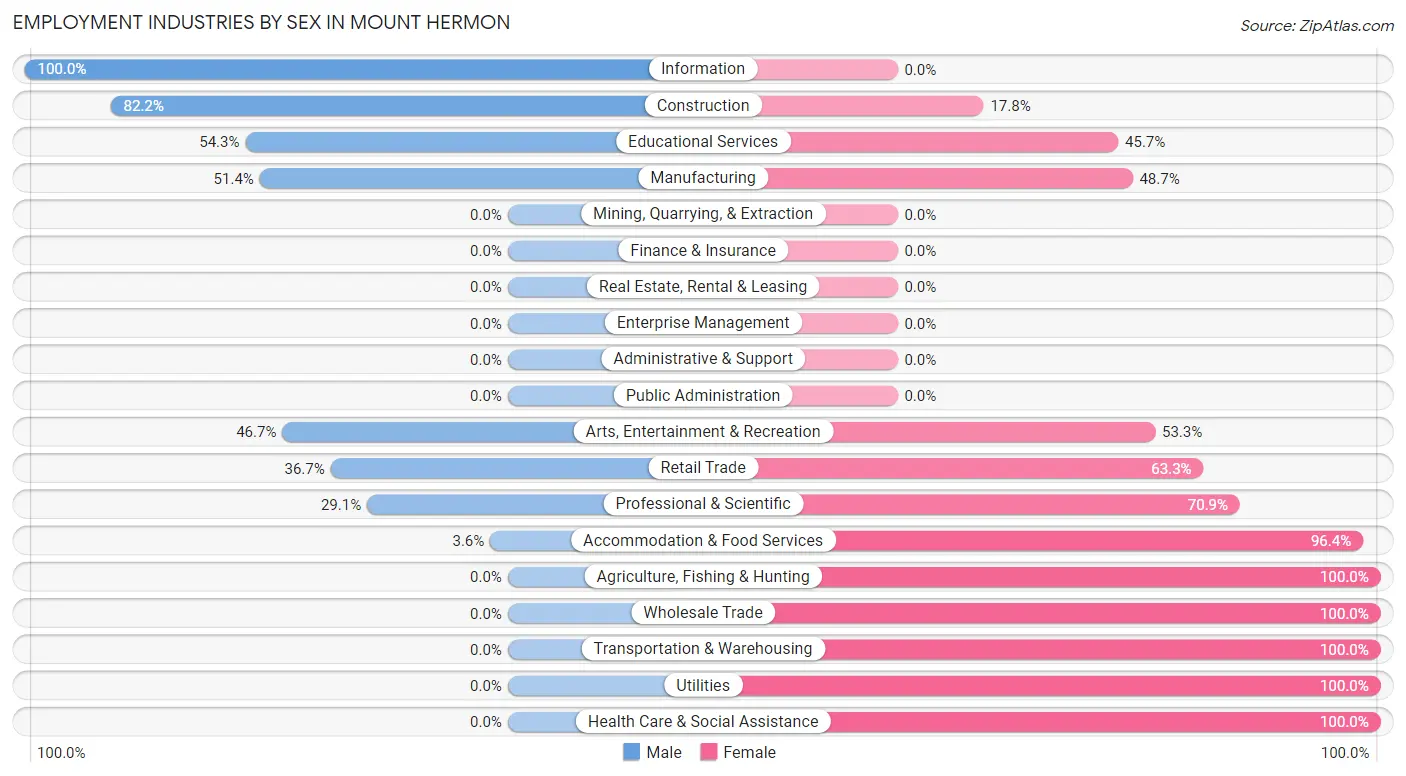
| Industry | Male | Female |
| Agriculture, Fishing & Hunting | 0 (0.0%) | 20 (100.0%) |
| Mining, Quarrying, & Extraction | 0 (0.0%) | 0 (0.0%) |
| Construction | 60 (82.2%) | 13 (17.8%) |
| Manufacturing | 19 (51.3%) | 18 (48.6%) |
| Wholesale Trade | 0 (0.0%) | 13 (100.0%) |
| Retail Trade | 22 (36.7%) | 38 (63.3%) |
| Transportation & Warehousing | 0 (0.0%) | 23 (100.0%) |
| Utilities | 0 (0.0%) | 14 (100.0%) |
| Information | 35 (100.0%) | 0 (0.0%) |
| Finance & Insurance | 0 (0.0%) | 0 (0.0%) |
| Real Estate, Rental & Leasing | 0 (0.0%) | 0 (0.0%) |
| Professional & Scientific | 37 (29.1%) | 90 (70.9%) |
| Enterprise Management | 0 (0.0%) | 0 (0.0%) |
| Administrative & Support | 0 (0.0%) | 0 (0.0%) |
| Educational Services | 44 (54.3%) | 37 (45.7%) |
| Health Care & Social Assistance | 0 (0.0%) | 88 (100.0%) |
| Arts, Entertainment & Recreation | 7 (46.7%) | 8 (53.3%) |
| Accommodation & Food Services | 2 (3.6%) | 53 (96.4%) |
| Public Administration | 0 (0.0%) | 0 (0.0%) |
| Total | 226 (35.3%) | 415 (64.7%) |
Education in Mount Hermon
School Enrollment in Mount Hermon
The most common levels of schooling among the 172 students in Mount Hermon are graduate / professional (57 | 33.1%), elementary school (45 | 26.2%), and middle school (31 | 18.0%).
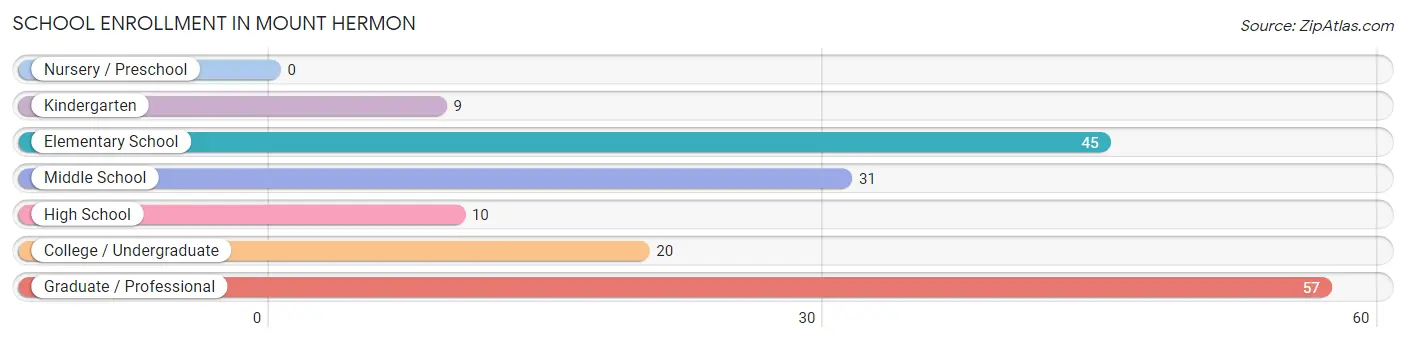
| School Level | # Students | % Students |
| Nursery / Preschool | 0 | 0.0% |
| Kindergarten | 9 | 5.2% |
| Elementary School | 45 | 26.2% |
| Middle School | 31 | 18.0% |
| High School | 10 | 5.8% |
| College / Undergraduate | 20 | 11.6% |
| Graduate / Professional | 57 | 33.1% |
| Total | 172 | 100.0% |
School Enrollment by Age by Funding Source in Mount Hermon
Out of a total of 172 students who are enrolled in schools in Mount Hermon, 27 (15.7%) attend a private institution, while the remaining 145 (84.3%) are enrolled in public schools. The age group of 5 to 9 year old has the highest likelihood of being enrolled in private schools, with 14 (25.9% in the age bracket) enrolled. Conversely, the age group of 10 to 14 year olds has the lowest likelihood of being enrolled in a private school, with 31 (100.0% in the age bracket) attending a public institution.
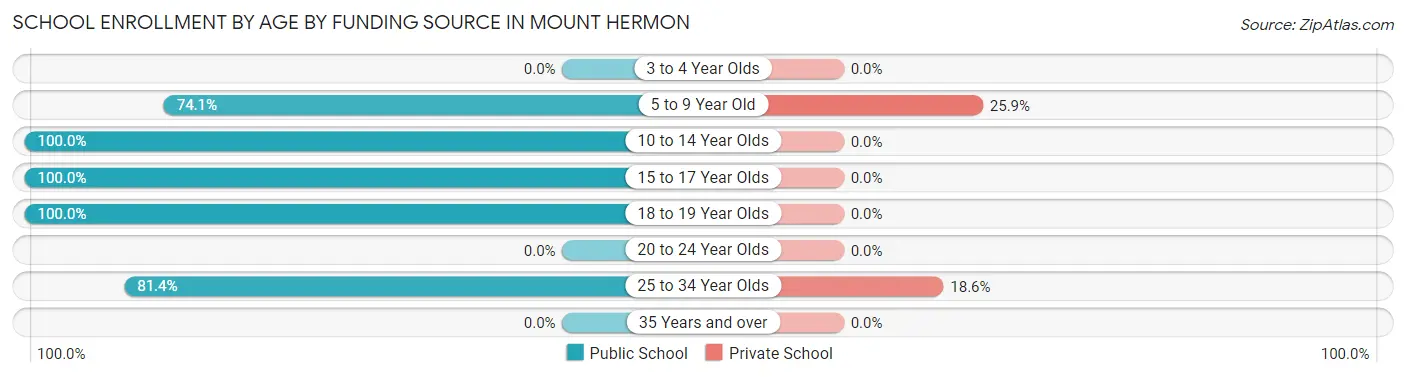
| Age Bracket | Public School | Private School |
| 3 to 4 Year Olds | 0 (0.0%) | 0 (0.0%) |
| 5 to 9 Year Old | 40 (74.1%) | 14 (25.9%) |
| 10 to 14 Year Olds | 31 (100.0%) | 0 (0.0%) |
| 15 to 17 Year Olds | 10 (100.0%) | 0 (0.0%) |
| 18 to 19 Year Olds | 7 (100.0%) | 0 (0.0%) |
| 20 to 24 Year Olds | 0 (0.0%) | 0 (0.0%) |
| 25 to 34 Year Olds | 57 (81.4%) | 13 (18.6%) |
| 35 Years and over | 0 (0.0%) | 0 (0.0%) |
| Total | 145 (84.3%) | 27 (15.7%) |
Educational Attainment by Field of Study in Mount Hermon
Psychology (114 | 15.5%), literature & languages (95 | 13.0%), social sciences (94 | 12.8%), communications (89 | 12.1%), and business (80 | 10.9%) are the most common fields of study among 733 individuals in Mount Hermon who have obtained a bachelor's degree or higher.
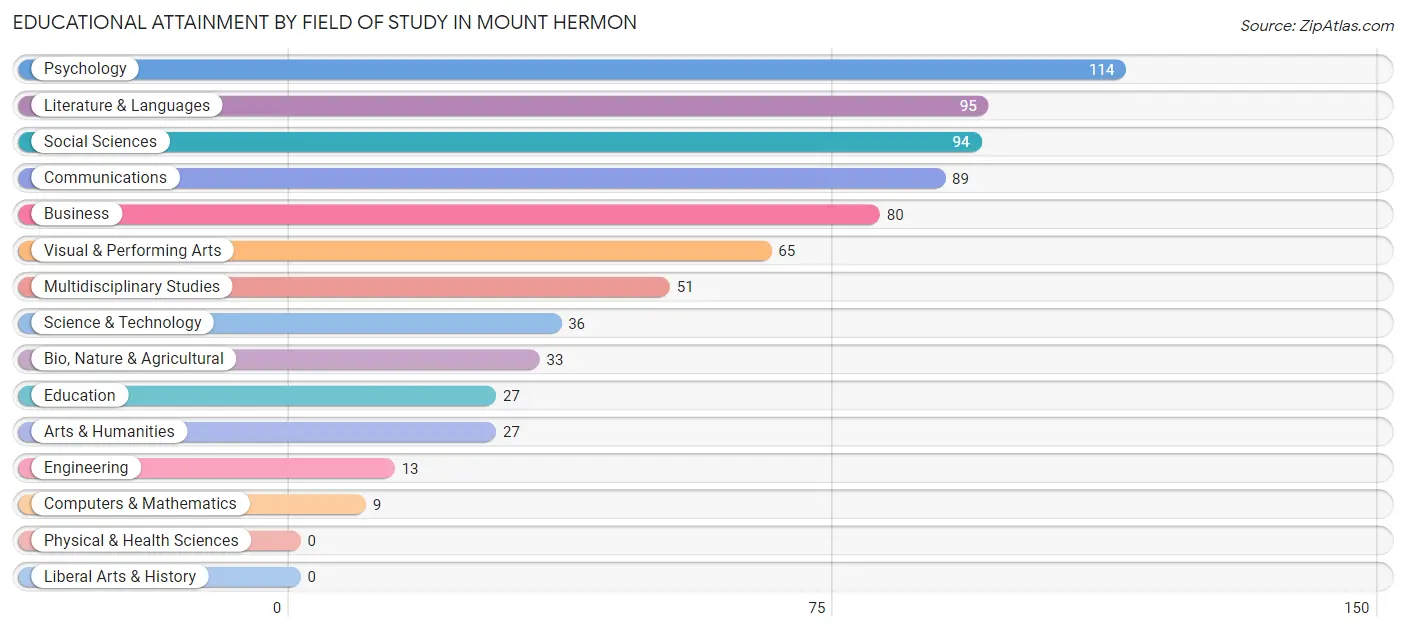
| Field of Study | # Graduates | % Graduates |
| Computers & Mathematics | 9 | 1.2% |
| Bio, Nature & Agricultural | 33 | 4.5% |
| Physical & Health Sciences | 0 | 0.0% |
| Psychology | 114 | 15.5% |
| Social Sciences | 94 | 12.8% |
| Engineering | 13 | 1.8% |
| Multidisciplinary Studies | 51 | 7.0% |
| Science & Technology | 36 | 4.9% |
| Business | 80 | 10.9% |
| Education | 27 | 3.7% |
| Literature & Languages | 95 | 13.0% |
| Liberal Arts & History | 0 | 0.0% |
| Visual & Performing Arts | 65 | 8.9% |
| Communications | 89 | 12.1% |
| Arts & Humanities | 27 | 3.7% |
| Total | 733 | 100.0% |
Transportation & Commute in Mount Hermon
Vehicle Availability by Sex in Mount Hermon
The most prevalent vehicle ownership categories in Mount Hermon are males with 2 vehicles (207, accounting for 84.5%) and females with 2 vehicles (266, making up 54.3%).
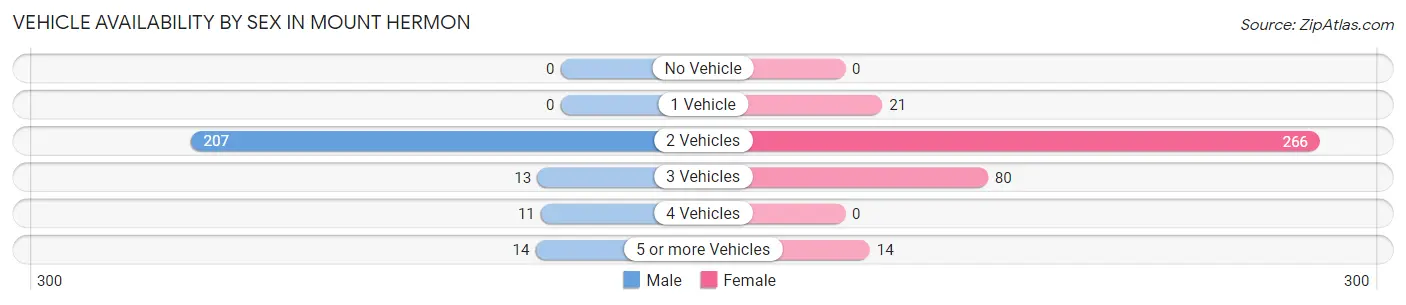
| Vehicles Available | Male | Female |
| No Vehicle | 0 (0.0%) | 0 (0.0%) |
| 1 Vehicle | 0 (0.0%) | 21 (5.5%) |
| 2 Vehicles | 207 (84.5%) | 266 (69.8%) |
| 3 Vehicles | 13 (5.3%) | 80 (21.0%) |
| 4 Vehicles | 11 (4.5%) | 0 (0.0%) |
| 5 or more Vehicles | 14 (5.7%) | 14 (3.7%) |
| Total | 245 (100.0%) | 381 (100.0%) |
Commute Time in Mount Hermon
The most frequently occuring commute durations in Mount Hermon are 15 to 19 minutes (141 commuters, 27.1%), less than 5 minutes (118 commuters, 22.7%), and 45 to 59 minutes (90 commuters, 17.3%).
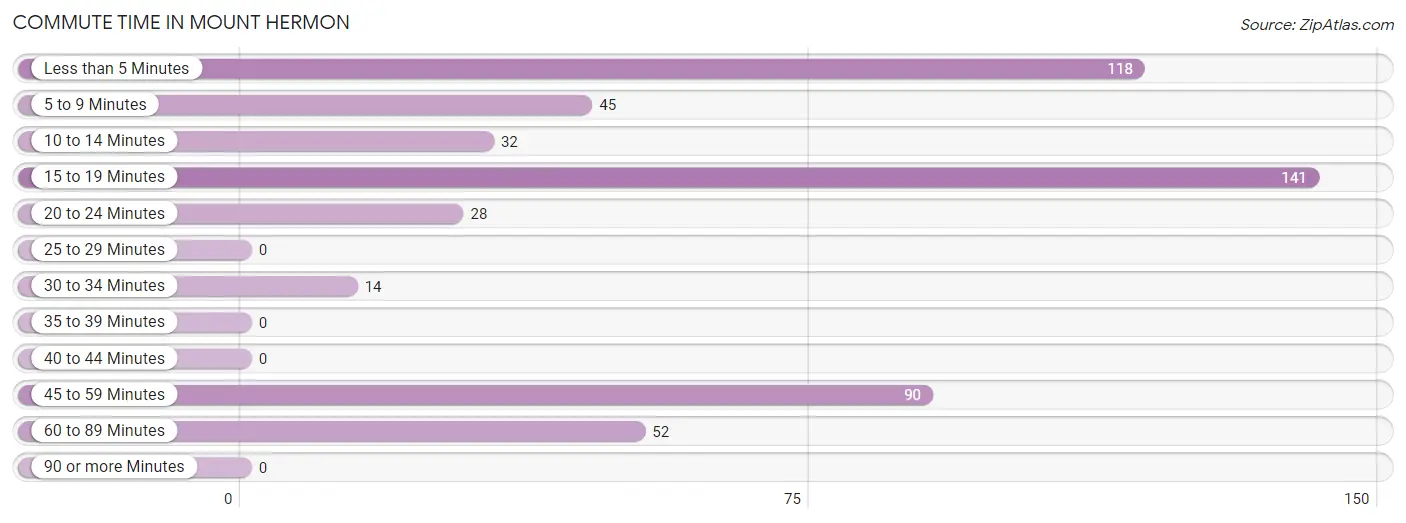
| Commute Time | # Commuters | % Commuters |
| Less than 5 Minutes | 118 | 22.7% |
| 5 to 9 Minutes | 45 | 8.6% |
| 10 to 14 Minutes | 32 | 6.1% |
| 15 to 19 Minutes | 141 | 27.1% |
| 20 to 24 Minutes | 28 | 5.4% |
| 25 to 29 Minutes | 0 | 0.0% |
| 30 to 34 Minutes | 14 | 2.7% |
| 35 to 39 Minutes | 0 | 0.0% |
| 40 to 44 Minutes | 0 | 0.0% |
| 45 to 59 Minutes | 90 | 17.3% |
| 60 to 89 Minutes | 52 | 10.0% |
| 90 or more Minutes | 0 | 0.0% |
Commute Time by Sex in Mount Hermon
The most common commute times in Mount Hermon are 45 to 59 minutes (90 commuters, 40.4%) for males and 15 to 19 minutes (103 commuters, 34.7%) for females.
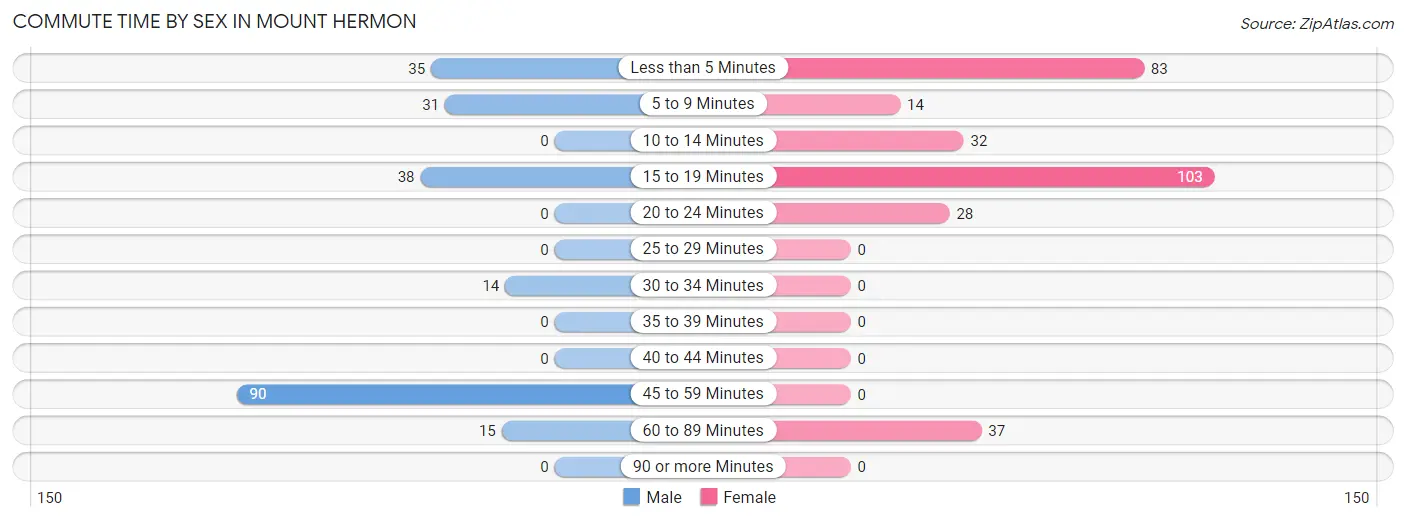
| Commute Time | Male | Female |
| Less than 5 Minutes | 35 (15.7%) | 83 (28.0%) |
| 5 to 9 Minutes | 31 (13.9%) | 14 (4.7%) |
| 10 to 14 Minutes | 0 (0.0%) | 32 (10.8%) |
| 15 to 19 Minutes | 38 (17.0%) | 103 (34.7%) |
| 20 to 24 Minutes | 0 (0.0%) | 28 (9.4%) |
| 25 to 29 Minutes | 0 (0.0%) | 0 (0.0%) |
| 30 to 34 Minutes | 14 (6.3%) | 0 (0.0%) |
| 35 to 39 Minutes | 0 (0.0%) | 0 (0.0%) |
| 40 to 44 Minutes | 0 (0.0%) | 0 (0.0%) |
| 45 to 59 Minutes | 90 (40.4%) | 0 (0.0%) |
| 60 to 89 Minutes | 15 (6.7%) | 37 (12.5%) |
| 90 or more Minutes | 0 (0.0%) | 0 (0.0%) |
Time of Departure to Work by Sex in Mount Hermon
The most frequent times of departure to work in Mount Hermon are 8:00 AM to 8:29 AM (62, 27.8%) for males and 8:00 AM to 8:29 AM (124, 41.7%) for females.
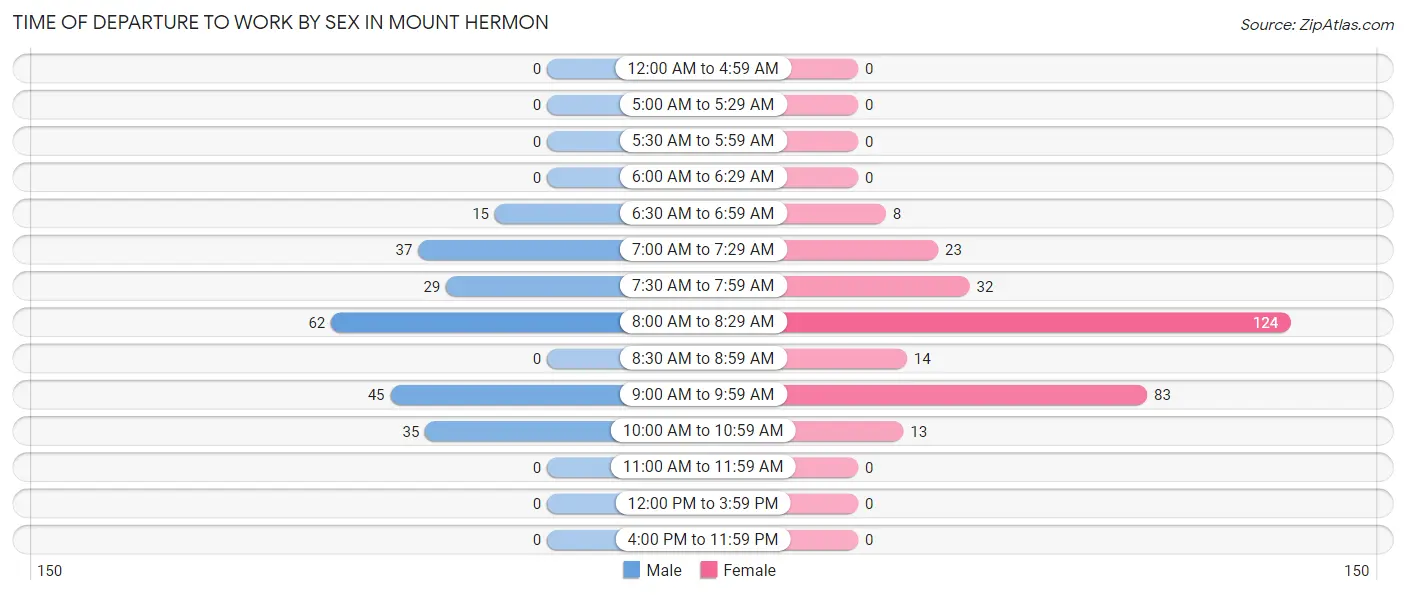
| Time of Departure | Male | Female |
| 12:00 AM to 4:59 AM | 0 (0.0%) | 0 (0.0%) |
| 5:00 AM to 5:29 AM | 0 (0.0%) | 0 (0.0%) |
| 5:30 AM to 5:59 AM | 0 (0.0%) | 0 (0.0%) |
| 6:00 AM to 6:29 AM | 0 (0.0%) | 0 (0.0%) |
| 6:30 AM to 6:59 AM | 15 (6.7%) | 8 (2.7%) |
| 7:00 AM to 7:29 AM | 37 (16.6%) | 23 (7.7%) |
| 7:30 AM to 7:59 AM | 29 (13.0%) | 32 (10.8%) |
| 8:00 AM to 8:29 AM | 62 (27.8%) | 124 (41.7%) |
| 8:30 AM to 8:59 AM | 0 (0.0%) | 14 (4.7%) |
| 9:00 AM to 9:59 AM | 45 (20.2%) | 83 (28.0%) |
| 10:00 AM to 10:59 AM | 35 (15.7%) | 13 (4.4%) |
| 11:00 AM to 11:59 AM | 0 (0.0%) | 0 (0.0%) |
| 12:00 PM to 3:59 PM | 0 (0.0%) | 0 (0.0%) |
| 4:00 PM to 11:59 PM | 0 (0.0%) | 0 (0.0%) |
| Total | 223 (100.0%) | 297 (100.0%) |
Housing Occupancy in Mount Hermon
Occupancy by Ownership in Mount Hermon
Of the total 506 dwellings in Mount Hermon, owner-occupied units account for 366 (72.3%), while renter-occupied units make up 140 (27.7%).
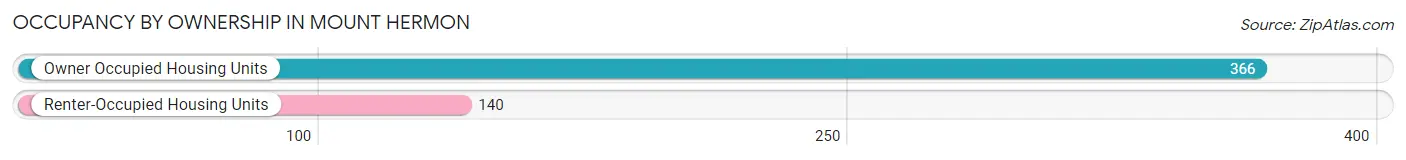
| Occupancy | # Housing Units | % Housing Units |
| Owner Occupied Housing Units | 366 | 72.3% |
| Renter-Occupied Housing Units | 140 | 27.7% |
| Total Occupied Housing Units | 506 | 100.0% |
Occupancy by Household Size in Mount Hermon
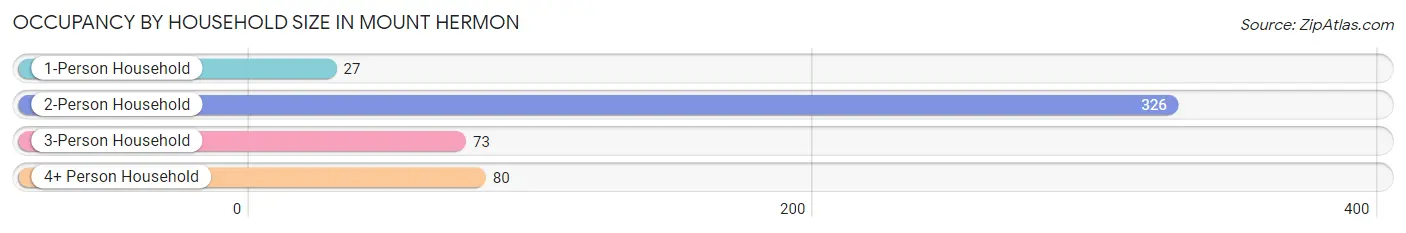
| Household Size | # Housing Units | % Housing Units |
| 1-Person Household | 27 | 5.3% |
| 2-Person Household | 326 | 64.4% |
| 3-Person Household | 73 | 14.4% |
| 4+ Person Household | 80 | 15.8% |
| Total Housing Units | 506 | 100.0% |
Occupancy by Ownership by Household Size in Mount Hermon
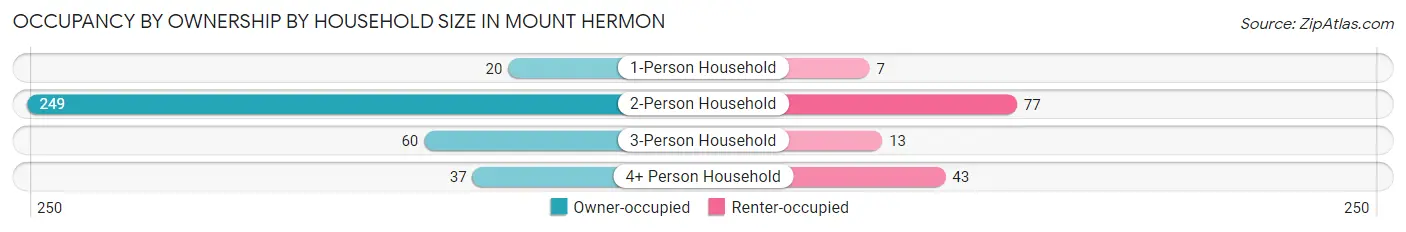
| Household Size | Owner-occupied | Renter-occupied |
| 1-Person Household | 20 (74.1%) | 7 (25.9%) |
| 2-Person Household | 249 (76.4%) | 77 (23.6%) |
| 3-Person Household | 60 (82.2%) | 13 (17.8%) |
| 4+ Person Household | 37 (46.3%) | 43 (53.7%) |
| Total Housing Units | 366 (72.3%) | 140 (27.7%) |
Occupancy by Educational Attainment in Mount Hermon
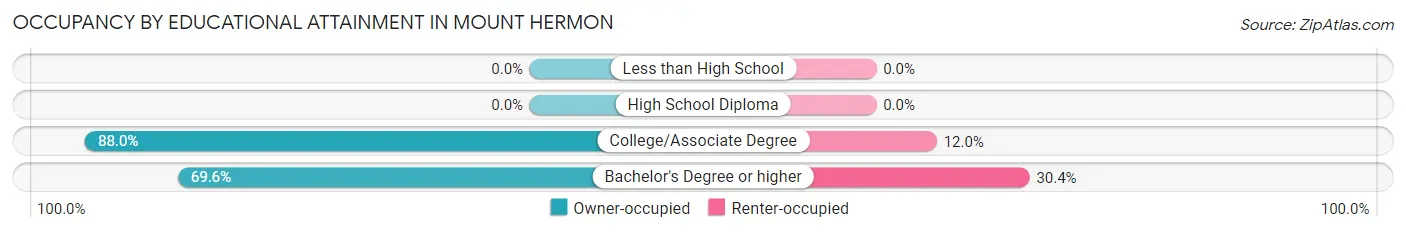
| Household Size | Owner-occupied | Renter-occupied |
| Less than High School | 0 (0.0%) | 0 (0.0%) |
| High School Diploma | 0 (0.0%) | 0 (0.0%) |
| College/Associate Degree | 66 (88.0%) | 9 (12.0%) |
| Bachelor's Degree or higher | 300 (69.6%) | 131 (30.4%) |
Occupancy by Age of Householder in Mount Hermon
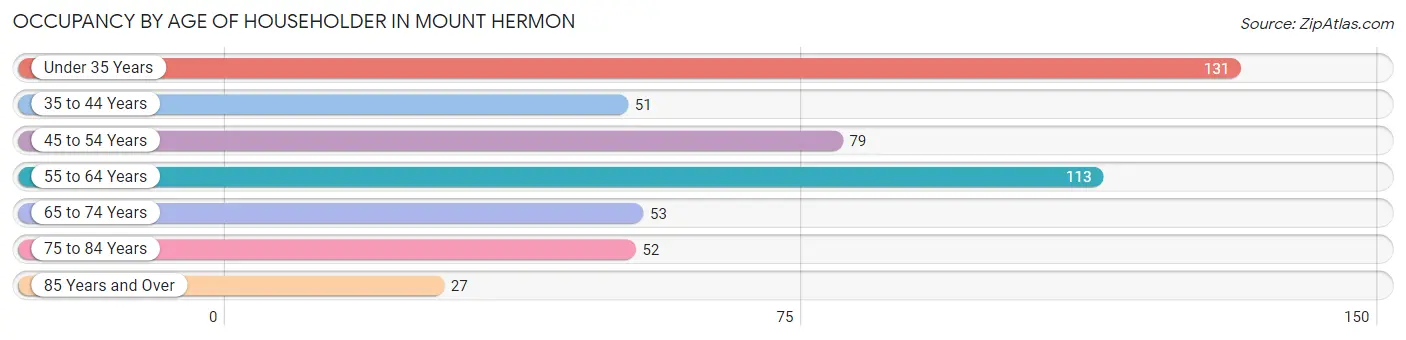
| Age Bracket | # Households | % Households |
| Under 35 Years | 131 | 25.9% |
| 35 to 44 Years | 51 | 10.1% |
| 45 to 54 Years | 79 | 15.6% |
| 55 to 64 Years | 113 | 22.3% |
| 65 to 74 Years | 53 | 10.5% |
| 75 to 84 Years | 52 | 10.3% |
| 85 Years and Over | 27 | 5.3% |
| Total | 506 | 100.0% |
Housing Finances in Mount Hermon
Median Income by Occupancy in Mount Hermon
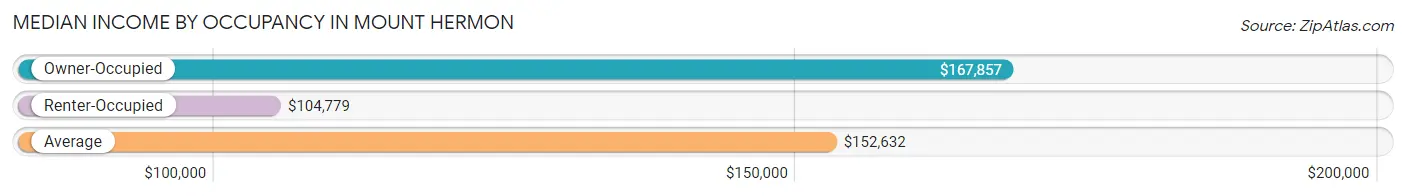
| Occupancy Type | # Households | Median Income |
| Owner-Occupied | 366 (72.3%) | $167,857 |
| Renter-Occupied | 140 (27.7%) | $104,779 |
| Average | 506 (100.0%) | $152,632 |
Occupancy by Householder Income Bracket in Mount Hermon
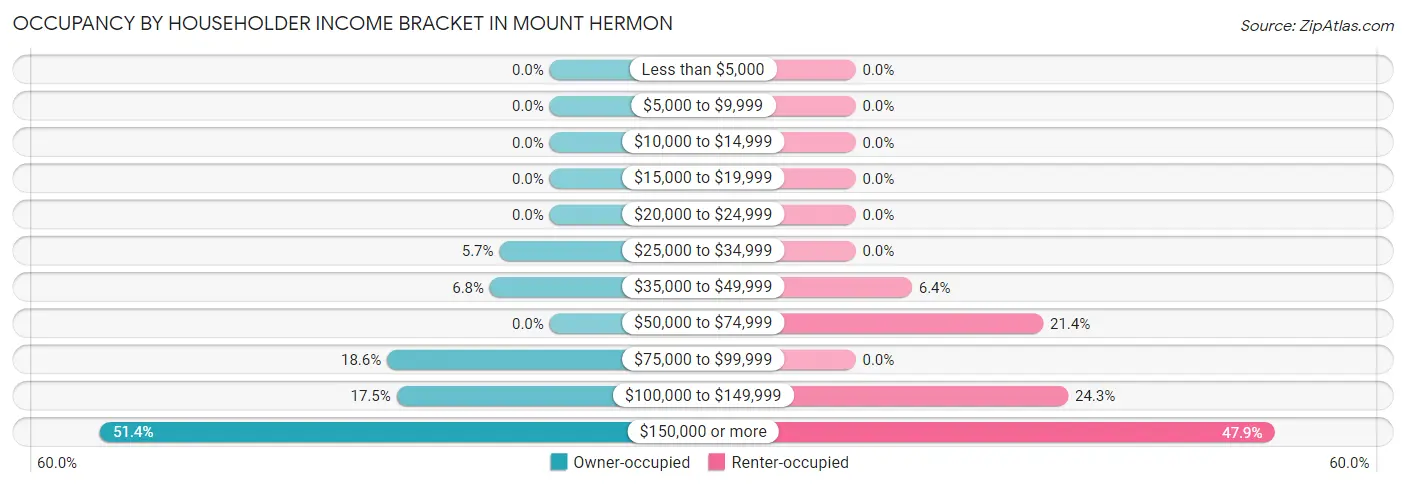
| Income Bracket | Owner-occupied | Renter-occupied |
| Less than $5,000 | 0 (0.0%) | 0 (0.0%) |
| $5,000 to $9,999 | 0 (0.0%) | 0 (0.0%) |
| $10,000 to $14,999 | 0 (0.0%) | 0 (0.0%) |
| $15,000 to $19,999 | 0 (0.0%) | 0 (0.0%) |
| $20,000 to $24,999 | 0 (0.0%) | 0 (0.0%) |
| $25,000 to $34,999 | 21 (5.7%) | 0 (0.0%) |
| $35,000 to $49,999 | 25 (6.8%) | 9 (6.4%) |
| $50,000 to $74,999 | 0 (0.0%) | 30 (21.4%) |
| $75,000 to $99,999 | 68 (18.6%) | 0 (0.0%) |
| $100,000 to $149,999 | 64 (17.5%) | 34 (24.3%) |
| $150,000 or more | 188 (51.4%) | 67 (47.9%) |
| Total | 366 (100.0%) | 140 (100.0%) |
Monthly Housing Cost Tiers in Mount Hermon
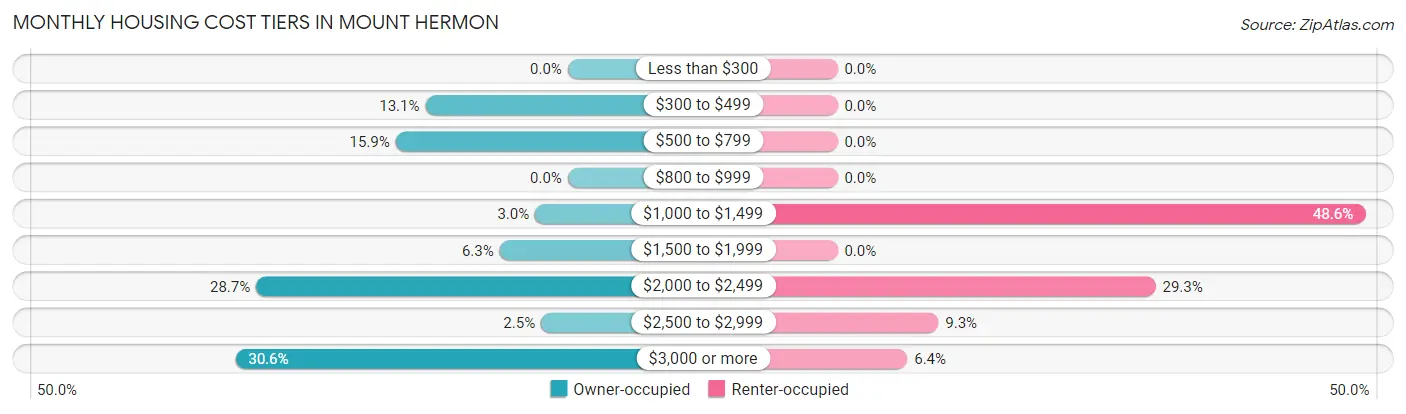
| Monthly Cost | Owner-occupied | Renter-occupied |
| Less than $300 | 0 (0.0%) | 0 (0.0%) |
| $300 to $499 | 48 (13.1%) | 0 (0.0%) |
| $500 to $799 | 58 (15.9%) | 0 (0.0%) |
| $800 to $999 | 0 (0.0%) | 0 (0.0%) |
| $1,000 to $1,499 | 11 (3.0%) | 68 (48.6%) |
| $1,500 to $1,999 | 23 (6.3%) | 0 (0.0%) |
| $2,000 to $2,499 | 105 (28.7%) | 41 (29.3%) |
| $2,500 to $2,999 | 9 (2.5%) | 13 (9.3%) |
| $3,000 or more | 112 (30.6%) | 9 (6.4%) |
| Total | 366 (100.0%) | 140 (100.0%) |
Physical Housing Characteristics in Mount Hermon
Housing Structures in Mount Hermon
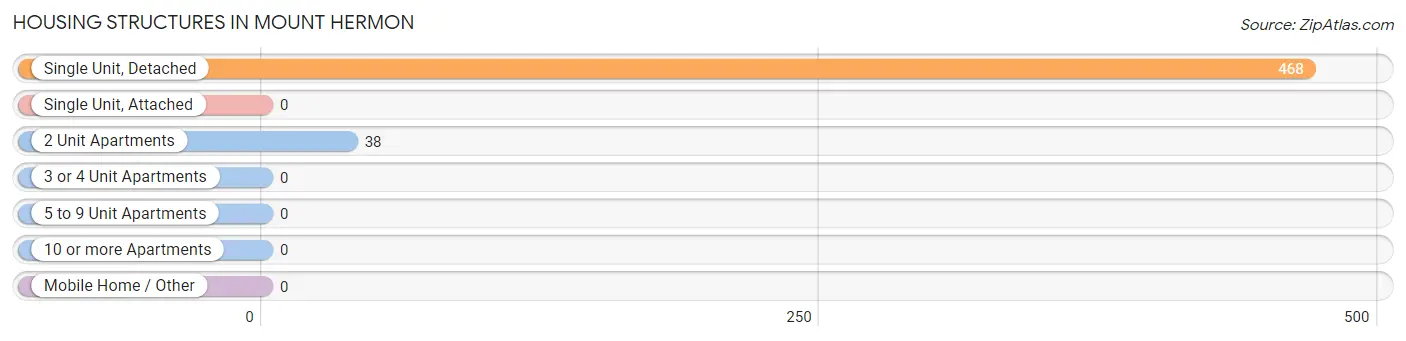
| Structure Type | # Housing Units | % Housing Units |
| Single Unit, Detached | 468 | 92.5% |
| Single Unit, Attached | 0 | 0.0% |
| 2 Unit Apartments | 38 | 7.5% |
| 3 or 4 Unit Apartments | 0 | 0.0% |
| 5 to 9 Unit Apartments | 0 | 0.0% |
| 10 or more Apartments | 0 | 0.0% |
| Mobile Home / Other | 0 | 0.0% |
| Total | 506 | 100.0% |
Housing Structures by Occupancy in Mount Hermon
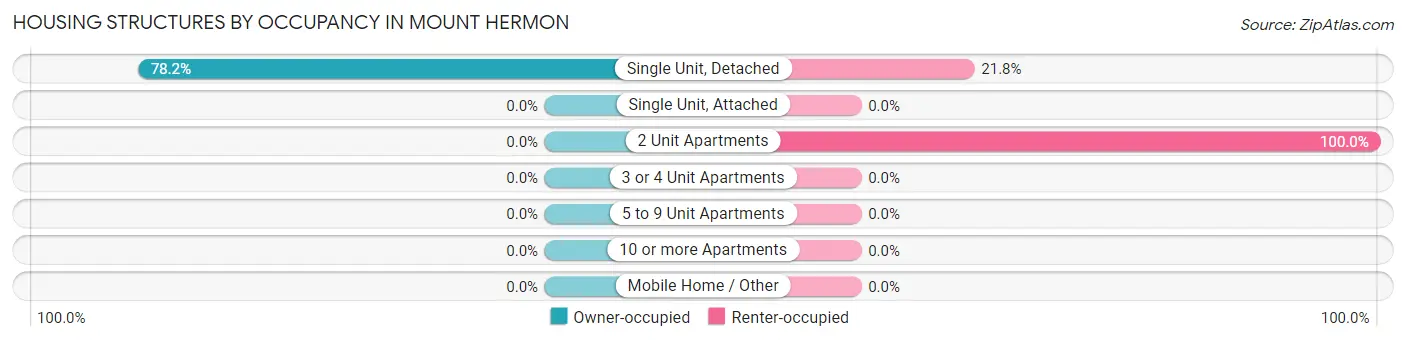
| Structure Type | Owner-occupied | Renter-occupied |
| Single Unit, Detached | 366 (78.2%) | 102 (21.8%) |
| Single Unit, Attached | 0 (0.0%) | 0 (0.0%) |
| 2 Unit Apartments | 0 (0.0%) | 38 (100.0%) |
| 3 or 4 Unit Apartments | 0 (0.0%) | 0 (0.0%) |
| 5 to 9 Unit Apartments | 0 (0.0%) | 0 (0.0%) |
| 10 or more Apartments | 0 (0.0%) | 0 (0.0%) |
| Mobile Home / Other | 0 (0.0%) | 0 (0.0%) |
| Total | 366 (72.3%) | 140 (27.7%) |
Housing Structures by Number of Rooms in Mount Hermon
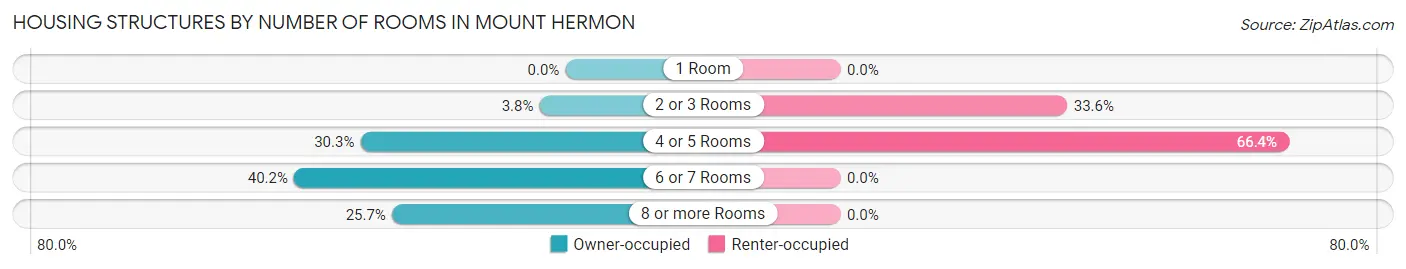
| Number of Rooms | Owner-occupied | Renter-occupied |
| 1 Room | 0 (0.0%) | 0 (0.0%) |
| 2 or 3 Rooms | 14 (3.8%) | 47 (33.6%) |
| 4 or 5 Rooms | 111 (30.3%) | 93 (66.4%) |
| 6 or 7 Rooms | 147 (40.2%) | 0 (0.0%) |
| 8 or more Rooms | 94 (25.7%) | 0 (0.0%) |
| Total | 366 (100.0%) | 140 (100.0%) |
Housing Structure by Heating Type in Mount Hermon
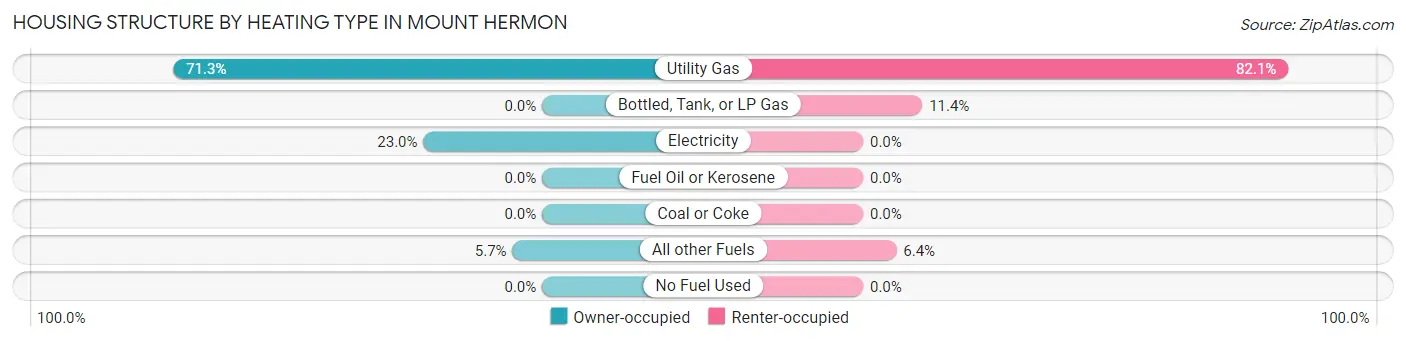
| Heating Type | Owner-occupied | Renter-occupied |
| Utility Gas | 261 (71.3%) | 115 (82.1%) |
| Bottled, Tank, or LP Gas | 0 (0.0%) | 16 (11.4%) |
| Electricity | 84 (23.0%) | 0 (0.0%) |
| Fuel Oil or Kerosene | 0 (0.0%) | 0 (0.0%) |
| Coal or Coke | 0 (0.0%) | 0 (0.0%) |
| All other Fuels | 21 (5.7%) | 9 (6.4%) |
| No Fuel Used | 0 (0.0%) | 0 (0.0%) |
| Total | 366 (100.0%) | 140 (100.0%) |
Household Vehicle Usage in Mount Hermon
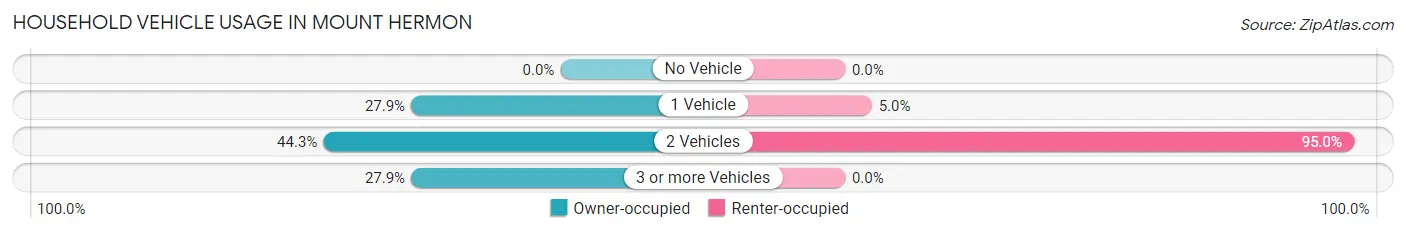
| Vehicles per Household | Owner-occupied | Renter-occupied |
| No Vehicle | 0 (0.0%) | 0 (0.0%) |
| 1 Vehicle | 102 (27.9%) | 7 (5.0%) |
| 2 Vehicles | 162 (44.3%) | 133 (95.0%) |
| 3 or more Vehicles | 102 (27.9%) | 0 (0.0%) |
| Total | 366 (100.0%) | 140 (100.0%) |
Real Estate & Mortgages in Mount Hermon
Real Estate and Mortgage Overview in Mount Hermon
| Characteristic | Without Mortgage | With Mortgage |
| Housing Units | 115 | 251 |
| Median Property Value | $1,053,100 | $1,023,100 |
| Median Household Income | $83,565 | $188 |
| Monthly Housing Costs | $538 | $112 |
| Real Estate Taxes | $2,076 | $0 |
Property Value by Mortgage Status in Mount Hermon
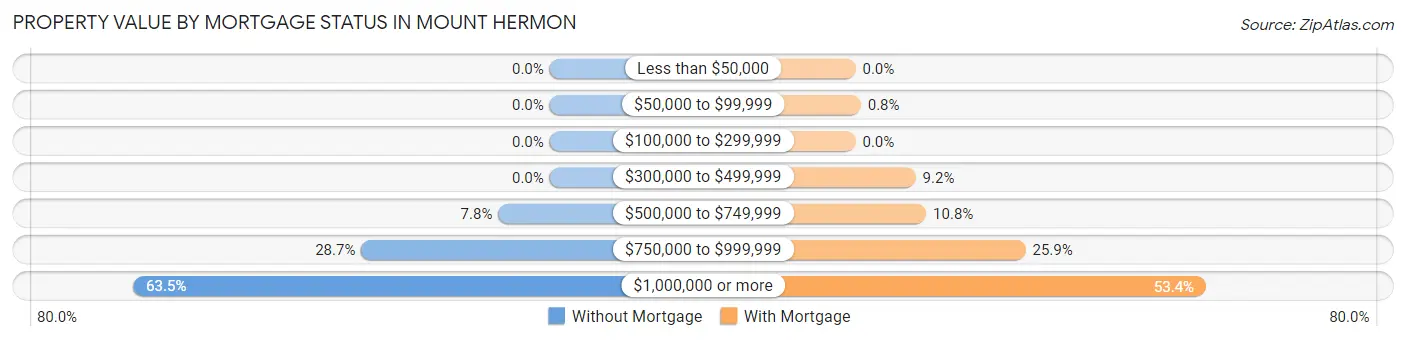
| Property Value | Without Mortgage | With Mortgage |
| Less than $50,000 | 0 (0.0%) | 0 (0.0%) |
| $50,000 to $99,999 | 0 (0.0%) | 2 (0.8%) |
| $100,000 to $299,999 | 0 (0.0%) | 0 (0.0%) |
| $300,000 to $499,999 | 0 (0.0%) | 23 (9.2%) |
| $500,000 to $749,999 | 9 (7.8%) | 27 (10.8%) |
| $750,000 to $999,999 | 33 (28.7%) | 65 (25.9%) |
| $1,000,000 or more | 73 (63.5%) | 134 (53.4%) |
| Total | 115 (100.0%) | 251 (100.0%) |
Household Income by Mortgage Status in Mount Hermon
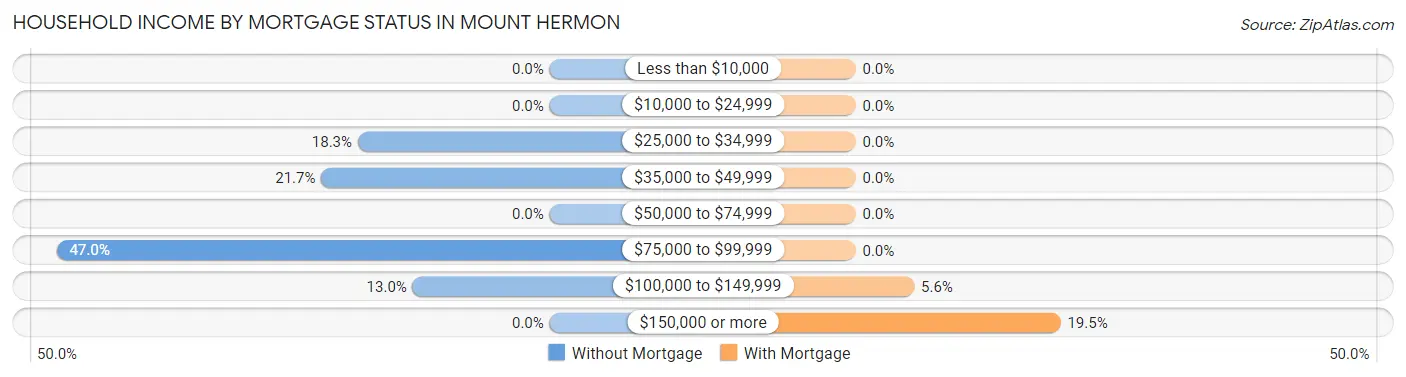
| Household Income | Without Mortgage | With Mortgage |
| Less than $10,000 | 0 (0.0%) | 0 (0.0%) |
| $10,000 to $24,999 | 0 (0.0%) | 0 (0.0%) |
| $25,000 to $34,999 | 21 (18.3%) | 0 (0.0%) |
| $35,000 to $49,999 | 25 (21.7%) | 0 (0.0%) |
| $50,000 to $74,999 | 0 (0.0%) | 0 (0.0%) |
| $75,000 to $99,999 | 54 (47.0%) | 0 (0.0%) |
| $100,000 to $149,999 | 15 (13.0%) | 14 (5.6%) |
| $150,000 or more | 0 (0.0%) | 49 (19.5%) |
| Total | 115 (100.0%) | 251 (100.0%) |
Property Value to Household Income Ratio in Mount Hermon
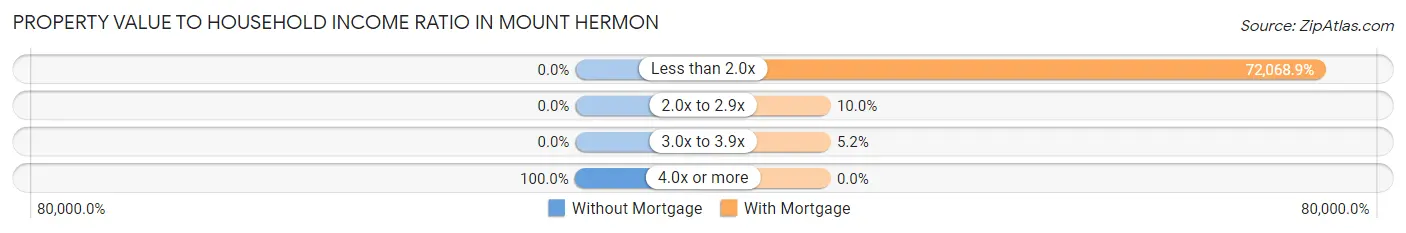
| Value-to-Income Ratio | Without Mortgage | With Mortgage |
| Less than 2.0x | 0 (0.0%) | 180,893 (72,068.9%) |
| 2.0x to 2.9x | 0 (0.0%) | 25 (10.0%) |
| 3.0x to 3.9x | 0 (0.0%) | 13 (5.2%) |
| 4.0x or more | 115 (100.0%) | 0 (0.0%) |
| Total | 115 (100.0%) | 251 (100.0%) |
Real Estate Taxes by Mortgage Status in Mount Hermon
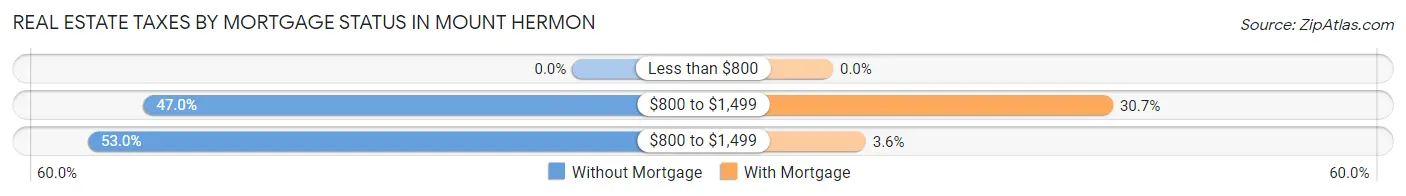
| Property Taxes | Without Mortgage | With Mortgage |
| Less than $800 | 0 (0.0%) | 0 (0.0%) |
| $800 to $1,499 | 54 (47.0%) | 77 (30.7%) |
| $800 to $1,499 | 61 (53.0%) | 9 (3.6%) |
| Total | 115 (100.0%) | 251 (100.0%) |
Health & Disability in Mount Hermon
Health Insurance Coverage by Age in Mount Hermon
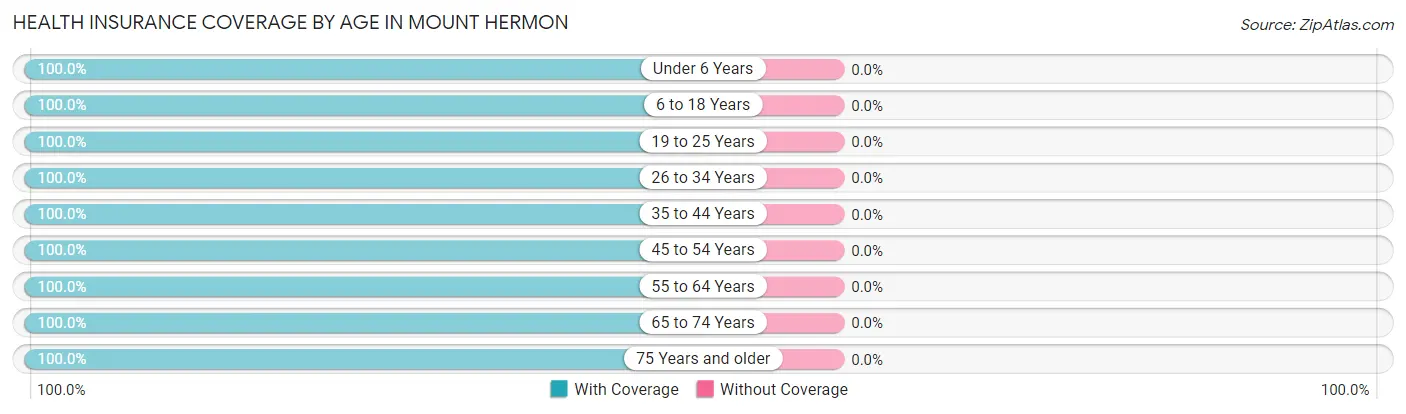
| Age Bracket | With Coverage | Without Coverage |
| Under 6 Years | 97 (100.0%) | 0 (0.0%) |
| 6 to 18 Years | 86 (100.0%) | 0 (0.0%) |
| 19 to 25 Years | 7 (100.0%) | 0 (0.0%) |
| 26 to 34 Years | 268 (100.0%) | 0 (0.0%) |
| 35 to 44 Years | 113 (100.0%) | 0 (0.0%) |
| 45 to 54 Years | 109 (100.0%) | 0 (0.0%) |
| 55 to 64 Years | 159 (100.0%) | 0 (0.0%) |
| 65 to 74 Years | 204 (100.0%) | 0 (0.0%) |
| 75 Years and older | 106 (100.0%) | 0 (0.0%) |
| Total | 1,149 (100.0%) | 0 (0.0%) |
Health Insurance Coverage by Citizenship Status in Mount Hermon
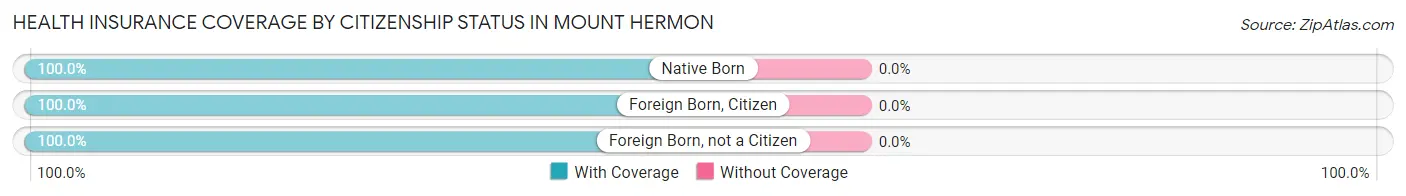
| Citizenship Status | With Coverage | Without Coverage |
| Native Born | 97 (100.0%) | 0 (0.0%) |
| Foreign Born, Citizen | 86 (100.0%) | 0 (0.0%) |
| Foreign Born, not a Citizen | 7 (100.0%) | 0 (0.0%) |
Health Insurance Coverage by Household Income in Mount Hermon
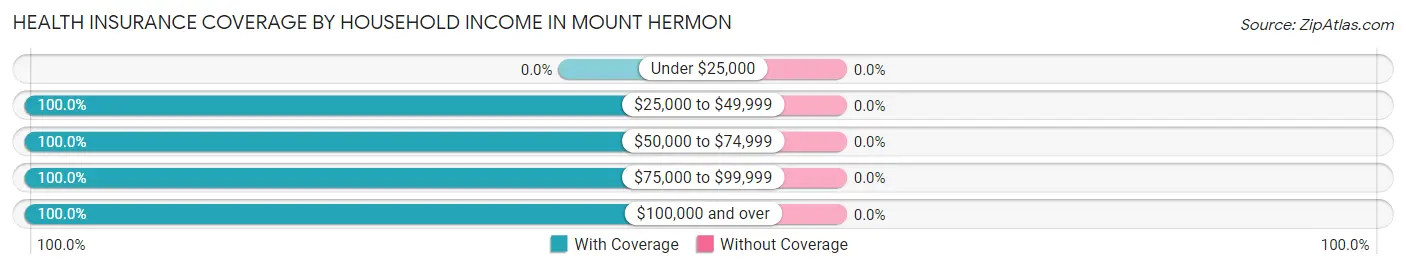
| Household Income | With Coverage | Without Coverage |
| Under $25,000 | 0 (0.0%) | 0 (0.0%) |
| $25,000 to $49,999 | 127 (100.0%) | 0 (0.0%) |
| $50,000 to $74,999 | 67 (100.0%) | 0 (0.0%) |
| $75,000 to $99,999 | 135 (100.0%) | 0 (0.0%) |
| $100,000 and over | 820 (100.0%) | 0 (0.0%) |
Public vs Private Health Insurance Coverage by Age in Mount Hermon
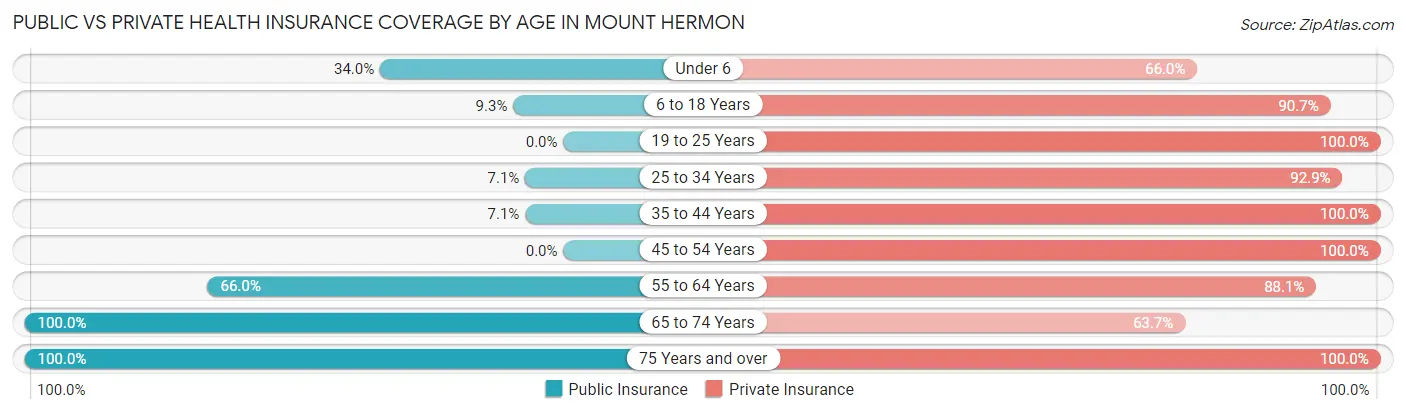
| Age Bracket | Public Insurance | Private Insurance |
| Under 6 | 33 (34.0%) | 64 (66.0%) |
| 6 to 18 Years | 8 (9.3%) | 78 (90.7%) |
| 19 to 25 Years | 0 (0.0%) | 7 (100.0%) |
| 25 to 34 Years | 19 (7.1%) | 249 (92.9%) |
| 35 to 44 Years | 8 (7.1%) | 113 (100.0%) |
| 45 to 54 Years | 0 (0.0%) | 109 (100.0%) |
| 55 to 64 Years | 105 (66.0%) | 140 (88.0%) |
| 65 to 74 Years | 204 (100.0%) | 130 (63.7%) |
| 75 Years and over | 106 (100.0%) | 106 (100.0%) |
| Total | 483 (42.0%) | 996 (86.7%) |
Disability Status by Sex by Age in Mount Hermon
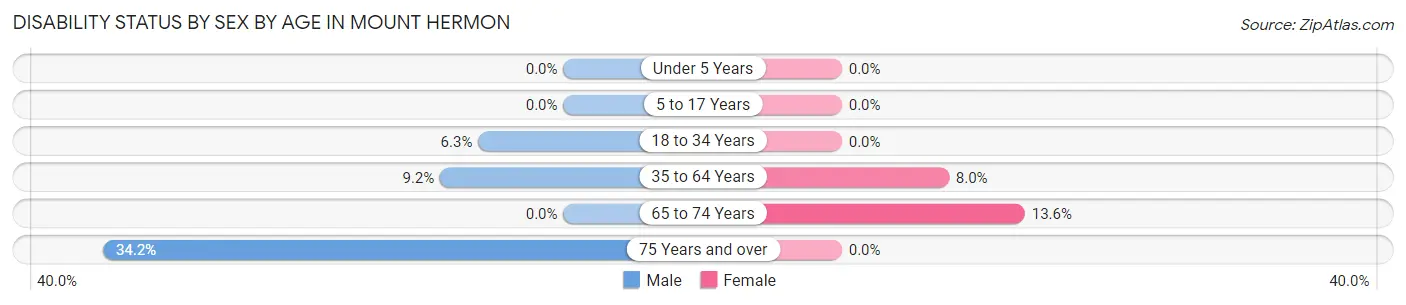
| Age Bracket | Male | Female |
| Under 5 Years | 0 (0.0%) | 0 (0.0%) |
| 5 to 17 Years | 0 (0.0%) | 0 (0.0%) |
| 18 to 34 Years | 6 (6.3%) | 0 (0.0%) |
| 35 to 64 Years | 13 (9.1%) | 19 (8.0%) |
| 65 to 74 Years | 0 (0.0%) | 14 (13.6%) |
| 75 Years and over | 27 (34.2%) | 0 (0.0%) |
Disability Class by Sex by Age in Mount Hermon
Disability Class: Hearing Difficulty
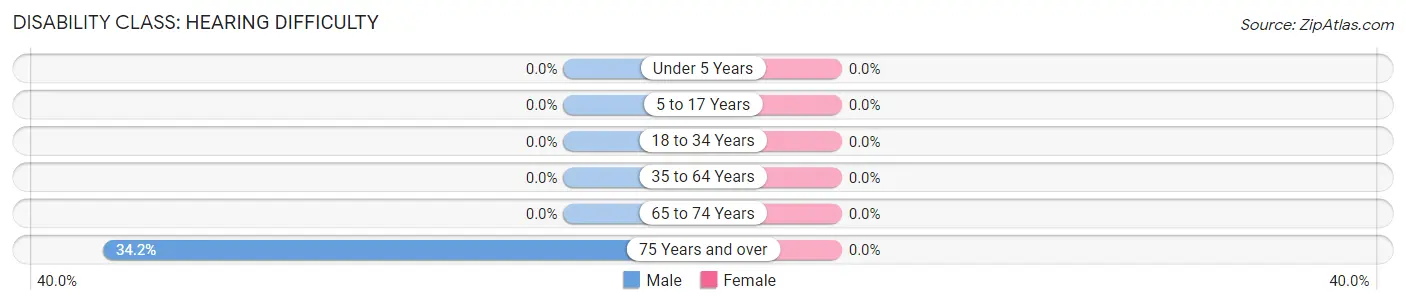
| Age Bracket | Male | Female |
| Under 5 Years | 0 (0.0%) | 0 (0.0%) |
| 5 to 17 Years | 0 (0.0%) | 0 (0.0%) |
| 18 to 34 Years | 0 (0.0%) | 0 (0.0%) |
| 35 to 64 Years | 0 (0.0%) | 0 (0.0%) |
| 65 to 74 Years | 0 (0.0%) | 0 (0.0%) |
| 75 Years and over | 27 (34.2%) | 0 (0.0%) |
Disability Class: Vision Difficulty
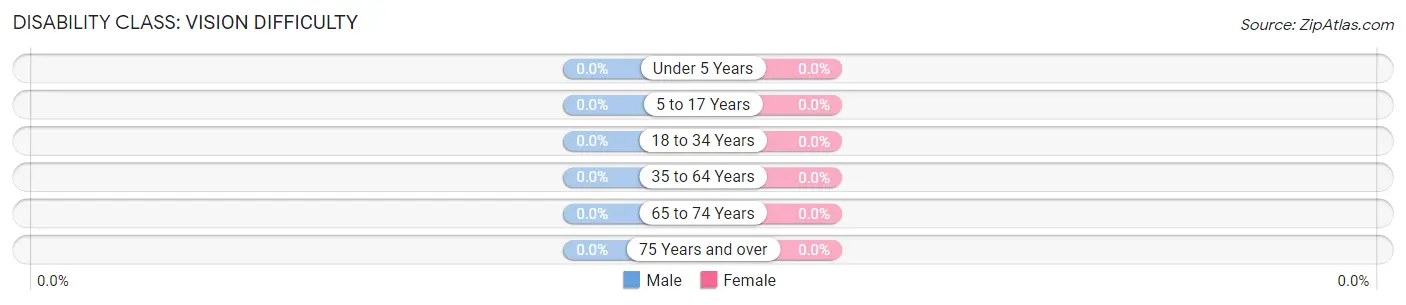
| Age Bracket | Male | Female |
| Under 5 Years | 0 (0.0%) | 0 (0.0%) |
| 5 to 17 Years | 0 (0.0%) | 0 (0.0%) |
| 18 to 34 Years | 0 (0.0%) | 0 (0.0%) |
| 35 to 64 Years | 0 (0.0%) | 0 (0.0%) |
| 65 to 74 Years | 0 (0.0%) | 0 (0.0%) |
| 75 Years and over | 0 (0.0%) | 0 (0.0%) |
Disability Class: Cognitive Difficulty
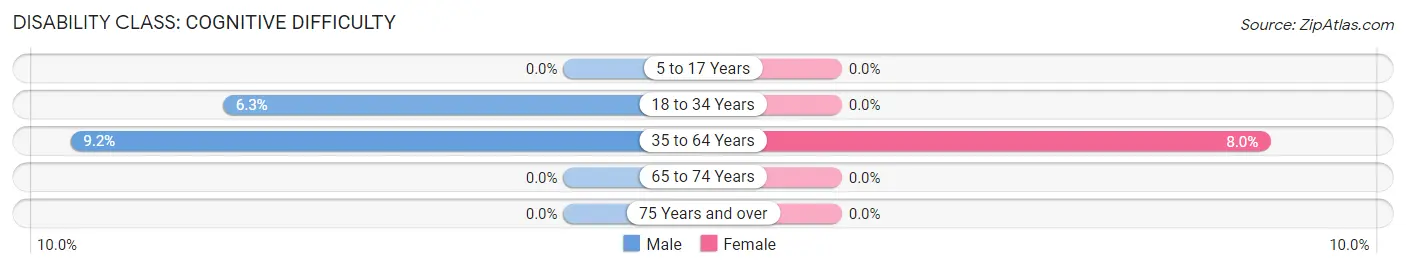
| Age Bracket | Male | Female |
| 5 to 17 Years | 0 (0.0%) | 0 (0.0%) |
| 18 to 34 Years | 6 (6.3%) | 0 (0.0%) |
| 35 to 64 Years | 13 (9.1%) | 19 (8.0%) |
| 65 to 74 Years | 0 (0.0%) | 0 (0.0%) |
| 75 Years and over | 0 (0.0%) | 0 (0.0%) |
Disability Class: Ambulatory Difficulty
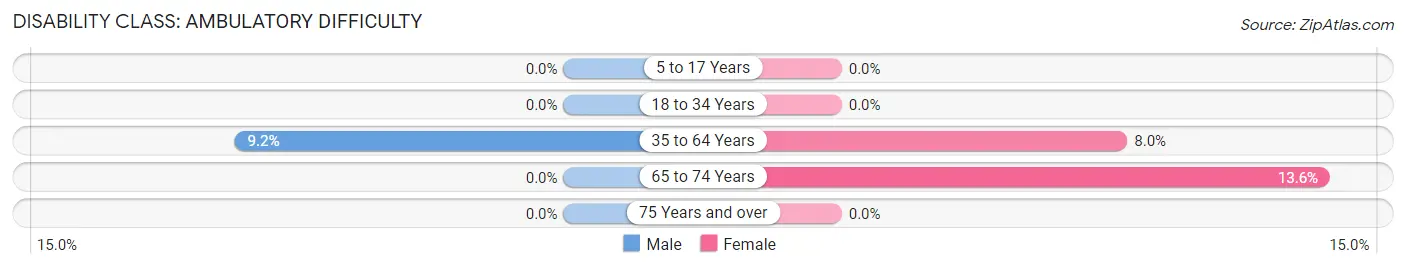
| Age Bracket | Male | Female |
| 5 to 17 Years | 0 (0.0%) | 0 (0.0%) |
| 18 to 34 Years | 0 (0.0%) | 0 (0.0%) |
| 35 to 64 Years | 13 (9.1%) | 19 (8.0%) |
| 65 to 74 Years | 0 (0.0%) | 14 (13.6%) |
| 75 Years and over | 0 (0.0%) | 0 (0.0%) |
Disability Class: Self-Care Difficulty
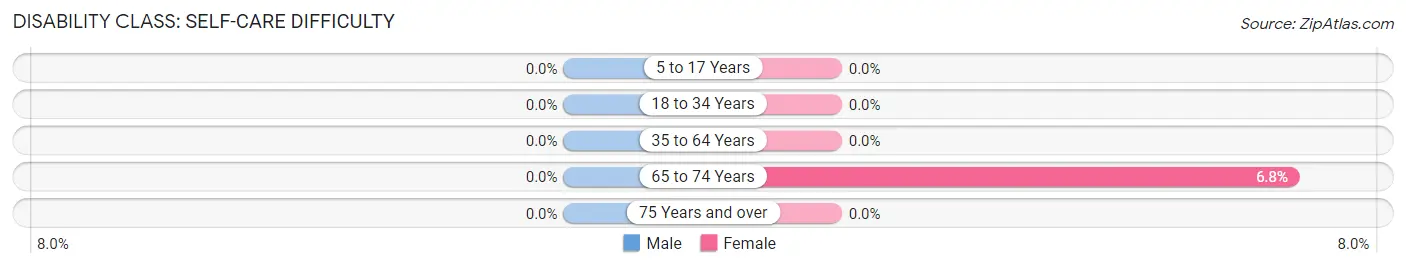
| Age Bracket | Male | Female |
| 5 to 17 Years | 0 (0.0%) | 0 (0.0%) |
| 18 to 34 Years | 0 (0.0%) | 0 (0.0%) |
| 35 to 64 Years | 0 (0.0%) | 0 (0.0%) |
| 65 to 74 Years | 0 (0.0%) | 7 (6.8%) |
| 75 Years and over | 0 (0.0%) | 0 (0.0%) |
Technology Access in Mount Hermon
Computing Device Access in Mount Hermon
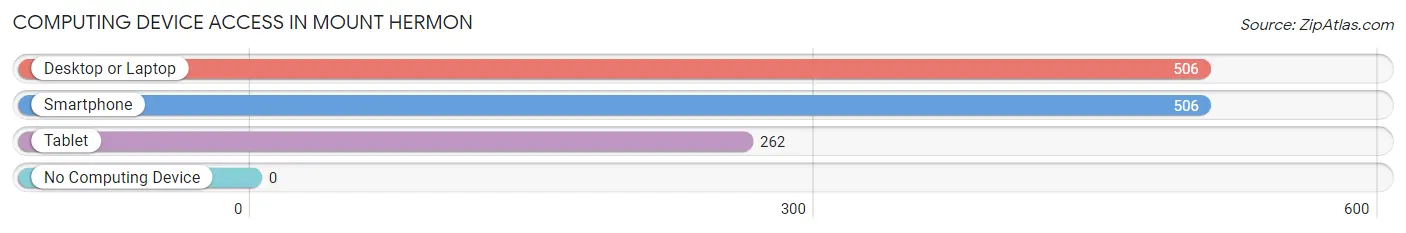
| Device Type | # Households | % Households |
| Desktop or Laptop | 506 | 100.0% |
| Smartphone | 506 | 100.0% |
| Tablet | 262 | 51.8% |
| No Computing Device | 0 | 0.0% |
| Total | 506 | 100.0% |
Internet Access in Mount Hermon
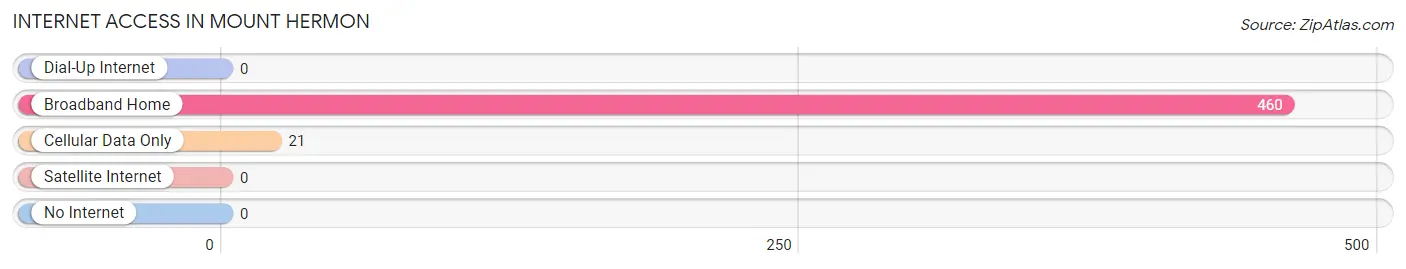
| Internet Type | # Households | % Households |
| Dial-Up Internet | 0 | 0.0% |
| Broadband Home | 460 | 90.9% |
| Cellular Data Only | 21 | 4.2% |
| Satellite Internet | 0 | 0.0% |
| No Internet | 0 | 0.0% |
| Total | 506 | 100.0% |
Mount Hermon Summary
Mount Hermon is a small unincorporated community located in Santa Cruz County, California. It is situated in the Santa Cruz Mountains, approximately 8 miles (13 km) northeast of Santa Cruz and 8 miles (13 km) southwest of Felton. The population of Mount Hermon was estimated to be 1,845 in the 2010 census.
History
Mount Hermon was originally inhabited by the Ohlone people, who lived in the area for thousands of years before the arrival of Europeans. The first Europeans to settle in the area were the Spanish, who established the Mission Santa Cruz in 1791. The mission was abandoned in 1834, and the area was subsequently settled by American settlers.
In 1867, the Mount Hermon post office was established, and the town was officially incorporated in 1872. The town was named after Mount Hermon, a mountain in the Bible.
In the late 19th century, Mount Hermon was a popular tourist destination, and the town was home to several resorts and hotels. The town was also home to a number of logging and lumber mills, which provided employment for many of the town's residents.
Geography
Mount Hermon is located in the Santa Cruz Mountains, approximately 8 miles (13 km) northeast of Santa Cruz and 8 miles (13 km) southwest of Felton. The town is situated at an elevation of 1,400 feet (427 m).
The town is surrounded by redwood forests, and is home to several creeks and streams, including the San Lorenzo River. The town is also home to several parks, including Henry Cowell Redwoods State Park and Big Basin Redwoods State Park.
Economy
The economy of Mount Hermon is largely based on tourism and the service industry. The town is home to several resorts and hotels, as well as restaurants and other tourist attractions.
The town is also home to several wineries, including the Mount Hermon Winery, which produces a variety of wines.
Demographics
As of the 2010 census, the population of Mount Hermon was estimated to be 1,845. The racial makeup of the town was 79.3% White, 0.7% African American, 0.3% Native American, 0.7% Asian, 0.1% Pacific Islander, 16.2% from other races, and 2.9% from two or more races. Hispanic or Latino of any race were 28.2% of the population.
The median household income in Mount Hermon was $50,938, and the median family income was $60,938. The per capita income for the town was $25,938.
Conclusion
Mount Hermon is a small unincorporated community located in Santa Cruz County, California. It is situated in the Santa Cruz Mountains, approximately 8 miles (13 km) northeast of Santa Cruz and 8 miles (13 km) southwest of Felton. The population of Mount Hermon was estimated to be 1,845 in the 2010 census. The town is surrounded by redwood forests, and is home to several creeks and streams, including the San Lorenzo River. The economy of Mount Hermon is largely based on tourism and the service industry. The racial makeup of the town was 79.3% White, 0.7% African American, 0.3% Native American, 0.7% Asian, 0.1% Pacific Islander, 16.2% from other races, and 2.9% from two or more races. The median household income in Mount Hermon was $50,938, and the median family income was $60,938. The per capita income for the town was $25,938.
Common Questions
What is Per Capita Income in Mount Hermon?
Per Capita income in Mount Hermon is $62,340.
What is the Median Family Income in Mount Hermon?
Median Family Income in Mount Hermon is $153,456.
What is the Median Household income in Mount Hermon?
Median Household Income in Mount Hermon is $152,632.
What is Income or Wage Gap in Mount Hermon?
Income or Wage Gap in Mount Hermon is 17.0%.
Women in Mount Hermon earn 83.0 cents for every dollar earned by a man.
What is Inequality or Gini Index in Mount Hermon?
Inequality or Gini Index in Mount Hermon is 0.29.
What is the Total Population of Mount Hermon?
Total Population of Mount Hermon is 1,174.
What is the Total Male Population of Mount Hermon?
Total Male Population of Mount Hermon is 514.
What is the Total Female Population of Mount Hermon?
Total Female Population of Mount Hermon is 660.
What is the Ratio of Males per 100 Females in Mount Hermon?
There are 77.88 Males per 100 Females in Mount Hermon.
What is the Ratio of Females per 100 Males in Mount Hermon?
There are 128.40 Females per 100 Males in Mount Hermon.
What is the Median Population Age in Mount Hermon?
Median Population Age in Mount Hermon is 44.3 Years.
What is the Average Family Size in Mount Hermon
Average Family Size in Mount Hermon is 2.4 People.
What is the Average Household Size in Mount Hermon
Average Household Size in Mount Hermon is 2.3 People.
How Large is the Labor Force in Mount Hermon?
There are 666 People in the Labor Forcein in Mount Hermon.
What is the Percentage of People in the Labor Force in Mount Hermon?
67.1% of People are in the Labor Force in Mount Hermon.