Fort Washington, CA Map & Demographics
Fort Washington Map
Fort Washington Overview
$62,466
PER CAPITA INCOME
$104,436
AVG FAMILY INCOME
$104,436
AVG HOUSEHOLD INCOME
0.13
INEQUALITY / GINI INDEX
158
TOTAL POPULATION
80
MALE POPULATION
78
FEMALE POPULATION
102.56
MALES / 100 FEMALES
97.50
FEMALES / 100 MALES
75.6
MEDIAN AGE
2.0
AVG FAMILY SIZE
2.0
AVG HOUSEHOLD SIZE
80
LABOR FORCE [ PEOPLE ]
50.6%
PERCENT IN LABOR FORCE
Income in Fort Washington
Income Overview in Fort Washington
Per Capita Income in Fort Washington is $62,466, while median incomes of families and households are $104,436 and $104,436 respectively.
| Characteristic | Number | Measure |
| Per Capita Income | 158 | $62,466 |
| Median Family Income | 79 | $104,436 |
| Mean Family Income | 79 | $124,027 |
| Median Household Income | 79 | $104,436 |
| Mean Household Income | 79 | $124,027 |
| Income Deficit | 79 | $0 |
| Wage / Income Gap (%) | 158 | 0.00% |
| Wage / Income Gap ($) | 158 | 100.00¢ per $1 |
| Gini / Inequality Index | 158 | 0.13 |
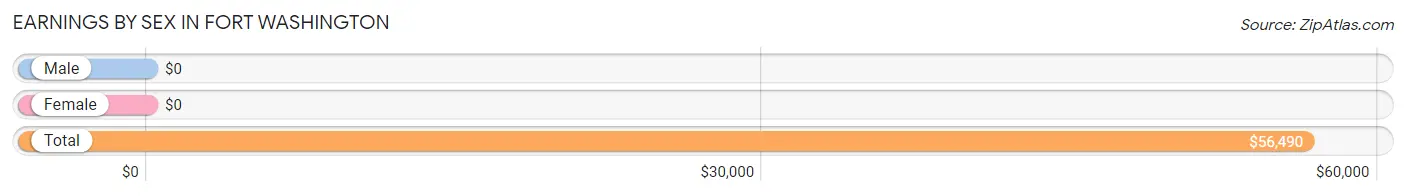
Earnings by Sex in Fort Washington
| Sex | Number | Average Earnings |
| Male | 71 (88.7%) | $0 |
| Female | 9 (11.3%) | $0 |
| Total | 80 (100.0%) | $56,490 |
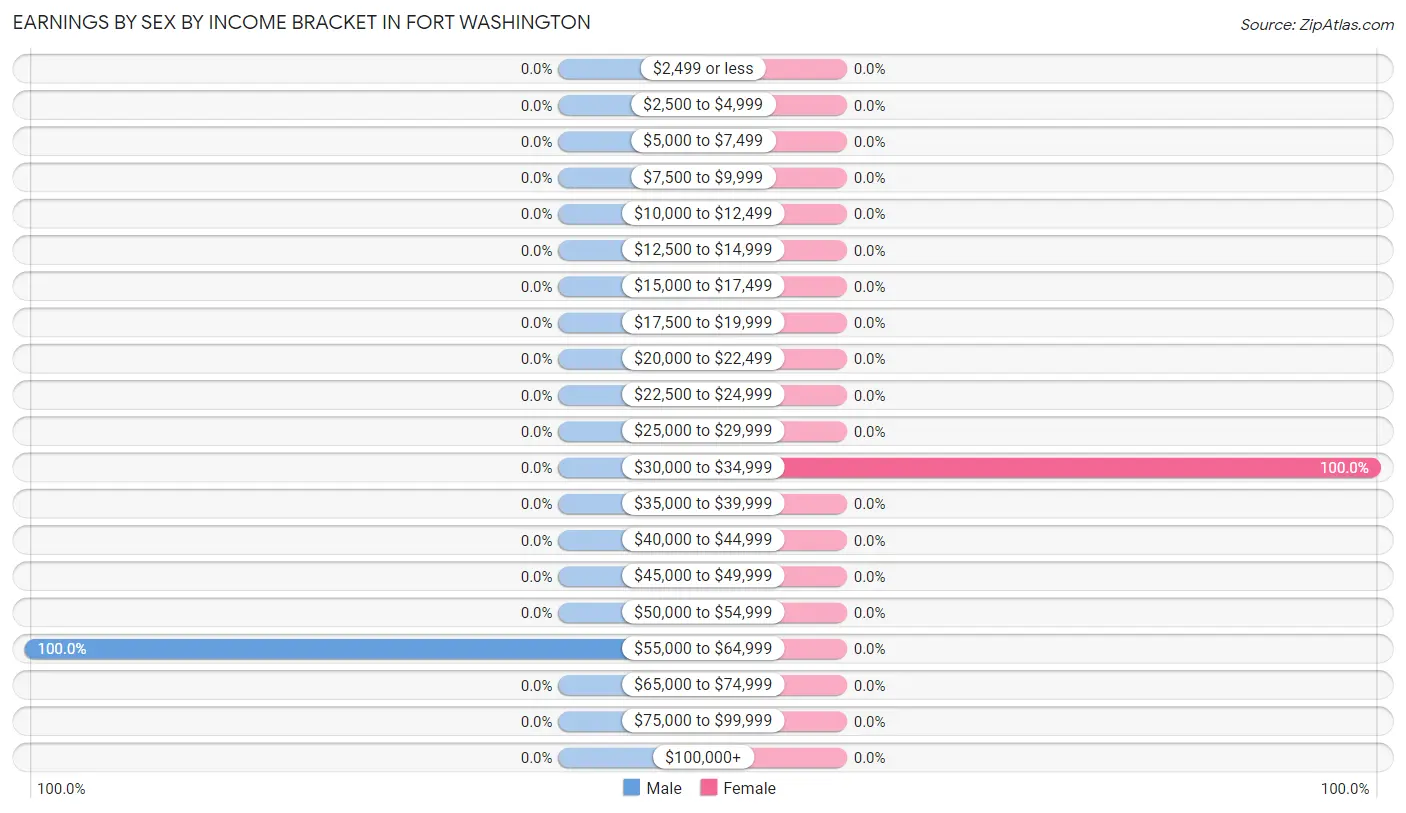
Earnings by Sex by Income Bracket in Fort Washington
The most common earnings brackets in Fort Washington are $55,000 to $64,999 for men (71 | 100.0%) and $30,000 to $34,999 for women (9 | 100.0%).
| Income | Male | Female |
| $2,499 or less | 0 (0.0%) | 0 (0.0%) |
| $2,500 to $4,999 | 0 (0.0%) | 0 (0.0%) |
| $5,000 to $7,499 | 0 (0.0%) | 0 (0.0%) |
| $7,500 to $9,999 | 0 (0.0%) | 0 (0.0%) |
| $10,000 to $12,499 | 0 (0.0%) | 0 (0.0%) |
| $12,500 to $14,999 | 0 (0.0%) | 0 (0.0%) |
| $15,000 to $17,499 | 0 (0.0%) | 0 (0.0%) |
| $17,500 to $19,999 | 0 (0.0%) | 0 (0.0%) |
| $20,000 to $22,499 | 0 (0.0%) | 0 (0.0%) |
| $22,500 to $24,999 | 0 (0.0%) | 0 (0.0%) |
| $25,000 to $29,999 | 0 (0.0%) | 0 (0.0%) |
| $30,000 to $34,999 | 0 (0.0%) | 9 (100.0%) |
| $35,000 to $39,999 | 0 (0.0%) | 0 (0.0%) |
| $40,000 to $44,999 | 0 (0.0%) | 0 (0.0%) |
| $45,000 to $49,999 | 0 (0.0%) | 0 (0.0%) |
| $50,000 to $54,999 | 0 (0.0%) | 0 (0.0%) |
| $55,000 to $64,999 | 71 (100.0%) | 0 (0.0%) |
| $65,000 to $74,999 | 0 (0.0%) | 0 (0.0%) |
| $75,000 to $99,999 | 0 (0.0%) | 0 (0.0%) |
| $100,000+ | 0 (0.0%) | 0 (0.0%) |
| Total | 71 (100.0%) | 9 (100.0%) |
Earnings by Sex by Educational Attainment in Fort Washington
| Educational Attainment | Male Income | Female Income |
| Less than High School | - | - |
| High School Diploma | - | - |
| College or Associate's Degree | - | - |
| Bachelor's Degree | - | - |
| Graduate Degree | - | - |
| Total | - | - |
Family Income in Fort Washington
Family Income Brackets in Fort Washington
According to the Fort Washington family income data, there are 70 families falling into the $100,000 to $149,999 income range, which is the most common income bracket and makes up 88.6% of all families.
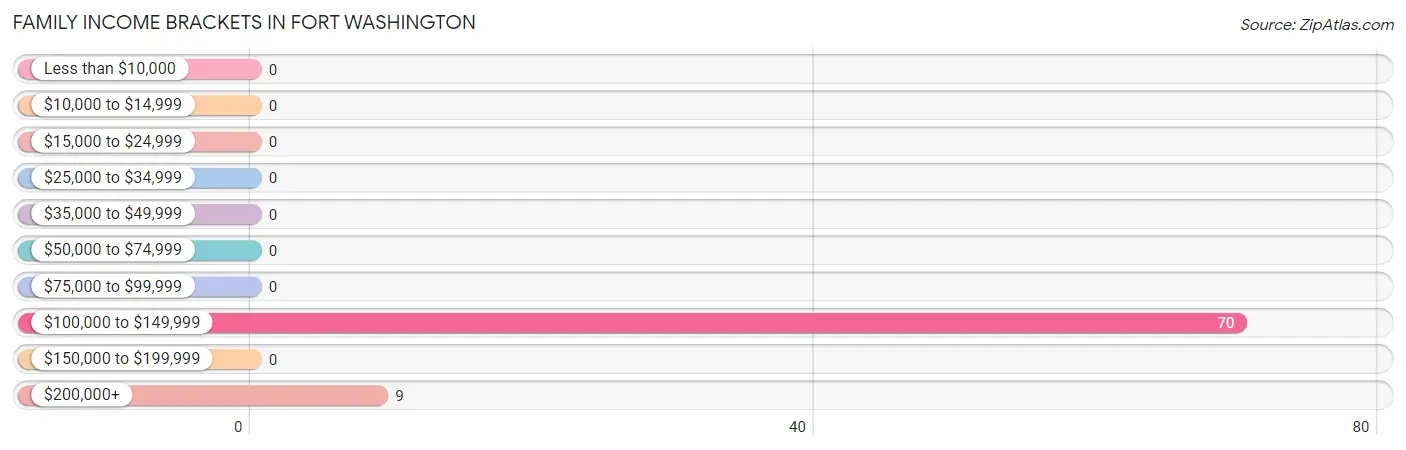
| Income Bracket | # Families | % Families |
| Less than $10,000 | 0 | 0.0% |
| $10,000 to $14,999 | 0 | 0.0% |
| $15,000 to $24,999 | 0 | 0.0% |
| $25,000 to $34,999 | 0 | 0.0% |
| $35,000 to $49,999 | 0 | 0.0% |
| $50,000 to $74,999 | 0 | 0.0% |
| $75,000 to $99,999 | 0 | 0.0% |
| $100,000 to $149,999 | 70 | 88.6% |
| $150,000 to $199,999 | 0 | 0.0% |
| $200,000+ | 9 | 11.4% |
Family Income by Famaliy Size in Fort Washington
2-person families (79 | 100.0%) account for the highest median family income in Fort Washington with $104,436 per family, while 2-person families (79 | 100.0%) have the highest median income of $52,218 per family member.
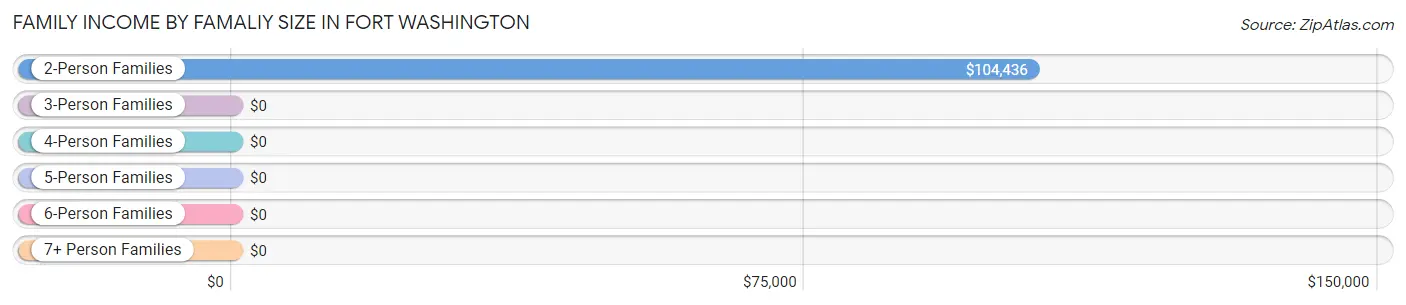
| Income Bracket | # Families | Median Income |
| 2-Person Families | 79 (100.0%) | $104,436 |
| 3-Person Families | 0 (0.0%) | $0 |
| 4-Person Families | 0 (0.0%) | $0 |
| 5-Person Families | 0 (0.0%) | $0 |
| 6-Person Families | 0 (0.0%) | $0 |
| 7+ Person Families | 0 (0.0%) | $0 |
| Total | 79 (100.0%) | $104,436 |
Family Income by Number of Earners in Fort Washington
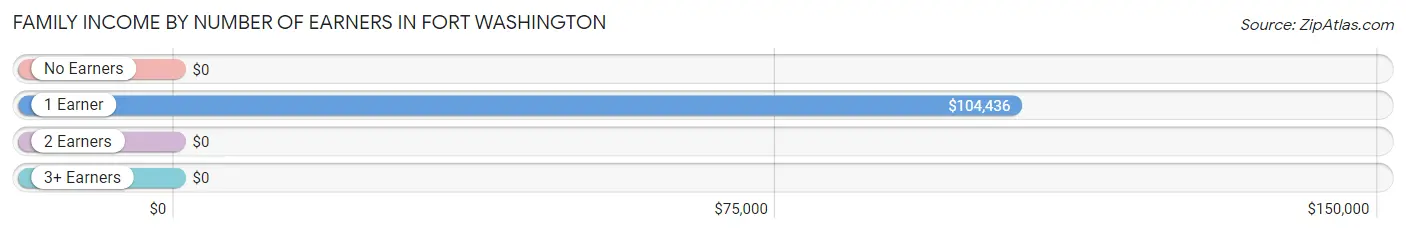
| Number of Earners | # Families | Median Income |
| No Earners | 0 (0.0%) | $0 |
| 1 Earner | 79 (100.0%) | $104,436 |
| 2 Earners | 0 (0.0%) | $0 |
| 3+ Earners | 0 (0.0%) | $0 |
| Total | 79 (100.0%) | $104,436 |
Household Income in Fort Washington
Household Income Brackets in Fort Washington
With 70 households falling in the category, the $100,000 to $149,999 income range is the most frequent in Fort Washington, accounting for 88.6% of all households.
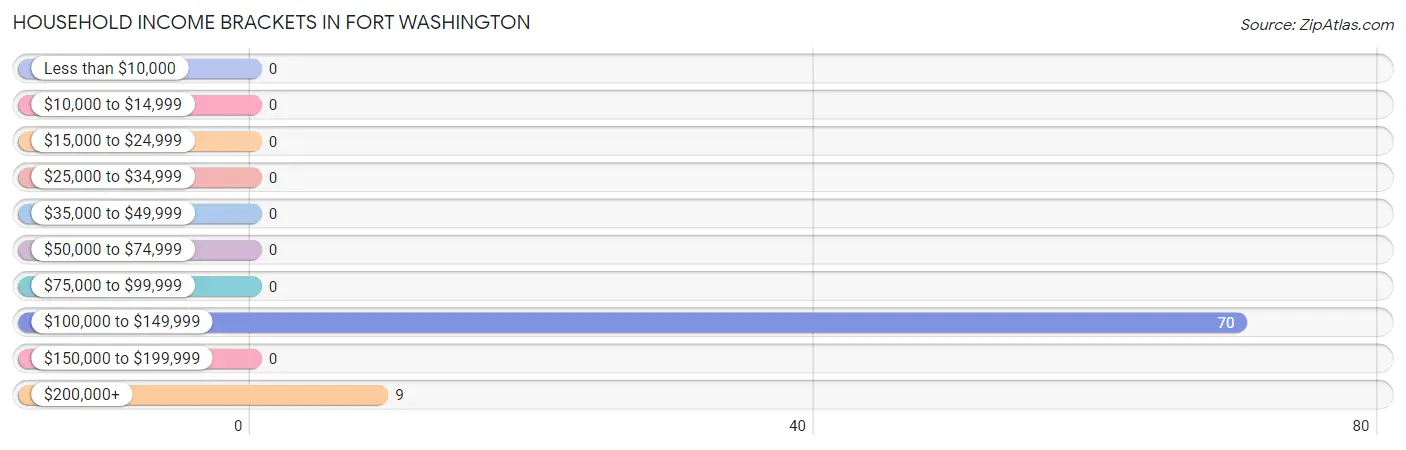
| Income Bracket | # Households | % Households |
| Less than $10,000 | 0 | 0.0% |
| $10,000 to $14,999 | 0 | 0.0% |
| $15,000 to $24,999 | 0 | 0.0% |
| $25,000 to $34,999 | 0 | 0.0% |
| $35,000 to $49,999 | 0 | 0.0% |
| $50,000 to $74,999 | 0 | 0.0% |
| $75,000 to $99,999 | 0 | 0.0% |
| $100,000 to $149,999 | 70 | 88.6% |
| $150,000 to $199,999 | 0 | 0.0% |
| $200,000+ | 9 | 11.4% |
Household Income by Householder Age in Fort Washington
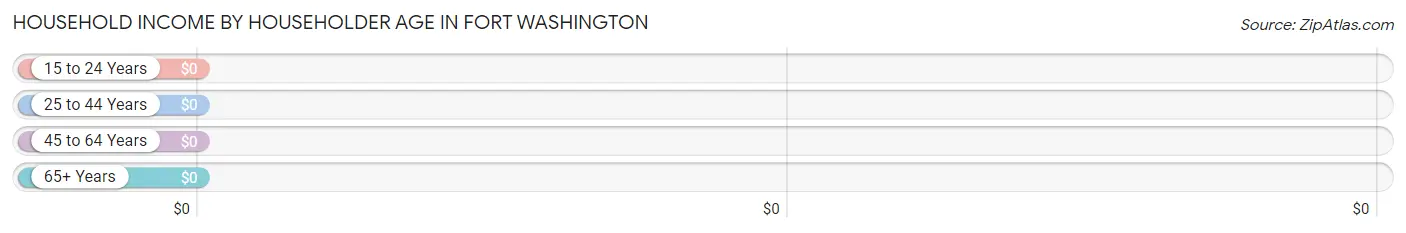
| Income Bracket | # Households | Median Income |
| 15 to 24 Years | 0 (0.0%) | $0 |
| 25 to 44 Years | 0 (0.0%) | $0 |
| 45 to 64 Years | 19 (24.0%) | $0 |
| 65+ Years | 60 (75.9%) | $0 |
| Total | 79 (100.0%) | $104,436 |
Poverty in Fort Washington
Income Below Poverty by Sex and Age in Fort Washington
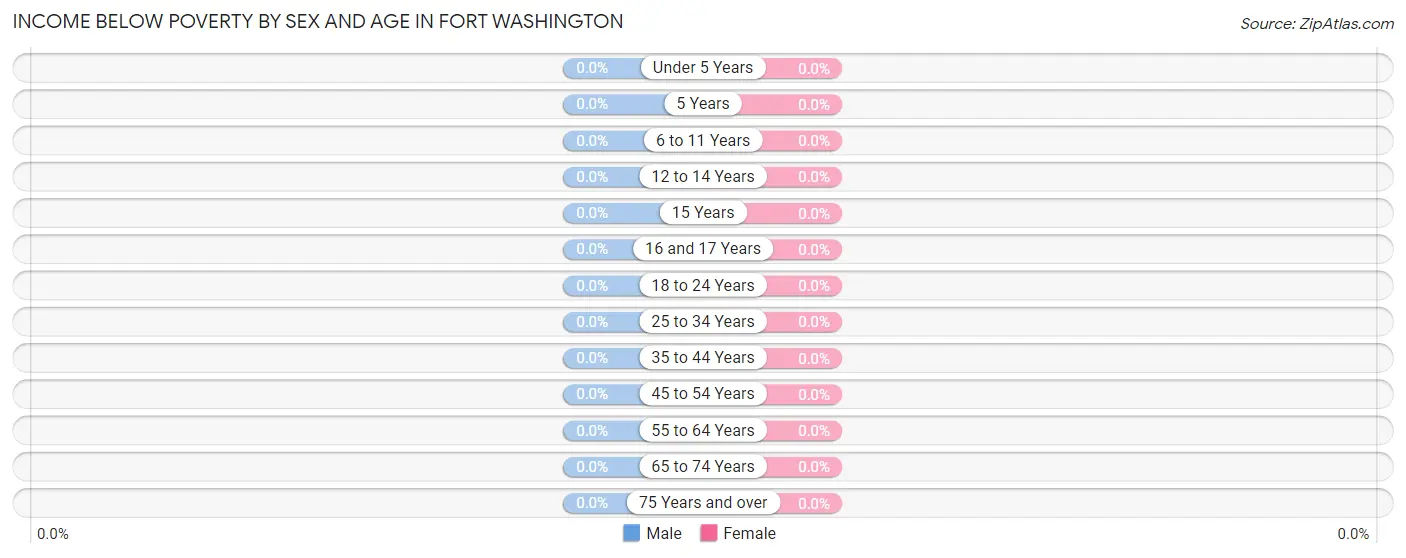
| Age Bracket | Male | Female |
| Under 5 Years | 0 (0.0%) | 0 (0.0%) |
| 5 Years | 0 (0.0%) | 0 (0.0%) |
| 6 to 11 Years | 0 (0.0%) | 0 (0.0%) |
| 12 to 14 Years | 0 (0.0%) | 0 (0.0%) |
| 15 Years | 0 (0.0%) | 0 (0.0%) |
| 16 and 17 Years | 0 (0.0%) | 0 (0.0%) |
| 18 to 24 Years | 0 (0.0%) | 0 (0.0%) |
| 25 to 34 Years | 0 (0.0%) | 0 (0.0%) |
| 35 to 44 Years | 0 (0.0%) | 0 (0.0%) |
| 45 to 54 Years | 0 (0.0%) | 0 (0.0%) |
| 55 to 64 Years | 0 (0.0%) | 0 (0.0%) |
| 65 to 74 Years | 0 (0.0%) | 0 (0.0%) |
| 75 Years and over | 0 (0.0%) | 0 (0.0%) |
| Total | 0 (0.0%) | 0 (0.0%) |
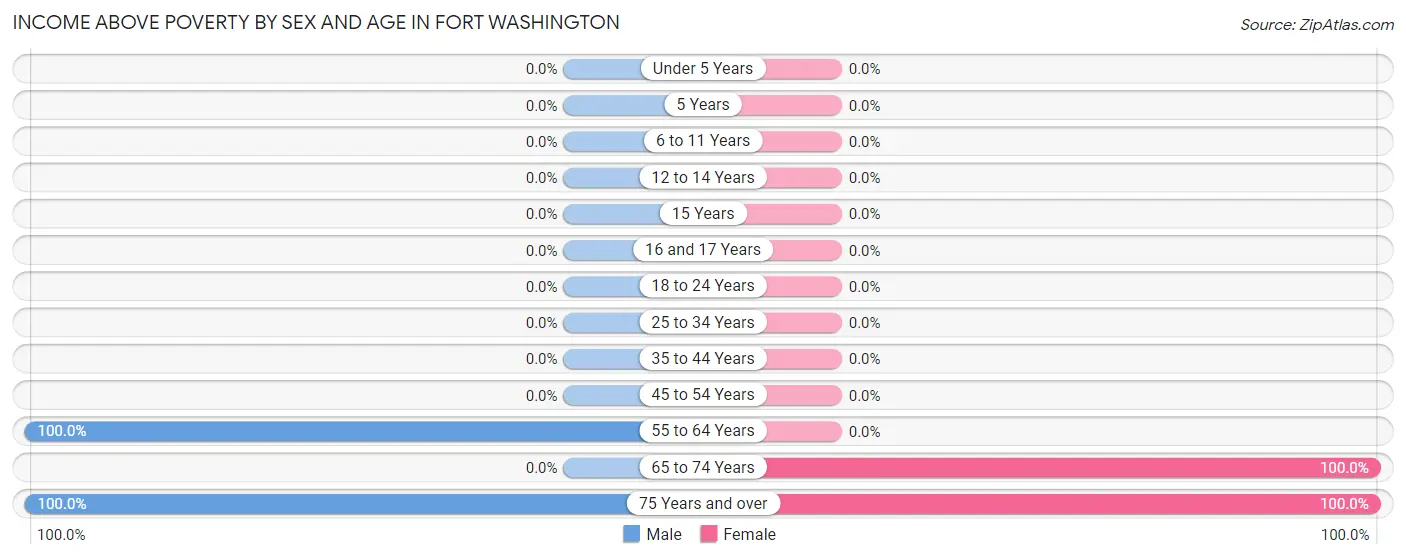
Income Above Poverty by Sex and Age in Fort Washington
According to the poverty statistics in Fort Washington, males aged 55 to 64 years and females aged 65 to 74 years are the age groups that are most secure financially, with 100.0% of males and 100.0% of females in these age groups living above the poverty line.
| Age Bracket | Male | Female |
| Under 5 Years | 0 (0.0%) | 0 (0.0%) |
| 5 Years | 0 (0.0%) | 0 (0.0%) |
| 6 to 11 Years | 0 (0.0%) | 0 (0.0%) |
| 12 to 14 Years | 0 (0.0%) | 0 (0.0%) |
| 15 Years | 0 (0.0%) | 0 (0.0%) |
| 16 and 17 Years | 0 (0.0%) | 0 (0.0%) |
| 18 to 24 Years | 0 (0.0%) | 0 (0.0%) |
| 25 to 34 Years | 0 (0.0%) | 0 (0.0%) |
| 35 to 44 Years | 0 (0.0%) | 0 (0.0%) |
| 45 to 54 Years | 0 (0.0%) | 0 (0.0%) |
| 55 to 64 Years | 19 (100.0%) | 0 (0.0%) |
| 65 to 74 Years | 0 (0.0%) | 27 (100.0%) |
| 75 Years and over | 61 (100.0%) | 51 (100.0%) |
| Total | 80 (100.0%) | 78 (100.0%) |
Income Below Poverty Among Married-Couple Families in Fort Washington
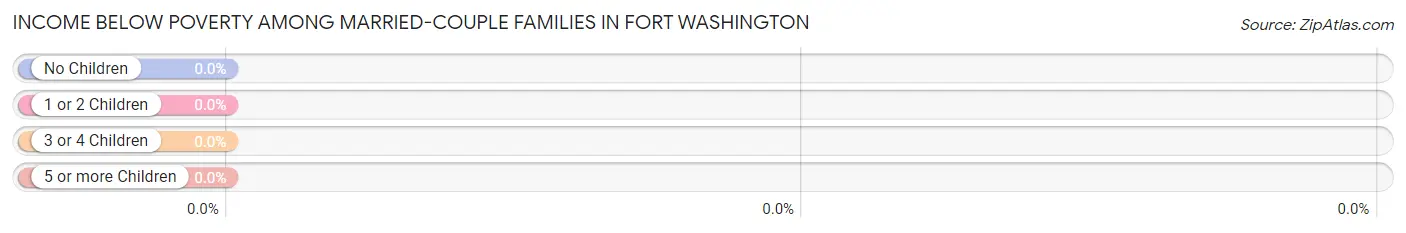
| Children | Above Poverty | Below Poverty |
| No Children | 79 (100.0%) | 0 (0.0%) |
| 1 or 2 Children | 0 (0.0%) | 0 (0.0%) |
| 3 or 4 Children | 0 (0.0%) | 0 (0.0%) |
| 5 or more Children | 0 (0.0%) | 0 (0.0%) |
| Total | 79 (100.0%) | 0 (0.0%) |
Income Below Poverty Among Single-Parent Households in Fort Washington
| Children | Single Father | Single Mother |
| No Children | 0 (0.0%) | 0 (0.0%) |
| 1 or 2 Children | 0 (0.0%) | 0 (0.0%) |
| 3 or 4 Children | 0 (0.0%) | 0 (0.0%) |
| 5 or more Children | 0 (0.0%) | 0 (0.0%) |
| Total | 0 (0.0%) | 0 (0.0%) |
Income Below Poverty Among Married-Couple vs Single-Parent Households in Fort Washington
| Children | Married-Couple Families | Single-Parent Households |
| No Children | 0 (0.0%) | 0 (0.0%) |
| 1 or 2 Children | 0 (0.0%) | 0 (0.0%) |
| 3 or 4 Children | 0 (0.0%) | 0 (0.0%) |
| 5 or more Children | 0 (0.0%) | 0 (0.0%) |
| Total | 0 (0.0%) | 0 (0.0%) |
Race in Fort Washington
The most populous races in Fort Washington are , and White / Caucasian (158 | 100.0%).
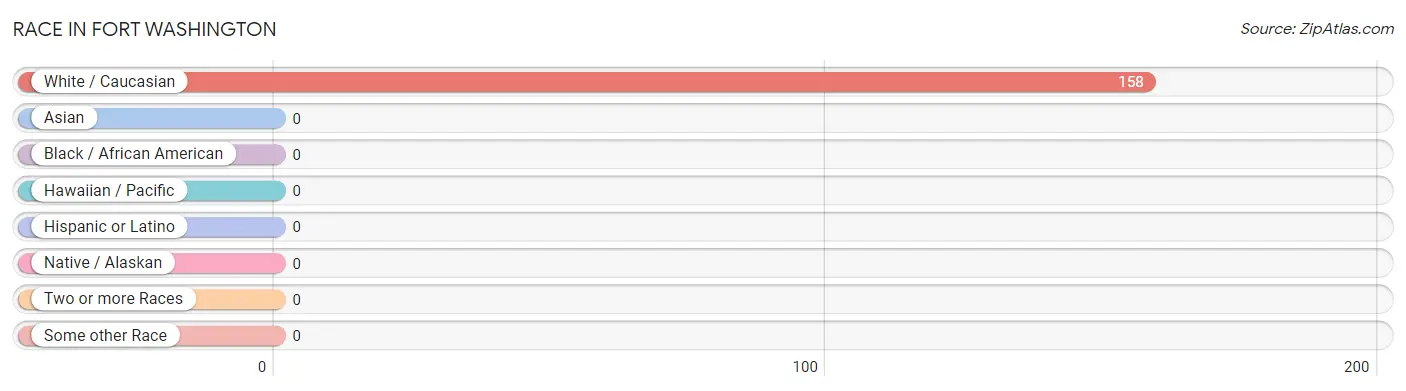
| Race | # Population | % Population |
| Asian | 0 | 0.0% |
| Black / African American | 0 | 0.0% |
| Hawaiian / Pacific | 0 | 0.0% |
| Hispanic or Latino | 0 | 0.0% |
| Native / Alaskan | 0 | 0.0% |
| White / Caucasian | 158 | 100.0% |
| Two or more Races | 0 | 0.0% |
| Some other Race | 0 | 0.0% |
| Total | 158 | 100.0% |
Ancestry in Fort Washington
The most populous ancestries reported in Fort Washington are Italian (52 | 32.9%), Armenian (46 | 29.1%), Scottish (19 | 12.0%), and Dutch (9 | 5.7%), together accounting for 79.8% of all Fort Washington residents.
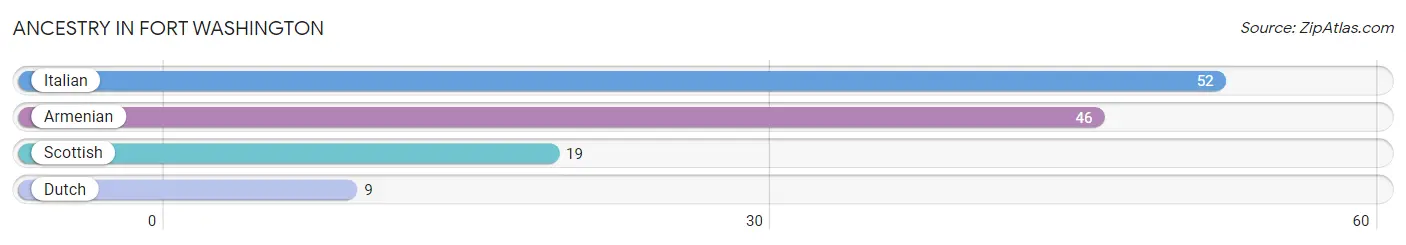
| Ancestry | # Population | % Population |
| Armenian | 46 | 29.1% |
| Dutch | 9 | 5.7% |
| Italian | 52 | 32.9% |
| Scottish | 19 | 12.0% | View All 4 Rows |
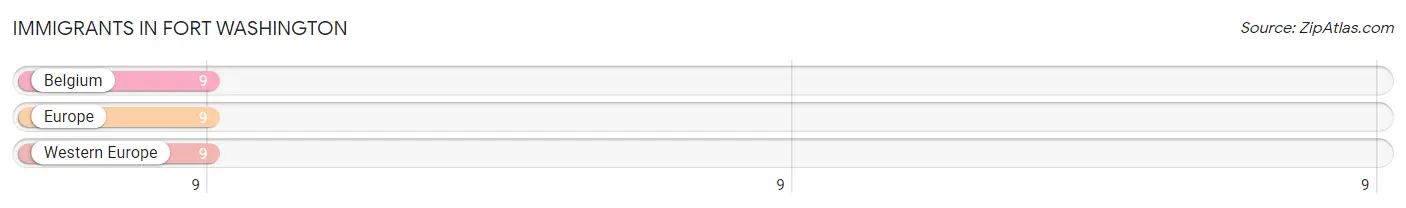
Immigrants in Fort Washington
The most numerous immigrant groups reported in Fort Washington came from Belgium (9 | 5.7%), Europe (9 | 5.7%), and Western Europe (9 | 5.7%), together accounting for 17.1% of all Fort Washington residents.
| Immigration Origin | # Population | % Population |
| Belgium | 9 | 5.7% |
| Europe | 9 | 5.7% |
| Western Europe | 9 | 5.7% | View All 3 Rows |
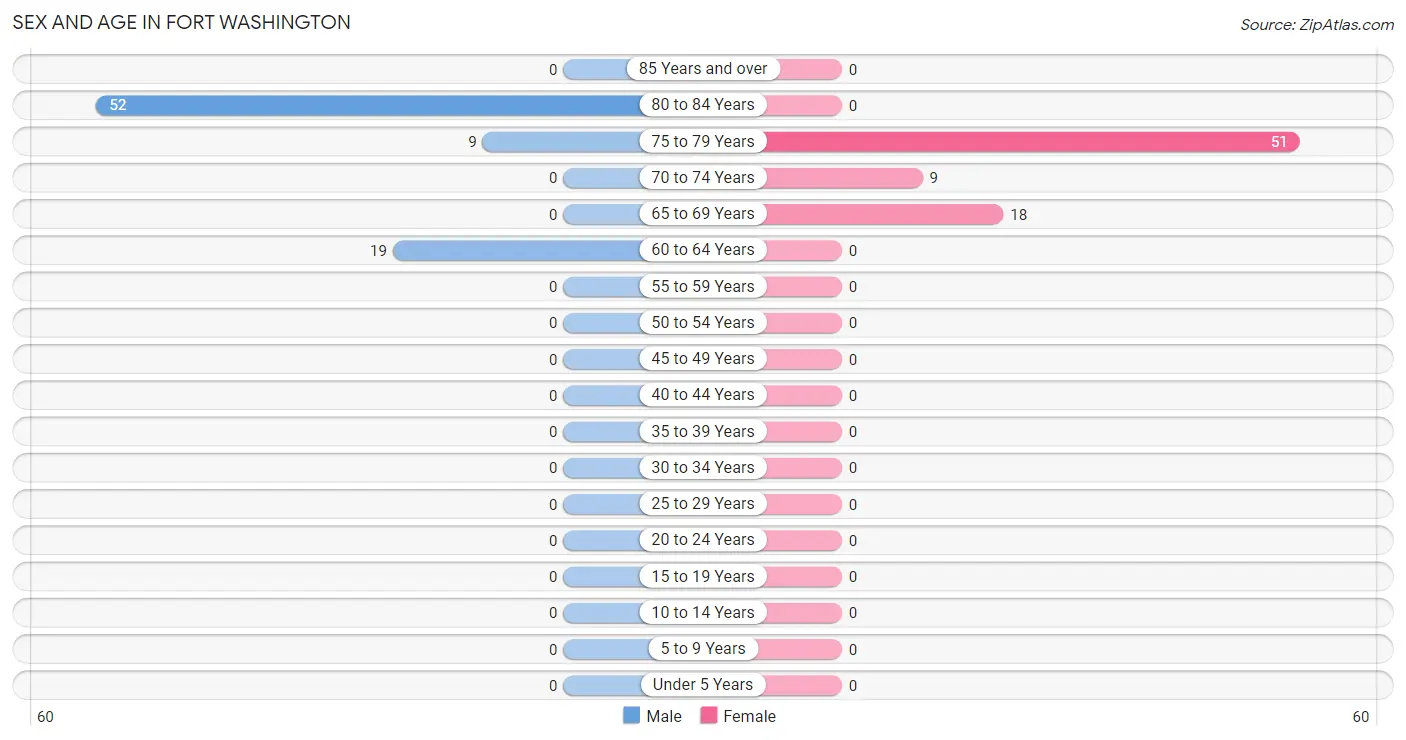
Sex and Age in Fort Washington
Sex and Age in Fort Washington
The most populous age groups in Fort Washington are 80 to 84 Years (52 | 65.0%) for men and 75 to 79 Years (51 | 65.4%) for women.
| Age Bracket | Male | Female |
| Under 5 Years | 0 (0.0%) | 0 (0.0%) |
| 5 to 9 Years | 0 (0.0%) | 0 (0.0%) |
| 10 to 14 Years | 0 (0.0%) | 0 (0.0%) |
| 15 to 19 Years | 0 (0.0%) | 0 (0.0%) |
| 20 to 24 Years | 0 (0.0%) | 0 (0.0%) |
| 25 to 29 Years | 0 (0.0%) | 0 (0.0%) |
| 30 to 34 Years | 0 (0.0%) | 0 (0.0%) |
| 35 to 39 Years | 0 (0.0%) | 0 (0.0%) |
| 40 to 44 Years | 0 (0.0%) | 0 (0.0%) |
| 45 to 49 Years | 0 (0.0%) | 0 (0.0%) |
| 50 to 54 Years | 0 (0.0%) | 0 (0.0%) |
| 55 to 59 Years | 0 (0.0%) | 0 (0.0%) |
| 60 to 64 Years | 19 (23.7%) | 0 (0.0%) |
| 65 to 69 Years | 0 (0.0%) | 18 (23.1%) |
| 70 to 74 Years | 0 (0.0%) | 9 (11.5%) |
| 75 to 79 Years | 9 (11.3%) | 51 (65.4%) |
| 80 to 84 Years | 52 (65.0%) | 0 (0.0%) |
| 85 Years and over | 0 (0.0%) | 0 (0.0%) |
| Total | 80 (100.0%) | 78 (100.0%) |
Families and Households in Fort Washington
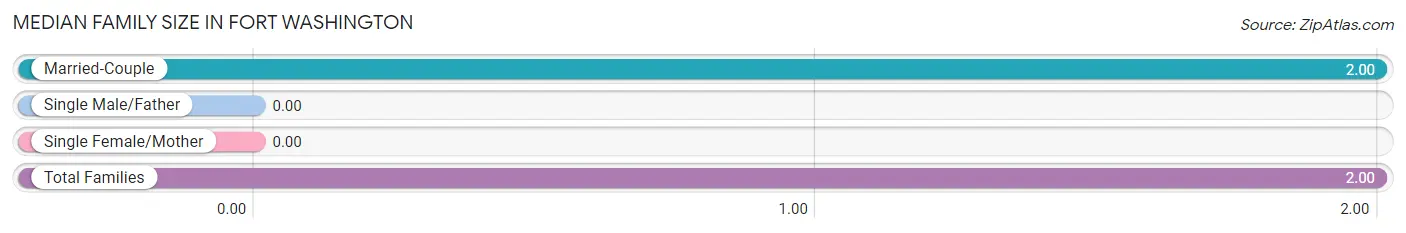
Median Family Size in Fort Washington
| Family Type | # Families | Family Size |
| Married-Couple | 79 (100.0%) | 2.00 |
| Single Male/Father | 0 (0.0%) | - |
| Single Female/Mother | 0 (0.0%) | - |
| Total Families | 79 (100.0%) | 2.00 |
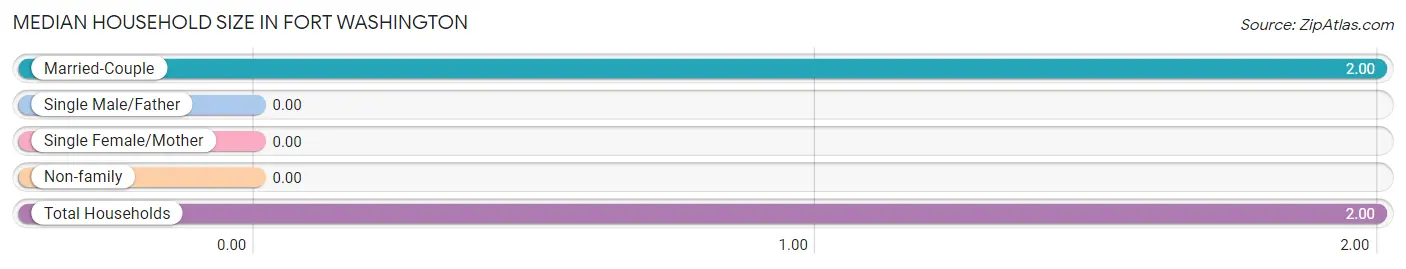
Median Household Size in Fort Washington
| Household Type | # Households | Household Size |
| Married-Couple | 79 (100.0%) | 2.00 |
| Single Male/Father | 0 (0.0%) | - |
| Single Female/Mother | 0 (0.0%) | - |
| Non-family | 0 (0.0%) | - |
| Total Households | 79 (100.0%) | 2.00 |
Household Size by Marriage Status in Fort Washington
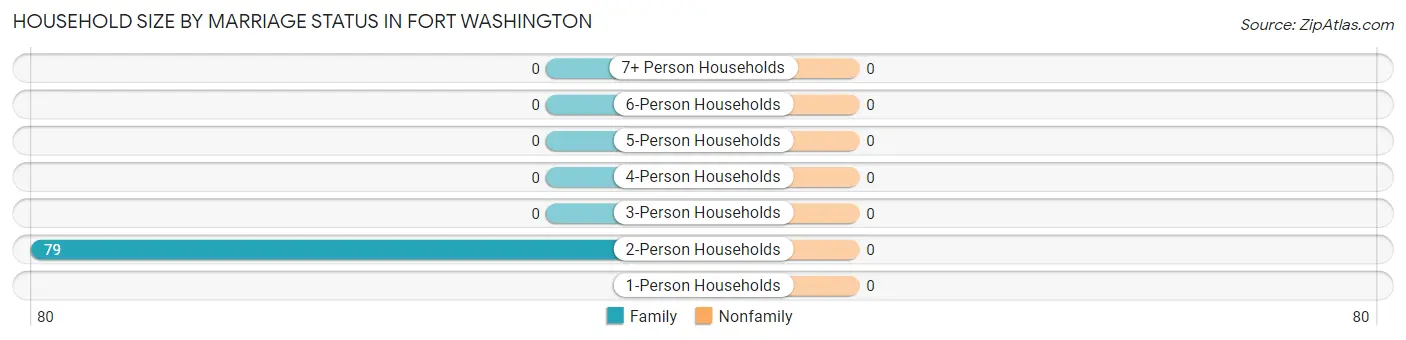
| Household Size | Family Households | Nonfamily Households |
| 1-Person Households | - | 0 (0.0%) |
| 2-Person Households | 79 (100.0%) | 0 (0.0%) |
| 3-Person Households | 0 (0.0%) | 0 (0.0%) |
| 4-Person Households | 0 (0.0%) | 0 (0.0%) |
| 5-Person Households | 0 (0.0%) | 0 (0.0%) |
| 6-Person Households | 0 (0.0%) | 0 (0.0%) |
| 7+ Person Households | 0 (0.0%) | 0 (0.0%) |
| Total | 79 (100.0%) | 0 (0.0%) |
Female Fertility in Fort Washington
Fertility by Age in Fort Washington
| Age Bracket | Women with Births | Births / 1,000 Women |
| 15 to 19 years | 0 (0.0%) | 0.0 |
| 20 to 34 years | 0 (0.0%) | 0.0 |
| 35 to 50 years | 0 (0.0%) | 0.0 |
| Total | 0 (0.0%) | 0.0 |
Fertility by Age by Marriage Status in Fort Washington
| Age Bracket | Married | Unmarried |
| 15 to 19 years | 0 (0.0%) | 0 (0.0%) |
| 20 to 34 years | 0 (0.0%) | 0 (0.0%) |
| 35 to 50 years | 0 (0.0%) | 0 (0.0%) |
| Total | 0 (0.0%) | 0 (0.0%) |
Fertility by Education in Fort Washington
| Educational Attainment | Women with Births | Births / 1,000 Women |
| Less than High School | 0 (0.0%) | 0.0 |
| High School Diploma | 0 (0.0%) | 0.0 |
| College or Associate's Degree | 0 (0.0%) | 0.0 |
| Bachelor's Degree | 0 (0.0%) | 0.0 |
| Graduate Degree | 0 (0.0%) | 0.0 |
| Total | 0 (0.0%) | 0.0 |
Fertility by Education by Marriage Status in Fort Washington
| Educational Attainment | Married | Unmarried |
| Less than High School | 0 (0.0%) | 0 (0.0%) |
| High School Diploma | 0 (0.0%) | 0 (0.0%) |
| College or Associate's Degree | 0 (0.0%) | 0 (0.0%) |
| Bachelor's Degree | 0 (0.0%) | 0 (0.0%) |
| Graduate Degree | 0 (0.0%) | 0 (0.0%) |
| Total | 0 (0.0%) | 0 (0.0%) |
Employment Characteristics in Fort Washington
Employment by Class of Employer in Fort Washington
Among the 80 employed individuals in Fort Washington, not-for-profit organizations (61 | 76.2%), and self-employed (incorporated) (19 | 23.7%) make up the most common classes of employment.
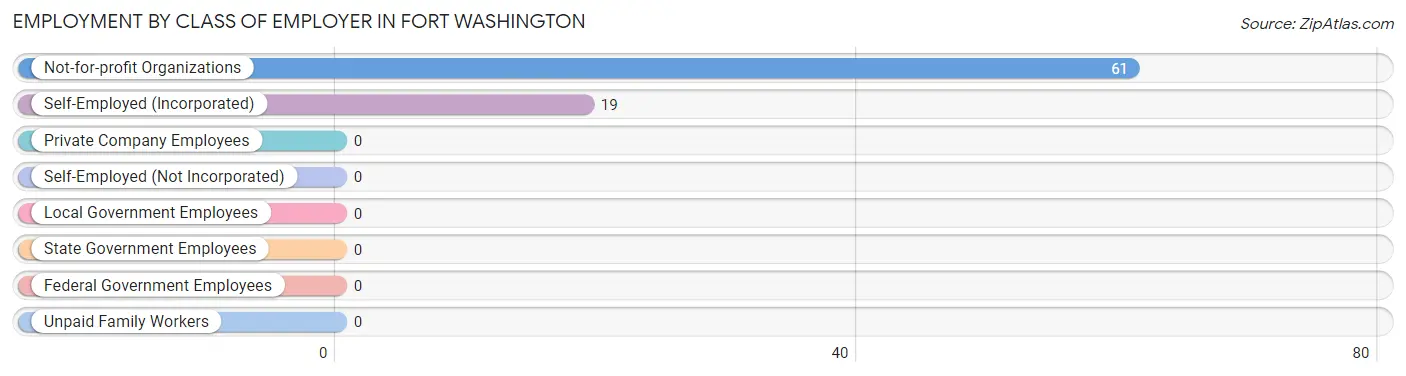
| Employer Class | # Employees | % Employees |
| Private Company Employees | 0 | 0.0% |
| Self-Employed (Incorporated) | 19 | 23.7% |
| Self-Employed (Not Incorporated) | 0 | 0.0% |
| Not-for-profit Organizations | 61 | 76.2% |
| Local Government Employees | 0 | 0.0% |
| State Government Employees | 0 | 0.0% |
| Federal Government Employees | 0 | 0.0% |
| Unpaid Family Workers | 0 | 0.0% |
| Total | 80 | 100.0% |
Employment Status by Age in Fort Washington
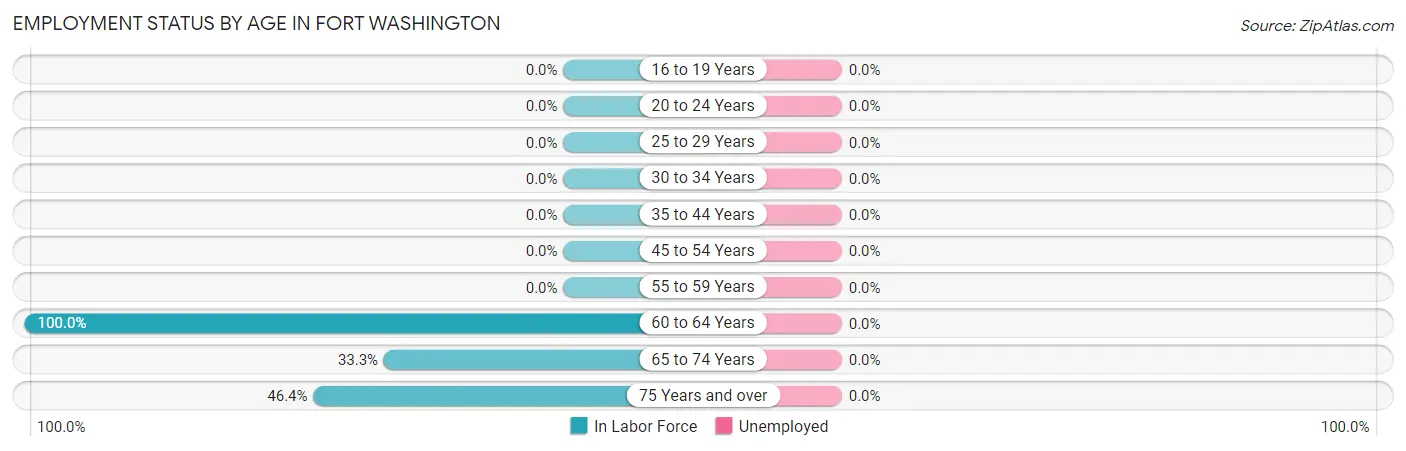
| Age Bracket | In Labor Force | Unemployed |
| 16 to 19 Years | 0 (0.0%) | 0 (0.0%) |
| 20 to 24 Years | 0 (0.0%) | 0 (0.0%) |
| 25 to 29 Years | 0 (0.0%) | 0 (0.0%) |
| 30 to 34 Years | 0 (0.0%) | 0 (0.0%) |
| 35 to 44 Years | 0 (0.0%) | 0 (0.0%) |
| 45 to 54 Years | 0 (0.0%) | 0 (0.0%) |
| 55 to 59 Years | 0 (0.0%) | 0 (0.0%) |
| 60 to 64 Years | 19 (100.0%) | 0 (0.0%) |
| 65 to 74 Years | 9 (33.3%) | 0 (0.0%) |
| 75 Years and over | 52 (46.4%) | 0 (0.0%) |
| Total | 80 (50.6%) | 0 (0.0%) |
Employment Status by Educational Attainment in Fort Washington
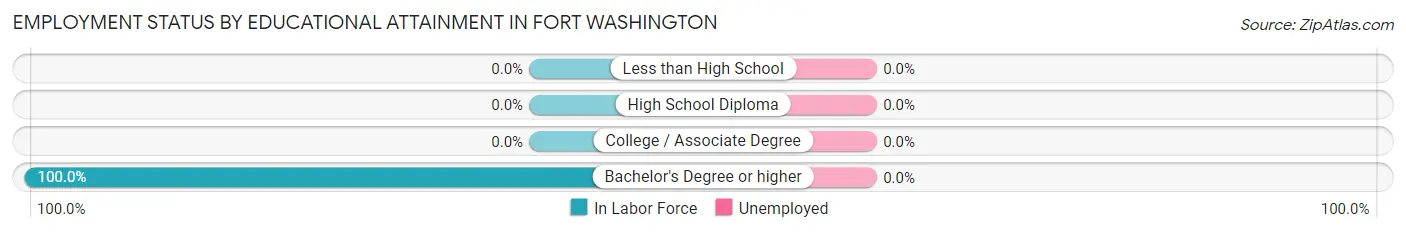
| Educational Attainment | In Labor Force | Unemployed |
| Less than High School | 0 (0.0%) | 0 (0.0%) |
| High School Diploma | 0 (0.0%) | 0 (0.0%) |
| College / Associate Degree | 0 (0.0%) | 0 (0.0%) |
| Bachelor's Degree or higher | 19 (100.0%) | 0 (0.0%) |
| Total | 19 (100.0%) | 0 (0.0%) |
Employment Occupations by Sex in Fort Washington
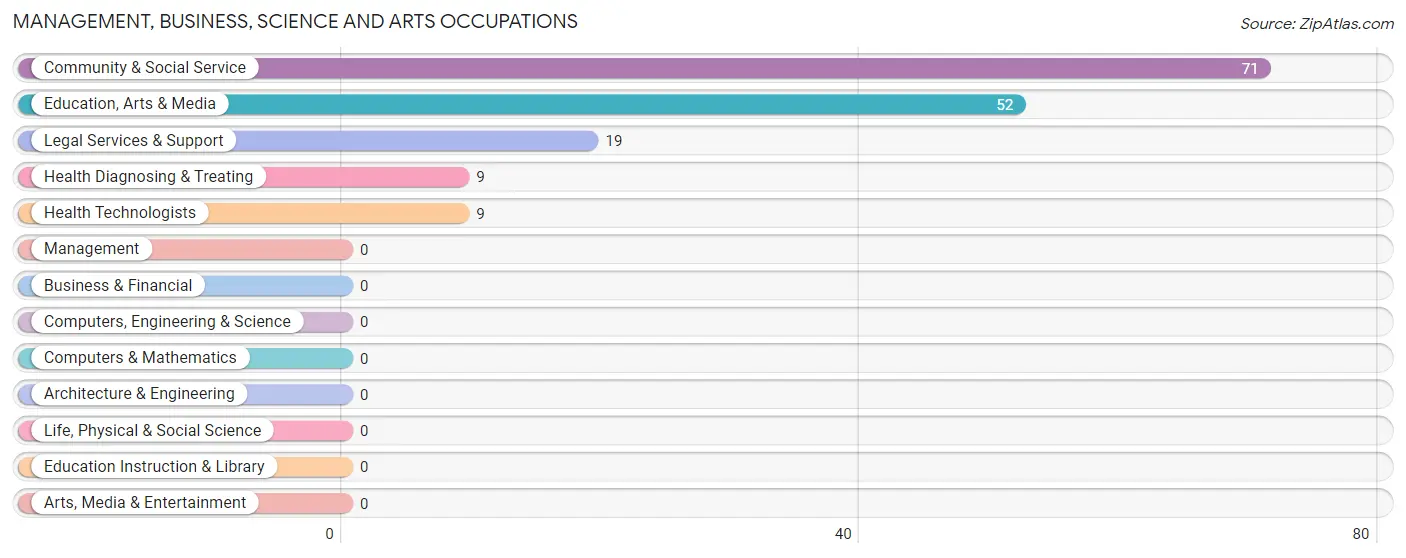
Management, Business, Science and Arts Occupations
The most common Management, Business, Science and Arts occupations in Fort Washington are Community & Social Service (71 | 88.7%), Education, Arts & Media (52 | 65.0%), Legal Services & Support (19 | 23.7%), Health Diagnosing & Treating (9 | 11.3%), and Health Technologists (9 | 11.3%).
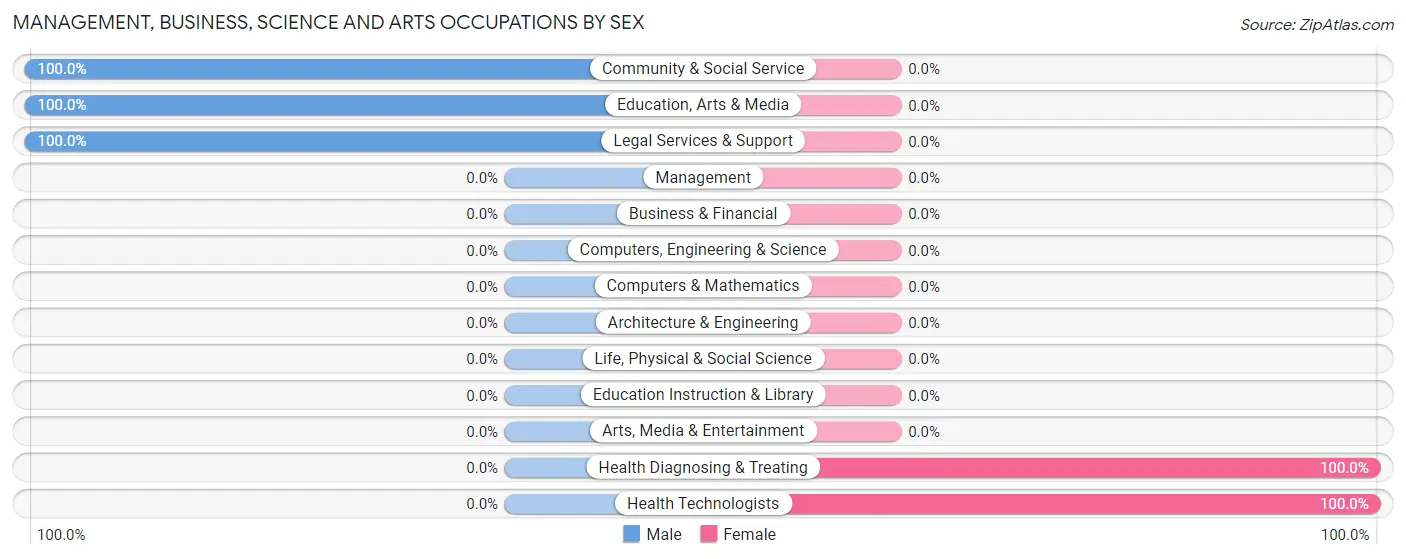
Management, Business, Science and Arts Occupations by Sex
Within the Management, Business, Science and Arts occupations in Fort Washington, the most male-oriented occupations are Community & Social Service (100.0%), Education, Arts & Media (100.0%), and Legal Services & Support (100.0%), while the most female-oriented occupations are Health Diagnosing & Treating (100.0%), and Health Technologists (100.0%).
| Occupation | Male | Female |
| Management | 0 (0.0%) | 0 (0.0%) |
| Business & Financial | 0 (0.0%) | 0 (0.0%) |
| Computers, Engineering & Science | 0 (0.0%) | 0 (0.0%) |
| Computers & Mathematics | 0 (0.0%) | 0 (0.0%) |
| Architecture & Engineering | 0 (0.0%) | 0 (0.0%) |
| Life, Physical & Social Science | 0 (0.0%) | 0 (0.0%) |
| Community & Social Service | 71 (100.0%) | 0 (0.0%) |
| Education, Arts & Media | 52 (100.0%) | 0 (0.0%) |
| Legal Services & Support | 19 (100.0%) | 0 (0.0%) |
| Education Instruction & Library | 0 (0.0%) | 0 (0.0%) |
| Arts, Media & Entertainment | 0 (0.0%) | 0 (0.0%) |
| Health Diagnosing & Treating | 0 (0.0%) | 9 (100.0%) |
| Health Technologists | 0 (0.0%) | 9 (100.0%) |
| Total (Category) | 71 (88.7%) | 9 (11.3%) |
| Total (Overall) | 71 (88.7%) | 9 (11.3%) |
Services Occupations
Services Occupations by Sex
| Occupation | Male | Female |
| Healthcare Support | 0 (0.0%) | 0 (0.0%) |
| Security & Protection | 0 (0.0%) | 0 (0.0%) |
| Firefighting & Prevention | 0 (0.0%) | 0 (0.0%) |
| Law Enforcement | 0 (0.0%) | 0 (0.0%) |
| Food Preparation & Serving | 0 (0.0%) | 0 (0.0%) |
| Cleaning & Maintenance | 0 (0.0%) | 0 (0.0%) |
| Personal Care & Service | 0 (0.0%) | 0 (0.0%) |
| Total (Category) | 0 (0.0%) | 0 (0.0%) |
| Total (Overall) | 71 (88.7%) | 9 (11.3%) |
Sales and Office Occupations
Sales and Office Occupations by Sex
| Occupation | Male | Female |
| Sales & Related | 0 (0.0%) | 0 (0.0%) |
| Office & Administration | 0 (0.0%) | 0 (0.0%) |
| Total (Category) | 0 (0.0%) | 0 (0.0%) |
| Total (Overall) | 71 (88.7%) | 9 (11.3%) |
Natural Resources, Construction and Maintenance Occupations
Natural Resources, Construction and Maintenance Occupations by Sex
| Occupation | Male | Female |
| Farming, Fishing & Forestry | 0 (0.0%) | 0 (0.0%) |
| Construction & Extraction | 0 (0.0%) | 0 (0.0%) |
| Installation, Maintenance & Repair | 0 (0.0%) | 0 (0.0%) |
| Total (Category) | 0 (0.0%) | 0 (0.0%) |
| Total (Overall) | 71 (88.7%) | 9 (11.3%) |
Production, Transportation and Moving Occupations
Production, Transportation and Moving Occupations by Sex
| Occupation | Male | Female |
| Production | 0 (0.0%) | 0 (0.0%) |
| Transportation | 0 (0.0%) | 0 (0.0%) |
| Material Moving | 0 (0.0%) | 0 (0.0%) |
| Total (Category) | 0 (0.0%) | 0 (0.0%) |
| Total (Overall) | 71 (88.7%) | 9 (11.3%) |
Employment Industries by Sex in Fort Washington
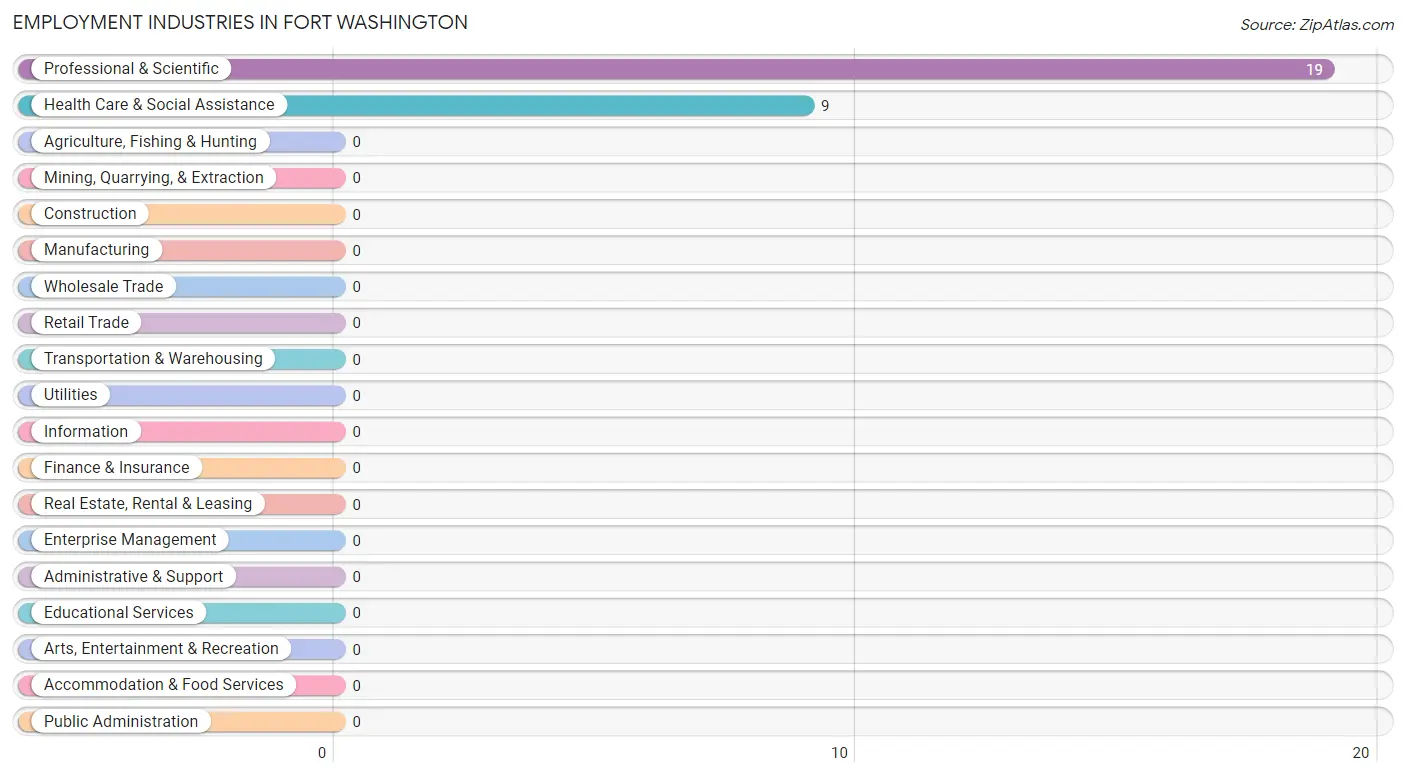
Employment Industries in Fort Washington
The major employment industries in Fort Washington include Professional & Scientific (19 | 23.7%), and Health Care & Social Assistance (9 | 11.3%).
Employment Industries by Sex in Fort Washington
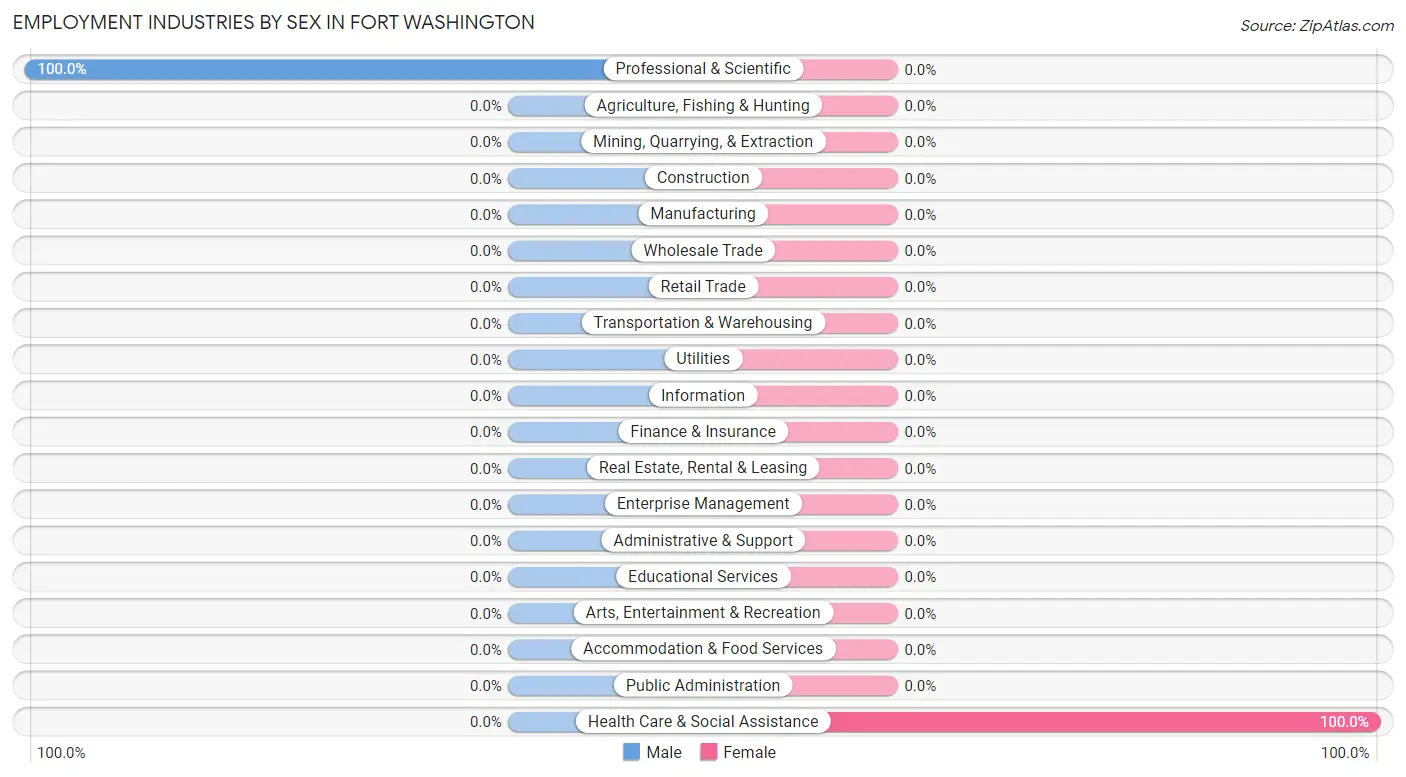
| Industry | Male | Female |
| Agriculture, Fishing & Hunting | 0 (0.0%) | 0 (0.0%) |
| Mining, Quarrying, & Extraction | 0 (0.0%) | 0 (0.0%) |
| Construction | 0 (0.0%) | 0 (0.0%) |
| Manufacturing | 0 (0.0%) | 0 (0.0%) |
| Wholesale Trade | 0 (0.0%) | 0 (0.0%) |
| Retail Trade | 0 (0.0%) | 0 (0.0%) |
| Transportation & Warehousing | 0 (0.0%) | 0 (0.0%) |
| Utilities | 0 (0.0%) | 0 (0.0%) |
| Information | 0 (0.0%) | 0 (0.0%) |
| Finance & Insurance | 0 (0.0%) | 0 (0.0%) |
| Real Estate, Rental & Leasing | 0 (0.0%) | 0 (0.0%) |
| Professional & Scientific | 19 (100.0%) | 0 (0.0%) |
| Enterprise Management | 0 (0.0%) | 0 (0.0%) |
| Administrative & Support | 0 (0.0%) | 0 (0.0%) |
| Educational Services | 0 (0.0%) | 0 (0.0%) |
| Health Care & Social Assistance | 0 (0.0%) | 9 (100.0%) |
| Arts, Entertainment & Recreation | 0 (0.0%) | 0 (0.0%) |
| Accommodation & Food Services | 0 (0.0%) | 0 (0.0%) |
| Public Administration | 0 (0.0%) | 0 (0.0%) |
| Total | 71 (88.7%) | 9 (11.3%) |
Education in Fort Washington
School Enrollment in Fort Washington
| School Level | # Students | % Students |
| Nursery / Preschool | 0 | 0.0% |
| Kindergarten | 0 | 0.0% |
| Elementary School | 0 | 0.0% |
| Middle School | 0 | 0.0% |
| High School | 0 | 0.0% |
| College / Undergraduate | 0 | 0.0% |
| Graduate / Professional | 0 | 0.0% |
| Total | 0 | 0.0% |
School Enrollment by Age by Funding Source in Fort Washington
| Age Bracket | Public School | Private School |
| 3 to 4 Year Olds | 0 (0.0%) | 0 (0.0%) |
| 5 to 9 Year Old | 0 (0.0%) | 0 (0.0%) |
| 10 to 14 Year Olds | 0 (0.0%) | 0 (0.0%) |
| 15 to 17 Year Olds | 0 (0.0%) | 0 (0.0%) |
| 18 to 19 Year Olds | 0 (0.0%) | 0 (0.0%) |
| 20 to 24 Year Olds | 0 (0.0%) | 0 (0.0%) |
| 25 to 34 Year Olds | 0 (0.0%) | 0 (0.0%) |
| 35 Years and over | 0 (0.0%) | 0 (0.0%) |
| Total | 0 (0.0%) | 0 (0.0%) |
Educational Attainment by Field of Study in Fort Washington
Liberal arts & history (52 | 37.1%), psychology (51 | 36.4%), business (19 | 13.6%), social sciences (9 | 6.4%), and science & technology (9 | 6.4%) are the most common fields of study among 140 individuals in Fort Washington who have obtained a bachelor's degree or higher.
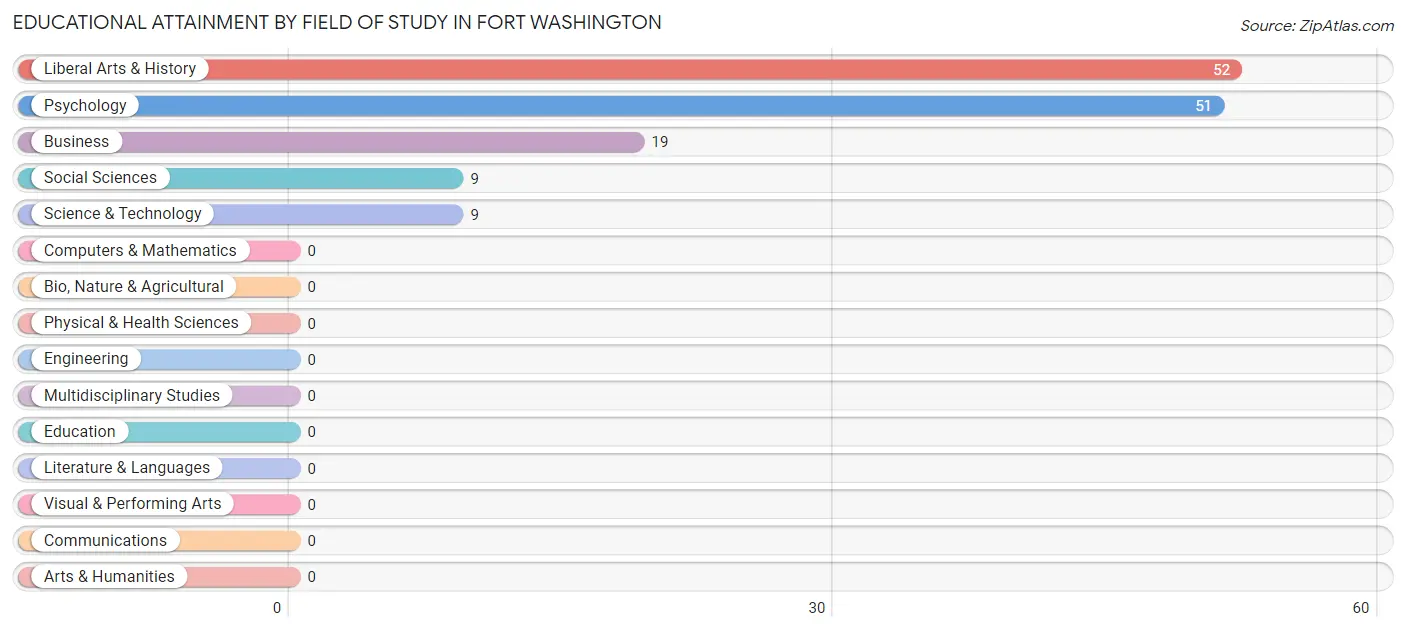
| Field of Study | # Graduates | % Graduates |
| Computers & Mathematics | 0 | 0.0% |
| Bio, Nature & Agricultural | 0 | 0.0% |
| Physical & Health Sciences | 0 | 0.0% |
| Psychology | 51 | 36.4% |
| Social Sciences | 9 | 6.4% |
| Engineering | 0 | 0.0% |
| Multidisciplinary Studies | 0 | 0.0% |
| Science & Technology | 9 | 6.4% |
| Business | 19 | 13.6% |
| Education | 0 | 0.0% |
| Literature & Languages | 0 | 0.0% |
| Liberal Arts & History | 52 | 37.1% |
| Visual & Performing Arts | 0 | 0.0% |
| Communications | 0 | 0.0% |
| Arts & Humanities | 0 | 0.0% |
| Total | 140 | 100.0% |
Transportation & Commute in Fort Washington
Vehicle Availability by Sex in Fort Washington
The most prevalent vehicle ownership categories in Fort Washington are males with 1 vehicle (52, accounting for 73.2%) and females with 1 vehicle (0, making up 577.8%).
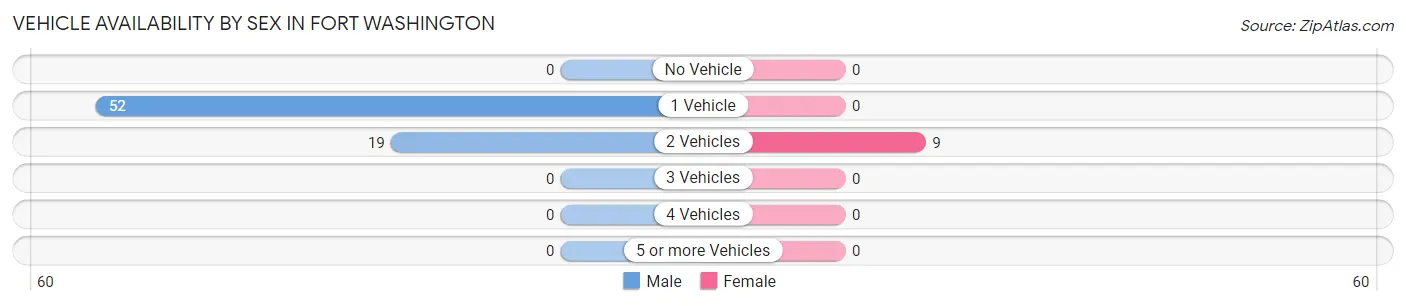
| Vehicles Available | Male | Female |
| No Vehicle | 0 (0.0%) | 0 (0.0%) |
| 1 Vehicle | 52 (73.2%) | 0 (0.0%) |
| 2 Vehicles | 19 (26.8%) | 9 (100.0%) |
| 3 Vehicles | 0 (0.0%) | 0 (0.0%) |
| 4 Vehicles | 0 (0.0%) | 0 (0.0%) |
| 5 or more Vehicles | 0 (0.0%) | 0 (0.0%) |
| Total | 71 (100.0%) | 9 (100.0%) |
Commute Time in Fort Washington
The most frequently occuring commute durations in Fort Washington are 10 to 14 minutes (52 commuters, 65.0%), 15 to 19 minutes (19 commuters, 23.7%), and 25 to 29 minutes (9 commuters, 11.3%).
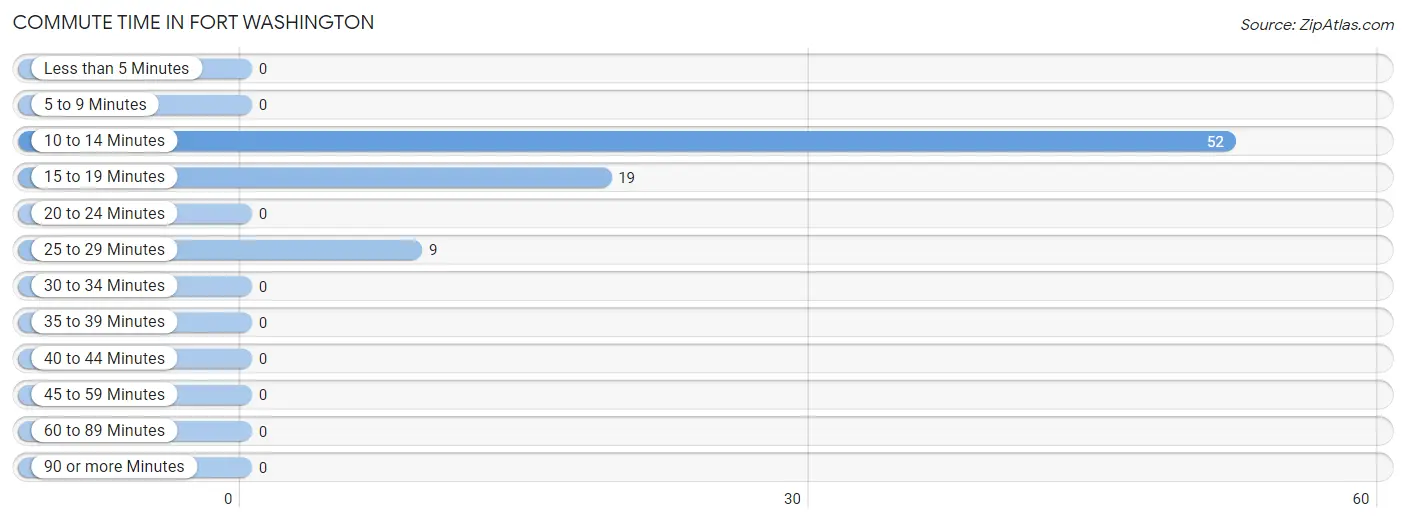
| Commute Time | # Commuters | % Commuters |
| Less than 5 Minutes | 0 | 0.0% |
| 5 to 9 Minutes | 0 | 0.0% |
| 10 to 14 Minutes | 52 | 65.0% |
| 15 to 19 Minutes | 19 | 23.7% |
| 20 to 24 Minutes | 0 | 0.0% |
| 25 to 29 Minutes | 9 | 11.3% |
| 30 to 34 Minutes | 0 | 0.0% |
| 35 to 39 Minutes | 0 | 0.0% |
| 40 to 44 Minutes | 0 | 0.0% |
| 45 to 59 Minutes | 0 | 0.0% |
| 60 to 89 Minutes | 0 | 0.0% |
| 90 or more Minutes | 0 | 0.0% |
Commute Time by Sex in Fort Washington
The most common commute times in Fort Washington are 10 to 14 minutes (52 commuters, 73.2%) for males and 25 to 29 minutes (9 commuters, 100.0%) for females.
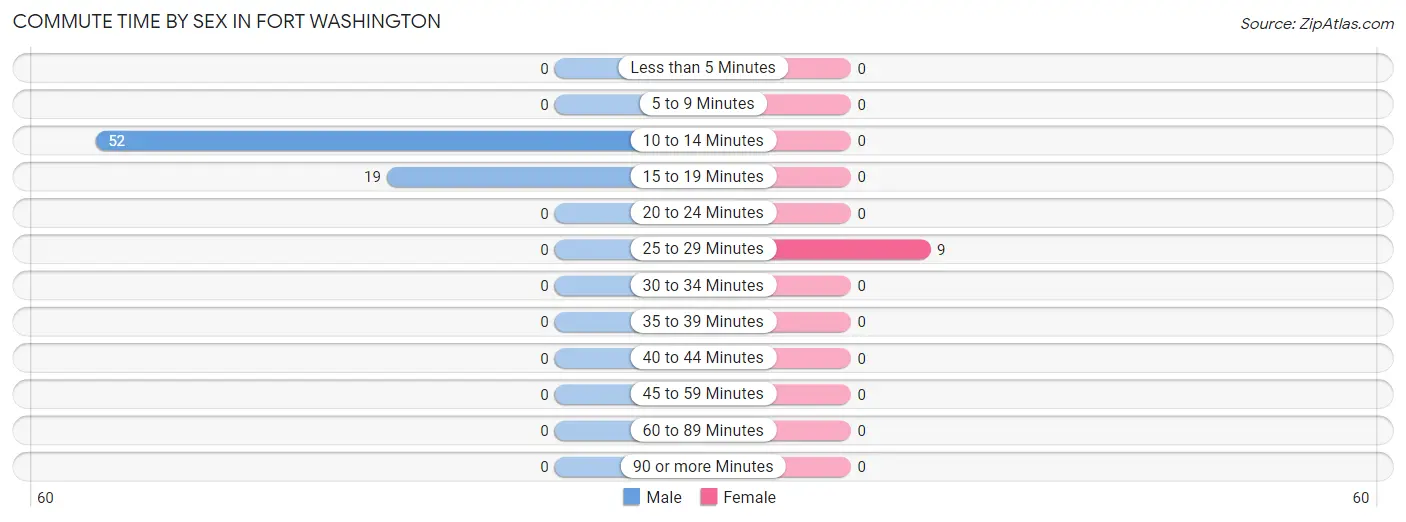
| Commute Time | Male | Female |
| Less than 5 Minutes | 0 (0.0%) | 0 (0.0%) |
| 5 to 9 Minutes | 0 (0.0%) | 0 (0.0%) |
| 10 to 14 Minutes | 52 (73.2%) | 0 (0.0%) |
| 15 to 19 Minutes | 19 (26.8%) | 0 (0.0%) |
| 20 to 24 Minutes | 0 (0.0%) | 0 (0.0%) |
| 25 to 29 Minutes | 0 (0.0%) | 9 (100.0%) |
| 30 to 34 Minutes | 0 (0.0%) | 0 (0.0%) |
| 35 to 39 Minutes | 0 (0.0%) | 0 (0.0%) |
| 40 to 44 Minutes | 0 (0.0%) | 0 (0.0%) |
| 45 to 59 Minutes | 0 (0.0%) | 0 (0.0%) |
| 60 to 89 Minutes | 0 (0.0%) | 0 (0.0%) |
| 90 or more Minutes | 0 (0.0%) | 0 (0.0%) |
Time of Departure to Work by Sex in Fort Washington
The most frequent times of departure to work in Fort Washington are 7:30 AM to 7:59 AM (52, 73.2%) for males and 9:00 AM to 9:59 AM (9, 100.0%) for females.
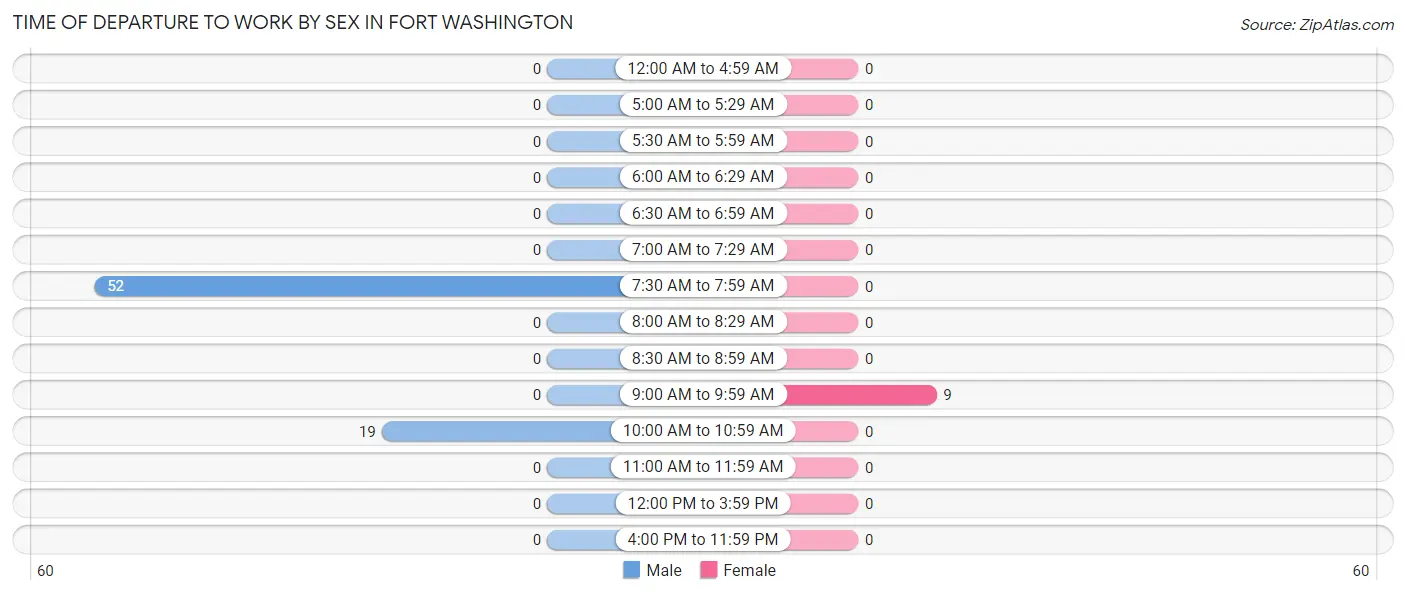
| Time of Departure | Male | Female |
| 12:00 AM to 4:59 AM | 0 (0.0%) | 0 (0.0%) |
| 5:00 AM to 5:29 AM | 0 (0.0%) | 0 (0.0%) |
| 5:30 AM to 5:59 AM | 0 (0.0%) | 0 (0.0%) |
| 6:00 AM to 6:29 AM | 0 (0.0%) | 0 (0.0%) |
| 6:30 AM to 6:59 AM | 0 (0.0%) | 0 (0.0%) |
| 7:00 AM to 7:29 AM | 0 (0.0%) | 0 (0.0%) |
| 7:30 AM to 7:59 AM | 52 (73.2%) | 0 (0.0%) |
| 8:00 AM to 8:29 AM | 0 (0.0%) | 0 (0.0%) |
| 8:30 AM to 8:59 AM | 0 (0.0%) | 0 (0.0%) |
| 9:00 AM to 9:59 AM | 0 (0.0%) | 9 (100.0%) |
| 10:00 AM to 10:59 AM | 19 (26.8%) | 0 (0.0%) |
| 11:00 AM to 11:59 AM | 0 (0.0%) | 0 (0.0%) |
| 12:00 PM to 3:59 PM | 0 (0.0%) | 0 (0.0%) |
| 4:00 PM to 11:59 PM | 0 (0.0%) | 0 (0.0%) |
| Total | 71 (100.0%) | 9 (100.0%) |
Housing Occupancy in Fort Washington
Occupancy by Ownership in Fort Washington
Of the total 79 dwellings in Fort Washington, owner-occupied units account for 79 (100.0%), while renter-occupied units make up 0 (0.0%).
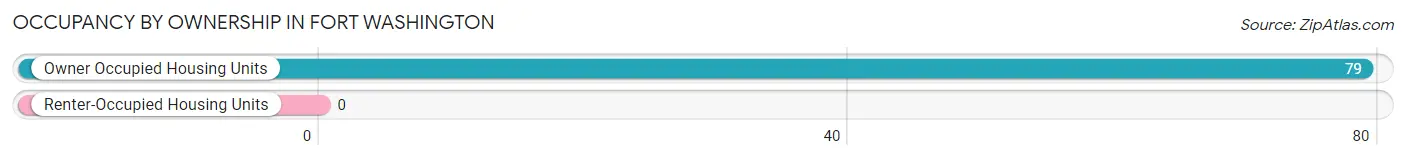
| Occupancy | # Housing Units | % Housing Units |
| Owner Occupied Housing Units | 79 | 100.0% |
| Renter-Occupied Housing Units | 0 | 0.0% |
| Total Occupied Housing Units | 79 | 100.0% |
Occupancy by Household Size in Fort Washington
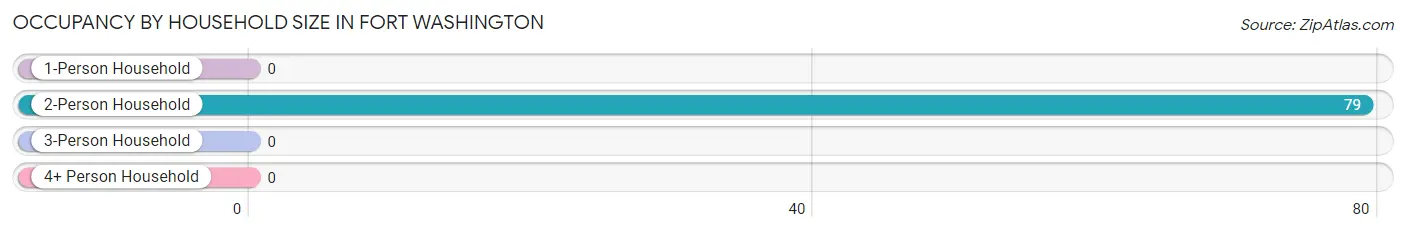
| Household Size | # Housing Units | % Housing Units |
| 1-Person Household | 0 | 0.0% |
| 2-Person Household | 79 | 100.0% |
| 3-Person Household | 0 | 0.0% |
| 4+ Person Household | 0 | 0.0% |
| Total Housing Units | 79 | 100.0% |
Occupancy by Ownership by Household Size in Fort Washington
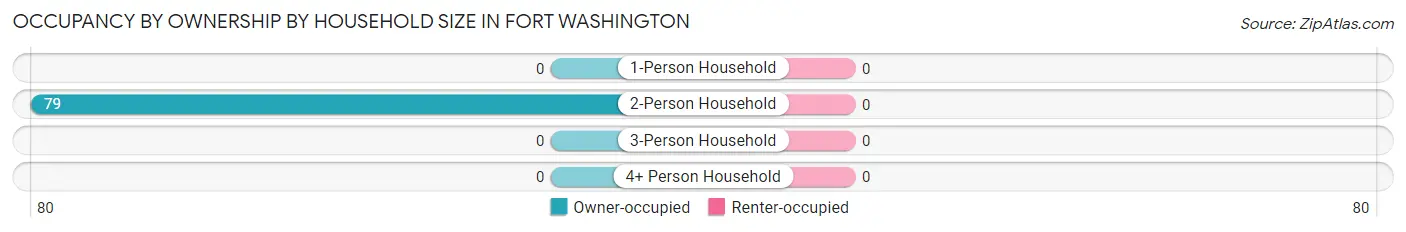
| Household Size | Owner-occupied | Renter-occupied |
| 1-Person Household | 0 (0.0%) | 0 (0.0%) |
| 2-Person Household | 79 (100.0%) | 0 (0.0%) |
| 3-Person Household | 0 (0.0%) | 0 (0.0%) |
| 4+ Person Household | 0 (0.0%) | 0 (0.0%) |
| Total Housing Units | 79 (100.0%) | 0 (0.0%) |
Occupancy by Educational Attainment in Fort Washington
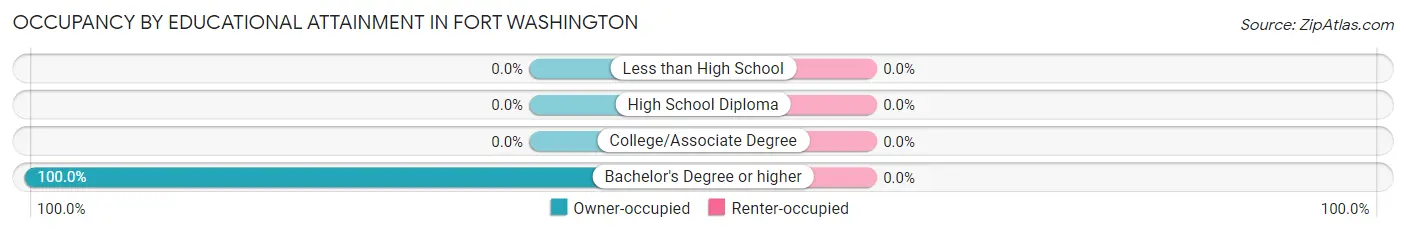
| Household Size | Owner-occupied | Renter-occupied |
| Less than High School | 0 (0.0%) | 0 (0.0%) |
| High School Diploma | 0 (0.0%) | 0 (0.0%) |
| College/Associate Degree | 0 (0.0%) | 0 (0.0%) |
| Bachelor's Degree or higher | 79 (100.0%) | 0 (0.0%) |
Occupancy by Age of Householder in Fort Washington
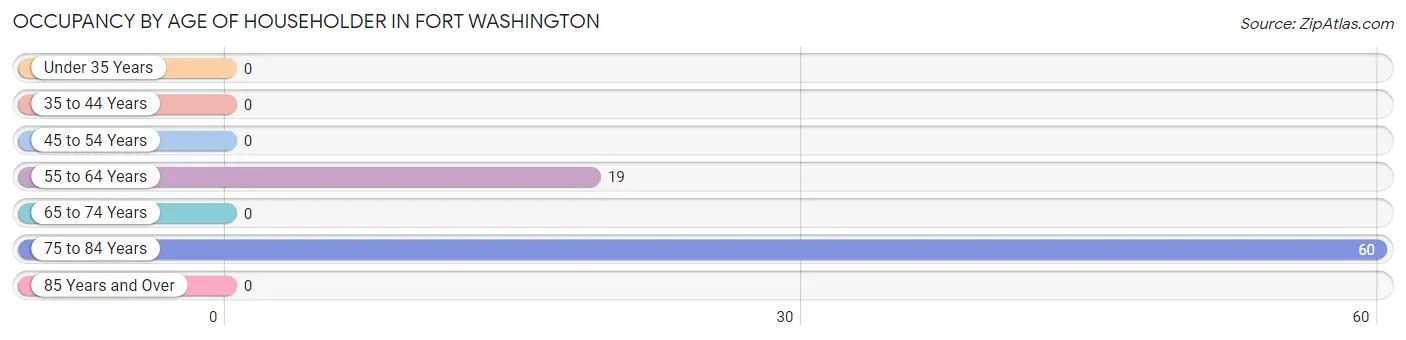
| Age Bracket | # Households | % Households |
| Under 35 Years | 0 | 0.0% |
| 35 to 44 Years | 0 | 0.0% |
| 45 to 54 Years | 0 | 0.0% |
| 55 to 64 Years | 19 | 24.0% |
| 65 to 74 Years | 0 | 0.0% |
| 75 to 84 Years | 60 | 75.9% |
| 85 Years and Over | 0 | 0.0% |
| Total | 79 | 100.0% |
Housing Finances in Fort Washington
Median Income by Occupancy in Fort Washington
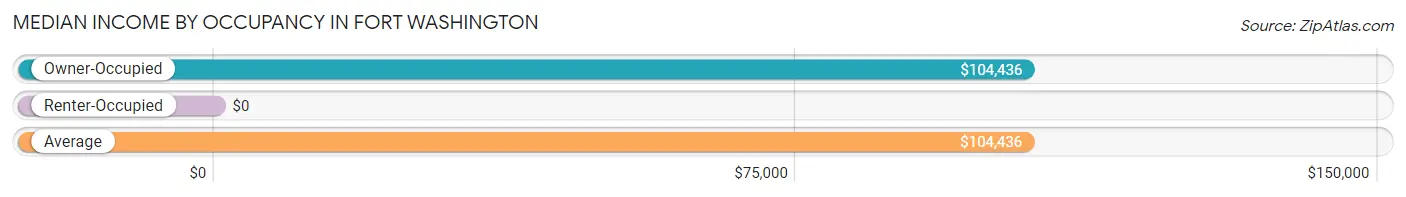
| Occupancy Type | # Households | Median Income |
| Owner-Occupied | 79 (100.0%) | $104,436 |
| Renter-Occupied | 0 (0.0%) | $0 |
| Average | 79 (100.0%) | $104,436 |
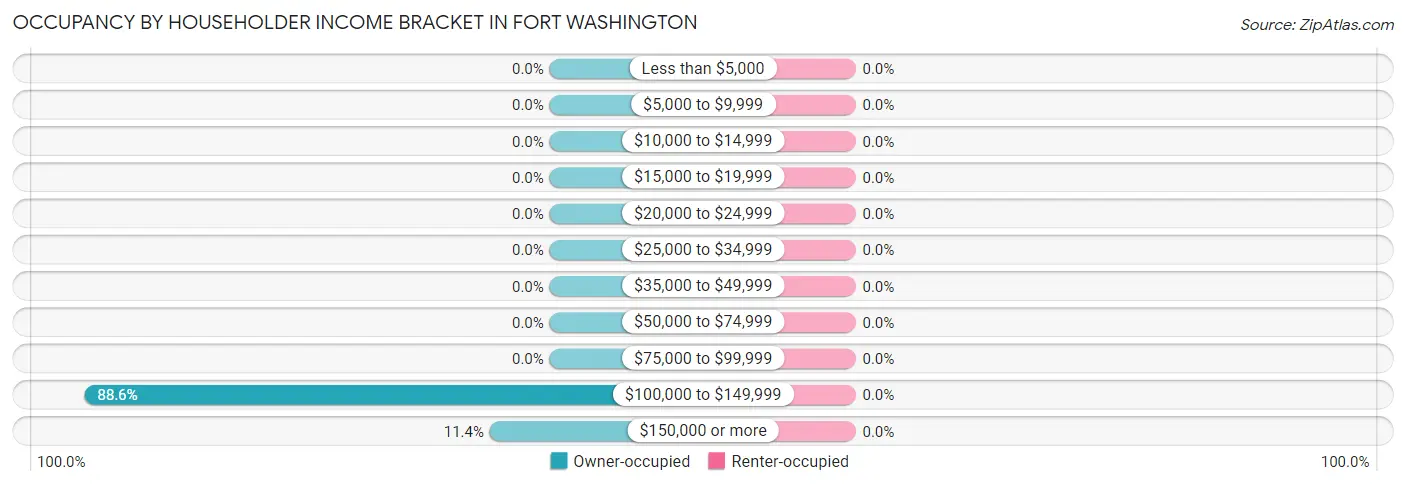
Occupancy by Householder Income Bracket in Fort Washington
| Income Bracket | Owner-occupied | Renter-occupied |
| Less than $5,000 | 0 (0.0%) | 0 (0.0%) |
| $5,000 to $9,999 | 0 (0.0%) | 0 (0.0%) |
| $10,000 to $14,999 | 0 (0.0%) | 0 (0.0%) |
| $15,000 to $19,999 | 0 (0.0%) | 0 (0.0%) |
| $20,000 to $24,999 | 0 (0.0%) | 0 (0.0%) |
| $25,000 to $34,999 | 0 (0.0%) | 0 (0.0%) |
| $35,000 to $49,999 | 0 (0.0%) | 0 (0.0%) |
| $50,000 to $74,999 | 0 (0.0%) | 0 (0.0%) |
| $75,000 to $99,999 | 0 (0.0%) | 0 (0.0%) |
| $100,000 to $149,999 | 70 (88.6%) | 0 (0.0%) |
| $150,000 or more | 9 (11.4%) | 0 (0.0%) |
| Total | 79 (100.0%) | 0 (0.0%) |
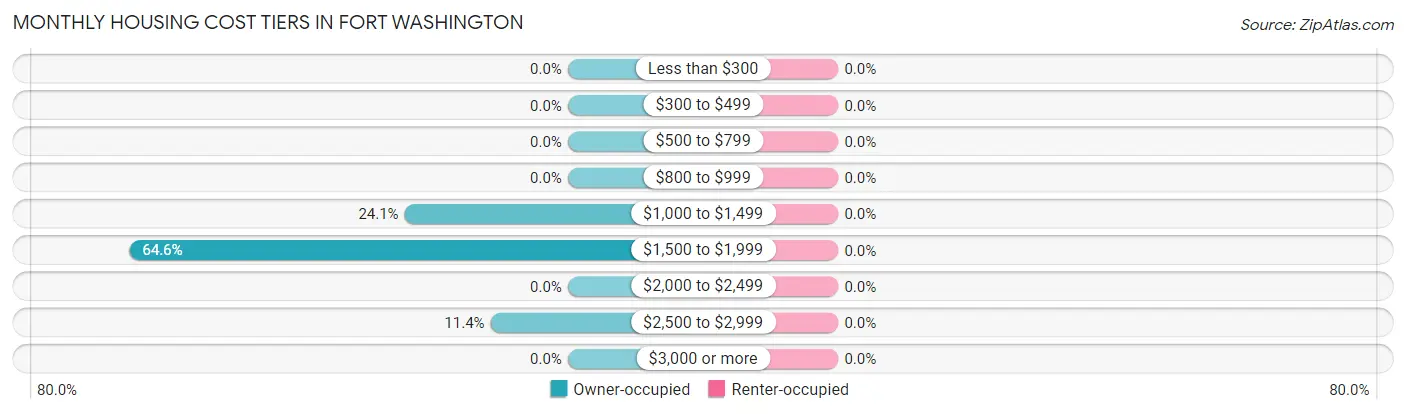
Monthly Housing Cost Tiers in Fort Washington
| Monthly Cost | Owner-occupied | Renter-occupied |
| Less than $300 | 0 (0.0%) | 0 (0.0%) |
| $300 to $499 | 0 (0.0%) | 0 (0.0%) |
| $500 to $799 | 0 (0.0%) | 0 (0.0%) |
| $800 to $999 | 0 (0.0%) | 0 (0.0%) |
| $1,000 to $1,499 | 19 (24.0%) | 0 (0.0%) |
| $1,500 to $1,999 | 51 (64.6%) | 0 (0.0%) |
| $2,000 to $2,499 | 0 (0.0%) | 0 (0.0%) |
| $2,500 to $2,999 | 9 (11.4%) | 0 (0.0%) |
| $3,000 or more | 0 (0.0%) | 0 (0.0%) |
| Total | 79 (100.0%) | 0 (0.0%) |
Physical Housing Characteristics in Fort Washington
Housing Structures in Fort Washington
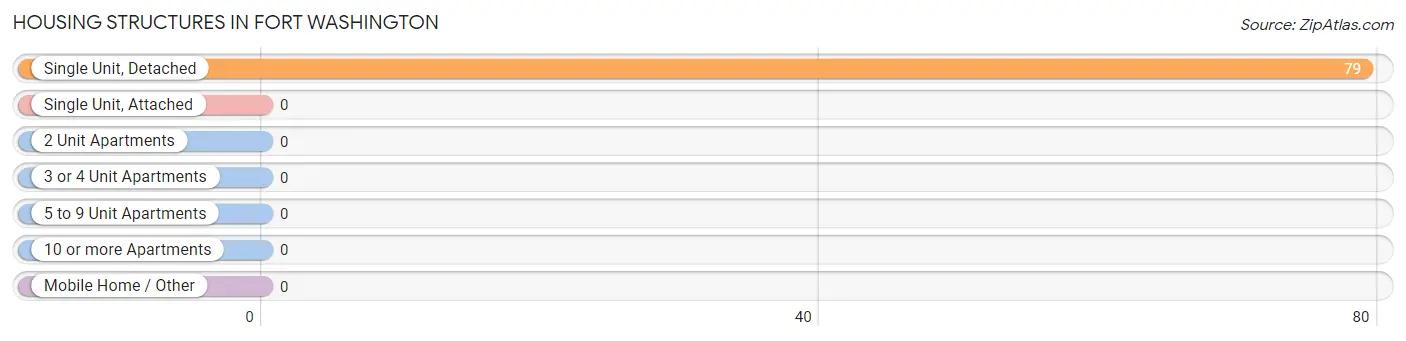
| Structure Type | # Housing Units | % Housing Units |
| Single Unit, Detached | 79 | 100.0% |
| Single Unit, Attached | 0 | 0.0% |
| 2 Unit Apartments | 0 | 0.0% |
| 3 or 4 Unit Apartments | 0 | 0.0% |
| 5 to 9 Unit Apartments | 0 | 0.0% |
| 10 or more Apartments | 0 | 0.0% |
| Mobile Home / Other | 0 | 0.0% |
| Total | 79 | 100.0% |
Housing Structures by Occupancy in Fort Washington
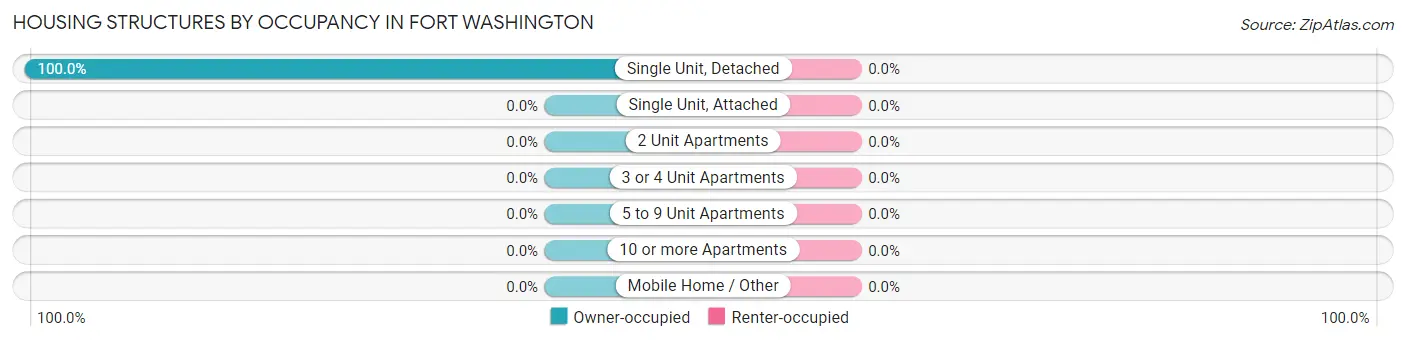
| Structure Type | Owner-occupied | Renter-occupied |
| Single Unit, Detached | 79 (100.0%) | 0 (0.0%) |
| Single Unit, Attached | 0 (0.0%) | 0 (0.0%) |
| 2 Unit Apartments | 0 (0.0%) | 0 (0.0%) |
| 3 or 4 Unit Apartments | 0 (0.0%) | 0 (0.0%) |
| 5 to 9 Unit Apartments | 0 (0.0%) | 0 (0.0%) |
| 10 or more Apartments | 0 (0.0%) | 0 (0.0%) |
| Mobile Home / Other | 0 (0.0%) | 0 (0.0%) |
| Total | 79 (100.0%) | 0 (0.0%) |
Housing Structures by Number of Rooms in Fort Washington
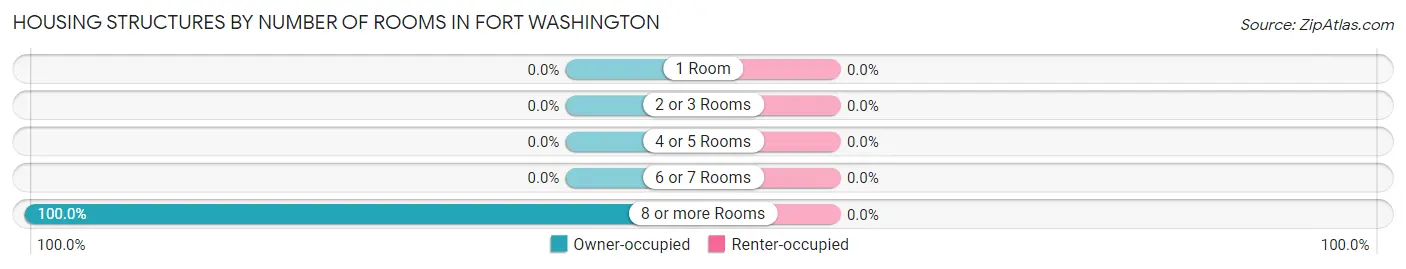
| Number of Rooms | Owner-occupied | Renter-occupied |
| 1 Room | 0 (0.0%) | 0 (0.0%) |
| 2 or 3 Rooms | 0 (0.0%) | 0 (0.0%) |
| 4 or 5 Rooms | 0 (0.0%) | 0 (0.0%) |
| 6 or 7 Rooms | 0 (0.0%) | 0 (0.0%) |
| 8 or more Rooms | 79 (100.0%) | 0 (0.0%) |
| Total | 79 (100.0%) | 0 (0.0%) |
Housing Structure by Heating Type in Fort Washington
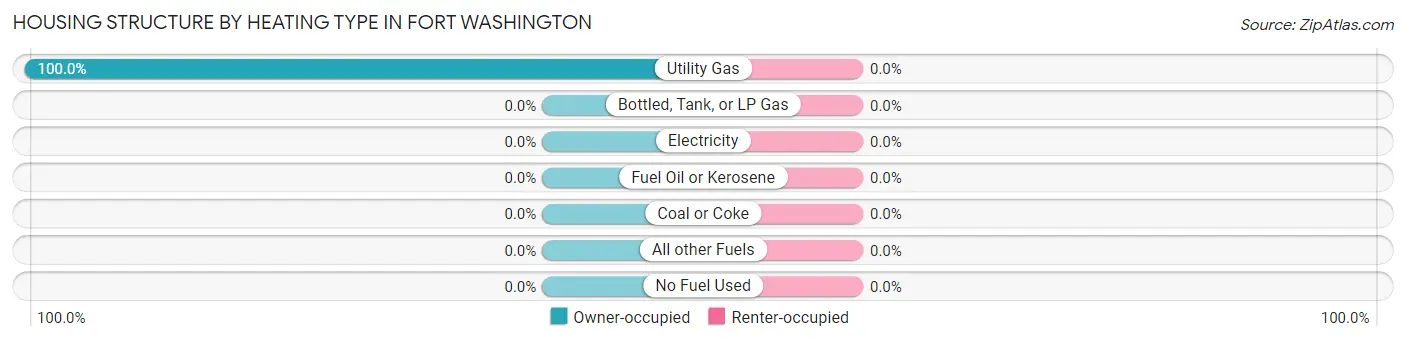
| Heating Type | Owner-occupied | Renter-occupied |
| Utility Gas | 79 (100.0%) | 0 (0.0%) |
| Bottled, Tank, or LP Gas | 0 (0.0%) | 0 (0.0%) |
| Electricity | 0 (0.0%) | 0 (0.0%) |
| Fuel Oil or Kerosene | 0 (0.0%) | 0 (0.0%) |
| Coal or Coke | 0 (0.0%) | 0 (0.0%) |
| All other Fuels | 0 (0.0%) | 0 (0.0%) |
| No Fuel Used | 0 (0.0%) | 0 (0.0%) |
| Total | 79 (100.0%) | 0 (0.0%) |
Household Vehicle Usage in Fort Washington
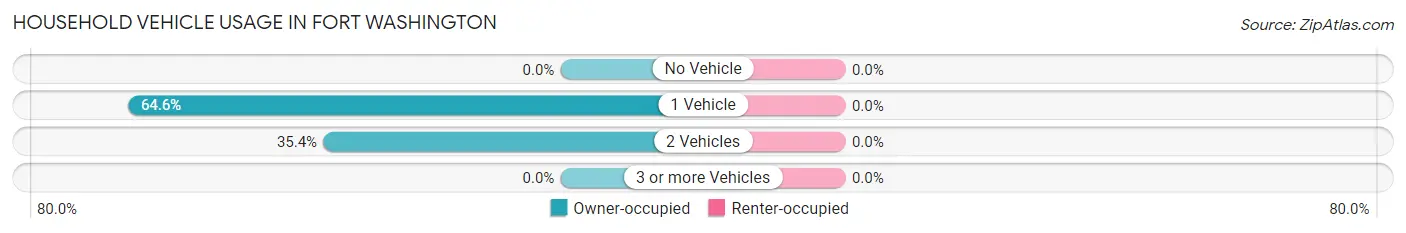
| Vehicles per Household | Owner-occupied | Renter-occupied |
| No Vehicle | 0 (0.0%) | 0 (0.0%) |
| 1 Vehicle | 51 (64.6%) | 0 (0.0%) |
| 2 Vehicles | 28 (35.4%) | 0 (0.0%) |
| 3 or more Vehicles | 0 (0.0%) | 0 (0.0%) |
| Total | 79 (100.0%) | 0 (0.0%) |
Real Estate & Mortgages in Fort Washington
Real Estate and Mortgage Overview in Fort Washington
| Characteristic | Without Mortgage | With Mortgage |
| Housing Units | 19 | 60 |
| Median Property Value | - | - |
| Median Household Income | - | - |
| Monthly Housing Costs | - | - |
| Real Estate Taxes | - | - |
Property Value by Mortgage Status in Fort Washington
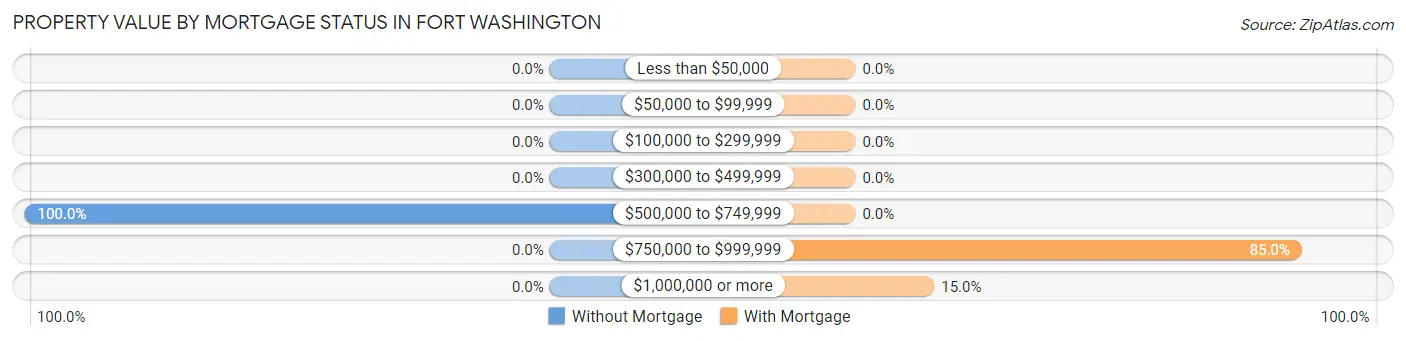
| Property Value | Without Mortgage | With Mortgage |
| Less than $50,000 | 0 (0.0%) | 0 (0.0%) |
| $50,000 to $99,999 | 0 (0.0%) | 0 (0.0%) |
| $100,000 to $299,999 | 0 (0.0%) | 0 (0.0%) |
| $300,000 to $499,999 | 0 (0.0%) | 0 (0.0%) |
| $500,000 to $749,999 | 19 (100.0%) | 0 (0.0%) |
| $750,000 to $999,999 | 0 (0.0%) | 51 (85.0%) |
| $1,000,000 or more | 0 (0.0%) | 9 (15.0%) |
| Total | 19 (100.0%) | 60 (100.0%) |
Household Income by Mortgage Status in Fort Washington
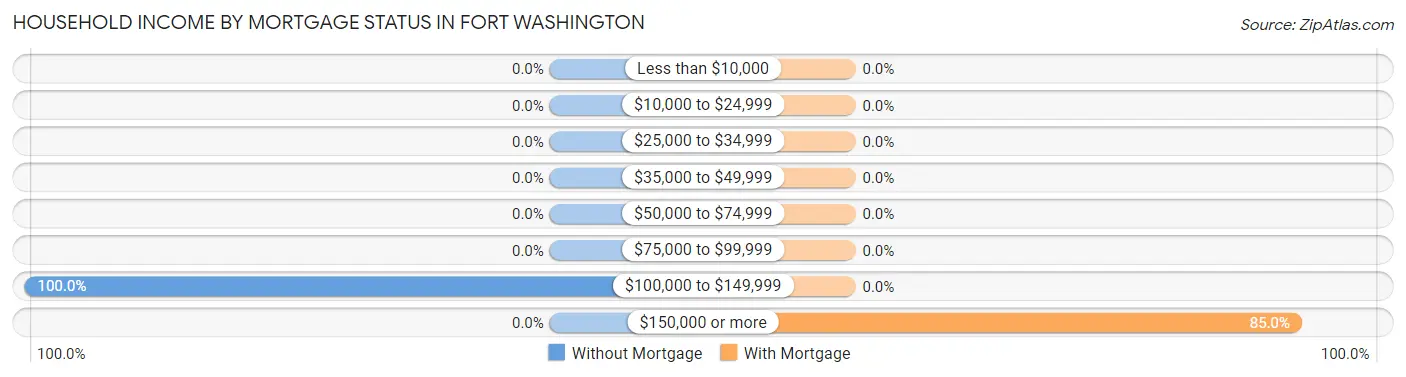
| Household Income | Without Mortgage | With Mortgage |
| Less than $10,000 | 0 (0.0%) | 0 (0.0%) |
| $10,000 to $24,999 | 0 (0.0%) | 0 (0.0%) |
| $25,000 to $34,999 | 0 (0.0%) | 0 (0.0%) |
| $35,000 to $49,999 | 0 (0.0%) | 0 (0.0%) |
| $50,000 to $74,999 | 0 (0.0%) | 0 (0.0%) |
| $75,000 to $99,999 | 0 (0.0%) | 0 (0.0%) |
| $100,000 to $149,999 | 19 (100.0%) | 0 (0.0%) |
| $150,000 or more | 0 (0.0%) | 51 (85.0%) |
| Total | 19 (100.0%) | 60 (100.0%) |
Property Value to Household Income Ratio in Fort Washington
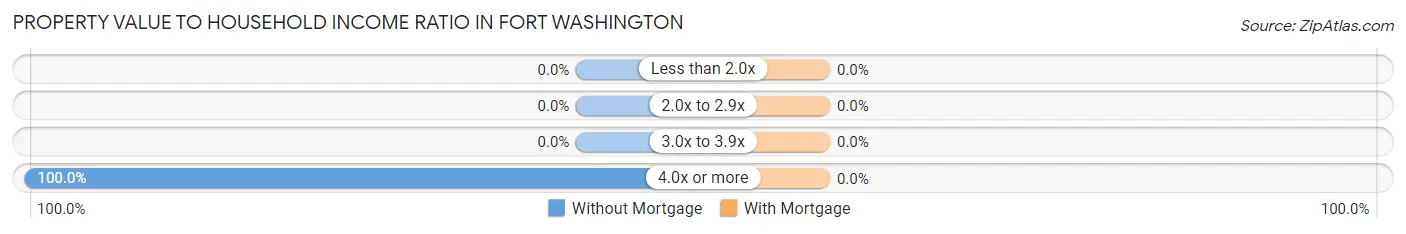
| Value-to-Income Ratio | Without Mortgage | With Mortgage |
| Less than 2.0x | 0 (0.0%) | 0 (0.0%) |
| 2.0x to 2.9x | 0 (0.0%) | 0 (0.0%) |
| 3.0x to 3.9x | 0 (0.0%) | 0 (0.0%) |
| 4.0x or more | 19 (100.0%) | 0 (0.0%) |
| Total | 19 (100.0%) | 60 (100.0%) |
Real Estate Taxes by Mortgage Status in Fort Washington
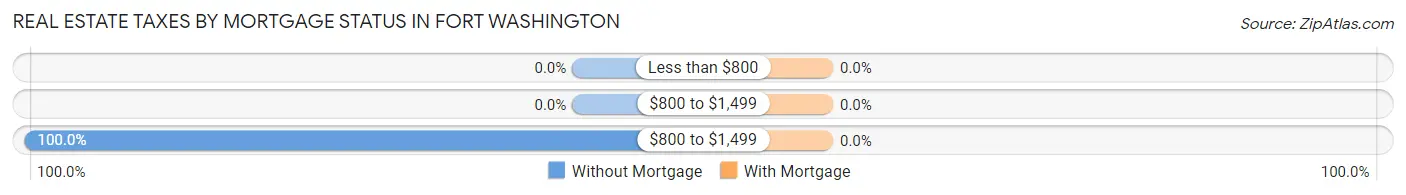
| Property Taxes | Without Mortgage | With Mortgage |
| Less than $800 | 0 (0.0%) | 0 (0.0%) |
| $800 to $1,499 | 0 (0.0%) | 0 (0.0%) |
| $800 to $1,499 | 19 (100.0%) | 0 (0.0%) |
| Total | 19 (100.0%) | 60 (100.0%) |
Health & Disability in Fort Washington
Health Insurance Coverage by Age in Fort Washington
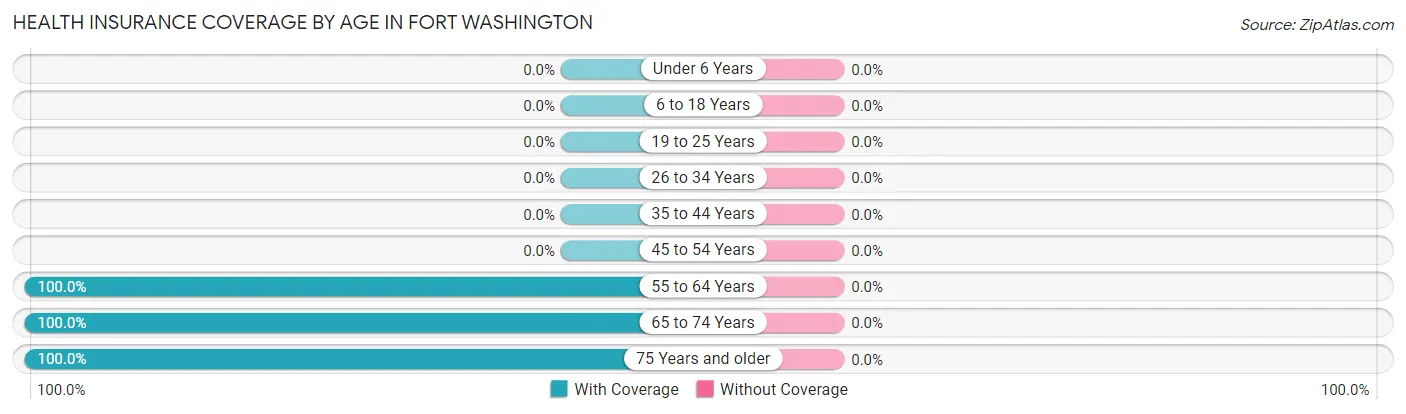
| Age Bracket | With Coverage | Without Coverage |
| Under 6 Years | 0 (0.0%) | 0 (0.0%) |
| 6 to 18 Years | 0 (0.0%) | 0 (0.0%) |
| 19 to 25 Years | 0 (0.0%) | 0 (0.0%) |
| 26 to 34 Years | 0 (0.0%) | 0 (0.0%) |
| 35 to 44 Years | 0 (0.0%) | 0 (0.0%) |
| 45 to 54 Years | 0 (0.0%) | 0 (0.0%) |
| 55 to 64 Years | 19 (100.0%) | 0 (0.0%) |
| 65 to 74 Years | 27 (100.0%) | 0 (0.0%) |
| 75 Years and older | 112 (100.0%) | 0 (0.0%) |
| Total | 158 (100.0%) | 0 (0.0%) |
Health Insurance Coverage by Citizenship Status in Fort Washington
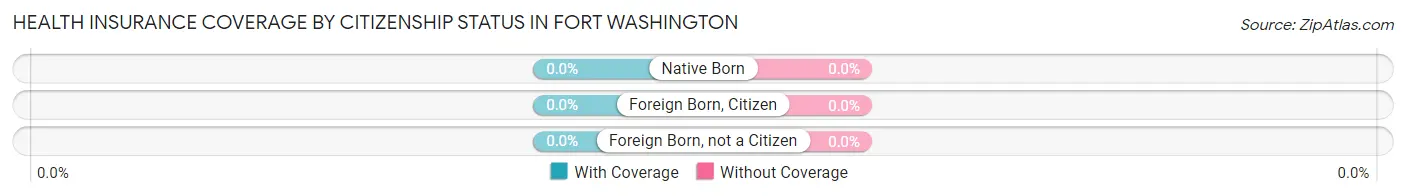
| Citizenship Status | With Coverage | Without Coverage |
| Native Born | 0 (0.0%) | 0 (0.0%) |
| Foreign Born, Citizen | 0 (0.0%) | 0 (0.0%) |
| Foreign Born, not a Citizen | 0 (0.0%) | 0 (0.0%) |
Health Insurance Coverage by Household Income in Fort Washington
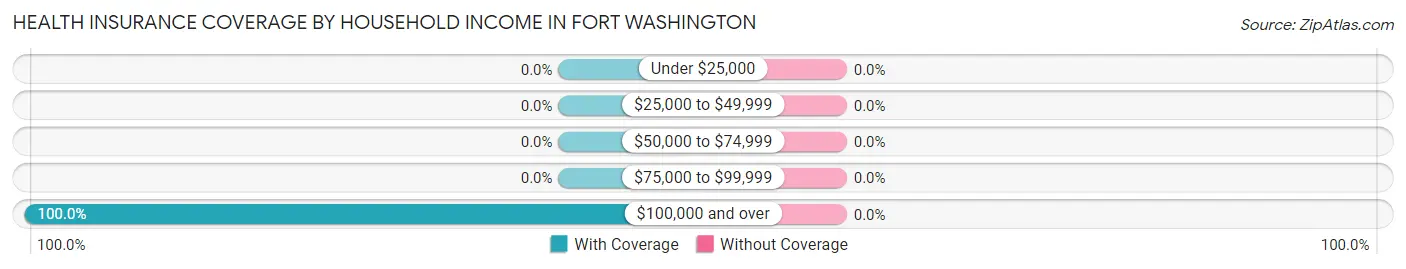
| Household Income | With Coverage | Without Coverage |
| Under $25,000 | 0 (0.0%) | 0 (0.0%) |
| $25,000 to $49,999 | 0 (0.0%) | 0 (0.0%) |
| $50,000 to $74,999 | 0 (0.0%) | 0 (0.0%) |
| $75,000 to $99,999 | 0 (0.0%) | 0 (0.0%) |
| $100,000 and over | 158 (100.0%) | 0 (0.0%) |
Public vs Private Health Insurance Coverage by Age in Fort Washington
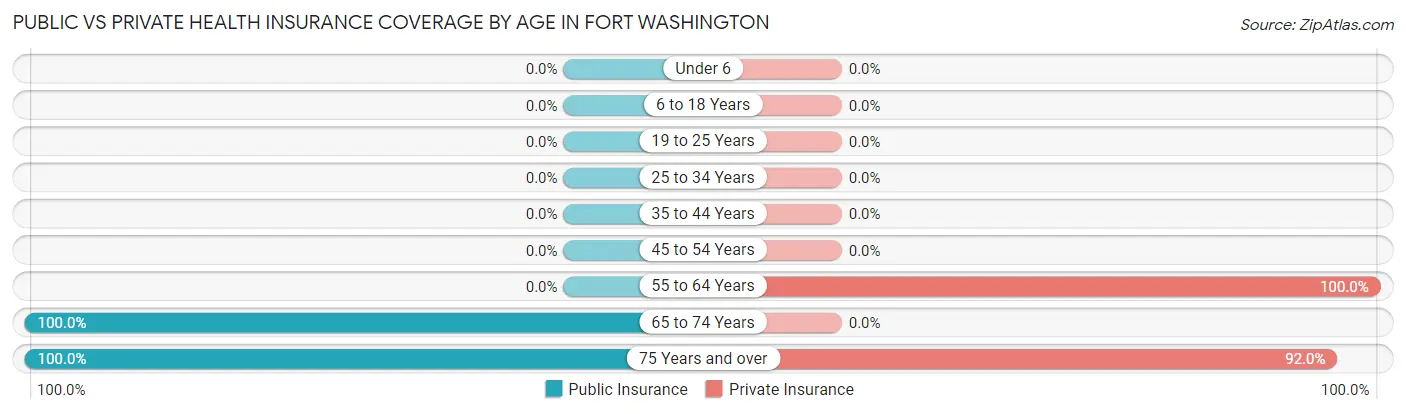
| Age Bracket | Public Insurance | Private Insurance |
| Under 6 | 0 (0.0%) | 0 (0.0%) |
| 6 to 18 Years | 0 (0.0%) | 0 (0.0%) |
| 19 to 25 Years | 0 (0.0%) | 0 (0.0%) |
| 25 to 34 Years | 0 (0.0%) | 0 (0.0%) |
| 35 to 44 Years | 0 (0.0%) | 0 (0.0%) |
| 45 to 54 Years | 0 (0.0%) | 0 (0.0%) |
| 55 to 64 Years | 0 (0.0%) | 19 (100.0%) |
| 65 to 74 Years | 27 (100.0%) | 0 (0.0%) |
| 75 Years and over | 112 (100.0%) | 103 (92.0%) |
| Total | 139 (88.0%) | 122 (77.2%) |
Disability Status by Sex by Age in Fort Washington
| Age Bracket | Male | Female |
| Under 5 Years | 0 (0.0%) | 0 (0.0%) |
| 5 to 17 Years | 0 (0.0%) | 0 (0.0%) |
| 18 to 34 Years | 0 (0.0%) | 0 (0.0%) |
| 35 to 64 Years | 0 (0.0%) | 0 (0.0%) |
| 65 to 74 Years | 0 (0.0%) | 0 (0.0%) |
| 75 Years and over | 0 (0.0%) | 0 (0.0%) |
Disability Class by Sex by Age in Fort Washington
Disability Class: Hearing Difficulty
| Age Bracket | Male | Female |
| Under 5 Years | 0 (0.0%) | 0 (0.0%) |
| 5 to 17 Years | 0 (0.0%) | 0 (0.0%) |
| 18 to 34 Years | 0 (0.0%) | 0 (0.0%) |
| 35 to 64 Years | 0 (0.0%) | 0 (0.0%) |
| 65 to 74 Years | 0 (0.0%) | 0 (0.0%) |
| 75 Years and over | 0 (0.0%) | 0 (0.0%) |
Disability Class: Vision Difficulty
| Age Bracket | Male | Female |
| Under 5 Years | 0 (0.0%) | 0 (0.0%) |
| 5 to 17 Years | 0 (0.0%) | 0 (0.0%) |
| 18 to 34 Years | 0 (0.0%) | 0 (0.0%) |
| 35 to 64 Years | 0 (0.0%) | 0 (0.0%) |
| 65 to 74 Years | 0 (0.0%) | 0 (0.0%) |
| 75 Years and over | 0 (0.0%) | 0 (0.0%) |
Disability Class: Cognitive Difficulty

| Age Bracket | Male | Female |
| 5 to 17 Years | 0 (0.0%) | 0 (0.0%) |
| 18 to 34 Years | 0 (0.0%) | 0 (0.0%) |
| 35 to 64 Years | 0 (0.0%) | 0 (0.0%) |
| 65 to 74 Years | 0 (0.0%) | 0 (0.0%) |
| 75 Years and over | 0 (0.0%) | 0 (0.0%) |
Disability Class: Ambulatory Difficulty
| Age Bracket | Male | Female |
| 5 to 17 Years | 0 (0.0%) | 0 (0.0%) |
| 18 to 34 Years | 0 (0.0%) | 0 (0.0%) |
| 35 to 64 Years | 0 (0.0%) | 0 (0.0%) |
| 65 to 74 Years | 0 (0.0%) | 0 (0.0%) |
| 75 Years and over | 0 (0.0%) | 0 (0.0%) |
Disability Class: Self-Care Difficulty
| Age Bracket | Male | Female |
| 5 to 17 Years | 0 (0.0%) | 0 (0.0%) |
| 18 to 34 Years | 0 (0.0%) | 0 (0.0%) |
| 35 to 64 Years | 0 (0.0%) | 0 (0.0%) |
| 65 to 74 Years | 0 (0.0%) | 0 (0.0%) |
| 75 Years and over | 0 (0.0%) | 0 (0.0%) |
Technology Access in Fort Washington
Computing Device Access in Fort Washington
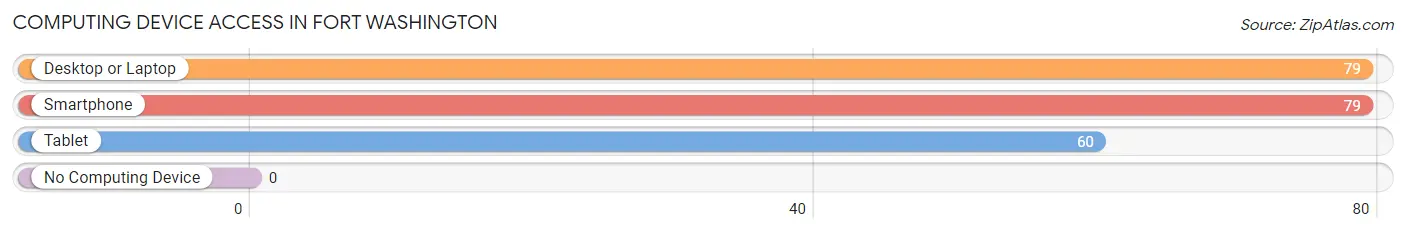
| Device Type | # Households | % Households |
| Desktop or Laptop | 79 | 100.0% |
| Smartphone | 79 | 100.0% |
| Tablet | 60 | 75.9% |
| No Computing Device | 0 | 0.0% |
| Total | 79 | 100.0% |
Internet Access in Fort Washington
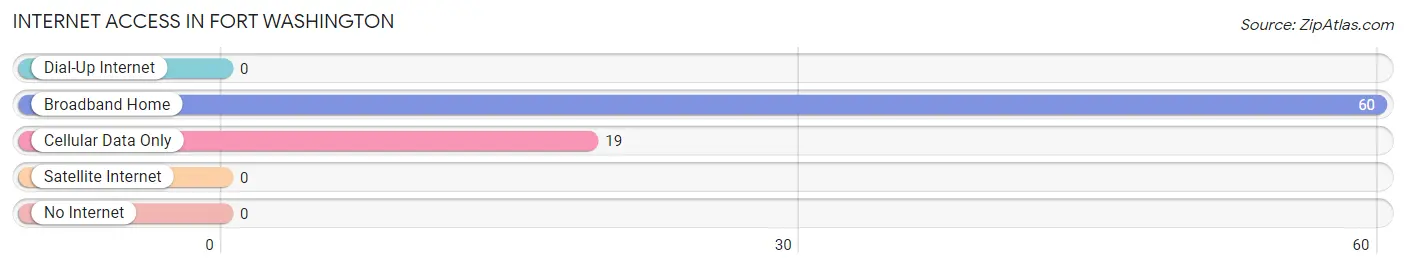
| Internet Type | # Households | % Households |
| Dial-Up Internet | 0 | 0.0% |
| Broadband Home | 60 | 75.9% |
| Cellular Data Only | 19 | 24.0% |
| Satellite Internet | 0 | 0.0% |
| No Internet | 0 | 0.0% |
| Total | 79 | 100.0% |
Fort Washington Summary
Founded in 1854, Fort Washington is a small unincorporated community located in Los Angeles County, California. It is situated in the San Gabriel Valley, approximately 20 miles east of downtown Los Angeles. The community is bordered by the cities of El Monte, South El Monte, and Rosemead.
History
Fort Washington was originally part of the Rancho La Puente land grant, which was granted to John Rowland and William Workman in 1845. The area was named after the fort that was built in the area in 1854 by the United States Army. The fort was built to protect the settlers from Native American attacks. The fort was abandoned in 1858 and the land was sold to private owners.
In the late 19th century, the area was used for farming and ranching. In the early 20th century, the area began to be developed for residential use. The first subdivision was built in 1910 and the community was officially incorporated in 1911.
Geography
Fort Washington is located in the San Gabriel Valley, approximately 20 miles east of downtown Los Angeles. The community is bordered by the cities of El Monte, South El Monte, and Rosemead. The area is mostly flat and is located at an elevation of approximately 500 feet.
The climate in Fort Washington is mild and temperate. The average high temperature in the summer is around 85 degrees Fahrenheit and the average low temperature in the winter is around 50 degrees Fahrenheit.
Economy
Fort Washington is primarily a residential community, but there are some businesses located in the area. The largest employers in the area are the El Monte Union High School District, the Los Angeles County Department of Public Works, and the Los Angeles County Sheriff’s Department.
Demographics
As of the 2010 census, the population of Fort Washington was 8,845. The racial makeup of the community was 57.3% Hispanic or Latino, 28.2% White, 8.2% Asian, and 6.3% African American. The median household income was $45,845 and the median home value was $400,000.
Fort Washington is a diverse community with a rich history. The area has seen a lot of development over the years and is now a thriving residential community. The economy is largely based on the local school district and government jobs, but there are also some businesses located in the area. The population is mostly Hispanic or Latino, but there is also a significant White, Asian, and African American population.
Common Questions
What is Per Capita Income in Fort Washington?
Per Capita income in Fort Washington is $62,466.
What is the Median Family Income in Fort Washington?
Median Family Income in Fort Washington is $104,436.
What is the Median Household income in Fort Washington?
Median Household Income in Fort Washington is $104,436.
What is Inequality or Gini Index in Fort Washington?
Inequality or Gini Index in Fort Washington is 0.13.
What is the Total Population of Fort Washington?
Total Population of Fort Washington is 158.
What is the Total Male Population of Fort Washington?
Total Male Population of Fort Washington is 80.
What is the Total Female Population of Fort Washington?
Total Female Population of Fort Washington is 78.
What is the Ratio of Males per 100 Females in Fort Washington?
There are 102.56 Males per 100 Females in Fort Washington.
What is the Ratio of Females per 100 Males in Fort Washington?
There are 97.50 Females per 100 Males in Fort Washington.
What is the Median Population Age in Fort Washington?
Median Population Age in Fort Washington is 75.6 Years.
What is the Average Family Size in Fort Washington
Average Family Size in Fort Washington is 2.0 People.
What is the Average Household Size in Fort Washington
Average Household Size in Fort Washington is 2.0 People.
How Large is the Labor Force in Fort Washington?
There are 80 People in the Labor Forcein in Fort Washington.
What is the Percentage of People in the Labor Force in Fort Washington?
50.6% of People are in the Labor Force in Fort Washington.