Loyola, CA Map & Demographics
Loyola Map
Loyola Overview
$131,051
PER CAPITA INCOME
$250,001
AVG FAMILY INCOME
$250,001
AVG HOUSEHOLD INCOME
61.9%
WAGE / INCOME GAP [ % ]
38.1¢/ $1
WAGE / INCOME GAP [ $ ]
0.46
INEQUALITY / GINI INDEX
3,818
TOTAL POPULATION
1,977
MALE POPULATION
1,841
FEMALE POPULATION
107.39
MALES / 100 FEMALES
93.12
FEMALES / 100 MALES
46.7
MEDIAN AGE
3.3
AVG FAMILY SIZE
3.0
AVG HOUSEHOLD SIZE
1,606
LABOR FORCE [ PEOPLE ]
56.2%
PERCENT IN LABOR FORCE
2.7%
UNEMPLOYMENT RATE
Income in Loyola
Income Overview in Loyola
Per Capita Income in Loyola is $131,051, while median incomes of families and households are $250,001 and $250,001 respectively.
| Characteristic | Number | Measure |
| Per Capita Income | 3,818 | $131,051 |
| Median Family Income | 1,089 | $250,001 |
| Mean Family Income | 1,089 | $431,340 |
| Median Household Income | 1,268 | $250,001 |
| Mean Household Income | 1,268 | $390,503 |
| Income Deficit | 1,089 | $0 |
| Wage / Income Gap (%) | 3,818 | 61.89% |
| Wage / Income Gap ($) | 3,818 | 38.11¢ per $1 |
| Gini / Inequality Index | 3,818 | 0.46 |
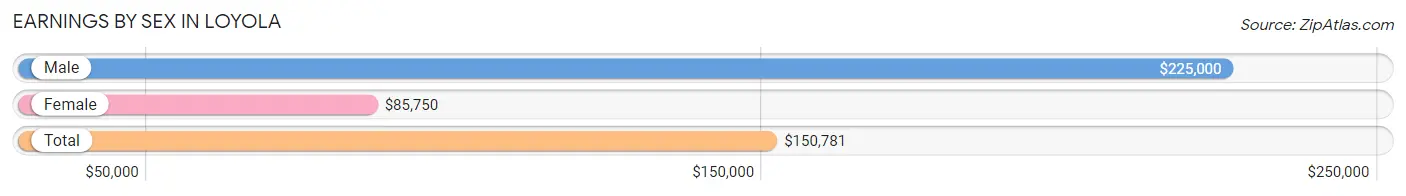
Earnings by Sex in Loyola
Average Earnings in Loyola are $150,781, $225,000 for men and $85,750 for women, a difference of 61.9%.
| Sex | Number | Average Earnings |
| Male | 960 (54.5%) | $225,000 |
| Female | 801 (45.5%) | $85,750 |
| Total | 1,761 (100.0%) | $150,781 |
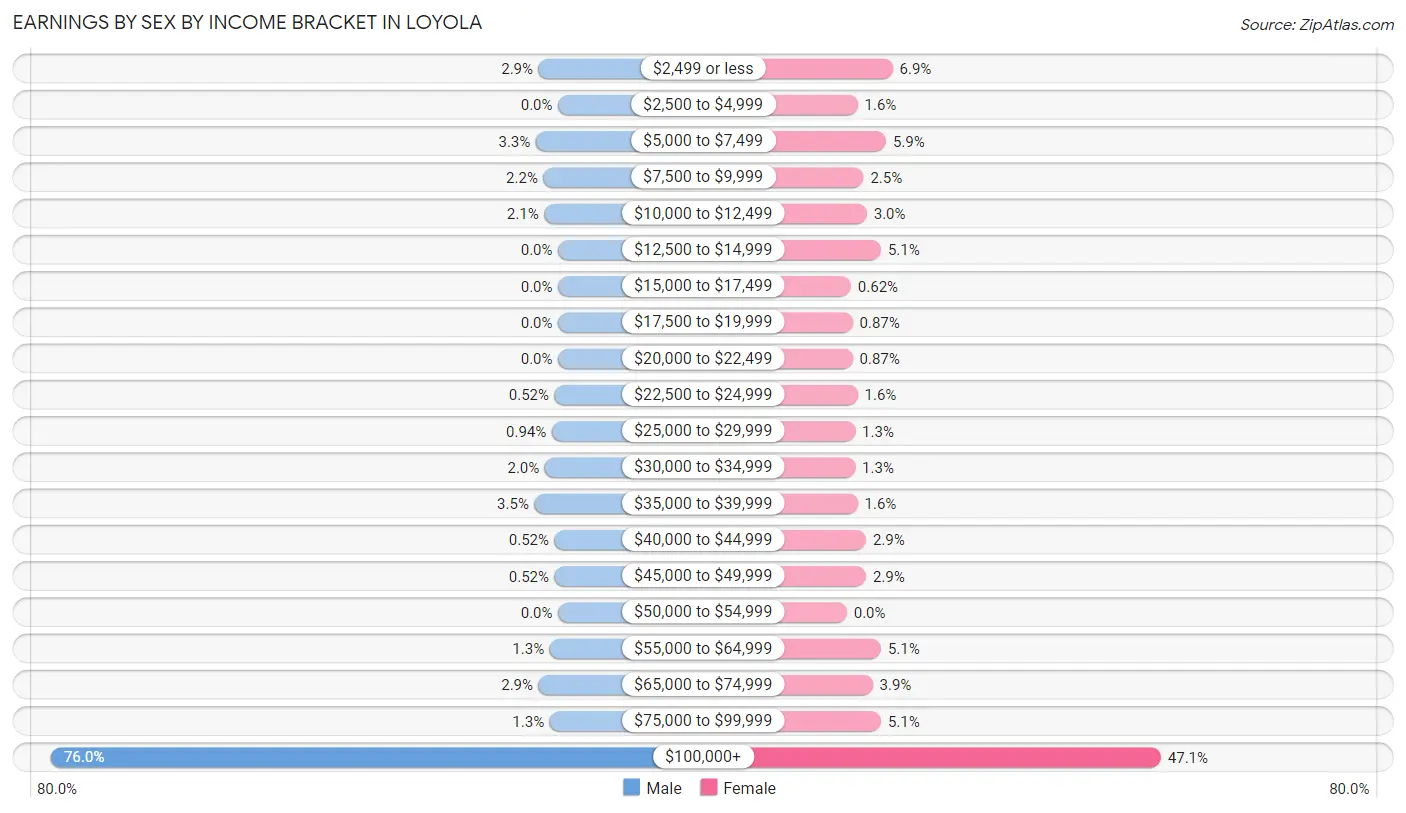
Earnings by Sex by Income Bracket in Loyola
The most common earnings brackets in Loyola are $100,000+ for men (730 | 76.0%) and $100,000+ for women (377 | 47.1%).
| Income | Male | Female |
| $2,499 or less | 28 (2.9%) | 55 (6.9%) |
| $2,500 to $4,999 | 0 (0.0%) | 13 (1.6%) |
| $5,000 to $7,499 | 32 (3.3%) | 47 (5.9%) |
| $7,500 to $9,999 | 21 (2.2%) | 20 (2.5%) |
| $10,000 to $12,499 | 20 (2.1%) | 24 (3.0%) |
| $12,500 to $14,999 | 0 (0.0%) | 41 (5.1%) |
| $15,000 to $17,499 | 0 (0.0%) | 5 (0.6%) |
| $17,500 to $19,999 | 0 (0.0%) | 7 (0.9%) |
| $20,000 to $22,499 | 0 (0.0%) | 7 (0.9%) |
| $22,500 to $24,999 | 5 (0.5%) | 13 (1.6%) |
| $25,000 to $29,999 | 9 (0.9%) | 10 (1.3%) |
| $30,000 to $34,999 | 19 (2.0%) | 10 (1.3%) |
| $35,000 to $39,999 | 34 (3.5%) | 13 (1.6%) |
| $40,000 to $44,999 | 5 (0.5%) | 23 (2.9%) |
| $45,000 to $49,999 | 5 (0.5%) | 23 (2.9%) |
| $50,000 to $54,999 | 0 (0.0%) | 0 (0.0%) |
| $55,000 to $64,999 | 12 (1.3%) | 41 (5.1%) |
| $65,000 to $74,999 | 28 (2.9%) | 31 (3.9%) |
| $75,000 to $99,999 | 12 (1.3%) | 41 (5.1%) |
| $100,000+ | 730 (76.0%) | 377 (47.1%) |
| Total | 960 (100.0%) | 801 (100.0%) |
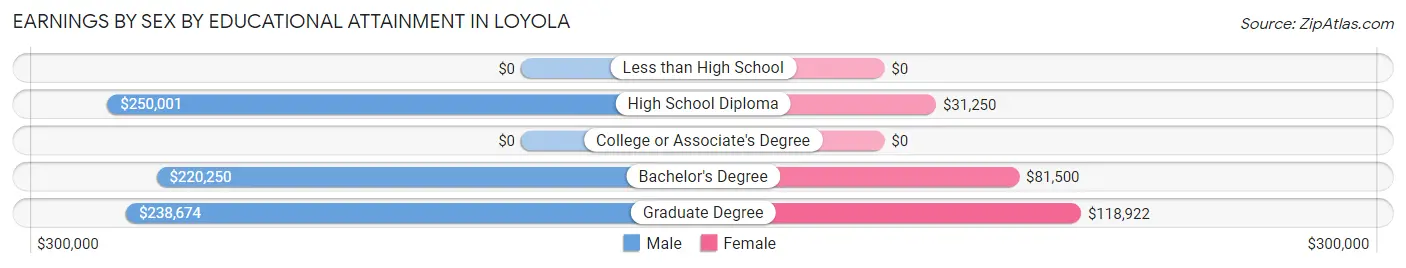
Earnings by Sex by Educational Attainment in Loyola
Average earnings in Loyola are $229,453 for men and $90,536 for women, a difference of 60.5%. Men with an educational attainment of high school diploma enjoy the highest average annual earnings of $250,001, while those with bachelor's degree education earn the least with $220,250. Women with an educational attainment of graduate degree earn the most with the average annual earnings of $118,922, while those with high school diploma education have the smallest earnings of $31,250.
| Educational Attainment | Male Income | Female Income |
| Less than High School | - | - |
| High School Diploma | $250,001 | $31,250 |
| College or Associate's Degree | - | - |
| Bachelor's Degree | $220,250 | $81,500 |
| Graduate Degree | $238,674 | $118,922 |
| Total | $229,453 | $90,536 |
Family Income in Loyola
Family Income Brackets in Loyola
According to the Loyola family income data, there are 807 families falling into the $200,000+ income range, which is the most common income bracket and makes up 74.1% of all families.
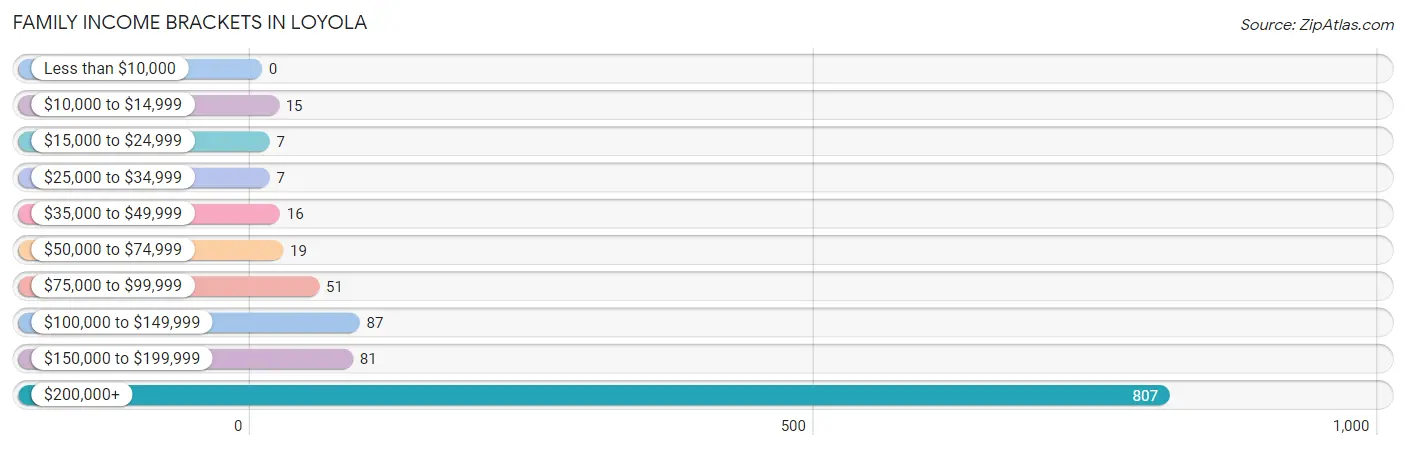
| Income Bracket | # Families | % Families |
| Less than $10,000 | 0 | 0.0% |
| $10,000 to $14,999 | 15 | 1.4% |
| $15,000 to $24,999 | 7 | 0.6% |
| $25,000 to $34,999 | 7 | 0.6% |
| $35,000 to $49,999 | 16 | 1.5% |
| $50,000 to $74,999 | 19 | 1.7% |
| $75,000 to $99,999 | 51 | 4.7% |
| $100,000 to $149,999 | 87 | 8.0% |
| $150,000 to $199,999 | 81 | 7.4% |
| $200,000+ | 807 | 74.1% |
Family Income by Famaliy Size in Loyola
2-person families (494 | 45.4%) account for the highest median family income in Loyola with $250,001 per family, while 2-person families (494 | 45.4%) have the highest median income of $125,000 per family member.
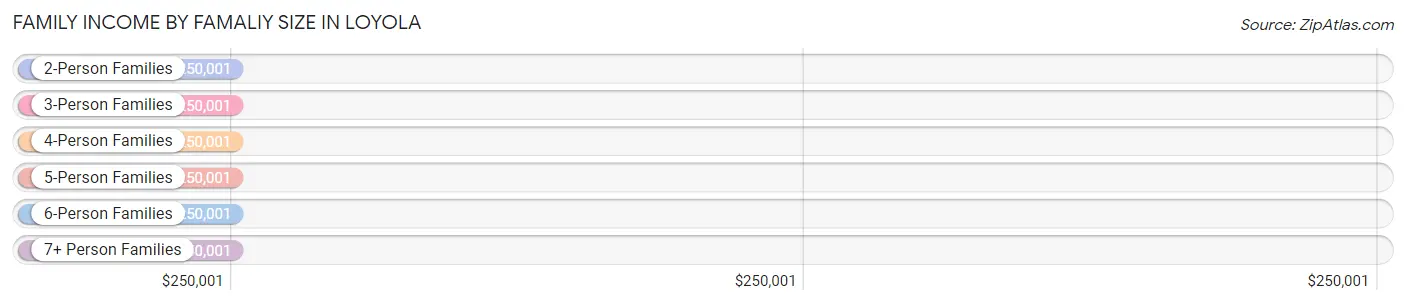
| Income Bracket | # Families | Median Income |
| 2-Person Families | 494 (45.4%) | $250,001 |
| 3-Person Families | 173 (15.9%) | $250,001 |
| 4-Person Families | 246 (22.6%) | $250,001 |
| 5-Person Families | 120 (11.0%) | $250,001 |
| 6-Person Families | 15 (1.4%) | $250,001 |
| 7+ Person Families | 41 (3.8%) | $250,001 |
| Total | 1,089 (100.0%) | $250,001 |
Family Income by Number of Earners in Loyola
The median family income in Loyola is $250,001, with families comprising 1 earner (382) having the highest median family income of $250,001, while families with no earners (157) have the lowest median family income of $180,536, accounting for 35.1% and 14.4% of families, respectively.
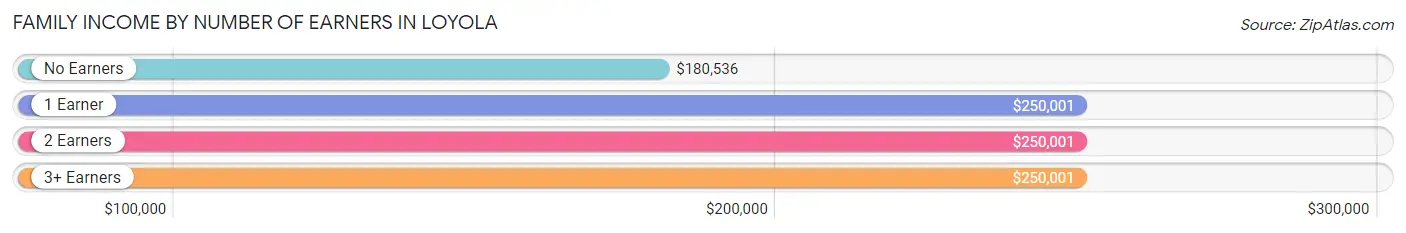
| Number of Earners | # Families | Median Income |
| No Earners | 157 (14.4%) | $180,536 |
| 1 Earner | 382 (35.1%) | $250,001 |
| 2 Earners | 465 (42.7%) | $250,001 |
| 3+ Earners | 85 (7.8%) | $250,001 |
| Total | 1,089 (100.0%) | $250,001 |
Household Income in Loyola
Household Income Brackets in Loyola
With 841 households falling in the category, the $200,000+ income range is the most frequent in Loyola, accounting for 66.3% of all households.
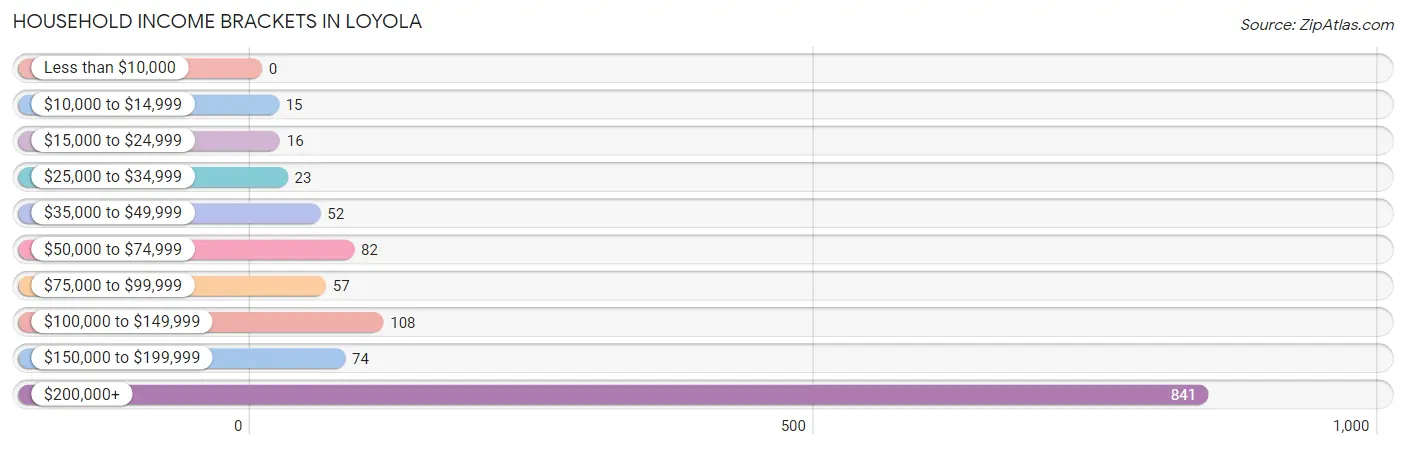
| Income Bracket | # Households | % Households |
| Less than $10,000 | 0 | 0.0% |
| $10,000 to $14,999 | 15 | 1.2% |
| $15,000 to $24,999 | 16 | 1.3% |
| $25,000 to $34,999 | 23 | 1.8% |
| $35,000 to $49,999 | 52 | 4.1% |
| $50,000 to $74,999 | 82 | 6.5% |
| $75,000 to $99,999 | 57 | 4.5% |
| $100,000 to $149,999 | 108 | 8.5% |
| $150,000 to $199,999 | 74 | 5.8% |
| $200,000+ | 841 | 66.3% |
Household Income by Householder Age in Loyola
The median household income in Loyola is $250,001, with the highest median household income of $250,001 found in the 25 to 44 years age bracket for the primary householder. A total of 242 households (19.1%) fall into this category.
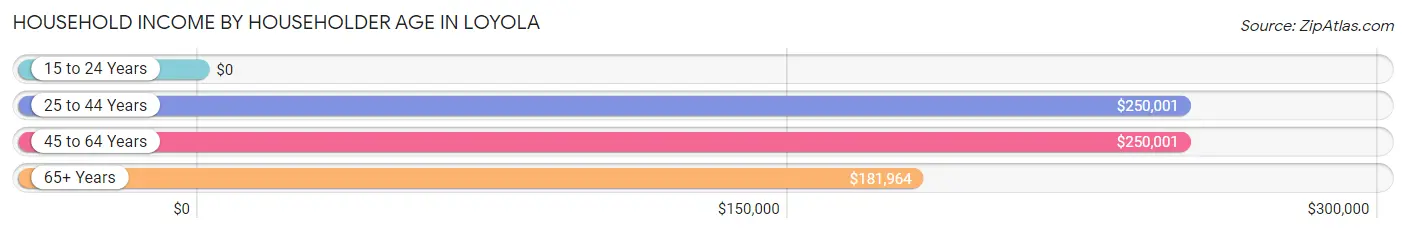
| Income Bracket | # Households | Median Income |
| 15 to 24 Years | 0 (0.0%) | $0 |
| 25 to 44 Years | 242 (19.1%) | $250,001 |
| 45 to 64 Years | 555 (43.8%) | $250,001 |
| 65+ Years | 471 (37.1%) | $181,964 |
| Total | 1,268 (100.0%) | $250,001 |
Poverty in Loyola
Income Below Poverty by Sex and Age in Loyola
With 1.8% poverty level for males and 2.3% for females among the residents of Loyola, 18 to 24 year old males and 18 to 24 year old females are the most vulnerable to poverty, with 8 males (10.5%) and 8 females (27.6%) in their respective age groups living below the poverty level.
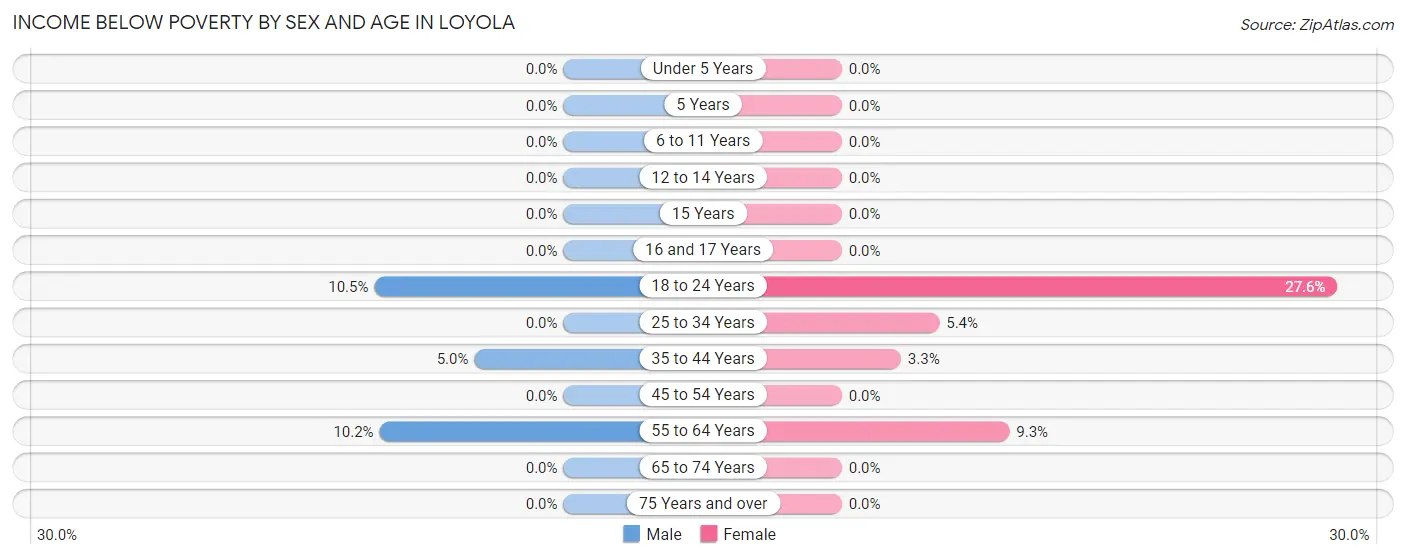
| Age Bracket | Male | Female |
| Under 5 Years | 0 (0.0%) | 0 (0.0%) |
| 5 Years | 0 (0.0%) | 0 (0.0%) |
| 6 to 11 Years | 0 (0.0%) | 0 (0.0%) |
| 12 to 14 Years | 0 (0.0%) | 0 (0.0%) |
| 15 Years | 0 (0.0%) | 0 (0.0%) |
| 16 and 17 Years | 0 (0.0%) | 0 (0.0%) |
| 18 to 24 Years | 8 (10.5%) | 8 (27.6%) |
| 25 to 34 Years | 0 (0.0%) | 7 (5.4%) |
| 35 to 44 Years | 7 (5.0%) | 7 (3.3%) |
| 45 to 54 Years | 0 (0.0%) | 0 (0.0%) |
| 55 to 64 Years | 21 (10.2%) | 21 (9.3%) |
| 65 to 74 Years | 0 (0.0%) | 0 (0.0%) |
| 75 Years and over | 0 (0.0%) | 0 (0.0%) |
| Total | 36 (1.8%) | 43 (2.3%) |
Income Above Poverty by Sex and Age in Loyola
According to the poverty statistics in Loyola, males aged under 5 years and females aged under 5 years are the age groups that are most secure financially, with 100.0% of males and 100.0% of females in these age groups living above the poverty line.
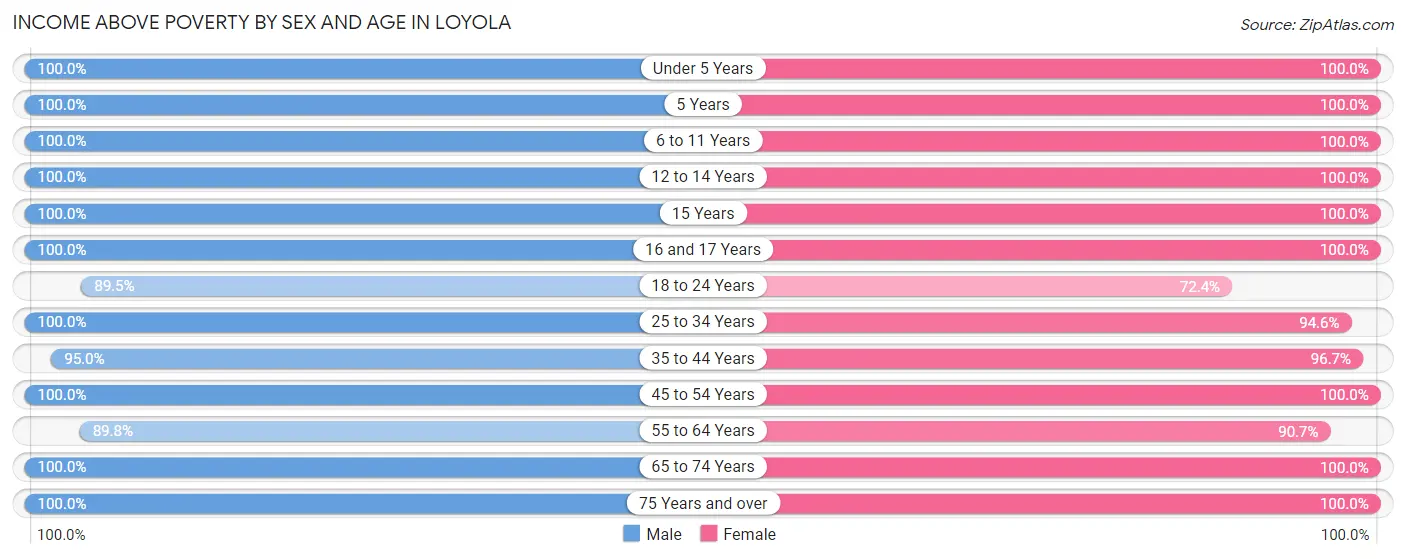
| Age Bracket | Male | Female |
| Under 5 Years | 108 (100.0%) | 82 (100.0%) |
| 5 Years | 46 (100.0%) | 31 (100.0%) |
| 6 to 11 Years | 173 (100.0%) | 222 (100.0%) |
| 12 to 14 Years | 185 (100.0%) | 82 (100.0%) |
| 15 Years | 21 (100.0%) | 11 (100.0%) |
| 16 and 17 Years | 67 (100.0%) | 67 (100.0%) |
| 18 to 24 Years | 68 (89.5%) | 21 (72.4%) |
| 25 to 34 Years | 95 (100.0%) | 122 (94.6%) |
| 35 to 44 Years | 134 (95.0%) | 206 (96.7%) |
| 45 to 54 Years | 356 (100.0%) | 333 (100.0%) |
| 55 to 64 Years | 184 (89.8%) | 204 (90.7%) |
| 65 to 74 Years | 297 (100.0%) | 262 (100.0%) |
| 75 Years and over | 207 (100.0%) | 155 (100.0%) |
| Total | 1,941 (98.2%) | 1,798 (97.7%) |
Income Below Poverty Among Married-Couple Families in Loyola
The poverty statistics for married-couple families in Loyola show that 2.3% or 22 of the total 974 families live below the poverty line. Families with no children have the highest poverty rate of 4.1%, comprising of 22 families. On the other hand, families with 1 or 2 children have the lowest poverty rate of 0.0%, which includes 0 families.
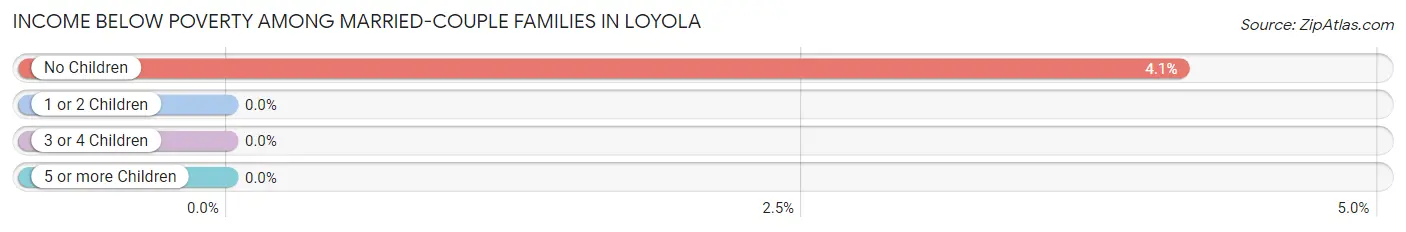
| Children | Above Poverty | Below Poverty |
| No Children | 510 (95.9%) | 22 (4.1%) |
| 1 or 2 Children | 333 (100.0%) | 0 (0.0%) |
| 3 or 4 Children | 101 (100.0%) | 0 (0.0%) |
| 5 or more Children | 8 (100.0%) | 0 (0.0%) |
| Total | 952 (97.7%) | 22 (2.3%) |
Income Below Poverty Among Single-Parent Households in Loyola
| Children | Single Father | Single Mother |
| No Children | 0 (0.0%) | 0 (0.0%) |
| 1 or 2 Children | 0 (0.0%) | 0 (0.0%) |
| 3 or 4 Children | 0 (0.0%) | 0 (0.0%) |
| 5 or more Children | 0 (0.0%) | 0 (0.0%) |
| Total | 0 (0.0%) | 0 (0.0%) |
Income Below Poverty Among Married-Couple vs Single-Parent Households in Loyola
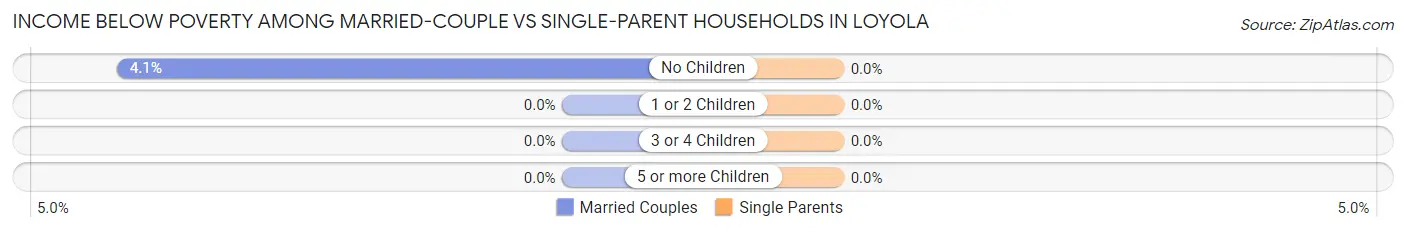
| Children | Married-Couple Families | Single-Parent Households |
| No Children | 22 (4.1%) | 0 (0.0%) |
| 1 or 2 Children | 0 (0.0%) | 0 (0.0%) |
| 3 or 4 Children | 0 (0.0%) | 0 (0.0%) |
| 5 or more Children | 0 (0.0%) | 0 (0.0%) |
| Total | 22 (2.3%) | 0 (0.0%) |
Race in Loyola
The most populous races in Loyola are White / Caucasian (2,201 | 57.7%), Asian (1,260 | 33.0%), and Two or more Races (250 | 6.6%).
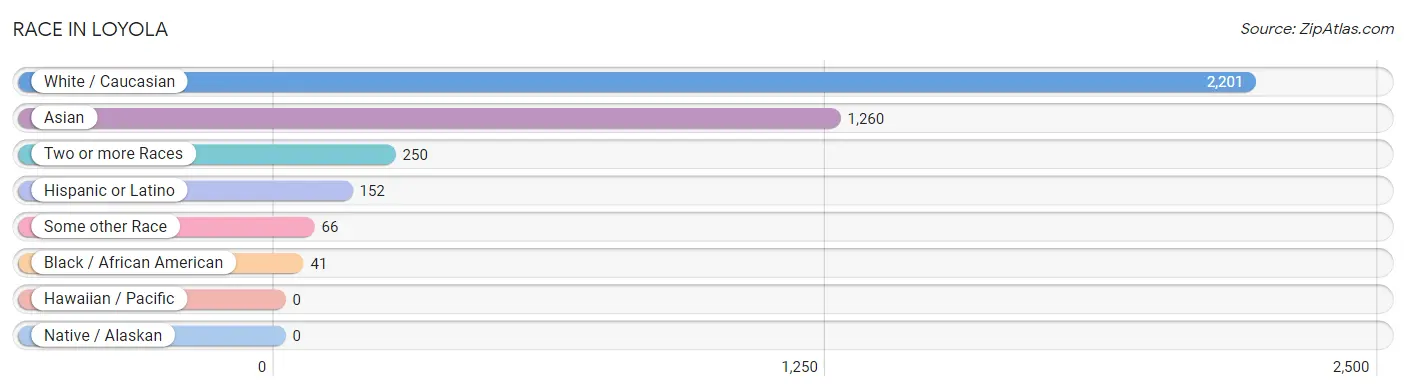
| Race | # Population | % Population |
| Asian | 1,260 | 33.0% |
| Black / African American | 41 | 1.1% |
| Hawaiian / Pacific | 0 | 0.0% |
| Hispanic or Latino | 152 | 4.0% |
| Native / Alaskan | 0 | 0.0% |
| White / Caucasian | 2,201 | 57.7% |
| Two or more Races | 250 | 6.6% |
| Some other Race | 66 | 1.7% |
| Total | 3,818 | 100.0% |
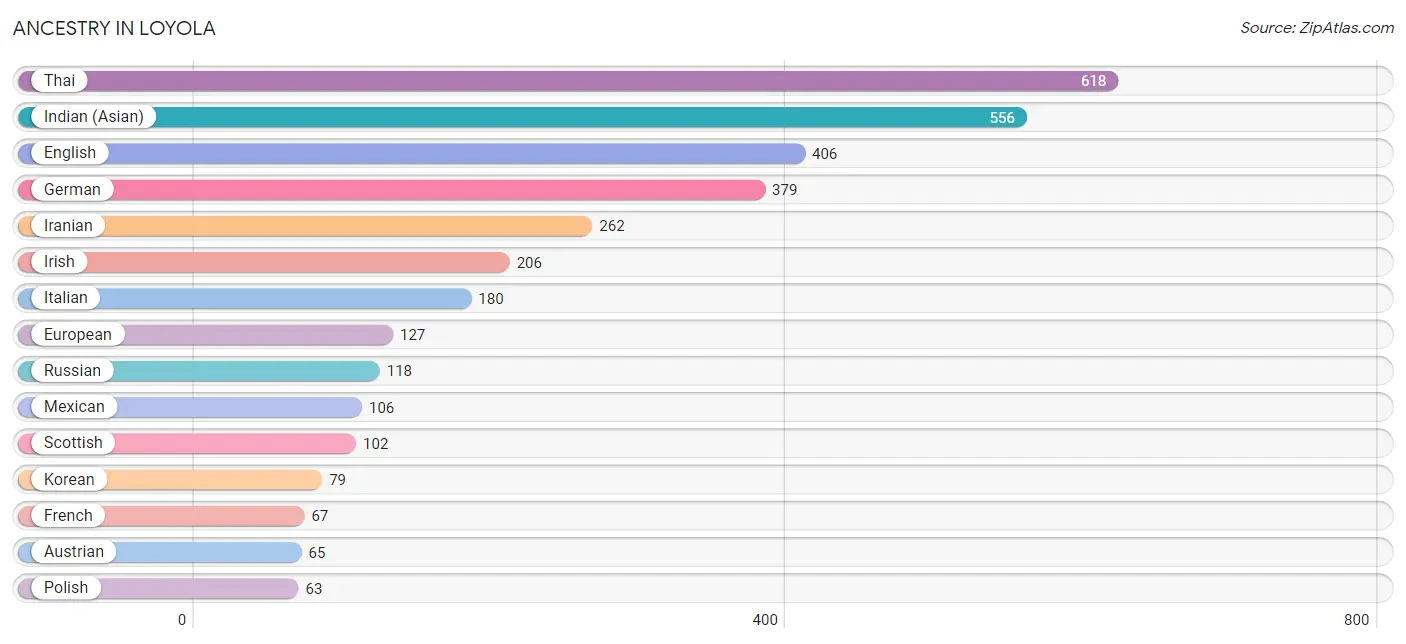
Ancestry in Loyola
The most populous ancestries reported in Loyola are Thai (618 | 16.2%), Indian (Asian) (556 | 14.6%), English (406 | 10.6%), German (379 | 9.9%), and Iranian (262 | 6.9%), together accounting for 58.2% of all Loyola residents.
| Ancestry | # Population | % Population |
| African | 44 | 1.1% |
| American | 39 | 1.0% |
| Arab | 35 | 0.9% |
| Australian | 15 | 0.4% |
| Austrian | 65 | 1.7% |
| Belgian | 14 | 0.4% |
| Bhutanese | 61 | 1.6% |
| British | 35 | 0.9% |
| Burmese | 39 | 1.0% |
| Canadian | 17 | 0.4% |
| Cherokee | 44 | 1.1% |
| Croatian | 7 | 0.2% |
| Cuban | 7 | 0.2% |
| Danish | 5 | 0.1% |
| Dominican | 13 | 0.3% |
| Dutch | 23 | 0.6% |
| Eastern European | 21 | 0.5% |
| Egyptian | 29 | 0.8% |
| English | 406 | 10.6% |
| European | 127 | 3.3% |
| Finnish | 3 | 0.1% |
| French | 67 | 1.8% |
| German | 379 | 9.9% |
| Greek | 16 | 0.4% |
| Haitian | 8 | 0.2% |
| Hungarian | 13 | 0.3% |
| Indian (Asian) | 556 | 14.6% |
| Iranian | 262 | 6.9% |
| Iraqi | 6 | 0.2% |
| Irish | 206 | 5.4% |
| Israeli | 57 | 1.5% |
| Italian | 180 | 4.7% |
| Korean | 79 | 2.1% |
| Mexican | 106 | 2.8% |
| New Zealander | 30 | 0.8% |
| Northern European | 15 | 0.4% |
| Norwegian | 60 | 1.6% |
| Pakistani | 12 | 0.3% |
| Polish | 63 | 1.7% |
| Portuguese | 6 | 0.2% |
| Puerto Rican | 21 | 0.5% |
| Romanian | 15 | 0.4% |
| Russian | 118 | 3.1% |
| Scotch-Irish | 4 | 0.1% |
| Scottish | 102 | 2.7% |
| Spaniard | 5 | 0.1% |
| Sri Lankan | 21 | 0.5% |
| Subsaharan African | 44 | 1.1% |
| Swedish | 46 | 1.2% |
| Swiss | 35 | 0.9% |
| Thai | 618 | 16.2% |
| Turkish | 12 | 0.3% |
| Ukrainian | 8 | 0.2% |
| Welsh | 8 | 0.2% | View All 54 Rows |
Immigrants in Loyola
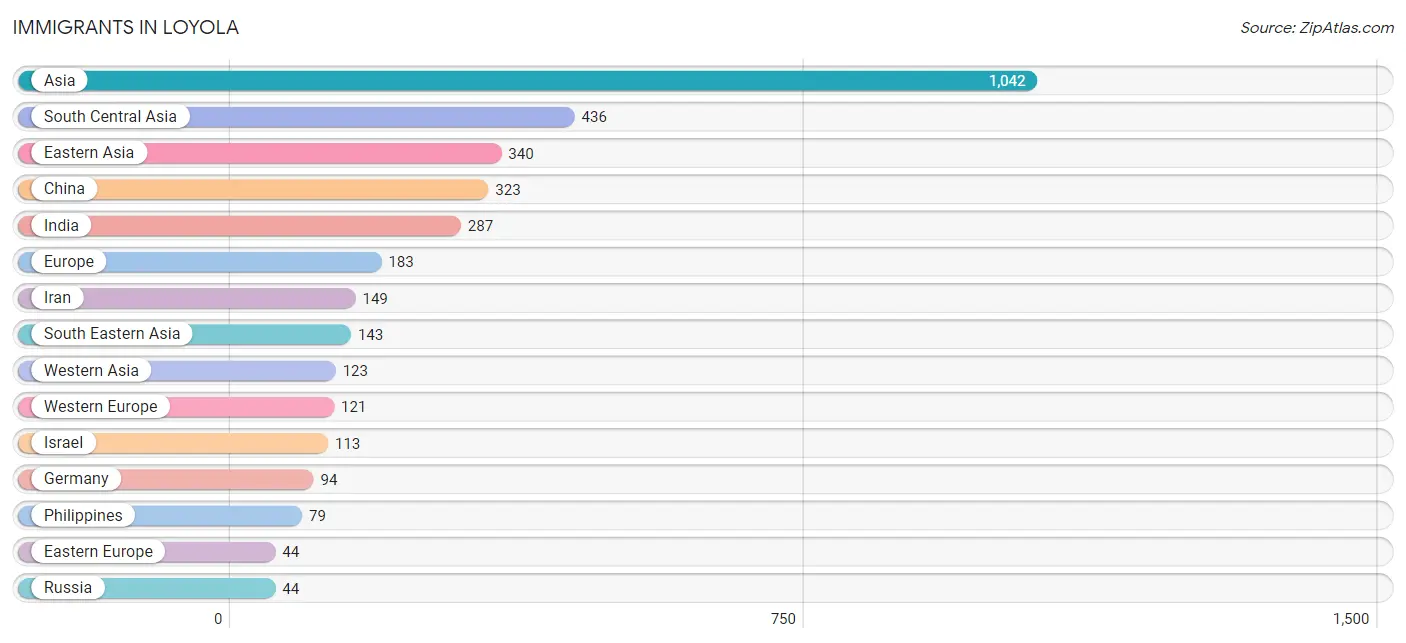
The most numerous immigrant groups reported in Loyola came from Asia (1,042 | 27.3%), South Central Asia (436 | 11.4%), Eastern Asia (340 | 8.9%), China (323 | 8.5%), and India (287 | 7.5%), together accounting for 63.6% of all Loyola residents.
| Immigration Origin | # Population | % Population |
| Africa | 40 | 1.1% |
| Asia | 1,042 | 27.3% |
| Australia | 15 | 0.4% |
| Austria | 22 | 0.6% |
| Canada | 39 | 1.0% |
| China | 323 | 8.5% |
| Denmark | 5 | 0.1% |
| Eastern Asia | 340 | 8.9% |
| Eastern Europe | 44 | 1.1% |
| Egypt | 40 | 1.1% |
| England | 5 | 0.1% |
| Europe | 183 | 4.8% |
| France | 5 | 0.1% |
| Germany | 94 | 2.5% |
| Guyana | 22 | 0.6% |
| Hong Kong | 18 | 0.5% |
| India | 287 | 7.5% |
| Iran | 149 | 3.9% |
| Iraq | 6 | 0.2% |
| Ireland | 8 | 0.2% |
| Israel | 113 | 3.0% |
| Japan | 10 | 0.3% |
| Korea | 7 | 0.2% |
| Latin America | 29 | 0.8% |
| Malaysia | 27 | 0.7% |
| Northern Africa | 40 | 1.1% |
| Northern Europe | 18 | 0.5% |
| Oceania | 15 | 0.4% |
| Philippines | 79 | 2.1% |
| Russia | 44 | 1.1% |
| South America | 29 | 0.8% |
| South Central Asia | 436 | 11.4% |
| South Eastern Asia | 143 | 3.7% |
| Taiwan | 24 | 0.6% |
| Turkey | 4 | 0.1% |
| Venezuela | 7 | 0.2% |
| Vietnam | 37 | 1.0% |
| Western Asia | 123 | 3.2% |
| Western Europe | 121 | 3.2% | View All 39 Rows |
Sex and Age in Loyola
Sex and Age in Loyola
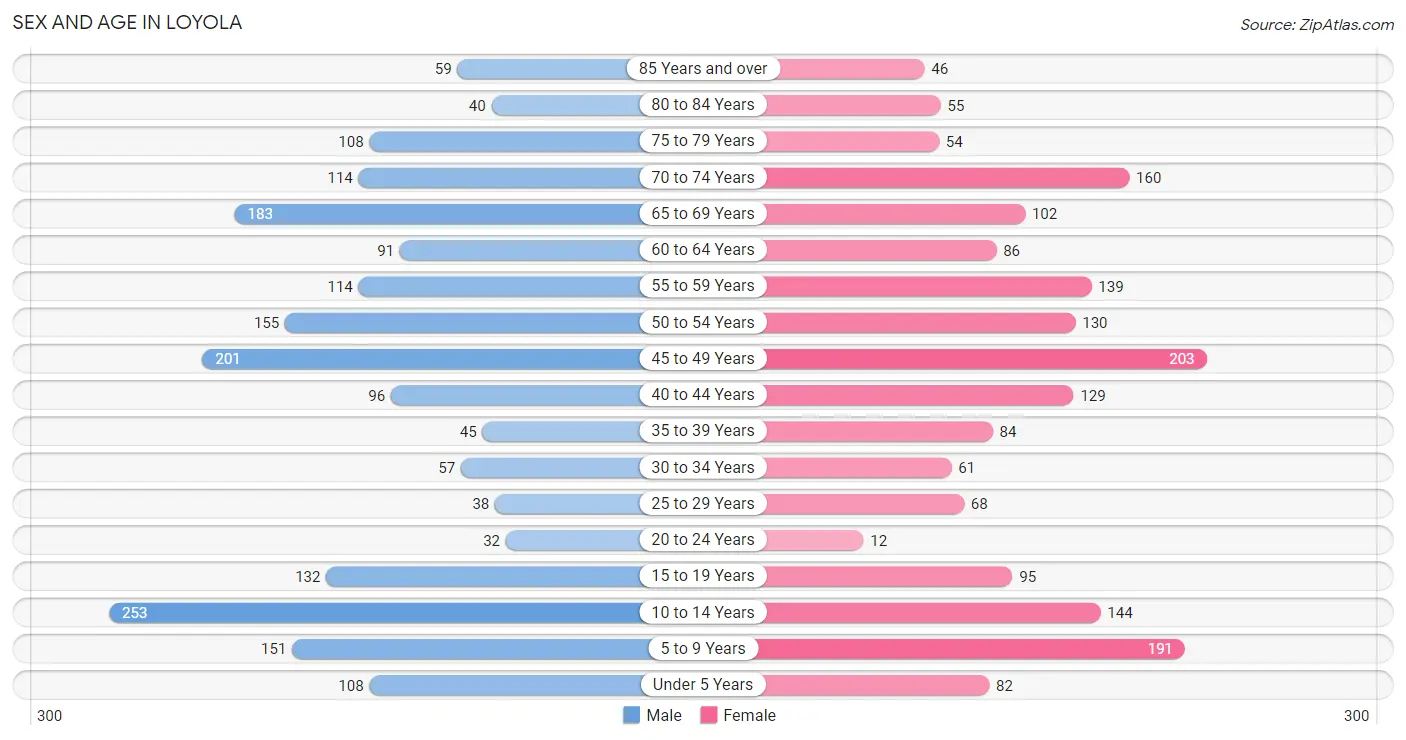
The most populous age groups in Loyola are 10 to 14 Years (253 | 12.8%) for men and 45 to 49 Years (203 | 11.0%) for women.
| Age Bracket | Male | Female |
| Under 5 Years | 108 (5.5%) | 82 (4.4%) |
| 5 to 9 Years | 151 (7.6%) | 191 (10.4%) |
| 10 to 14 Years | 253 (12.8%) | 144 (7.8%) |
| 15 to 19 Years | 132 (6.7%) | 95 (5.2%) |
| 20 to 24 Years | 32 (1.6%) | 12 (0.6%) |
| 25 to 29 Years | 38 (1.9%) | 68 (3.7%) |
| 30 to 34 Years | 57 (2.9%) | 61 (3.3%) |
| 35 to 39 Years | 45 (2.3%) | 84 (4.6%) |
| 40 to 44 Years | 96 (4.9%) | 129 (7.0%) |
| 45 to 49 Years | 201 (10.2%) | 203 (11.0%) |
| 50 to 54 Years | 155 (7.8%) | 130 (7.1%) |
| 55 to 59 Years | 114 (5.8%) | 139 (7.5%) |
| 60 to 64 Years | 91 (4.6%) | 86 (4.7%) |
| 65 to 69 Years | 183 (9.3%) | 102 (5.5%) |
| 70 to 74 Years | 114 (5.8%) | 160 (8.7%) |
| 75 to 79 Years | 108 (5.5%) | 54 (2.9%) |
| 80 to 84 Years | 40 (2.0%) | 55 (3.0%) |
| 85 Years and over | 59 (3.0%) | 46 (2.5%) |
| Total | 1,977 (100.0%) | 1,841 (100.0%) |
Families and Households in Loyola
Median Family Size in Loyola
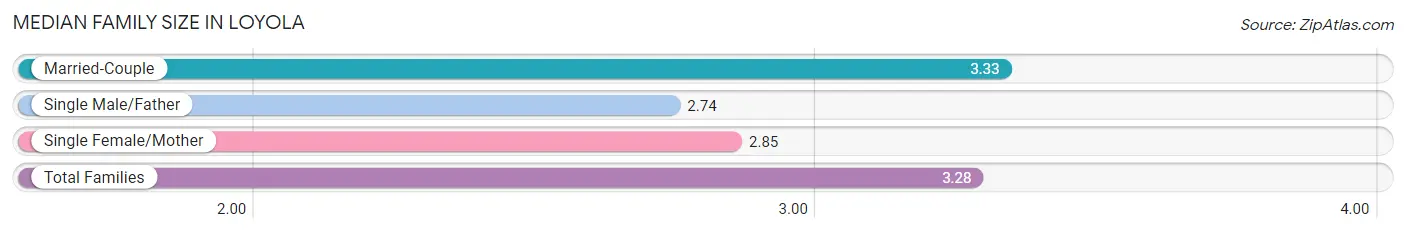
The median family size in Loyola is 3.28 persons per family, with married-couple families (974 | 89.4%) accounting for the largest median family size of 3.33 persons per family. On the other hand, single male/father families (42 | 3.9%) represent the smallest median family size with 2.74 persons per family.
| Family Type | # Families | Family Size |
| Married-Couple | 974 (89.4%) | 3.33 |
| Single Male/Father | 42 (3.9%) | 2.74 |
| Single Female/Mother | 73 (6.7%) | 2.85 |
| Total Families | 1,089 (100.0%) | 3.28 |
Median Household Size in Loyola
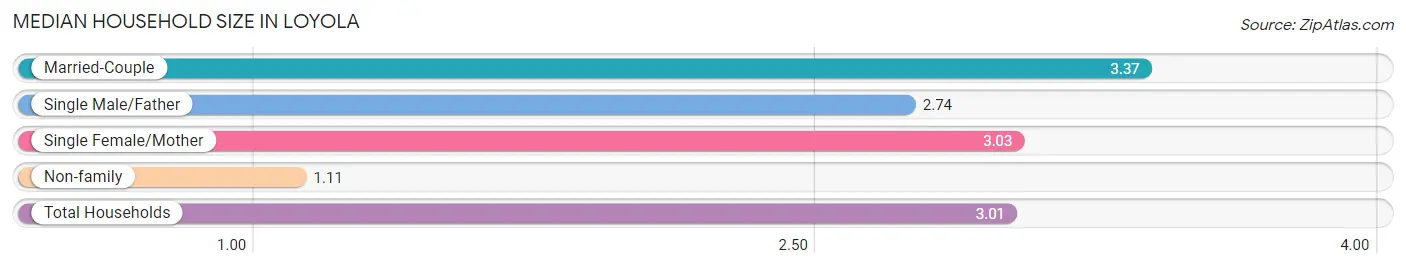
The median household size in Loyola is 3.01 persons per household, with married-couple households (974 | 76.8%) accounting for the largest median household size of 3.37 persons per household. non-family households (179 | 14.1%) represent the smallest median household size with 1.11 persons per household.
| Household Type | # Households | Household Size |
| Married-Couple | 974 (76.8%) | 3.37 |
| Single Male/Father | 42 (3.3%) | 2.74 |
| Single Female/Mother | 73 (5.8%) | 3.03 |
| Non-family | 179 (14.1%) | 1.11 |
| Total Households | 1,268 (100.0%) | 3.01 |
Household Size by Marriage Status in Loyola
Out of a total of 1,268 households in Loyola, 1,089 (85.9%) are family households, while 179 (14.1%) are nonfamily households. The most numerous type of family households are 2-person households, comprising 471, and the most common type of nonfamily households are 1-person households, comprising 161.
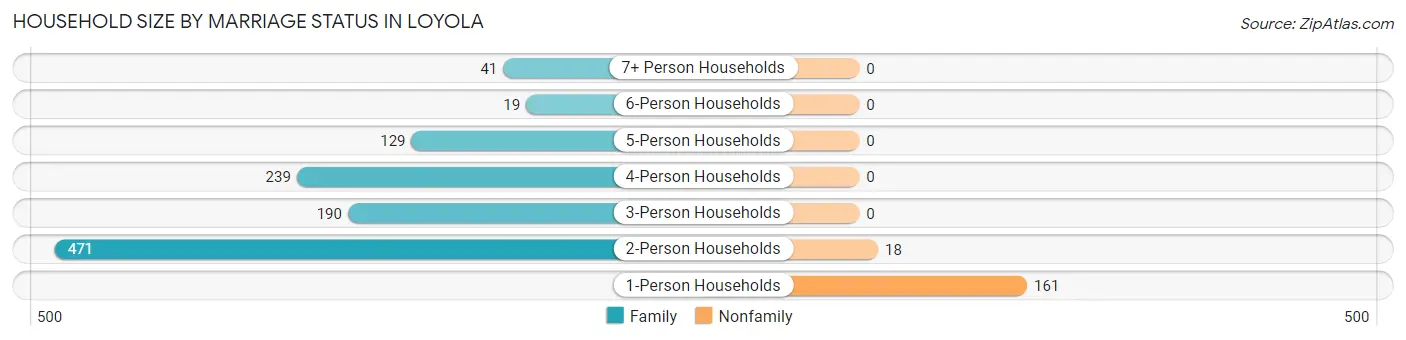
| Household Size | Family Households | Nonfamily Households |
| 1-Person Households | - | 161 (12.7%) |
| 2-Person Households | 471 (37.1%) | 18 (1.4%) |
| 3-Person Households | 190 (15.0%) | 0 (0.0%) |
| 4-Person Households | 239 (18.9%) | 0 (0.0%) |
| 5-Person Households | 129 (10.2%) | 0 (0.0%) |
| 6-Person Households | 19 (1.5%) | 0 (0.0%) |
| 7+ Person Households | 41 (3.2%) | 0 (0.0%) |
| Total | 1,089 (85.9%) | 179 (14.1%) |
Female Fertility in Loyola
Fertility by Age in Loyola
Average fertility rate in Loyola is 15.0 births per 1,000 women. Women in the age bracket of 20 to 34 years have the highest fertility rate with 71.0 births per 1,000 women. Women in the age bracket of 20 to 34 years acount for 100.0% of all women with births.
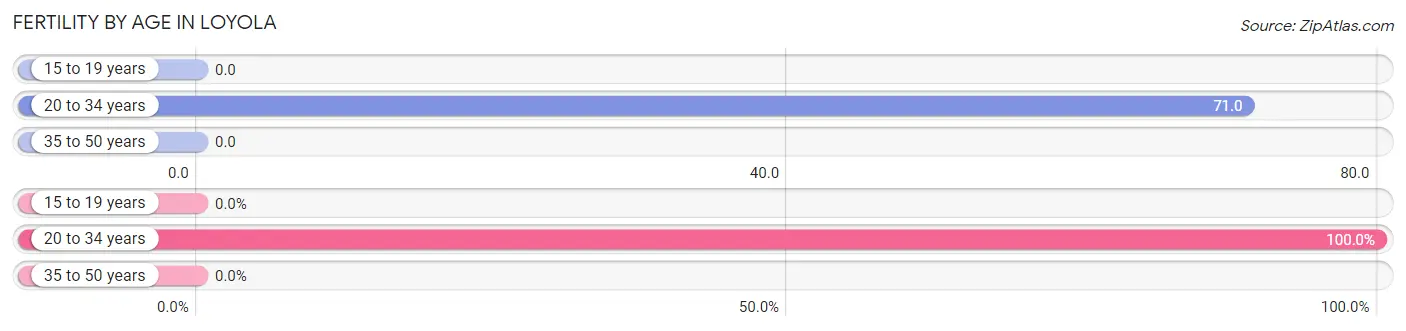
| Age Bracket | Women with Births | Births / 1,000 Women |
| 15 to 19 years | 0 (0.0%) | 0.0 |
| 20 to 34 years | 10 (100.0%) | 71.0 |
| 35 to 50 years | 0 (0.0%) | 0.0 |
| Total | 10 (100.0%) | 15.0 |
Fertility by Age by Marriage Status in Loyola
60.0% of women with births (10) in Loyola are married. The highest percentage of unmarried women with births falls into 20 to 34 years age bracket with 40.0% of them unmarried at the time of birth, while the lowest percentage of unmarried women with births belong to 20 to 34 years age bracket with 40.0% of them unmarried.
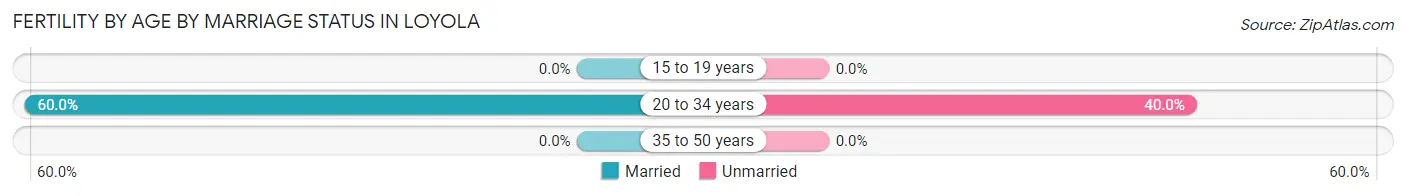
| Age Bracket | Married | Unmarried |
| 15 to 19 years | 0 (0.0%) | 0 (0.0%) |
| 20 to 34 years | 6 (60.0%) | 4 (40.0%) |
| 35 to 50 years | 0 (0.0%) | 0 (0.0%) |
| Total | 6 (60.0%) | 4 (40.0%) |
Fertility by Education in Loyola
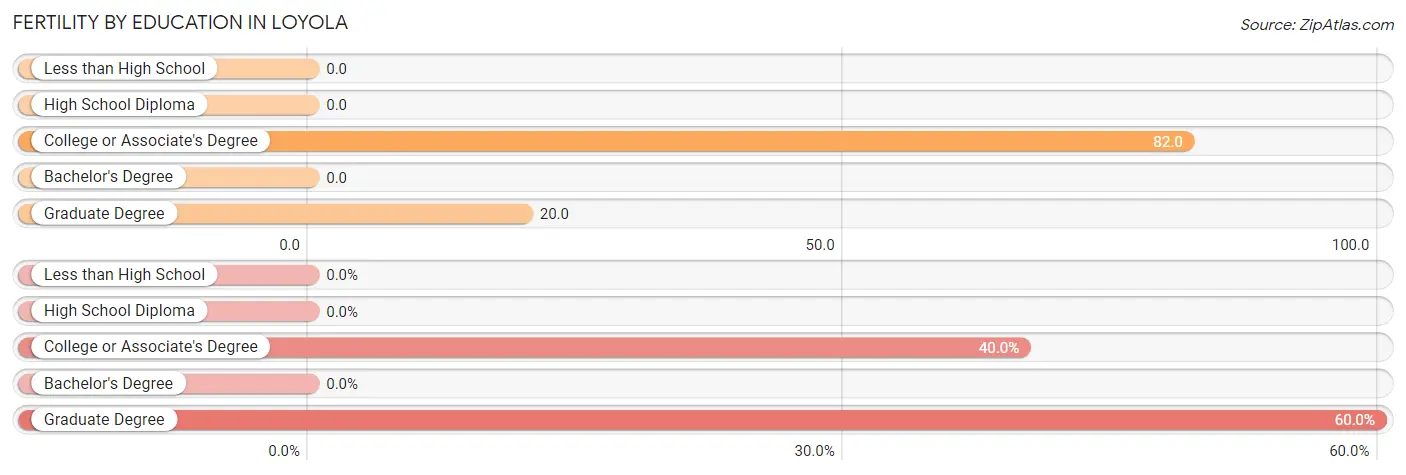
| Educational Attainment | Women with Births | Births / 1,000 Women |
| Less than High School | 0 (0.0%) | 0.0 |
| High School Diploma | 0 (0.0%) | 0.0 |
| College or Associate's Degree | 4 (40.0%) | 82.0 |
| Bachelor's Degree | 0 (0.0%) | 0.0 |
| Graduate Degree | 6 (60.0%) | 20.0 |
| Total | 10 (100.0%) | 15.0 |
Fertility by Education by Marriage Status in Loyola
40.0% of women with births in Loyola are unmarried. Women with the educational attainment of graduate degree are most likely to be married with 100.0% of them married at childbirth, while women with the educational attainment of college or associate's degree are least likely to be married with 100.0% of them unmarried at childbirth.
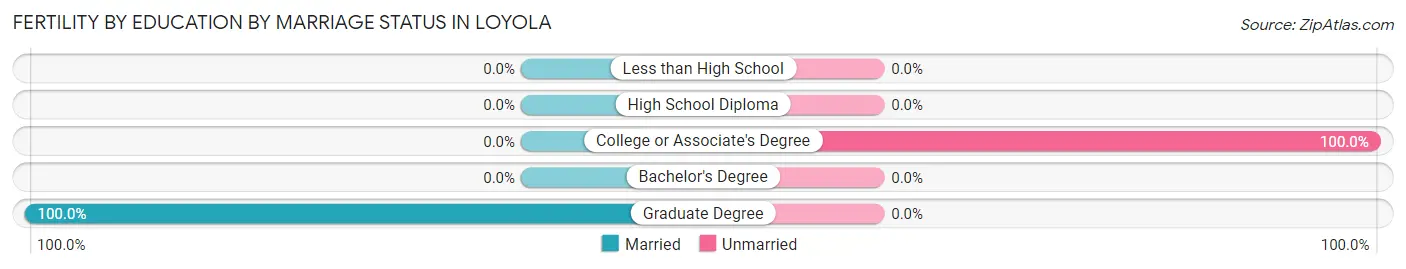
| Educational Attainment | Married | Unmarried |
| Less than High School | 0 (0.0%) | 0 (0.0%) |
| High School Diploma | 0 (0.0%) | 0 (0.0%) |
| College or Associate's Degree | 0 (0.0%) | 4 (100.0%) |
| Bachelor's Degree | 0 (0.0%) | 0 (0.0%) |
| Graduate Degree | 6 (100.0%) | 0 (0.0%) |
| Total | 6 (60.0%) | 4 (40.0%) |
Employment Characteristics in Loyola
Employment by Class of Employer in Loyola
Among the 1,540 employed individuals in Loyola, private company employees (1,128 | 73.3%), not-for-profit organizations (122 | 7.9%), and self-employed (not incorporated) (111 | 7.2%) make up the most common classes of employment.
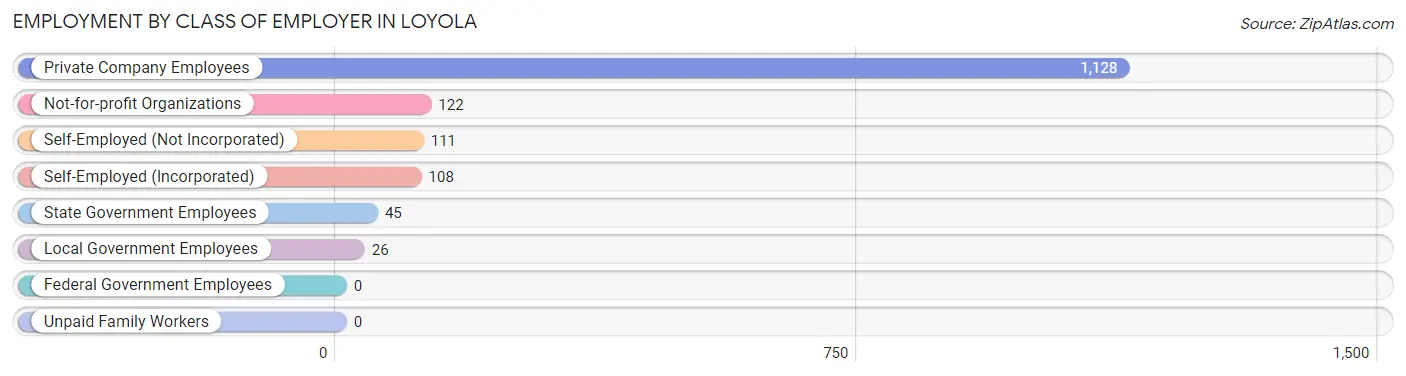
| Employer Class | # Employees | % Employees |
| Private Company Employees | 1,128 | 73.3% |
| Self-Employed (Incorporated) | 108 | 7.0% |
| Self-Employed (Not Incorporated) | 111 | 7.2% |
| Not-for-profit Organizations | 122 | 7.9% |
| Local Government Employees | 26 | 1.7% |
| State Government Employees | 45 | 2.9% |
| Federal Government Employees | 0 | 0.0% |
| Unpaid Family Workers | 0 | 0.0% |
| Total | 1,540 | 100.0% |
Employment Status by Age in Loyola
According to the labor force statistics for Loyola, out of the total population over 16 years of age (2,857), 56.2% or 1,606 individuals are in the labor force, with 2.7% or 43 of them unemployed. The age group with the highest labor force participation rate is 30 to 34 years, with 95.8% or 113 individuals in the labor force. Within the labor force, the 65 to 74 years age range has the highest percentage of unemployed individuals, with 6.7% or 14 of them being unemployed.
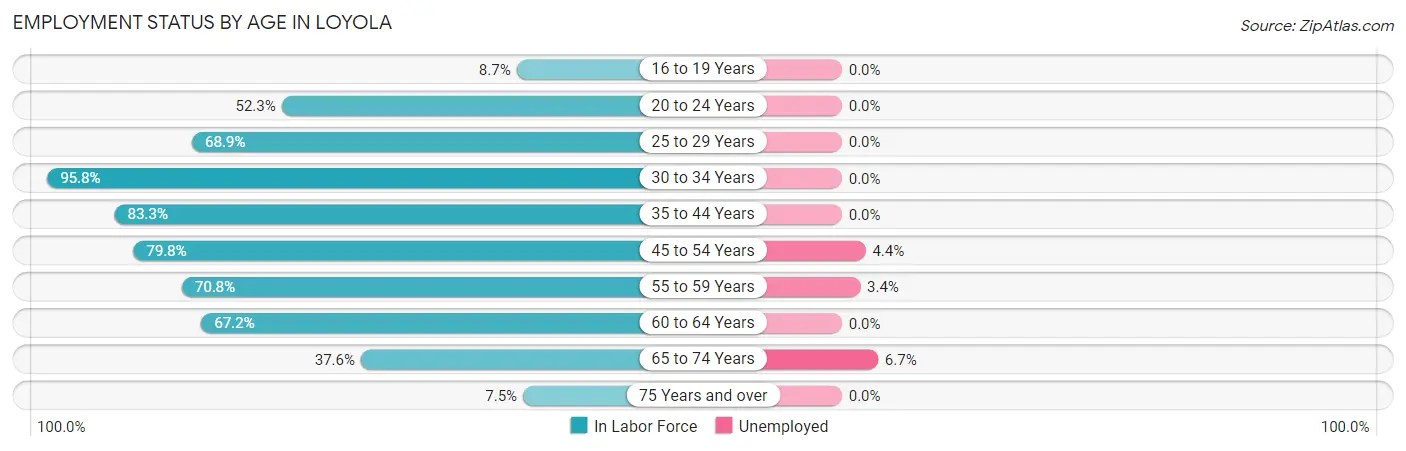
| Age Bracket | In Labor Force | Unemployed |
| 16 to 19 Years | 17 (8.7%) | 0 (0.0%) |
| 20 to 24 Years | 23 (52.3%) | 0 (0.0%) |
| 25 to 29 Years | 73 (68.9%) | 0 (0.0%) |
| 30 to 34 Years | 113 (95.8%) | 0 (0.0%) |
| 35 to 44 Years | 295 (83.3%) | 0 (0.0%) |
| 45 to 54 Years | 550 (79.8%) | 24 (4.4%) |
| 55 to 59 Years | 179 (70.8%) | 6 (3.4%) |
| 60 to 64 Years | 119 (67.2%) | 0 (0.0%) |
| 65 to 74 Years | 210 (37.6%) | 14 (6.7%) |
| 75 Years and over | 27 (7.5%) | 0 (0.0%) |
| Total | 1,606 (56.2%) | 43 (2.7%) |
Employment Status by Educational Attainment in Loyola
According to labor force statistics for Loyola, 78.3% of individuals (1,329) out of the total population between 25 and 64 years of age (1,697) are in the labor force, with 2.3% or 31 of them being unemployed. The group with the highest labor force participation rate are those with the educational attainment of high school diploma, with 87.0% or 40 individuals in the labor force. Within the labor force, individuals with bachelor's degree or higher education have the highest percentage of unemployment, with 2.5% or 30 of them being unemployed.
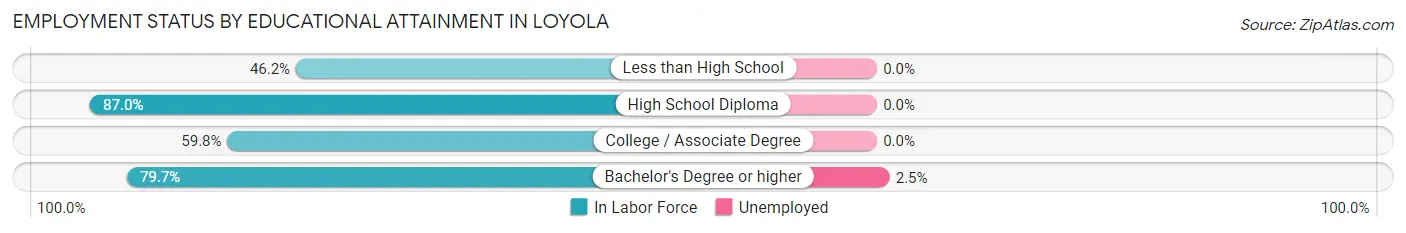
| Educational Attainment | In Labor Force | Unemployed |
| Less than High School | 6 (46.2%) | 0 (0.0%) |
| High School Diploma | 40 (87.0%) | 0 (0.0%) |
| College / Associate Degree | 67 (59.8%) | 0 (0.0%) |
| Bachelor's Degree or higher | 1,216 (79.7%) | 38 (2.5%) |
| Total | 1,329 (78.3%) | 39 (2.3%) |
Employment Occupations by Sex in Loyola
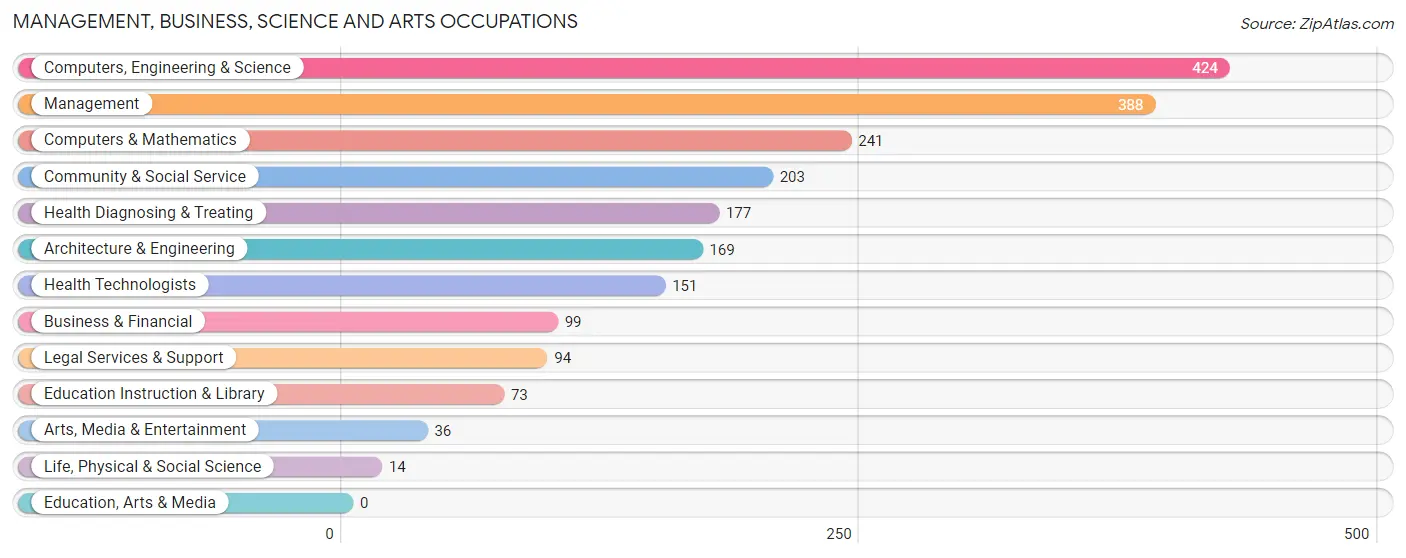
Management, Business, Science and Arts Occupations
The most common Management, Business, Science and Arts occupations in Loyola are Computers, Engineering & Science (424 | 27.1%), Management (388 | 24.8%), Computers & Mathematics (241 | 15.4%), Community & Social Service (203 | 13.0%), and Health Diagnosing & Treating (177 | 11.3%).
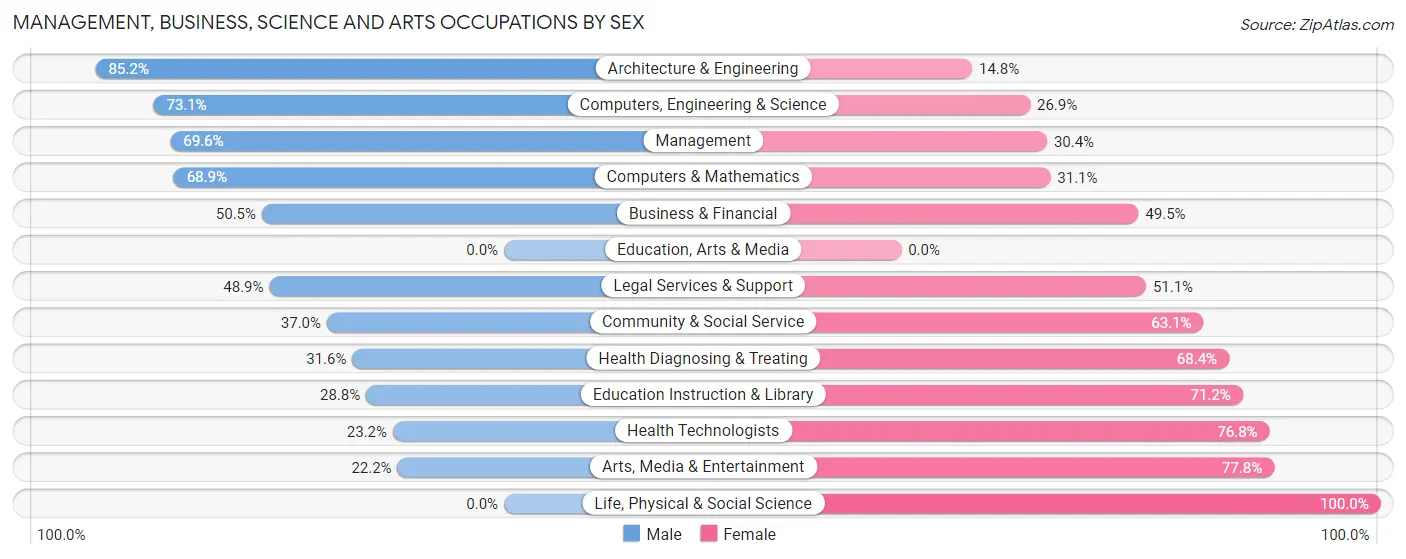
Management, Business, Science and Arts Occupations by Sex
Within the Management, Business, Science and Arts occupations in Loyola, the most male-oriented occupations are Architecture & Engineering (85.2%), Computers, Engineering & Science (73.1%), and Management (69.6%), while the most female-oriented occupations are Life, Physical & Social Science (100.0%), Arts, Media & Entertainment (77.8%), and Health Technologists (76.8%).
| Occupation | Male | Female |
| Management | 270 (69.6%) | 118 (30.4%) |
| Business & Financial | 50 (50.5%) | 49 (49.5%) |
| Computers, Engineering & Science | 310 (73.1%) | 114 (26.9%) |
| Computers & Mathematics | 166 (68.9%) | 75 (31.1%) |
| Architecture & Engineering | 144 (85.2%) | 25 (14.8%) |
| Life, Physical & Social Science | 0 (0.0%) | 14 (100.0%) |
| Community & Social Service | 75 (36.9%) | 128 (63.0%) |
| Education, Arts & Media | 0 (0.0%) | 0 (0.0%) |
| Legal Services & Support | 46 (48.9%) | 48 (51.1%) |
| Education Instruction & Library | 21 (28.8%) | 52 (71.2%) |
| Arts, Media & Entertainment | 8 (22.2%) | 28 (77.8%) |
| Health Diagnosing & Treating | 56 (31.6%) | 121 (68.4%) |
| Health Technologists | 35 (23.2%) | 116 (76.8%) |
| Total (Category) | 761 (59.0%) | 530 (41.0%) |
| Total (Overall) | 881 (56.4%) | 681 (43.6%) |
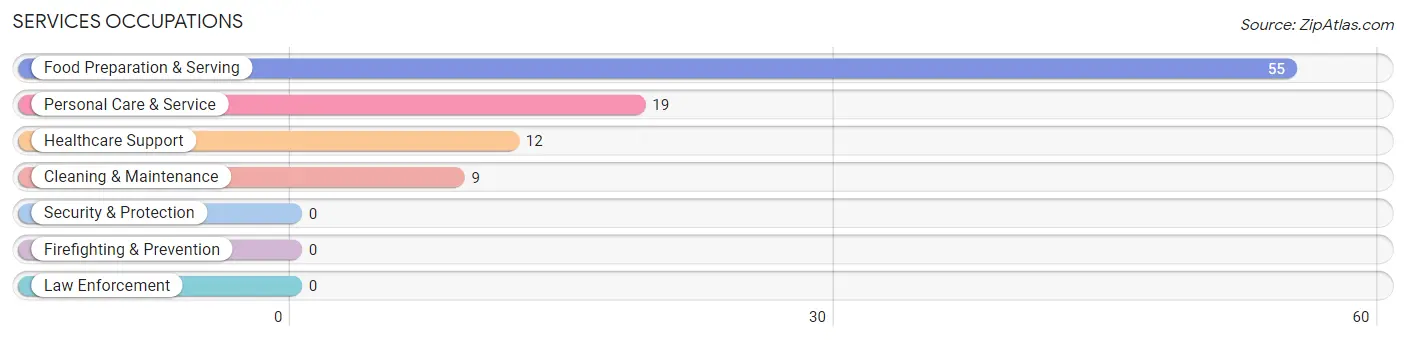
Services Occupations
The most common Services occupations in Loyola are Food Preparation & Serving (55 | 3.5%), Personal Care & Service (19 | 1.2%), Healthcare Support (12 | 0.8%), and Cleaning & Maintenance (9 | 0.6%).
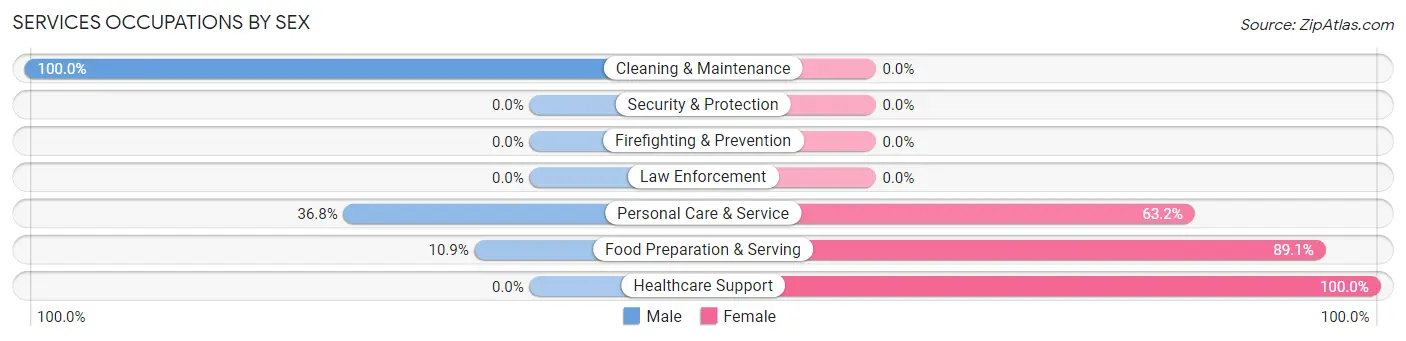
Services Occupations by Sex
Within the Services occupations in Loyola, the most male-oriented occupations are Cleaning & Maintenance (100.0%), Personal Care & Service (36.8%), and Food Preparation & Serving (10.9%), while the most female-oriented occupations are Healthcare Support (100.0%), Food Preparation & Serving (89.1%), and Personal Care & Service (63.2%).
| Occupation | Male | Female |
| Healthcare Support | 0 (0.0%) | 12 (100.0%) |
| Security & Protection | 0 (0.0%) | 0 (0.0%) |
| Firefighting & Prevention | 0 (0.0%) | 0 (0.0%) |
| Law Enforcement | 0 (0.0%) | 0 (0.0%) |
| Food Preparation & Serving | 6 (10.9%) | 49 (89.1%) |
| Cleaning & Maintenance | 9 (100.0%) | 0 (0.0%) |
| Personal Care & Service | 7 (36.8%) | 12 (63.2%) |
| Total (Category) | 22 (23.2%) | 73 (76.8%) |
| Total (Overall) | 881 (56.4%) | 681 (43.6%) |
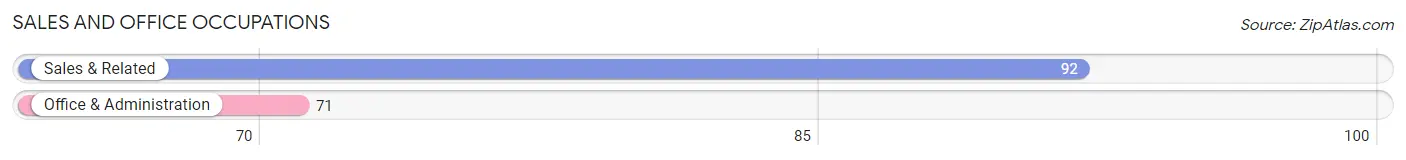
Sales and Office Occupations
The most common Sales and Office occupations in Loyola are Sales & Related (92 | 5.9%), and Office & Administration (71 | 4.5%).
Sales and Office Occupations by Sex
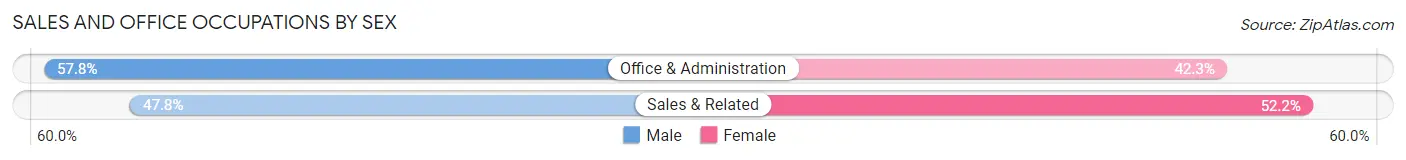
| Occupation | Male | Female |
| Sales & Related | 44 (47.8%) | 48 (52.2%) |
| Office & Administration | 41 (57.8%) | 30 (42.2%) |
| Total (Category) | 85 (52.1%) | 78 (47.8%) |
| Total (Overall) | 881 (56.4%) | 681 (43.6%) |
Natural Resources, Construction and Maintenance Occupations
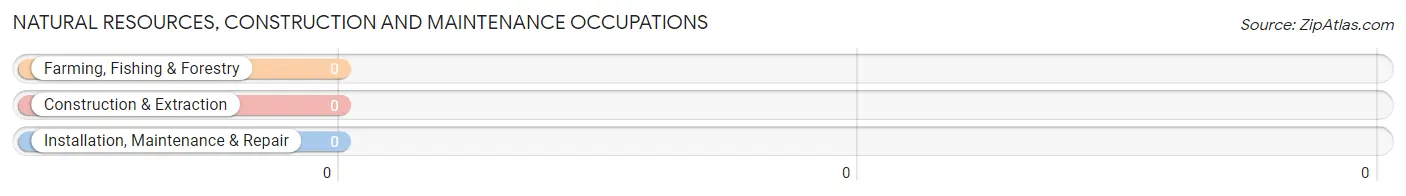
Natural Resources, Construction and Maintenance Occupations by Sex
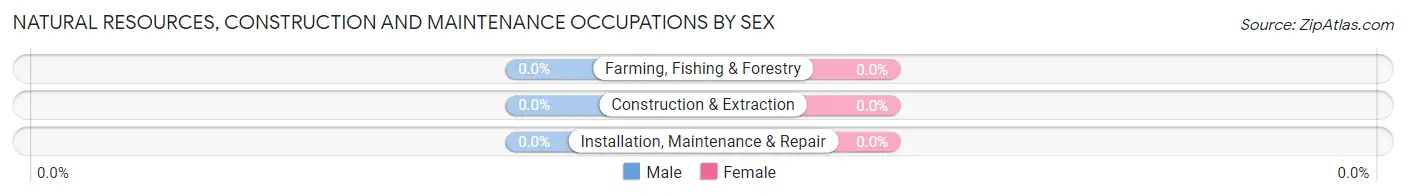
| Occupation | Male | Female |
| Farming, Fishing & Forestry | 0 (0.0%) | 0 (0.0%) |
| Construction & Extraction | 0 (0.0%) | 0 (0.0%) |
| Installation, Maintenance & Repair | 0 (0.0%) | 0 (0.0%) |
| Total (Category) | 0 (0.0%) | 0 (0.0%) |
| Total (Overall) | 881 (56.4%) | 681 (43.6%) |
Production, Transportation and Moving Occupations
The most common Production, Transportation and Moving occupations in Loyola are Production (8 | 0.5%), and Transportation (5 | 0.3%).
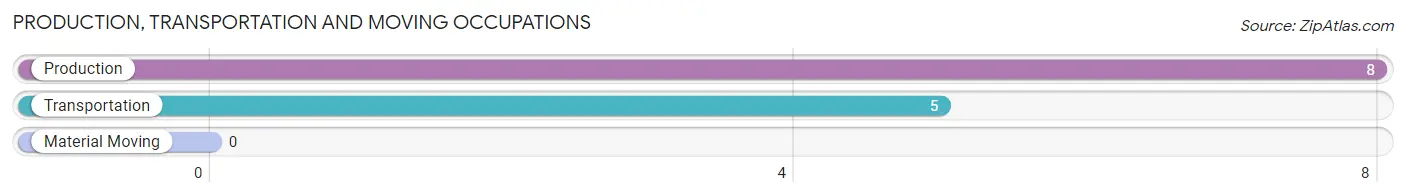
Production, Transportation and Moving Occupations by Sex
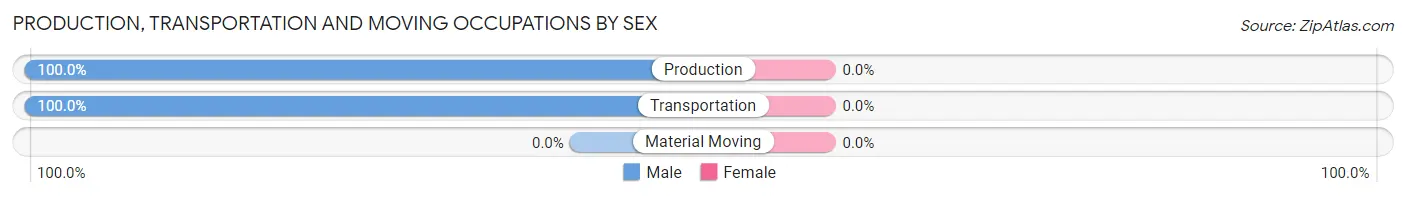
| Occupation | Male | Female |
| Production | 8 (100.0%) | 0 (0.0%) |
| Transportation | 5 (100.0%) | 0 (0.0%) |
| Material Moving | 0 (0.0%) | 0 (0.0%) |
| Total (Category) | 13 (100.0%) | 0 (0.0%) |
| Total (Overall) | 881 (56.4%) | 681 (43.6%) |
Employment Industries by Sex in Loyola
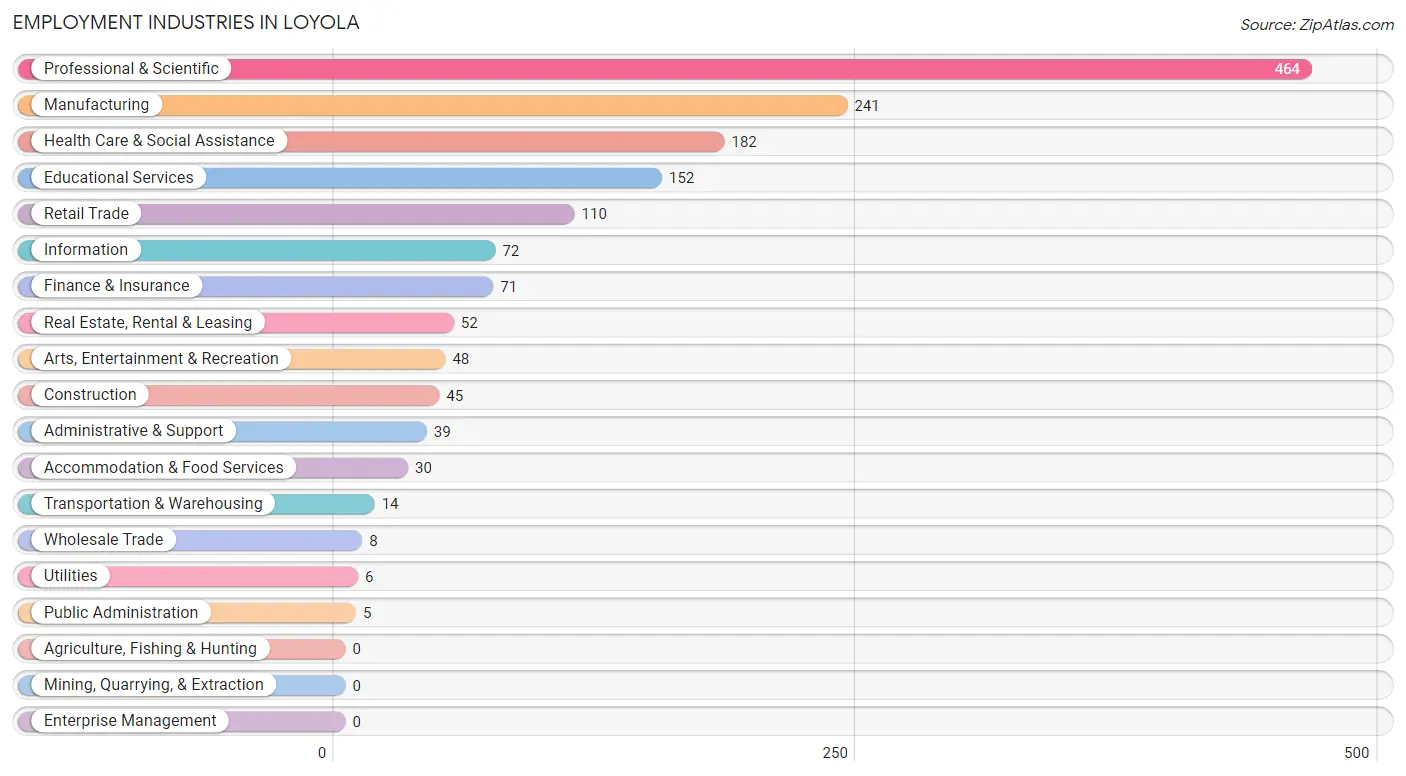
Employment Industries in Loyola
The major employment industries in Loyola include Professional & Scientific (464 | 29.7%), Manufacturing (241 | 15.4%), Health Care & Social Assistance (182 | 11.7%), Educational Services (152 | 9.7%), and Retail Trade (110 | 7.0%).
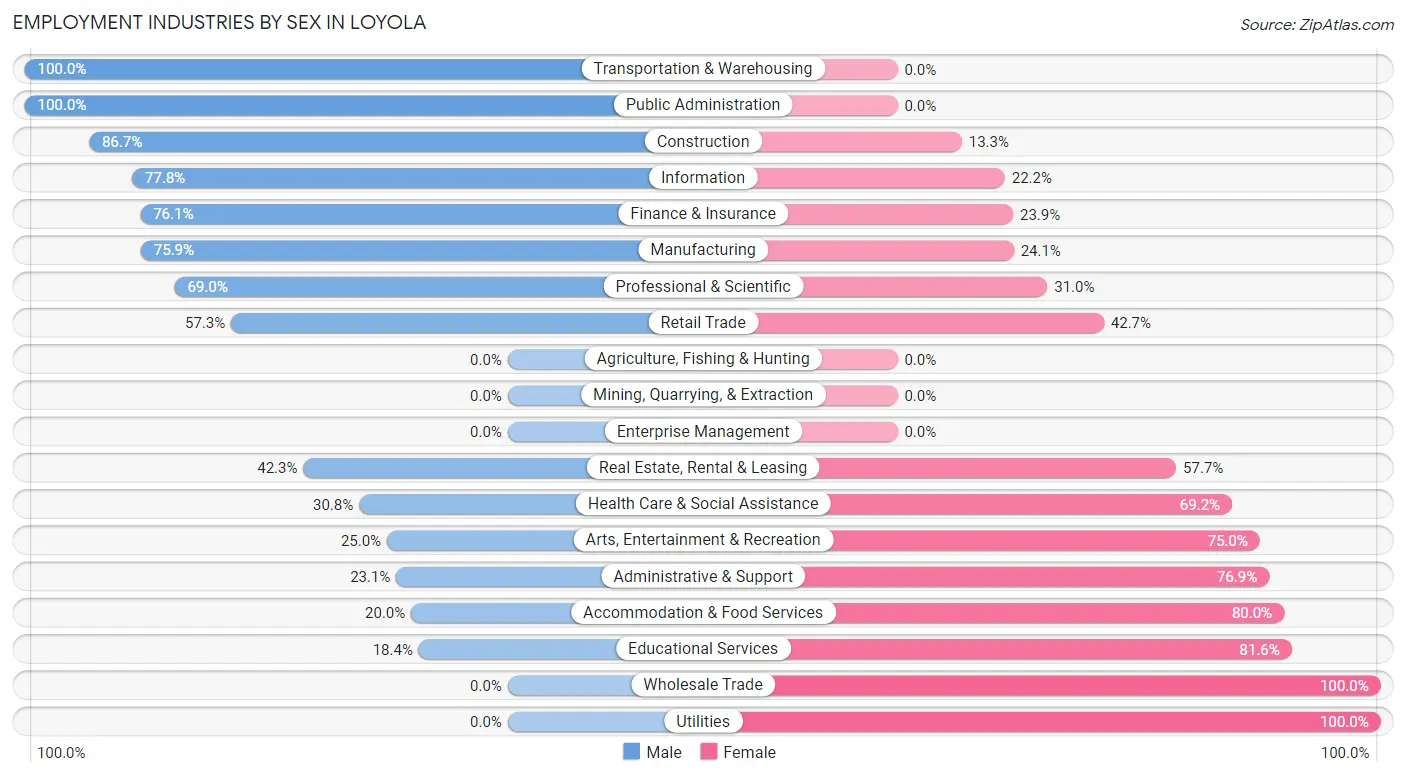
Employment Industries by Sex in Loyola
The Loyola industries that see more men than women are Transportation & Warehousing (100.0%), Public Administration (100.0%), and Construction (86.7%), whereas the industries that tend to have a higher number of women are Wholesale Trade (100.0%), Utilities (100.0%), and Educational Services (81.6%).
| Industry | Male | Female |
| Agriculture, Fishing & Hunting | 0 (0.0%) | 0 (0.0%) |
| Mining, Quarrying, & Extraction | 0 (0.0%) | 0 (0.0%) |
| Construction | 39 (86.7%) | 6 (13.3%) |
| Manufacturing | 183 (75.9%) | 58 (24.1%) |
| Wholesale Trade | 0 (0.0%) | 8 (100.0%) |
| Retail Trade | 63 (57.3%) | 47 (42.7%) |
| Transportation & Warehousing | 14 (100.0%) | 0 (0.0%) |
| Utilities | 0 (0.0%) | 6 (100.0%) |
| Information | 56 (77.8%) | 16 (22.2%) |
| Finance & Insurance | 54 (76.1%) | 17 (23.9%) |
| Real Estate, Rental & Leasing | 22 (42.3%) | 30 (57.7%) |
| Professional & Scientific | 320 (69.0%) | 144 (31.0%) |
| Enterprise Management | 0 (0.0%) | 0 (0.0%) |
| Administrative & Support | 9 (23.1%) | 30 (76.9%) |
| Educational Services | 28 (18.4%) | 124 (81.6%) |
| Health Care & Social Assistance | 56 (30.8%) | 126 (69.2%) |
| Arts, Entertainment & Recreation | 12 (25.0%) | 36 (75.0%) |
| Accommodation & Food Services | 6 (20.0%) | 24 (80.0%) |
| Public Administration | 5 (100.0%) | 0 (0.0%) |
| Total | 881 (56.4%) | 681 (43.6%) |
Education in Loyola
School Enrollment in Loyola
The most common levels of schooling among the 1,104 students in Loyola are high school (293 | 26.5%), middle school (284 | 25.7%), and elementary school (270 | 24.5%).
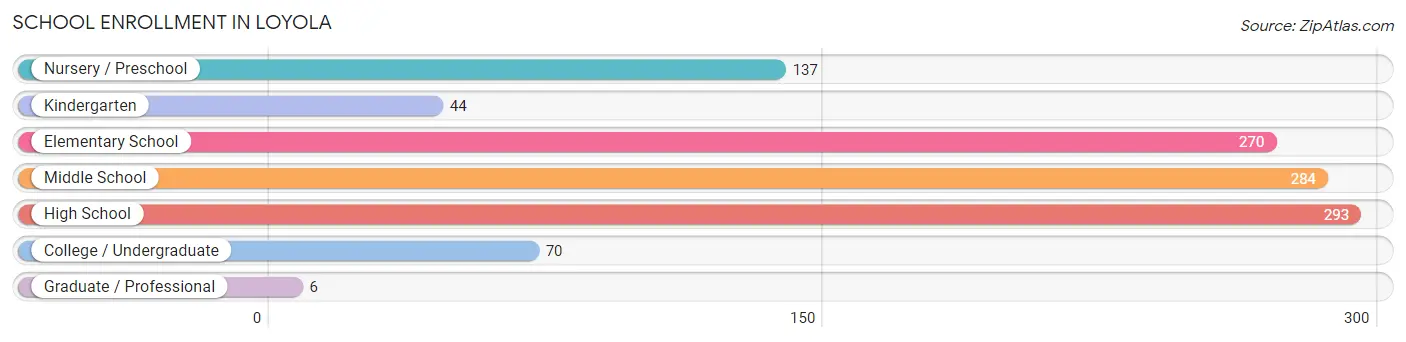
| School Level | # Students | % Students |
| Nursery / Preschool | 137 | 12.4% |
| Kindergarten | 44 | 4.0% |
| Elementary School | 270 | 24.5% |
| Middle School | 284 | 25.7% |
| High School | 293 | 26.5% |
| College / Undergraduate | 70 | 6.3% |
| Graduate / Professional | 6 | 0.5% |
| Total | 1,104 | 100.0% |
School Enrollment by Age by Funding Source in Loyola
Out of a total of 1,104 students who are enrolled in schools in Loyola, 307 (27.8%) attend a private institution, while the remaining 797 (72.2%) are enrolled in public schools. The age group of 3 to 4 year olds has the highest likelihood of being enrolled in private schools, with 58 (72.5% in the age bracket) enrolled. Conversely, the age group of 20 to 24 year olds has the lowest likelihood of being enrolled in a private school, with 24 (100.0% in the age bracket) attending a public institution.
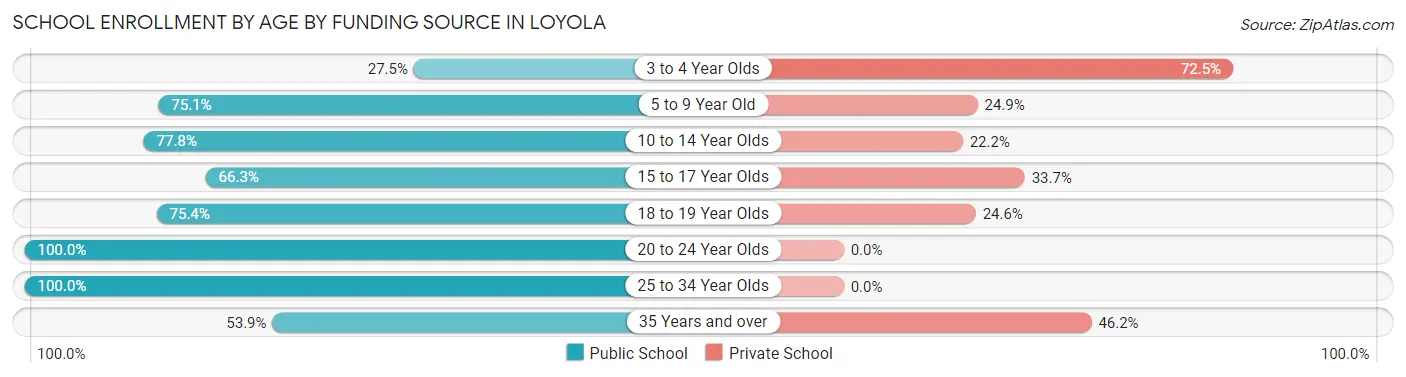
| Age Bracket | Public School | Private School |
| 3 to 4 Year Olds | 22 (27.5%) | 58 (72.5%) |
| 5 to 9 Year Old | 253 (75.1%) | 84 (24.9%) |
| 10 to 14 Year Olds | 309 (77.8%) | 88 (22.2%) |
| 15 to 17 Year Olds | 110 (66.3%) | 56 (33.7%) |
| 18 to 19 Year Olds | 46 (75.4%) | 15 (24.6%) |
| 20 to 24 Year Olds | 24 (100.0%) | 0 (0.0%) |
| 25 to 34 Year Olds | 26 (100.0%) | 0 (0.0%) |
| 35 Years and over | 7 (53.8%) | 6 (46.2%) |
| Total | 797 (72.2%) | 307 (27.8%) |
Educational Attainment by Field of Study in Loyola
Engineering (672 | 26.5%), social sciences (282 | 11.1%), computers & mathematics (230 | 9.1%), business (230 | 9.1%), and literature & languages (203 | 8.0%) are the most common fields of study among 2,540 individuals in Loyola who have obtained a bachelor's degree or higher.
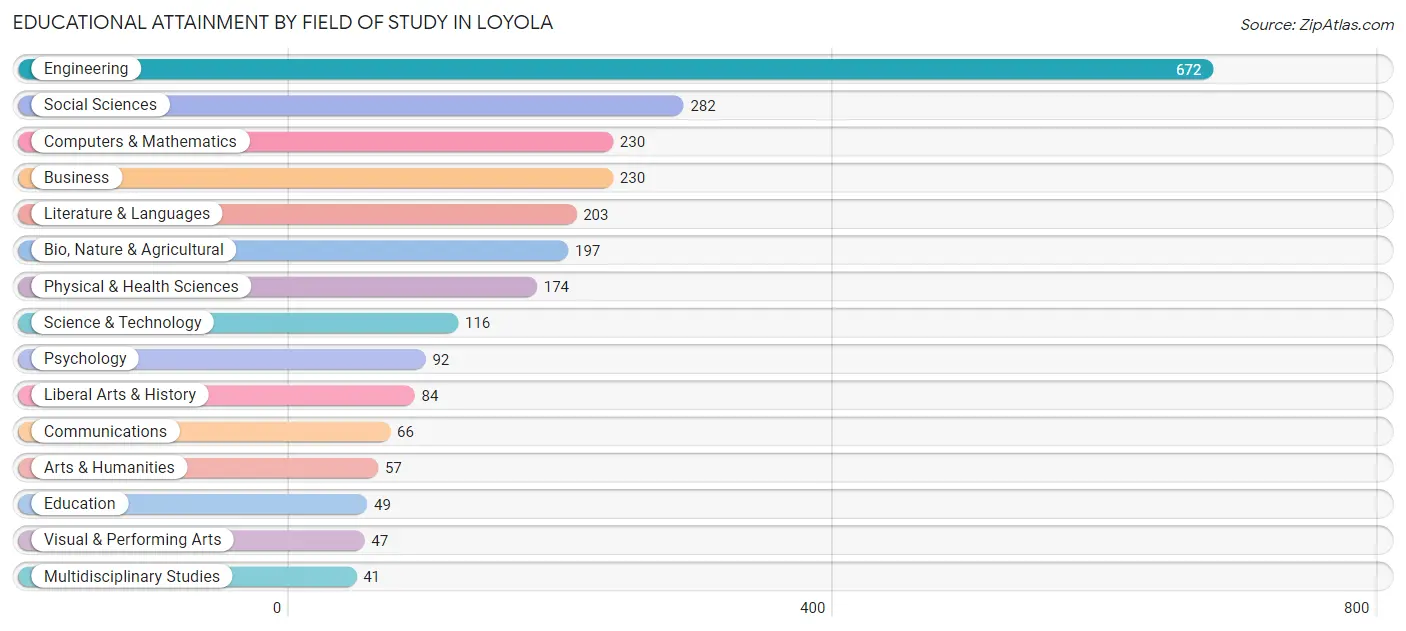
| Field of Study | # Graduates | % Graduates |
| Computers & Mathematics | 230 | 9.1% |
| Bio, Nature & Agricultural | 197 | 7.8% |
| Physical & Health Sciences | 174 | 6.9% |
| Psychology | 92 | 3.6% |
| Social Sciences | 282 | 11.1% |
| Engineering | 672 | 26.5% |
| Multidisciplinary Studies | 41 | 1.6% |
| Science & Technology | 116 | 4.6% |
| Business | 230 | 9.1% |
| Education | 49 | 1.9% |
| Literature & Languages | 203 | 8.0% |
| Liberal Arts & History | 84 | 3.3% |
| Visual & Performing Arts | 47 | 1.8% |
| Communications | 66 | 2.6% |
| Arts & Humanities | 57 | 2.2% |
| Total | 2,540 | 100.0% |
Transportation & Commute in Loyola
Vehicle Availability by Sex in Loyola
The most prevalent vehicle ownership categories in Loyola are males with 2 vehicles (403, accounting for 46.4%) and females with 2 vehicles (276, making up 60.1%).
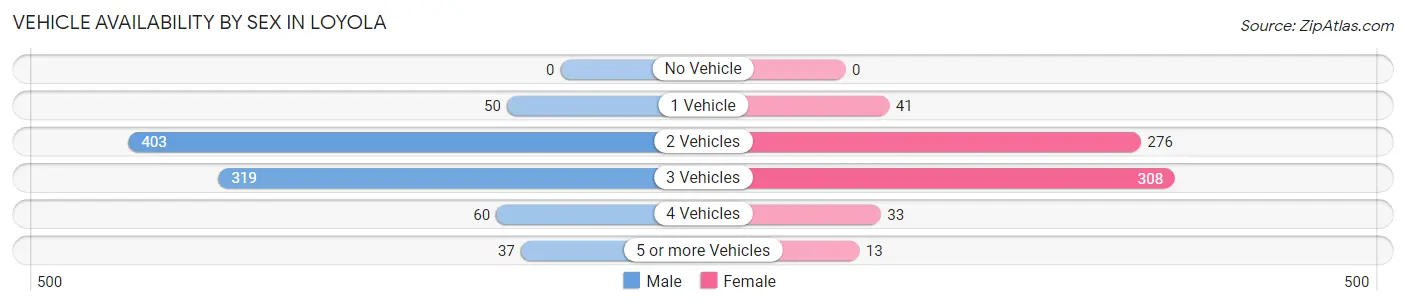
| Vehicles Available | Male | Female |
| No Vehicle | 0 (0.0%) | 0 (0.0%) |
| 1 Vehicle | 50 (5.8%) | 41 (6.1%) |
| 2 Vehicles | 403 (46.4%) | 276 (41.1%) |
| 3 Vehicles | 319 (36.7%) | 308 (45.9%) |
| 4 Vehicles | 60 (6.9%) | 33 (4.9%) |
| 5 or more Vehicles | 37 (4.3%) | 13 (1.9%) |
| Total | 869 (100.0%) | 671 (100.0%) |
Commute Time in Loyola
The most frequently occuring commute durations in Loyola are 15 to 19 minutes (266 commuters, 26.4%), 20 to 24 minutes (255 commuters, 25.3%), and 30 to 34 minutes (134 commuters, 13.3%).
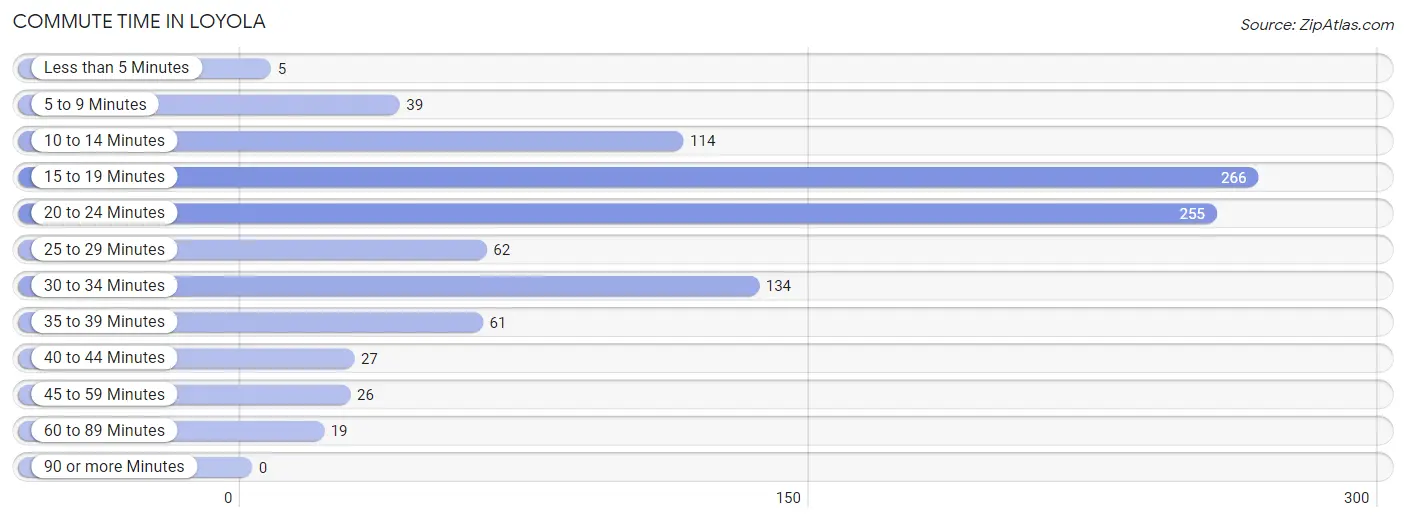
| Commute Time | # Commuters | % Commuters |
| Less than 5 Minutes | 5 | 0.5% |
| 5 to 9 Minutes | 39 | 3.9% |
| 10 to 14 Minutes | 114 | 11.3% |
| 15 to 19 Minutes | 266 | 26.4% |
| 20 to 24 Minutes | 255 | 25.3% |
| 25 to 29 Minutes | 62 | 6.1% |
| 30 to 34 Minutes | 134 | 13.3% |
| 35 to 39 Minutes | 61 | 6.0% |
| 40 to 44 Minutes | 27 | 2.7% |
| 45 to 59 Minutes | 26 | 2.6% |
| 60 to 89 Minutes | 19 | 1.9% |
| 90 or more Minutes | 0 | 0.0% |
Commute Time by Sex in Loyola
The most common commute times in Loyola are 20 to 24 minutes (165 commuters, 30.6%) for males and 15 to 19 minutes (103 commuters, 22.0%) for females.
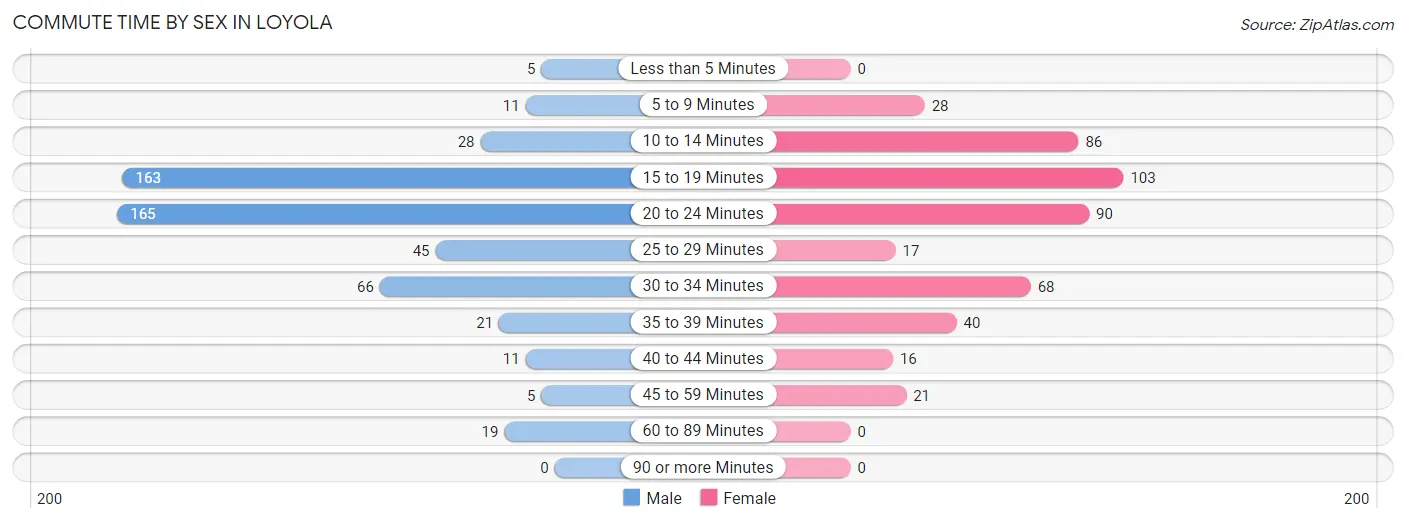
| Commute Time | Male | Female |
| Less than 5 Minutes | 5 (0.9%) | 0 (0.0%) |
| 5 to 9 Minutes | 11 (2.0%) | 28 (6.0%) |
| 10 to 14 Minutes | 28 (5.2%) | 86 (18.3%) |
| 15 to 19 Minutes | 163 (30.2%) | 103 (22.0%) |
| 20 to 24 Minutes | 165 (30.6%) | 90 (19.2%) |
| 25 to 29 Minutes | 45 (8.4%) | 17 (3.6%) |
| 30 to 34 Minutes | 66 (12.2%) | 68 (14.5%) |
| 35 to 39 Minutes | 21 (3.9%) | 40 (8.5%) |
| 40 to 44 Minutes | 11 (2.0%) | 16 (3.4%) |
| 45 to 59 Minutes | 5 (0.9%) | 21 (4.5%) |
| 60 to 89 Minutes | 19 (3.5%) | 0 (0.0%) |
| 90 or more Minutes | 0 (0.0%) | 0 (0.0%) |
Time of Departure to Work by Sex in Loyola
The most frequent times of departure to work in Loyola are 9:00 AM to 9:59 AM (127, 23.6%) for males and 8:00 AM to 8:29 AM (98, 20.9%) for females.
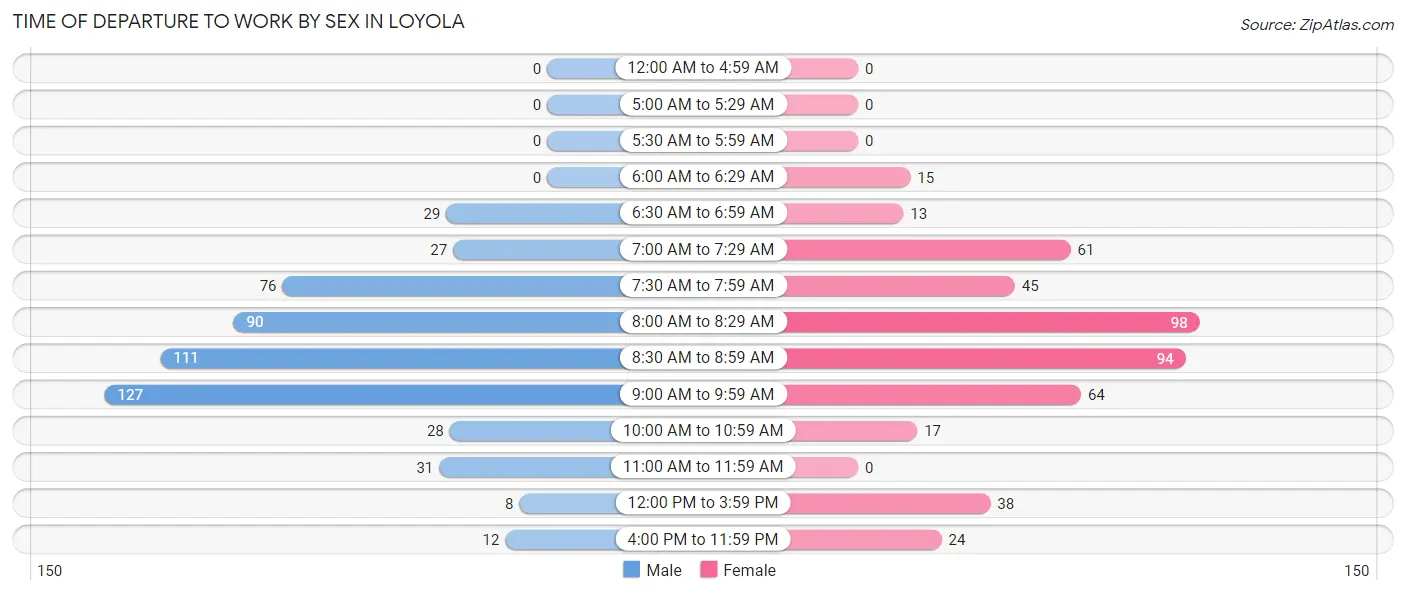
| Time of Departure | Male | Female |
| 12:00 AM to 4:59 AM | 0 (0.0%) | 0 (0.0%) |
| 5:00 AM to 5:29 AM | 0 (0.0%) | 0 (0.0%) |
| 5:30 AM to 5:59 AM | 0 (0.0%) | 0 (0.0%) |
| 6:00 AM to 6:29 AM | 0 (0.0%) | 15 (3.2%) |
| 6:30 AM to 6:59 AM | 29 (5.4%) | 13 (2.8%) |
| 7:00 AM to 7:29 AM | 27 (5.0%) | 61 (13.0%) |
| 7:30 AM to 7:59 AM | 76 (14.1%) | 45 (9.6%) |
| 8:00 AM to 8:29 AM | 90 (16.7%) | 98 (20.9%) |
| 8:30 AM to 8:59 AM | 111 (20.6%) | 94 (20.0%) |
| 9:00 AM to 9:59 AM | 127 (23.6%) | 64 (13.7%) |
| 10:00 AM to 10:59 AM | 28 (5.2%) | 17 (3.6%) |
| 11:00 AM to 11:59 AM | 31 (5.8%) | 0 (0.0%) |
| 12:00 PM to 3:59 PM | 8 (1.5%) | 38 (8.1%) |
| 4:00 PM to 11:59 PM | 12 (2.2%) | 24 (5.1%) |
| Total | 539 (100.0%) | 469 (100.0%) |
Housing Occupancy in Loyola
Occupancy by Ownership in Loyola
Of the total 1,268 dwellings in Loyola, owner-occupied units account for 1,105 (87.2%), while renter-occupied units make up 163 (12.9%).
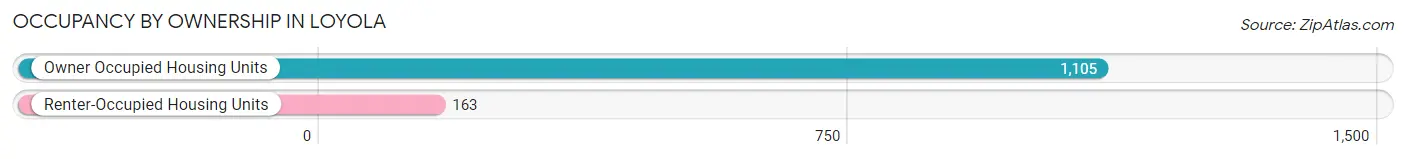
| Occupancy | # Housing Units | % Housing Units |
| Owner Occupied Housing Units | 1,105 | 87.2% |
| Renter-Occupied Housing Units | 163 | 12.9% |
| Total Occupied Housing Units | 1,268 | 100.0% |
Occupancy by Household Size in Loyola
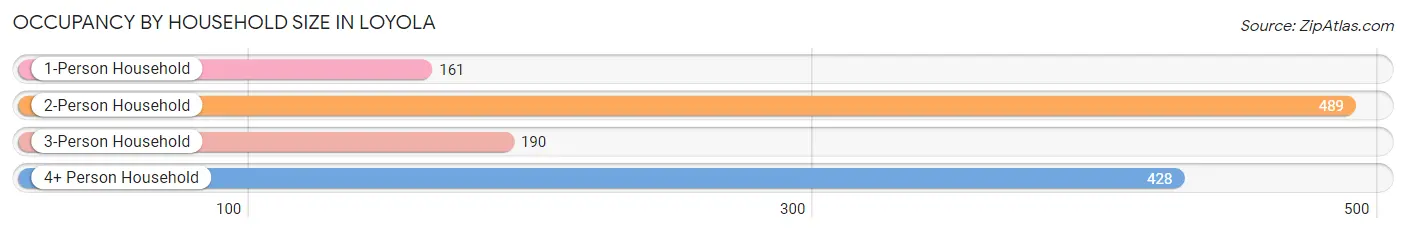
| Household Size | # Housing Units | % Housing Units |
| 1-Person Household | 161 | 12.7% |
| 2-Person Household | 489 | 38.6% |
| 3-Person Household | 190 | 15.0% |
| 4+ Person Household | 428 | 33.8% |
| Total Housing Units | 1,268 | 100.0% |
Occupancy by Ownership by Household Size in Loyola
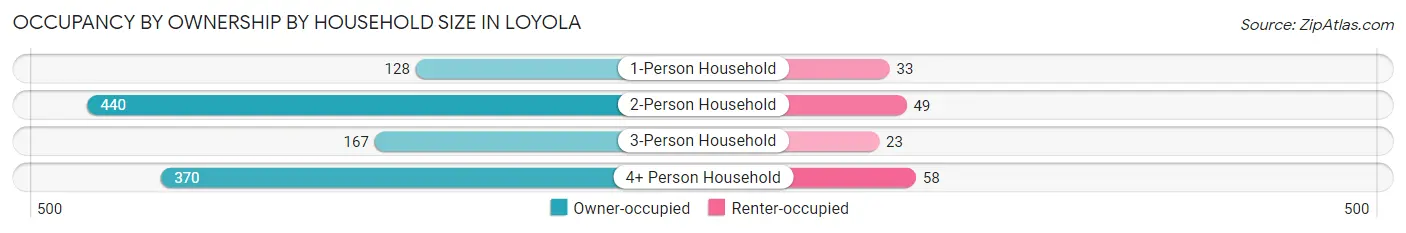
| Household Size | Owner-occupied | Renter-occupied |
| 1-Person Household | 128 (79.5%) | 33 (20.5%) |
| 2-Person Household | 440 (90.0%) | 49 (10.0%) |
| 3-Person Household | 167 (87.9%) | 23 (12.1%) |
| 4+ Person Household | 370 (86.5%) | 58 (13.6%) |
| Total Housing Units | 1,105 (87.2%) | 163 (12.9%) |
Occupancy by Educational Attainment in Loyola
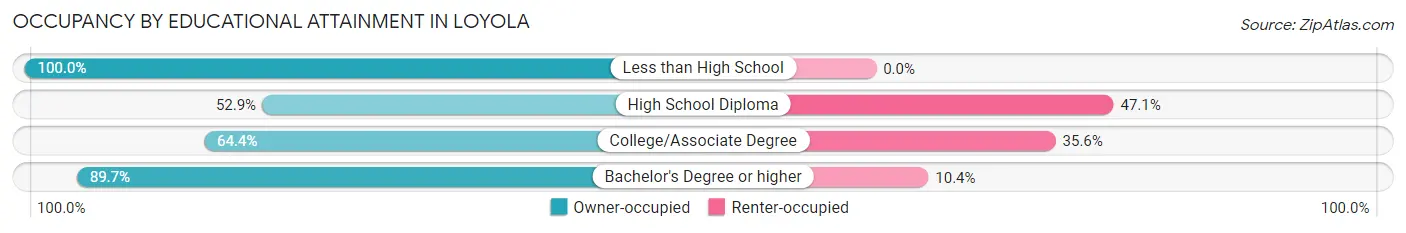
| Household Size | Owner-occupied | Renter-occupied |
| Less than High School | 7 (100.0%) | 0 (0.0%) |
| High School Diploma | 9 (52.9%) | 8 (47.1%) |
| College/Associate Degree | 67 (64.4%) | 37 (35.6%) |
| Bachelor's Degree or higher | 1,022 (89.6%) | 118 (10.3%) |
Occupancy by Age of Householder in Loyola
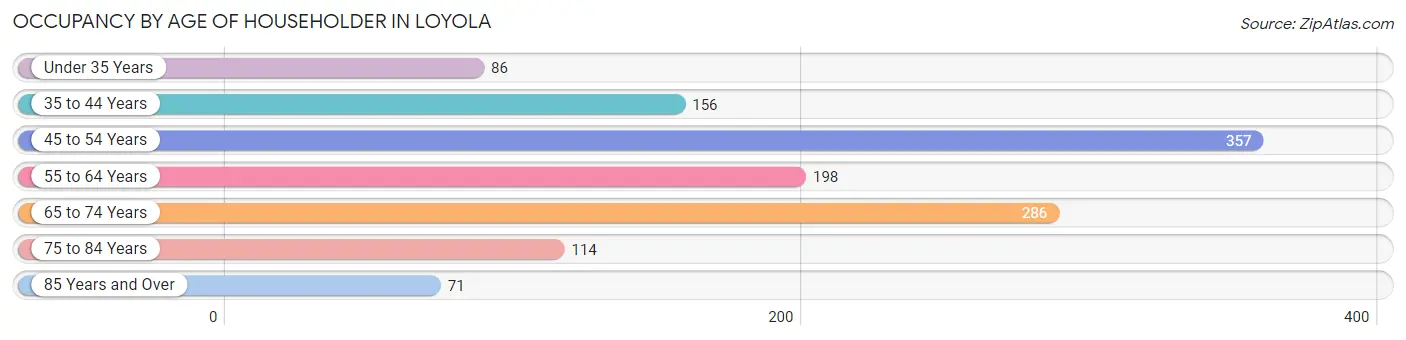
| Age Bracket | # Households | % Households |
| Under 35 Years | 86 | 6.8% |
| 35 to 44 Years | 156 | 12.3% |
| 45 to 54 Years | 357 | 28.1% |
| 55 to 64 Years | 198 | 15.6% |
| 65 to 74 Years | 286 | 22.6% |
| 75 to 84 Years | 114 | 9.0% |
| 85 Years and Over | 71 | 5.6% |
| Total | 1,268 | 100.0% |
Housing Finances in Loyola
Median Income by Occupancy in Loyola
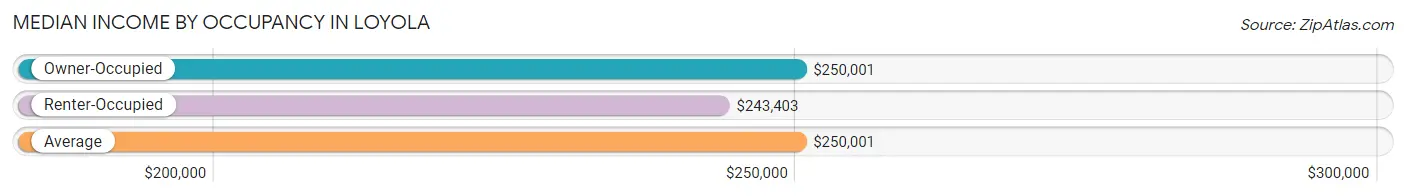
| Occupancy Type | # Households | Median Income |
| Owner-Occupied | 1,105 (87.2%) | $250,001 |
| Renter-Occupied | 163 (12.9%) | $243,403 |
| Average | 1,268 (100.0%) | $250,001 |
Occupancy by Householder Income Bracket in Loyola
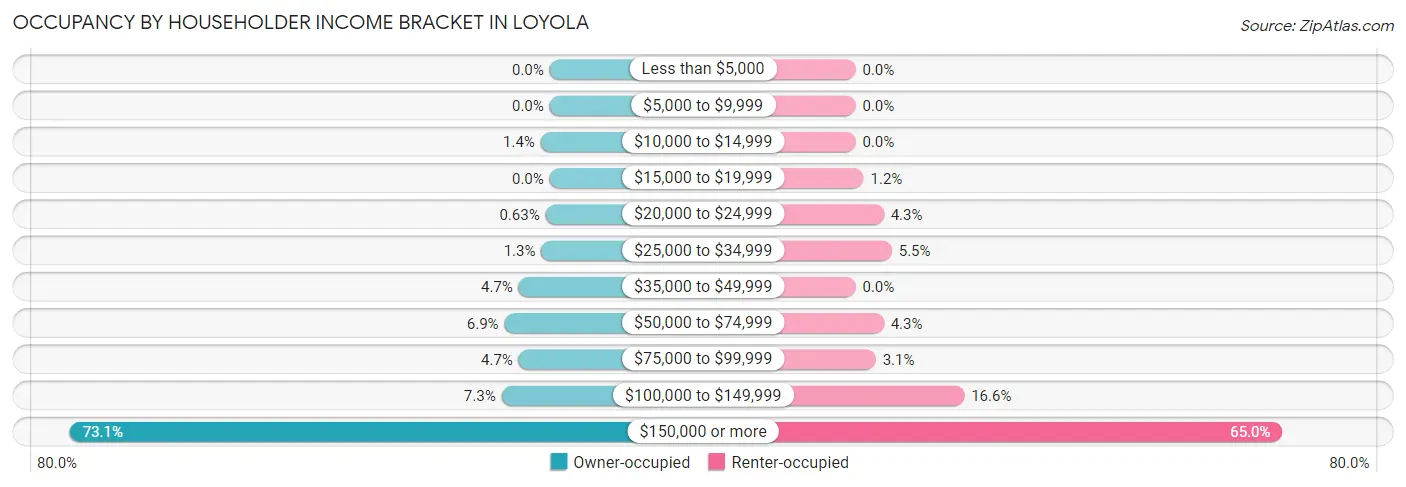
| Income Bracket | Owner-occupied | Renter-occupied |
| Less than $5,000 | 0 (0.0%) | 0 (0.0%) |
| $5,000 to $9,999 | 0 (0.0%) | 0 (0.0%) |
| $10,000 to $14,999 | 15 (1.4%) | 0 (0.0%) |
| $15,000 to $19,999 | 0 (0.0%) | 2 (1.2%) |
| $20,000 to $24,999 | 7 (0.6%) | 7 (4.3%) |
| $25,000 to $34,999 | 14 (1.3%) | 9 (5.5%) |
| $35,000 to $49,999 | 52 (4.7%) | 0 (0.0%) |
| $50,000 to $74,999 | 76 (6.9%) | 7 (4.3%) |
| $75,000 to $99,999 | 52 (4.7%) | 5 (3.1%) |
| $100,000 to $149,999 | 81 (7.3%) | 27 (16.6%) |
| $150,000 or more | 808 (73.1%) | 106 (65.0%) |
| Total | 1,105 (100.0%) | 163 (100.0%) |
Monthly Housing Cost Tiers in Loyola
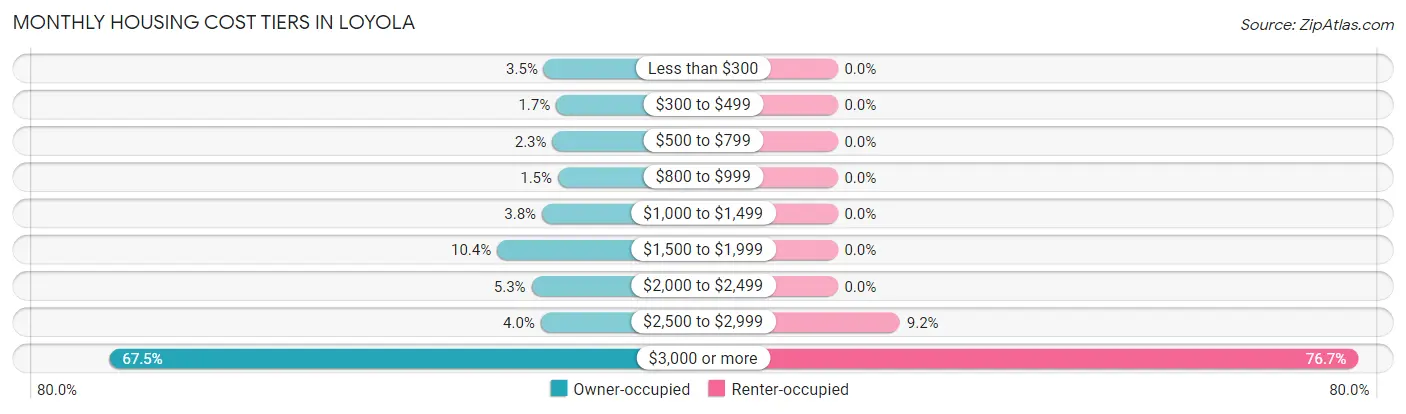
| Monthly Cost | Owner-occupied | Renter-occupied |
| Less than $300 | 39 (3.5%) | 0 (0.0%) |
| $300 to $499 | 19 (1.7%) | 0 (0.0%) |
| $500 to $799 | 25 (2.3%) | 0 (0.0%) |
| $800 to $999 | 16 (1.5%) | 0 (0.0%) |
| $1,000 to $1,499 | 42 (3.8%) | 0 (0.0%) |
| $1,500 to $1,999 | 115 (10.4%) | 0 (0.0%) |
| $2,000 to $2,499 | 59 (5.3%) | 0 (0.0%) |
| $2,500 to $2,999 | 44 (4.0%) | 15 (9.2%) |
| $3,000 or more | 746 (67.5%) | 125 (76.7%) |
| Total | 1,105 (100.0%) | 163 (100.0%) |
Physical Housing Characteristics in Loyola
Housing Structures in Loyola
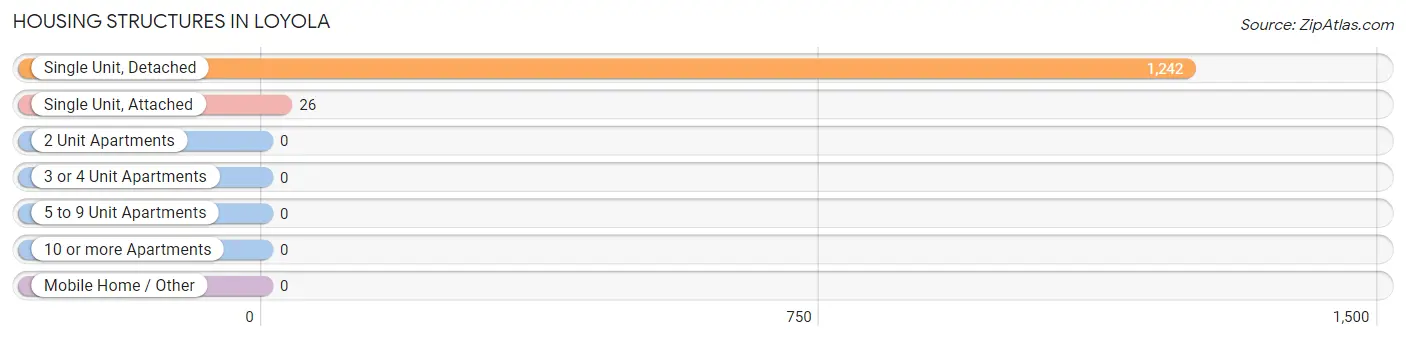
| Structure Type | # Housing Units | % Housing Units |
| Single Unit, Detached | 1,242 | 98.0% |
| Single Unit, Attached | 26 | 2.1% |
| 2 Unit Apartments | 0 | 0.0% |
| 3 or 4 Unit Apartments | 0 | 0.0% |
| 5 to 9 Unit Apartments | 0 | 0.0% |
| 10 or more Apartments | 0 | 0.0% |
| Mobile Home / Other | 0 | 0.0% |
| Total | 1,268 | 100.0% |
Housing Structures by Occupancy in Loyola
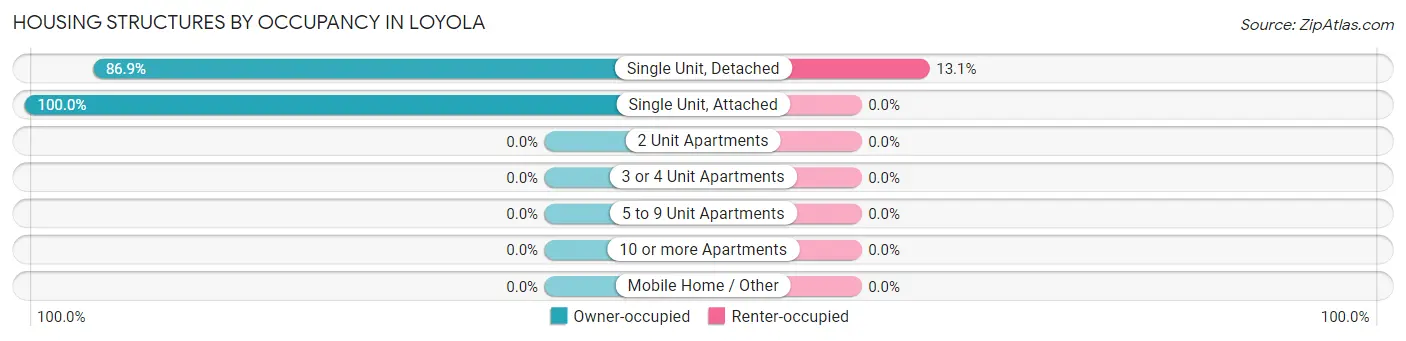
| Structure Type | Owner-occupied | Renter-occupied |
| Single Unit, Detached | 1,079 (86.9%) | 163 (13.1%) |
| Single Unit, Attached | 26 (100.0%) | 0 (0.0%) |
| 2 Unit Apartments | 0 (0.0%) | 0 (0.0%) |
| 3 or 4 Unit Apartments | 0 (0.0%) | 0 (0.0%) |
| 5 to 9 Unit Apartments | 0 (0.0%) | 0 (0.0%) |
| 10 or more Apartments | 0 (0.0%) | 0 (0.0%) |
| Mobile Home / Other | 0 (0.0%) | 0 (0.0%) |
| Total | 1,105 (87.2%) | 163 (12.9%) |
Housing Structures by Number of Rooms in Loyola
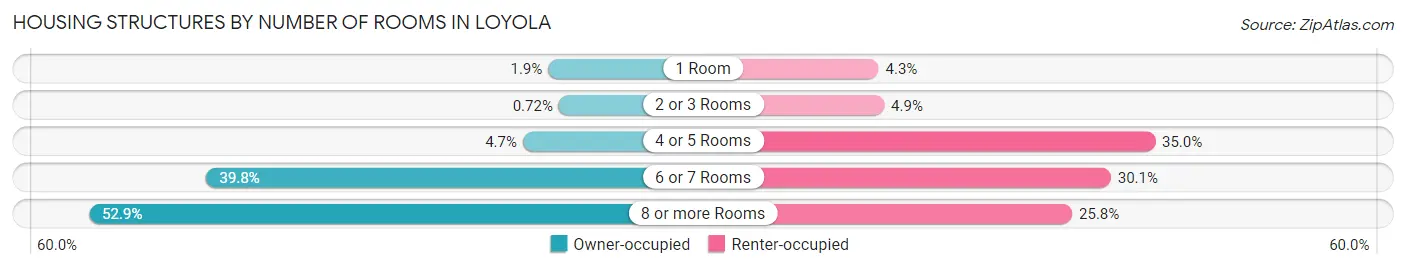
| Number of Rooms | Owner-occupied | Renter-occupied |
| 1 Room | 21 (1.9%) | 7 (4.3%) |
| 2 or 3 Rooms | 8 (0.7%) | 8 (4.9%) |
| 4 or 5 Rooms | 52 (4.7%) | 57 (35.0%) |
| 6 or 7 Rooms | 440 (39.8%) | 49 (30.1%) |
| 8 or more Rooms | 584 (52.8%) | 42 (25.8%) |
| Total | 1,105 (100.0%) | 163 (100.0%) |
Housing Structure by Heating Type in Loyola
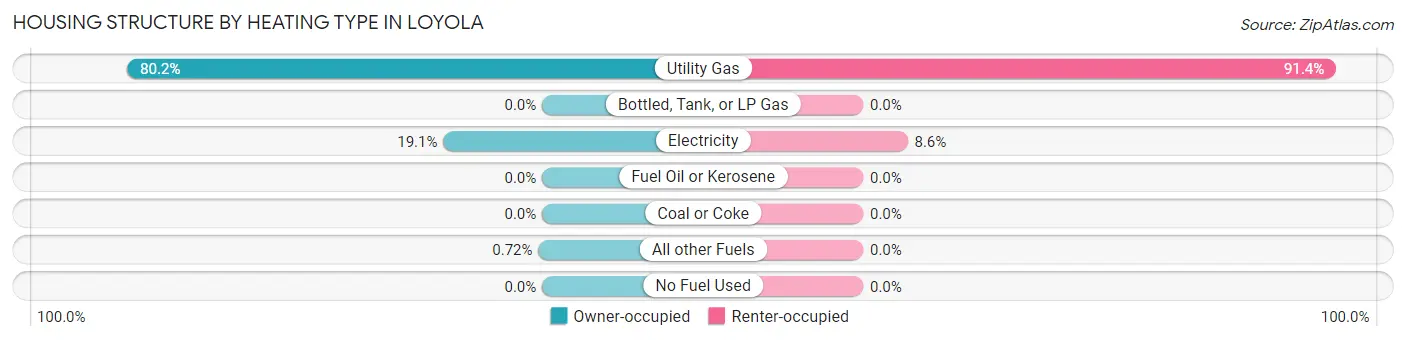
| Heating Type | Owner-occupied | Renter-occupied |
| Utility Gas | 886 (80.2%) | 149 (91.4%) |
| Bottled, Tank, or LP Gas | 0 (0.0%) | 0 (0.0%) |
| Electricity | 211 (19.1%) | 14 (8.6%) |
| Fuel Oil or Kerosene | 0 (0.0%) | 0 (0.0%) |
| Coal or Coke | 0 (0.0%) | 0 (0.0%) |
| All other Fuels | 8 (0.7%) | 0 (0.0%) |
| No Fuel Used | 0 (0.0%) | 0 (0.0%) |
| Total | 1,105 (100.0%) | 163 (100.0%) |
Household Vehicle Usage in Loyola
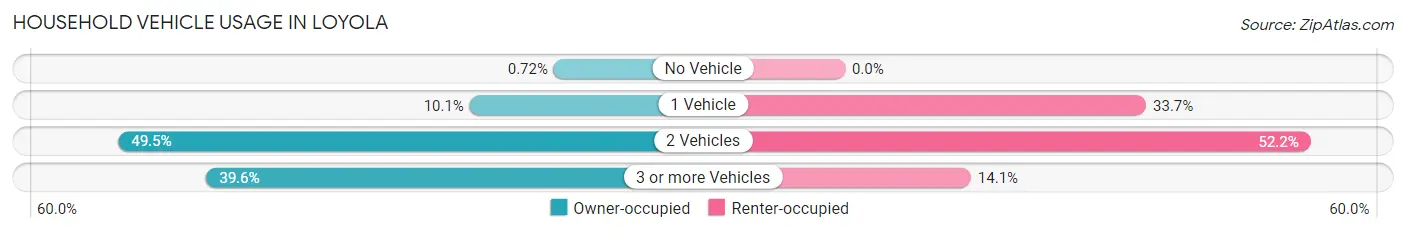
| Vehicles per Household | Owner-occupied | Renter-occupied |
| No Vehicle | 8 (0.7%) | 0 (0.0%) |
| 1 Vehicle | 112 (10.1%) | 55 (33.7%) |
| 2 Vehicles | 547 (49.5%) | 85 (52.1%) |
| 3 or more Vehicles | 438 (39.6%) | 23 (14.1%) |
| Total | 1,105 (100.0%) | 163 (100.0%) |
Real Estate & Mortgages in Loyola
Real Estate and Mortgage Overview in Loyola
| Characteristic | Without Mortgage | With Mortgage |
| Housing Units | 404 | 701 |
| Median Property Value | $2,000,001 | $2,000,001 |
| Median Household Income | $212,917 | $579 |
| Monthly Housing Costs | $1,501 | $664 |
| Real Estate Taxes | $10,001 | $0 |
Property Value by Mortgage Status in Loyola
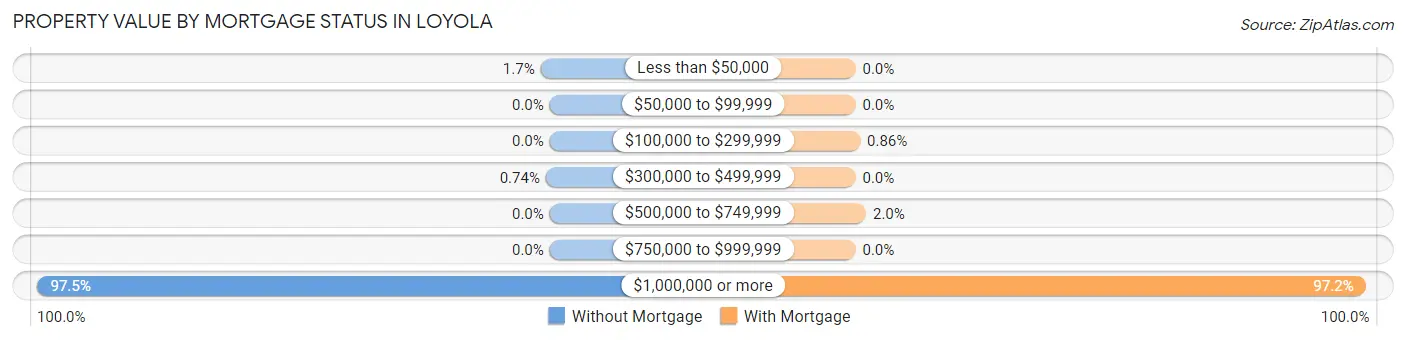
| Property Value | Without Mortgage | With Mortgage |
| Less than $50,000 | 7 (1.7%) | 0 (0.0%) |
| $50,000 to $99,999 | 0 (0.0%) | 0 (0.0%) |
| $100,000 to $299,999 | 0 (0.0%) | 6 (0.9%) |
| $300,000 to $499,999 | 3 (0.7%) | 0 (0.0%) |
| $500,000 to $749,999 | 0 (0.0%) | 14 (2.0%) |
| $750,000 to $999,999 | 0 (0.0%) | 0 (0.0%) |
| $1,000,000 or more | 394 (97.5%) | 681 (97.2%) |
| Total | 404 (100.0%) | 701 (100.0%) |
Household Income by Mortgage Status in Loyola
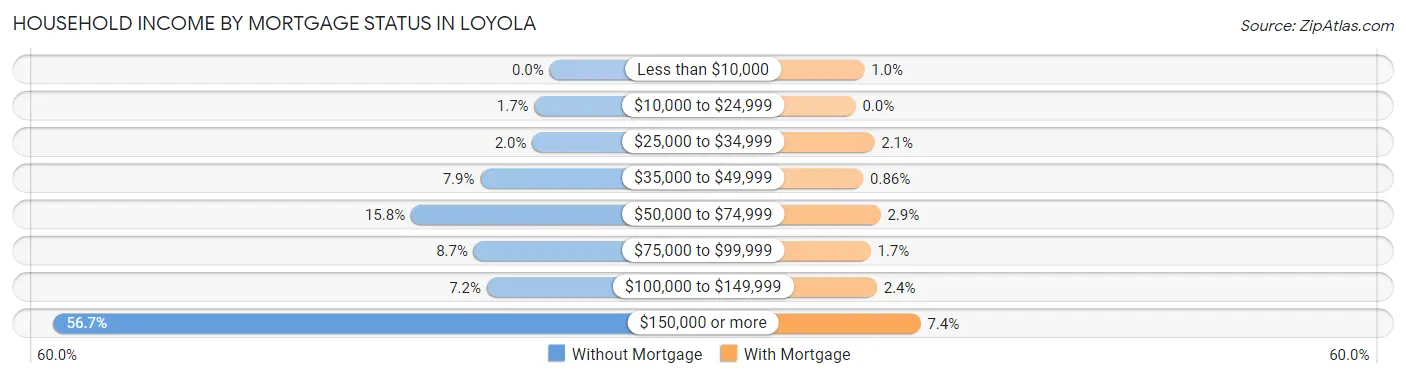
| Household Income | Without Mortgage | With Mortgage |
| Less than $10,000 | 0 (0.0%) | 7 (1.0%) |
| $10,000 to $24,999 | 7 (1.7%) | 0 (0.0%) |
| $25,000 to $34,999 | 8 (2.0%) | 15 (2.1%) |
| $35,000 to $49,999 | 32 (7.9%) | 6 (0.9%) |
| $50,000 to $74,999 | 64 (15.8%) | 20 (2.9%) |
| $75,000 to $99,999 | 35 (8.7%) | 12 (1.7%) |
| $100,000 to $149,999 | 29 (7.2%) | 17 (2.4%) |
| $150,000 or more | 229 (56.7%) | 52 (7.4%) |
| Total | 404 (100.0%) | 701 (100.0%) |
Property Value to Household Income Ratio in Loyola
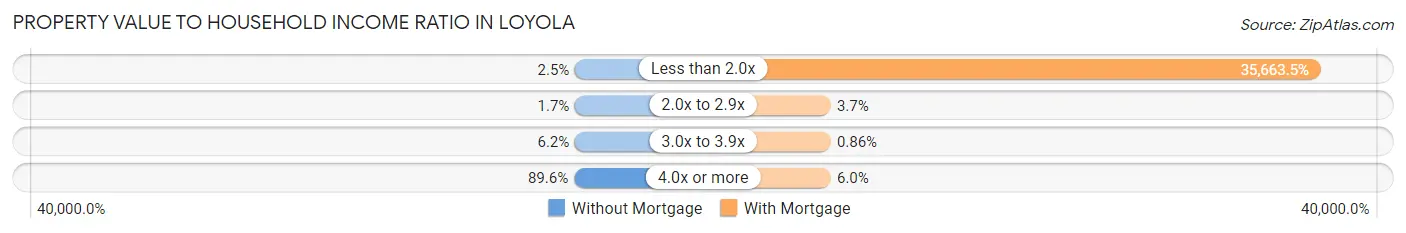
| Value-to-Income Ratio | Without Mortgage | With Mortgage |
| Less than 2.0x | 10 (2.5%) | 250,001 (35,663.5%) |
| 2.0x to 2.9x | 7 (1.7%) | 26 (3.7%) |
| 3.0x to 3.9x | 25 (6.2%) | 6 (0.9%) |
| 4.0x or more | 362 (89.6%) | 42 (6.0%) |
| Total | 404 (100.0%) | 701 (100.0%) |
Real Estate Taxes by Mortgage Status in Loyola
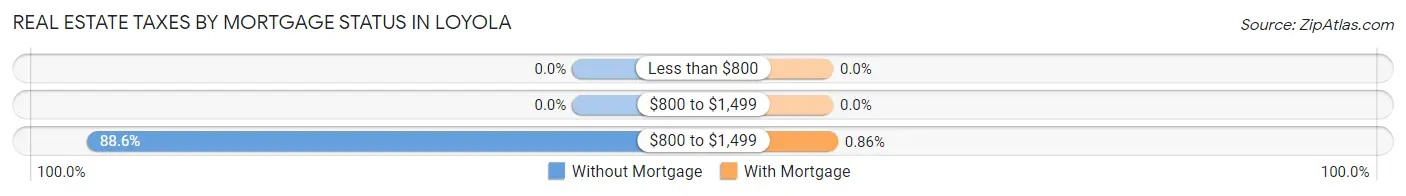
| Property Taxes | Without Mortgage | With Mortgage |
| Less than $800 | 0 (0.0%) | 0 (0.0%) |
| $800 to $1,499 | 0 (0.0%) | 0 (0.0%) |
| $800 to $1,499 | 358 (88.6%) | 6 (0.9%) |
| Total | 404 (100.0%) | 701 (100.0%) |
Health & Disability in Loyola
Health Insurance Coverage by Age in Loyola
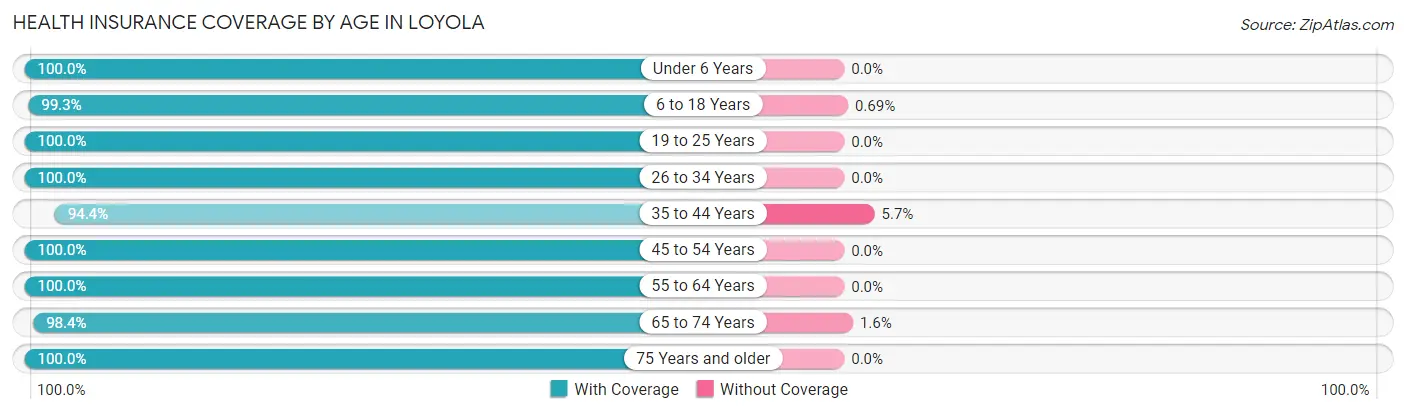
| Age Bracket | With Coverage | Without Coverage |
| Under 6 Years | 267 (100.0%) | 0 (0.0%) |
| 6 to 18 Years | 863 (99.3%) | 6 (0.7%) |
| 19 to 25 Years | 64 (100.0%) | 0 (0.0%) |
| 26 to 34 Years | 224 (100.0%) | 0 (0.0%) |
| 35 to 44 Years | 334 (94.4%) | 20 (5.7%) |
| 45 to 54 Years | 689 (100.0%) | 0 (0.0%) |
| 55 to 64 Years | 430 (100.0%) | 0 (0.0%) |
| 65 to 74 Years | 550 (98.4%) | 9 (1.6%) |
| 75 Years and older | 362 (100.0%) | 0 (0.0%) |
| Total | 3,783 (99.1%) | 35 (0.9%) |
Health Insurance Coverage by Citizenship Status in Loyola
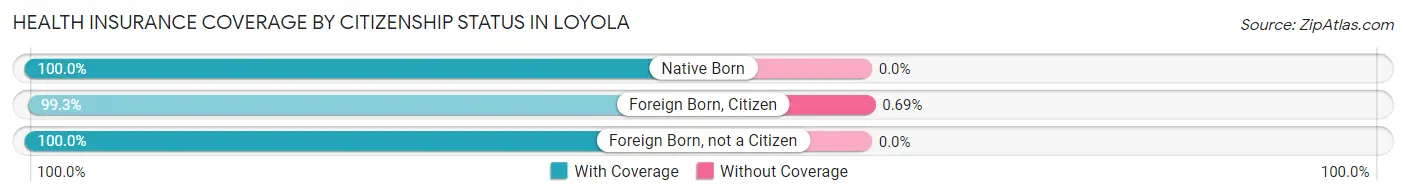
| Citizenship Status | With Coverage | Without Coverage |
| Native Born | 267 (100.0%) | 0 (0.0%) |
| Foreign Born, Citizen | 863 (99.3%) | 6 (0.7%) |
| Foreign Born, not a Citizen | 64 (100.0%) | 0 (0.0%) |
Health Insurance Coverage by Household Income in Loyola
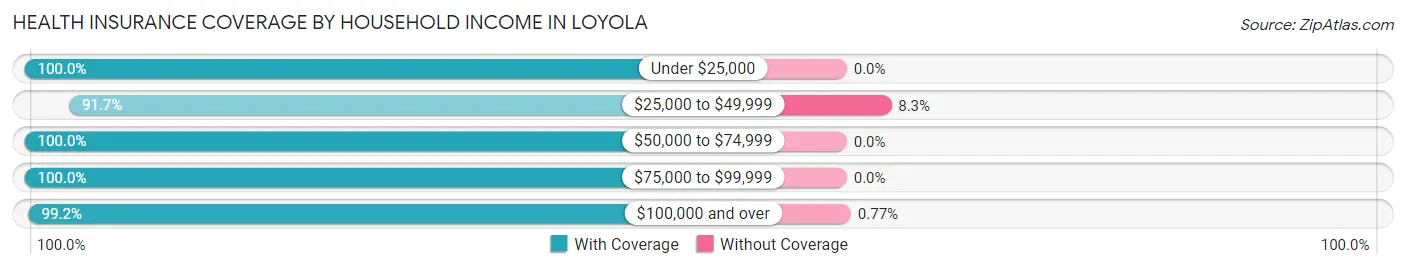
| Household Income | With Coverage | Without Coverage |
| Under $25,000 | 66 (100.0%) | 0 (0.0%) |
| $25,000 to $49,999 | 99 (91.7%) | 9 (8.3%) |
| $50,000 to $74,999 | 113 (100.0%) | 0 (0.0%) |
| $75,000 to $99,999 | 144 (100.0%) | 0 (0.0%) |
| $100,000 and over | 3,361 (99.2%) | 26 (0.8%) |
Public vs Private Health Insurance Coverage by Age in Loyola
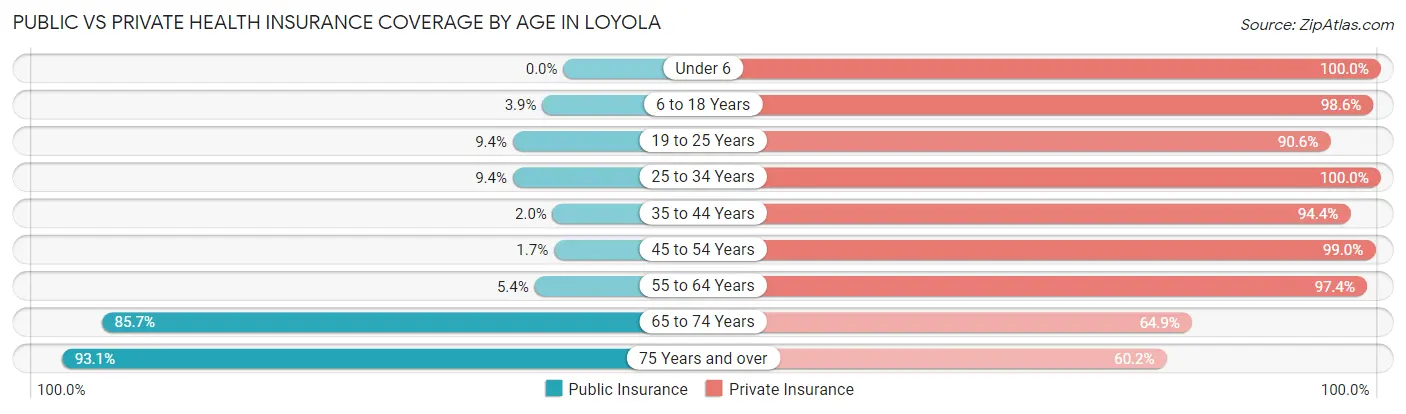
| Age Bracket | Public Insurance | Private Insurance |
| Under 6 | 0 (0.0%) | 267 (100.0%) |
| 6 to 18 Years | 34 (3.9%) | 857 (98.6%) |
| 19 to 25 Years | 6 (9.4%) | 58 (90.6%) |
| 25 to 34 Years | 21 (9.4%) | 224 (100.0%) |
| 35 to 44 Years | 7 (2.0%) | 334 (94.4%) |
| 45 to 54 Years | 12 (1.7%) | 682 (99.0%) |
| 55 to 64 Years | 23 (5.3%) | 419 (97.4%) |
| 65 to 74 Years | 479 (85.7%) | 363 (64.9%) |
| 75 Years and over | 337 (93.1%) | 218 (60.2%) |
| Total | 919 (24.1%) | 3,422 (89.6%) |
Disability Status by Sex by Age in Loyola
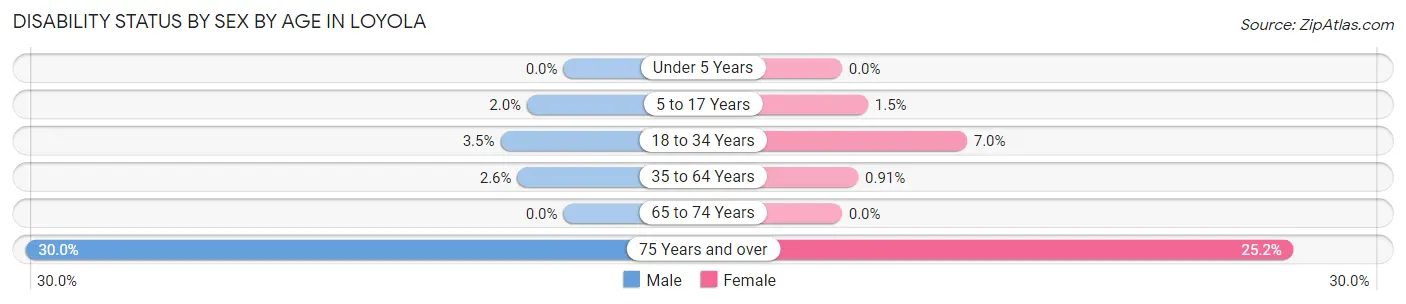
| Age Bracket | Male | Female |
| Under 5 Years | 0 (0.0%) | 0 (0.0%) |
| 5 to 17 Years | 10 (2.0%) | 6 (1.5%) |
| 18 to 34 Years | 6 (3.5%) | 11 (7.0%) |
| 35 to 64 Years | 18 (2.6%) | 7 (0.9%) |
| 65 to 74 Years | 0 (0.0%) | 0 (0.0%) |
| 75 Years and over | 62 (29.9%) | 39 (25.2%) |
Disability Class by Sex by Age in Loyola
Disability Class: Hearing Difficulty
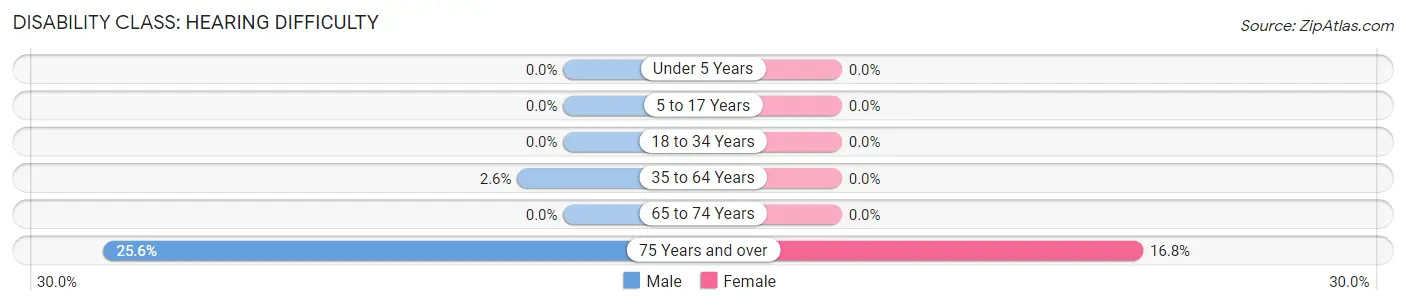
| Age Bracket | Male | Female |
| Under 5 Years | 0 (0.0%) | 0 (0.0%) |
| 5 to 17 Years | 0 (0.0%) | 0 (0.0%) |
| 18 to 34 Years | 0 (0.0%) | 0 (0.0%) |
| 35 to 64 Years | 18 (2.6%) | 0 (0.0%) |
| 65 to 74 Years | 0 (0.0%) | 0 (0.0%) |
| 75 Years and over | 53 (25.6%) | 26 (16.8%) |
Disability Class: Vision Difficulty
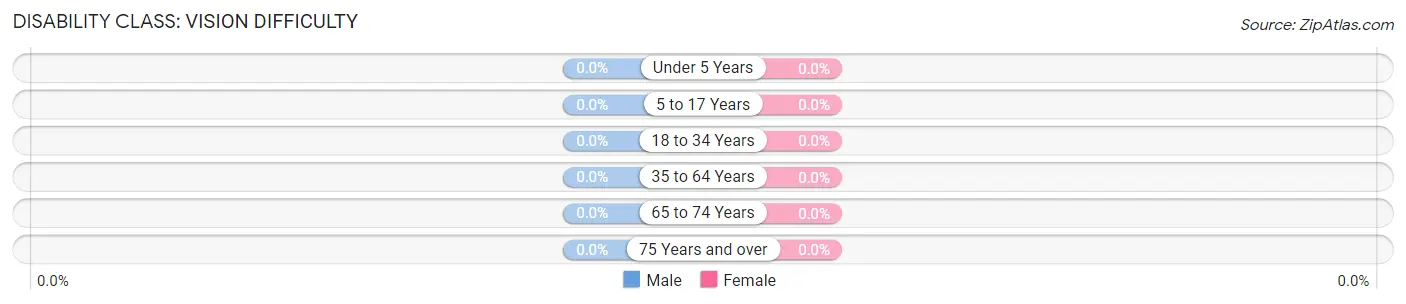
| Age Bracket | Male | Female |
| Under 5 Years | 0 (0.0%) | 0 (0.0%) |
| 5 to 17 Years | 0 (0.0%) | 0 (0.0%) |
| 18 to 34 Years | 0 (0.0%) | 0 (0.0%) |
| 35 to 64 Years | 0 (0.0%) | 0 (0.0%) |
| 65 to 74 Years | 0 (0.0%) | 0 (0.0%) |
| 75 Years and over | 0 (0.0%) | 0 (0.0%) |
Disability Class: Cognitive Difficulty
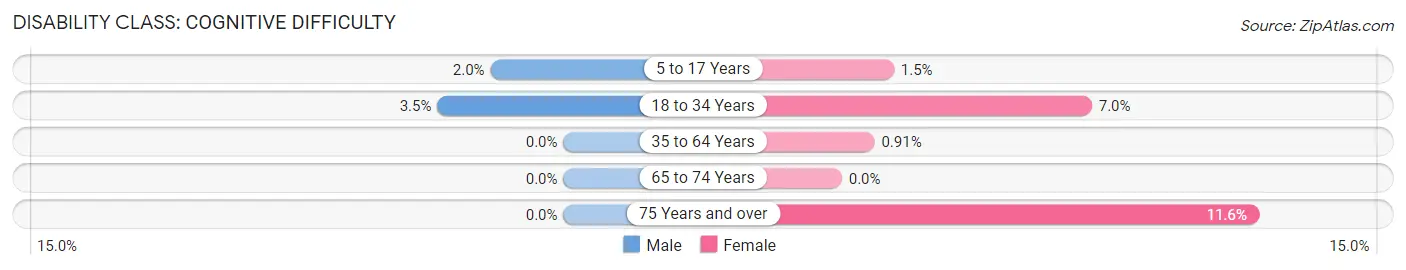
| Age Bracket | Male | Female |
| 5 to 17 Years | 10 (2.0%) | 6 (1.5%) |
| 18 to 34 Years | 6 (3.5%) | 11 (7.0%) |
| 35 to 64 Years | 0 (0.0%) | 7 (0.9%) |
| 65 to 74 Years | 0 (0.0%) | 0 (0.0%) |
| 75 Years and over | 0 (0.0%) | 18 (11.6%) |
Disability Class: Ambulatory Difficulty
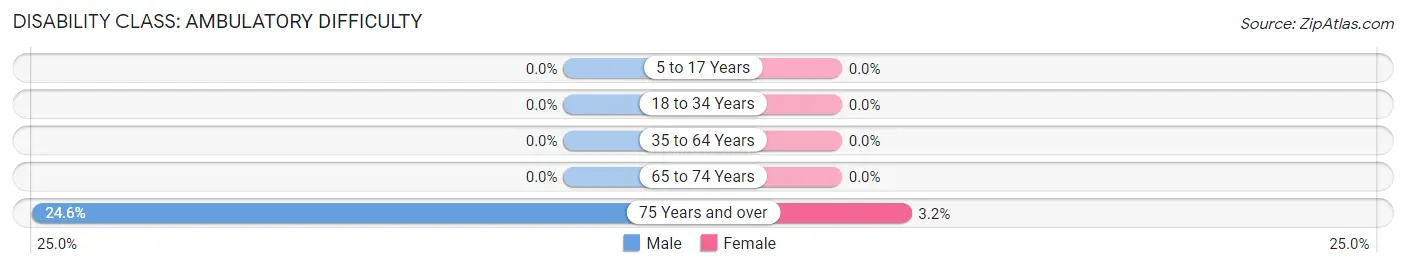
| Age Bracket | Male | Female |
| 5 to 17 Years | 0 (0.0%) | 0 (0.0%) |
| 18 to 34 Years | 0 (0.0%) | 0 (0.0%) |
| 35 to 64 Years | 0 (0.0%) | 0 (0.0%) |
| 65 to 74 Years | 0 (0.0%) | 0 (0.0%) |
| 75 Years and over | 51 (24.6%) | 5 (3.2%) |
Disability Class: Self-Care Difficulty
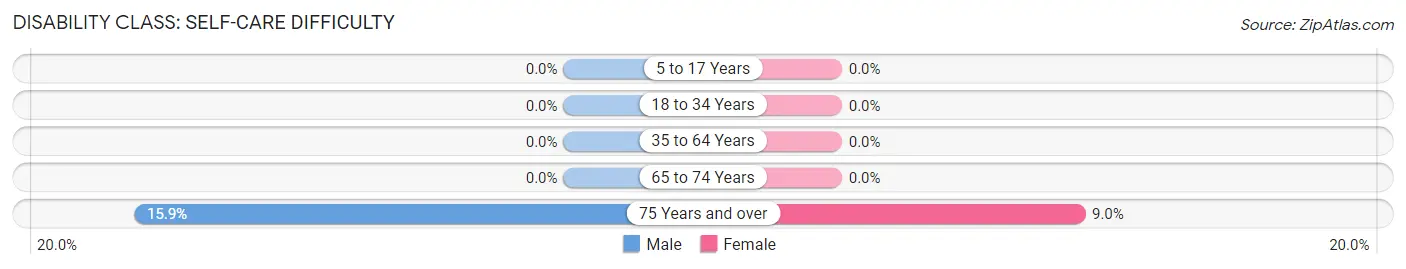
| Age Bracket | Male | Female |
| 5 to 17 Years | 0 (0.0%) | 0 (0.0%) |
| 18 to 34 Years | 0 (0.0%) | 0 (0.0%) |
| 35 to 64 Years | 0 (0.0%) | 0 (0.0%) |
| 65 to 74 Years | 0 (0.0%) | 0 (0.0%) |
| 75 Years and over | 33 (15.9%) | 14 (9.0%) |
Technology Access in Loyola
Computing Device Access in Loyola
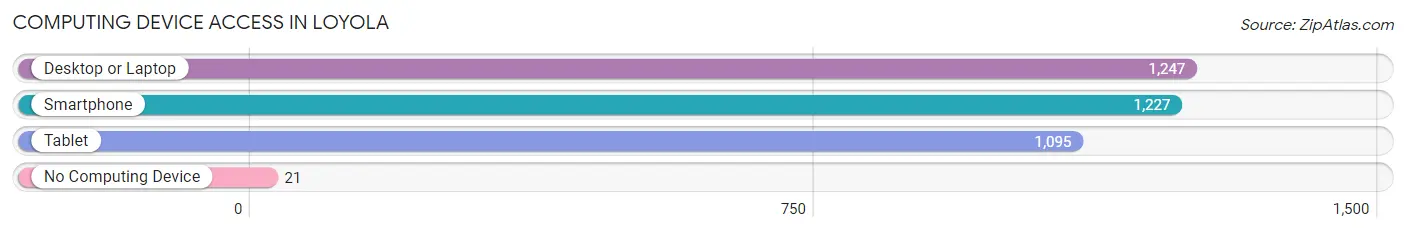
| Device Type | # Households | % Households |
| Desktop or Laptop | 1,247 | 98.3% |
| Smartphone | 1,227 | 96.8% |
| Tablet | 1,095 | 86.4% |
| No Computing Device | 21 | 1.7% |
| Total | 1,268 | 100.0% |
Internet Access in Loyola
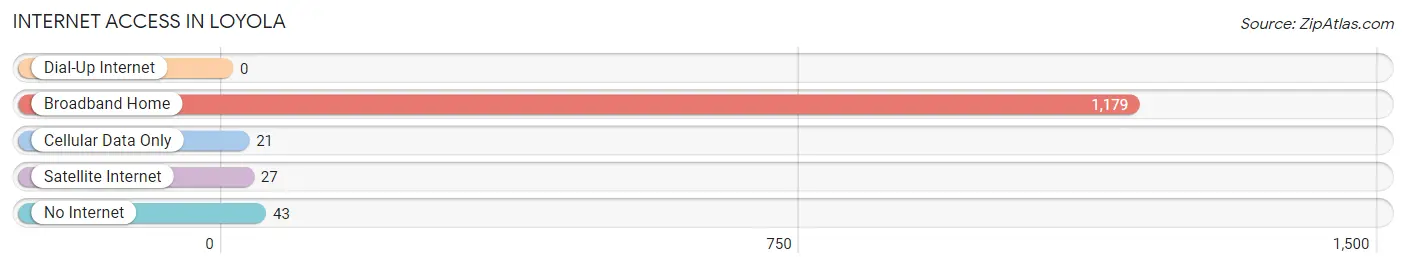
| Internet Type | # Households | % Households |
| Dial-Up Internet | 0 | 0.0% |
| Broadband Home | 1,179 | 93.0% |
| Cellular Data Only | 21 | 1.7% |
| Satellite Internet | 27 | 2.1% |
| No Internet | 43 | 3.4% |
| Total | 1,268 | 100.0% |
Loyola Summary
Loyola is a small unincorporated community located in Los Angeles County, California. It is situated in the San Gabriel Valley, approximately 20 miles east of downtown Los Angeles. The community is bordered by the cities of Monterey Park, Alhambra, and South Pasadena.
History
Loyola was founded in 1887 by Father John Asmuth, a Jesuit priest from Germany. He named the community after the Jesuit university in Rome, Italy, which was founded by St. Ignatius of Loyola. Father Asmuth purchased the land from the San Gabriel Mission and established a small Catholic school. The school was later renamed Loyola High School and is still in operation today.
In the early 1900s, the area began to develop as a residential community. Many of the homes were built in the Craftsman style, and the streets were lined with trees. The community was served by a trolley line that ran from downtown Los Angeles to Pasadena.
Geography
Loyola is located in the San Gabriel Valley, approximately 20 miles east of downtown Los Angeles. The community is bordered by the cities of Monterey Park, Alhambra, and South Pasadena. The area is characterized by rolling hills and is home to several parks, including Loyola Park and Loyola Marymount University.
Economy
Loyola is primarily a residential community, but it is also home to several businesses. The area is served by several small retail stores, restaurants, and professional services. The community is also home to Loyola Marymount University, which is a private Catholic university.
Demographics
As of the 2010 census, the population of Loyola was 8,945. The racial makeup of the community was 57.3% White, 22.2% Asian, 11.2% Hispanic or Latino, 8.2% African American, and 1.1% other. The median household income was $63,945, and the median home value was $717,000.
Conclusion
Loyola is a small unincorporated community located in Los Angeles County, California. It is situated in the San Gabriel Valley, approximately 20 miles east of downtown Los Angeles. The community is bordered by the cities of Monterey Park, Alhambra, and South Pasadena. Loyola was founded in 1887 by Father John Asmuth, a Jesuit priest from Germany. The area is primarily a residential community, but it is also home to several businesses. As of the 2010 census, the population of Loyola was 8,945. The racial makeup of the community was 57.3% White, 22.2% Asian, 11.2% Hispanic or Latino, 8.2% African American, and 1.1% other. The median household income was $63,945, and the median home value was $717,000.
Common Questions
What is Per Capita Income in Loyola?
Per Capita income in Loyola is $131,051.
What is the Median Family Income in Loyola?
Median Family Income in Loyola is $250,001.
What is the Median Household income in Loyola?
Median Household Income in Loyola is $250,001.
What is Income or Wage Gap in Loyola?
Income or Wage Gap in Loyola is 61.9%.
Women in Loyola earn 38.1 cents for every dollar earned by a man.
What is Inequality or Gini Index in Loyola?
Inequality or Gini Index in Loyola is 0.46.
What is the Total Population of Loyola?
Total Population of Loyola is 3,818.
What is the Total Male Population of Loyola?
Total Male Population of Loyola is 1,977.
What is the Total Female Population of Loyola?
Total Female Population of Loyola is 1,841.
What is the Ratio of Males per 100 Females in Loyola?
There are 107.39 Males per 100 Females in Loyola.
What is the Ratio of Females per 100 Males in Loyola?
There are 93.12 Females per 100 Males in Loyola.
What is the Median Population Age in Loyola?
Median Population Age in Loyola is 46.7 Years.
What is the Average Family Size in Loyola
Average Family Size in Loyola is 3.3 People.
What is the Average Household Size in Loyola
Average Household Size in Loyola is 3.0 People.
How Large is the Labor Force in Loyola?
There are 1,606 People in the Labor Forcein in Loyola.
What is the Percentage of People in the Labor Force in Loyola?
56.2% of People are in the Labor Force in Loyola.
What is the Unemployment Rate in Loyola?
Unemployment Rate in Loyola is 2.7%.