Bootjack, CA Map & Demographics
Bootjack Map
Bootjack Overview
$44,936
PER CAPITA INCOME
0.48
INEQUALITY / GINI INDEX
337
TOTAL POPULATION
126
MALE POPULATION
211
FEMALE POPULATION
59.72
MALES / 100 FEMALES
167.46
FEMALES / 100 MALES
53.8
MEDIAN AGE
2.6
AVG FAMILY SIZE
2.2
AVG HOUSEHOLD SIZE
186
LABOR FORCE [ PEOPLE ]
61.2%
PERCENT IN LABOR FORCE
2.7%
UNEMPLOYMENT RATE
Income in Bootjack
Income Overview in Bootjack
| Characteristic | Number | Measure |
| Per Capita Income | 337 | $44,936 |
| Median Family Income | 105 | $0 |
| Mean Family Income | 105 | $125,953 |
| Median Household Income | 152 | $0 |
| Mean Household Income | 152 | $101,453 |
| Income Deficit | 105 | $0 |
| Wage / Income Gap (%) | 337 | 0.00% |
| Wage / Income Gap ($) | 337 | 100.00¢ per $1 |
| Gini / Inequality Index | 337 | 0.48 |
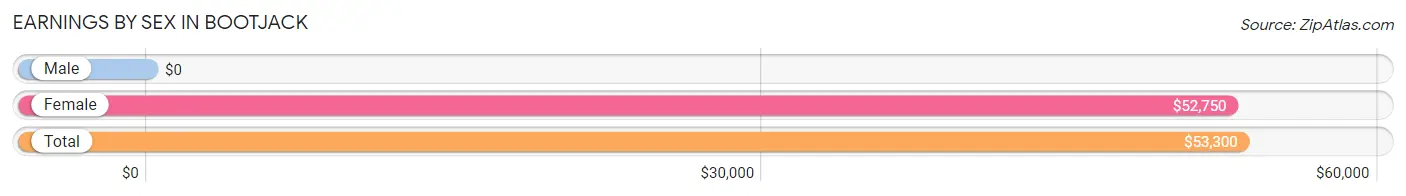
Earnings by Sex in Bootjack
| Sex | Number | Average Earnings |
| Male | 83 (43.2%) | $0 |
| Female | 109 (56.8%) | $52,750 |
| Total | 192 (100.0%) | $53,300 |
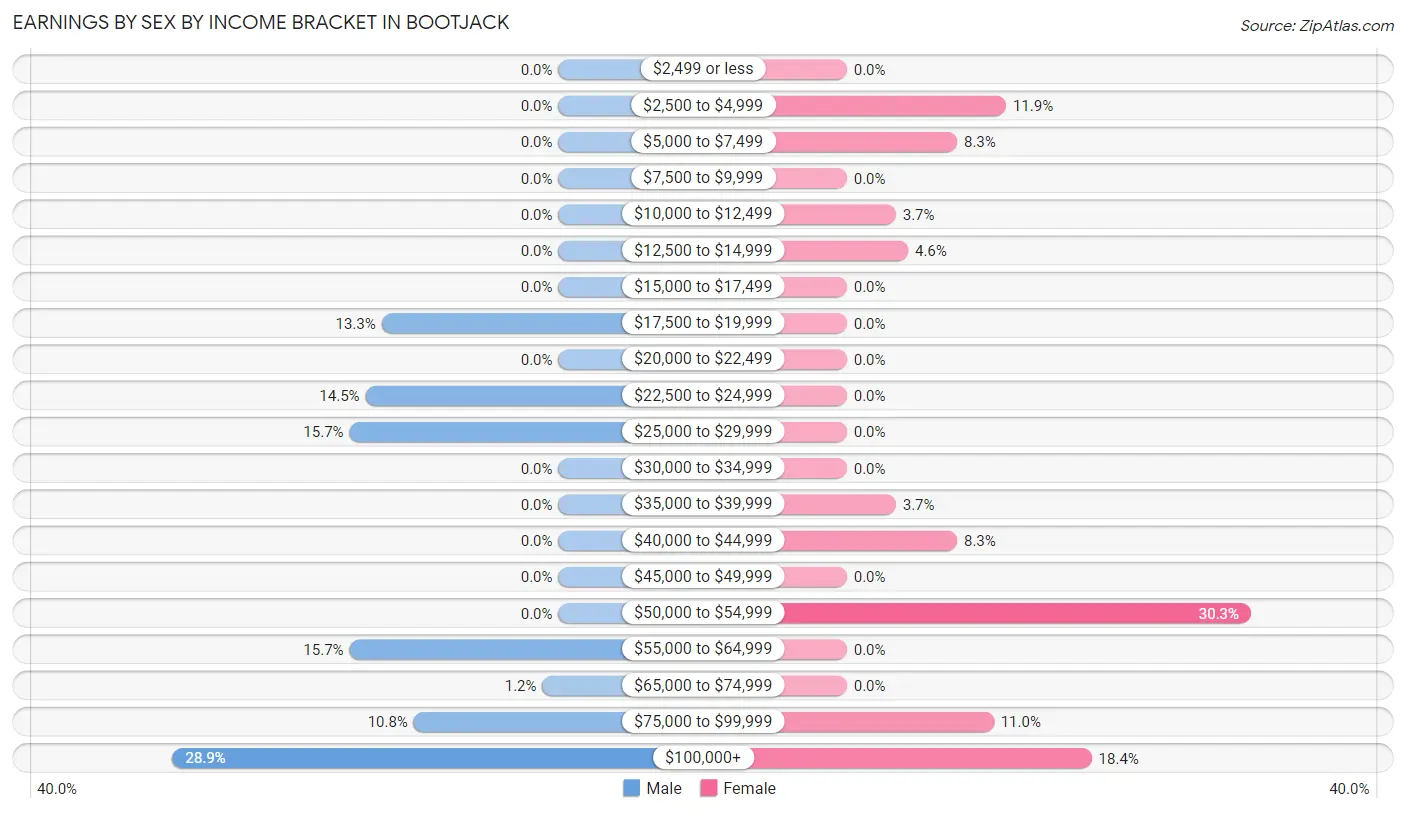
Earnings by Sex by Income Bracket in Bootjack
The most common earnings brackets in Bootjack are $100,000+ for men (24 | 28.9%) and $50,000 to $54,999 for women (33 | 30.3%).
| Income | Male | Female |
| $2,499 or less | 0 (0.0%) | 0 (0.0%) |
| $2,500 to $4,999 | 0 (0.0%) | 13 (11.9%) |
| $5,000 to $7,499 | 0 (0.0%) | 9 (8.3%) |
| $7,500 to $9,999 | 0 (0.0%) | 0 (0.0%) |
| $10,000 to $12,499 | 0 (0.0%) | 4 (3.7%) |
| $12,500 to $14,999 | 0 (0.0%) | 5 (4.6%) |
| $15,000 to $17,499 | 0 (0.0%) | 0 (0.0%) |
| $17,500 to $19,999 | 11 (13.3%) | 0 (0.0%) |
| $20,000 to $22,499 | 0 (0.0%) | 0 (0.0%) |
| $22,500 to $24,999 | 12 (14.5%) | 0 (0.0%) |
| $25,000 to $29,999 | 13 (15.7%) | 0 (0.0%) |
| $30,000 to $34,999 | 0 (0.0%) | 0 (0.0%) |
| $35,000 to $39,999 | 0 (0.0%) | 4 (3.7%) |
| $40,000 to $44,999 | 0 (0.0%) | 9 (8.3%) |
| $45,000 to $49,999 | 0 (0.0%) | 0 (0.0%) |
| $50,000 to $54,999 | 0 (0.0%) | 33 (30.3%) |
| $55,000 to $64,999 | 13 (15.7%) | 0 (0.0%) |
| $65,000 to $74,999 | 1 (1.2%) | 0 (0.0%) |
| $75,000 to $99,999 | 9 (10.8%) | 12 (11.0%) |
| $100,000+ | 24 (28.9%) | 20 (18.3%) |
| Total | 83 (100.0%) | 109 (100.0%) |
Earnings by Sex by Educational Attainment in Bootjack
| Educational Attainment | Male Income | Female Income |
| Less than High School | - | - |
| High School Diploma | - | - |
| College or Associate's Degree | - | - |
| Bachelor's Degree | - | - |
| Graduate Degree | - | - |
| Total | - | - |
Family Income in Bootjack
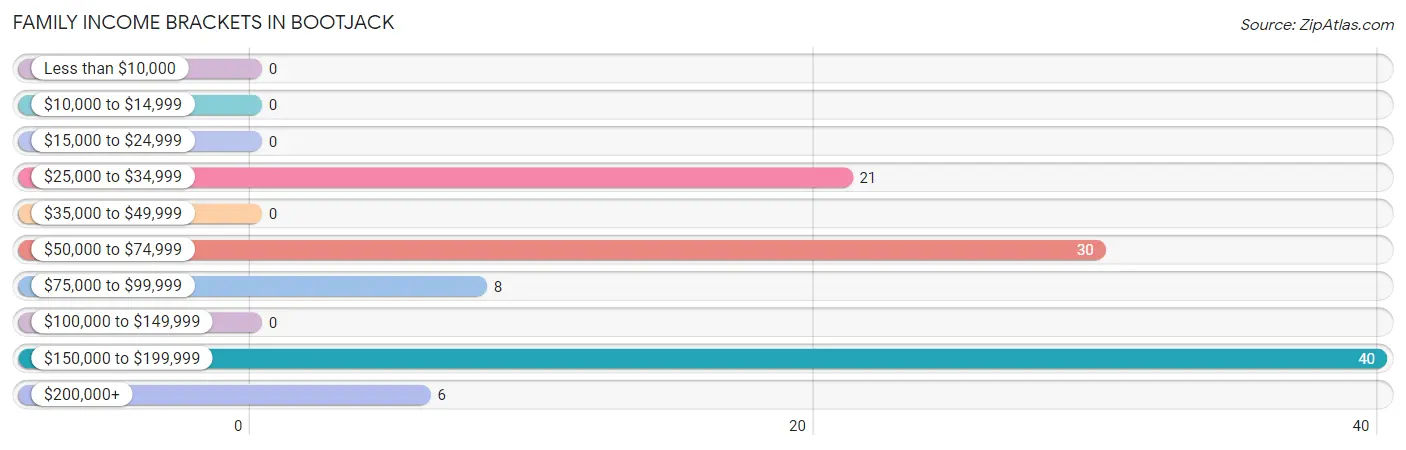
Family Income Brackets in Bootjack
According to the Bootjack family income data, there are 40 families falling into the $150,000 to $199,999 income range, which is the most common income bracket and makes up 38.1% of all families.
| Income Bracket | # Families | % Families |
| Less than $10,000 | 0 | 0.0% |
| $10,000 to $14,999 | 0 | 0.0% |
| $15,000 to $24,999 | 0 | 0.0% |
| $25,000 to $34,999 | 21 | 20.0% |
| $35,000 to $49,999 | 0 | 0.0% |
| $50,000 to $74,999 | 30 | 28.6% |
| $75,000 to $99,999 | 8 | 7.6% |
| $100,000 to $149,999 | 0 | 0.0% |
| $150,000 to $199,999 | 40 | 38.1% |
| $200,000+ | 6 | 5.7% |
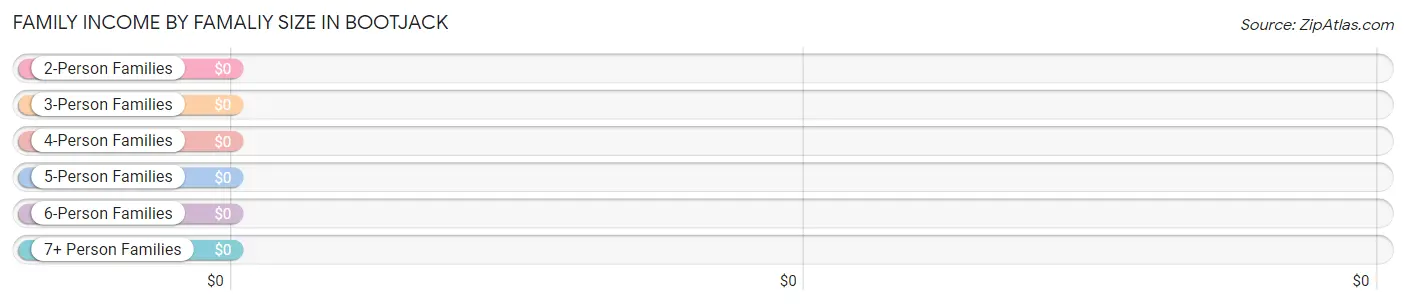
Family Income by Famaliy Size in Bootjack
| Income Bracket | # Families | Median Income |
| 2-Person Families | 71 (67.6%) | $0 |
| 3-Person Families | 6 (5.7%) | $0 |
| 4-Person Families | 8 (7.6%) | $0 |
| 5-Person Families | 20 (19.1%) | $0 |
| 6-Person Families | 0 (0.0%) | $0 |
| 7+ Person Families | 0 (0.0%) | $0 |
| Total | 105 (100.0%) | $0 |
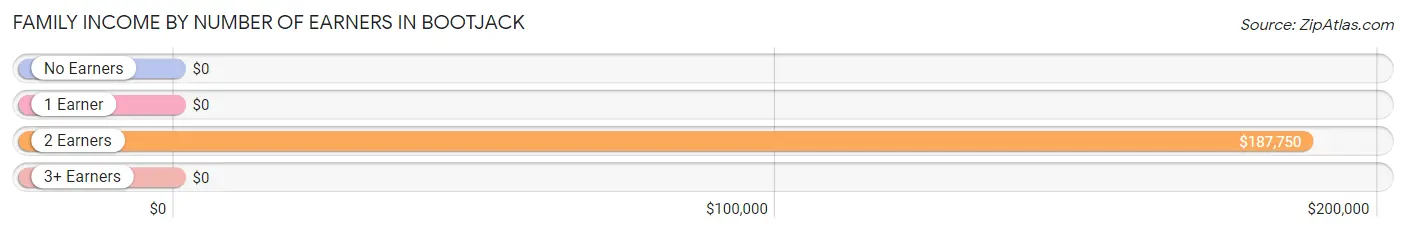
Family Income by Number of Earners in Bootjack
| Number of Earners | # Families | Median Income |
| No Earners | 8 (7.6%) | $0 |
| 1 Earner | 25 (23.8%) | $0 |
| 2 Earners | 72 (68.6%) | $187,750 |
| 3+ Earners | 0 (0.0%) | $0 |
| Total | 105 (100.0%) | $0 |
Household Income in Bootjack
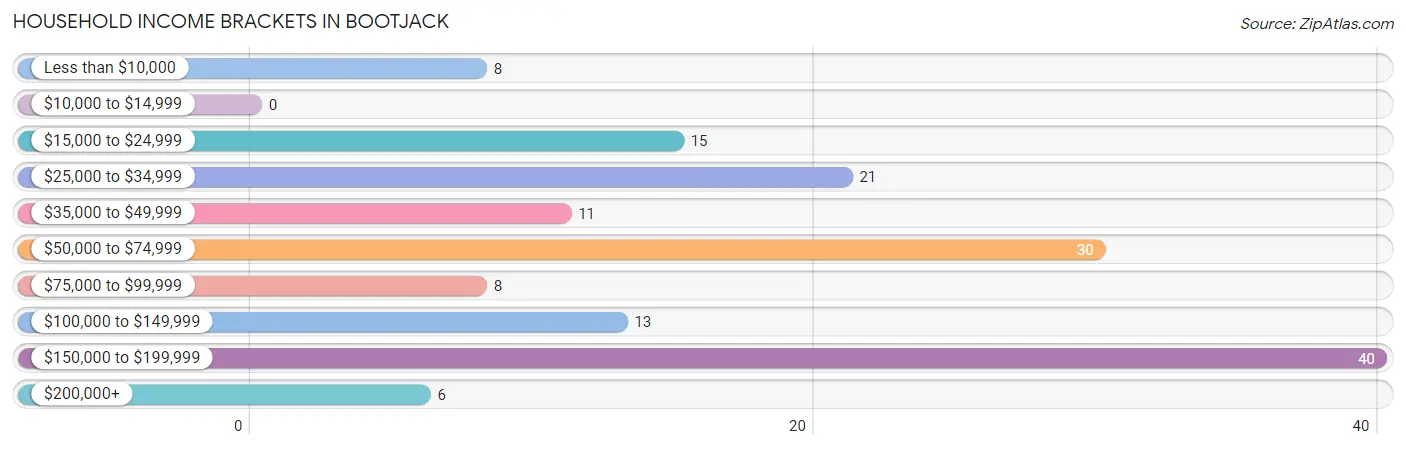
Household Income Brackets in Bootjack
With 40 households falling in the category, the $150,000 to $199,999 income range is the most frequent in Bootjack, accounting for 26.3% of all households.
| Income Bracket | # Households | % Households |
| Less than $10,000 | 8 | 5.3% |
| $10,000 to $14,999 | 0 | 0.0% |
| $15,000 to $24,999 | 15 | 9.9% |
| $25,000 to $34,999 | 21 | 13.8% |
| $35,000 to $49,999 | 11 | 7.2% |
| $50,000 to $74,999 | 30 | 19.7% |
| $75,000 to $99,999 | 8 | 5.3% |
| $100,000 to $149,999 | 13 | 8.6% |
| $150,000 to $199,999 | 40 | 26.3% |
| $200,000+ | 6 | 3.9% |
Household Income by Householder Age in Bootjack
The median household income in Bootjack is $0, with the highest median household income of $78,125 found in the 45 to 64 years age bracket for the primary householder. A total of 106 households (69.7%) fall into this category.
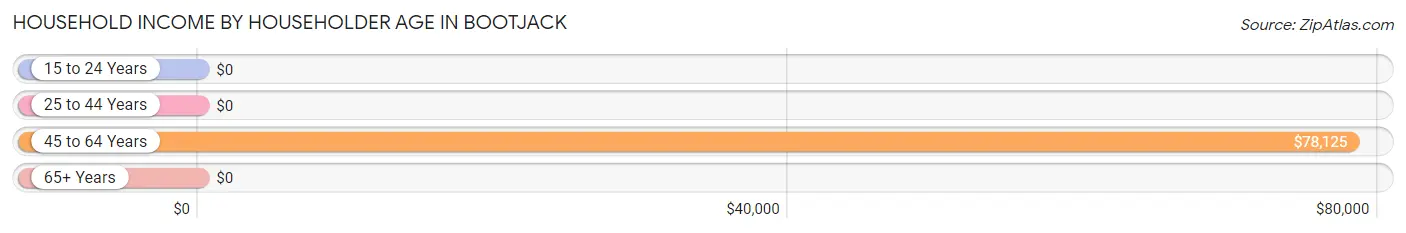
| Income Bracket | # Households | Median Income |
| 15 to 24 Years | 0 (0.0%) | $0 |
| 25 to 44 Years | 20 (13.2%) | $0 |
| 45 to 64 Years | 106 (69.7%) | $78,125 |
| 65+ Years | 26 (17.1%) | $0 |
| Total | 152 (100.0%) | $0 |
Poverty in Bootjack
Income Below Poverty by Sex and Age in Bootjack
With 2.4% poverty level for males and 3.8% for females among the residents of Bootjack, 65 to 74 year old males and 65 to 74 year old females are the most vulnerable to poverty, with 3 males (23.1%) and 8 females (53.3%) in their respective age groups living below the poverty level.
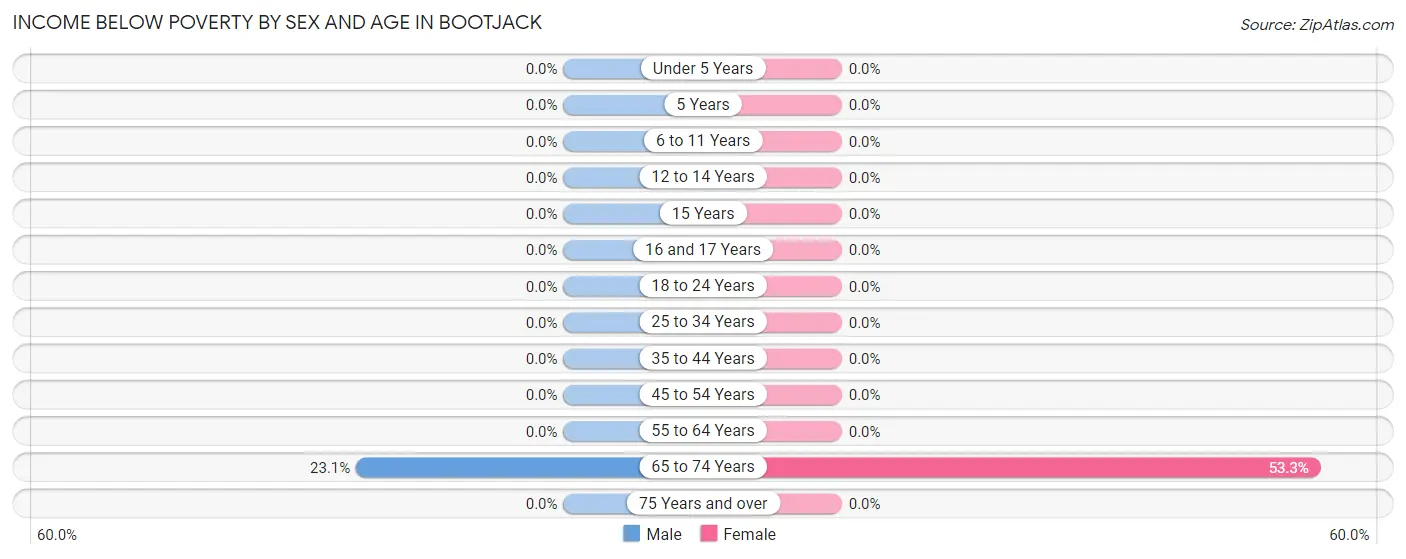
| Age Bracket | Male | Female |
| Under 5 Years | 0 (0.0%) | 0 (0.0%) |
| 5 Years | 0 (0.0%) | 0 (0.0%) |
| 6 to 11 Years | 0 (0.0%) | 0 (0.0%) |
| 12 to 14 Years | 0 (0.0%) | 0 (0.0%) |
| 15 Years | 0 (0.0%) | 0 (0.0%) |
| 16 and 17 Years | 0 (0.0%) | 0 (0.0%) |
| 18 to 24 Years | 0 (0.0%) | 0 (0.0%) |
| 25 to 34 Years | 0 (0.0%) | 0 (0.0%) |
| 35 to 44 Years | 0 (0.0%) | 0 (0.0%) |
| 45 to 54 Years | 0 (0.0%) | 0 (0.0%) |
| 55 to 64 Years | 0 (0.0%) | 0 (0.0%) |
| 65 to 74 Years | 3 (23.1%) | 8 (53.3%) |
| 75 Years and over | 0 (0.0%) | 0 (0.0%) |
| Total | 3 (2.4%) | 8 (3.8%) |
Income Above Poverty by Sex and Age in Bootjack
According to the poverty statistics in Bootjack, males aged 6 to 11 years and females aged under 5 years are the age groups that are most secure financially, with 100.0% of males and 100.0% of females in these age groups living above the poverty line.
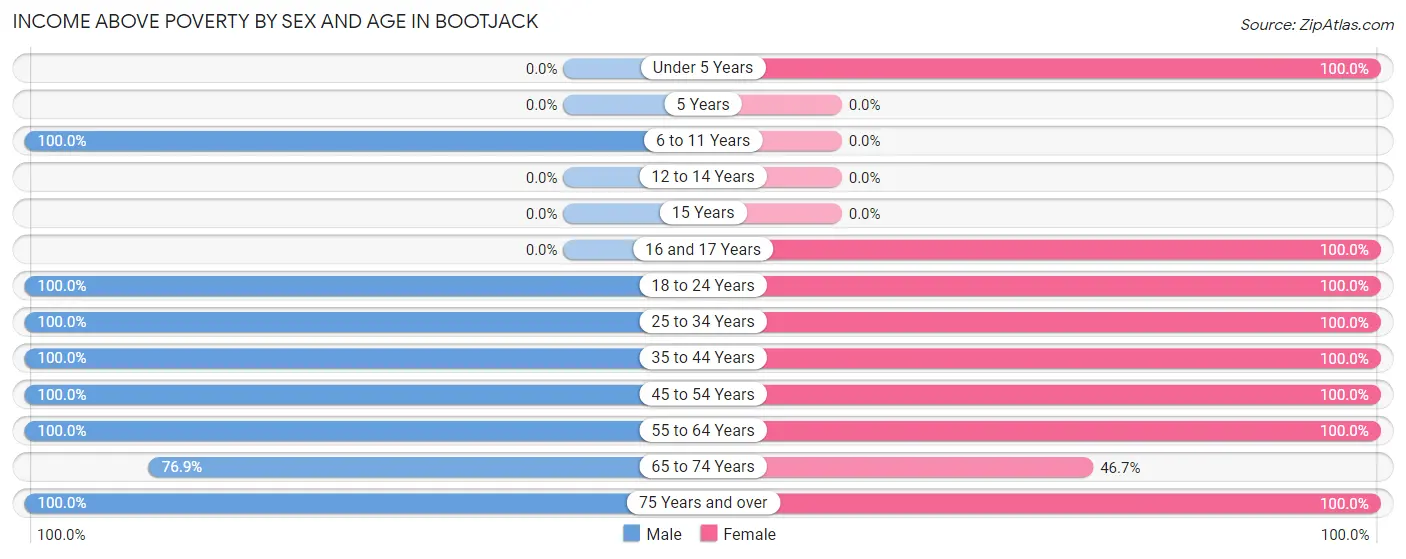
| Age Bracket | Male | Female |
| Under 5 Years | 0 (0.0%) | 14 (100.0%) |
| 5 Years | 0 (0.0%) | 0 (0.0%) |
| 6 to 11 Years | 19 (100.0%) | 0 (0.0%) |
| 12 to 14 Years | 0 (0.0%) | 0 (0.0%) |
| 15 Years | 0 (0.0%) | 0 (0.0%) |
| 16 and 17 Years | 0 (0.0%) | 46 (100.0%) |
| 18 to 24 Years | 4 (100.0%) | 10 (100.0%) |
| 25 to 34 Years | 17 (100.0%) | 4 (100.0%) |
| 35 to 44 Years | 8 (100.0%) | 21 (100.0%) |
| 45 to 54 Years | 22 (100.0%) | 30 (100.0%) |
| 55 to 64 Years | 40 (100.0%) | 56 (100.0%) |
| 65 to 74 Years | 10 (76.9%) | 7 (46.7%) |
| 75 Years and over | 3 (100.0%) | 15 (100.0%) |
| Total | 123 (97.6%) | 203 (96.2%) |
Income Below Poverty Among Married-Couple Families in Bootjack
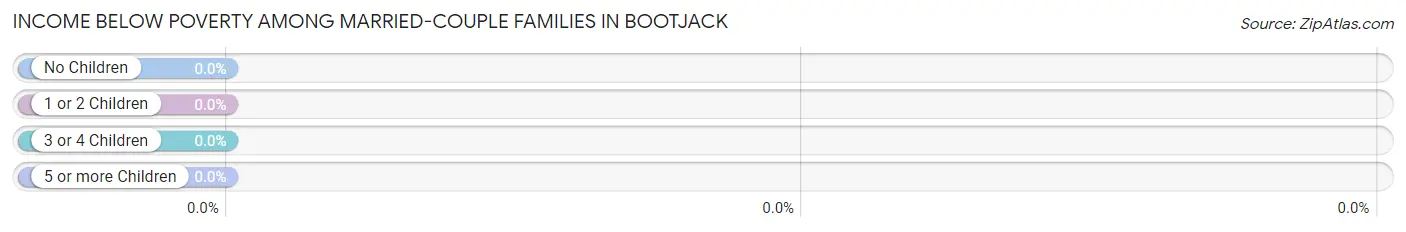
| Children | Above Poverty | Below Poverty |
| No Children | 42 (100.0%) | 0 (0.0%) |
| 1 or 2 Children | 8 (100.0%) | 0 (0.0%) |
| 3 or 4 Children | 12 (100.0%) | 0 (0.0%) |
| 5 or more Children | 0 (0.0%) | 0 (0.0%) |
| Total | 62 (100.0%) | 0 (0.0%) |
Income Below Poverty Among Single-Parent Households in Bootjack
| Children | Single Father | Single Mother |
| No Children | 0 (0.0%) | 0 (0.0%) |
| 1 or 2 Children | 0 (0.0%) | 0 (0.0%) |
| 3 or 4 Children | 0 (0.0%) | 0 (0.0%) |
| 5 or more Children | 0 (0.0%) | 0 (0.0%) |
| Total | 0 (0.0%) | 0 (0.0%) |
Income Below Poverty Among Married-Couple vs Single-Parent Households in Bootjack
| Children | Married-Couple Families | Single-Parent Households |
| No Children | 0 (0.0%) | 0 (0.0%) |
| 1 or 2 Children | 0 (0.0%) | 0 (0.0%) |
| 3 or 4 Children | 0 (0.0%) | 0 (0.0%) |
| 5 or more Children | 0 (0.0%) | 0 (0.0%) |
| Total | 0 (0.0%) | 0 (0.0%) |
Race in Bootjack
The most populous races in Bootjack are White / Caucasian (320 | 95.0%), Hispanic or Latino (17 | 5.0%), and Some other Race (12 | 3.6%).
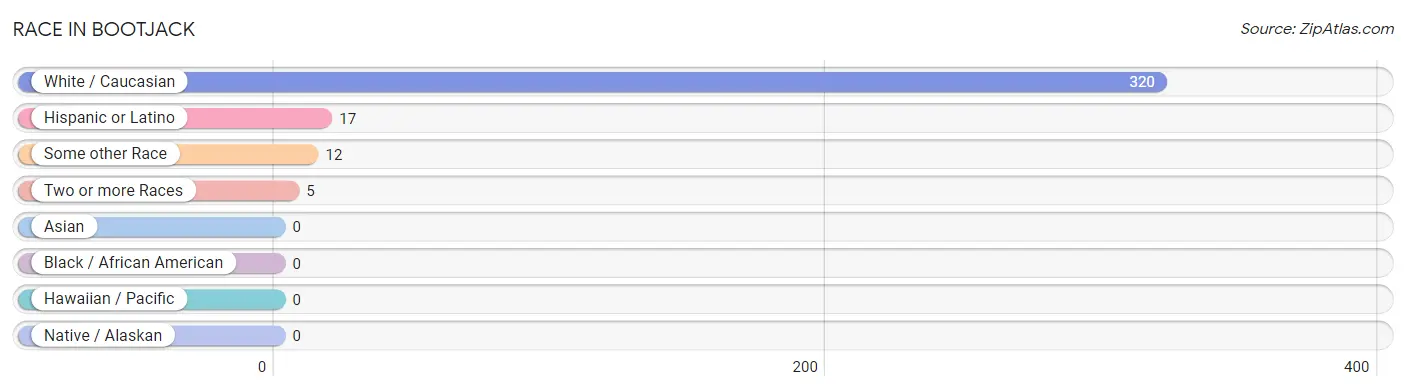
| Race | # Population | % Population |
| Asian | 0 | 0.0% |
| Black / African American | 0 | 0.0% |
| Hawaiian / Pacific | 0 | 0.0% |
| Hispanic or Latino | 17 | 5.0% |
| Native / Alaskan | 0 | 0.0% |
| White / Caucasian | 320 | 95.0% |
| Two or more Races | 5 | 1.5% |
| Some other Race | 12 | 3.6% |
| Total | 337 | 100.0% |
Ancestry in Bootjack
The most populous ancestries reported in Bootjack are Irish (90 | 26.7%), French (79 | 23.4%), American (69 | 20.5%), English (63 | 18.7%), and German (43 | 12.8%), together accounting for 102.1% of all Bootjack residents.
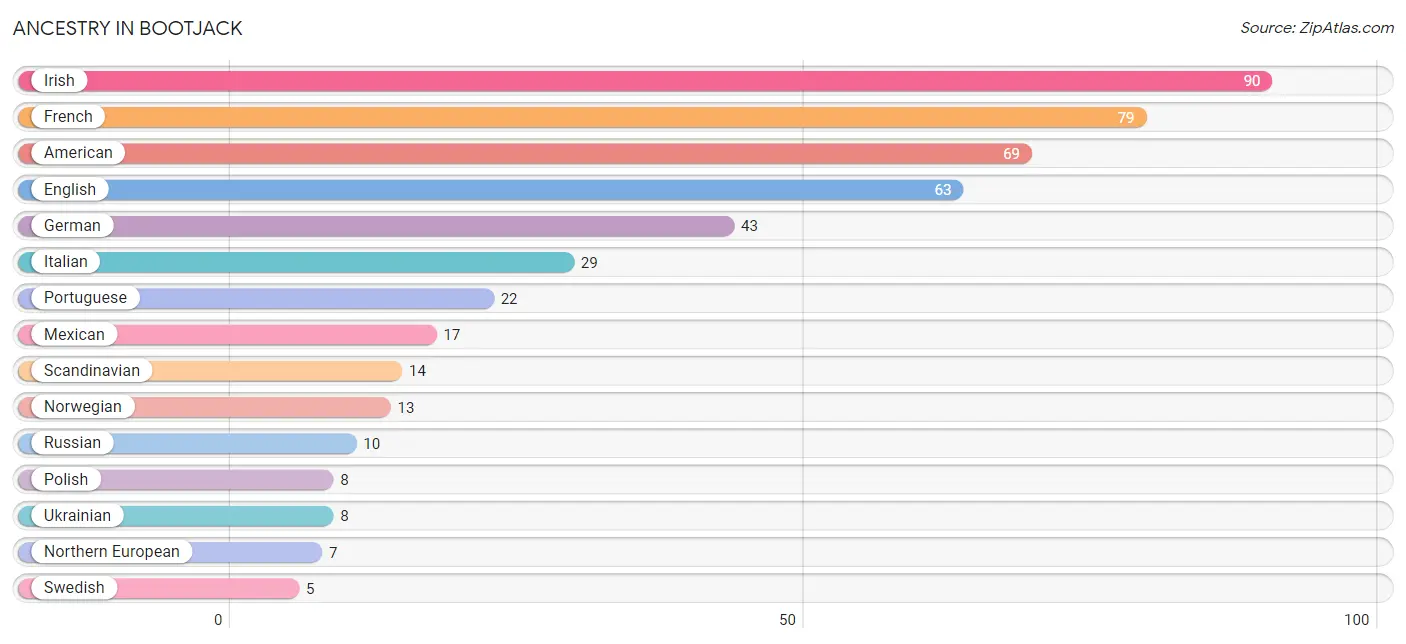
| Ancestry | # Population | % Population |
| American | 69 | 20.5% |
| English | 63 | 18.7% |
| European | 4 | 1.2% |
| French | 79 | 23.4% |
| German | 43 | 12.8% |
| Irish | 90 | 26.7% |
| Italian | 29 | 8.6% |
| Mexican | 17 | 5.0% |
| Northern European | 7 | 2.1% |
| Norwegian | 13 | 3.9% |
| Polish | 8 | 2.4% |
| Portuguese | 22 | 6.5% |
| Russian | 10 | 3.0% |
| Scandinavian | 14 | 4.2% |
| Swedish | 5 | 1.5% |
| Ukrainian | 8 | 2.4% | View All 16 Rows |
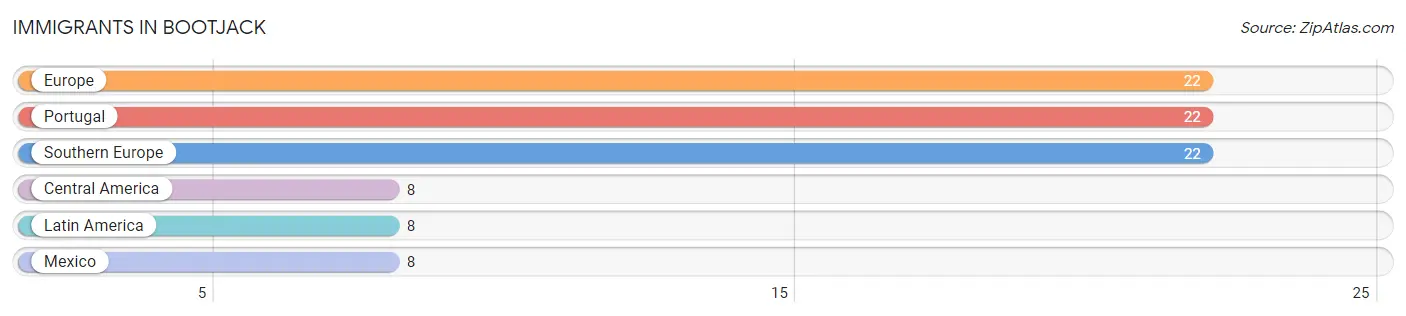
Immigrants in Bootjack
The most numerous immigrant groups reported in Bootjack came from Europe (22 | 6.5%), Portugal (22 | 6.5%), Southern Europe (22 | 6.5%), Central America (8 | 2.4%), and Latin America (8 | 2.4%), together accounting for 24.3% of all Bootjack residents.
| Immigration Origin | # Population | % Population |
| Central America | 8 | 2.4% |
| Europe | 22 | 6.5% |
| Latin America | 8 | 2.4% |
| Mexico | 8 | 2.4% |
| Portugal | 22 | 6.5% |
| Southern Europe | 22 | 6.5% | View All 6 Rows |
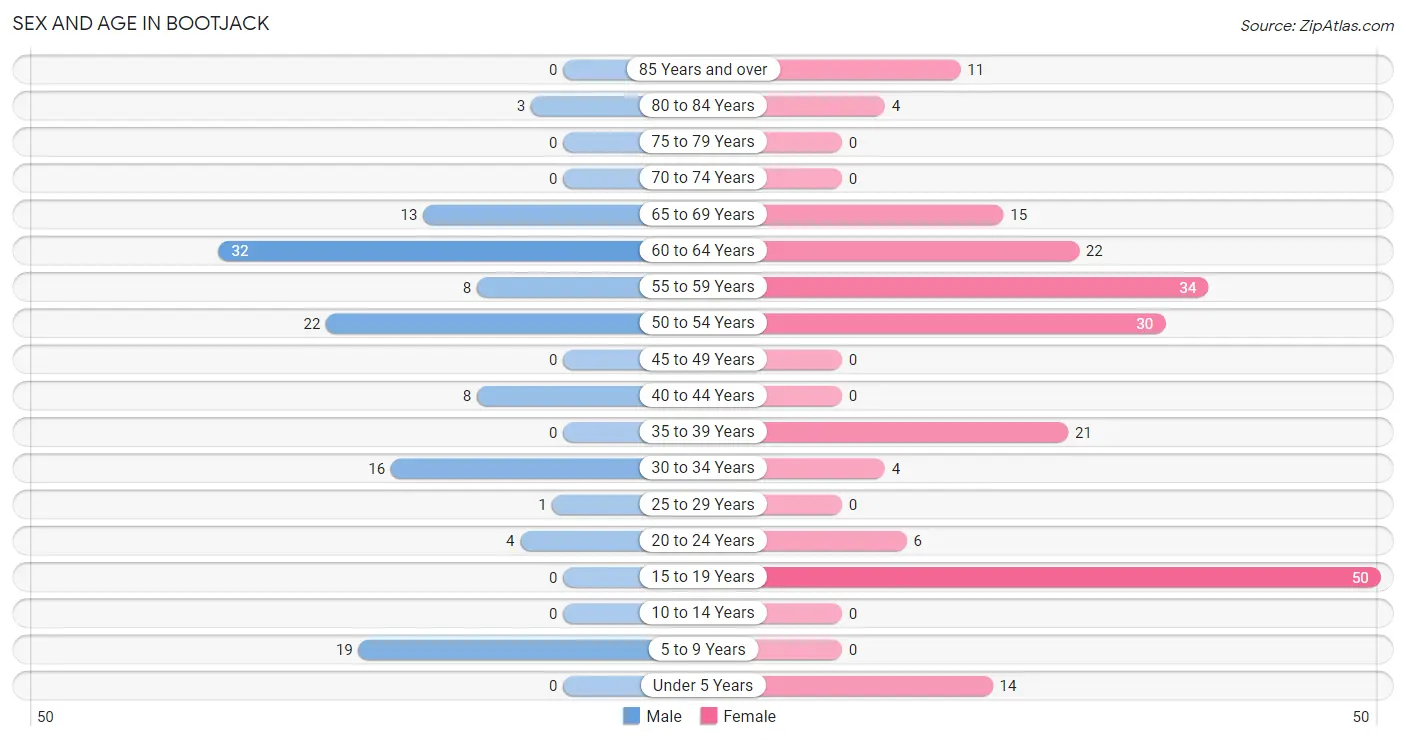
Sex and Age in Bootjack
Sex and Age in Bootjack
The most populous age groups in Bootjack are 60 to 64 Years (32 | 25.4%) for men and 15 to 19 Years (50 | 23.7%) for women.
| Age Bracket | Male | Female |
| Under 5 Years | 0 (0.0%) | 14 (6.6%) |
| 5 to 9 Years | 19 (15.1%) | 0 (0.0%) |
| 10 to 14 Years | 0 (0.0%) | 0 (0.0%) |
| 15 to 19 Years | 0 (0.0%) | 50 (23.7%) |
| 20 to 24 Years | 4 (3.2%) | 6 (2.8%) |
| 25 to 29 Years | 1 (0.8%) | 0 (0.0%) |
| 30 to 34 Years | 16 (12.7%) | 4 (1.9%) |
| 35 to 39 Years | 0 (0.0%) | 21 (10.0%) |
| 40 to 44 Years | 8 (6.4%) | 0 (0.0%) |
| 45 to 49 Years | 0 (0.0%) | 0 (0.0%) |
| 50 to 54 Years | 22 (17.5%) | 30 (14.2%) |
| 55 to 59 Years | 8 (6.4%) | 34 (16.1%) |
| 60 to 64 Years | 32 (25.4%) | 22 (10.4%) |
| 65 to 69 Years | 13 (10.3%) | 15 (7.1%) |
| 70 to 74 Years | 0 (0.0%) | 0 (0.0%) |
| 75 to 79 Years | 0 (0.0%) | 0 (0.0%) |
| 80 to 84 Years | 3 (2.4%) | 4 (1.9%) |
| 85 Years and over | 0 (0.0%) | 11 (5.2%) |
| Total | 126 (100.0%) | 211 (100.0%) |
Families and Households in Bootjack
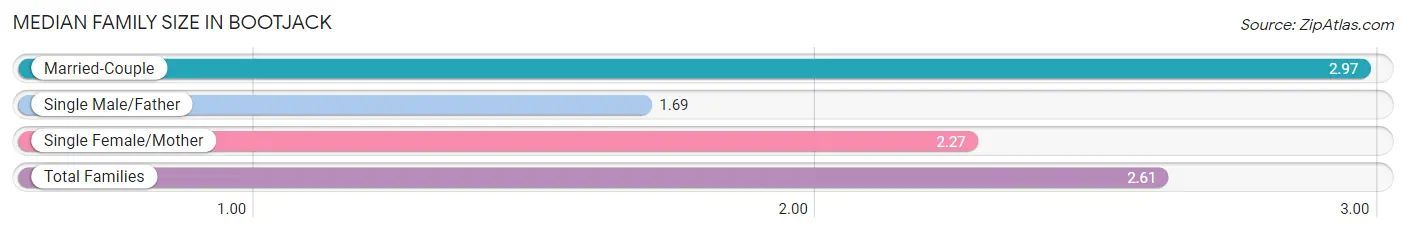
Median Family Size in Bootjack
The median family size in Bootjack is 2.61 persons per family, with married-couple families (62 | 59.1%) accounting for the largest median family size of 2.97 persons per family. On the other hand, single male/father families (13 | 12.4%) represent the smallest median family size with 1.69 persons per family.
| Family Type | # Families | Family Size |
| Married-Couple | 62 (59.1%) | 2.97 |
| Single Male/Father | 13 (12.4%) | 1.69 |
| Single Female/Mother | 30 (28.6%) | 2.27 |
| Total Families | 105 (100.0%) | 2.61 |
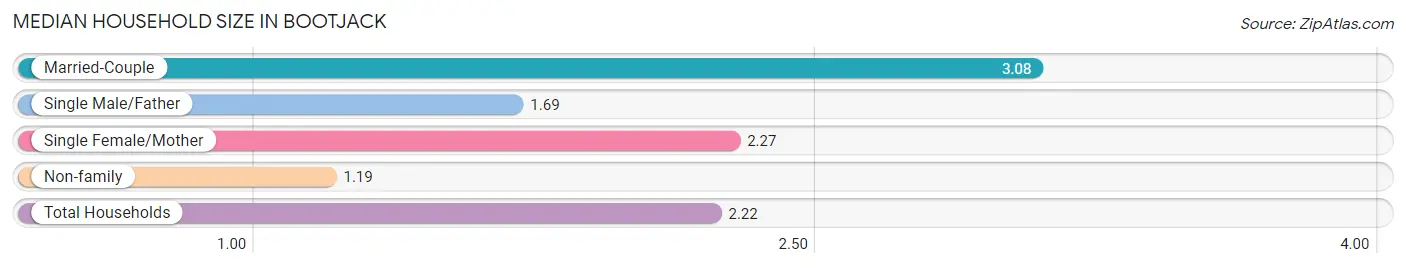
Median Household Size in Bootjack
The median household size in Bootjack is 2.22 persons per household, with married-couple households (62 | 40.8%) accounting for the largest median household size of 3.08 persons per household. non-family households (47 | 30.9%) represent the smallest median household size with 1.19 persons per household.
| Household Type | # Households | Household Size |
| Married-Couple | 62 (40.8%) | 3.08 |
| Single Male/Father | 13 (8.6%) | 1.69 |
| Single Female/Mother | 30 (19.7%) | 2.27 |
| Non-family | 47 (30.9%) | 1.19 |
| Total Households | 152 (100.0%) | 2.22 |
Household Size by Marriage Status in Bootjack
Out of a total of 152 households in Bootjack, 105 (69.1%) are family households, while 47 (30.9%) are nonfamily households. The most numerous type of family households are 2-person households, comprising 71, and the most common type of nonfamily households are 1-person households, comprising 34.
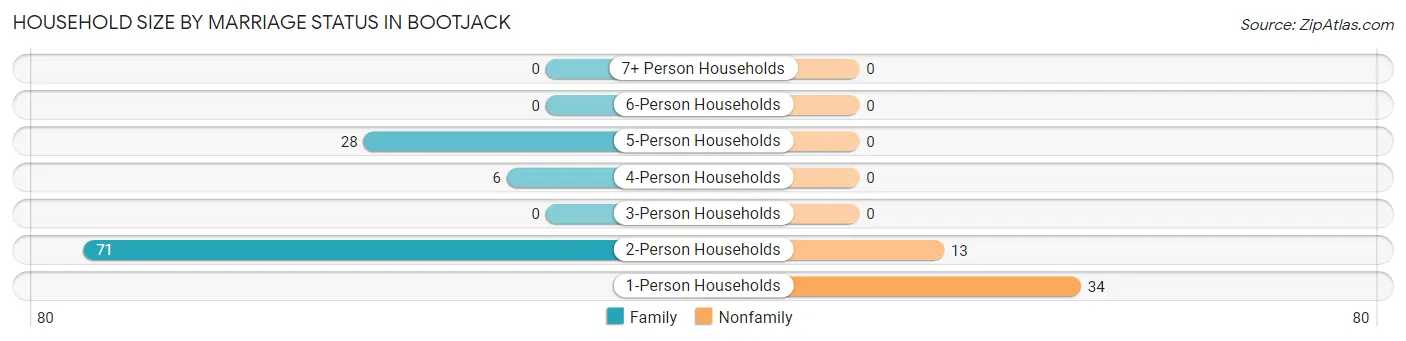
| Household Size | Family Households | Nonfamily Households |
| 1-Person Households | - | 34 (22.4%) |
| 2-Person Households | 71 (46.7%) | 13 (8.6%) |
| 3-Person Households | 0 (0.0%) | 0 (0.0%) |
| 4-Person Households | 6 (4.0%) | 0 (0.0%) |
| 5-Person Households | 28 (18.4%) | 0 (0.0%) |
| 6-Person Households | 0 (0.0%) | 0 (0.0%) |
| 7+ Person Households | 0 (0.0%) | 0 (0.0%) |
| Total | 105 (69.1%) | 47 (30.9%) |
Female Fertility in Bootjack
Fertility by Age in Bootjack
| Age Bracket | Women with Births | Births / 1,000 Women |
| 15 to 19 years | 0 (0.0%) | 0.0 |
| 20 to 34 years | 0 (0.0%) | 0.0 |
| 35 to 50 years | 0 (0.0%) | 0.0 |
| Total | 0 (0.0%) | 0.0 |
Fertility by Age by Marriage Status in Bootjack
| Age Bracket | Married | Unmarried |
| 15 to 19 years | 0 (0.0%) | 0 (0.0%) |
| 20 to 34 years | 0 (0.0%) | 0 (0.0%) |
| 35 to 50 years | 0 (0.0%) | 0 (0.0%) |
| Total | 0 (0.0%) | 0 (0.0%) |
Fertility by Education in Bootjack
| Educational Attainment | Women with Births | Births / 1,000 Women |
| Less than High School | 0 (0.0%) | 0.0 |
| High School Diploma | 0 (0.0%) | 0.0 |
| College or Associate's Degree | 0 (0.0%) | 0.0 |
| Bachelor's Degree | 0 (0.0%) | 0.0 |
| Graduate Degree | 0 (0.0%) | 0.0 |
| Total | 0 (0.0%) | 0.0 |
Fertility by Education by Marriage Status in Bootjack
| Educational Attainment | Married | Unmarried |
| Less than High School | 0 (0.0%) | 0 (0.0%) |
| High School Diploma | 0 (0.0%) | 0 (0.0%) |
| College or Associate's Degree | 0 (0.0%) | 0 (0.0%) |
| Bachelor's Degree | 0 (0.0%) | 0 (0.0%) |
| Graduate Degree | 0 (0.0%) | 0 (0.0%) |
| Total | 0 (0.0%) | 0 (0.0%) |
Employment Characteristics in Bootjack
Employment by Class of Employer in Bootjack
Among the 181 employed individuals in Bootjack, private company employees (92 | 50.8%), self-employed (not incorporated) (49 | 27.1%), and local government employees (36 | 19.9%) make up the most common classes of employment.
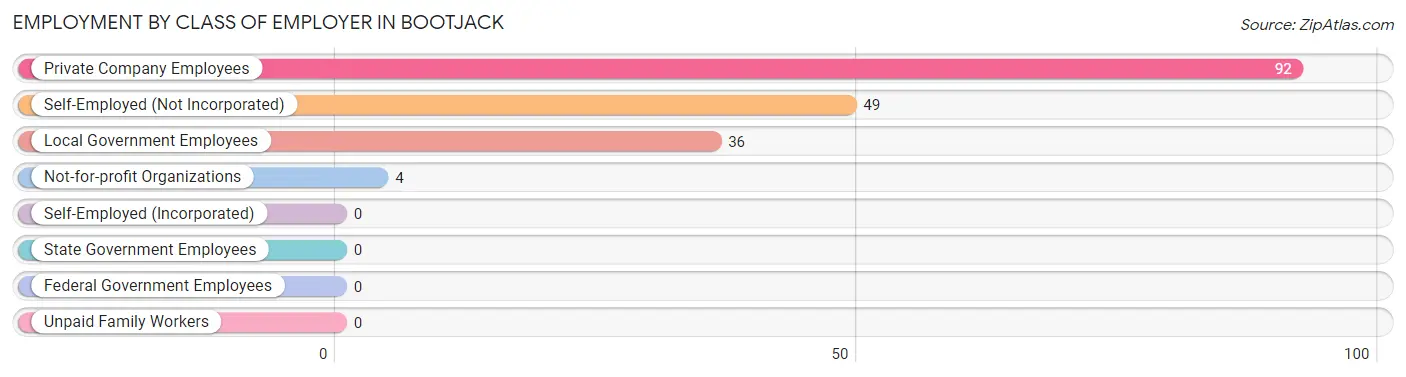
| Employer Class | # Employees | % Employees |
| Private Company Employees | 92 | 50.8% |
| Self-Employed (Incorporated) | 0 | 0.0% |
| Self-Employed (Not Incorporated) | 49 | 27.1% |
| Not-for-profit Organizations | 4 | 2.2% |
| Local Government Employees | 36 | 19.9% |
| State Government Employees | 0 | 0.0% |
| Federal Government Employees | 0 | 0.0% |
| Unpaid Family Workers | 0 | 0.0% |
| Total | 181 | 100.0% |
Employment Status by Age in Bootjack
According to the labor force statistics for Bootjack, out of the total population over 16 years of age (304), 61.2% or 186 individuals are in the labor force, with 2.7% or 5 of them unemployed. The age group with the highest labor force participation rate is 25 to 29 years, with 100.0% or 1 individuals in the labor force. Within the labor force, the 45 to 54 years age range has the highest percentage of unemployed individuals, with 9.6% or 5 of them being unemployed.
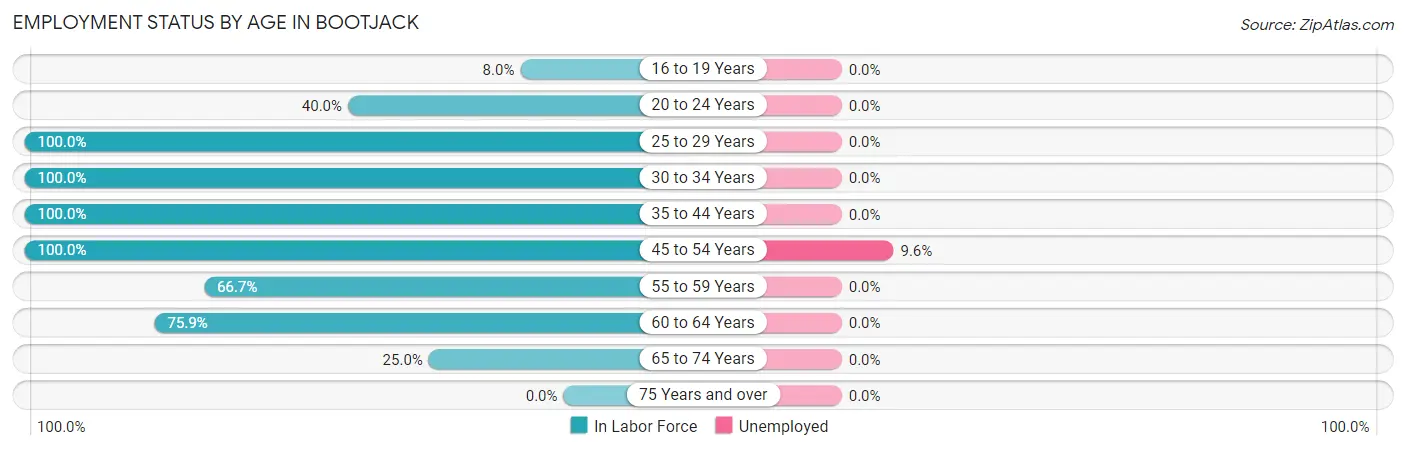
| Age Bracket | In Labor Force | Unemployed |
| 16 to 19 Years | 4 (8.0%) | 0 (0.0%) |
| 20 to 24 Years | 4 (40.0%) | 0 (0.0%) |
| 25 to 29 Years | 1 (100.0%) | 0 (0.0%) |
| 30 to 34 Years | 20 (100.0%) | 0 (0.0%) |
| 35 to 44 Years | 29 (100.0%) | 0 (0.0%) |
| 45 to 54 Years | 52 (100.0%) | 5 (9.6%) |
| 55 to 59 Years | 28 (66.7%) | 0 (0.0%) |
| 60 to 64 Years | 41 (75.9%) | 0 (0.0%) |
| 65 to 74 Years | 7 (25.0%) | 0 (0.0%) |
| 75 Years and over | 0 (0.0%) | 0 (0.0%) |
| Total | 186 (61.2%) | 5 (2.7%) |
Employment Status by Educational Attainment in Bootjack
According to labor force statistics for Bootjack, 86.4% of individuals (171) out of the total population between 25 and 64 years of age (198) are in the labor force, with 2.9% or 5 of them being unemployed. The group with the highest labor force participation rate are those with the educational attainment of less than high school, with 100.0% or 26 individuals in the labor force. Within the labor force, individuals with college / associate degree education have the highest percentage of unemployment, with 7.8% or 5 of them being unemployed.
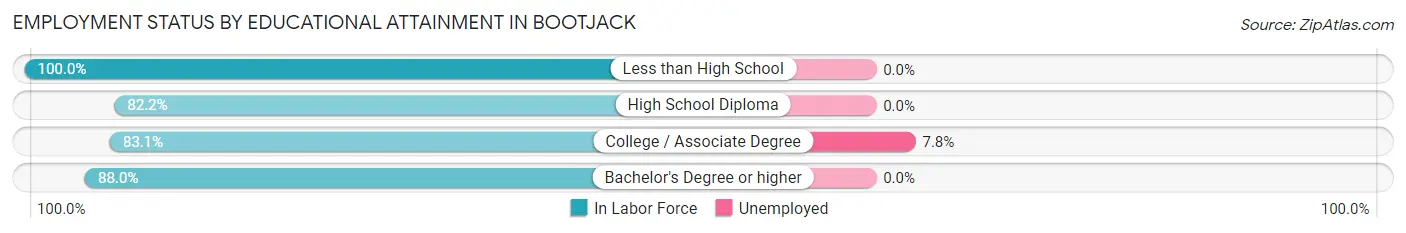
| Educational Attainment | In Labor Force | Unemployed |
| Less than High School | 26 (100.0%) | 0 (0.0%) |
| High School Diploma | 37 (82.2%) | 0 (0.0%) |
| College / Associate Degree | 64 (83.1%) | 6 (7.8%) |
| Bachelor's Degree or higher | 44 (88.0%) | 0 (0.0%) |
| Total | 171 (86.4%) | 6 (2.9%) |
Employment Occupations by Sex in Bootjack
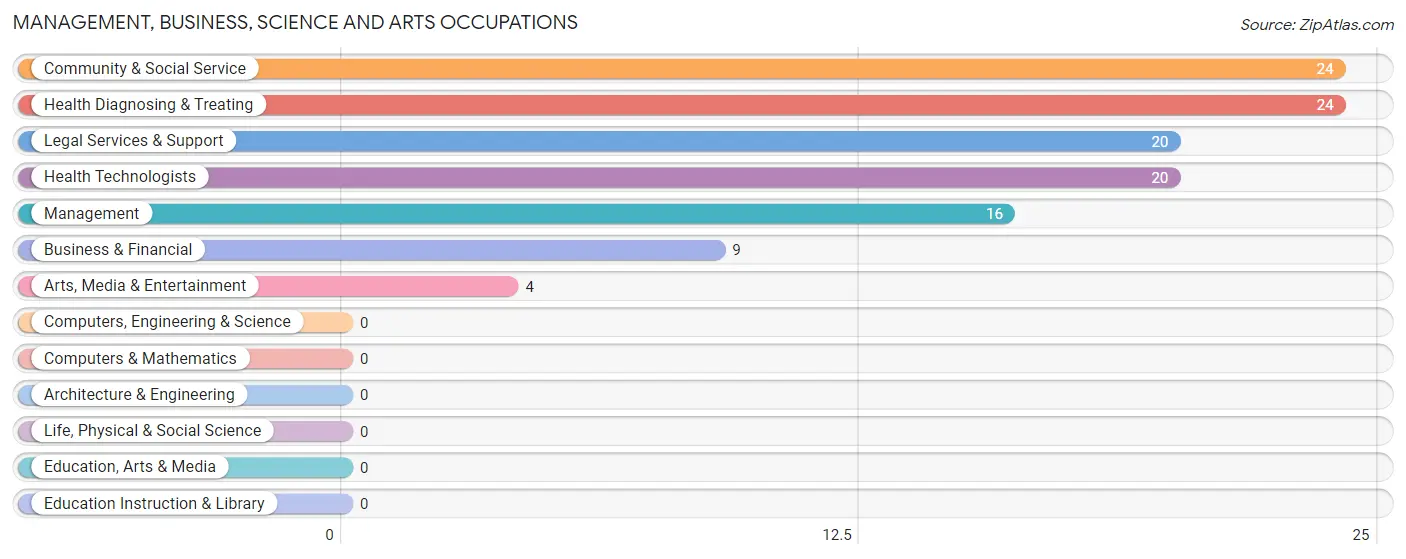
Management, Business, Science and Arts Occupations
The most common Management, Business, Science and Arts occupations in Bootjack are Community & Social Service (24 | 13.3%), Health Diagnosing & Treating (24 | 13.3%), Legal Services & Support (20 | 11.1%), Health Technologists (20 | 11.1%), and Management (16 | 8.8%).
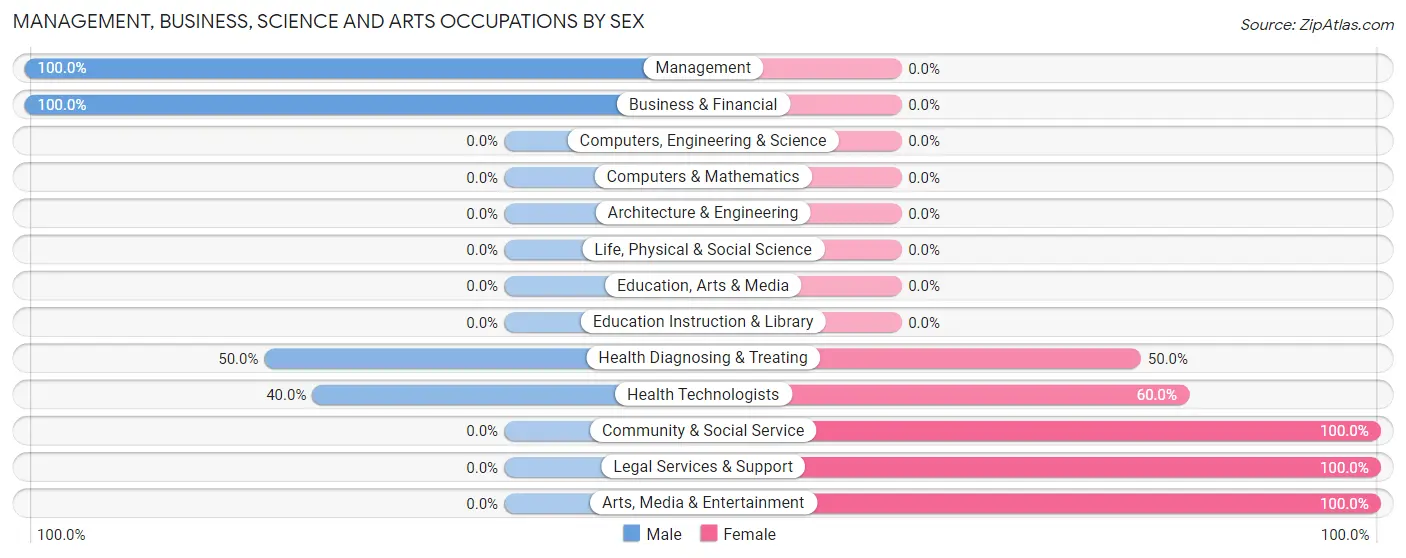
Management, Business, Science and Arts Occupations by Sex
Within the Management, Business, Science and Arts occupations in Bootjack, the most male-oriented occupations are Management (100.0%), Business & Financial (100.0%), and Health Diagnosing & Treating (50.0%), while the most female-oriented occupations are Community & Social Service (100.0%), Legal Services & Support (100.0%), and Arts, Media & Entertainment (100.0%).
| Occupation | Male | Female |
| Management | 16 (100.0%) | 0 (0.0%) |
| Business & Financial | 9 (100.0%) | 0 (0.0%) |
| Computers, Engineering & Science | 0 (0.0%) | 0 (0.0%) |
| Computers & Mathematics | 0 (0.0%) | 0 (0.0%) |
| Architecture & Engineering | 0 (0.0%) | 0 (0.0%) |
| Life, Physical & Social Science | 0 (0.0%) | 0 (0.0%) |
| Community & Social Service | 0 (0.0%) | 24 (100.0%) |
| Education, Arts & Media | 0 (0.0%) | 0 (0.0%) |
| Legal Services & Support | 0 (0.0%) | 20 (100.0%) |
| Education Instruction & Library | 0 (0.0%) | 0 (0.0%) |
| Arts, Media & Entertainment | 0 (0.0%) | 4 (100.0%) |
| Health Diagnosing & Treating | 12 (50.0%) | 12 (50.0%) |
| Health Technologists | 8 (40.0%) | 12 (60.0%) |
| Total (Category) | 37 (50.7%) | 36 (49.3%) |
| Total (Overall) | 83 (45.9%) | 98 (54.1%) |
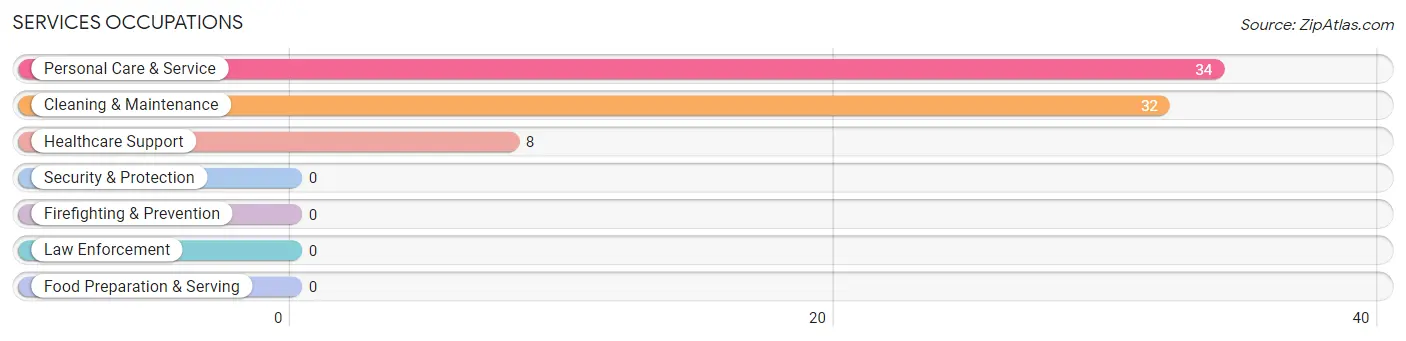
Services Occupations
The most common Services occupations in Bootjack are Personal Care & Service (34 | 18.8%), Cleaning & Maintenance (32 | 17.7%), and Healthcare Support (8 | 4.4%).
Services Occupations by Sex
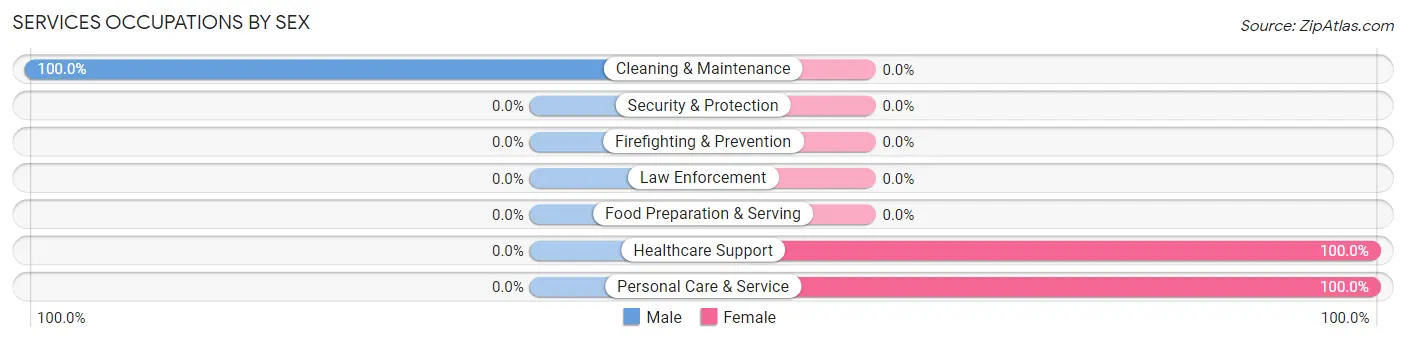
| Occupation | Male | Female |
| Healthcare Support | 0 (0.0%) | 8 (100.0%) |
| Security & Protection | 0 (0.0%) | 0 (0.0%) |
| Firefighting & Prevention | 0 (0.0%) | 0 (0.0%) |
| Law Enforcement | 0 (0.0%) | 0 (0.0%) |
| Food Preparation & Serving | 0 (0.0%) | 0 (0.0%) |
| Cleaning & Maintenance | 32 (100.0%) | 0 (0.0%) |
| Personal Care & Service | 0 (0.0%) | 34 (100.0%) |
| Total (Category) | 32 (43.2%) | 42 (56.8%) |
| Total (Overall) | 83 (45.9%) | 98 (54.1%) |
Sales and Office Occupations
The most common Sales and Office occupations in Bootjack are , and Office & Administration (12 | 6.6%).
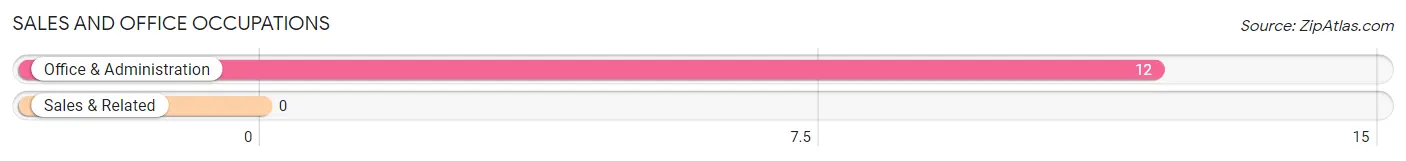
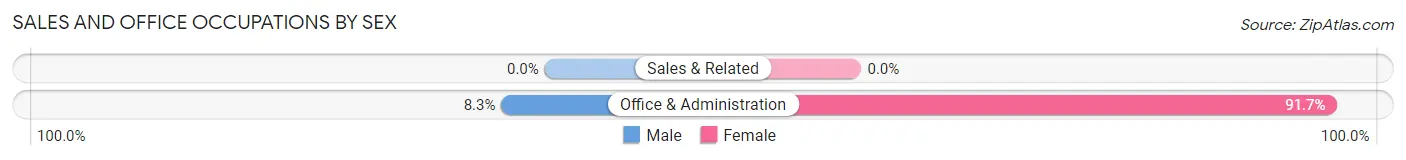
Sales and Office Occupations by Sex
| Occupation | Male | Female |
| Sales & Related | 0 (0.0%) | 0 (0.0%) |
| Office & Administration | 1 (8.3%) | 11 (91.7%) |
| Total (Category) | 1 (8.3%) | 11 (91.7%) |
| Total (Overall) | 83 (45.9%) | 98 (54.1%) |
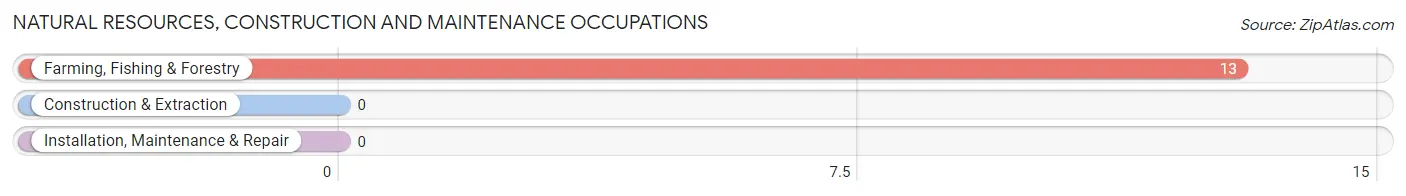
Natural Resources, Construction and Maintenance Occupations
The most common Natural Resources, Construction and Maintenance occupations in Bootjack are , and Farming, Fishing & Forestry (13 | 7.2%).
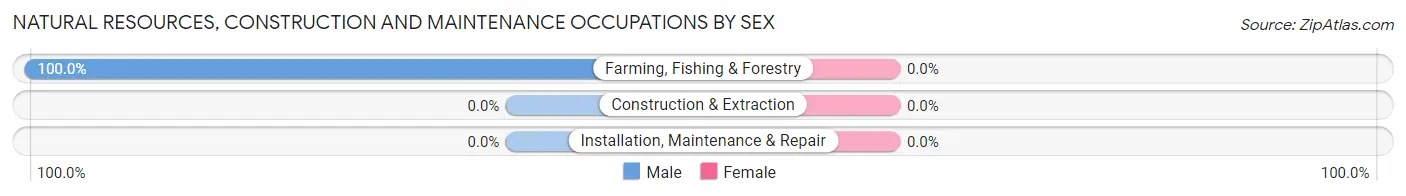
Natural Resources, Construction and Maintenance Occupations by Sex
| Occupation | Male | Female |
| Farming, Fishing & Forestry | 13 (100.0%) | 0 (0.0%) |
| Construction & Extraction | 0 (0.0%) | 0 (0.0%) |
| Installation, Maintenance & Repair | 0 (0.0%) | 0 (0.0%) |
| Total (Category) | 13 (100.0%) | 0 (0.0%) |
| Total (Overall) | 83 (45.9%) | 98 (54.1%) |
Production, Transportation and Moving Occupations
The most common Production, Transportation and Moving occupations in Bootjack are , and Transportation (9 | 5.0%).
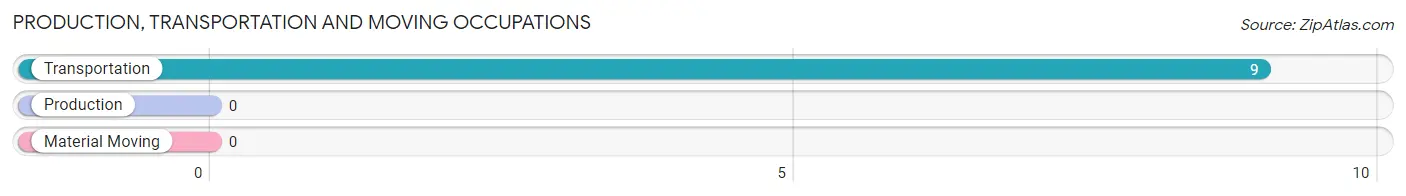
Production, Transportation and Moving Occupations by Sex
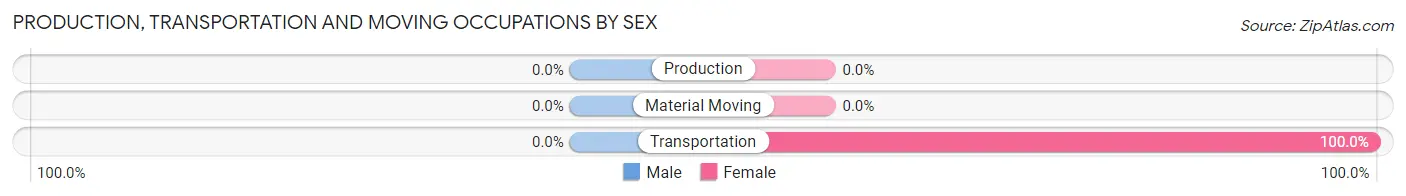
| Occupation | Male | Female |
| Production | 0 (0.0%) | 0 (0.0%) |
| Transportation | 0 (0.0%) | 9 (100.0%) |
| Material Moving | 0 (0.0%) | 0 (0.0%) |
| Total (Category) | 0 (0.0%) | 9 (100.0%) |
| Total (Overall) | 83 (45.9%) | 98 (54.1%) |
Employment Industries by Sex in Bootjack
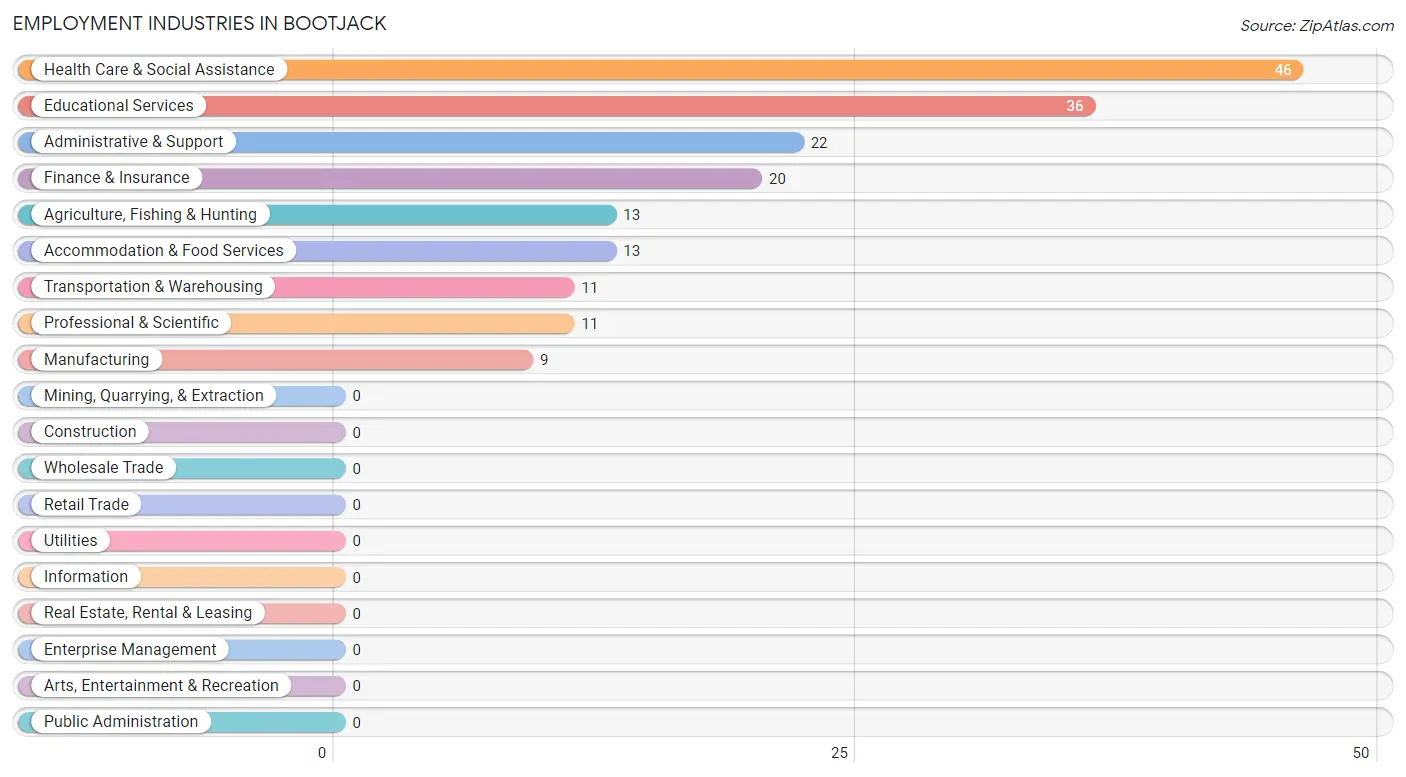
Employment Industries in Bootjack
The major employment industries in Bootjack include Health Care & Social Assistance (46 | 25.4%), Educational Services (36 | 19.9%), Administrative & Support (22 | 12.1%), Finance & Insurance (20 | 11.1%), and Agriculture, Fishing & Hunting (13 | 7.2%).
Employment Industries by Sex in Bootjack
The Bootjack industries that see more men than women are Agriculture, Fishing & Hunting (100.0%), Manufacturing (100.0%), and Transportation & Warehousing (100.0%), whereas the industries that tend to have a higher number of women are Finance & Insurance (100.0%), Professional & Scientific (100.0%), and Accommodation & Food Services (100.0%).
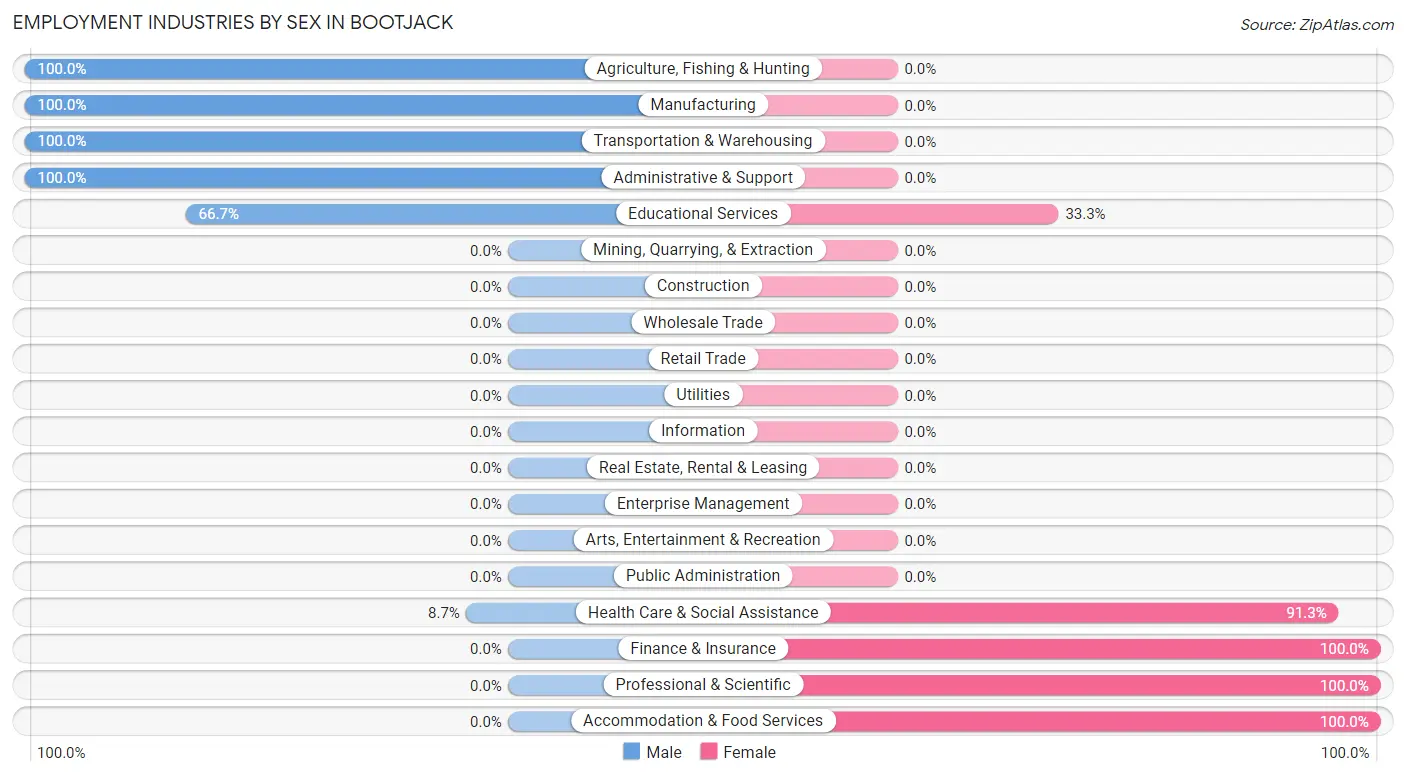
| Industry | Male | Female |
| Agriculture, Fishing & Hunting | 13 (100.0%) | 0 (0.0%) |
| Mining, Quarrying, & Extraction | 0 (0.0%) | 0 (0.0%) |
| Construction | 0 (0.0%) | 0 (0.0%) |
| Manufacturing | 9 (100.0%) | 0 (0.0%) |
| Wholesale Trade | 0 (0.0%) | 0 (0.0%) |
| Retail Trade | 0 (0.0%) | 0 (0.0%) |
| Transportation & Warehousing | 11 (100.0%) | 0 (0.0%) |
| Utilities | 0 (0.0%) | 0 (0.0%) |
| Information | 0 (0.0%) | 0 (0.0%) |
| Finance & Insurance | 0 (0.0%) | 20 (100.0%) |
| Real Estate, Rental & Leasing | 0 (0.0%) | 0 (0.0%) |
| Professional & Scientific | 0 (0.0%) | 11 (100.0%) |
| Enterprise Management | 0 (0.0%) | 0 (0.0%) |
| Administrative & Support | 22 (100.0%) | 0 (0.0%) |
| Educational Services | 24 (66.7%) | 12 (33.3%) |
| Health Care & Social Assistance | 4 (8.7%) | 42 (91.3%) |
| Arts, Entertainment & Recreation | 0 (0.0%) | 0 (0.0%) |
| Accommodation & Food Services | 0 (0.0%) | 13 (100.0%) |
| Public Administration | 0 (0.0%) | 0 (0.0%) |
| Total | 83 (45.9%) | 98 (54.1%) |
Education in Bootjack
School Enrollment in Bootjack
The most common levels of schooling among the 69 students in Bootjack are high school (46 | 66.7%), elementary school (19 | 27.5%), and college / undergraduate (4 | 5.8%).
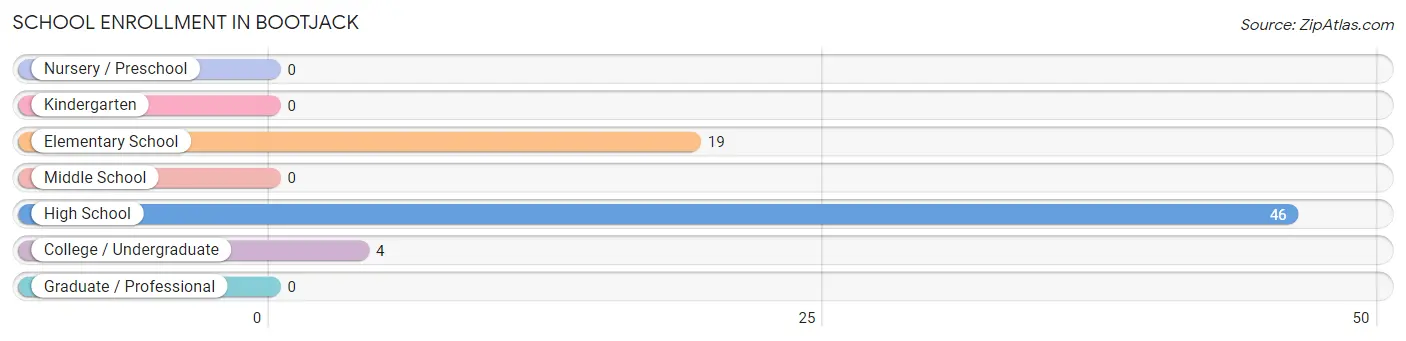
| School Level | # Students | % Students |
| Nursery / Preschool | 0 | 0.0% |
| Kindergarten | 0 | 0.0% |
| Elementary School | 19 | 27.5% |
| Middle School | 0 | 0.0% |
| High School | 46 | 66.7% |
| College / Undergraduate | 4 | 5.8% |
| Graduate / Professional | 0 | 0.0% |
| Total | 69 | 100.0% |
School Enrollment by Age by Funding Source in Bootjack
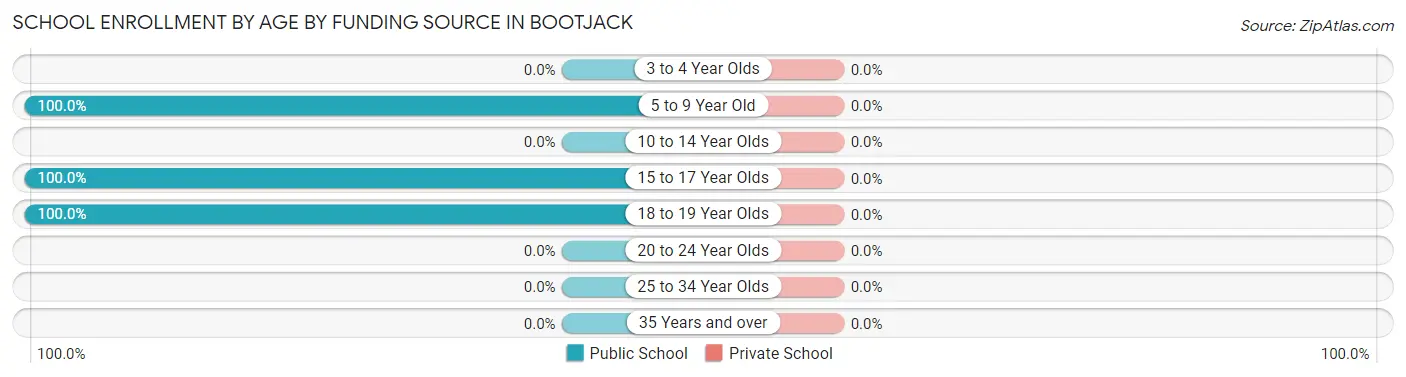
| Age Bracket | Public School | Private School |
| 3 to 4 Year Olds | 0 (0.0%) | 0 (0.0%) |
| 5 to 9 Year Old | 19 (100.0%) | 0 (0.0%) |
| 10 to 14 Year Olds | 0 (0.0%) | 0 (0.0%) |
| 15 to 17 Year Olds | 46 (100.0%) | 0 (0.0%) |
| 18 to 19 Year Olds | 4 (100.0%) | 0 (0.0%) |
| 20 to 24 Year Olds | 0 (0.0%) | 0 (0.0%) |
| 25 to 34 Year Olds | 0 (0.0%) | 0 (0.0%) |
| 35 Years and over | 0 (0.0%) | 0 (0.0%) |
| Total | 69 (100.0%) | 0 (0.0%) |
Educational Attainment by Field of Study in Bootjack
Science & technology (18 | 36.0%), education (16 | 32.0%), bio, nature & agricultural (8 | 16.0%), and visual & performing arts (8 | 16.0%) are the most common fields of study among 50 individuals in Bootjack who have obtained a bachelor's degree or higher.
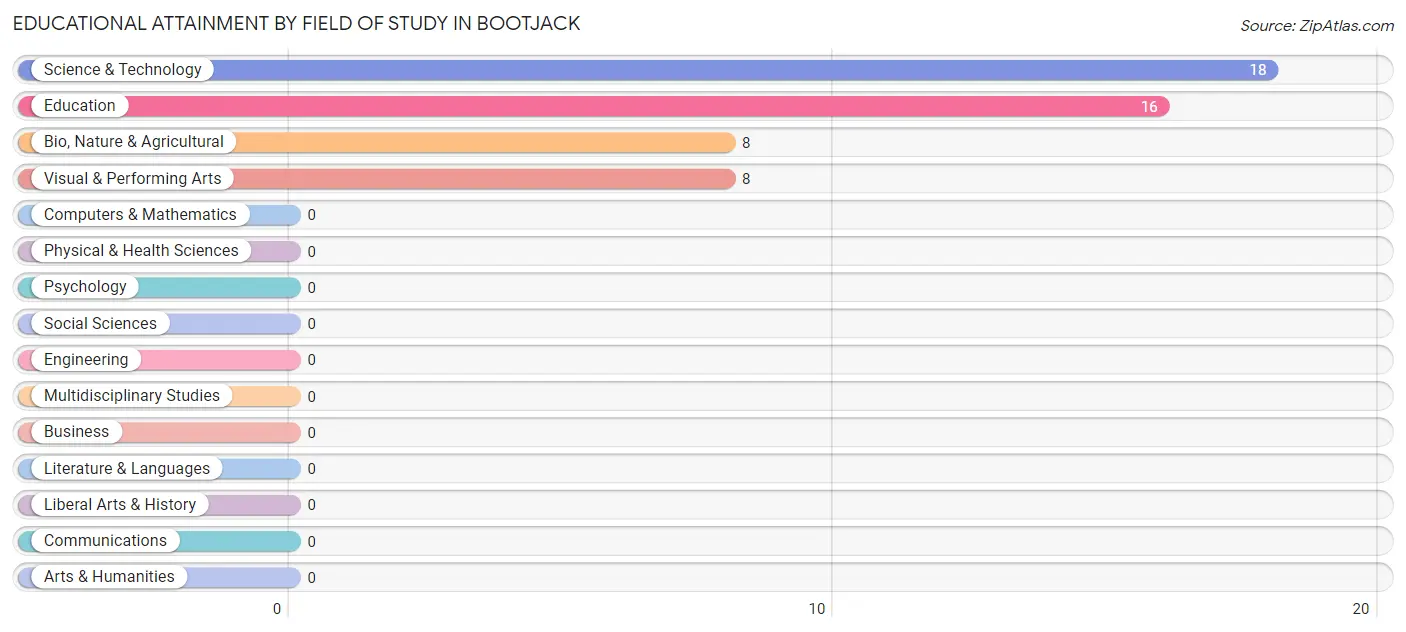
| Field of Study | # Graduates | % Graduates |
| Computers & Mathematics | 0 | 0.0% |
| Bio, Nature & Agricultural | 8 | 16.0% |
| Physical & Health Sciences | 0 | 0.0% |
| Psychology | 0 | 0.0% |
| Social Sciences | 0 | 0.0% |
| Engineering | 0 | 0.0% |
| Multidisciplinary Studies | 0 | 0.0% |
| Science & Technology | 18 | 36.0% |
| Business | 0 | 0.0% |
| Education | 16 | 32.0% |
| Literature & Languages | 0 | 0.0% |
| Liberal Arts & History | 0 | 0.0% |
| Visual & Performing Arts | 8 | 16.0% |
| Communications | 0 | 0.0% |
| Arts & Humanities | 0 | 0.0% |
| Total | 50 | 100.0% |
Transportation & Commute in Bootjack
Vehicle Availability by Sex in Bootjack
The most prevalent vehicle ownership categories in Bootjack are males with 2 vehicles (25, accounting for 30.1%) and females with 2 vehicles (32, making up 25.5%).
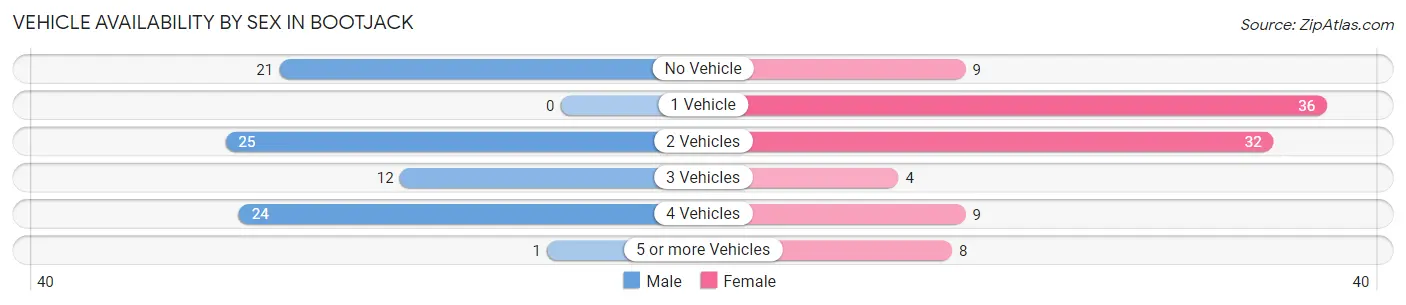
| Vehicles Available | Male | Female |
| No Vehicle | 21 (25.3%) | 9 (9.2%) |
| 1 Vehicle | 0 (0.0%) | 36 (36.7%) |
| 2 Vehicles | 25 (30.1%) | 32 (32.7%) |
| 3 Vehicles | 12 (14.5%) | 4 (4.1%) |
| 4 Vehicles | 24 (28.9%) | 9 (9.2%) |
| 5 or more Vehicles | 1 (1.2%) | 8 (8.2%) |
| Total | 83 (100.0%) | 98 (100.0%) |
Commute Time in Bootjack
The most frequently occuring commute durations in Bootjack are 15 to 19 minutes (37 commuters, 28.9%), less than 5 minutes (29 commuters, 22.7%), and 10 to 14 minutes (25 commuters, 19.5%).
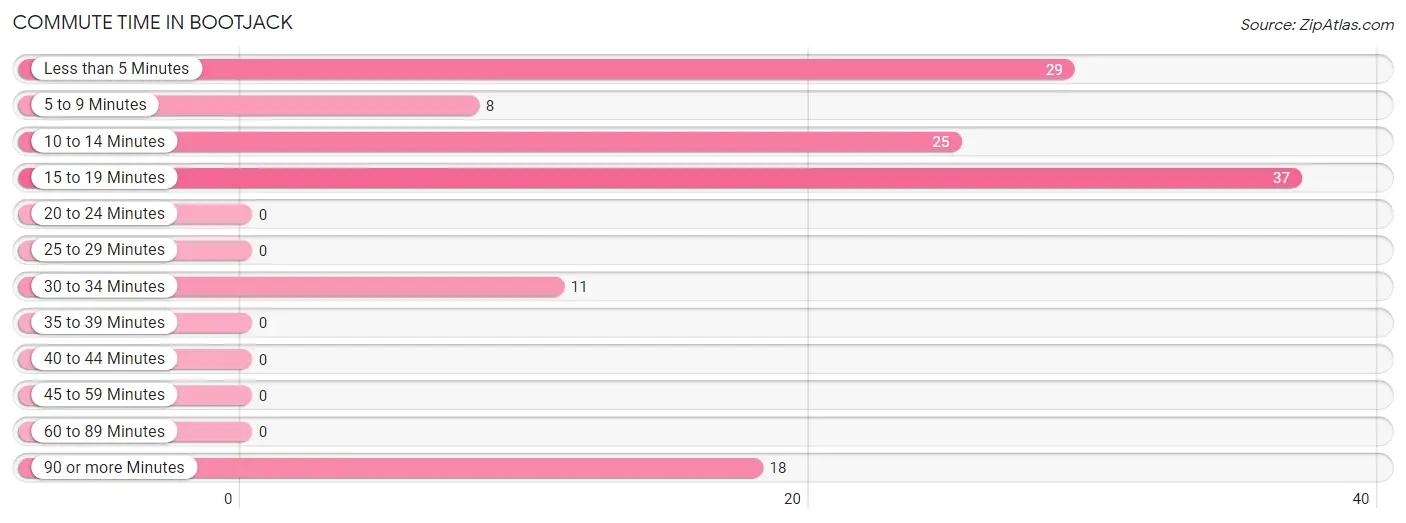
| Commute Time | # Commuters | % Commuters |
| Less than 5 Minutes | 29 | 22.7% |
| 5 to 9 Minutes | 8 | 6.2% |
| 10 to 14 Minutes | 25 | 19.5% |
| 15 to 19 Minutes | 37 | 28.9% |
| 20 to 24 Minutes | 0 | 0.0% |
| 25 to 29 Minutes | 0 | 0.0% |
| 30 to 34 Minutes | 11 | 8.6% |
| 35 to 39 Minutes | 0 | 0.0% |
| 40 to 44 Minutes | 0 | 0.0% |
| 45 to 59 Minutes | 0 | 0.0% |
| 60 to 89 Minutes | 0 | 0.0% |
| 90 or more Minutes | 18 | 14.1% |
Commute Time by Sex in Bootjack
The most common commute times in Bootjack are less than 5 minutes (29 commuters, 35.4%) for males and 15 to 19 minutes (24 commuters, 52.2%) for females.
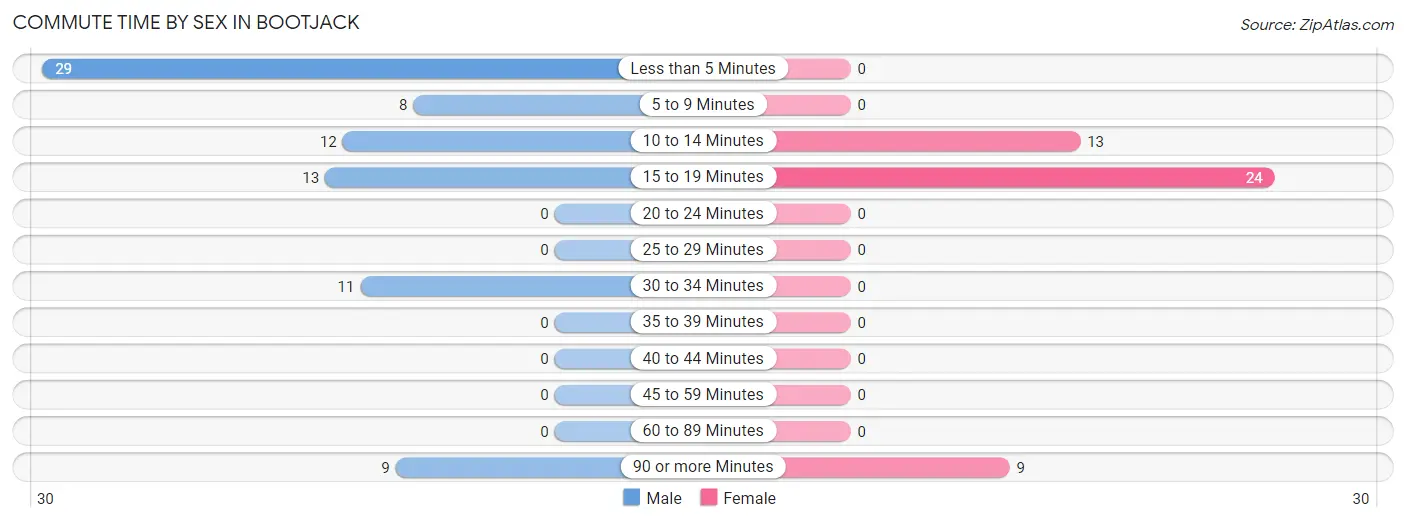
| Commute Time | Male | Female |
| Less than 5 Minutes | 29 (35.4%) | 0 (0.0%) |
| 5 to 9 Minutes | 8 (9.8%) | 0 (0.0%) |
| 10 to 14 Minutes | 12 (14.6%) | 13 (28.3%) |
| 15 to 19 Minutes | 13 (15.9%) | 24 (52.2%) |
| 20 to 24 Minutes | 0 (0.0%) | 0 (0.0%) |
| 25 to 29 Minutes | 0 (0.0%) | 0 (0.0%) |
| 30 to 34 Minutes | 11 (13.4%) | 0 (0.0%) |
| 35 to 39 Minutes | 0 (0.0%) | 0 (0.0%) |
| 40 to 44 Minutes | 0 (0.0%) | 0 (0.0%) |
| 45 to 59 Minutes | 0 (0.0%) | 0 (0.0%) |
| 60 to 89 Minutes | 0 (0.0%) | 0 (0.0%) |
| 90 or more Minutes | 9 (11.0%) | 9 (19.6%) |
Time of Departure to Work by Sex in Bootjack
The most frequent times of departure to work in Bootjack are 7:30 AM to 7:59 AM (27, 32.9%) for males and 7:30 AM to 7:59 AM (24, 52.2%) for females.
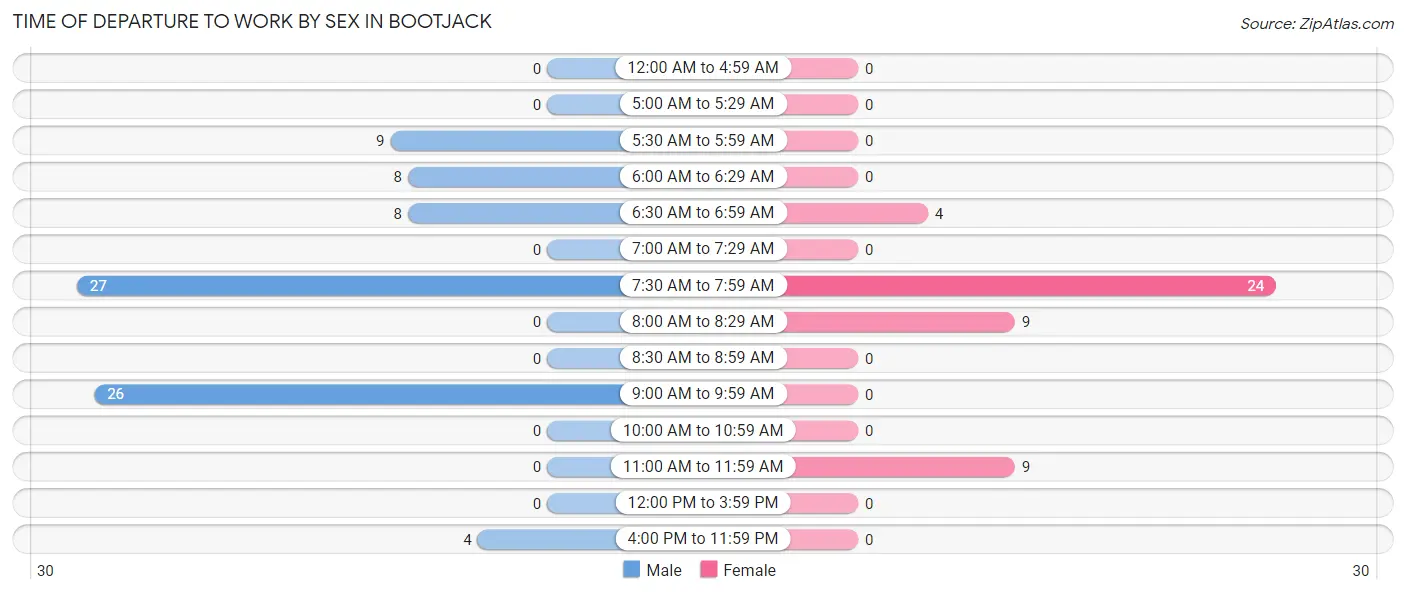
| Time of Departure | Male | Female |
| 12:00 AM to 4:59 AM | 0 (0.0%) | 0 (0.0%) |
| 5:00 AM to 5:29 AM | 0 (0.0%) | 0 (0.0%) |
| 5:30 AM to 5:59 AM | 9 (11.0%) | 0 (0.0%) |
| 6:00 AM to 6:29 AM | 8 (9.8%) | 0 (0.0%) |
| 6:30 AM to 6:59 AM | 8 (9.8%) | 4 (8.7%) |
| 7:00 AM to 7:29 AM | 0 (0.0%) | 0 (0.0%) |
| 7:30 AM to 7:59 AM | 27 (32.9%) | 24 (52.2%) |
| 8:00 AM to 8:29 AM | 0 (0.0%) | 9 (19.6%) |
| 8:30 AM to 8:59 AM | 0 (0.0%) | 0 (0.0%) |
| 9:00 AM to 9:59 AM | 26 (31.7%) | 0 (0.0%) |
| 10:00 AM to 10:59 AM | 0 (0.0%) | 0 (0.0%) |
| 11:00 AM to 11:59 AM | 0 (0.0%) | 9 (19.6%) |
| 12:00 PM to 3:59 PM | 0 (0.0%) | 0 (0.0%) |
| 4:00 PM to 11:59 PM | 4 (4.9%) | 0 (0.0%) |
| Total | 82 (100.0%) | 46 (100.0%) |
Housing Occupancy in Bootjack
Occupancy by Ownership in Bootjack
Of the total 152 dwellings in Bootjack, owner-occupied units account for 106 (69.7%), while renter-occupied units make up 46 (30.3%).
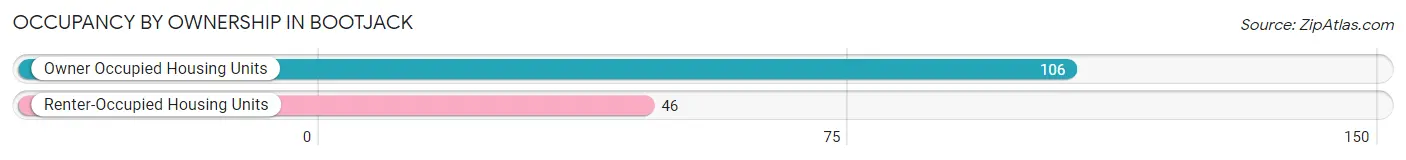
| Occupancy | # Housing Units | % Housing Units |
| Owner Occupied Housing Units | 106 | 69.7% |
| Renter-Occupied Housing Units | 46 | 30.3% |
| Total Occupied Housing Units | 152 | 100.0% |
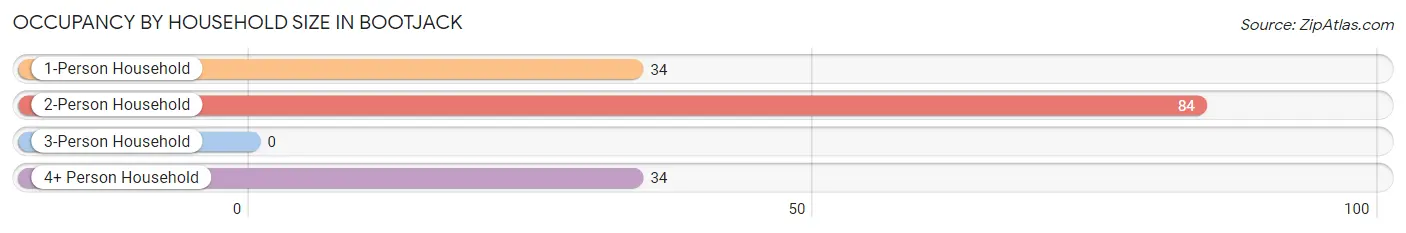
Occupancy by Household Size in Bootjack
| Household Size | # Housing Units | % Housing Units |
| 1-Person Household | 34 | 22.4% |
| 2-Person Household | 84 | 55.3% |
| 3-Person Household | 0 | 0.0% |
| 4+ Person Household | 34 | 22.4% |
| Total Housing Units | 152 | 100.0% |
Occupancy by Ownership by Household Size in Bootjack
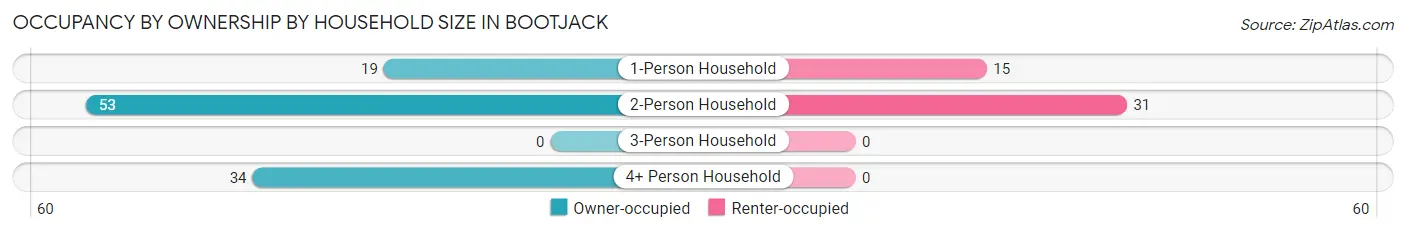
| Household Size | Owner-occupied | Renter-occupied |
| 1-Person Household | 19 (55.9%) | 15 (44.1%) |
| 2-Person Household | 53 (63.1%) | 31 (36.9%) |
| 3-Person Household | 0 (0.0%) | 0 (0.0%) |
| 4+ Person Household | 34 (100.0%) | 0 (0.0%) |
| Total Housing Units | 106 (69.7%) | 46 (30.3%) |
Occupancy by Educational Attainment in Bootjack
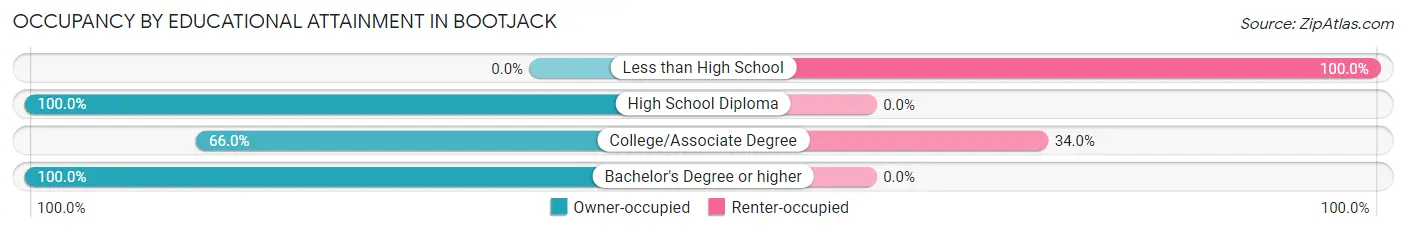
| Household Size | Owner-occupied | Renter-occupied |
| Less than High School | 0 (0.0%) | 13 (100.0%) |
| High School Diploma | 16 (100.0%) | 0 (0.0%) |
| College/Associate Degree | 64 (66.0%) | 33 (34.0%) |
| Bachelor's Degree or higher | 26 (100.0%) | 0 (0.0%) |
Occupancy by Age of Householder in Bootjack
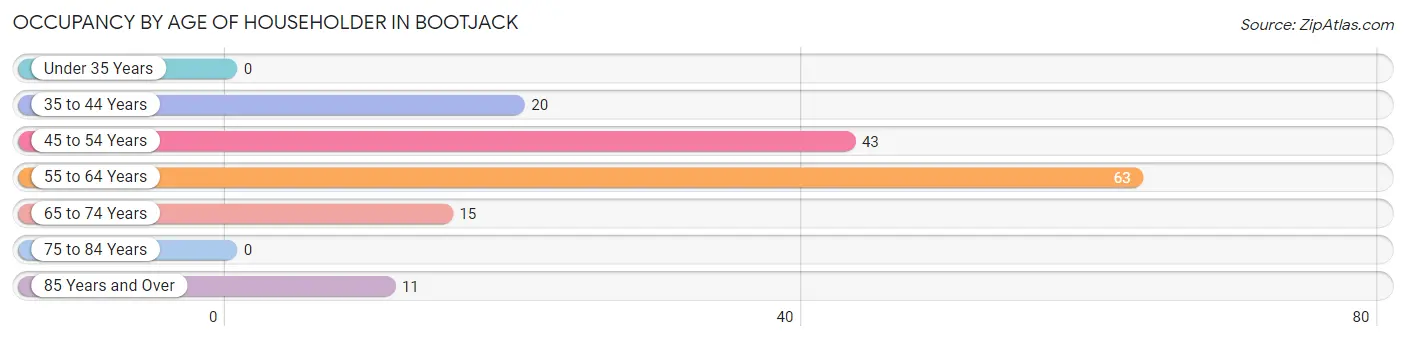
| Age Bracket | # Households | % Households |
| Under 35 Years | 0 | 0.0% |
| 35 to 44 Years | 20 | 13.2% |
| 45 to 54 Years | 43 | 28.3% |
| 55 to 64 Years | 63 | 41.4% |
| 65 to 74 Years | 15 | 9.9% |
| 75 to 84 Years | 0 | 0.0% |
| 85 Years and Over | 11 | 7.2% |
| Total | 152 | 100.0% |
Housing Finances in Bootjack
Median Income by Occupancy in Bootjack
| Occupancy Type | # Households | Median Income |
| Owner-Occupied | 106 (69.7%) | $0 |
| Renter-Occupied | 46 (30.3%) | $0 |
| Average | 152 (100.0%) | $0 |
Occupancy by Householder Income Bracket in Bootjack
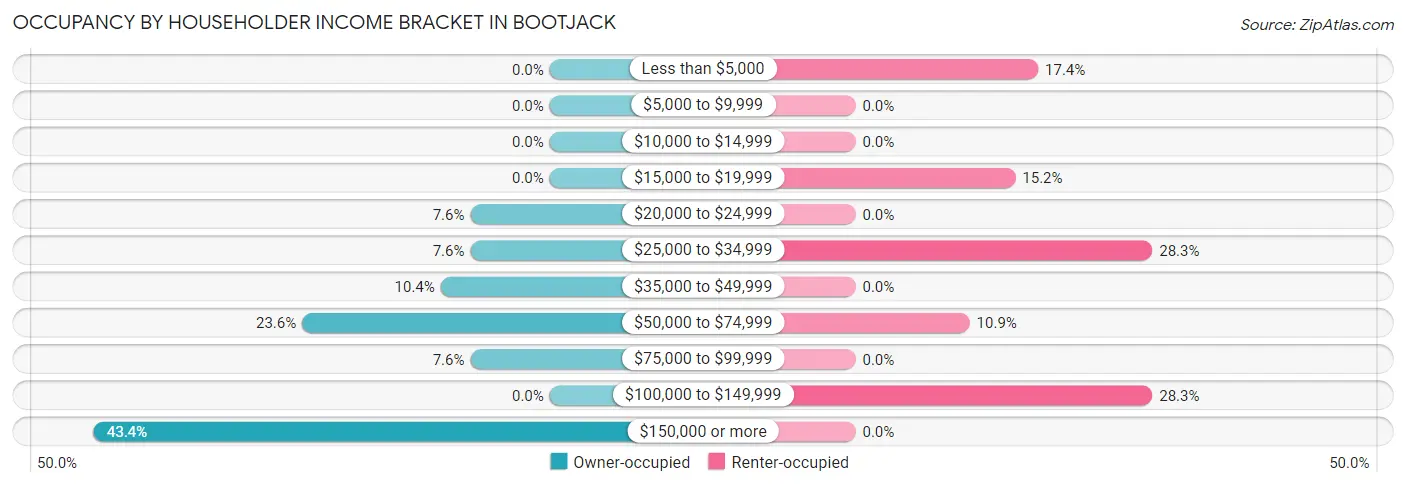
| Income Bracket | Owner-occupied | Renter-occupied |
| Less than $5,000 | 0 (0.0%) | 8 (17.4%) |
| $5,000 to $9,999 | 0 (0.0%) | 0 (0.0%) |
| $10,000 to $14,999 | 0 (0.0%) | 0 (0.0%) |
| $15,000 to $19,999 | 0 (0.0%) | 7 (15.2%) |
| $20,000 to $24,999 | 8 (7.5%) | 0 (0.0%) |
| $25,000 to $34,999 | 8 (7.5%) | 13 (28.3%) |
| $35,000 to $49,999 | 11 (10.4%) | 0 (0.0%) |
| $50,000 to $74,999 | 25 (23.6%) | 5 (10.9%) |
| $75,000 to $99,999 | 8 (7.5%) | 0 (0.0%) |
| $100,000 to $149,999 | 0 (0.0%) | 13 (28.3%) |
| $150,000 or more | 46 (43.4%) | 0 (0.0%) |
| Total | 106 (100.0%) | 46 (100.0%) |
Monthly Housing Cost Tiers in Bootjack
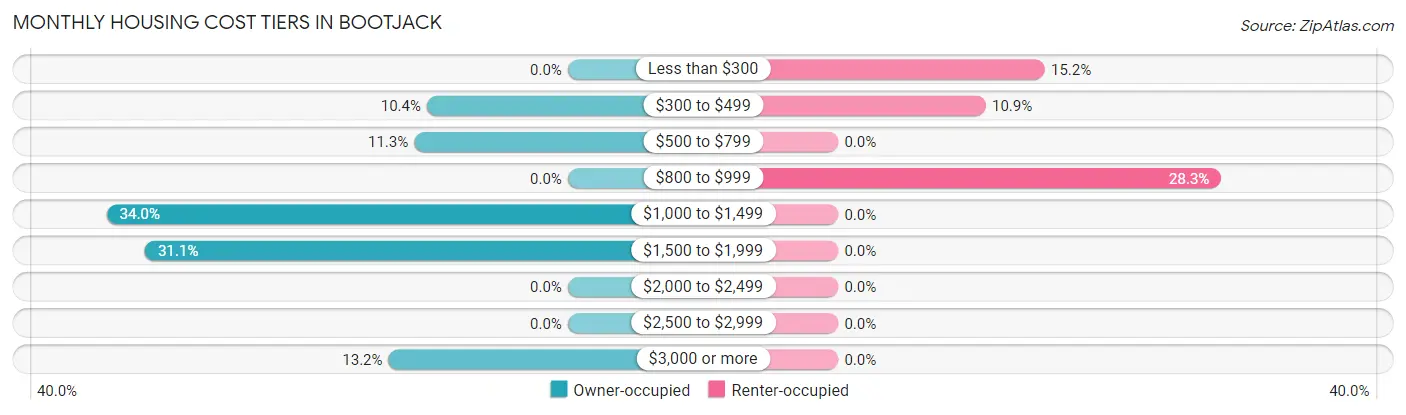
| Monthly Cost | Owner-occupied | Renter-occupied |
| Less than $300 | 0 (0.0%) | 7 (15.2%) |
| $300 to $499 | 11 (10.4%) | 5 (10.9%) |
| $500 to $799 | 12 (11.3%) | 0 (0.0%) |
| $800 to $999 | 0 (0.0%) | 13 (28.3%) |
| $1,000 to $1,499 | 36 (34.0%) | 0 (0.0%) |
| $1,500 to $1,999 | 33 (31.1%) | 0 (0.0%) |
| $2,000 to $2,499 | 0 (0.0%) | 0 (0.0%) |
| $2,500 to $2,999 | 0 (0.0%) | 0 (0.0%) |
| $3,000 or more | 14 (13.2%) | 0 (0.0%) |
| Total | 106 (100.0%) | 46 (100.0%) |
Physical Housing Characteristics in Bootjack
Housing Structures in Bootjack
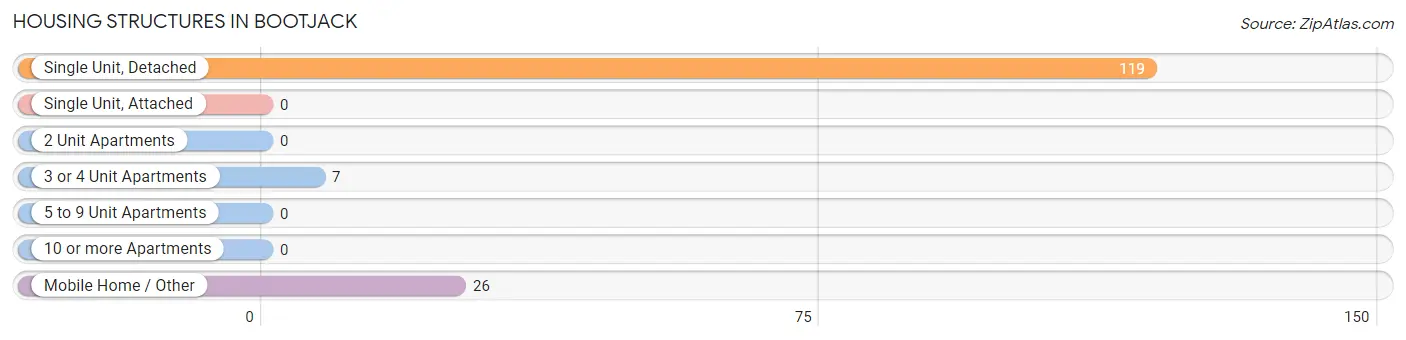
| Structure Type | # Housing Units | % Housing Units |
| Single Unit, Detached | 119 | 78.3% |
| Single Unit, Attached | 0 | 0.0% |
| 2 Unit Apartments | 0 | 0.0% |
| 3 or 4 Unit Apartments | 7 | 4.6% |
| 5 to 9 Unit Apartments | 0 | 0.0% |
| 10 or more Apartments | 0 | 0.0% |
| Mobile Home / Other | 26 | 17.1% |
| Total | 152 | 100.0% |
Housing Structures by Occupancy in Bootjack
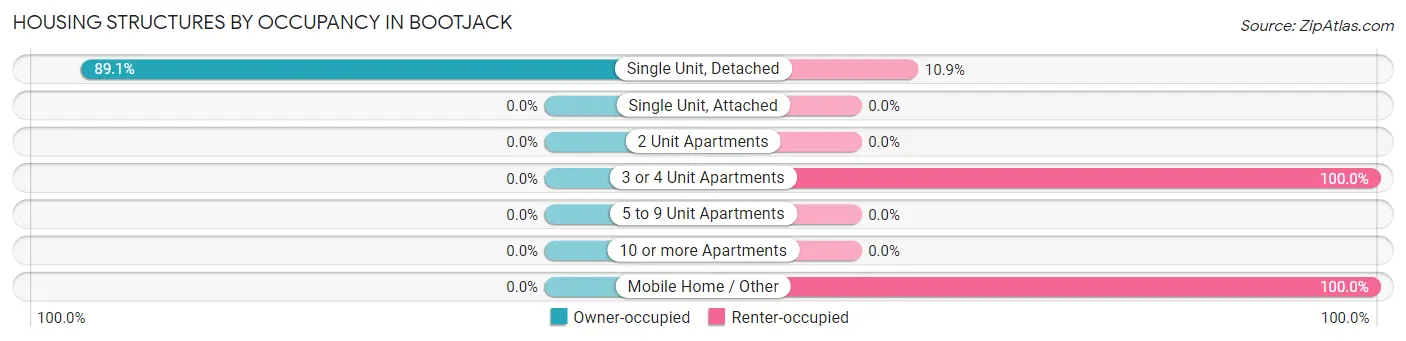
| Structure Type | Owner-occupied | Renter-occupied |
| Single Unit, Detached | 106 (89.1%) | 13 (10.9%) |
| Single Unit, Attached | 0 (0.0%) | 0 (0.0%) |
| 2 Unit Apartments | 0 (0.0%) | 0 (0.0%) |
| 3 or 4 Unit Apartments | 0 (0.0%) | 7 (100.0%) |
| 5 to 9 Unit Apartments | 0 (0.0%) | 0 (0.0%) |
| 10 or more Apartments | 0 (0.0%) | 0 (0.0%) |
| Mobile Home / Other | 0 (0.0%) | 26 (100.0%) |
| Total | 106 (69.7%) | 46 (30.3%) |
Housing Structures by Number of Rooms in Bootjack
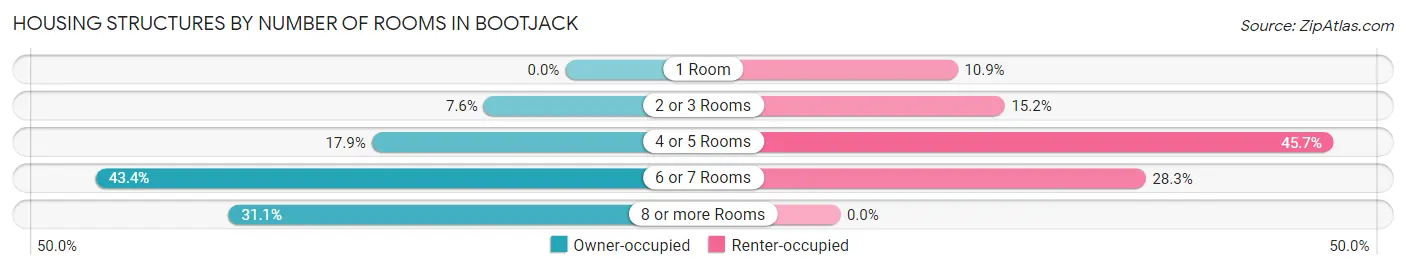
| Number of Rooms | Owner-occupied | Renter-occupied |
| 1 Room | 0 (0.0%) | 5 (10.9%) |
| 2 or 3 Rooms | 8 (7.5%) | 7 (15.2%) |
| 4 or 5 Rooms | 19 (17.9%) | 21 (45.7%) |
| 6 or 7 Rooms | 46 (43.4%) | 13 (28.3%) |
| 8 or more Rooms | 33 (31.1%) | 0 (0.0%) |
| Total | 106 (100.0%) | 46 (100.0%) |
Housing Structure by Heating Type in Bootjack
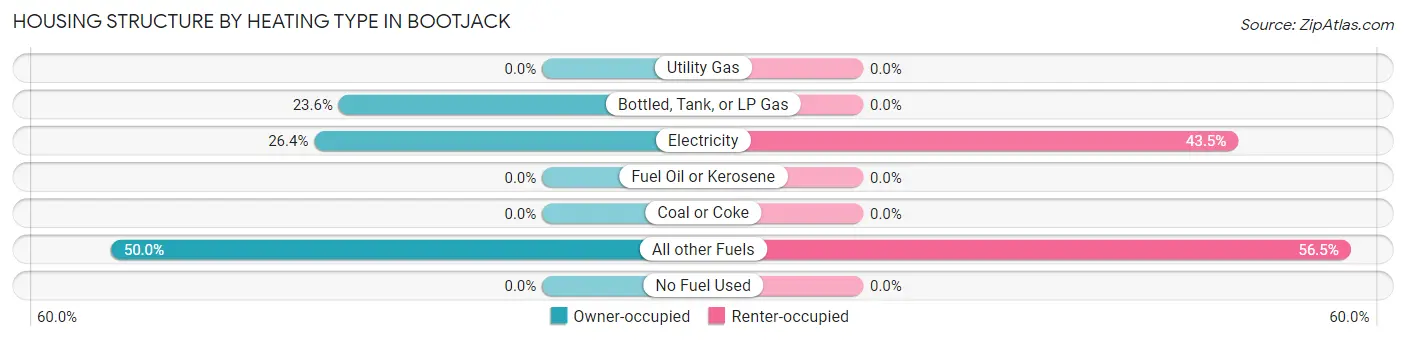
| Heating Type | Owner-occupied | Renter-occupied |
| Utility Gas | 0 (0.0%) | 0 (0.0%) |
| Bottled, Tank, or LP Gas | 25 (23.6%) | 0 (0.0%) |
| Electricity | 28 (26.4%) | 20 (43.5%) |
| Fuel Oil or Kerosene | 0 (0.0%) | 0 (0.0%) |
| Coal or Coke | 0 (0.0%) | 0 (0.0%) |
| All other Fuels | 53 (50.0%) | 26 (56.5%) |
| No Fuel Used | 0 (0.0%) | 0 (0.0%) |
| Total | 106 (100.0%) | 46 (100.0%) |
Household Vehicle Usage in Bootjack
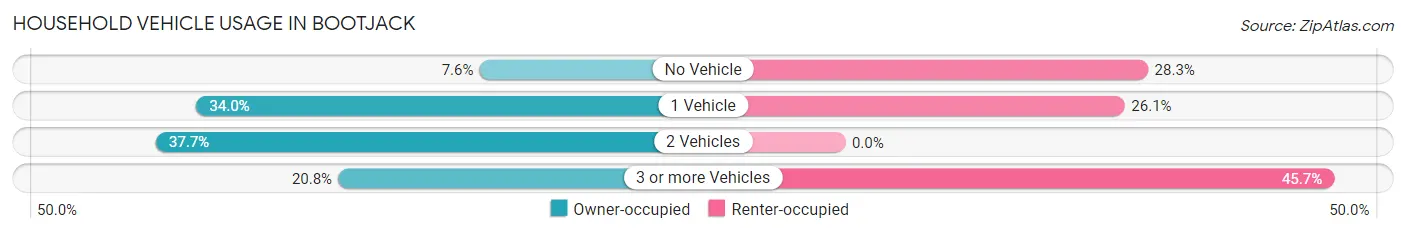
| Vehicles per Household | Owner-occupied | Renter-occupied |
| No Vehicle | 8 (7.5%) | 13 (28.3%) |
| 1 Vehicle | 36 (34.0%) | 12 (26.1%) |
| 2 Vehicles | 40 (37.7%) | 0 (0.0%) |
| 3 or more Vehicles | 22 (20.7%) | 21 (45.7%) |
| Total | 106 (100.0%) | 46 (100.0%) |
Real Estate & Mortgages in Bootjack
Real Estate and Mortgage Overview in Bootjack
| Characteristic | Without Mortgage | With Mortgage |
| Housing Units | 31 | 75 |
| Median Property Value | - | - |
| Median Household Income | - | - |
| Monthly Housing Costs | - | - |
| Real Estate Taxes | $2,563 | $0 |
Property Value by Mortgage Status in Bootjack
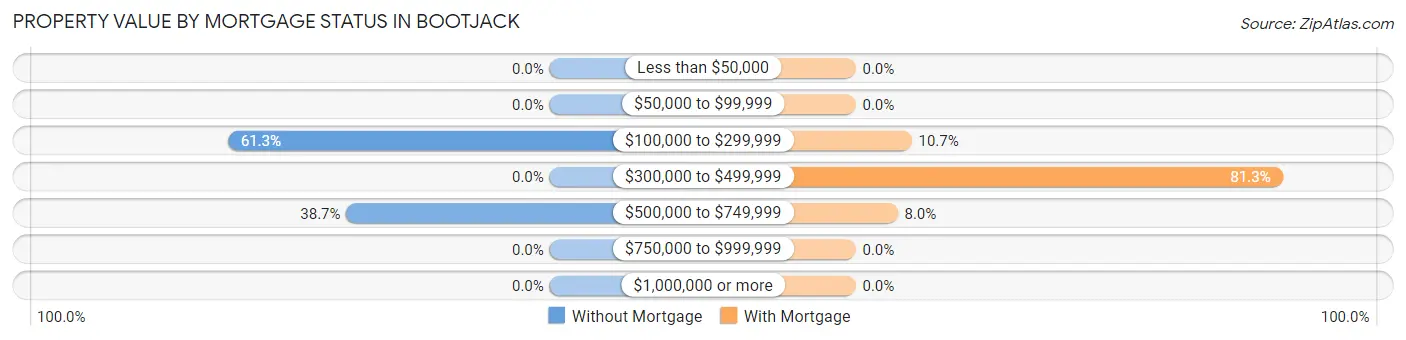
| Property Value | Without Mortgage | With Mortgage |
| Less than $50,000 | 0 (0.0%) | 0 (0.0%) |
| $50,000 to $99,999 | 0 (0.0%) | 0 (0.0%) |
| $100,000 to $299,999 | 19 (61.3%) | 8 (10.7%) |
| $300,000 to $499,999 | 0 (0.0%) | 61 (81.3%) |
| $500,000 to $749,999 | 12 (38.7%) | 6 (8.0%) |
| $750,000 to $999,999 | 0 (0.0%) | 0 (0.0%) |
| $1,000,000 or more | 0 (0.0%) | 0 (0.0%) |
| Total | 31 (100.0%) | 75 (100.0%) |
Household Income by Mortgage Status in Bootjack
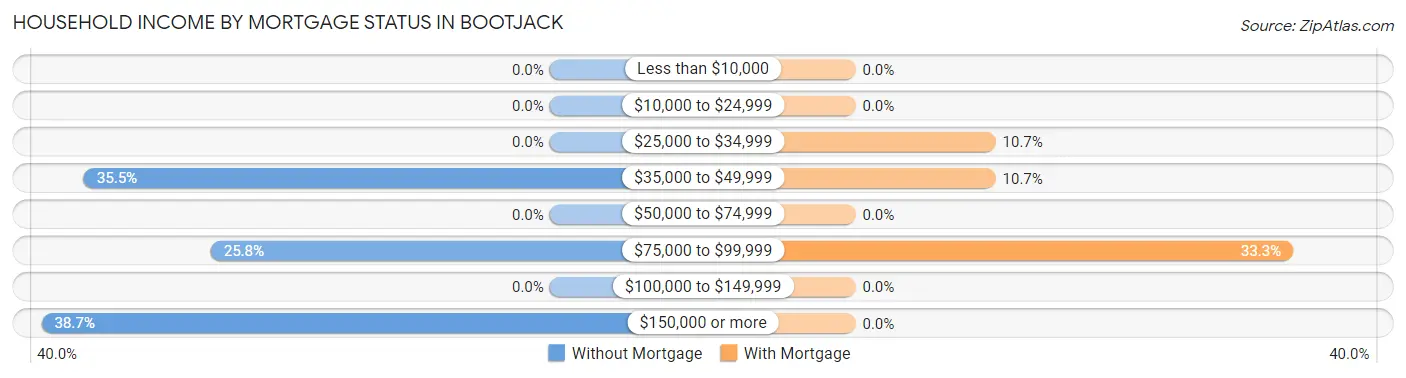
| Household Income | Without Mortgage | With Mortgage |
| Less than $10,000 | 0 (0.0%) | 0 (0.0%) |
| $10,000 to $24,999 | 0 (0.0%) | 0 (0.0%) |
| $25,000 to $34,999 | 0 (0.0%) | 8 (10.7%) |
| $35,000 to $49,999 | 11 (35.5%) | 8 (10.7%) |
| $50,000 to $74,999 | 0 (0.0%) | 0 (0.0%) |
| $75,000 to $99,999 | 8 (25.8%) | 25 (33.3%) |
| $100,000 to $149,999 | 0 (0.0%) | 0 (0.0%) |
| $150,000 or more | 12 (38.7%) | 0 (0.0%) |
| Total | 31 (100.0%) | 75 (100.0%) |
Property Value to Household Income Ratio in Bootjack
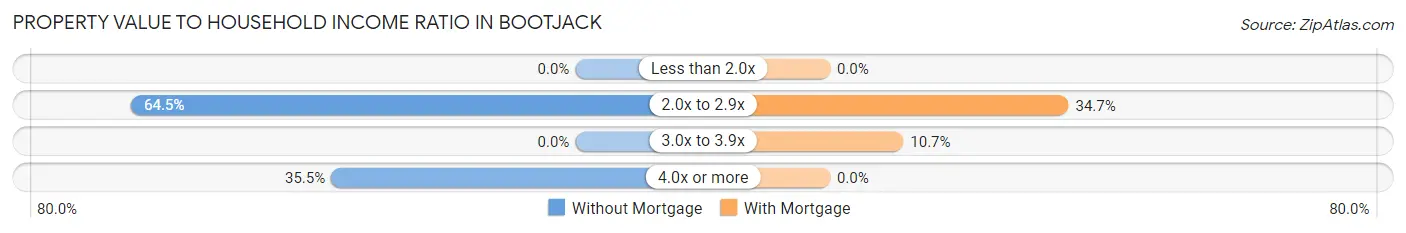
| Value-to-Income Ratio | Without Mortgage | With Mortgage |
| Less than 2.0x | 0 (0.0%) | 0 (0.0%) |
| 2.0x to 2.9x | 20 (64.5%) | 26 (34.7%) |
| 3.0x to 3.9x | 0 (0.0%) | 8 (10.7%) |
| 4.0x or more | 11 (35.5%) | 0 (0.0%) |
| Total | 31 (100.0%) | 75 (100.0%) |
Real Estate Taxes by Mortgage Status in Bootjack
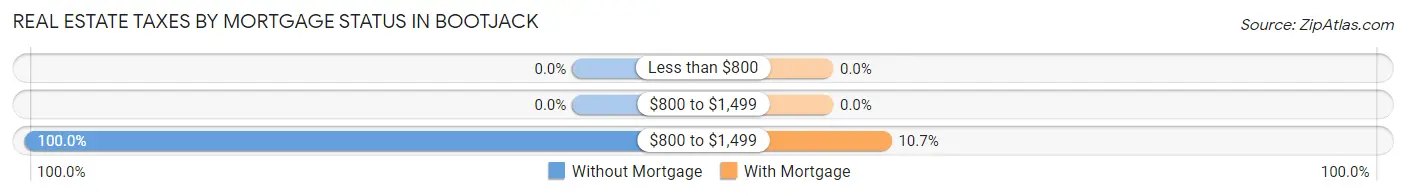
| Property Taxes | Without Mortgage | With Mortgage |
| Less than $800 | 0 (0.0%) | 0 (0.0%) |
| $800 to $1,499 | 0 (0.0%) | 0 (0.0%) |
| $800 to $1,499 | 31 (100.0%) | 8 (10.7%) |
| Total | 31 (100.0%) | 75 (100.0%) |
Health & Disability in Bootjack
Health Insurance Coverage by Age in Bootjack
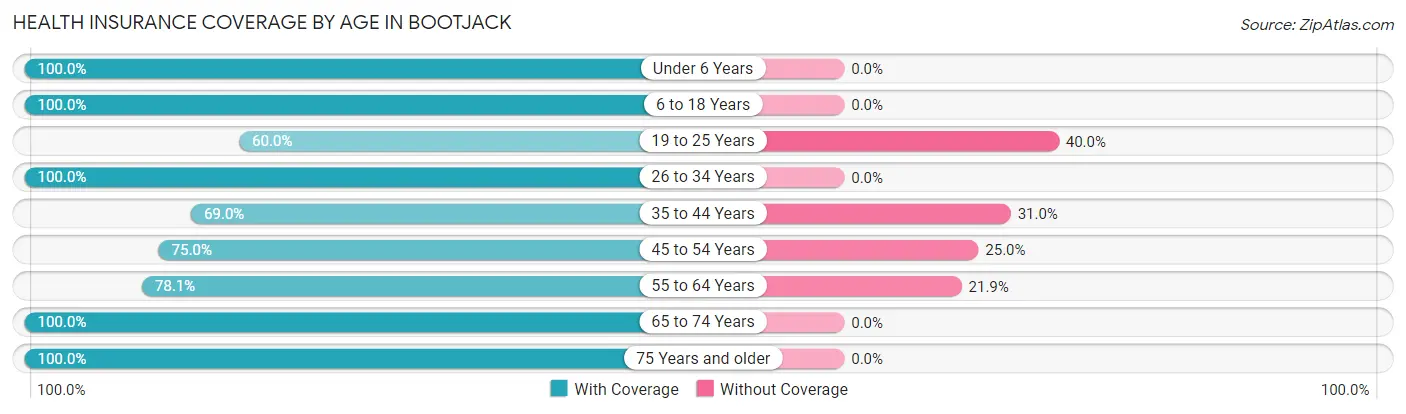
| Age Bracket | With Coverage | Without Coverage |
| Under 6 Years | 14 (100.0%) | 0 (0.0%) |
| 6 to 18 Years | 65 (100.0%) | 0 (0.0%) |
| 19 to 25 Years | 9 (60.0%) | 6 (40.0%) |
| 26 to 34 Years | 20 (100.0%) | 0 (0.0%) |
| 35 to 44 Years | 20 (69.0%) | 9 (31.0%) |
| 45 to 54 Years | 39 (75.0%) | 13 (25.0%) |
| 55 to 64 Years | 75 (78.1%) | 21 (21.9%) |
| 65 to 74 Years | 28 (100.0%) | 0 (0.0%) |
| 75 Years and older | 18 (100.0%) | 0 (0.0%) |
| Total | 288 (85.5%) | 49 (14.5%) |
Health Insurance Coverage by Citizenship Status in Bootjack
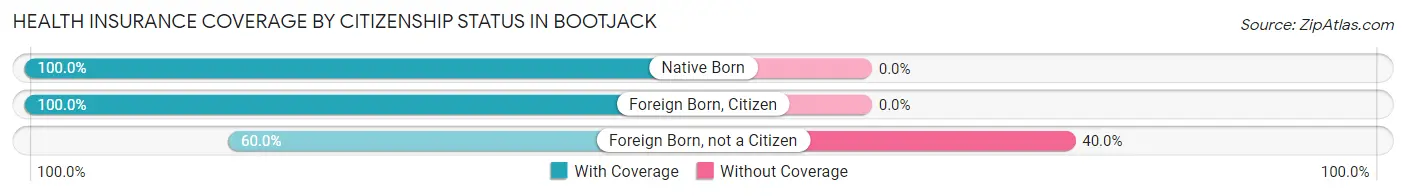
| Citizenship Status | With Coverage | Without Coverage |
| Native Born | 14 (100.0%) | 0 (0.0%) |
| Foreign Born, Citizen | 65 (100.0%) | 0 (0.0%) |
| Foreign Born, not a Citizen | 9 (60.0%) | 6 (40.0%) |
Health Insurance Coverage by Household Income in Bootjack
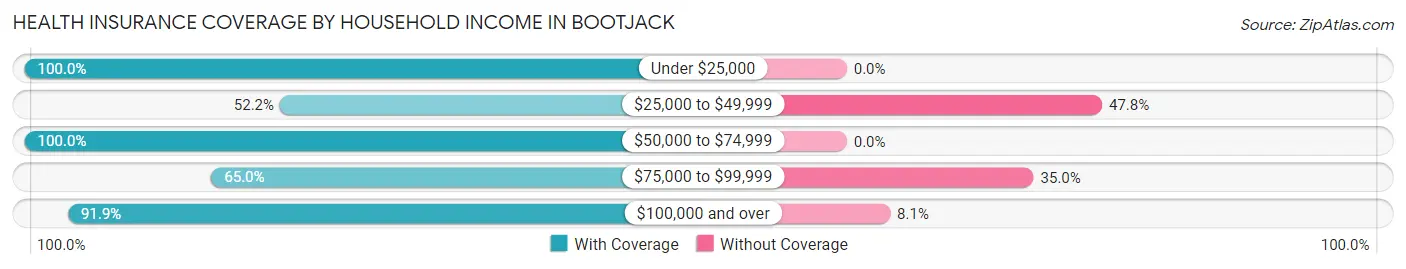
| Household Income | With Coverage | Without Coverage |
| Under $25,000 | 23 (100.0%) | 0 (0.0%) |
| $25,000 to $49,999 | 24 (52.2%) | 22 (47.8%) |
| $50,000 to $74,999 | 68 (100.0%) | 0 (0.0%) |
| $75,000 to $99,999 | 26 (65.0%) | 14 (35.0%) |
| $100,000 and over | 147 (91.9%) | 13 (8.1%) |
Public vs Private Health Insurance Coverage by Age in Bootjack
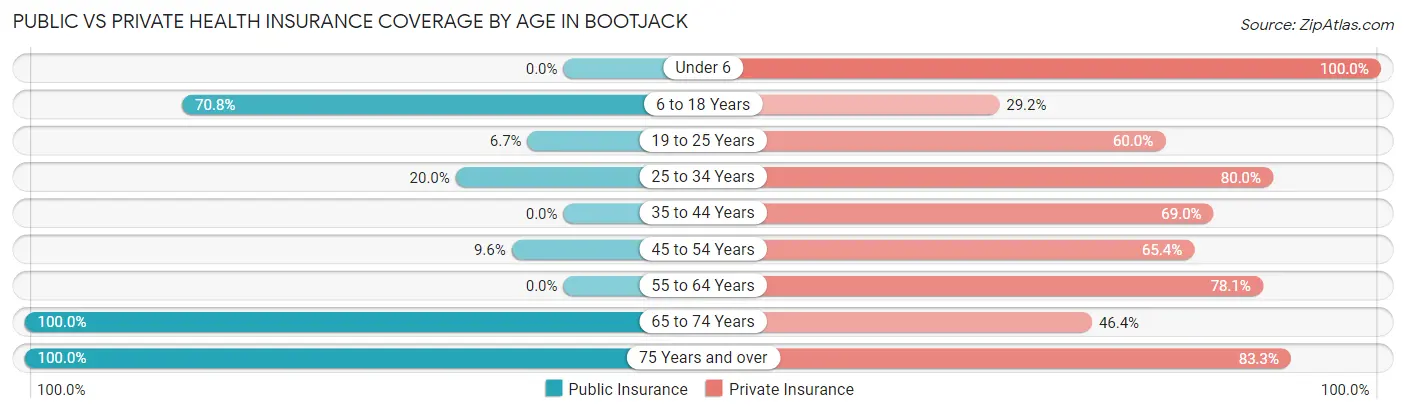
| Age Bracket | Public Insurance | Private Insurance |
| Under 6 | 0 (0.0%) | 14 (100.0%) |
| 6 to 18 Years | 46 (70.8%) | 19 (29.2%) |
| 19 to 25 Years | 1 (6.7%) | 9 (60.0%) |
| 25 to 34 Years | 4 (20.0%) | 16 (80.0%) |
| 35 to 44 Years | 0 (0.0%) | 20 (69.0%) |
| 45 to 54 Years | 5 (9.6%) | 34 (65.4%) |
| 55 to 64 Years | 0 (0.0%) | 75 (78.1%) |
| 65 to 74 Years | 28 (100.0%) | 13 (46.4%) |
| 75 Years and over | 18 (100.0%) | 15 (83.3%) |
| Total | 102 (30.3%) | 215 (63.8%) |
Disability Status by Sex by Age in Bootjack
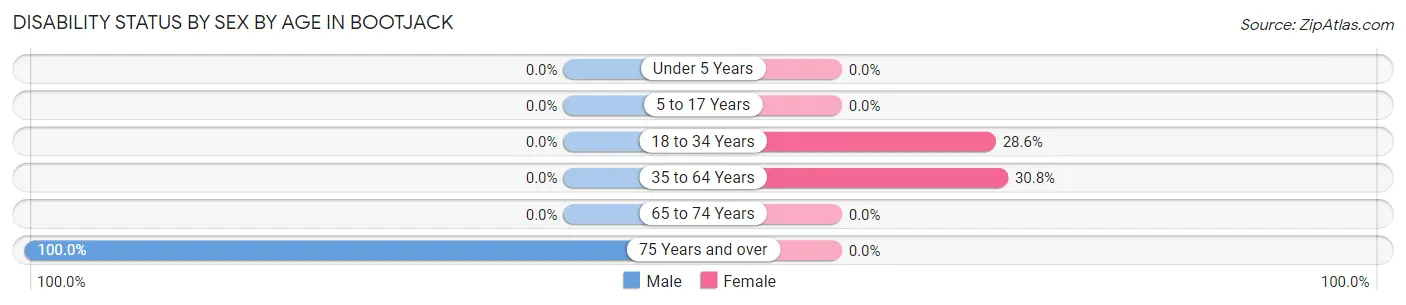
| Age Bracket | Male | Female |
| Under 5 Years | 0 (0.0%) | 0 (0.0%) |
| 5 to 17 Years | 0 (0.0%) | 0 (0.0%) |
| 18 to 34 Years | 0 (0.0%) | 4 (28.6%) |
| 35 to 64 Years | 0 (0.0%) | 33 (30.8%) |
| 65 to 74 Years | 0 (0.0%) | 0 (0.0%) |
| 75 Years and over | 3 (100.0%) | 0 (0.0%) |
Disability Class by Sex by Age in Bootjack
Disability Class: Hearing Difficulty
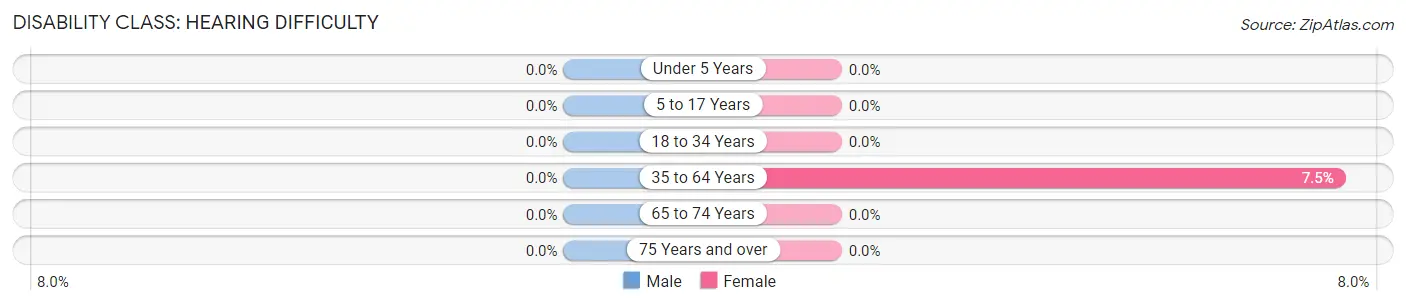
| Age Bracket | Male | Female |
| Under 5 Years | 0 (0.0%) | 0 (0.0%) |
| 5 to 17 Years | 0 (0.0%) | 0 (0.0%) |
| 18 to 34 Years | 0 (0.0%) | 0 (0.0%) |
| 35 to 64 Years | 0 (0.0%) | 8 (7.5%) |
| 65 to 74 Years | 0 (0.0%) | 0 (0.0%) |
| 75 Years and over | 0 (0.0%) | 0 (0.0%) |
Disability Class: Vision Difficulty
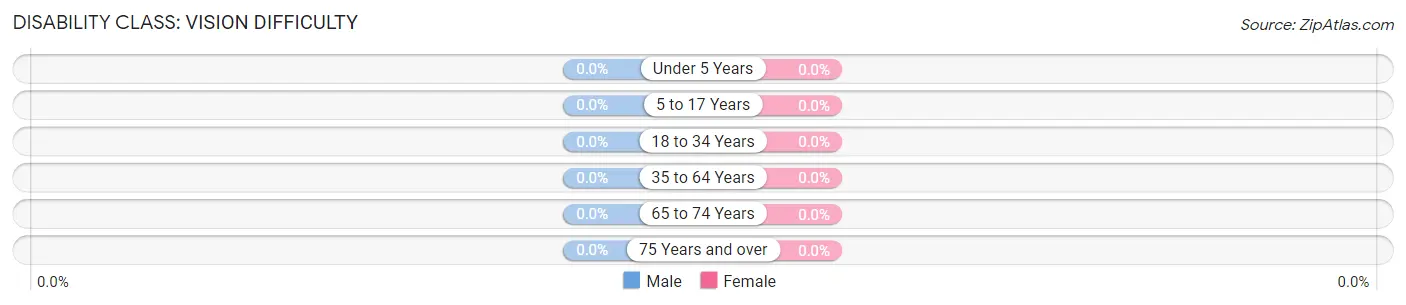
| Age Bracket | Male | Female |
| Under 5 Years | 0 (0.0%) | 0 (0.0%) |
| 5 to 17 Years | 0 (0.0%) | 0 (0.0%) |
| 18 to 34 Years | 0 (0.0%) | 0 (0.0%) |
| 35 to 64 Years | 0 (0.0%) | 0 (0.0%) |
| 65 to 74 Years | 0 (0.0%) | 0 (0.0%) |
| 75 Years and over | 0 (0.0%) | 0 (0.0%) |
Disability Class: Cognitive Difficulty
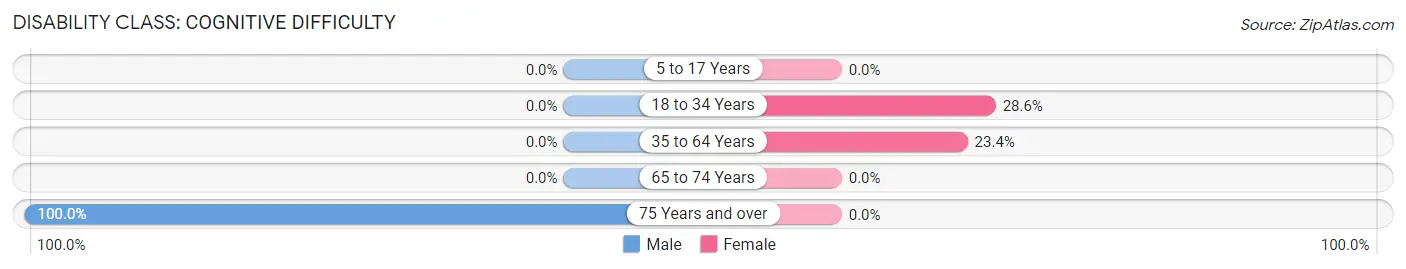
| Age Bracket | Male | Female |
| 5 to 17 Years | 0 (0.0%) | 0 (0.0%) |
| 18 to 34 Years | 0 (0.0%) | 4 (28.6%) |
| 35 to 64 Years | 0 (0.0%) | 25 (23.4%) |
| 65 to 74 Years | 0 (0.0%) | 0 (0.0%) |
| 75 Years and over | 3 (100.0%) | 0 (0.0%) |
Disability Class: Ambulatory Difficulty
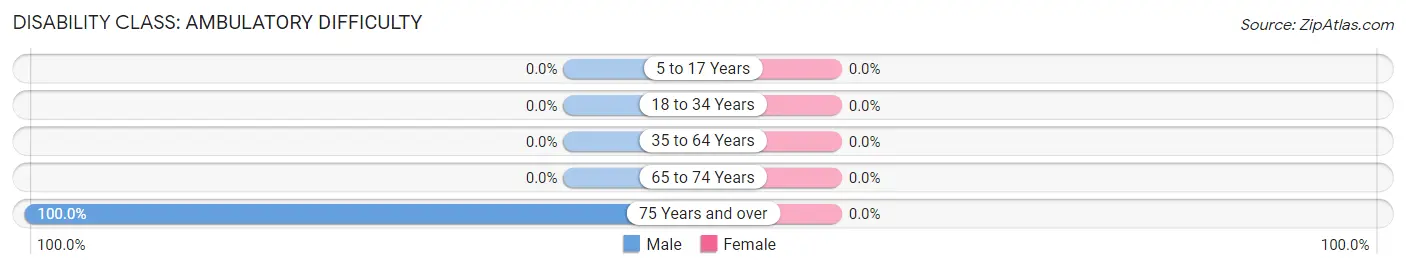
| Age Bracket | Male | Female |
| 5 to 17 Years | 0 (0.0%) | 0 (0.0%) |
| 18 to 34 Years | 0 (0.0%) | 0 (0.0%) |
| 35 to 64 Years | 0 (0.0%) | 0 (0.0%) |
| 65 to 74 Years | 0 (0.0%) | 0 (0.0%) |
| 75 Years and over | 3 (100.0%) | 0 (0.0%) |
Disability Class: Self-Care Difficulty
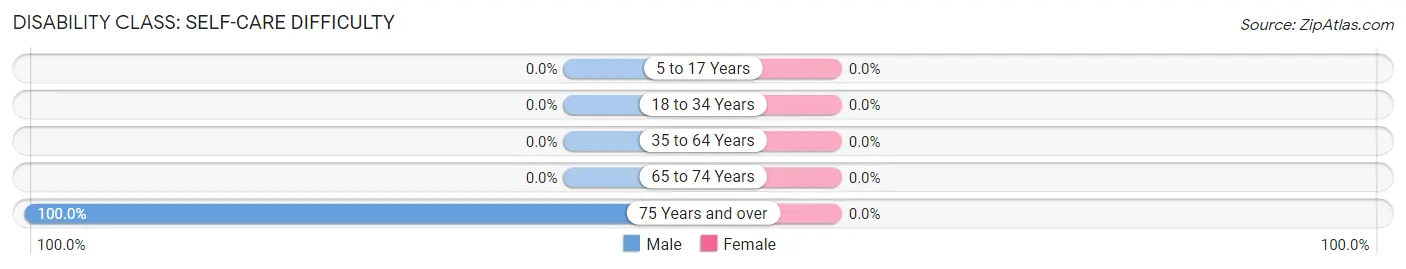
| Age Bracket | Male | Female |
| 5 to 17 Years | 0 (0.0%) | 0 (0.0%) |
| 18 to 34 Years | 0 (0.0%) | 0 (0.0%) |
| 35 to 64 Years | 0 (0.0%) | 0 (0.0%) |
| 65 to 74 Years | 0 (0.0%) | 0 (0.0%) |
| 75 Years and over | 3 (100.0%) | 0 (0.0%) |
Technology Access in Bootjack
Computing Device Access in Bootjack
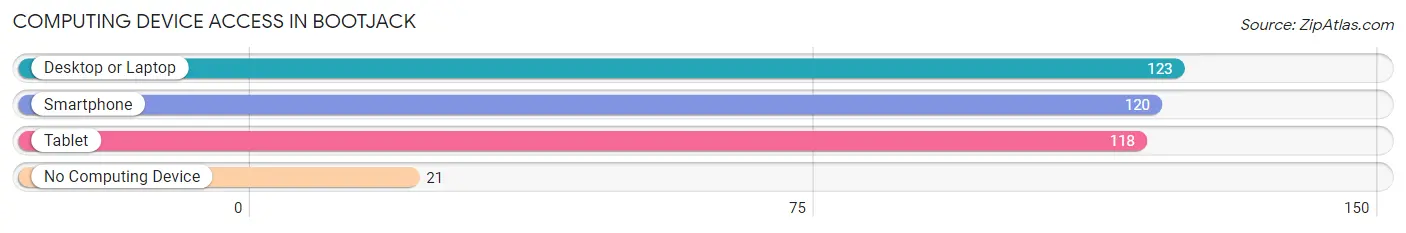
| Device Type | # Households | % Households |
| Desktop or Laptop | 123 | 80.9% |
| Smartphone | 120 | 78.9% |
| Tablet | 118 | 77.6% |
| No Computing Device | 21 | 13.8% |
| Total | 152 | 100.0% |
Internet Access in Bootjack
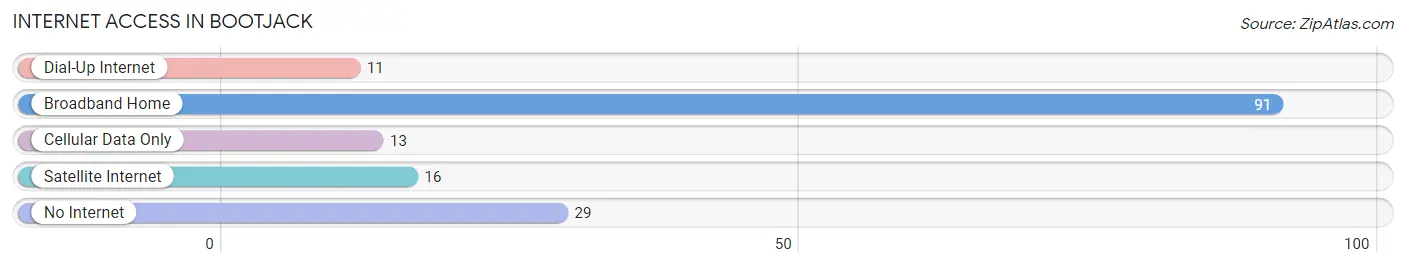
| Internet Type | # Households | % Households |
| Dial-Up Internet | 11 | 7.2% |
| Broadband Home | 91 | 59.9% |
| Cellular Data Only | 13 | 8.6% |
| Satellite Internet | 16 | 10.5% |
| No Internet | 29 | 19.1% |
| Total | 152 | 100.0% |
Bootjack Summary
Bootjack, California is a small unincorporated community located in Mariposa County, California. It is situated in the foothills of the Sierra Nevada Mountains, approximately 25 miles east of the city of Mariposa. The population of Bootjack was estimated to be around 200 people in 2020.
History
The area that is now Bootjack was originally inhabited by the Miwok Native American tribe. The first European settlers arrived in the area in the mid-1800s, and the town was officially established in 1854. The town was named after a nearby creek, which was named after a type of bootjack used by miners to remove their boots.
The town was initially a mining town, with gold being the primary mineral mined. The town also had a few other businesses, such as a general store, a blacksmith, and a saloon. In the late 1800s, the town began to decline as the gold deposits were depleted.
In the early 1900s, the town began to experience a resurgence as the timber industry began to take off. The town was home to several sawmills and lumber companies, and the population began to grow. The town also had a few other businesses, such as a hotel, a post office, and a school.
Geography
Bootjack is located in the foothills of the Sierra Nevada Mountains, approximately 25 miles east of the city of Mariposa. The town is situated at an elevation of 2,000 feet, and the surrounding area is mostly mountainous and heavily forested. The town is located in a valley, and the nearby mountains provide a picturesque backdrop.
The climate in Bootjack is generally mild, with hot summers and cold winters. The average high temperature in the summer is around 90 degrees Fahrenheit, and the average low temperature in the winter is around 30 degrees Fahrenheit.
Economy
The economy of Bootjack is largely based on tourism and the timber industry. The town is home to several sawmills and lumber companies, and the timber industry is the primary source of employment in the area. The town also has a few other businesses, such as a general store, a hotel, and a post office.
The town is also a popular tourist destination, as it is located in a scenic area of the Sierra Nevada Mountains. The town is home to several hiking trails, and it is a popular spot for camping and fishing.
Demographics
The population of Bootjack was estimated to be around 200 people in 2020. The town is predominantly white, with a small Hispanic population. The median household income in the town is around $50,000, and the median home value is around $200,000. The town has a low crime rate, and the unemployment rate is around 4%.
Common Questions
What is Per Capita Income in Bootjack?
Per Capita income in Bootjack is $44,936.
What is Inequality or Gini Index in Bootjack?
Inequality or Gini Index in Bootjack is 0.48.
What is the Total Population of Bootjack?
Total Population of Bootjack is 337.
What is the Total Male Population of Bootjack?
Total Male Population of Bootjack is 126.
What is the Total Female Population of Bootjack?
Total Female Population of Bootjack is 211.
What is the Ratio of Males per 100 Females in Bootjack?
There are 59.72 Males per 100 Females in Bootjack.
What is the Ratio of Females per 100 Males in Bootjack?
There are 167.46 Females per 100 Males in Bootjack.
What is the Median Population Age in Bootjack?
Median Population Age in Bootjack is 53.8 Years.
What is the Average Family Size in Bootjack
Average Family Size in Bootjack is 2.6 People.
What is the Average Household Size in Bootjack
Average Household Size in Bootjack is 2.2 People.
How Large is the Labor Force in Bootjack?
There are 186 People in the Labor Forcein in Bootjack.
What is the Percentage of People in the Labor Force in Bootjack?
61.2% of People are in the Labor Force in Bootjack.
What is the Unemployment Rate in Bootjack?
Unemployment Rate in Bootjack is 2.7%.