Cities with the Highest Percentage of Population Employed in Legal Services & Support in Oregon
RELATED REPORTS & OPTIONS
Legal Services & Support
Oregon
Compare Cities
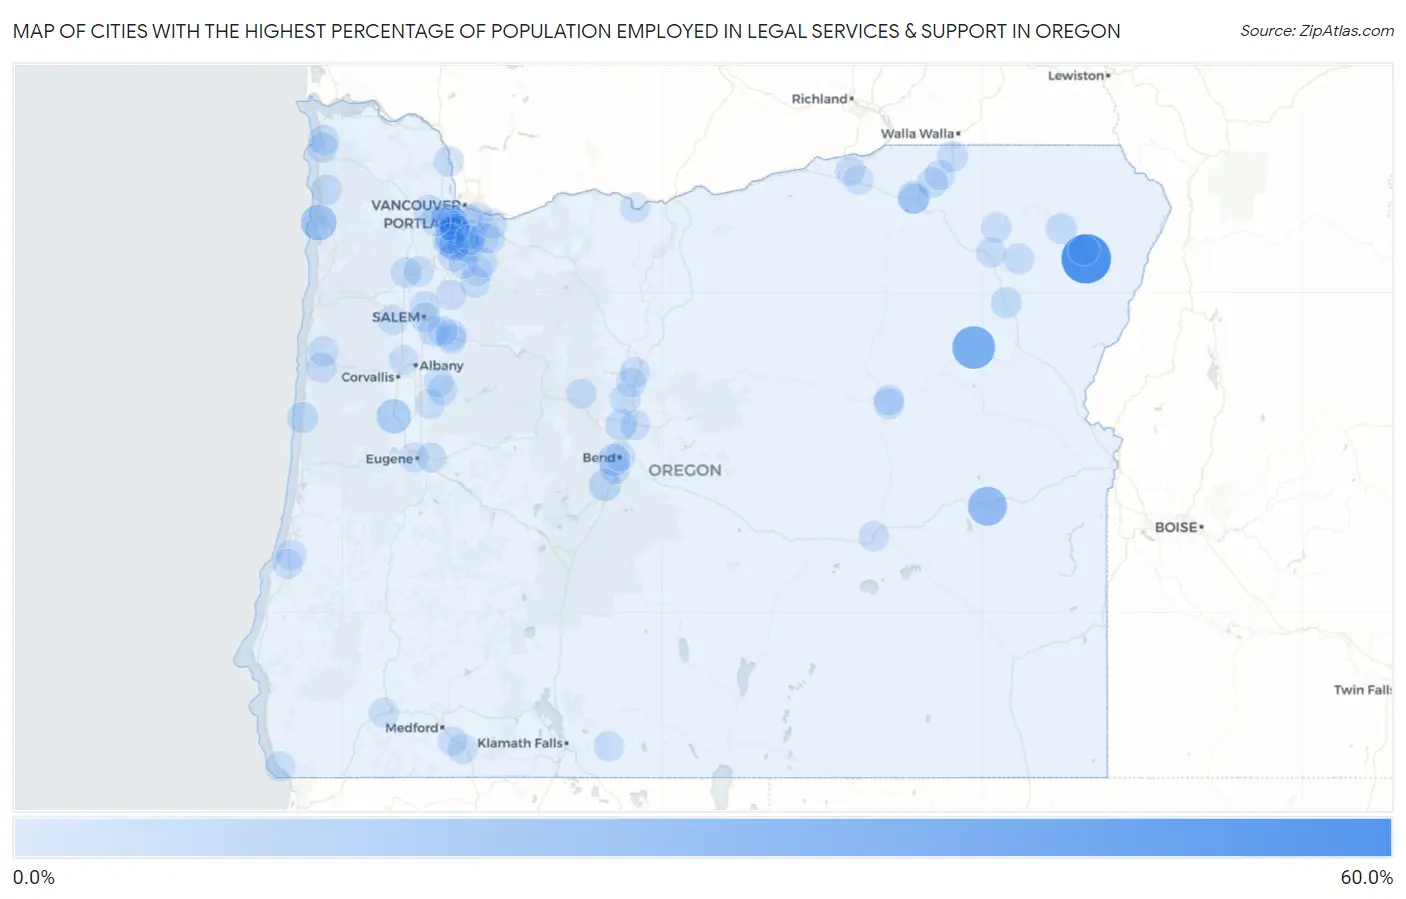
Map of Cities with the Highest Percentage of Population Employed in Legal Services & Support in Oregon
0.0%
60.0%
Cities with the Highest Percentage of Population Employed in Legal Services & Support in Oregon
| City | % Employed | vs State | vs National | |
| 1. | Wallowa Lake | 56.6% | 1.1%(+55.5)#1 | 1.2%(+55.4)#8 |
| 2. | Sumpter | 36.4% | 1.1%(+35.3)#2 | 1.2%(+35.2)#19 |
| 3. | Juntura | 25.0% | 1.1%(+23.9)#3 | 1.2%(+23.8)#35 |
| 4. | Knappa | 17.1% | 1.1%(+16.0)#4 | 1.2%(+15.9)#81 |
| 5. | Cape Meares | 16.7% | 1.1%(+15.6)#5 | 1.2%(+15.5)#86 |
| 6. | River Point | 15.1% | 1.1%(+14.0)#6 | 1.2%(+13.9)#103 |
| 7. | Monroe | 13.1% | 1.1%(+12.0)#7 | 1.2%(+11.9)#140 |
| 8. | Riverside | 7.3% | 1.1%(+6.15)#8 | 1.2%(+6.07)#410 |
| 9. | Dunthorpe | 7.0% | 1.1%(+5.89)#9 | 1.2%(+5.81)#444 |
| 10. | Pleasant Valley | 6.5% | 1.1%(+5.39)#10 | 1.2%(+5.31)#513 |
| 11. | Sunriver | 6.4% | 1.1%(+5.34)#11 | 1.2%(+5.26)#526 |
| 12. | Tetherow | 6.2% | 1.1%(+5.08)#12 | 1.2%(+5.00)#567 |
| 13. | Eagle Crest | 4.3% | 1.1%(+3.20)#13 | 1.2%(+3.12)#1,086 |
| 14. | Stafford | 4.1% | 1.1%(+2.96)#14 | 1.2%(+2.88)#1,201 |
| 15. | Lostine | 4.1% | 1.1%(+2.95)#15 | 1.2%(+2.87)#1,204 |
| 16. | Yachats | 4.0% | 1.1%(+2.86)#16 | 1.2%(+2.77)#1,253 |
| 17. | North Powder | 3.7% | 1.1%(+2.59)#17 | 1.2%(+2.50)#1,408 |
| 18. | Bethany | 3.3% | 1.1%(+2.16)#18 | 1.2%(+2.08)#1,709 |
| 19. | Sublimity | 3.1% | 1.1%(+2.04)#19 | 1.2%(+1.96)#1,815 |
| 20. | Milton Freewater | 2.8% | 1.1%(+1.70)#20 | 1.2%(+1.62)#2,128 |
| 21. | Lake Oswego | 2.8% | 1.1%(+1.68)#21 | 1.2%(+1.60)#2,148 |
| 22. | Canyon City | 2.8% | 1.1%(+1.65)#22 | 1.2%(+1.57)#2,176 |
| 23. | King City | 2.7% | 1.1%(+1.64)#23 | 1.2%(+1.56)#2,190 |
| 24. | Gearhart | 2.6% | 1.1%(+1.53)#24 | 1.2%(+1.44)#2,310 |
| 25. | Garden Home Whitford | 2.6% | 1.1%(+1.52)#25 | 1.2%(+1.44)#2,313 |
| 26. | Oak Hills | 2.5% | 1.1%(+1.40)#26 | 1.2%(+1.32)#2,437 |
| 27. | Crooked River Ranch | 2.4% | 1.1%(+1.34)#27 | 1.2%(+1.26)#2,516 |
| 28. | Columbia City | 2.4% | 1.1%(+1.32)#28 | 1.2%(+1.23)#2,559 |
| 29. | Cove | 2.4% | 1.1%(+1.29)#29 | 1.2%(+1.21)#2,596 |
| 30. | Durham | 2.4% | 1.1%(+1.28)#30 | 1.2%(+1.20)#2,607 |
| 31. | Mcminnville | 2.4% | 1.1%(+1.27)#31 | 1.2%(+1.18)#2,626 |
| 32. | Adams | 2.4% | 1.1%(+1.27)#32 | 1.2%(+1.18)#2,628 |
| 33. | Nehalem | 2.3% | 1.1%(+1.24)#33 | 1.2%(+1.16)#2,663 |
| 34. | Joseph | 2.2% | 1.1%(+1.08)#34 | 1.2%(+0.995)#2,904 |
| 35. | Seaside | 2.2% | 1.1%(+1.06)#35 | 1.2%(+0.975)#2,946 |
| 36. | Portland | 2.1% | 1.1%(+0.992)#36 | 1.2%(+0.909)#3,048 |
| 37. | Siletz | 2.0% | 1.1%(+0.940)#37 | 1.2%(+0.857)#3,136 |
| 38. | Maywood Park | 2.0% | 1.1%(+0.929)#38 | 1.2%(+0.846)#3,163 |
| 39. | John Day | 2.0% | 1.1%(+0.891)#39 | 1.2%(+0.808)#3,230 |
| 40. | Dayton | 2.0% | 1.1%(+0.885)#40 | 1.2%(+0.802)#3,240 |
| 41. | Athena | 2.0% | 1.1%(+0.880)#41 | 1.2%(+0.796)#3,253 |
| 42. | Glasgow | 1.9% | 1.1%(+0.847)#42 | 1.2%(+0.764)#3,313 |
| 43. | Bull Mountain | 1.9% | 1.1%(+0.835)#43 | 1.2%(+0.752)#3,333 |
| 44. | West Haven Sylvan | 1.9% | 1.1%(+0.764)#44 | 1.2%(+0.681)#3,483 |
| 45. | Bonanza | 1.8% | 1.1%(+0.746)#45 | 1.2%(+0.662)#3,525 |
| 46. | Molalla | 1.8% | 1.1%(+0.735)#46 | 1.2%(+0.652)#3,543 |
| 47. | Cedar Hills | 1.8% | 1.1%(+0.731)#47 | 1.2%(+0.648)#3,561 |
| 48. | Deschutes River Woods | 1.8% | 1.1%(+0.730)#48 | 1.2%(+0.647)#3,564 |
| 49. | West Slope | 1.8% | 1.1%(+0.677)#49 | 1.2%(+0.594)#3,691 |
| 50. | Wilsonville | 1.8% | 1.1%(+0.669)#50 | 1.2%(+0.586)#3,712 |
| 51. | Redmond | 1.8% | 1.1%(+0.665)#51 | 1.2%(+0.582)#3,721 |
| 52. | Santa Clara | 1.8% | 1.1%(+0.662)#52 | 1.2%(+0.579)#3,725 |
| 53. | Turner | 1.7% | 1.1%(+0.642)#53 | 1.2%(+0.558)#3,771 |
| 54. | Hines | 1.7% | 1.1%(+0.624)#54 | 1.2%(+0.540)#3,811 |
| 55. | Cedar Mill | 1.7% | 1.1%(+0.610)#55 | 1.2%(+0.527)#3,860 |
| 56. | Toledo | 1.7% | 1.1%(+0.595)#56 | 1.2%(+0.512)#3,897 |
| 57. | Summerville | 1.7% | 1.1%(+0.594)#57 | 1.2%(+0.511)#3,906 |
| 58. | Mount Angel | 1.7% | 1.1%(+0.569)#58 | 1.2%(+0.486)#3,963 |
| 59. | North Plains | 1.5% | 1.1%(+0.433)#59 | 1.2%(+0.349)#4,304 |
| 60. | Keizer | 1.5% | 1.1%(+0.416)#60 | 1.2%(+0.332)#4,362 |
| 61. | West Linn | 1.5% | 1.1%(+0.412)#61 | 1.2%(+0.328)#4,371 |
| 62. | Stayton | 1.5% | 1.1%(+0.407)#62 | 1.2%(+0.324)#4,387 |
| 63. | Dallas | 1.5% | 1.1%(+0.400)#63 | 1.2%(+0.317)#4,405 |
| 64. | Aumsville | 1.5% | 1.1%(+0.383)#64 | 1.2%(+0.299)#4,468 |
| 65. | Island City | 1.5% | 1.1%(+0.355)#65 | 1.2%(+0.271)#4,559 |
| 66. | Metolius | 1.4% | 1.1%(+0.325)#66 | 1.2%(+0.241)#4,657 |
| 67. | Sodaville | 1.4% | 1.1%(+0.308)#67 | 1.2%(+0.225)#4,720 |
| 68. | Salem | 1.4% | 1.1%(+0.305)#68 | 1.2%(+0.222)#4,733 |
| 69. | Milwaukie | 1.4% | 1.1%(+0.302)#69 | 1.2%(+0.219)#4,740 |
| 70. | Gopher Flats | 1.4% | 1.1%(+0.298)#70 | 1.2%(+0.215)#4,750 |
| 71. | River Road | 1.4% | 1.1%(+0.255)#71 | 1.2%(+0.172)#4,880 |
| 72. | Camp Sherman | 1.3% | 1.1%(+0.198)#72 | 1.2%(+0.115)#5,068 |
| 73. | Juniper Canyon | 1.3% | 1.1%(+0.162)#73 | 1.2%(+0.079)#5,198 |
| 74. | Coos Bay | 1.2% | 1.1%(+0.128)#74 | 1.2%(+0.045)#5,340 |
| 75. | Boring | 1.2% | 1.1%(+0.119)#75 | 1.2%(+0.036)#5,377 |
| 76. | Eugene | 1.2% | 1.1%(+0.116)#76 | 1.2%(+0.033)#5,387 |
| 77. | Mulino | 1.2% | 1.1%(+0.116)#77 | 1.2%(+0.033)#5,388 |
| 78. | Happy Valley | 1.2% | 1.1%(+0.065)#78 | 1.2%(-0.018)#5,580 |
| 79. | Beavercreek | 1.2% | 1.1%(+0.061)#79 | 1.2%(-0.023)#5,603 |
| 80. | Damascus | 1.2% | 1.1%(+0.054)#80 | 1.2%(-0.029)#5,630 |
| 81. | Tualatin | 1.1% | 1.1%(+0.032)#81 | 1.2%(-0.051)#5,721 |
| 82. | Raleigh Hills | 1.1% | 1.1%(+0.018)#82 | 1.2%(-0.066)#5,783 |
| 83. | Redwood | 1.1% | 1.1%(+0.015)#83 | 1.2%(-0.068)#5,788 |
| 84. | Ashland | 1.1% | 1.1%(-0.027)#84 | 1.2%(-0.110)#5,991 |
| 85. | Brookings | 1.1% | 1.1%(-0.032)#85 | 1.2%(-0.115)#6,019 |
| 86. | The Dalles | 1.0% | 1.1%(-0.068)#86 | 1.2%(-0.151)#6,202 |
| 87. | Brownsville | 1.0% | 1.1%(-0.085)#87 | 1.2%(-0.168)#6,291 |
| 88. | Stanfield | 0.99% | 1.1%(-0.111)#88 | 1.2%(-0.194)#6,421 |
| 89. | Bend | 0.98% | 1.1%(-0.125)#89 | 1.2%(-0.208)#6,492 |
| 90. | Tigard | 0.97% | 1.1%(-0.134)#90 | 1.2%(-0.217)#6,526 |
| 91. | Culver | 0.93% | 1.1%(-0.167)#91 | 1.2%(-0.251)#6,721 |
| 92. | Canby | 0.91% | 1.1%(-0.188)#92 | 1.2%(-0.272)#6,822 |
| 93. | Oak Grove | 0.91% | 1.1%(-0.193)#93 | 1.2%(-0.277)#6,847 |
| 94. | Gresham | 0.88% | 1.1%(-0.217)#94 | 1.2%(-0.300)#6,954 |
| 95. | Hillsboro | 0.88% | 1.1%(-0.217)#95 | 1.2%(-0.300)#6,955 |
| 96. | Talent | 0.88% | 1.1%(-0.224)#96 | 1.2%(-0.307)#7,001 |
| 97. | Hermiston | 0.87% | 1.1%(-0.228)#97 | 1.2%(-0.311)#7,028 |
| 98. | Springfield | 0.87% | 1.1%(-0.233)#98 | 1.2%(-0.316)#7,051 |
| 99. | Adair Village | 0.84% | 1.1%(-0.263)#99 | 1.2%(-0.346)#7,206 |
| 100. | Lebanon | 0.83% | 1.1%(-0.271)#100 | 1.2%(-0.354)#7,242 |
Common Questions
What are the Top 10 Cities with the Highest Percentage of Population Employed in Legal Services & Support in Oregon?
Top 10 Cities with the Highest Percentage of Population Employed in Legal Services & Support in Oregon are:
#1
56.6%
#2
36.4%
#3
25.0%
#4
16.7%
#5
13.1%
#6
7.3%
#7
6.4%
#8
6.2%
#9
4.3%
#10
4.1%
What city has the Highest Percentage of Population Employed in Legal Services & Support in Oregon?
Wallowa Lake has the Highest Percentage of Population Employed in Legal Services & Support in Oregon with 56.6%.
What is the Percentage of Population Employed in Legal Services & Support in the State of Oregon?
Percentage of Population Employed in Legal Services & Support in Oregon is 1.1%.
What is the Percentage of Population Employed in Legal Services & Support in the United States?
Percentage of Population Employed in Legal Services & Support in the United States is 1.2%.