Alto, CA Map & Demographics
Alto Map
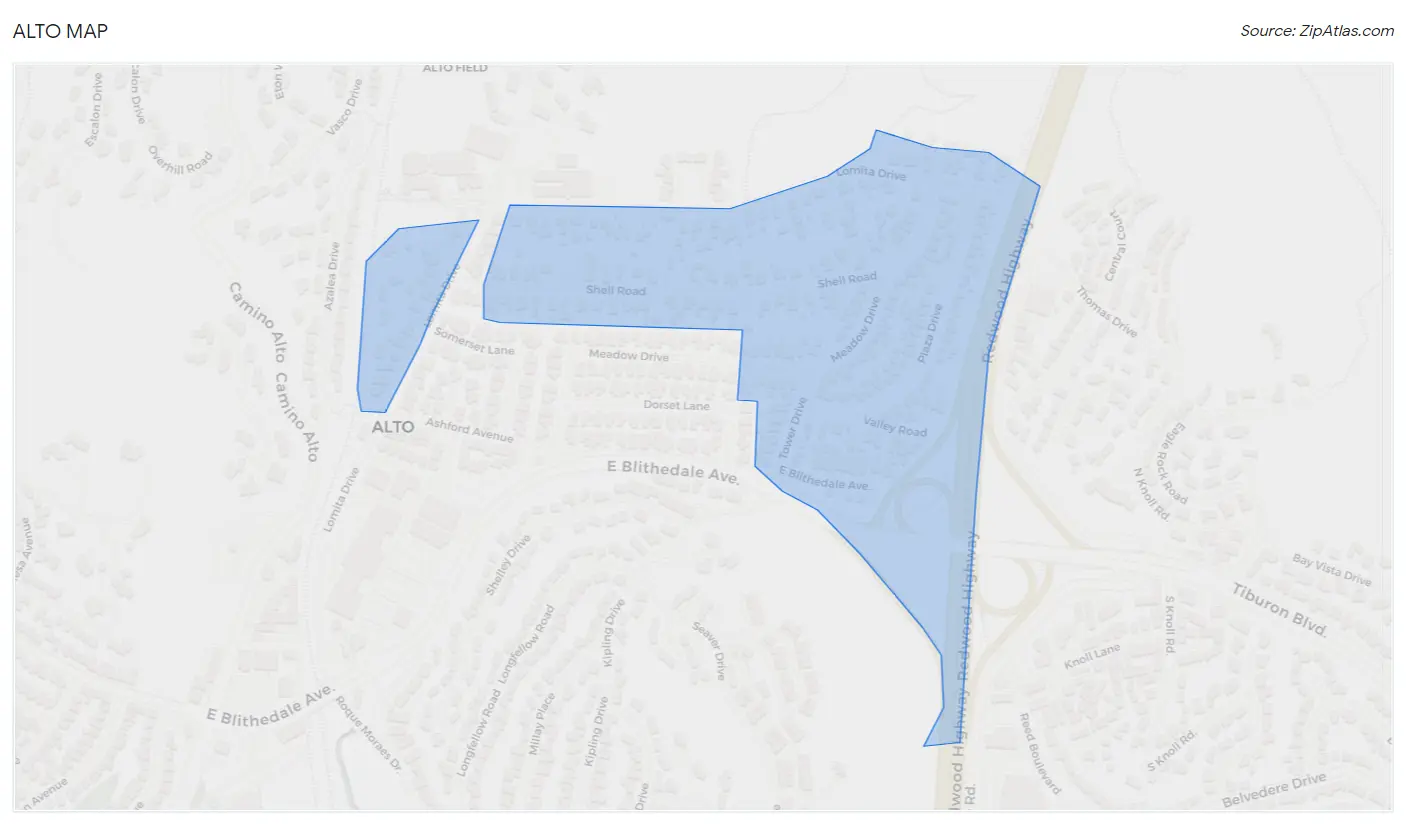
Alto Overview
$120,225
PER CAPITA INCOME
$221,912
AVG FAMILY INCOME
$216,495
AVG HOUSEHOLD INCOME
0.43
INEQUALITY / GINI INDEX
659
TOTAL POPULATION
261
MALE POPULATION
398
FEMALE POPULATION
65.58
MALES / 100 FEMALES
152.49
FEMALES / 100 MALES
48.8
MEDIAN AGE
2.6
AVG FAMILY SIZE
2.2
AVG HOUSEHOLD SIZE
370
LABOR FORCE [ PEOPLE ]
66.7%
PERCENT IN LABOR FORCE
7.8%
UNEMPLOYMENT RATE
Income in Alto
Income Overview in Alto
Per Capita Income in Alto is $120,225, while median incomes of families and households are $221,912 and $216,495 respectively.
| Characteristic | Number | Measure |
| Per Capita Income | 659 | $120,225 |
| Median Family Income | 232 | $221,912 |
| Mean Family Income | 232 | $295,880 |
| Median Household Income | 295 | $216,495 |
| Mean Household Income | 295 | $258,903 |
| Income Deficit | 232 | $0 |
| Wage / Income Gap (%) | 659 | 0.00% |
| Wage / Income Gap ($) | 659 | 100.00¢ per $1 |
| Gini / Inequality Index | 659 | 0.43 |
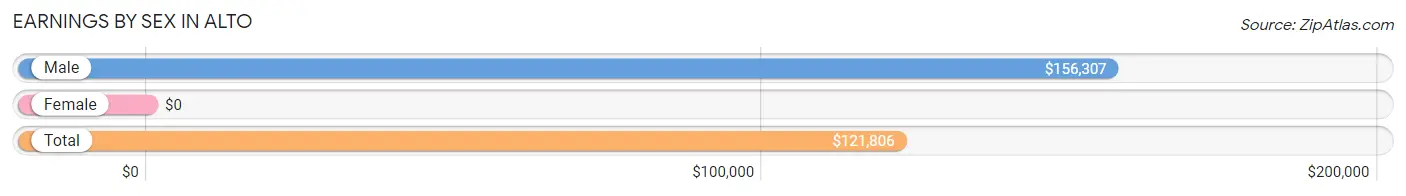
Earnings by Sex in Alto
| Sex | Number | Average Earnings |
| Male | 165 (43.2%) | $156,307 |
| Female | 217 (56.8%) | $0 |
| Total | 382 (100.0%) | $121,806 |
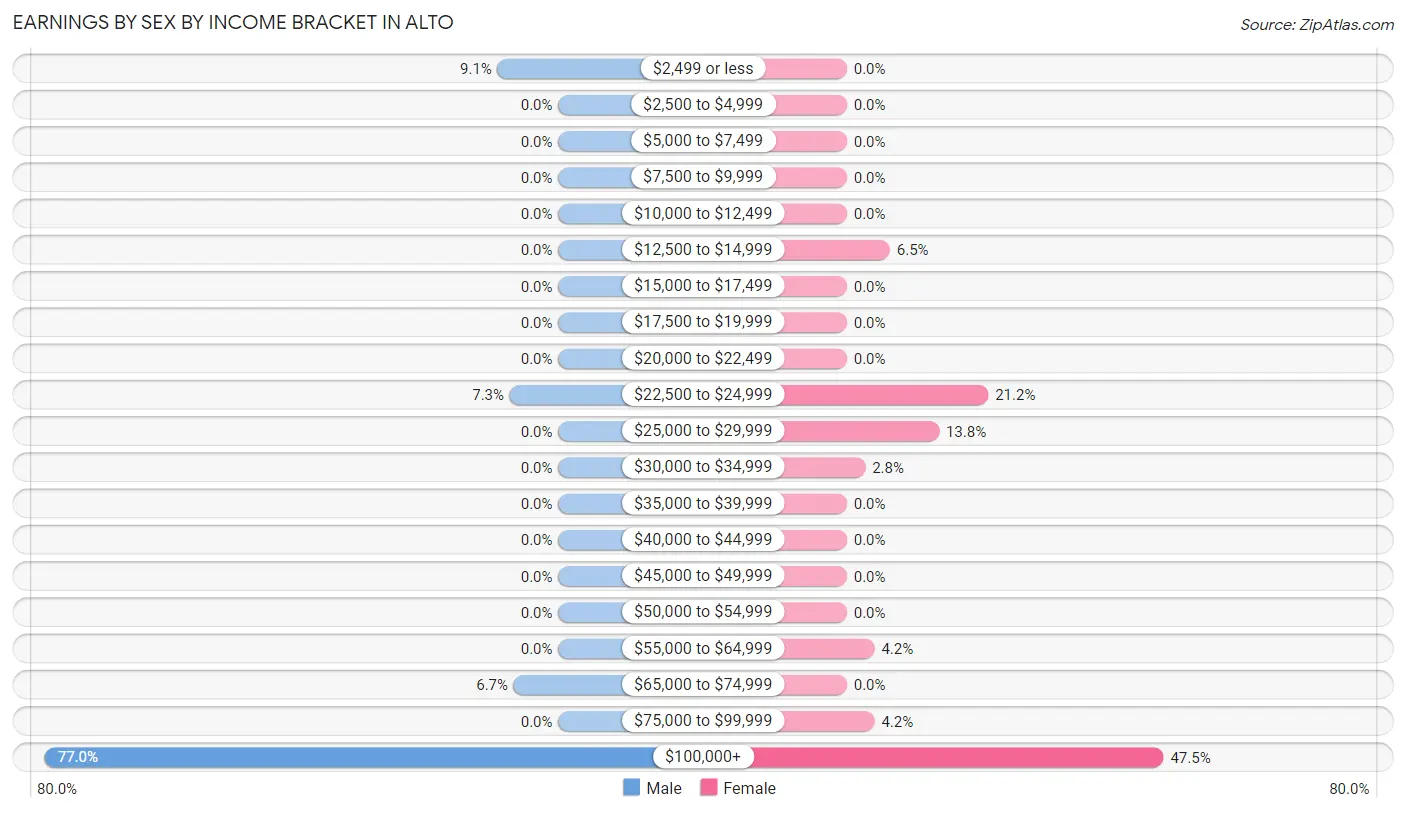
Earnings by Sex by Income Bracket in Alto
The most common earnings brackets in Alto are $100,000+ for men (127 | 77.0%) and $100,000+ for women (103 | 47.5%).
| Income | Male | Female |
| $2,499 or less | 15 (9.1%) | 0 (0.0%) |
| $2,500 to $4,999 | 0 (0.0%) | 0 (0.0%) |
| $5,000 to $7,499 | 0 (0.0%) | 0 (0.0%) |
| $7,500 to $9,999 | 0 (0.0%) | 0 (0.0%) |
| $10,000 to $12,499 | 0 (0.0%) | 0 (0.0%) |
| $12,500 to $14,999 | 0 (0.0%) | 14 (6.5%) |
| $15,000 to $17,499 | 0 (0.0%) | 0 (0.0%) |
| $17,500 to $19,999 | 0 (0.0%) | 0 (0.0%) |
| $20,000 to $22,499 | 0 (0.0%) | 0 (0.0%) |
| $22,500 to $24,999 | 12 (7.3%) | 46 (21.2%) |
| $25,000 to $29,999 | 0 (0.0%) | 30 (13.8%) |
| $30,000 to $34,999 | 0 (0.0%) | 6 (2.8%) |
| $35,000 to $39,999 | 0 (0.0%) | 0 (0.0%) |
| $40,000 to $44,999 | 0 (0.0%) | 0 (0.0%) |
| $45,000 to $49,999 | 0 (0.0%) | 0 (0.0%) |
| $50,000 to $54,999 | 0 (0.0%) | 0 (0.0%) |
| $55,000 to $64,999 | 0 (0.0%) | 9 (4.2%) |
| $65,000 to $74,999 | 11 (6.7%) | 0 (0.0%) |
| $75,000 to $99,999 | 0 (0.0%) | 9 (4.2%) |
| $100,000+ | 127 (77.0%) | 103 (47.5%) |
| Total | 165 (100.0%) | 217 (100.0%) |
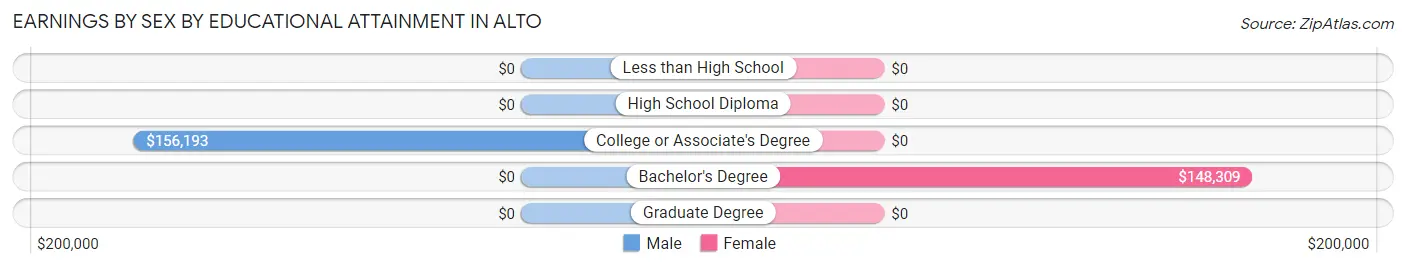
Earnings by Sex by Educational Attainment in Alto
| Educational Attainment | Male Income | Female Income |
| Less than High School | - | - |
| High School Diploma | - | - |
| College or Associate's Degree | $156,193 | $0 |
| Bachelor's Degree | - | - |
| Graduate Degree | - | - |
| Total | $156,307 | $0 |
Family Income in Alto
Family Income Brackets in Alto
According to the Alto family income data, there are 175 families falling into the $200,000+ income range, which is the most common income bracket and makes up 75.4% of all families.
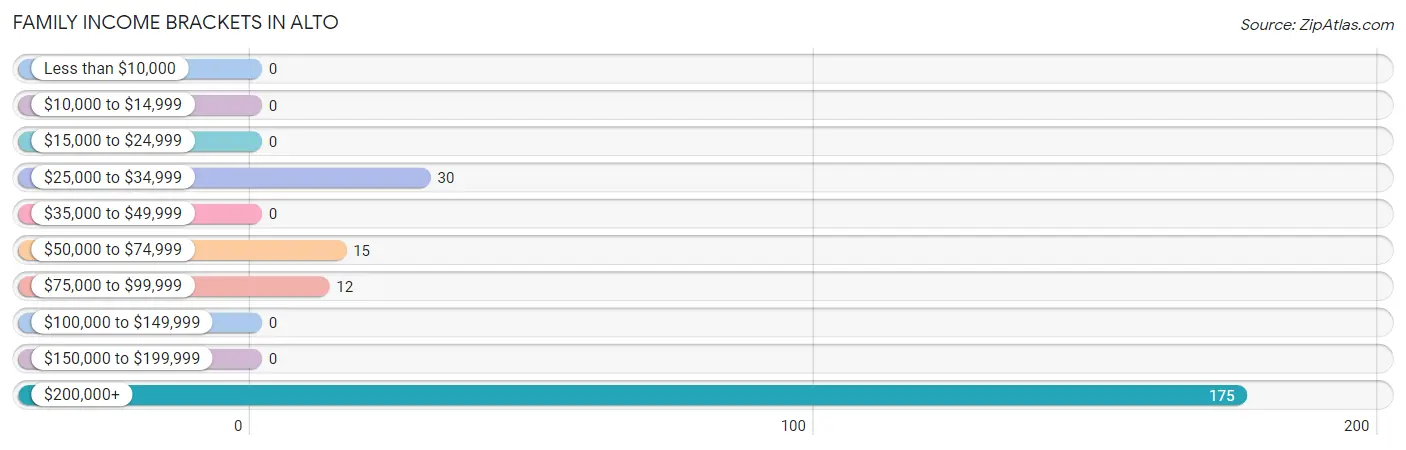
| Income Bracket | # Families | % Families |
| Less than $10,000 | 0 | 0.0% |
| $10,000 to $14,999 | 0 | 0.0% |
| $15,000 to $24,999 | 0 | 0.0% |
| $25,000 to $34,999 | 30 | 12.9% |
| $35,000 to $49,999 | 0 | 0.0% |
| $50,000 to $74,999 | 15 | 6.5% |
| $75,000 to $99,999 | 12 | 5.2% |
| $100,000 to $149,999 | 0 | 0.0% |
| $150,000 to $199,999 | 0 | 0.0% |
| $200,000+ | 175 | 75.4% |
Family Income by Famaliy Size in Alto
4-person families (54 | 23.3%) account for the highest median family income in Alto with $250,001 per family, while 2-person families (124 | 53.4%) have the highest median income of $107,962 per family member.
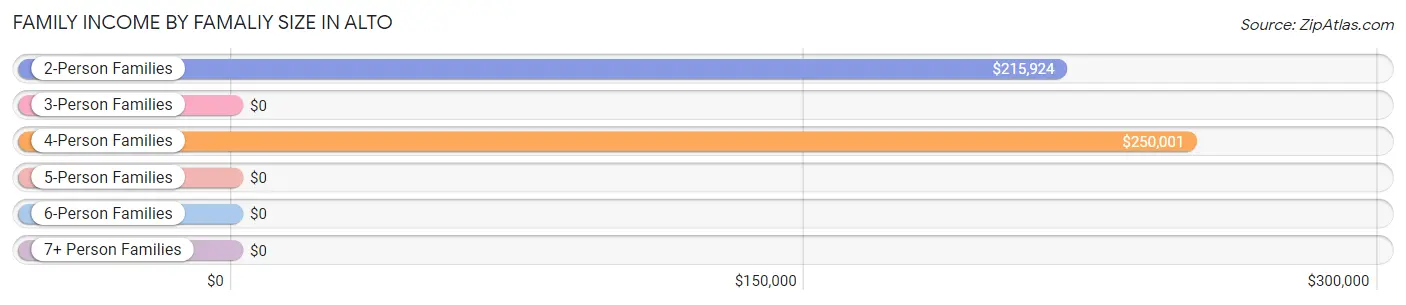
| Income Bracket | # Families | Median Income |
| 2-Person Families | 124 (53.4%) | $215,924 |
| 3-Person Families | 54 (23.3%) | $0 |
| 4-Person Families | 54 (23.3%) | $250,001 |
| 5-Person Families | 0 (0.0%) | $0 |
| 6-Person Families | 0 (0.0%) | $0 |
| 7+ Person Families | 0 (0.0%) | $0 |
| Total | 232 (100.0%) | $221,912 |
Family Income by Number of Earners in Alto
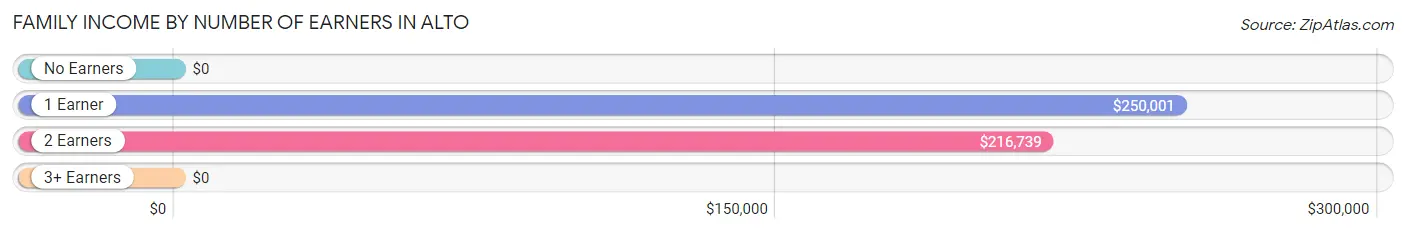
| Number of Earners | # Families | Median Income |
| No Earners | 0 (0.0%) | $0 |
| 1 Earner | 114 (49.1%) | $250,001 |
| 2 Earners | 118 (50.9%) | $216,739 |
| 3+ Earners | 0 (0.0%) | $0 |
| Total | 232 (100.0%) | $221,912 |
Household Income in Alto
Household Income Brackets in Alto
With 175 households falling in the category, the $200,000+ income range is the most frequent in Alto, accounting for 59.3% of all households.
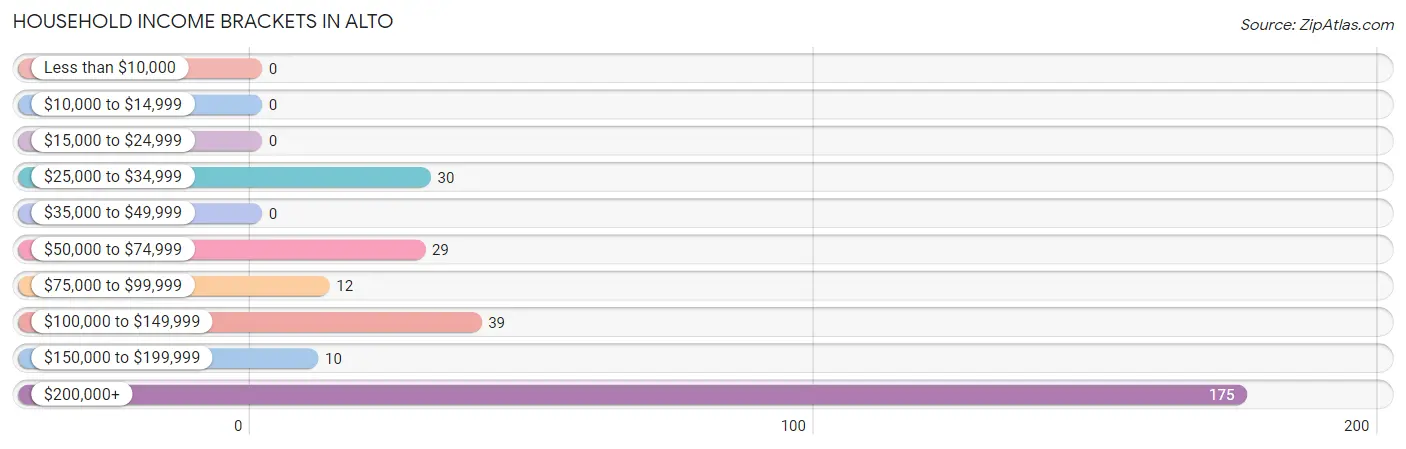
| Income Bracket | # Households | % Households |
| Less than $10,000 | 0 | 0.0% |
| $10,000 to $14,999 | 0 | 0.0% |
| $15,000 to $24,999 | 0 | 0.0% |
| $25,000 to $34,999 | 30 | 10.2% |
| $35,000 to $49,999 | 0 | 0.0% |
| $50,000 to $74,999 | 29 | 9.8% |
| $75,000 to $99,999 | 12 | 4.1% |
| $100,000 to $149,999 | 39 | 13.2% |
| $150,000 to $199,999 | 10 | 3.4% |
| $200,000+ | 175 | 59.3% |
Household Income by Householder Age in Alto
The median household income in Alto is $216,495, with the highest median household income of $221,912 found in the 45 to 64 years age bracket for the primary householder. A total of 196 households (66.4%) fall into this category.
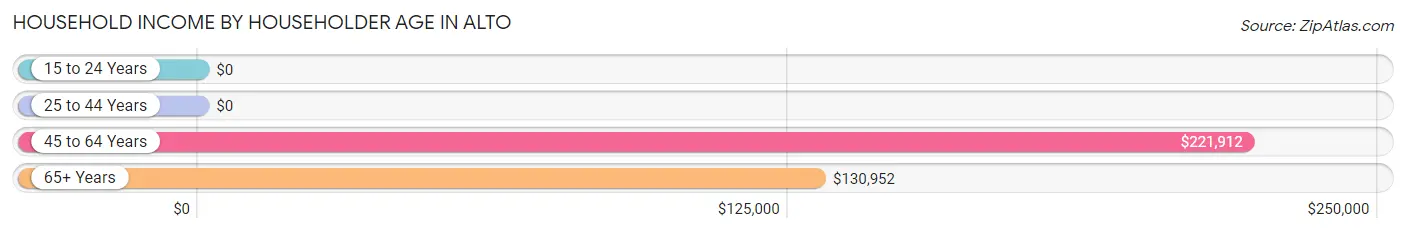
| Income Bracket | # Households | Median Income |
| 15 to 24 Years | 0 (0.0%) | $0 |
| 25 to 44 Years | 55 (18.6%) | $0 |
| 45 to 64 Years | 196 (66.4%) | $221,912 |
| 65+ Years | 44 (14.9%) | $130,952 |
| Total | 295 (100.0%) | $216,495 |
Poverty in Alto
Income Below Poverty by Sex and Age in Alto
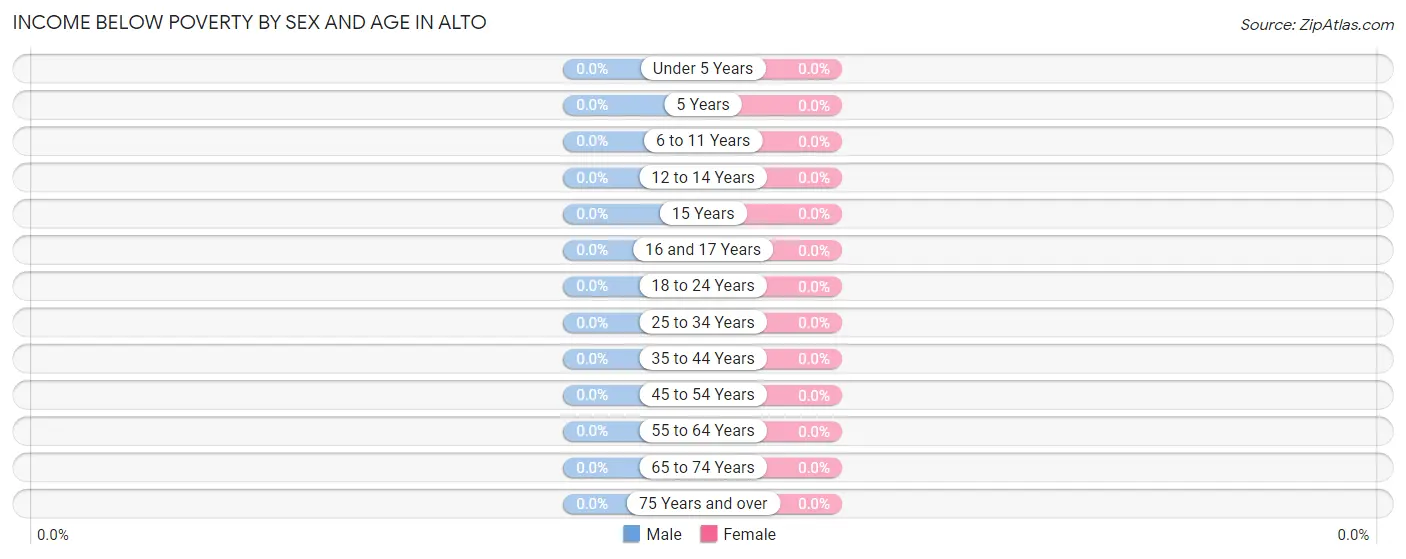
| Age Bracket | Male | Female |
| Under 5 Years | 0 (0.0%) | 0 (0.0%) |
| 5 Years | 0 (0.0%) | 0 (0.0%) |
| 6 to 11 Years | 0 (0.0%) | 0 (0.0%) |
| 12 to 14 Years | 0 (0.0%) | 0 (0.0%) |
| 15 Years | 0 (0.0%) | 0 (0.0%) |
| 16 and 17 Years | 0 (0.0%) | 0 (0.0%) |
| 18 to 24 Years | 0 (0.0%) | 0 (0.0%) |
| 25 to 34 Years | 0 (0.0%) | 0 (0.0%) |
| 35 to 44 Years | 0 (0.0%) | 0 (0.0%) |
| 45 to 54 Years | 0 (0.0%) | 0 (0.0%) |
| 55 to 64 Years | 0 (0.0%) | 0 (0.0%) |
| 65 to 74 Years | 0 (0.0%) | 0 (0.0%) |
| 75 Years and over | 0 (0.0%) | 0 (0.0%) |
| Total | 0 (0.0%) | 0 (0.0%) |
Income Above Poverty by Sex and Age in Alto
According to the poverty statistics in Alto, males aged 6 to 11 years and females aged under 5 years are the age groups that are most secure financially, with 100.0% of males and 100.0% of females in these age groups living above the poverty line.
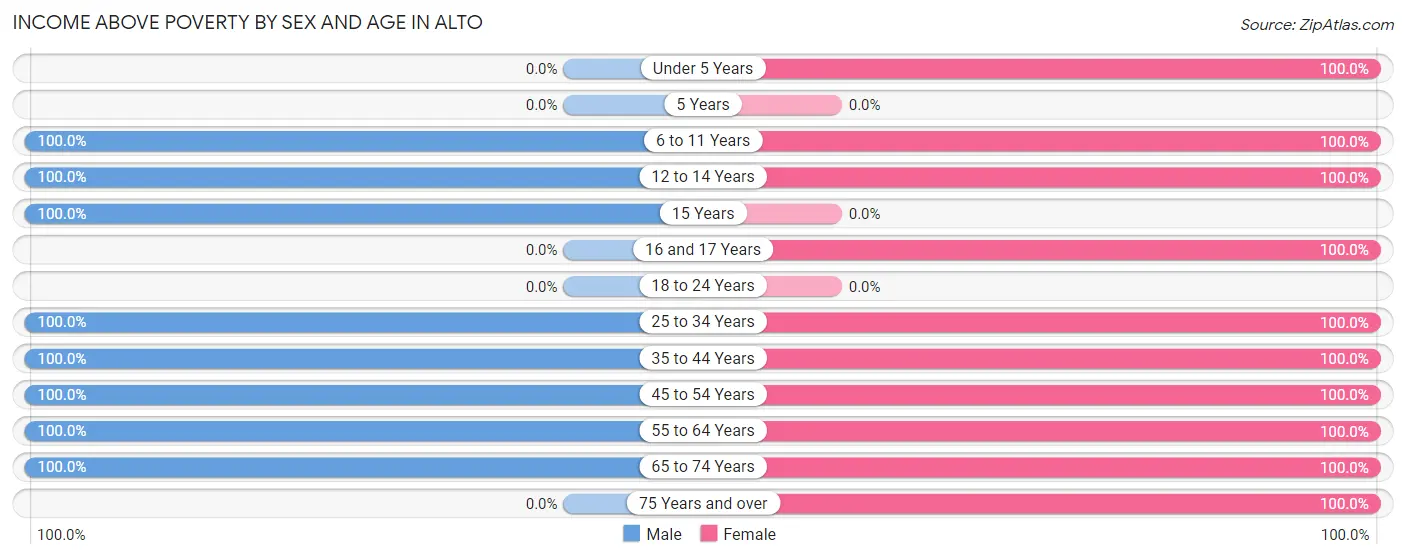
| Age Bracket | Male | Female |
| Under 5 Years | 0 (0.0%) | 8 (100.0%) |
| 5 Years | 0 (0.0%) | 0 (0.0%) |
| 6 to 11 Years | 31 (100.0%) | 12 (100.0%) |
| 12 to 14 Years | 20 (100.0%) | 12 (100.0%) |
| 15 Years | 21 (100.0%) | 0 (0.0%) |
| 16 and 17 Years | 0 (0.0%) | 31 (100.0%) |
| 18 to 24 Years | 0 (0.0%) | 0 (0.0%) |
| 25 to 34 Years | 66 (100.0%) | 46 (100.0%) |
| 35 to 44 Years | 9 (100.0%) | 33 (100.0%) |
| 45 to 54 Years | 39 (100.0%) | 69 (100.0%) |
| 55 to 64 Years | 51 (100.0%) | 152 (100.0%) |
| 65 to 74 Years | 24 (100.0%) | 21 (100.0%) |
| 75 Years and over | 0 (0.0%) | 14 (100.0%) |
| Total | 261 (100.0%) | 398 (100.0%) |
Income Below Poverty Among Married-Couple Families in Alto
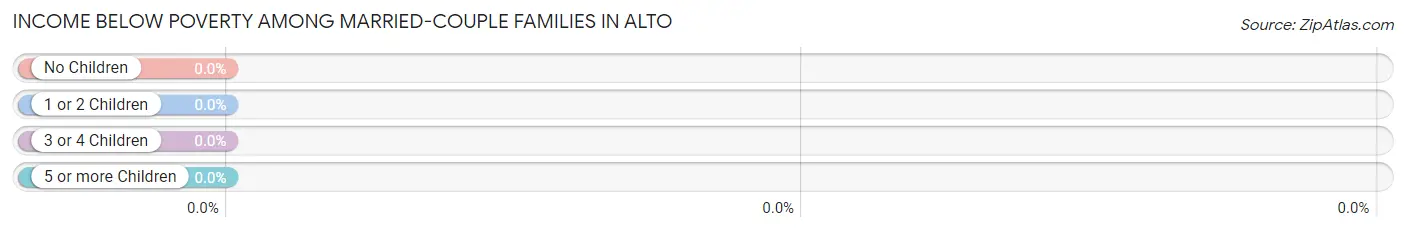
| Children | Above Poverty | Below Poverty |
| No Children | 106 (100.0%) | 0 (0.0%) |
| 1 or 2 Children | 54 (100.0%) | 0 (0.0%) |
| 3 or 4 Children | 0 (0.0%) | 0 (0.0%) |
| 5 or more Children | 0 (0.0%) | 0 (0.0%) |
| Total | 160 (100.0%) | 0 (0.0%) |
Income Below Poverty Among Single-Parent Households in Alto
| Children | Single Father | Single Mother |
| No Children | 0 (0.0%) | 0 (0.0%) |
| 1 or 2 Children | 0 (0.0%) | 0 (0.0%) |
| 3 or 4 Children | 0 (0.0%) | 0 (0.0%) |
| 5 or more Children | 0 (0.0%) | 0 (0.0%) |
| Total | 0 (0.0%) | 0 (0.0%) |
Income Below Poverty Among Married-Couple vs Single-Parent Households in Alto
| Children | Married-Couple Families | Single-Parent Households |
| No Children | 0 (0.0%) | 0 (0.0%) |
| 1 or 2 Children | 0 (0.0%) | 0 (0.0%) |
| 3 or 4 Children | 0 (0.0%) | 0 (0.0%) |
| 5 or more Children | 0 (0.0%) | 0 (0.0%) |
| Total | 0 (0.0%) | 0 (0.0%) |
Race in Alto
The most populous races in Alto are White / Caucasian (549 | 83.3%), Hispanic or Latino (67 | 10.2%), and Two or more Races (61 | 9.3%).
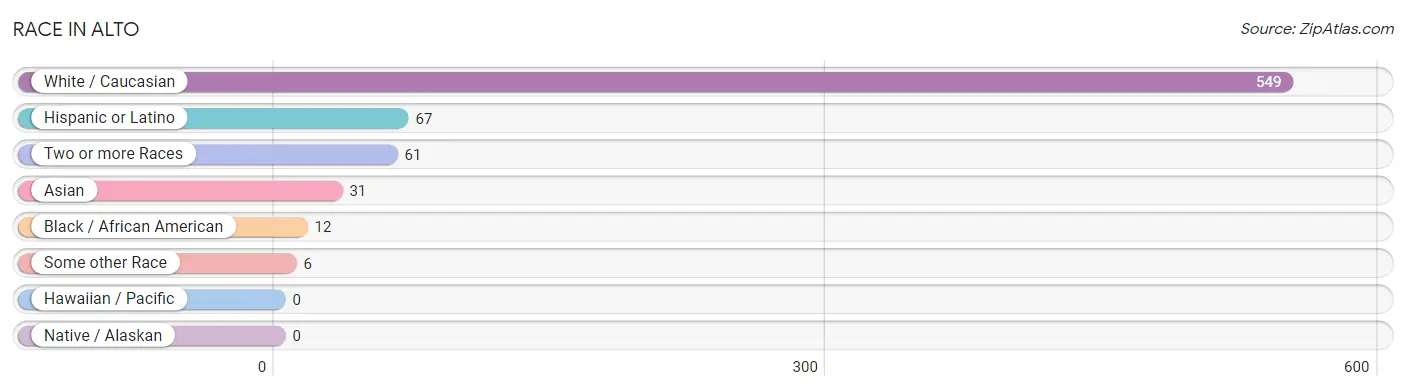
| Race | # Population | % Population |
| Asian | 31 | 4.7% |
| Black / African American | 12 | 1.8% |
| Hawaiian / Pacific | 0 | 0.0% |
| Hispanic or Latino | 67 | 10.2% |
| Native / Alaskan | 0 | 0.0% |
| White / Caucasian | 549 | 83.3% |
| Two or more Races | 61 | 9.3% |
| Some other Race | 6 | 0.9% |
| Total | 659 | 100.0% |
Ancestry in Alto
The most populous ancestries reported in Alto are English (167 | 25.3%), Irish (138 | 20.9%), Swiss (64 | 9.7%), Central American (61 | 9.3%), and Guatemalan (61 | 9.3%), together accounting for 74.5% of all Alto residents.
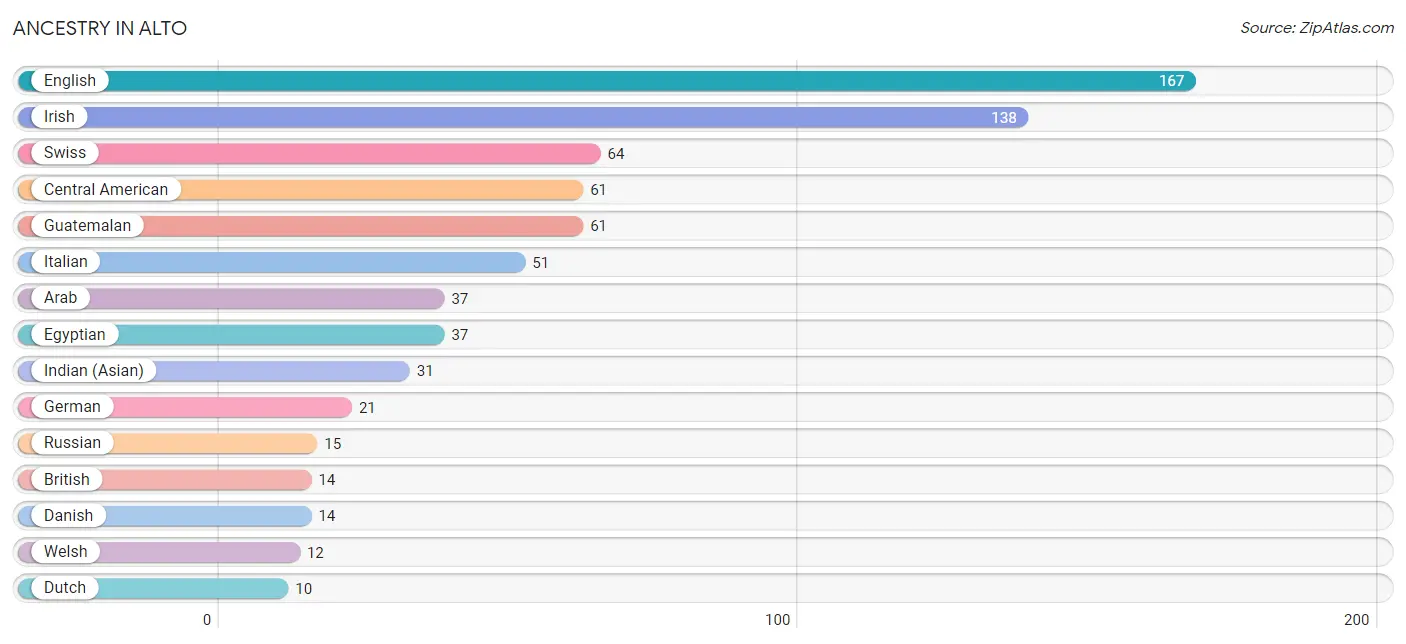
| Ancestry | # Population | % Population |
| Arab | 37 | 5.6% |
| British | 14 | 2.1% |
| Central American | 61 | 9.3% |
| Danish | 14 | 2.1% |
| Dutch | 10 | 1.5% |
| Egyptian | 37 | 5.6% |
| English | 167 | 25.3% |
| French | 9 | 1.4% |
| French Canadian | 9 | 1.4% |
| German | 21 | 3.2% |
| Guatemalan | 61 | 9.3% |
| Hungarian | 9 | 1.4% |
| Indian (Asian) | 31 | 4.7% |
| Irish | 138 | 20.9% |
| Italian | 51 | 7.7% |
| Mexican | 6 | 0.9% |
| Russian | 15 | 2.3% |
| Swiss | 64 | 9.7% |
| Welsh | 12 | 1.8% | View All 19 Rows |
Immigrants in Alto
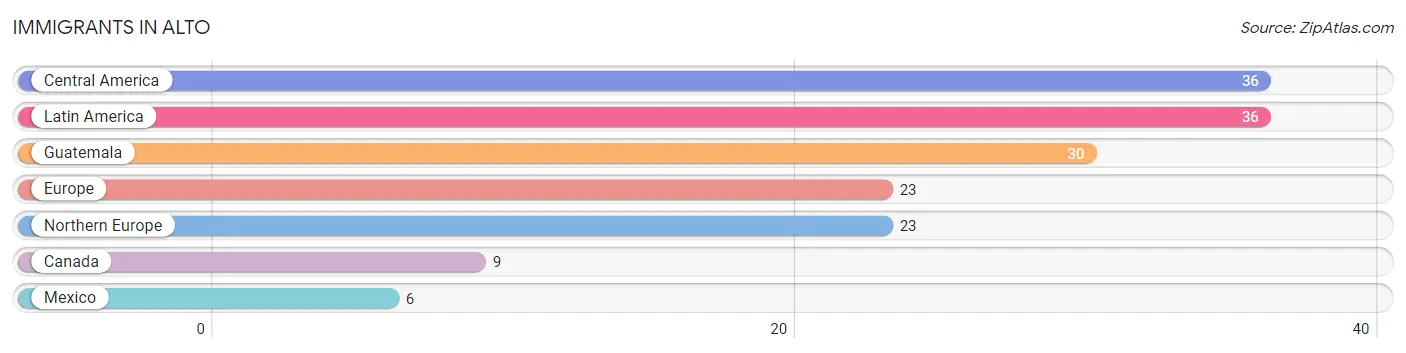
The most numerous immigrant groups reported in Alto came from Central America (36 | 5.5%), Latin America (36 | 5.5%), Guatemala (30 | 4.5%), Europe (23 | 3.5%), and Northern Europe (23 | 3.5%), together accounting for 22.4% of all Alto residents.
| Immigration Origin | # Population | % Population |
| Canada | 9 | 1.4% |
| Central America | 36 | 5.5% |
| Europe | 23 | 3.5% |
| Guatemala | 30 | 4.5% |
| Latin America | 36 | 5.5% |
| Mexico | 6 | 0.9% |
| Northern Europe | 23 | 3.5% | View All 7 Rows |
Sex and Age in Alto
Sex and Age in Alto
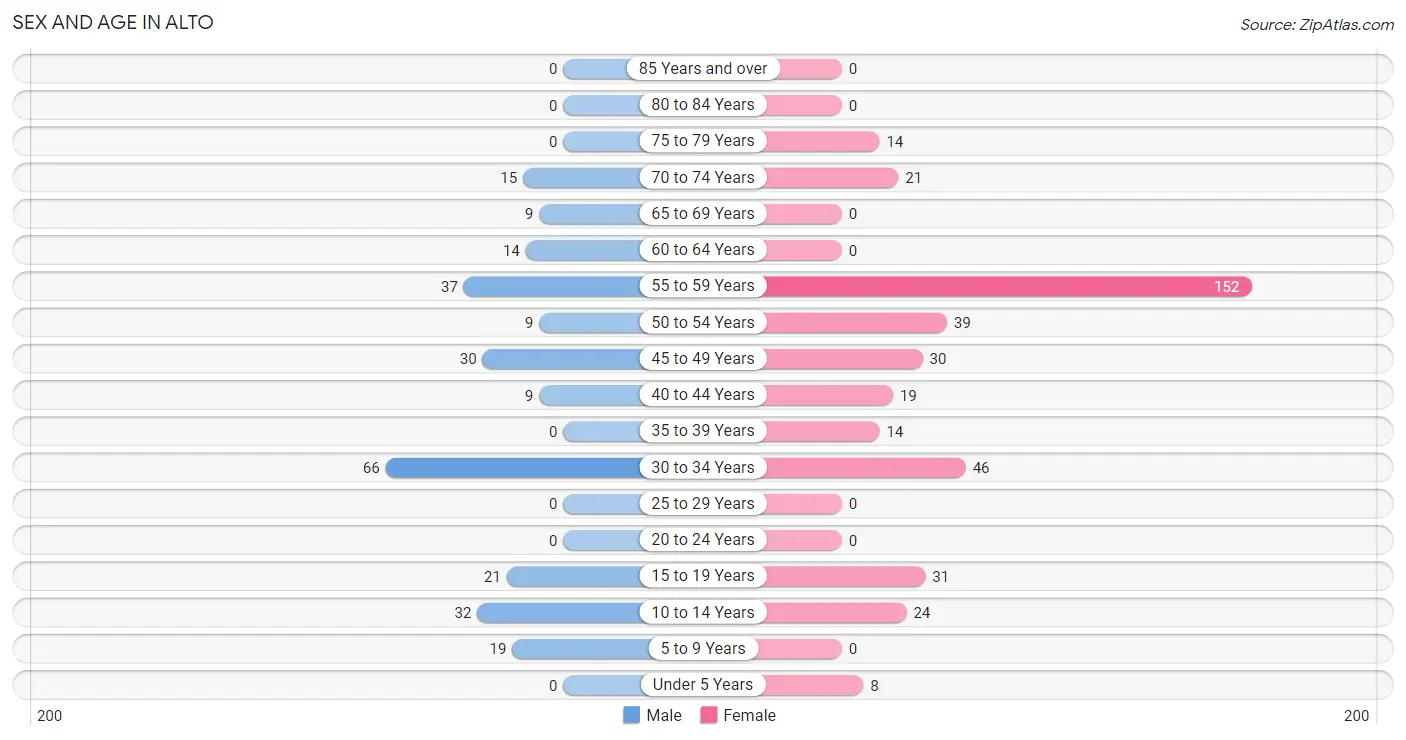
The most populous age groups in Alto are 30 to 34 Years (66 | 25.3%) for men and 55 to 59 Years (152 | 38.2%) for women.
| Age Bracket | Male | Female |
| Under 5 Years | 0 (0.0%) | 8 (2.0%) |
| 5 to 9 Years | 19 (7.3%) | 0 (0.0%) |
| 10 to 14 Years | 32 (12.3%) | 24 (6.0%) |
| 15 to 19 Years | 21 (8.1%) | 31 (7.8%) |
| 20 to 24 Years | 0 (0.0%) | 0 (0.0%) |
| 25 to 29 Years | 0 (0.0%) | 0 (0.0%) |
| 30 to 34 Years | 66 (25.3%) | 46 (11.6%) |
| 35 to 39 Years | 0 (0.0%) | 14 (3.5%) |
| 40 to 44 Years | 9 (3.5%) | 19 (4.8%) |
| 45 to 49 Years | 30 (11.5%) | 30 (7.5%) |
| 50 to 54 Years | 9 (3.5%) | 39 (9.8%) |
| 55 to 59 Years | 37 (14.2%) | 152 (38.2%) |
| 60 to 64 Years | 14 (5.4%) | 0 (0.0%) |
| 65 to 69 Years | 9 (3.5%) | 0 (0.0%) |
| 70 to 74 Years | 15 (5.8%) | 21 (5.3%) |
| 75 to 79 Years | 0 (0.0%) | 14 (3.5%) |
| 80 to 84 Years | 0 (0.0%) | 0 (0.0%) |
| 85 Years and over | 0 (0.0%) | 0 (0.0%) |
| Total | 261 (100.0%) | 398 (100.0%) |
Families and Households in Alto
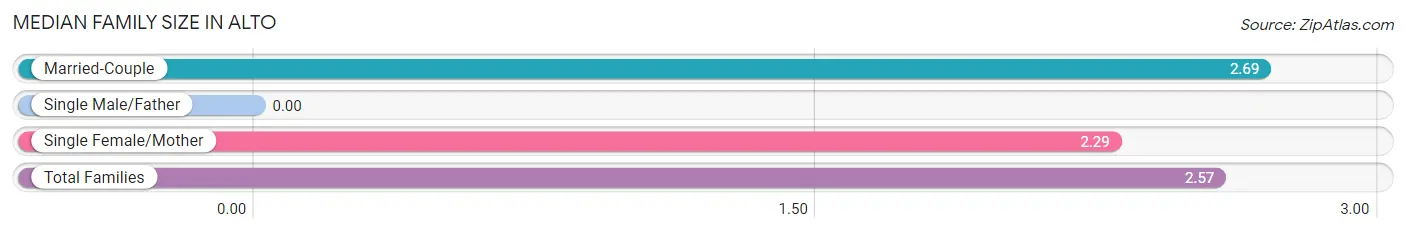
Median Family Size in Alto
| Family Type | # Families | Family Size |
| Married-Couple | 160 (69.0%) | 2.69 |
| Single Male/Father | 0 (0.0%) | - |
| Single Female/Mother | 72 (31.0%) | 2.29 |
| Total Families | 232 (100.0%) | 2.57 |
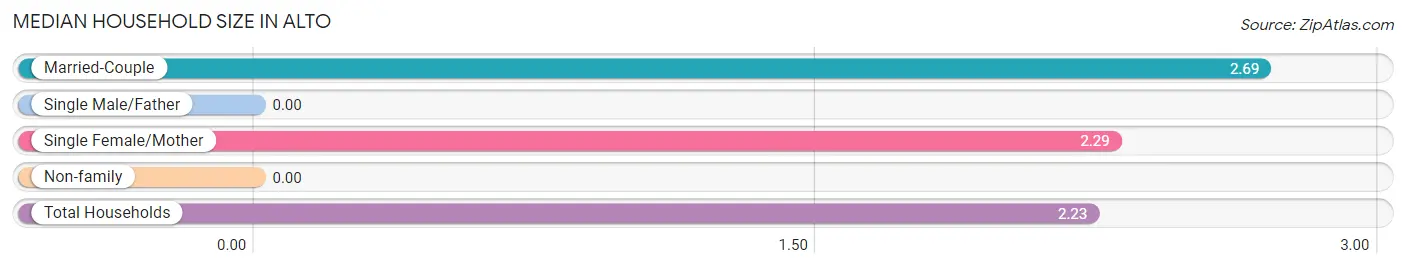
Median Household Size in Alto
| Household Type | # Households | Household Size |
| Married-Couple | 160 (54.2%) | 2.69 |
| Single Male/Father | 0 (0.0%) | - |
| Single Female/Mother | 72 (24.4%) | 2.29 |
| Non-family | 63 (21.4%) | - |
| Total Households | 295 (100.0%) | 2.23 |
Household Size by Marriage Status in Alto
Out of a total of 295 households in Alto, 232 (78.6%) are family households, while 63 (21.4%) are nonfamily households. The most numerous type of family households are 2-person households, comprising 124, and the most common type of nonfamily households are 1-person households, comprising 63.
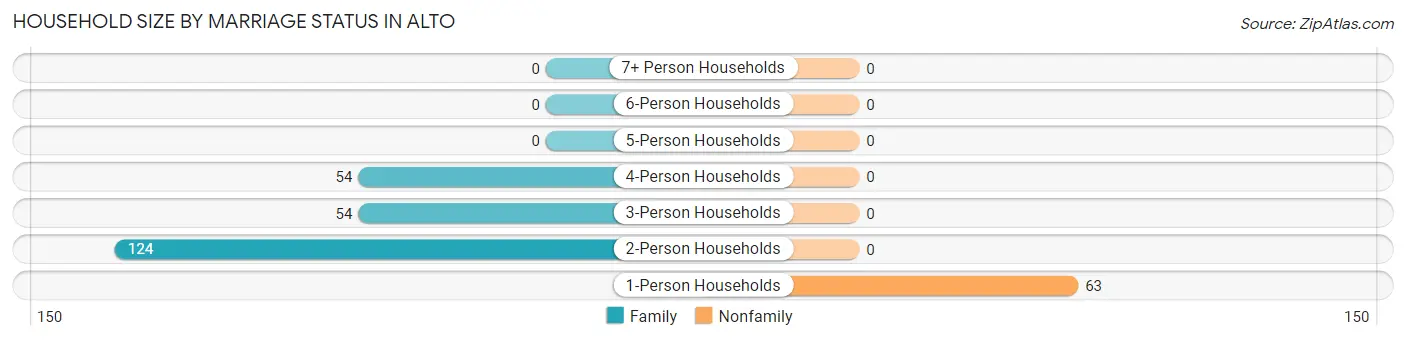
| Household Size | Family Households | Nonfamily Households |
| 1-Person Households | - | 63 (21.4%) |
| 2-Person Households | 124 (42.0%) | 0 (0.0%) |
| 3-Person Households | 54 (18.3%) | 0 (0.0%) |
| 4-Person Households | 54 (18.3%) | 0 (0.0%) |
| 5-Person Households | 0 (0.0%) | 0 (0.0%) |
| 6-Person Households | 0 (0.0%) | 0 (0.0%) |
| 7+ Person Households | 0 (0.0%) | 0 (0.0%) |
| Total | 232 (78.6%) | 63 (21.4%) |
Female Fertility in Alto
Fertility by Age in Alto
| Age Bracket | Women with Births | Births / 1,000 Women |
| 15 to 19 years | 0 (0.0%) | 0.0 |
| 20 to 34 years | 0 (0.0%) | 0.0 |
| 35 to 50 years | 0 (0.0%) | 0.0 |
| Total | 0 (0.0%) | 0.0 |
Fertility by Age by Marriage Status in Alto
| Age Bracket | Married | Unmarried |
| 15 to 19 years | 0 (0.0%) | 0 (0.0%) |
| 20 to 34 years | 0 (0.0%) | 0 (0.0%) |
| 35 to 50 years | 0 (0.0%) | 0 (0.0%) |
| Total | 0 (0.0%) | 0 (0.0%) |
Fertility by Education in Alto
| Educational Attainment | Women with Births | Births / 1,000 Women |
| Less than High School | 0 (0.0%) | 0.0 |
| High School Diploma | 0 (0.0%) | 0.0 |
| College or Associate's Degree | 0 (0.0%) | 0.0 |
| Bachelor's Degree | 0 (0.0%) | 0.0 |
| Graduate Degree | 0 (0.0%) | 0.0 |
| Total | 0 (0.0%) | 0.0 |
Fertility by Education by Marriage Status in Alto
| Educational Attainment | Married | Unmarried |
| Less than High School | 0 (0.0%) | 0 (0.0%) |
| High School Diploma | 0 (0.0%) | 0 (0.0%) |
| College or Associate's Degree | 0 (0.0%) | 0 (0.0%) |
| Bachelor's Degree | 0 (0.0%) | 0 (0.0%) |
| Graduate Degree | 0 (0.0%) | 0 (0.0%) |
| Total | 0 (0.0%) | 0 (0.0%) |
Employment Characteristics in Alto
Employment by Class of Employer in Alto
Among the 341 employed individuals in Alto, private company employees (195 | 57.2%), self-employed (incorporated) (96 | 28.1%), and self-employed (not incorporated) (23 | 6.7%) make up the most common classes of employment.
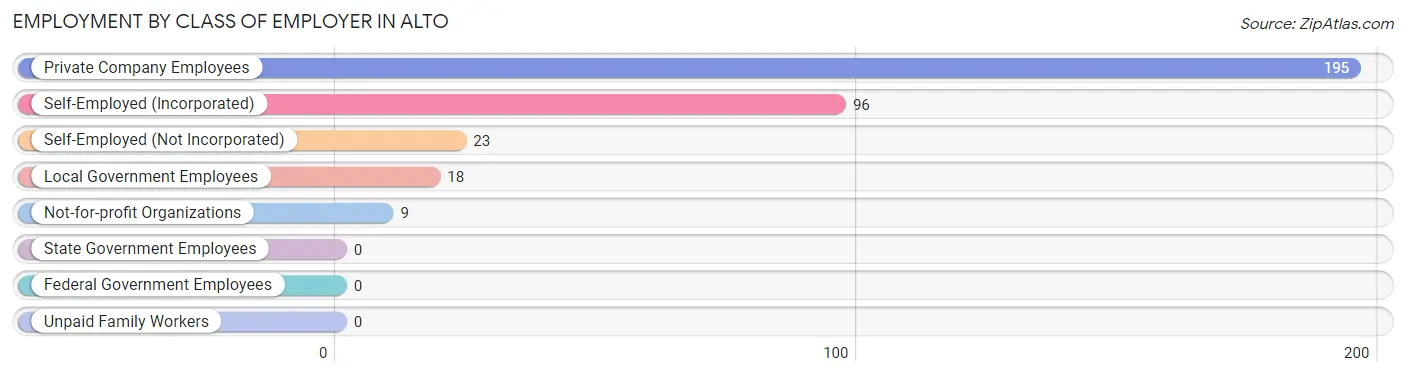
| Employer Class | # Employees | % Employees |
| Private Company Employees | 195 | 57.2% |
| Self-Employed (Incorporated) | 96 | 28.1% |
| Self-Employed (Not Incorporated) | 23 | 6.7% |
| Not-for-profit Organizations | 9 | 2.6% |
| Local Government Employees | 18 | 5.3% |
| State Government Employees | 0 | 0.0% |
| Federal Government Employees | 0 | 0.0% |
| Unpaid Family Workers | 0 | 0.0% |
| Total | 341 | 100.0% |
Employment Status by Age in Alto
According to the labor force statistics for Alto, out of the total population over 16 years of age (555), 66.7% or 370 individuals are in the labor force, with 7.8% or 29 of them unemployed. The age group with the highest labor force participation rate is 30 to 34 years, with 100.0% or 112 individuals in the labor force. Within the labor force, the 35 to 44 years age range has the highest percentage of unemployed individuals, with 38.9% or 14 of them being unemployed.
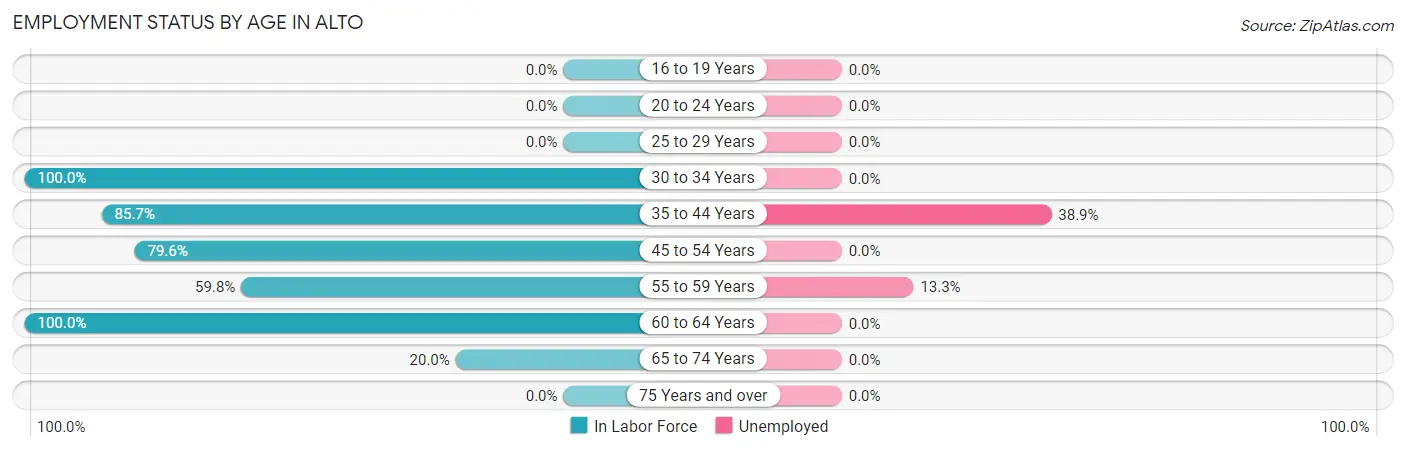
| Age Bracket | In Labor Force | Unemployed |
| 16 to 19 Years | 0 (0.0%) | 0 (0.0%) |
| 20 to 24 Years | 0 (0.0%) | 0 (0.0%) |
| 25 to 29 Years | 0 (0.0%) | 0 (0.0%) |
| 30 to 34 Years | 112 (100.0%) | 0 (0.0%) |
| 35 to 44 Years | 36 (85.7%) | 14 (38.9%) |
| 45 to 54 Years | 86 (79.6%) | 0 (0.0%) |
| 55 to 59 Years | 113 (59.8%) | 15 (13.3%) |
| 60 to 64 Years | 14 (100.0%) | 0 (0.0%) |
| 65 to 74 Years | 9 (20.0%) | 0 (0.0%) |
| 75 Years and over | 0 (0.0%) | 0 (0.0%) |
| Total | 370 (66.7%) | 29 (7.8%) |
Employment Status by Educational Attainment in Alto
According to labor force statistics for Alto, 77.6% of individuals (361) out of the total population between 25 and 64 years of age (465) are in the labor force, with 8.0% or 29 of them being unemployed. The group with the highest labor force participation rate are those with the educational attainment of high school diploma, with 100.0% or 50 individuals in the labor force. Within the labor force, individuals with college / associate degree education have the highest percentage of unemployment, with 14.3% or 14 of them being unemployed.
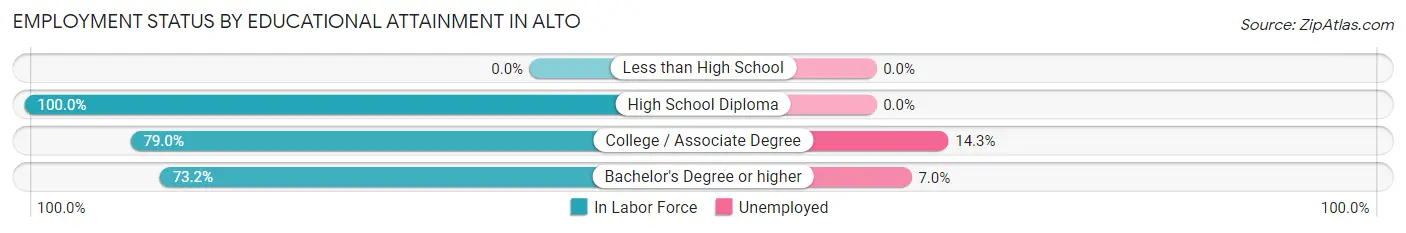
| Educational Attainment | In Labor Force | Unemployed |
| Less than High School | 0 (0.0%) | 0 (0.0%) |
| High School Diploma | 50 (100.0%) | 0 (0.0%) |
| College / Associate Degree | 98 (79.0%) | 18 (14.3%) |
| Bachelor's Degree or higher | 213 (73.2%) | 20 (7.0%) |
| Total | 361 (77.6%) | 37 (8.0%) |
Employment Occupations by Sex in Alto
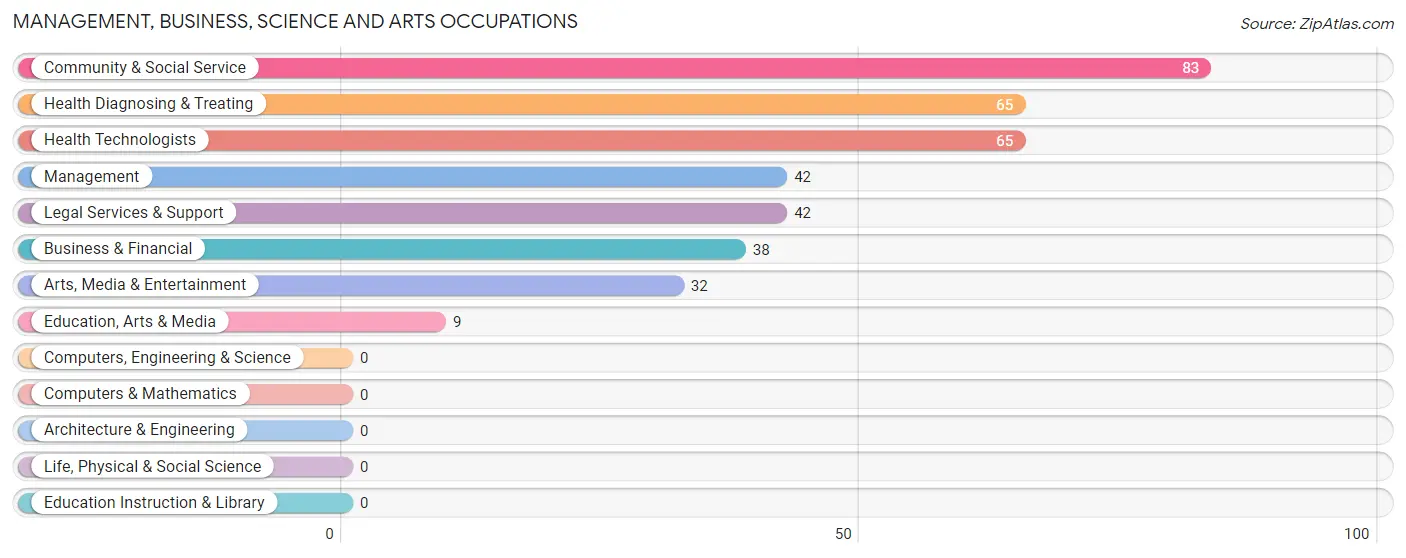
Management, Business, Science and Arts Occupations
The most common Management, Business, Science and Arts occupations in Alto are Community & Social Service (83 | 24.3%), Health Diagnosing & Treating (65 | 19.1%), Health Technologists (65 | 19.1%), Management (42 | 12.3%), and Legal Services & Support (42 | 12.3%).
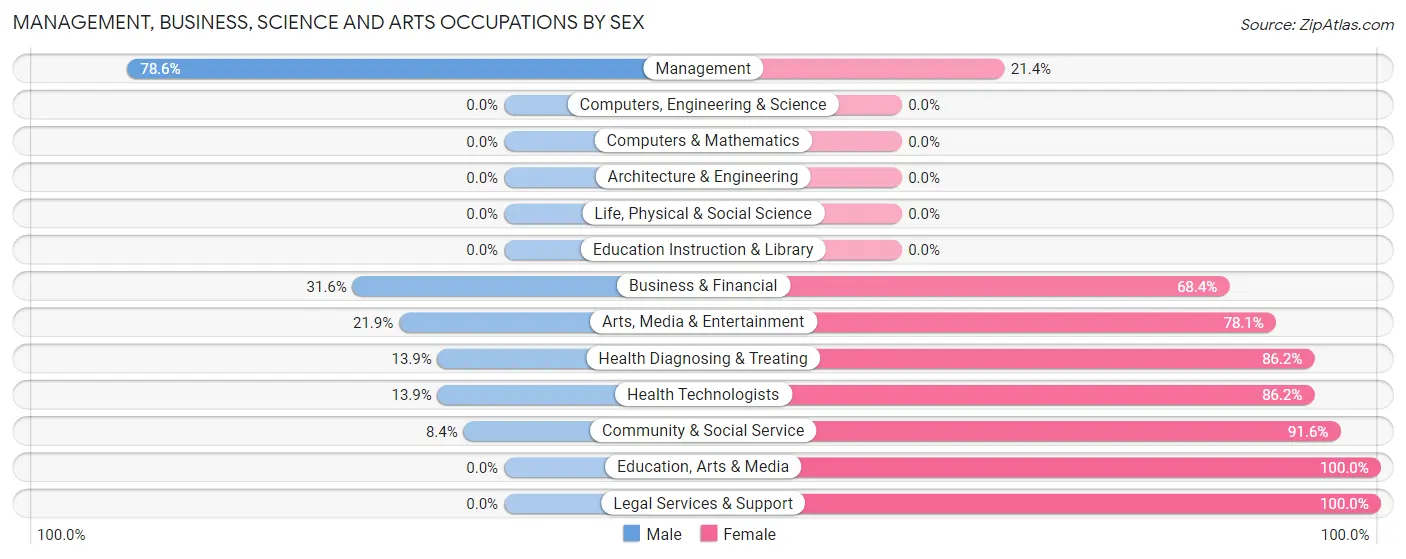
Management, Business, Science and Arts Occupations by Sex
Within the Management, Business, Science and Arts occupations in Alto, the most male-oriented occupations are Management (78.6%), Business & Financial (31.6%), and Arts, Media & Entertainment (21.9%), while the most female-oriented occupations are Education, Arts & Media (100.0%), Legal Services & Support (100.0%), and Community & Social Service (91.6%).
| Occupation | Male | Female |
| Management | 33 (78.6%) | 9 (21.4%) |
| Business & Financial | 12 (31.6%) | 26 (68.4%) |
| Computers, Engineering & Science | 0 (0.0%) | 0 (0.0%) |
| Computers & Mathematics | 0 (0.0%) | 0 (0.0%) |
| Architecture & Engineering | 0 (0.0%) | 0 (0.0%) |
| Life, Physical & Social Science | 0 (0.0%) | 0 (0.0%) |
| Community & Social Service | 7 (8.4%) | 76 (91.6%) |
| Education, Arts & Media | 0 (0.0%) | 9 (100.0%) |
| Legal Services & Support | 0 (0.0%) | 42 (100.0%) |
| Education Instruction & Library | 0 (0.0%) | 0 (0.0%) |
| Arts, Media & Entertainment | 7 (21.9%) | 25 (78.1%) |
| Health Diagnosing & Treating | 9 (13.9%) | 56 (86.2%) |
| Health Technologists | 9 (13.9%) | 56 (86.2%) |
| Total (Category) | 61 (26.8%) | 167 (73.3%) |
| Total (Overall) | 138 (40.5%) | 203 (59.5%) |
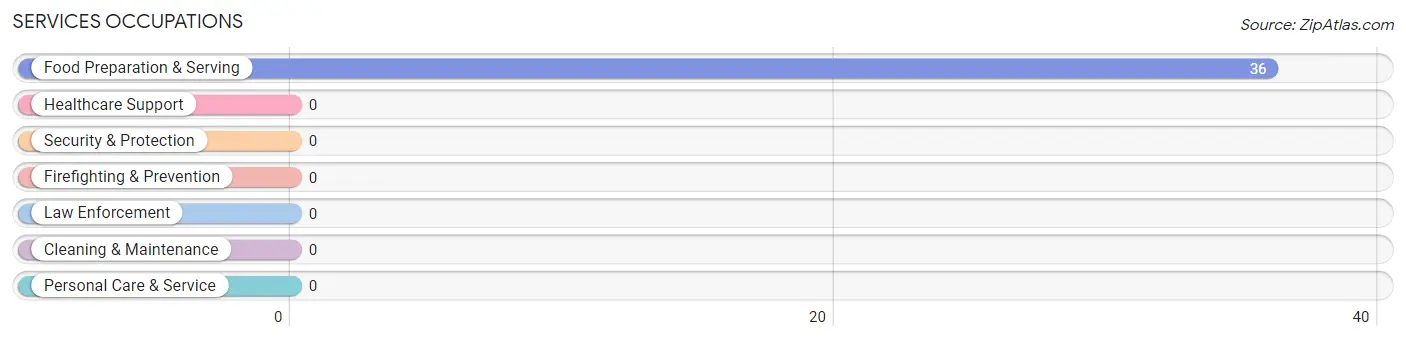
Services Occupations
The most common Services occupations in Alto are , and Food Preparation & Serving (36 | 10.6%).
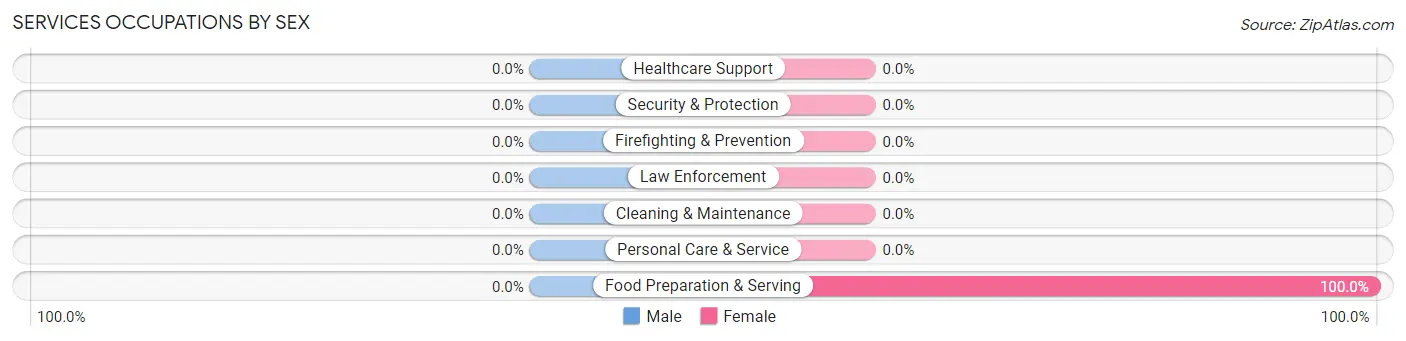
Services Occupations by Sex
| Occupation | Male | Female |
| Healthcare Support | 0 (0.0%) | 0 (0.0%) |
| Security & Protection | 0 (0.0%) | 0 (0.0%) |
| Firefighting & Prevention | 0 (0.0%) | 0 (0.0%) |
| Law Enforcement | 0 (0.0%) | 0 (0.0%) |
| Food Preparation & Serving | 0 (0.0%) | 36 (100.0%) |
| Cleaning & Maintenance | 0 (0.0%) | 0 (0.0%) |
| Personal Care & Service | 0 (0.0%) | 0 (0.0%) |
| Total (Category) | 0 (0.0%) | 36 (100.0%) |
| Total (Overall) | 138 (40.5%) | 203 (59.5%) |
Sales and Office Occupations
The most common Sales and Office occupations in Alto are , and Sales & Related (77 | 22.6%).
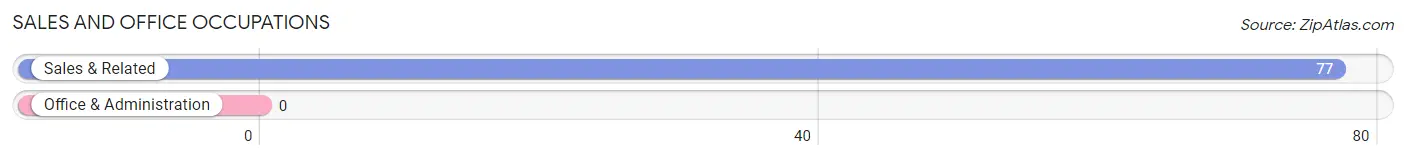
Sales and Office Occupations by Sex

| Occupation | Male | Female |
| Sales & Related | 77 (100.0%) | 0 (0.0%) |
| Office & Administration | 0 (0.0%) | 0 (0.0%) |
| Total (Category) | 77 (100.0%) | 0 (0.0%) |
| Total (Overall) | 138 (40.5%) | 203 (59.5%) |
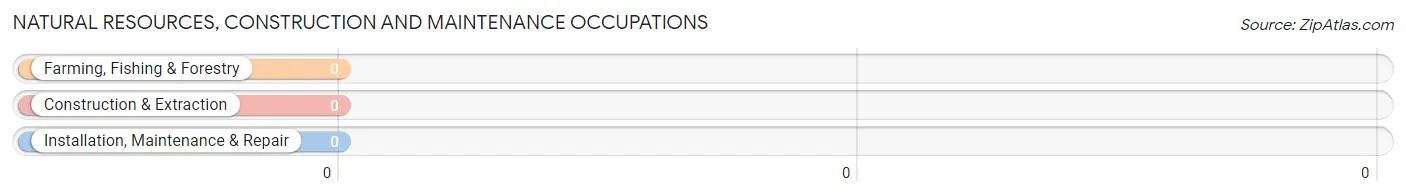
Natural Resources, Construction and Maintenance Occupations
Natural Resources, Construction and Maintenance Occupations by Sex
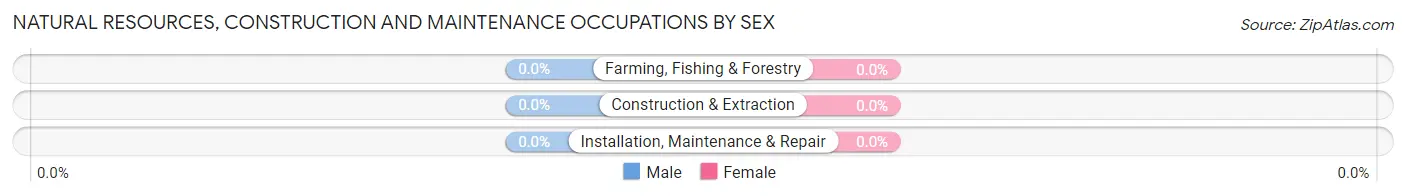
| Occupation | Male | Female |
| Farming, Fishing & Forestry | 0 (0.0%) | 0 (0.0%) |
| Construction & Extraction | 0 (0.0%) | 0 (0.0%) |
| Installation, Maintenance & Repair | 0 (0.0%) | 0 (0.0%) |
| Total (Category) | 0 (0.0%) | 0 (0.0%) |
| Total (Overall) | 138 (40.5%) | 203 (59.5%) |
Production, Transportation and Moving Occupations
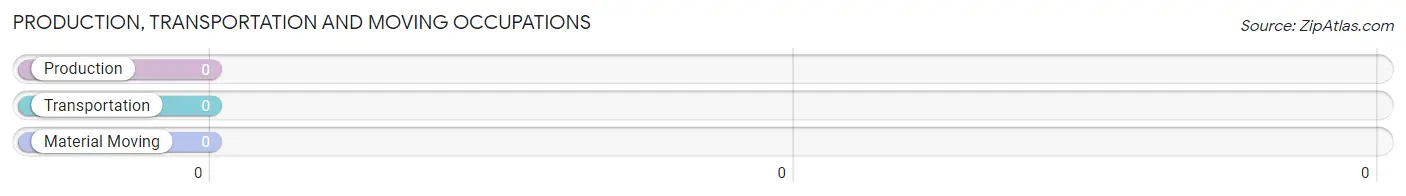
Production, Transportation and Moving Occupations by Sex
| Occupation | Male | Female |
| Production | 0 (0.0%) | 0 (0.0%) |
| Transportation | 0 (0.0%) | 0 (0.0%) |
| Material Moving | 0 (0.0%) | 0 (0.0%) |
| Total (Category) | 0 (0.0%) | 0 (0.0%) |
| Total (Overall) | 138 (40.5%) | 203 (59.5%) |
Employment Industries by Sex in Alto
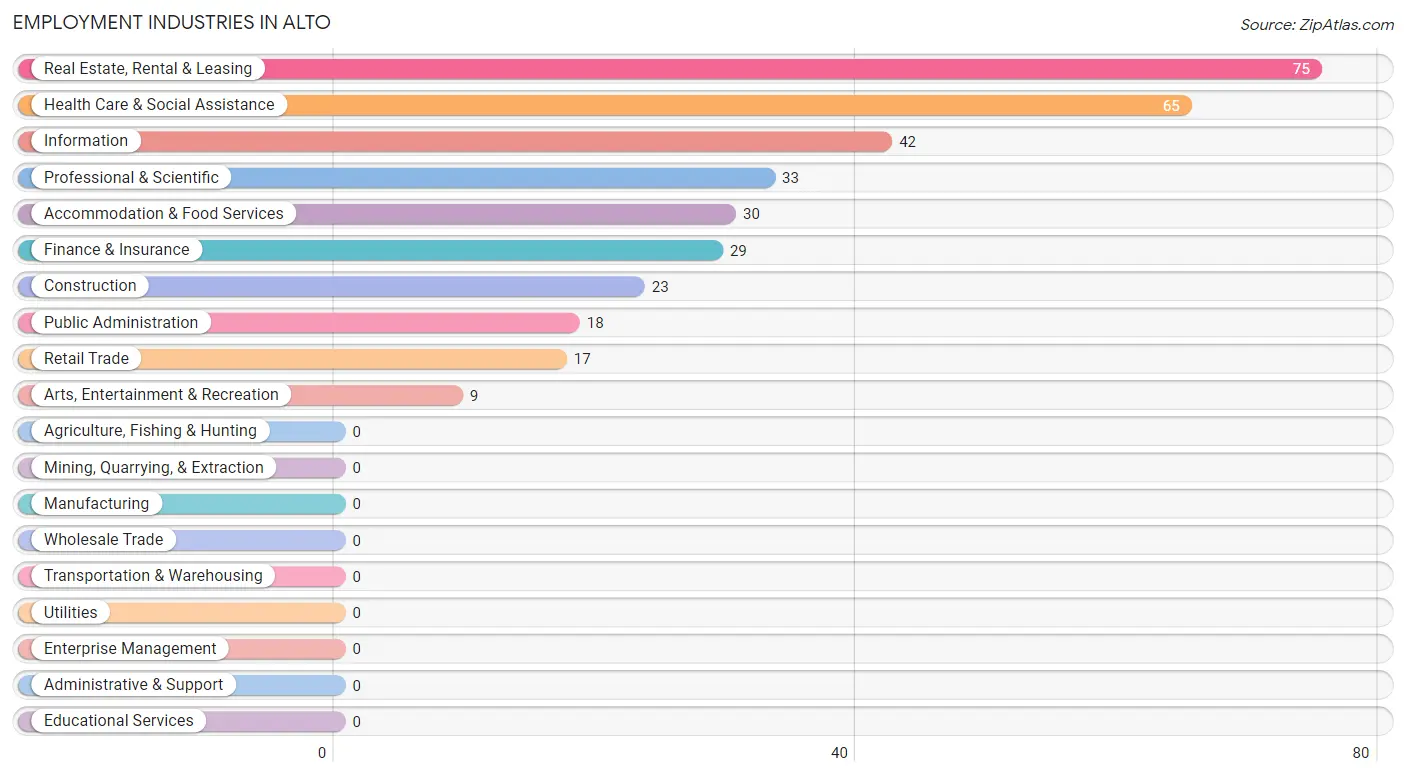
Employment Industries in Alto
The major employment industries in Alto include Real Estate, Rental & Leasing (75 | 22.0%), Health Care & Social Assistance (65 | 19.1%), Information (42 | 12.3%), Professional & Scientific (33 | 9.7%), and Accommodation & Food Services (30 | 8.8%).
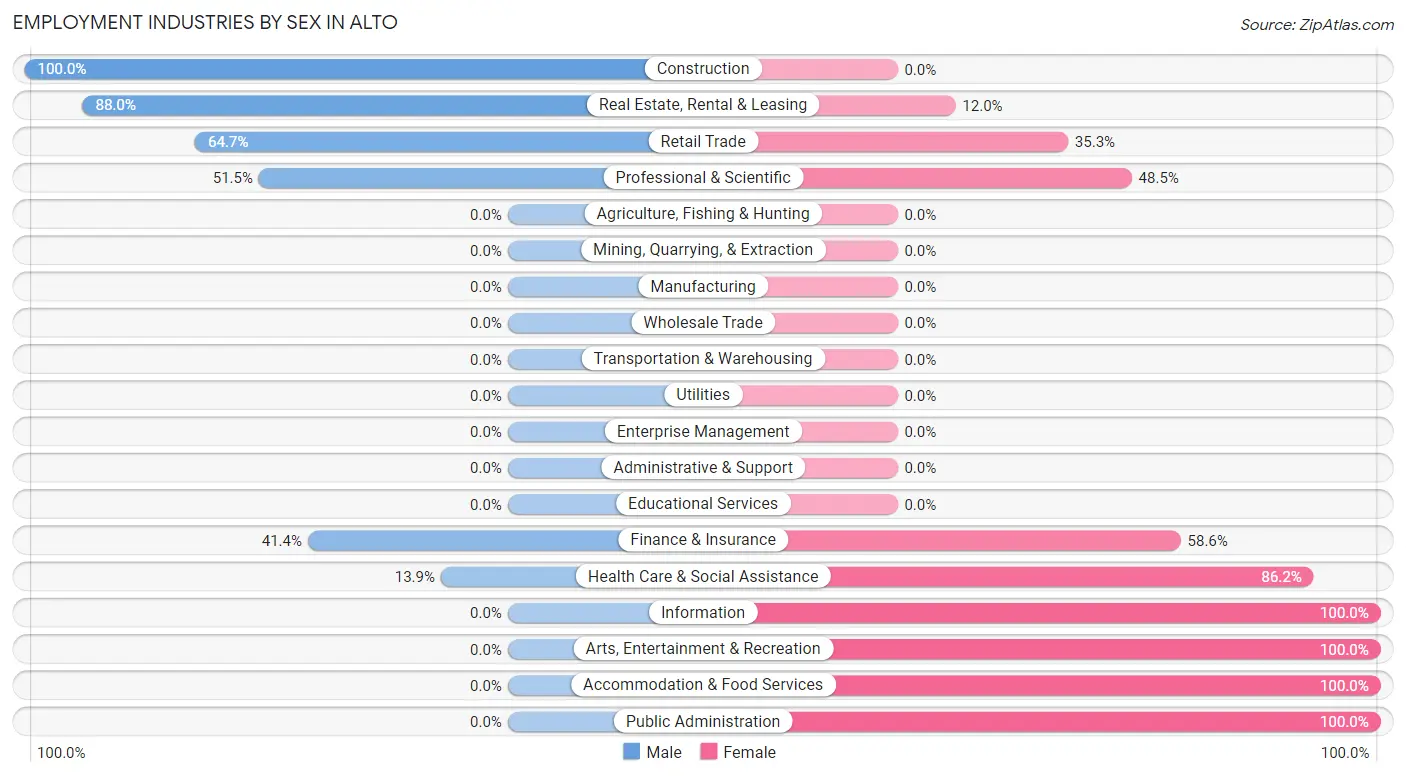
Employment Industries by Sex in Alto
The Alto industries that see more men than women are Construction (100.0%), Real Estate, Rental & Leasing (88.0%), and Retail Trade (64.7%), whereas the industries that tend to have a higher number of women are Information (100.0%), Arts, Entertainment & Recreation (100.0%), and Accommodation & Food Services (100.0%).
| Industry | Male | Female |
| Agriculture, Fishing & Hunting | 0 (0.0%) | 0 (0.0%) |
| Mining, Quarrying, & Extraction | 0 (0.0%) | 0 (0.0%) |
| Construction | 23 (100.0%) | 0 (0.0%) |
| Manufacturing | 0 (0.0%) | 0 (0.0%) |
| Wholesale Trade | 0 (0.0%) | 0 (0.0%) |
| Retail Trade | 11 (64.7%) | 6 (35.3%) |
| Transportation & Warehousing | 0 (0.0%) | 0 (0.0%) |
| Utilities | 0 (0.0%) | 0 (0.0%) |
| Information | 0 (0.0%) | 42 (100.0%) |
| Finance & Insurance | 12 (41.4%) | 17 (58.6%) |
| Real Estate, Rental & Leasing | 66 (88.0%) | 9 (12.0%) |
| Professional & Scientific | 17 (51.5%) | 16 (48.5%) |
| Enterprise Management | 0 (0.0%) | 0 (0.0%) |
| Administrative & Support | 0 (0.0%) | 0 (0.0%) |
| Educational Services | 0 (0.0%) | 0 (0.0%) |
| Health Care & Social Assistance | 9 (13.9%) | 56 (86.2%) |
| Arts, Entertainment & Recreation | 0 (0.0%) | 9 (100.0%) |
| Accommodation & Food Services | 0 (0.0%) | 30 (100.0%) |
| Public Administration | 0 (0.0%) | 18 (100.0%) |
| Total | 138 (40.5%) | 203 (59.5%) |
Education in Alto
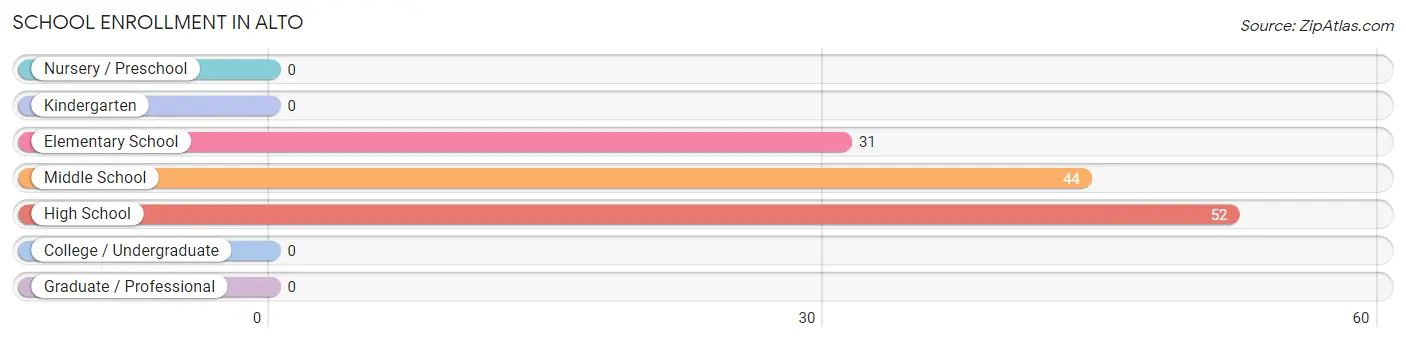
School Enrollment in Alto
The most common levels of schooling among the 127 students in Alto are high school (52 | 40.9%), middle school (44 | 34.6%), and elementary school (31 | 24.4%).
| School Level | # Students | % Students |
| Nursery / Preschool | 0 | 0.0% |
| Kindergarten | 0 | 0.0% |
| Elementary School | 31 | 24.4% |
| Middle School | 44 | 34.6% |
| High School | 52 | 40.9% |
| College / Undergraduate | 0 | 0.0% |
| Graduate / Professional | 0 | 0.0% |
| Total | 127 | 100.0% |
School Enrollment by Age by Funding Source in Alto
Out of a total of 127 students who are enrolled in schools in Alto, 31 (24.4%) attend a private institution, while the remaining 96 (75.6%) are enrolled in public schools. The age group of 10 to 14 year olds has the highest likelihood of being enrolled in private schools, with 24 (42.9% in the age bracket) enrolled. Conversely, the age group of 15 to 17 year olds has the lowest likelihood of being enrolled in a private school, with 52 (100.0% in the age bracket) attending a public institution.
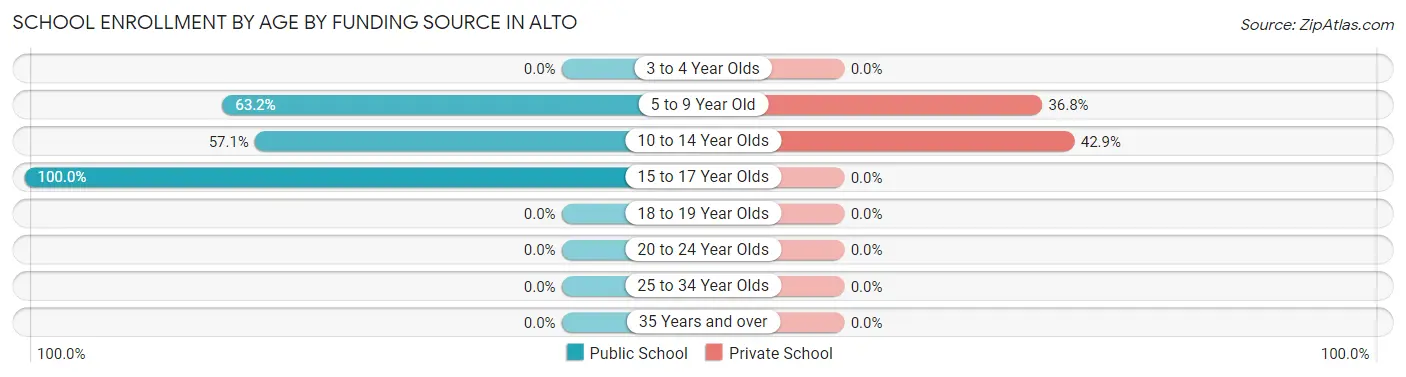
| Age Bracket | Public School | Private School |
| 3 to 4 Year Olds | 0 (0.0%) | 0 (0.0%) |
| 5 to 9 Year Old | 12 (63.2%) | 7 (36.8%) |
| 10 to 14 Year Olds | 32 (57.1%) | 24 (42.9%) |
| 15 to 17 Year Olds | 52 (100.0%) | 0 (0.0%) |
| 18 to 19 Year Olds | 0 (0.0%) | 0 (0.0%) |
| 20 to 24 Year Olds | 0 (0.0%) | 0 (0.0%) |
| 25 to 34 Year Olds | 0 (0.0%) | 0 (0.0%) |
| 35 Years and over | 0 (0.0%) | 0 (0.0%) |
| Total | 96 (75.6%) | 31 (24.4%) |
Educational Attainment by Field of Study in Alto
Social sciences (86 | 29.5%), visual & performing arts (59 | 20.3%), multidisciplinary studies (46 | 15.8%), business (20 | 6.9%), and engineering (19 | 6.5%) are the most common fields of study among 291 individuals in Alto who have obtained a bachelor's degree or higher.
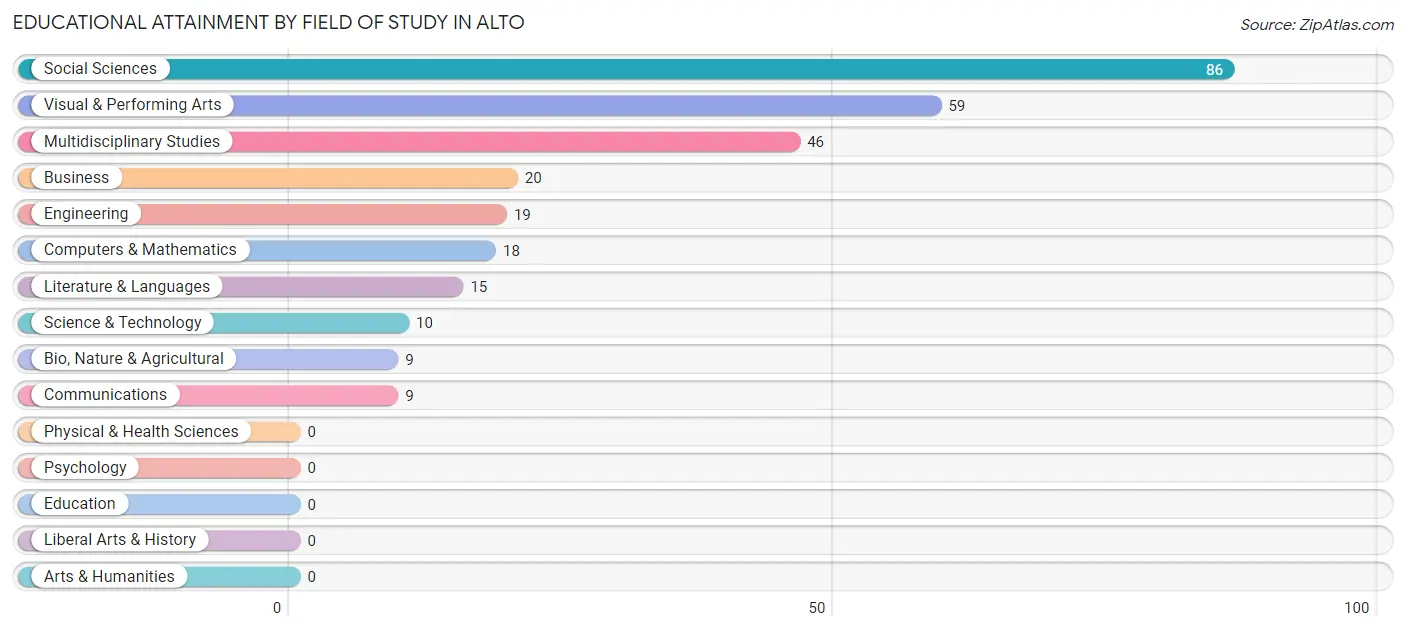
| Field of Study | # Graduates | % Graduates |
| Computers & Mathematics | 18 | 6.2% |
| Bio, Nature & Agricultural | 9 | 3.1% |
| Physical & Health Sciences | 0 | 0.0% |
| Psychology | 0 | 0.0% |
| Social Sciences | 86 | 29.5% |
| Engineering | 19 | 6.5% |
| Multidisciplinary Studies | 46 | 15.8% |
| Science & Technology | 10 | 3.4% |
| Business | 20 | 6.9% |
| Education | 0 | 0.0% |
| Literature & Languages | 15 | 5.1% |
| Liberal Arts & History | 0 | 0.0% |
| Visual & Performing Arts | 59 | 20.3% |
| Communications | 9 | 3.1% |
| Arts & Humanities | 0 | 0.0% |
| Total | 291 | 100.0% |
Transportation & Commute in Alto
Vehicle Availability by Sex in Alto
The most prevalent vehicle ownership categories in Alto are males with 3 vehicles (89, accounting for 64.5%) and females with 3 vehicles (55, making up 43.8%).
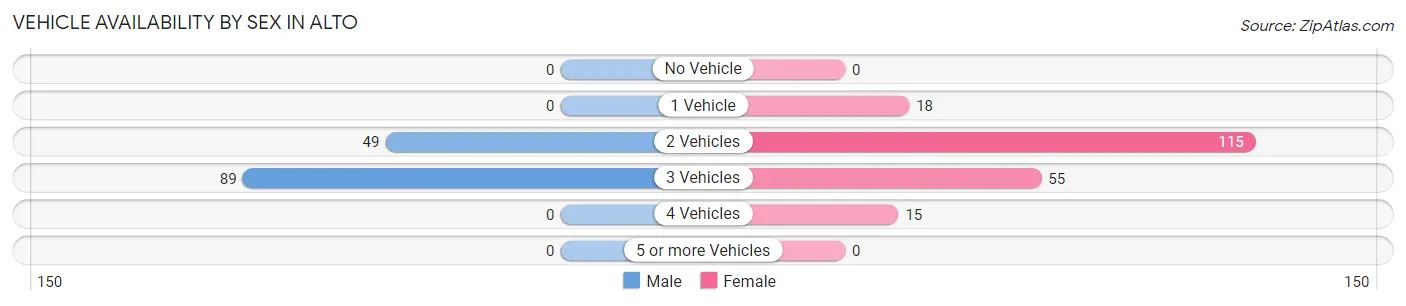
| Vehicles Available | Male | Female |
| No Vehicle | 0 (0.0%) | 0 (0.0%) |
| 1 Vehicle | 0 (0.0%) | 18 (8.9%) |
| 2 Vehicles | 49 (35.5%) | 115 (56.7%) |
| 3 Vehicles | 89 (64.5%) | 55 (27.1%) |
| 4 Vehicles | 0 (0.0%) | 15 (7.4%) |
| 5 or more Vehicles | 0 (0.0%) | 0 (0.0%) |
| Total | 138 (100.0%) | 203 (100.0%) |
Commute Time in Alto
The most frequently occuring commute durations in Alto are 30 to 34 minutes (66 commuters, 26.1%), 15 to 19 minutes (46 commuters, 18.2%), and 10 to 14 minutes (41 commuters, 16.2%).
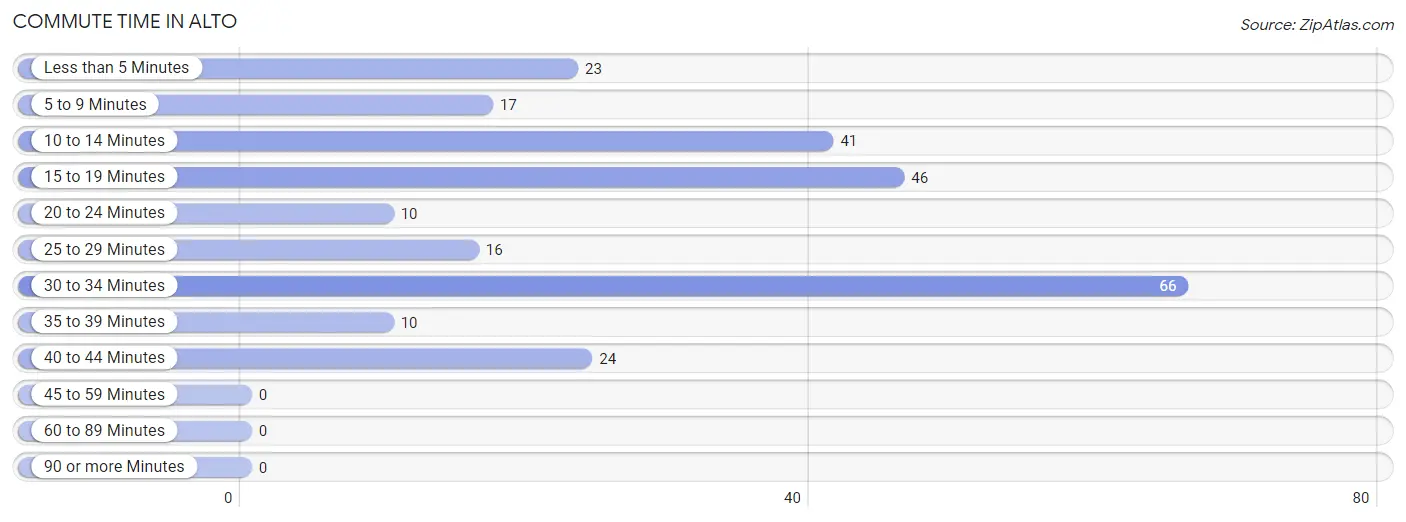
| Commute Time | # Commuters | % Commuters |
| Less than 5 Minutes | 23 | 9.1% |
| 5 to 9 Minutes | 17 | 6.7% |
| 10 to 14 Minutes | 41 | 16.2% |
| 15 to 19 Minutes | 46 | 18.2% |
| 20 to 24 Minutes | 10 | 4.0% |
| 25 to 29 Minutes | 16 | 6.3% |
| 30 to 34 Minutes | 66 | 26.1% |
| 35 to 39 Minutes | 10 | 4.0% |
| 40 to 44 Minutes | 24 | 9.5% |
| 45 to 59 Minutes | 0 | 0.0% |
| 60 to 89 Minutes | 0 | 0.0% |
| 90 or more Minutes | 0 | 0.0% |
Commute Time by Sex in Alto
The most common commute times in Alto are 30 to 34 minutes (66 commuters, 47.8%) for males and 10 to 14 minutes (30 commuters, 26.1%) for females.
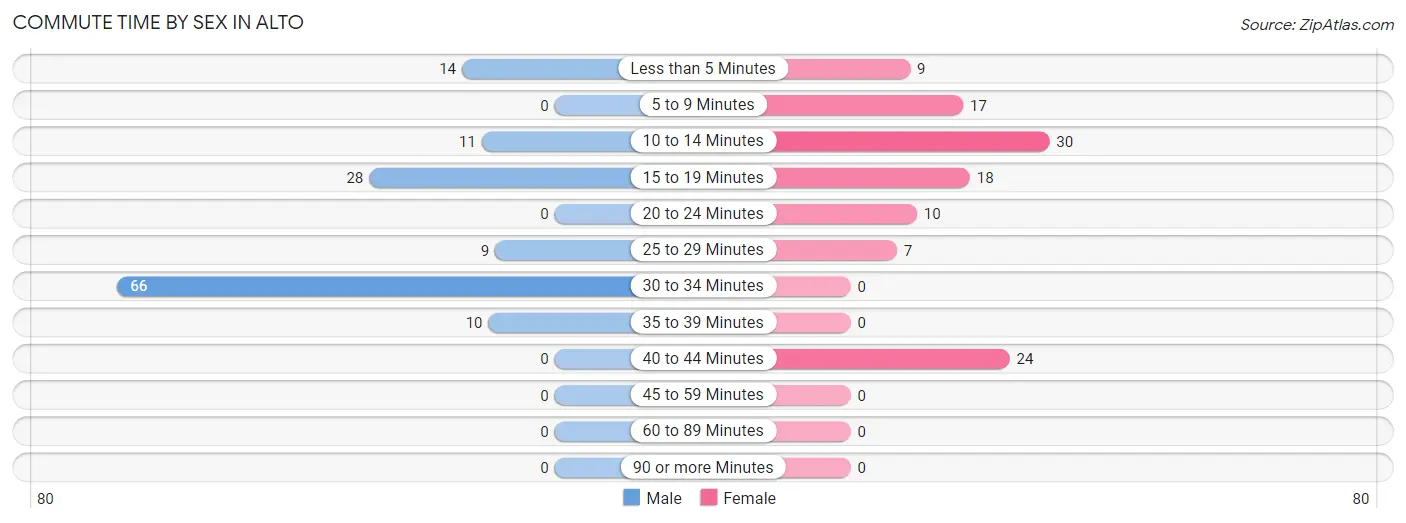
| Commute Time | Male | Female |
| Less than 5 Minutes | 14 (10.1%) | 9 (7.8%) |
| 5 to 9 Minutes | 0 (0.0%) | 17 (14.8%) |
| 10 to 14 Minutes | 11 (8.0%) | 30 (26.1%) |
| 15 to 19 Minutes | 28 (20.3%) | 18 (15.7%) |
| 20 to 24 Minutes | 0 (0.0%) | 10 (8.7%) |
| 25 to 29 Minutes | 9 (6.5%) | 7 (6.1%) |
| 30 to 34 Minutes | 66 (47.8%) | 0 (0.0%) |
| 35 to 39 Minutes | 10 (7.2%) | 0 (0.0%) |
| 40 to 44 Minutes | 0 (0.0%) | 24 (20.9%) |
| 45 to 59 Minutes | 0 (0.0%) | 0 (0.0%) |
| 60 to 89 Minutes | 0 (0.0%) | 0 (0.0%) |
| 90 or more Minutes | 0 (0.0%) | 0 (0.0%) |
Time of Departure to Work by Sex in Alto
The most frequent times of departure to work in Alto are 7:00 AM to 7:29 AM (82, 59.4%) for males and 12:00 PM to 3:59 PM (39, 33.9%) for females.
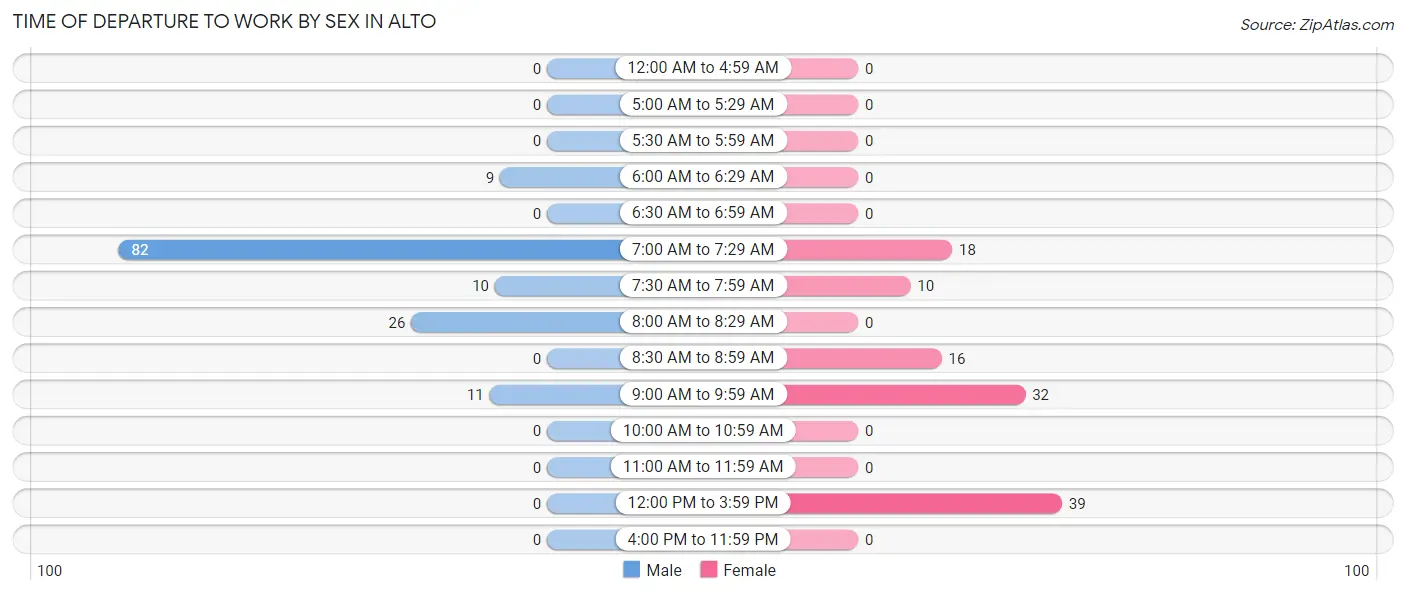
| Time of Departure | Male | Female |
| 12:00 AM to 4:59 AM | 0 (0.0%) | 0 (0.0%) |
| 5:00 AM to 5:29 AM | 0 (0.0%) | 0 (0.0%) |
| 5:30 AM to 5:59 AM | 0 (0.0%) | 0 (0.0%) |
| 6:00 AM to 6:29 AM | 9 (6.5%) | 0 (0.0%) |
| 6:30 AM to 6:59 AM | 0 (0.0%) | 0 (0.0%) |
| 7:00 AM to 7:29 AM | 82 (59.4%) | 18 (15.7%) |
| 7:30 AM to 7:59 AM | 10 (7.2%) | 10 (8.7%) |
| 8:00 AM to 8:29 AM | 26 (18.8%) | 0 (0.0%) |
| 8:30 AM to 8:59 AM | 0 (0.0%) | 16 (13.9%) |
| 9:00 AM to 9:59 AM | 11 (8.0%) | 32 (27.8%) |
| 10:00 AM to 10:59 AM | 0 (0.0%) | 0 (0.0%) |
| 11:00 AM to 11:59 AM | 0 (0.0%) | 0 (0.0%) |
| 12:00 PM to 3:59 PM | 0 (0.0%) | 39 (33.9%) |
| 4:00 PM to 11:59 PM | 0 (0.0%) | 0 (0.0%) |
| Total | 138 (100.0%) | 115 (100.0%) |
Housing Occupancy in Alto
Occupancy by Ownership in Alto
Of the total 295 dwellings in Alto, owner-occupied units account for 151 (51.2%), while renter-occupied units make up 144 (48.8%).
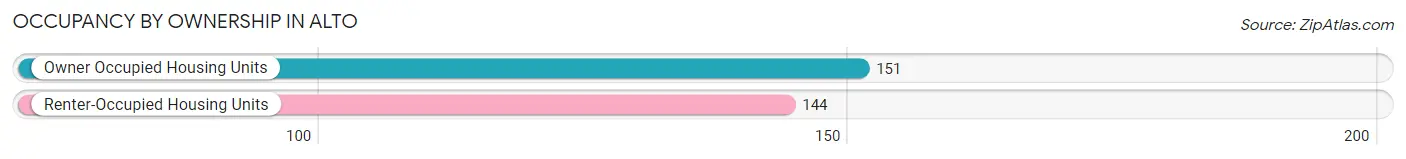
| Occupancy | # Housing Units | % Housing Units |
| Owner Occupied Housing Units | 151 | 51.2% |
| Renter-Occupied Housing Units | 144 | 48.8% |
| Total Occupied Housing Units | 295 | 100.0% |
Occupancy by Household Size in Alto
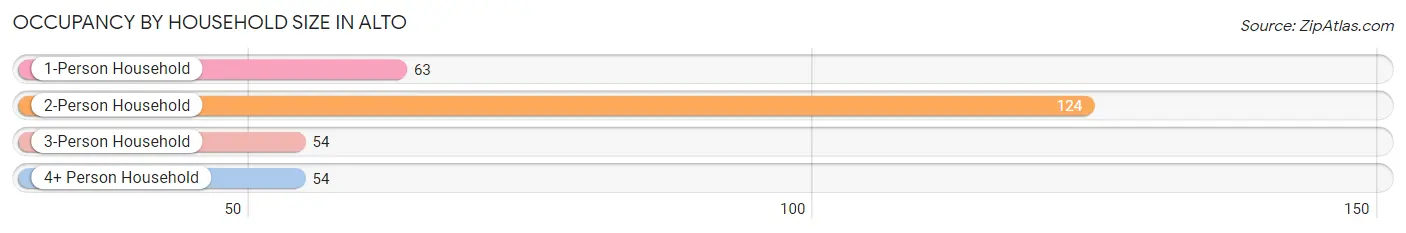
| Household Size | # Housing Units | % Housing Units |
| 1-Person Household | 63 | 21.4% |
| 2-Person Household | 124 | 42.0% |
| 3-Person Household | 54 | 18.3% |
| 4+ Person Household | 54 | 18.3% |
| Total Housing Units | 295 | 100.0% |
Occupancy by Ownership by Household Size in Alto
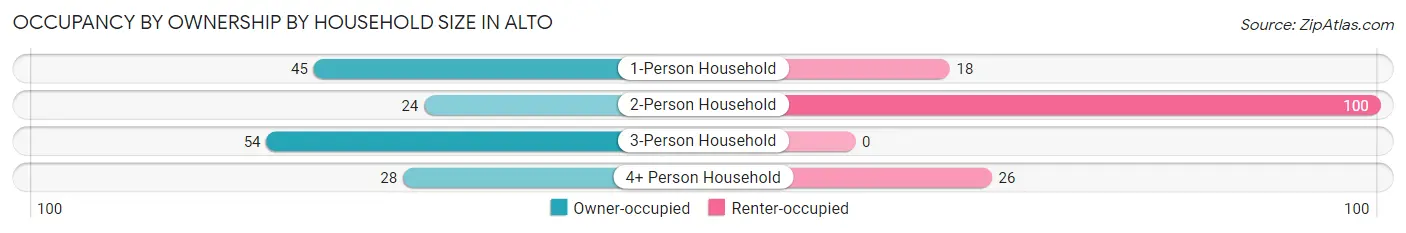
| Household Size | Owner-occupied | Renter-occupied |
| 1-Person Household | 45 (71.4%) | 18 (28.6%) |
| 2-Person Household | 24 (19.4%) | 100 (80.6%) |
| 3-Person Household | 54 (100.0%) | 0 (0.0%) |
| 4+ Person Household | 28 (51.8%) | 26 (48.1%) |
| Total Housing Units | 151 (51.2%) | 144 (48.8%) |
Occupancy by Educational Attainment in Alto
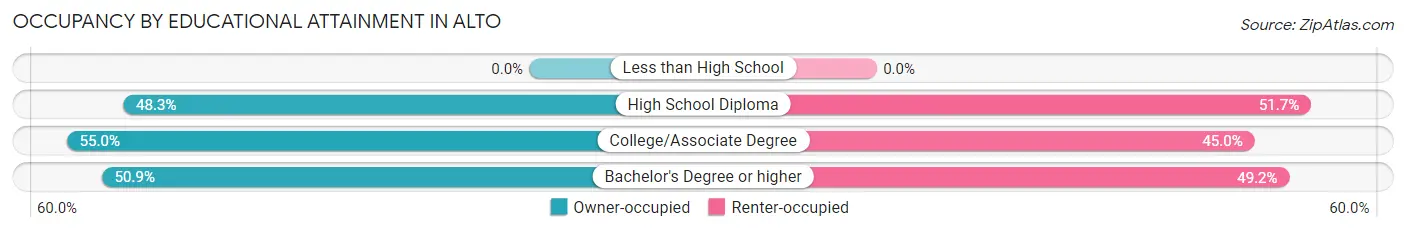
| Household Size | Owner-occupied | Renter-occupied |
| Less than High School | 0 (0.0%) | 0 (0.0%) |
| High School Diploma | 28 (48.3%) | 30 (51.7%) |
| College/Associate Degree | 33 (55.0%) | 27 (45.0%) |
| Bachelor's Degree or higher | 90 (50.8%) | 87 (49.1%) |
Occupancy by Age of Householder in Alto
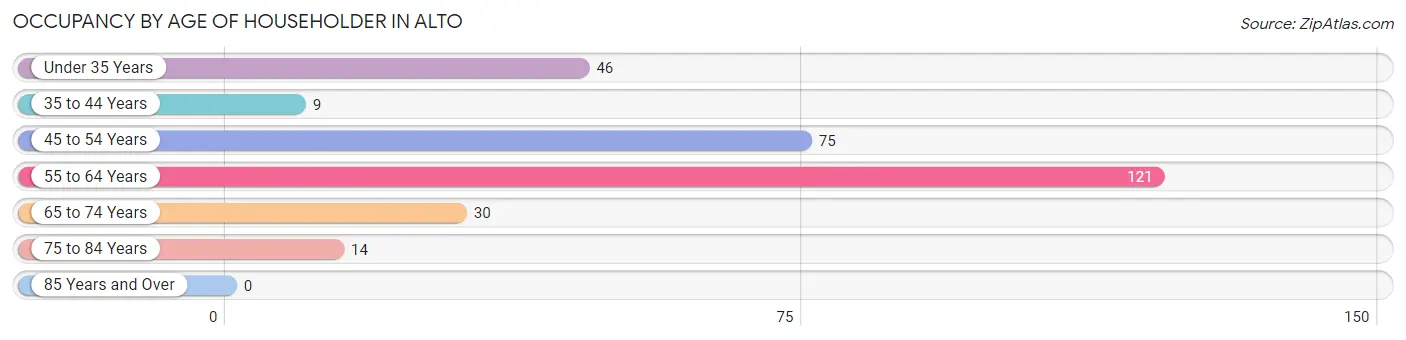
| Age Bracket | # Households | % Households |
| Under 35 Years | 46 | 15.6% |
| 35 to 44 Years | 9 | 3.0% |
| 45 to 54 Years | 75 | 25.4% |
| 55 to 64 Years | 121 | 41.0% |
| 65 to 74 Years | 30 | 10.2% |
| 75 to 84 Years | 14 | 4.8% |
| 85 Years and Over | 0 | 0.0% |
| Total | 295 | 100.0% |
Housing Finances in Alto
Median Income by Occupancy in Alto
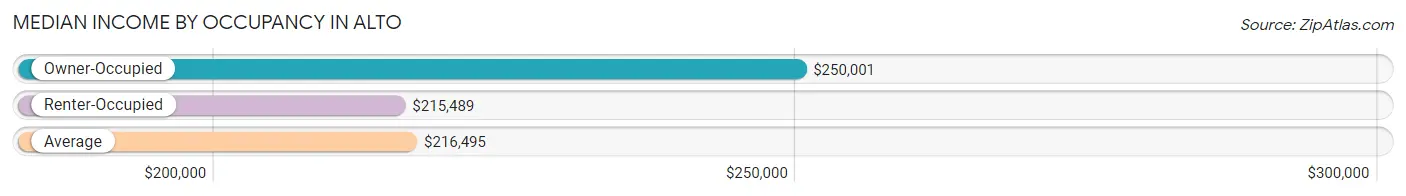
| Occupancy Type | # Households | Median Income |
| Owner-Occupied | 151 (51.2%) | $250,001 |
| Renter-Occupied | 144 (48.8%) | $215,489 |
| Average | 295 (100.0%) | $216,495 |
Occupancy by Householder Income Bracket in Alto
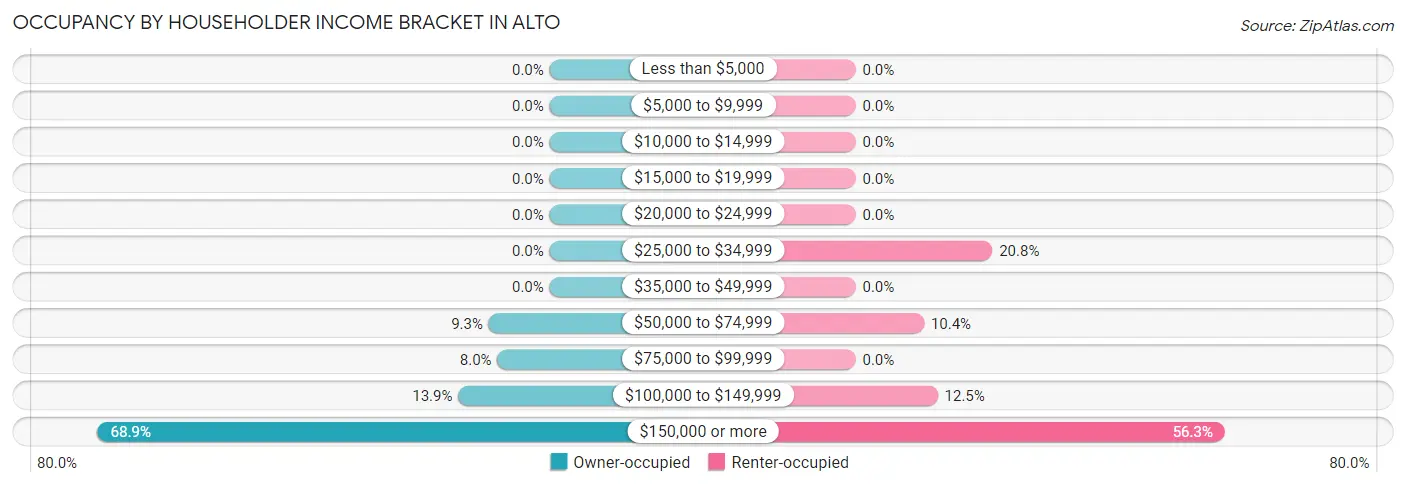
| Income Bracket | Owner-occupied | Renter-occupied |
| Less than $5,000 | 0 (0.0%) | 0 (0.0%) |
| $5,000 to $9,999 | 0 (0.0%) | 0 (0.0%) |
| $10,000 to $14,999 | 0 (0.0%) | 0 (0.0%) |
| $15,000 to $19,999 | 0 (0.0%) | 0 (0.0%) |
| $20,000 to $24,999 | 0 (0.0%) | 0 (0.0%) |
| $25,000 to $34,999 | 0 (0.0%) | 30 (20.8%) |
| $35,000 to $49,999 | 0 (0.0%) | 0 (0.0%) |
| $50,000 to $74,999 | 14 (9.3%) | 15 (10.4%) |
| $75,000 to $99,999 | 12 (8.0%) | 0 (0.0%) |
| $100,000 to $149,999 | 21 (13.9%) | 18 (12.5%) |
| $150,000 or more | 104 (68.9%) | 81 (56.2%) |
| Total | 151 (100.0%) | 144 (100.0%) |
Monthly Housing Cost Tiers in Alto
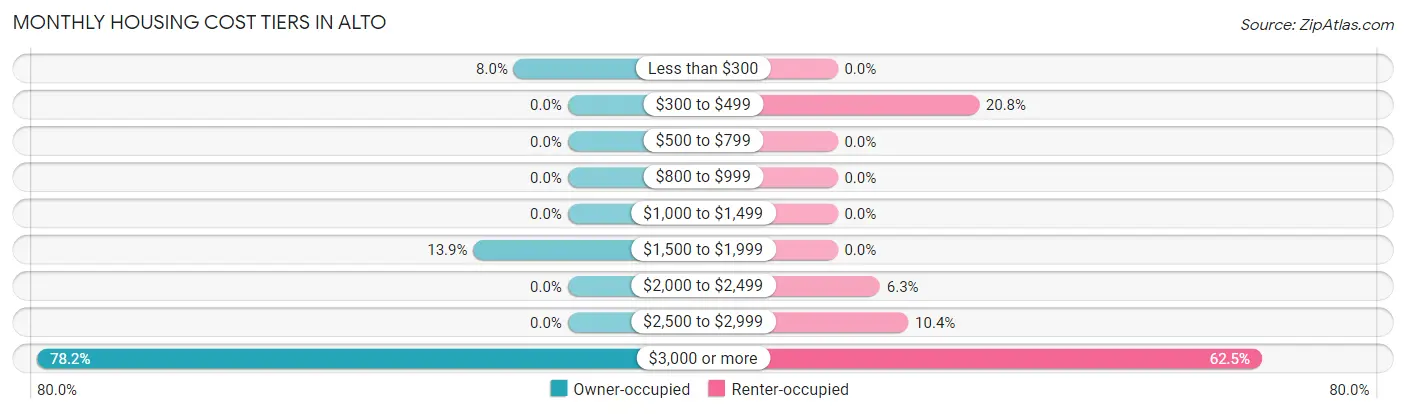
| Monthly Cost | Owner-occupied | Renter-occupied |
| Less than $300 | 12 (8.0%) | 0 (0.0%) |
| $300 to $499 | 0 (0.0%) | 30 (20.8%) |
| $500 to $799 | 0 (0.0%) | 0 (0.0%) |
| $800 to $999 | 0 (0.0%) | 0 (0.0%) |
| $1,000 to $1,499 | 0 (0.0%) | 0 (0.0%) |
| $1,500 to $1,999 | 21 (13.9%) | 0 (0.0%) |
| $2,000 to $2,499 | 0 (0.0%) | 9 (6.2%) |
| $2,500 to $2,999 | 0 (0.0%) | 15 (10.4%) |
| $3,000 or more | 118 (78.1%) | 90 (62.5%) |
| Total | 151 (100.0%) | 144 (100.0%) |
Physical Housing Characteristics in Alto
Housing Structures in Alto
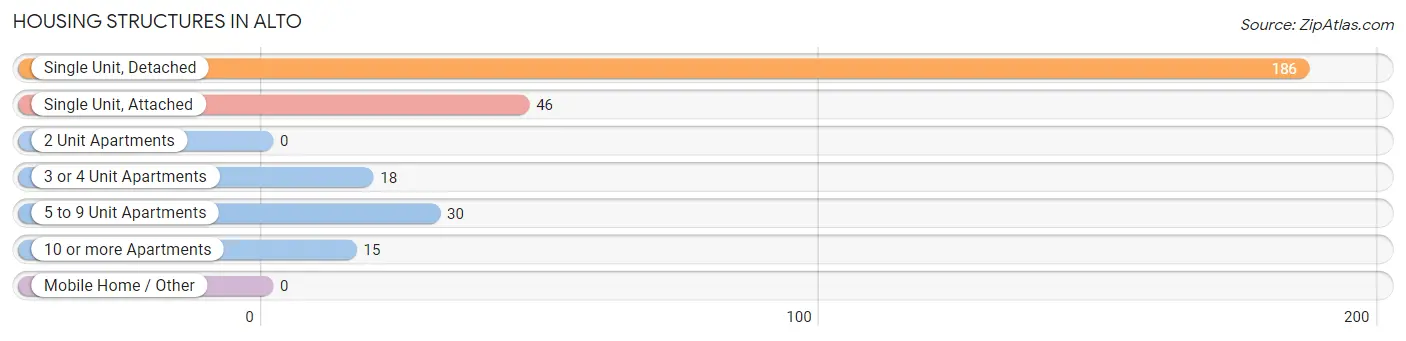
| Structure Type | # Housing Units | % Housing Units |
| Single Unit, Detached | 186 | 63.0% |
| Single Unit, Attached | 46 | 15.6% |
| 2 Unit Apartments | 0 | 0.0% |
| 3 or 4 Unit Apartments | 18 | 6.1% |
| 5 to 9 Unit Apartments | 30 | 10.2% |
| 10 or more Apartments | 15 | 5.1% |
| Mobile Home / Other | 0 | 0.0% |
| Total | 295 | 100.0% |
Housing Structures by Occupancy in Alto
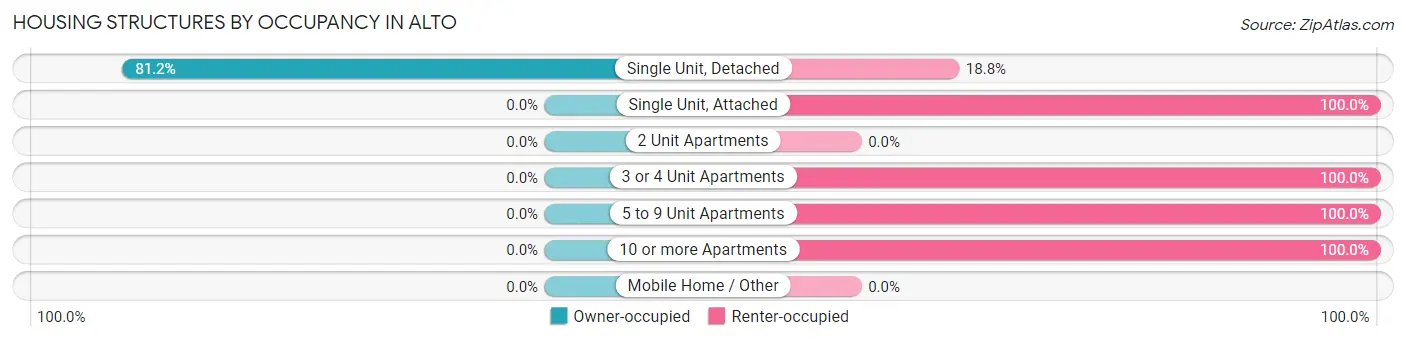
| Structure Type | Owner-occupied | Renter-occupied |
| Single Unit, Detached | 151 (81.2%) | 35 (18.8%) |
| Single Unit, Attached | 0 (0.0%) | 46 (100.0%) |
| 2 Unit Apartments | 0 (0.0%) | 0 (0.0%) |
| 3 or 4 Unit Apartments | 0 (0.0%) | 18 (100.0%) |
| 5 to 9 Unit Apartments | 0 (0.0%) | 30 (100.0%) |
| 10 or more Apartments | 0 (0.0%) | 15 (100.0%) |
| Mobile Home / Other | 0 (0.0%) | 0 (0.0%) |
| Total | 151 (51.2%) | 144 (48.8%) |
Housing Structures by Number of Rooms in Alto
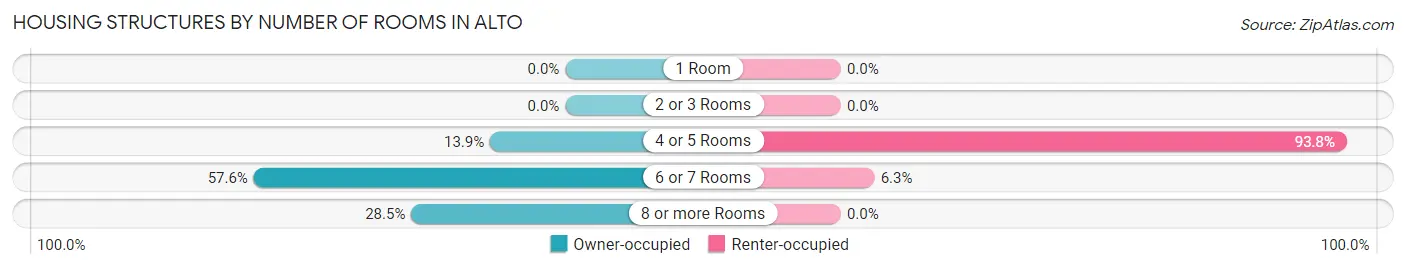
| Number of Rooms | Owner-occupied | Renter-occupied |
| 1 Room | 0 (0.0%) | 0 (0.0%) |
| 2 or 3 Rooms | 0 (0.0%) | 0 (0.0%) |
| 4 or 5 Rooms | 21 (13.9%) | 135 (93.8%) |
| 6 or 7 Rooms | 87 (57.6%) | 9 (6.2%) |
| 8 or more Rooms | 43 (28.5%) | 0 (0.0%) |
| Total | 151 (100.0%) | 144 (100.0%) |
Housing Structure by Heating Type in Alto
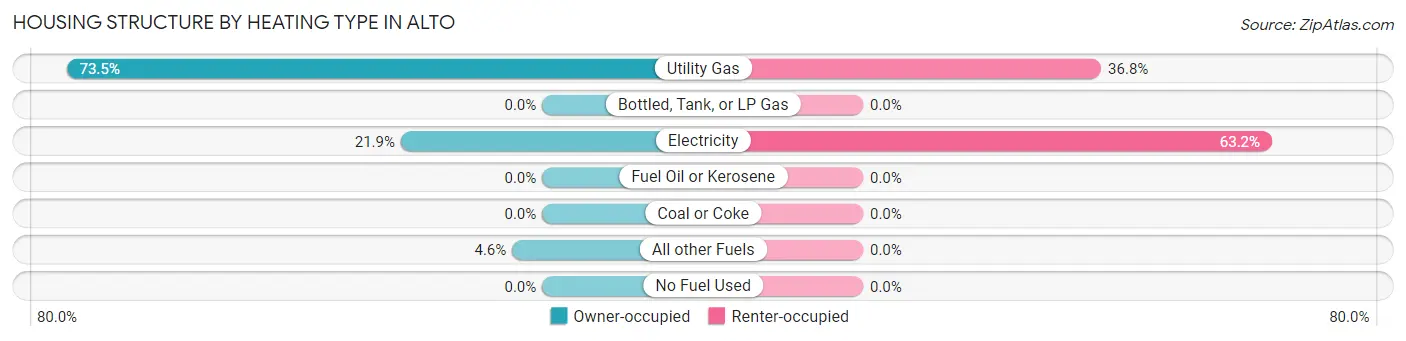
| Heating Type | Owner-occupied | Renter-occupied |
| Utility Gas | 111 (73.5%) | 53 (36.8%) |
| Bottled, Tank, or LP Gas | 0 (0.0%) | 0 (0.0%) |
| Electricity | 33 (21.8%) | 91 (63.2%) |
| Fuel Oil or Kerosene | 0 (0.0%) | 0 (0.0%) |
| Coal or Coke | 0 (0.0%) | 0 (0.0%) |
| All other Fuels | 7 (4.6%) | 0 (0.0%) |
| No Fuel Used | 0 (0.0%) | 0 (0.0%) |
| Total | 151 (100.0%) | 144 (100.0%) |
Household Vehicle Usage in Alto
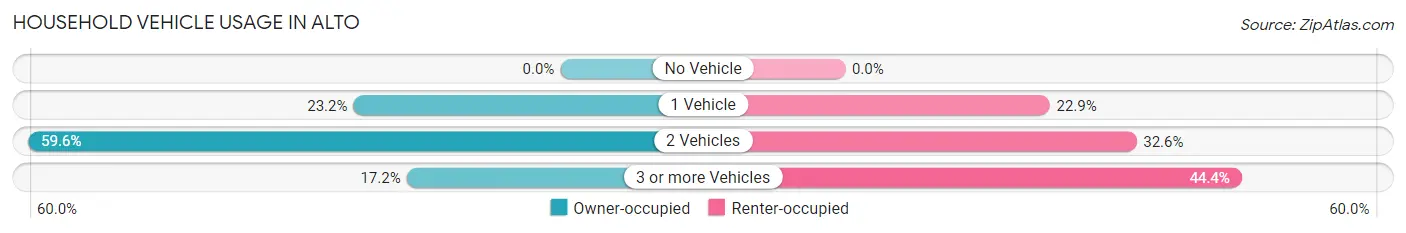
| Vehicles per Household | Owner-occupied | Renter-occupied |
| No Vehicle | 0 (0.0%) | 0 (0.0%) |
| 1 Vehicle | 35 (23.2%) | 33 (22.9%) |
| 2 Vehicles | 90 (59.6%) | 47 (32.6%) |
| 3 or more Vehicles | 26 (17.2%) | 64 (44.4%) |
| Total | 151 (100.0%) | 144 (100.0%) |
Real Estate & Mortgages in Alto
Real Estate and Mortgage Overview in Alto
| Characteristic | Without Mortgage | With Mortgage |
| Housing Units | 12 | 139 |
| Median Property Value | - | - |
| Median Household Income | - | - |
| Monthly Housing Costs | - | - |
| Real Estate Taxes | - | - |
Property Value by Mortgage Status in Alto
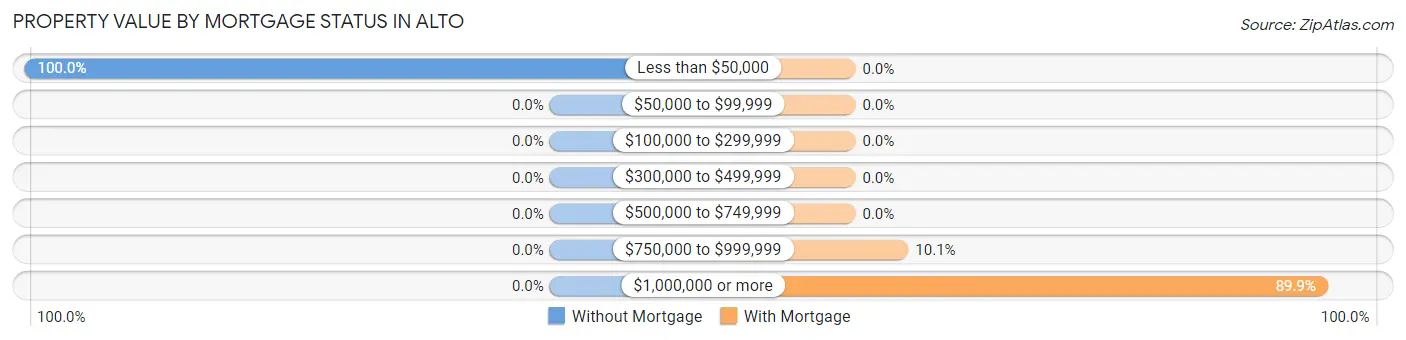
| Property Value | Without Mortgage | With Mortgage |
| Less than $50,000 | 12 (100.0%) | 0 (0.0%) |
| $50,000 to $99,999 | 0 (0.0%) | 0 (0.0%) |
| $100,000 to $299,999 | 0 (0.0%) | 0 (0.0%) |
| $300,000 to $499,999 | 0 (0.0%) | 0 (0.0%) |
| $500,000 to $749,999 | 0 (0.0%) | 0 (0.0%) |
| $750,000 to $999,999 | 0 (0.0%) | 14 (10.1%) |
| $1,000,000 or more | 0 (0.0%) | 125 (89.9%) |
| Total | 12 (100.0%) | 139 (100.0%) |
Household Income by Mortgage Status in Alto
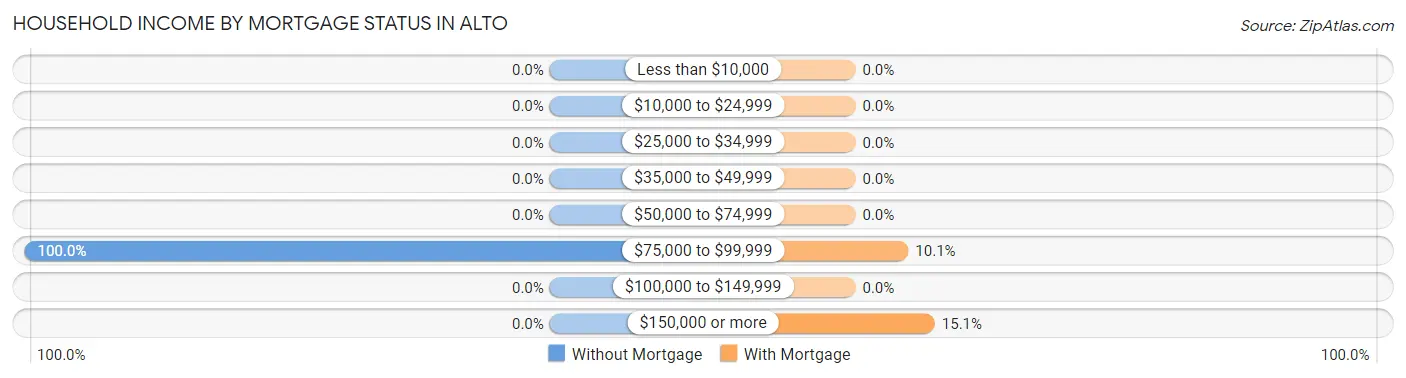
| Household Income | Without Mortgage | With Mortgage |
| Less than $10,000 | 0 (0.0%) | 0 (0.0%) |
| $10,000 to $24,999 | 0 (0.0%) | 0 (0.0%) |
| $25,000 to $34,999 | 0 (0.0%) | 0 (0.0%) |
| $35,000 to $49,999 | 0 (0.0%) | 0 (0.0%) |
| $50,000 to $74,999 | 0 (0.0%) | 0 (0.0%) |
| $75,000 to $99,999 | 12 (100.0%) | 14 (10.1%) |
| $100,000 to $149,999 | 0 (0.0%) | 0 (0.0%) |
| $150,000 or more | 0 (0.0%) | 21 (15.1%) |
| Total | 12 (100.0%) | 139 (100.0%) |
Property Value to Household Income Ratio in Alto
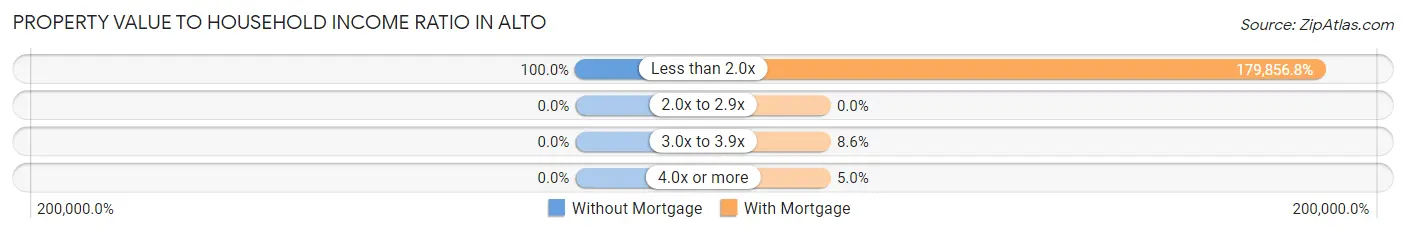
| Value-to-Income Ratio | Without Mortgage | With Mortgage |
| Less than 2.0x | 12 (100.0%) | 250,001 (179,856.8%) |
| 2.0x to 2.9x | 0 (0.0%) | 0 (0.0%) |
| 3.0x to 3.9x | 0 (0.0%) | 12 (8.6%) |
| 4.0x or more | 0 (0.0%) | 7 (5.0%) |
| Total | 12 (100.0%) | 139 (100.0%) |
Real Estate Taxes by Mortgage Status in Alto
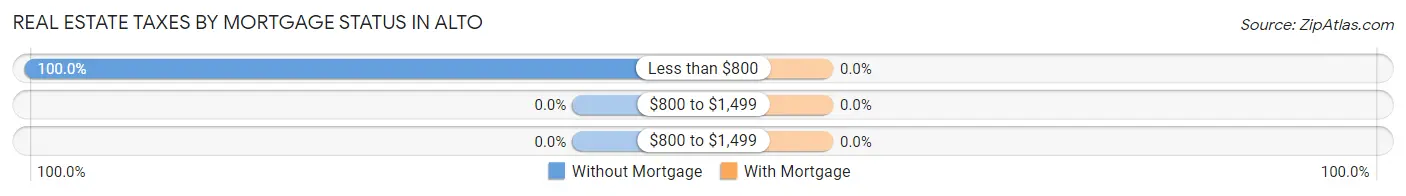
| Property Taxes | Without Mortgage | With Mortgage |
| Less than $800 | 12 (100.0%) | 0 (0.0%) |
| $800 to $1,499 | 0 (0.0%) | 0 (0.0%) |
| $800 to $1,499 | 0 (0.0%) | 0 (0.0%) |
| Total | 12 (100.0%) | 139 (100.0%) |
Health & Disability in Alto
Health Insurance Coverage by Age in Alto
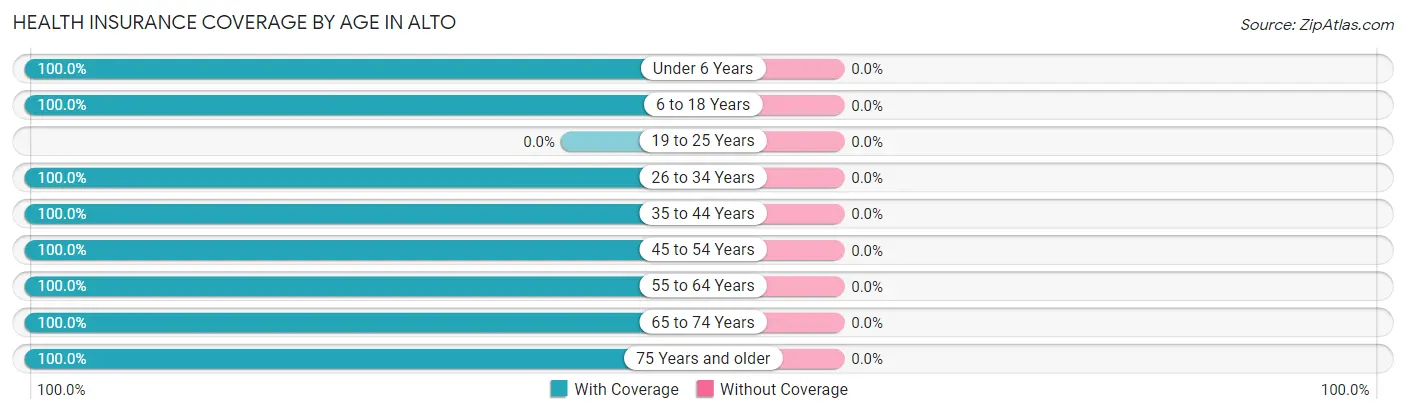
| Age Bracket | With Coverage | Without Coverage |
| Under 6 Years | 8 (100.0%) | 0 (0.0%) |
| 6 to 18 Years | 127 (100.0%) | 0 (0.0%) |
| 19 to 25 Years | 0 (0.0%) | 0 (0.0%) |
| 26 to 34 Years | 112 (100.0%) | 0 (0.0%) |
| 35 to 44 Years | 42 (100.0%) | 0 (0.0%) |
| 45 to 54 Years | 108 (100.0%) | 0 (0.0%) |
| 55 to 64 Years | 203 (100.0%) | 0 (0.0%) |
| 65 to 74 Years | 45 (100.0%) | 0 (0.0%) |
| 75 Years and older | 14 (100.0%) | 0 (0.0%) |
| Total | 659 (100.0%) | 0 (0.0%) |
Health Insurance Coverage by Citizenship Status in Alto

| Citizenship Status | With Coverage | Without Coverage |
| Native Born | 8 (100.0%) | 0 (0.0%) |
| Foreign Born, Citizen | 127 (100.0%) | 0 (0.0%) |
| Foreign Born, not a Citizen | 0 (0.0%) | 0 (0.0%) |
Health Insurance Coverage by Household Income in Alto
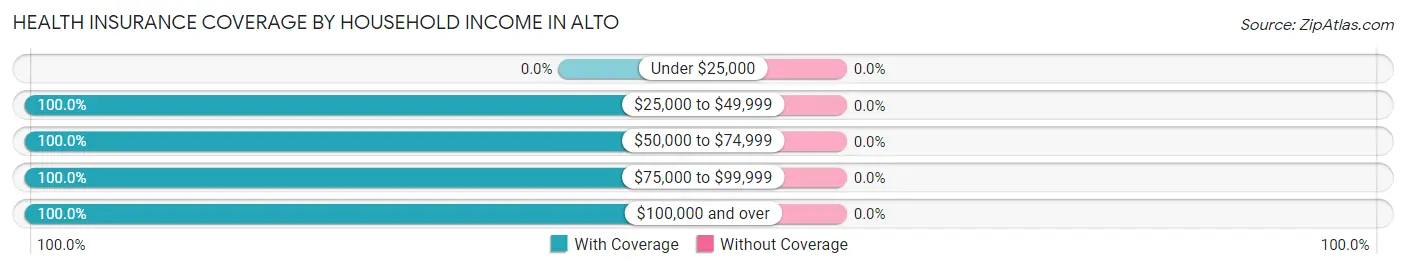
| Household Income | With Coverage | Without Coverage |
| Under $25,000 | 0 (0.0%) | 0 (0.0%) |
| $25,000 to $49,999 | 61 (100.0%) | 0 (0.0%) |
| $50,000 to $74,999 | 43 (100.0%) | 0 (0.0%) |
| $75,000 to $99,999 | 33 (100.0%) | 0 (0.0%) |
| $100,000 and over | 522 (100.0%) | 0 (0.0%) |
Public vs Private Health Insurance Coverage by Age in Alto
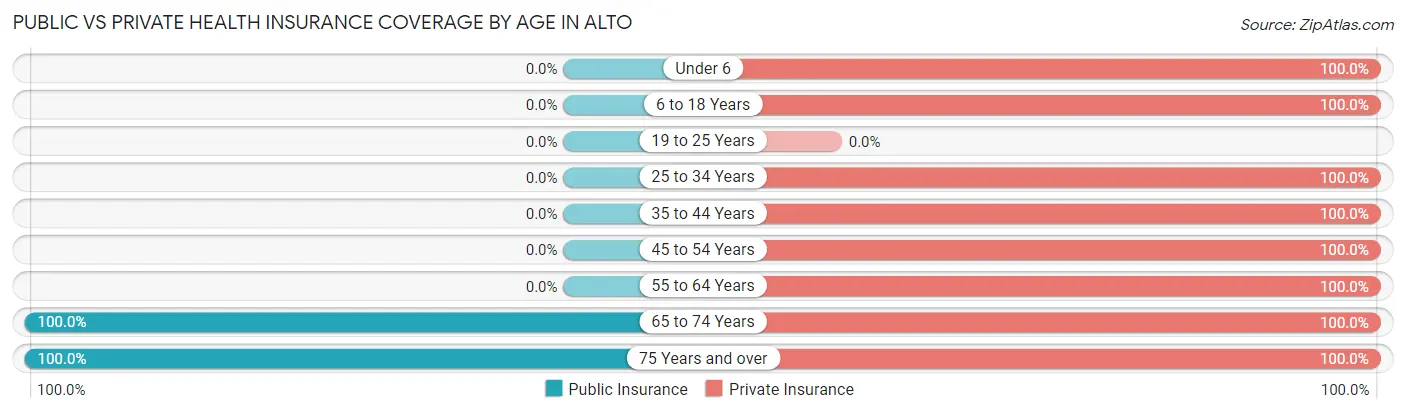
| Age Bracket | Public Insurance | Private Insurance |
| Under 6 | 0 (0.0%) | 8 (100.0%) |
| 6 to 18 Years | 0 (0.0%) | 127 (100.0%) |
| 19 to 25 Years | 0 (0.0%) | 0 (0.0%) |
| 25 to 34 Years | 0 (0.0%) | 112 (100.0%) |
| 35 to 44 Years | 0 (0.0%) | 42 (100.0%) |
| 45 to 54 Years | 0 (0.0%) | 108 (100.0%) |
| 55 to 64 Years | 0 (0.0%) | 203 (100.0%) |
| 65 to 74 Years | 45 (100.0%) | 45 (100.0%) |
| 75 Years and over | 14 (100.0%) | 14 (100.0%) |
| Total | 59 (8.9%) | 659 (100.0%) |
Disability Status by Sex by Age in Alto
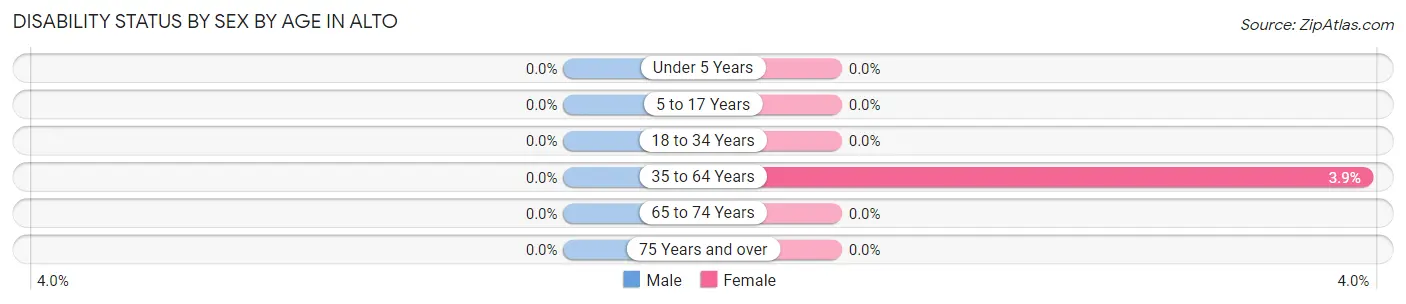
| Age Bracket | Male | Female |
| Under 5 Years | 0 (0.0%) | 0 (0.0%) |
| 5 to 17 Years | 0 (0.0%) | 0 (0.0%) |
| 18 to 34 Years | 0 (0.0%) | 0 (0.0%) |
| 35 to 64 Years | 0 (0.0%) | 10 (3.9%) |
| 65 to 74 Years | 0 (0.0%) | 0 (0.0%) |
| 75 Years and over | 0 (0.0%) | 0 (0.0%) |
Disability Class by Sex by Age in Alto
Disability Class: Hearing Difficulty
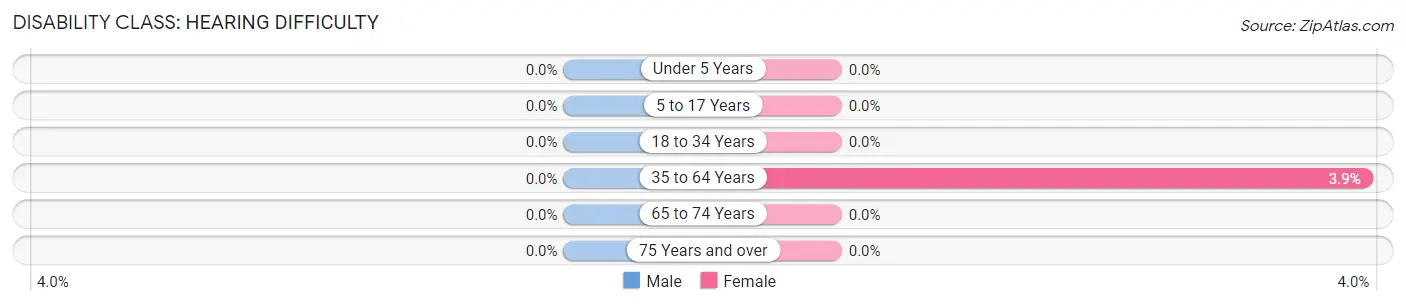
| Age Bracket | Male | Female |
| Under 5 Years | 0 (0.0%) | 0 (0.0%) |
| 5 to 17 Years | 0 (0.0%) | 0 (0.0%) |
| 18 to 34 Years | 0 (0.0%) | 0 (0.0%) |
| 35 to 64 Years | 0 (0.0%) | 10 (3.9%) |
| 65 to 74 Years | 0 (0.0%) | 0 (0.0%) |
| 75 Years and over | 0 (0.0%) | 0 (0.0%) |
Disability Class: Vision Difficulty
| Age Bracket | Male | Female |
| Under 5 Years | 0 (0.0%) | 0 (0.0%) |
| 5 to 17 Years | 0 (0.0%) | 0 (0.0%) |
| 18 to 34 Years | 0 (0.0%) | 0 (0.0%) |
| 35 to 64 Years | 0 (0.0%) | 0 (0.0%) |
| 65 to 74 Years | 0 (0.0%) | 0 (0.0%) |
| 75 Years and over | 0 (0.0%) | 0 (0.0%) |
Disability Class: Cognitive Difficulty
| Age Bracket | Male | Female |
| 5 to 17 Years | 0 (0.0%) | 0 (0.0%) |
| 18 to 34 Years | 0 (0.0%) | 0 (0.0%) |
| 35 to 64 Years | 0 (0.0%) | 0 (0.0%) |
| 65 to 74 Years | 0 (0.0%) | 0 (0.0%) |
| 75 Years and over | 0 (0.0%) | 0 (0.0%) |
Disability Class: Ambulatory Difficulty
| Age Bracket | Male | Female |
| 5 to 17 Years | 0 (0.0%) | 0 (0.0%) |
| 18 to 34 Years | 0 (0.0%) | 0 (0.0%) |
| 35 to 64 Years | 0 (0.0%) | 0 (0.0%) |
| 65 to 74 Years | 0 (0.0%) | 0 (0.0%) |
| 75 Years and over | 0 (0.0%) | 0 (0.0%) |
Disability Class: Self-Care Difficulty
| Age Bracket | Male | Female |
| 5 to 17 Years | 0 (0.0%) | 0 (0.0%) |
| 18 to 34 Years | 0 (0.0%) | 0 (0.0%) |
| 35 to 64 Years | 0 (0.0%) | 0 (0.0%) |
| 65 to 74 Years | 0 (0.0%) | 0 (0.0%) |
| 75 Years and over | 0 (0.0%) | 0 (0.0%) |
Technology Access in Alto
Computing Device Access in Alto
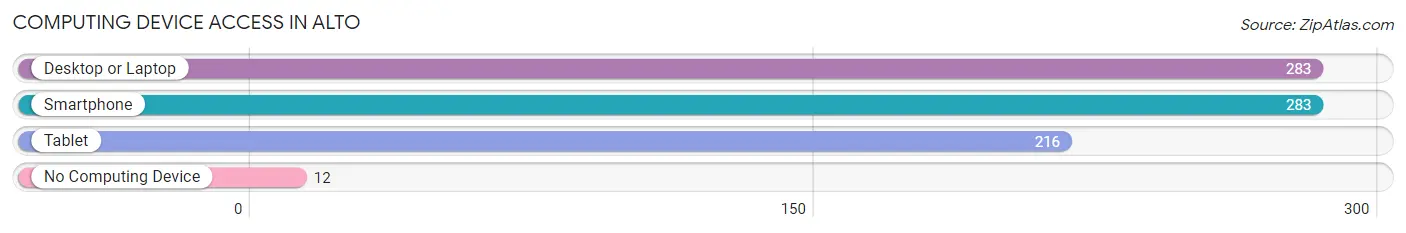
| Device Type | # Households | % Households |
| Desktop or Laptop | 283 | 95.9% |
| Smartphone | 283 | 95.9% |
| Tablet | 216 | 73.2% |
| No Computing Device | 12 | 4.1% |
| Total | 295 | 100.0% |
Internet Access in Alto
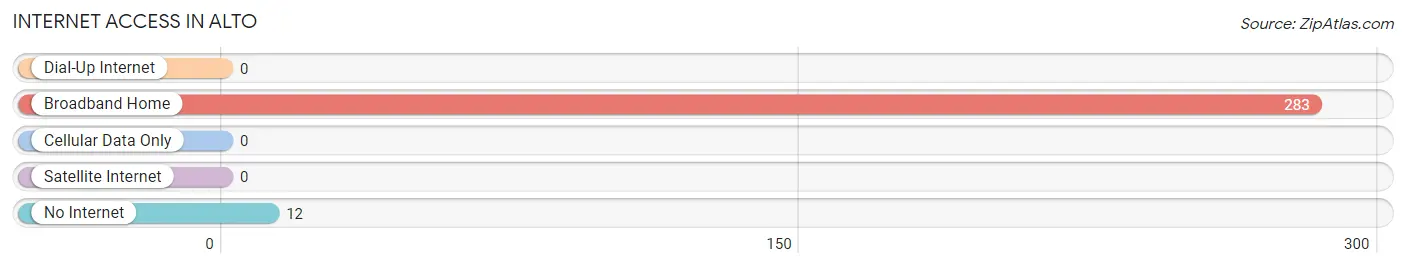
| Internet Type | # Households | % Households |
| Dial-Up Internet | 0 | 0.0% |
| Broadband Home | 283 | 95.9% |
| Cellular Data Only | 0 | 0.0% |
| Satellite Internet | 0 | 0.0% |
| No Internet | 12 | 4.1% |
| Total | 295 | 100.0% |
Alto Summary
Alto, California is a small unincorporated community located in the Sierra Nevada foothills of Placer County, California. It is situated at an elevation of 2,400 feet (731 m) and is located approximately 25 miles (40 km) northeast of Sacramento. The population of Alto as of the 2010 census was 1,845.
Geography
Alto is located in the Sierra Nevada foothills of Placer County, California. It is situated at an elevation of 2,400 feet (731 m) and is located approximately 25 miles (40 km) northeast of Sacramento. The community is surrounded by rolling hills and is bordered by the American River to the north and the Bear River to the south. The area is characterized by a Mediterranean climate with hot, dry summers and cool, wet winters.
Economy
Alto’s economy is largely based on agriculture and tourism. The area is home to several wineries, including the award-winning Naggiar Vineyards. The community is also home to several small businesses, including a grocery store, a hardware store, and a few restaurants. The area is also popular with outdoor enthusiasts, who come to enjoy the nearby hiking trails, fishing spots, and camping sites.
Demographics
As of the 2010 census, Alto had a population of 1,845. The racial makeup of the community was 87.3% White, 0.7% African American, 0.7% Native American, 0.7% Asian, 0.2% Pacific Islander, 8.2% from other races, and 2.2% from two or more races. Hispanic or Latino of any race were 16.2% of the population.
The median income for a household in Alto was $50,938, and the median income for a family was $58,750. Males had a median income of $41,250 versus $30,000 for females. The per capita income for the community was $22,945. About 8.2% of families and 10.2% of the population were below the poverty line, including 14.2% of those under age 18 and 4.2% of those age 65 or over.
Conclusion
Alto, California is a small unincorporated community located in the Sierra Nevada foothills of Placer County, California. It is situated at an elevation of 2,400 feet (731 m) and is located approximately 25 miles (40 km) northeast of Sacramento. The population of Alto as of the 2010 census was 1,845. The economy of Alto is largely based on agriculture and tourism, and the area is popular with outdoor enthusiasts. The racial makeup of the community was 87.3% White, 0.7% African American, 0.7% Native American, 0.7% Asian, 0.2% Pacific Islander, 8.2% from other races, and 2.2% from two or more races. The median income for a household in Alto was $50,938, and the median income for a family was $58,750. Alto is a small but vibrant community that offers a unique blend of rural and urban living.
Common Questions
What is Per Capita Income in Alto?
Per Capita income in Alto is $120,225.
What is the Median Family Income in Alto?
Median Family Income in Alto is $221,912.
What is the Median Household income in Alto?
Median Household Income in Alto is $216,495.
What is Inequality or Gini Index in Alto?
Inequality or Gini Index in Alto is 0.43.
What is the Total Population of Alto?
Total Population of Alto is 659.
What is the Total Male Population of Alto?
Total Male Population of Alto is 261.
What is the Total Female Population of Alto?
Total Female Population of Alto is 398.
What is the Ratio of Males per 100 Females in Alto?
There are 65.58 Males per 100 Females in Alto.
What is the Ratio of Females per 100 Males in Alto?
There are 152.49 Females per 100 Males in Alto.
What is the Median Population Age in Alto?
Median Population Age in Alto is 48.8 Years.
What is the Average Family Size in Alto
Average Family Size in Alto is 2.6 People.
What is the Average Household Size in Alto
Average Household Size in Alto is 2.2 People.
How Large is the Labor Force in Alto?
There are 370 People in the Labor Forcein in Alto.
What is the Percentage of People in the Labor Force in Alto?
66.7% of People are in the Labor Force in Alto.
What is the Unemployment Rate in Alto?
Unemployment Rate in Alto is 7.8%.