Kirkwood, CA Map & Demographics
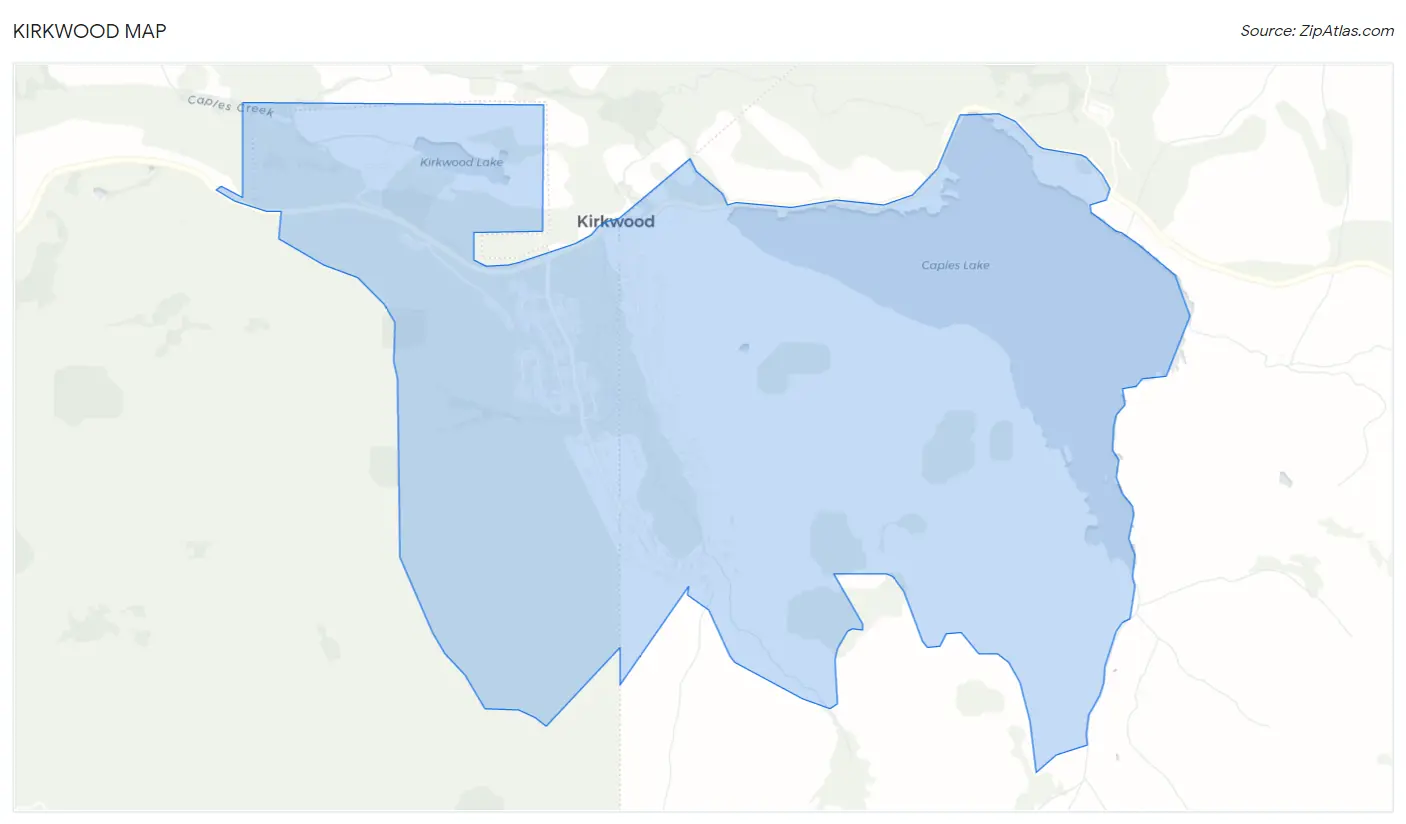
Kirkwood Map
Kirkwood Overview
$36,701
PER CAPITA INCOME
$153,250
AVG FAMILY INCOME
$138,295
AVG HOUSEHOLD INCOME
0.40
INEQUALITY / GINI INDEX
249
TOTAL POPULATION
175
MALE POPULATION
74
FEMALE POPULATION
236.49
MALES / 100 FEMALES
42.29
FEMALES / 100 MALES
26.6
MEDIAN AGE
4.1
AVG FAMILY SIZE
3.0
AVG HOUSEHOLD SIZE
102
LABOR FORCE [ PEOPLE ]
62.2%
PERCENT IN LABOR FORCE
Kirkwood Zip Codes
Income in Kirkwood
Income Overview in Kirkwood
Per Capita Income in Kirkwood is $36,701, while median incomes of families and households are $153,250 and $138,295 respectively.
| Characteristic | Number | Measure |
| Per Capita Income | 249 | $36,701 |
| Median Family Income | 38 | $153,250 |
| Mean Family Income | 38 | $187,447 |
| Median Household Income | 59 | $138,295 |
| Mean Household Income | 59 | $144,310 |
| Income Deficit | 38 | $0 |
| Wage / Income Gap (%) | 249 | 0.00% |
| Wage / Income Gap ($) | 249 | 100.00¢ per $1 |
| Gini / Inequality Index | 249 | 0.40 |
Earnings by Sex in Kirkwood
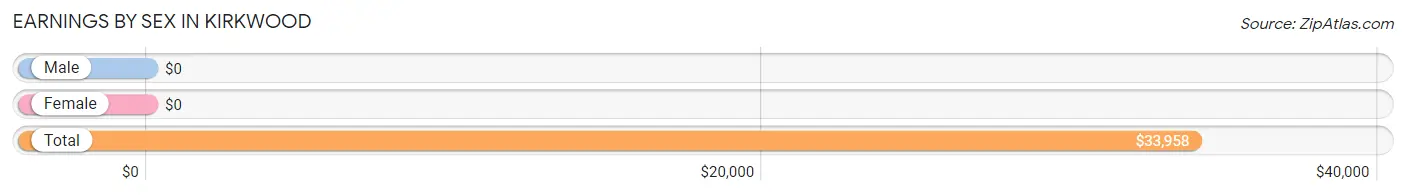
| Sex | Number | Average Earnings |
| Male | 94 (72.3%) | $0 |
| Female | 36 (27.7%) | $0 |
| Total | 130 (100.0%) | $33,958 |
Earnings by Sex by Income Bracket in Kirkwood
The most common earnings brackets in Kirkwood are $2,500 to $4,999 for men (15 | 16.0%) and $75,000 to $99,999 for women (21 | 58.3%).
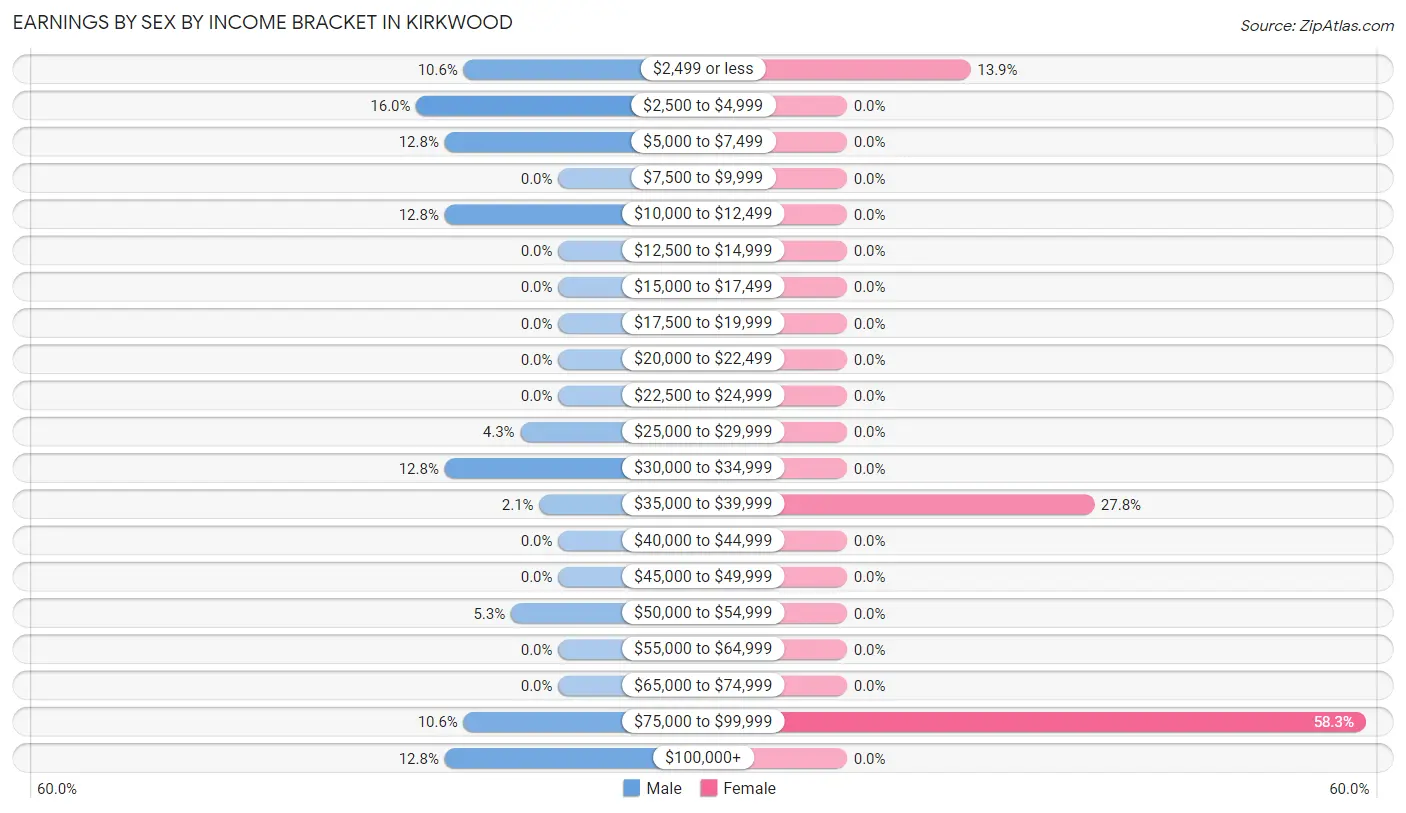
| Income | Male | Female |
| $2,499 or less | 10 (10.6%) | 5 (13.9%) |
| $2,500 to $4,999 | 15 (16.0%) | 0 (0.0%) |
| $5,000 to $7,499 | 12 (12.8%) | 0 (0.0%) |
| $7,500 to $9,999 | 0 (0.0%) | 0 (0.0%) |
| $10,000 to $12,499 | 12 (12.8%) | 0 (0.0%) |
| $12,500 to $14,999 | 0 (0.0%) | 0 (0.0%) |
| $15,000 to $17,499 | 0 (0.0%) | 0 (0.0%) |
| $17,500 to $19,999 | 0 (0.0%) | 0 (0.0%) |
| $20,000 to $22,499 | 0 (0.0%) | 0 (0.0%) |
| $22,500 to $24,999 | 0 (0.0%) | 0 (0.0%) |
| $25,000 to $29,999 | 4 (4.3%) | 0 (0.0%) |
| $30,000 to $34,999 | 12 (12.8%) | 0 (0.0%) |
| $35,000 to $39,999 | 2 (2.1%) | 10 (27.8%) |
| $40,000 to $44,999 | 0 (0.0%) | 0 (0.0%) |
| $45,000 to $49,999 | 0 (0.0%) | 0 (0.0%) |
| $50,000 to $54,999 | 5 (5.3%) | 0 (0.0%) |
| $55,000 to $64,999 | 0 (0.0%) | 0 (0.0%) |
| $65,000 to $74,999 | 0 (0.0%) | 0 (0.0%) |
| $75,000 to $99,999 | 10 (10.6%) | 21 (58.3%) |
| $100,000+ | 12 (12.8%) | 0 (0.0%) |
| Total | 94 (100.0%) | 36 (100.0%) |
Earnings by Sex by Educational Attainment in Kirkwood
| Educational Attainment | Male Income | Female Income |
| Less than High School | - | - |
| High School Diploma | - | - |
| College or Associate's Degree | - | - |
| Bachelor's Degree | - | - |
| Graduate Degree | - | - |
| Total | - | - |
Family Income in Kirkwood
Family Income Brackets in Kirkwood
According to the Kirkwood family income data, there are 12 families falling into the $200,000+ income range, which is the most common income bracket and makes up 31.6% of all families.
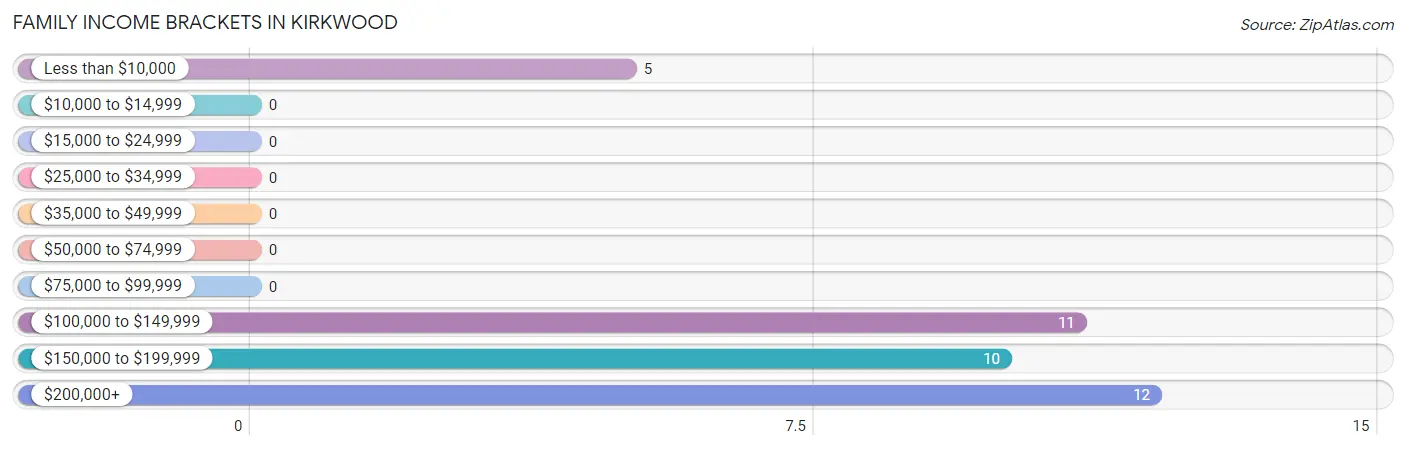
| Income Bracket | # Families | % Families |
| Less than $10,000 | 5 | 13.2% |
| $10,000 to $14,999 | 0 | 0.0% |
| $15,000 to $24,999 | 0 | 0.0% |
| $25,000 to $34,999 | 0 | 0.0% |
| $35,000 to $49,999 | 0 | 0.0% |
| $50,000 to $74,999 | 0 | 0.0% |
| $75,000 to $99,999 | 0 | 0.0% |
| $100,000 to $149,999 | 11 | 28.9% |
| $150,000 to $199,999 | 10 | 26.3% |
| $200,000+ | 12 | 31.6% |
Family Income by Famaliy Size in Kirkwood
| Income Bracket | # Families | Median Income |
| 2-Person Families | 17 (44.7%) | $0 |
| 3-Person Families | 10 (26.3%) | $0 |
| 4-Person Families | 11 (28.9%) | $0 |
| 5-Person Families | 0 (0.0%) | $0 |
| 6-Person Families | 0 (0.0%) | $0 |
| 7+ Person Families | 0 (0.0%) | $0 |
| Total | 38 (100.0%) | $153,250 |
Family Income by Number of Earners in Kirkwood
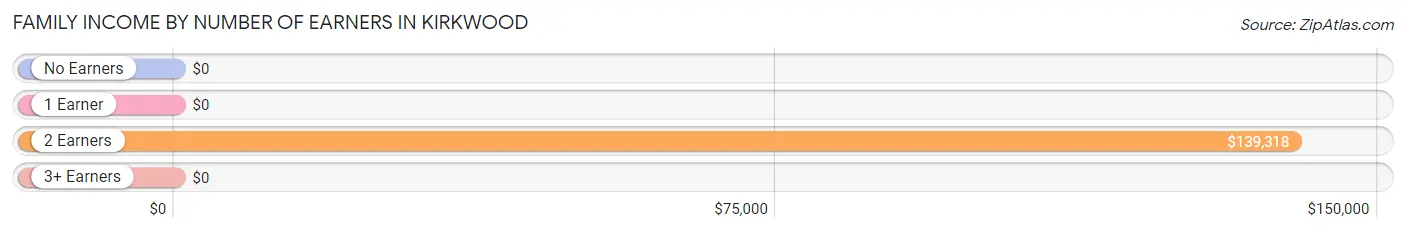
| Number of Earners | # Families | Median Income |
| No Earners | 0 (0.0%) | $0 |
| 1 Earner | 12 (31.6%) | $0 |
| 2 Earners | 26 (68.4%) | $139,318 |
| 3+ Earners | 0 (0.0%) | $0 |
| Total | 38 (100.0%) | $153,250 |
Household Income in Kirkwood
Household Income Brackets in Kirkwood
With 12 households falling in the category, the $200,000+ income range is the most frequent in Kirkwood, accounting for 20.3% of all households.
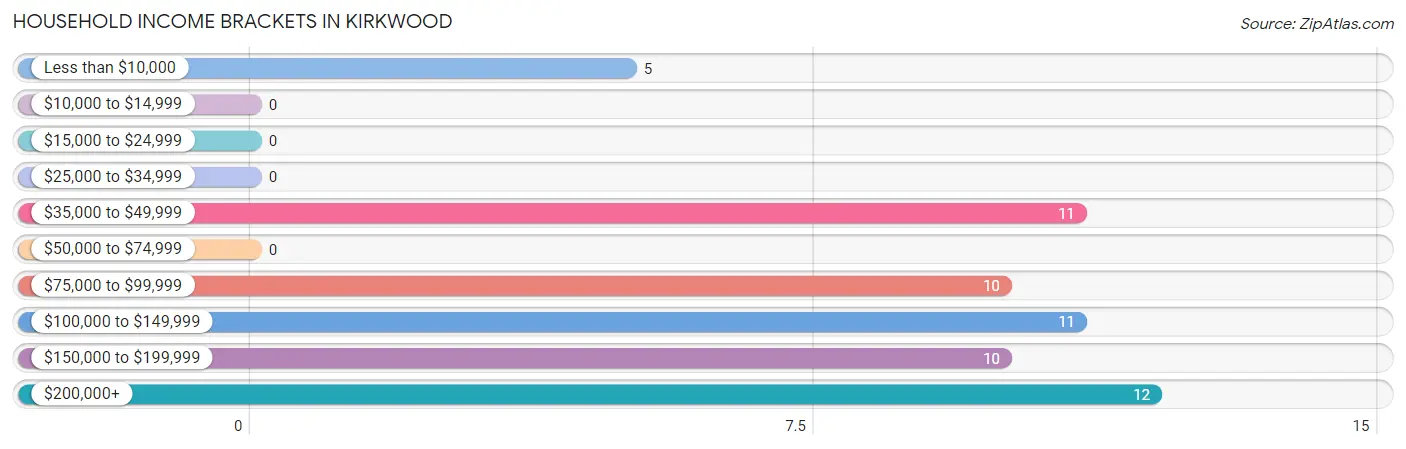
| Income Bracket | # Households | % Households |
| Less than $10,000 | 5 | 8.5% |
| $10,000 to $14,999 | 0 | 0.0% |
| $15,000 to $24,999 | 0 | 0.0% |
| $25,000 to $34,999 | 0 | 0.0% |
| $35,000 to $49,999 | 11 | 18.6% |
| $50,000 to $74,999 | 0 | 0.0% |
| $75,000 to $99,999 | 10 | 16.9% |
| $100,000 to $149,999 | 11 | 18.6% |
| $150,000 to $199,999 | 10 | 16.9% |
| $200,000+ | 12 | 20.3% |
Household Income by Householder Age in Kirkwood
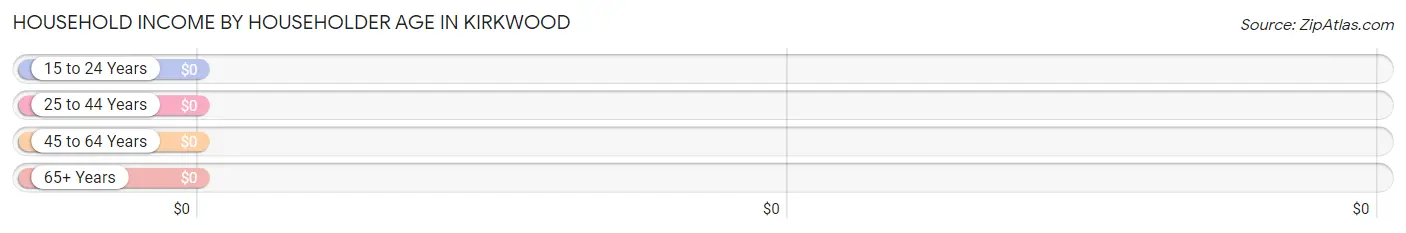
| Income Bracket | # Households | Median Income |
| 15 to 24 Years | 0 (0.0%) | $0 |
| 25 to 44 Years | 11 (18.6%) | $0 |
| 45 to 64 Years | 25 (42.4%) | $0 |
| 65+ Years | 23 (39.0%) | $0 |
| Total | 59 (100.0%) | $138,295 |
Poverty in Kirkwood
Income Below Poverty by Sex and Age in Kirkwood
With 36.0% poverty level for males and 6.8% for females among the residents of Kirkwood, 18 to 24 year old males and 45 to 54 year old females are the most vulnerable to poverty, with 13 males (100.0%) and 5 females (100.0%) in their respective age groups living below the poverty level.
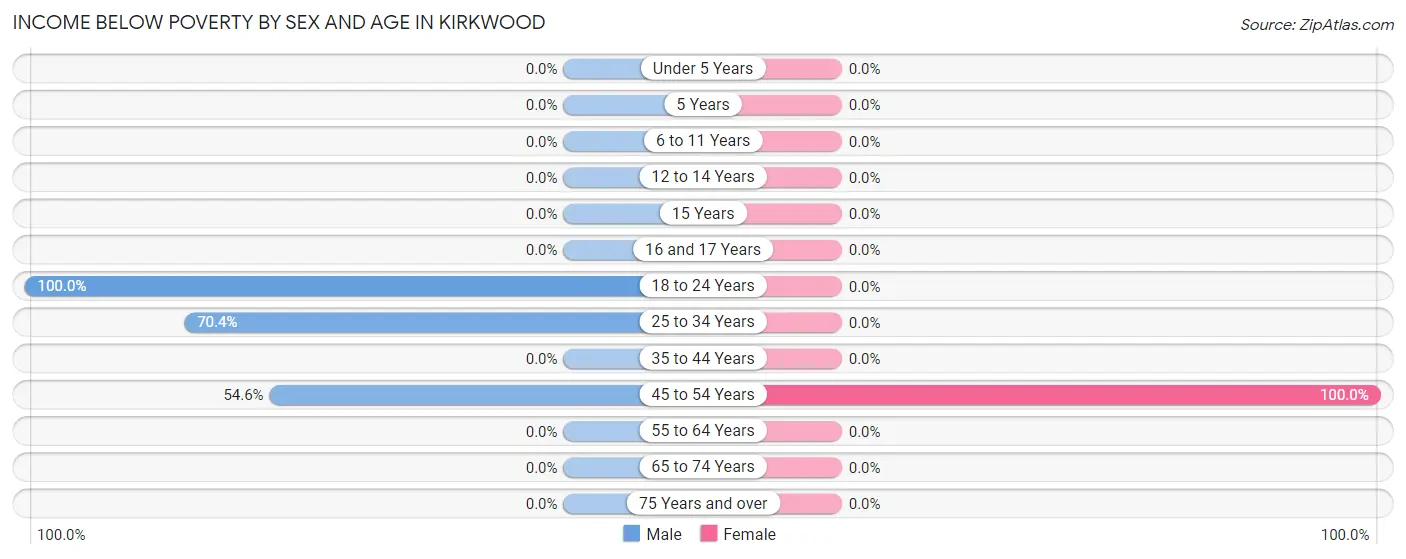
| Age Bracket | Male | Female |
| Under 5 Years | 0 (0.0%) | 0 (0.0%) |
| 5 Years | 0 (0.0%) | 0 (0.0%) |
| 6 to 11 Years | 0 (0.0%) | 0 (0.0%) |
| 12 to 14 Years | 0 (0.0%) | 0 (0.0%) |
| 15 Years | 0 (0.0%) | 0 (0.0%) |
| 16 and 17 Years | 0 (0.0%) | 0 (0.0%) |
| 18 to 24 Years | 13 (100.0%) | 0 (0.0%) |
| 25 to 34 Years | 38 (70.4%) | 0 (0.0%) |
| 35 to 44 Years | 0 (0.0%) | 0 (0.0%) |
| 45 to 54 Years | 12 (54.5%) | 5 (100.0%) |
| 55 to 64 Years | 0 (0.0%) | 0 (0.0%) |
| 65 to 74 Years | 0 (0.0%) | 0 (0.0%) |
| 75 Years and over | 0 (0.0%) | 0 (0.0%) |
| Total | 63 (36.0%) | 5 (6.8%) |
Income Above Poverty by Sex and Age in Kirkwood
According to the poverty statistics in Kirkwood, males aged under 5 years and females aged under 5 years are the age groups that are most secure financially, with 100.0% of males and 100.0% of females in these age groups living above the poverty line.
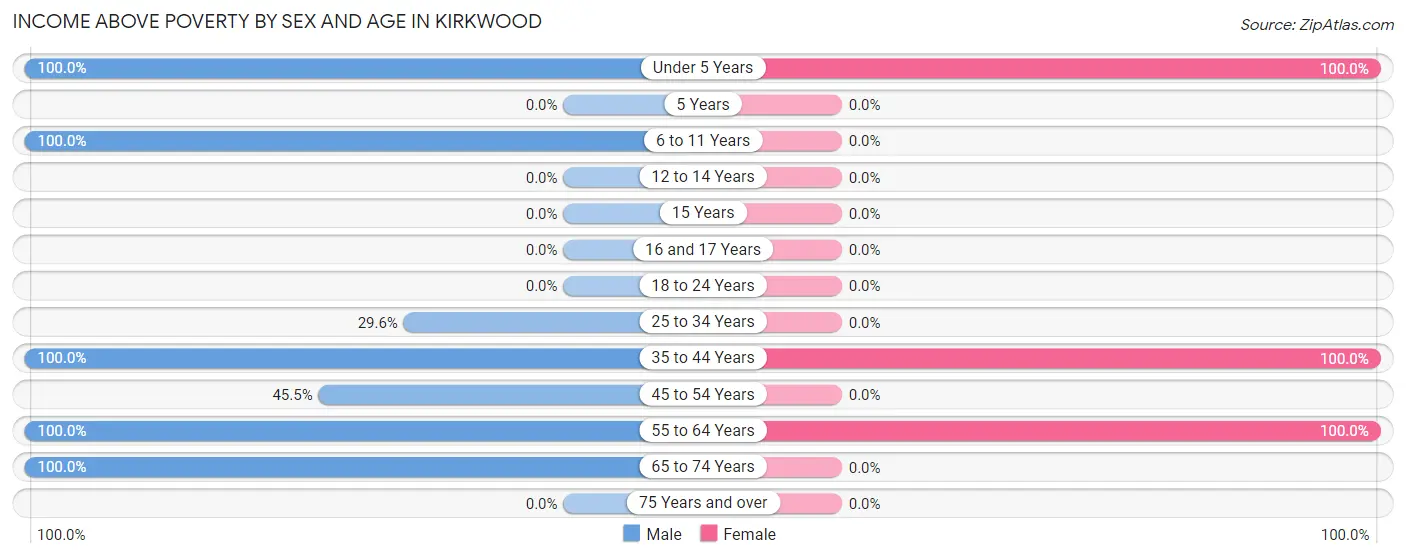
| Age Bracket | Male | Female |
| Under 5 Years | 29 (100.0%) | 29 (100.0%) |
| 5 Years | 0 (0.0%) | 0 (0.0%) |
| 6 to 11 Years | 27 (100.0%) | 0 (0.0%) |
| 12 to 14 Years | 0 (0.0%) | 0 (0.0%) |
| 15 Years | 0 (0.0%) | 0 (0.0%) |
| 16 and 17 Years | 0 (0.0%) | 0 (0.0%) |
| 18 to 24 Years | 0 (0.0%) | 0 (0.0%) |
| 25 to 34 Years | 16 (29.6%) | 0 (0.0%) |
| 35 to 44 Years | 5 (100.0%) | 21 (100.0%) |
| 45 to 54 Years | 10 (45.5%) | 0 (0.0%) |
| 55 to 64 Years | 2 (100.0%) | 19 (100.0%) |
| 65 to 74 Years | 23 (100.0%) | 0 (0.0%) |
| 75 Years and over | 0 (0.0%) | 0 (0.0%) |
| Total | 112 (64.0%) | 69 (93.2%) |
Income Below Poverty Among Married-Couple Families in Kirkwood
The poverty statistics for married-couple families in Kirkwood show that 13.2% or 5 of the total 38 families live below the poverty line. Families with no children have the highest poverty rate of 29.4%, comprising of 5 families. On the other hand, families with 1 or 2 children have the lowest poverty rate of 0.0%, which includes 0 families.
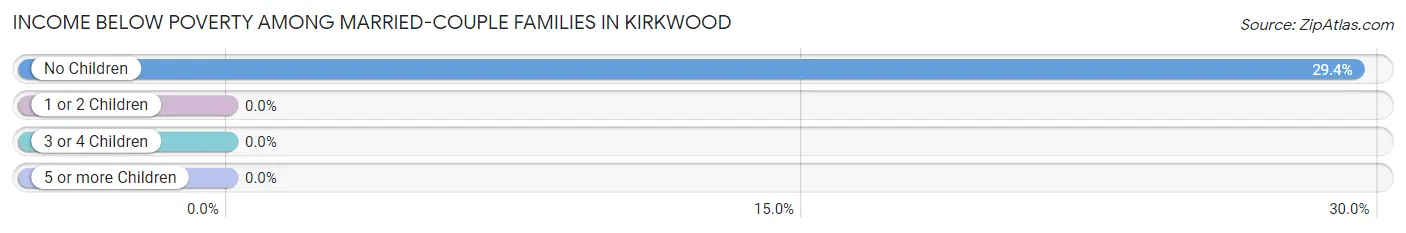
| Children | Above Poverty | Below Poverty |
| No Children | 12 (70.6%) | 5 (29.4%) |
| 1 or 2 Children | 21 (100.0%) | 0 (0.0%) |
| 3 or 4 Children | 0 (0.0%) | 0 (0.0%) |
| 5 or more Children | 0 (0.0%) | 0 (0.0%) |
| Total | 33 (86.8%) | 5 (13.2%) |
Income Below Poverty Among Single-Parent Households in Kirkwood
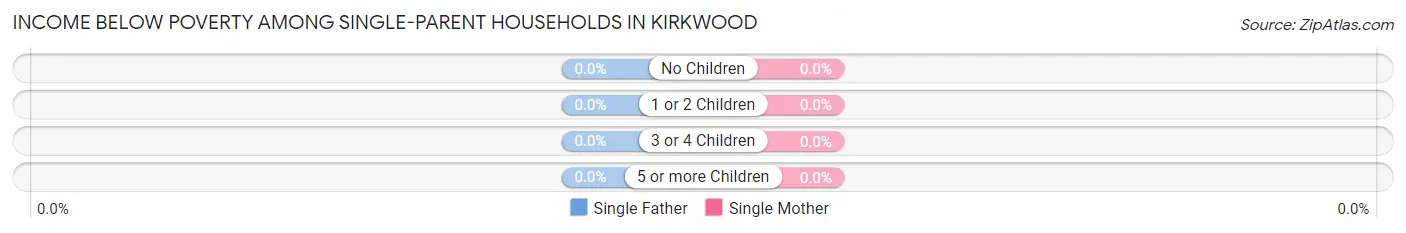
| Children | Single Father | Single Mother |
| No Children | 0 (0.0%) | 0 (0.0%) |
| 1 or 2 Children | 0 (0.0%) | 0 (0.0%) |
| 3 or 4 Children | 0 (0.0%) | 0 (0.0%) |
| 5 or more Children | 0 (0.0%) | 0 (0.0%) |
| Total | 0 (0.0%) | 0 (0.0%) |
Income Below Poverty Among Married-Couple vs Single-Parent Households in Kirkwood
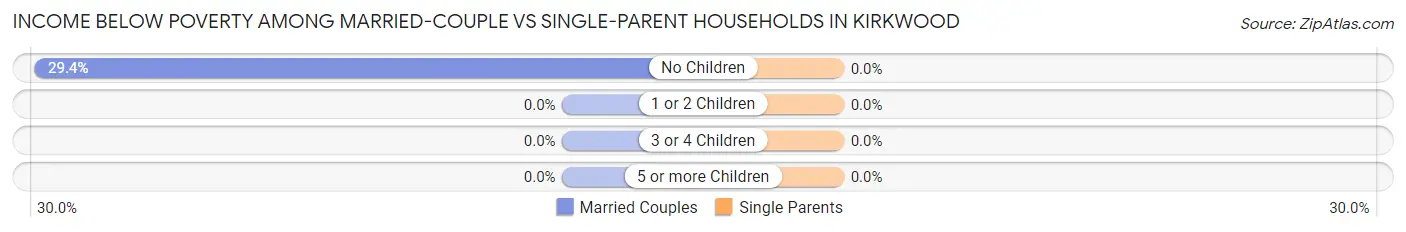
| Children | Married-Couple Families | Single-Parent Households |
| No Children | 5 (29.4%) | 0 (0.0%) |
| 1 or 2 Children | 0 (0.0%) | 0 (0.0%) |
| 3 or 4 Children | 0 (0.0%) | 0 (0.0%) |
| 5 or more Children | 0 (0.0%) | 0 (0.0%) |
| Total | 5 (13.2%) | 0 (0.0%) |
Race in Kirkwood
The most populous races in Kirkwood are White / Caucasian (182 | 73.1%), Hispanic or Latino (103 | 41.4%), and Two or more Races (55 | 22.1%).
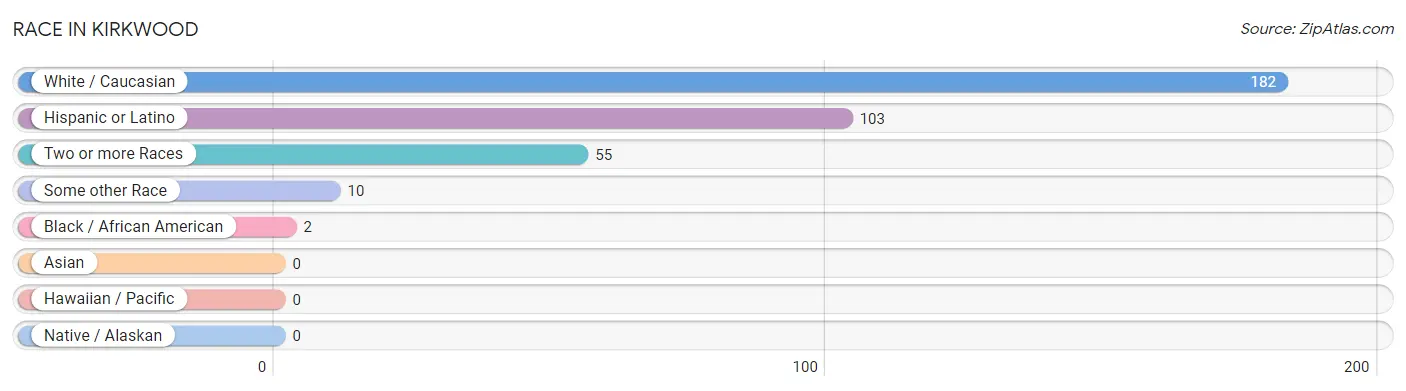
| Race | # Population | % Population |
| Asian | 0 | 0.0% |
| Black / African American | 2 | 0.8% |
| Hawaiian / Pacific | 0 | 0.0% |
| Hispanic or Latino | 103 | 41.4% |
| Native / Alaskan | 0 | 0.0% |
| White / Caucasian | 182 | 73.1% |
| Two or more Races | 55 | 22.1% |
| Some other Race | 10 | 4.0% |
| Total | 249 | 100.0% |
Ancestry in Kirkwood
The most populous ancestries reported in Kirkwood are English (90 | 36.1%), Mexican (56 | 22.5%), South American (47 | 18.9%), Colombian (37 | 14.9%), and German (24 | 9.6%), together accounting for 102.0% of all Kirkwood residents.
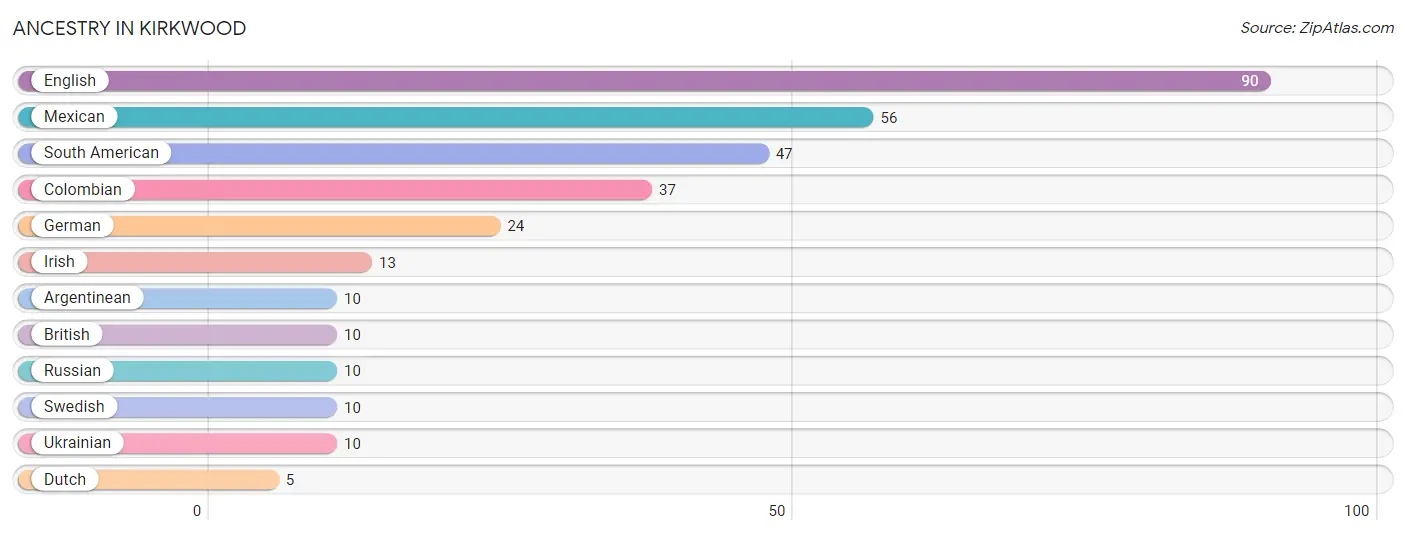
| Ancestry | # Population | % Population |
| Argentinean | 10 | 4.0% |
| British | 10 | 4.0% |
| Colombian | 37 | 14.9% |
| Dutch | 5 | 2.0% |
| English | 90 | 36.1% |
| German | 24 | 9.6% |
| Irish | 13 | 5.2% |
| Mexican | 56 | 22.5% |
| Russian | 10 | 4.0% |
| South American | 47 | 18.9% |
| Swedish | 10 | 4.0% |
| Ukrainian | 10 | 4.0% | View All 12 Rows |
Immigrants in Kirkwood
The most numerous immigrant groups reported in Kirkwood came from Latin America (28 | 11.2%), Central America (18 | 7.2%), Mexico (18 | 7.2%), Colombia (10 | 4.0%), and South America (10 | 4.0%), together accounting for 33.7% of all Kirkwood residents.
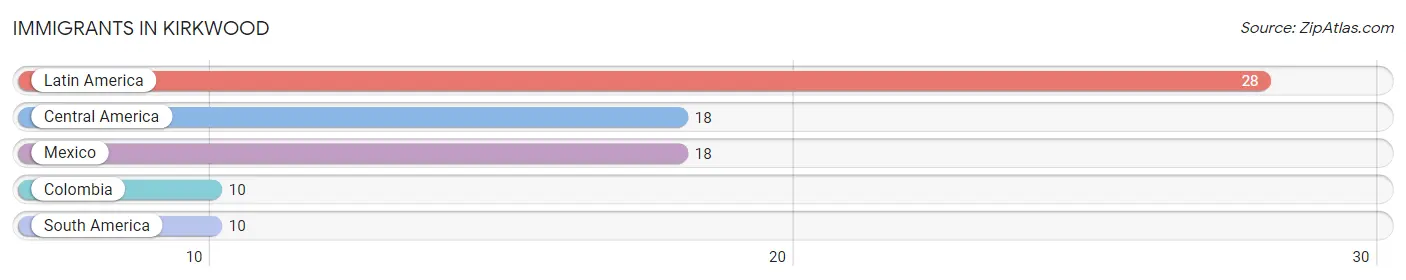
| Immigration Origin | # Population | % Population |
| Central America | 18 | 7.2% |
| Colombia | 10 | 4.0% |
| Latin America | 28 | 11.2% |
| Mexico | 18 | 7.2% |
| South America | 10 | 4.0% | View All 5 Rows |
Sex and Age in Kirkwood
Sex and Age in Kirkwood
The most populous age groups in Kirkwood are 25 to 29 Years (50 | 28.6%) for men and Under 5 Years (29 | 39.2%) for women.
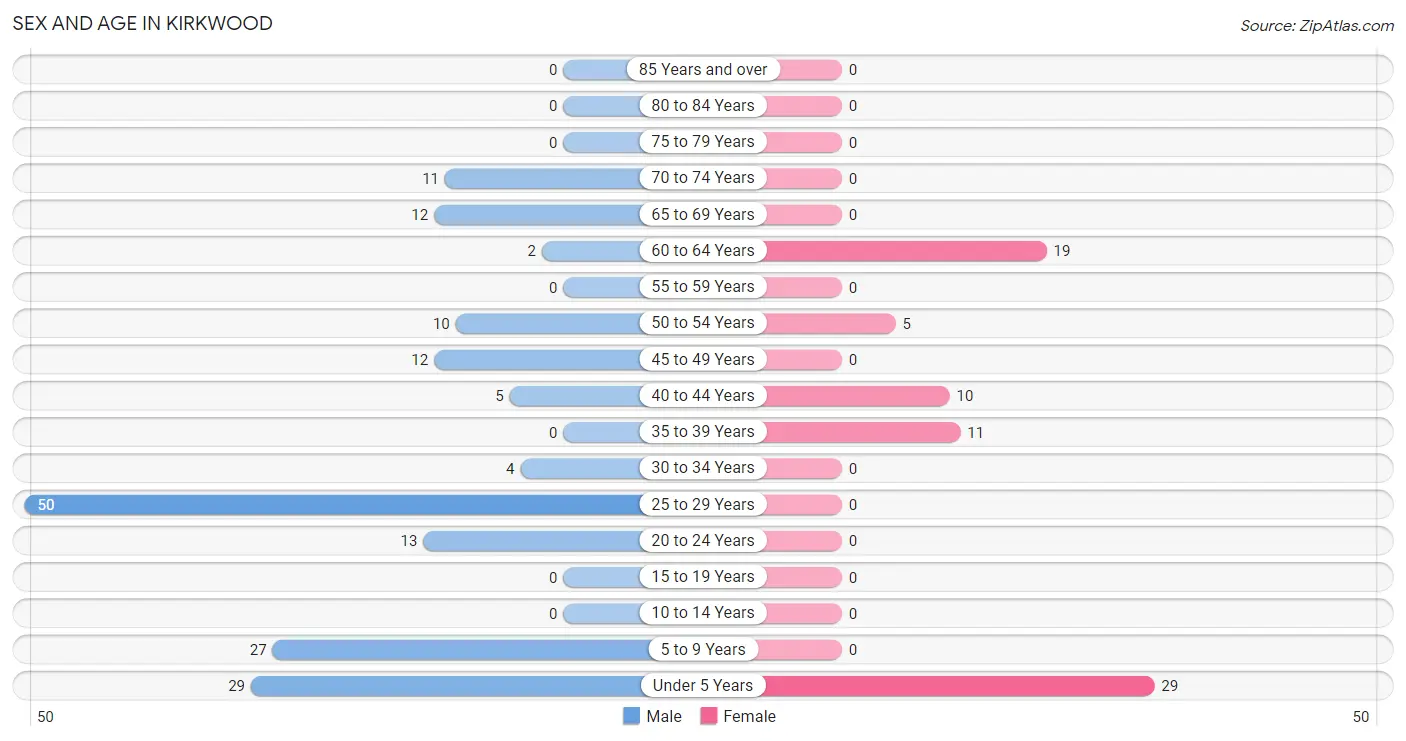
| Age Bracket | Male | Female |
| Under 5 Years | 29 (16.6%) | 29 (39.2%) |
| 5 to 9 Years | 27 (15.4%) | 0 (0.0%) |
| 10 to 14 Years | 0 (0.0%) | 0 (0.0%) |
| 15 to 19 Years | 0 (0.0%) | 0 (0.0%) |
| 20 to 24 Years | 13 (7.4%) | 0 (0.0%) |
| 25 to 29 Years | 50 (28.6%) | 0 (0.0%) |
| 30 to 34 Years | 4 (2.3%) | 0 (0.0%) |
| 35 to 39 Years | 0 (0.0%) | 11 (14.9%) |
| 40 to 44 Years | 5 (2.9%) | 10 (13.5%) |
| 45 to 49 Years | 12 (6.9%) | 0 (0.0%) |
| 50 to 54 Years | 10 (5.7%) | 5 (6.8%) |
| 55 to 59 Years | 0 (0.0%) | 0 (0.0%) |
| 60 to 64 Years | 2 (1.1%) | 19 (25.7%) |
| 65 to 69 Years | 12 (6.9%) | 0 (0.0%) |
| 70 to 74 Years | 11 (6.3%) | 0 (0.0%) |
| 75 to 79 Years | 0 (0.0%) | 0 (0.0%) |
| 80 to 84 Years | 0 (0.0%) | 0 (0.0%) |
| 85 Years and over | 0 (0.0%) | 0 (0.0%) |
| Total | 175 (100.0%) | 74 (100.0%) |
Families and Households in Kirkwood
Median Family Size in Kirkwood
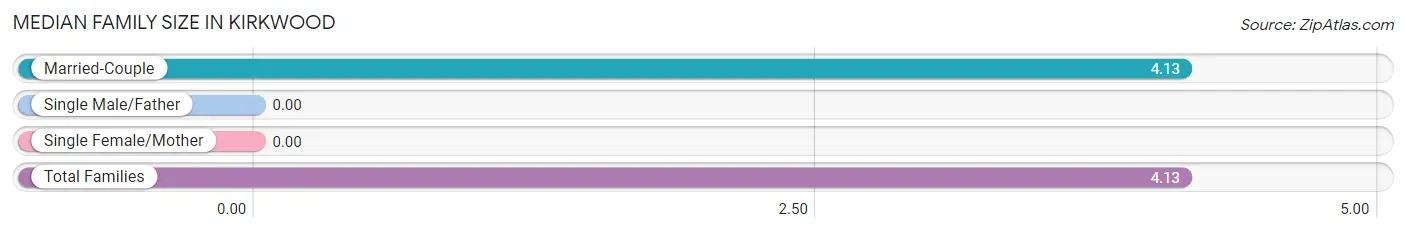
| Family Type | # Families | Family Size |
| Married-Couple | 38 (100.0%) | 4.13 |
| Single Male/Father | 0 (0.0%) | - |
| Single Female/Mother | 0 (0.0%) | - |
| Total Families | 38 (100.0%) | 4.13 |
Median Household Size in Kirkwood
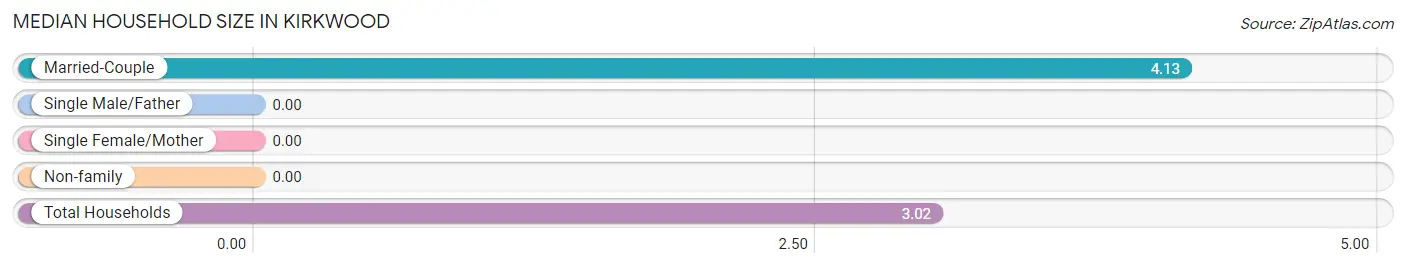
| Household Type | # Households | Household Size |
| Married-Couple | 38 (64.4%) | 4.13 |
| Single Male/Father | 0 (0.0%) | - |
| Single Female/Mother | 0 (0.0%) | - |
| Non-family | 21 (35.6%) | - |
| Total Households | 59 (100.0%) | 3.02 |
Household Size by Marriage Status in Kirkwood
Out of a total of 59 households in Kirkwood, 38 (64.4%) are family households, while 21 (35.6%) are nonfamily households. The most numerous type of family households are 2-person households, comprising 17, and the most common type of nonfamily households are 1-person households, comprising 21.
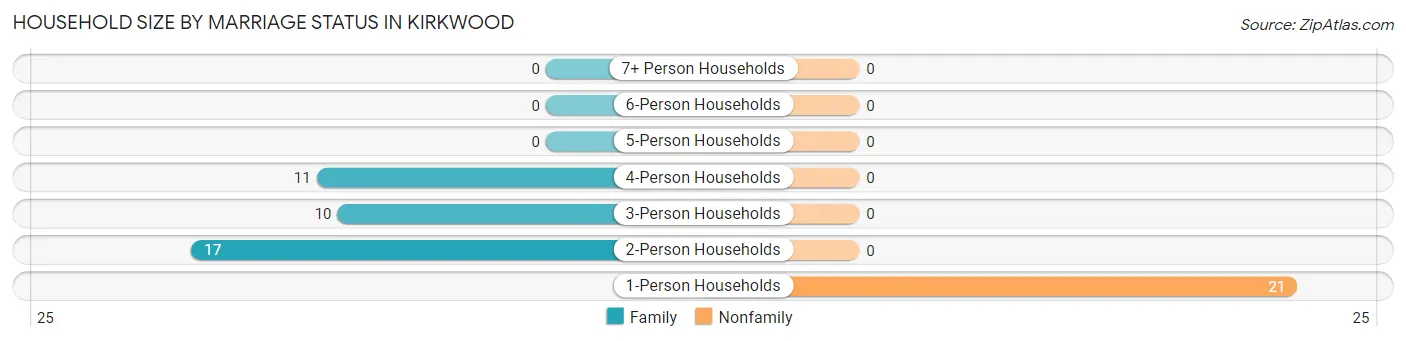
| Household Size | Family Households | Nonfamily Households |
| 1-Person Households | - | 21 (35.6%) |
| 2-Person Households | 17 (28.8%) | 0 (0.0%) |
| 3-Person Households | 10 (17.0%) | 0 (0.0%) |
| 4-Person Households | 11 (18.6%) | 0 (0.0%) |
| 5-Person Households | 0 (0.0%) | 0 (0.0%) |
| 6-Person Households | 0 (0.0%) | 0 (0.0%) |
| 7+ Person Households | 0 (0.0%) | 0 (0.0%) |
| Total | 38 (64.4%) | 21 (35.6%) |
Female Fertility in Kirkwood
Fertility by Age in Kirkwood
Average fertility rate in Kirkwood is 524.0 births per 1,000 women. Women in the age bracket of 35 to 50 years have the highest fertility rate with 524.0 births per 1,000 women. Women in the age bracket of 35 to 50 years acount for 100.0% of all women with births.
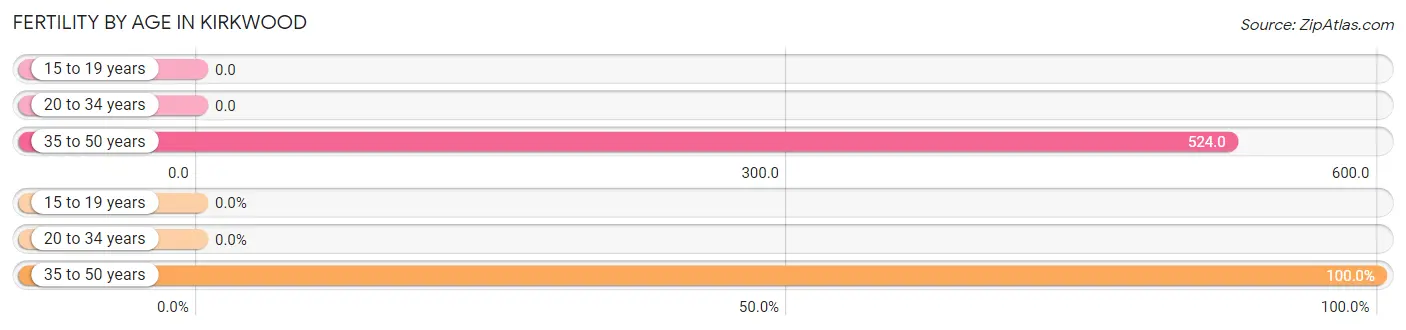
| Age Bracket | Women with Births | Births / 1,000 Women |
| 15 to 19 years | 0 (0.0%) | 0.0 |
| 20 to 34 years | 0 (0.0%) | 0.0 |
| 35 to 50 years | 11 (100.0%) | 524.0 |
| Total | 11 (100.0%) | 524.0 |
Fertility by Age by Marriage Status in Kirkwood
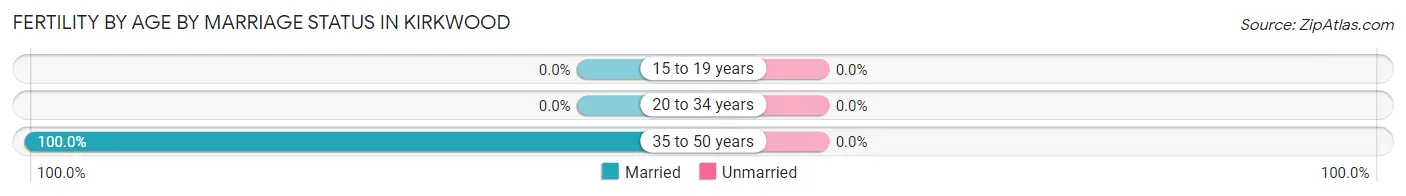
| Age Bracket | Married | Unmarried |
| 15 to 19 years | 0 (0.0%) | 0 (0.0%) |
| 20 to 34 years | 0 (0.0%) | 0 (0.0%) |
| 35 to 50 years | 11 (100.0%) | 0 (0.0%) |
| Total | 11 (100.0%) | 0 (0.0%) |
Fertility by Education in Kirkwood
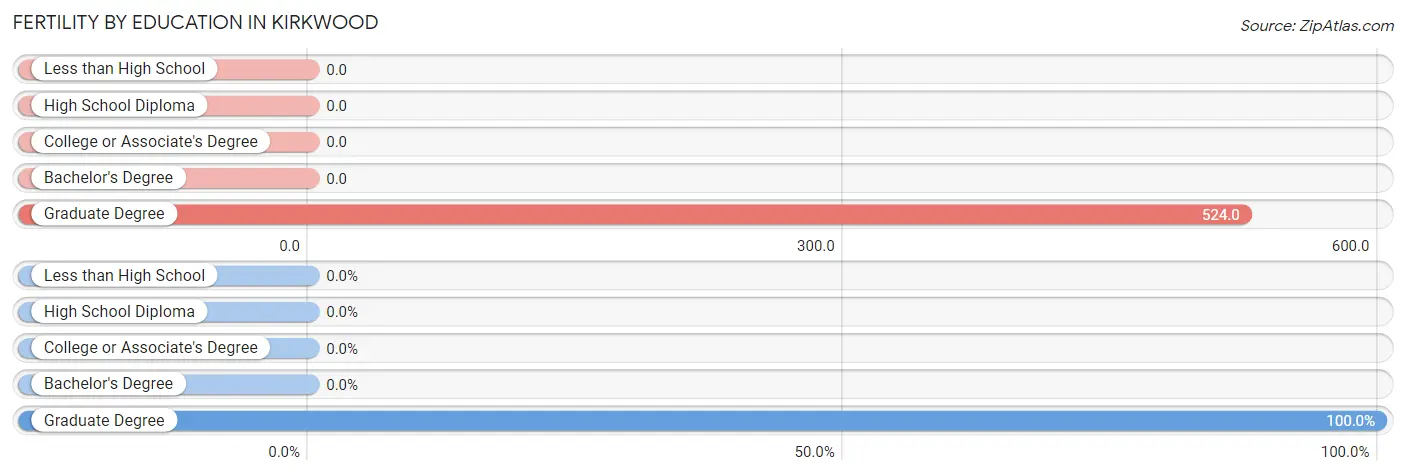
| Educational Attainment | Women with Births | Births / 1,000 Women |
| Less than High School | 0 (0.0%) | 0.0 |
| High School Diploma | 0 (0.0%) | 0.0 |
| College or Associate's Degree | 0 (0.0%) | 0.0 |
| Bachelor's Degree | 0 (0.0%) | 0.0 |
| Graduate Degree | 11 (100.0%) | 524.0 |
| Total | 11 (100.0%) | 524.0 |
Fertility by Education by Marriage Status in Kirkwood
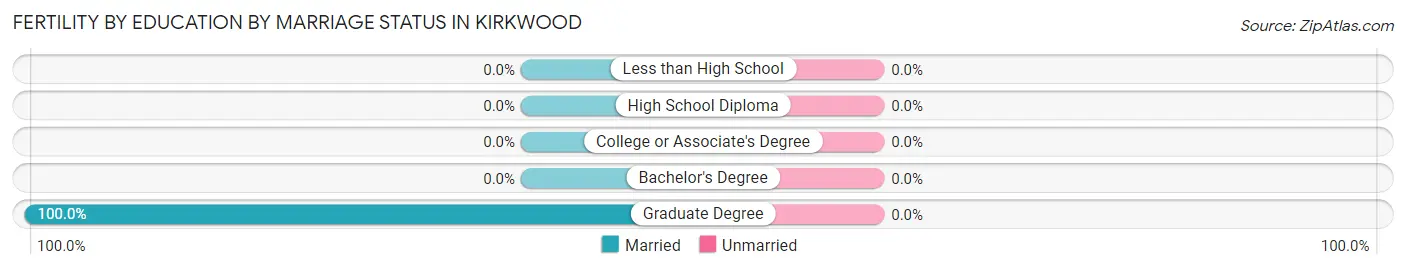
| Educational Attainment | Married | Unmarried |
| Less than High School | 0 (0.0%) | 0 (0.0%) |
| High School Diploma | 0 (0.0%) | 0 (0.0%) |
| College or Associate's Degree | 0 (0.0%) | 0 (0.0%) |
| Bachelor's Degree | 0 (0.0%) | 0 (0.0%) |
| Graduate Degree | 11 (100.0%) | 0 (0.0%) |
| Total | 11 (100.0%) | 0 (0.0%) |
Employment Characteristics in Kirkwood
Employment by Class of Employer in Kirkwood
Among the 102 employed individuals in Kirkwood, not-for-profit organizations (27 | 26.5%), local government employees (26 | 25.5%), and private company employees (18 | 17.6%) make up the most common classes of employment.
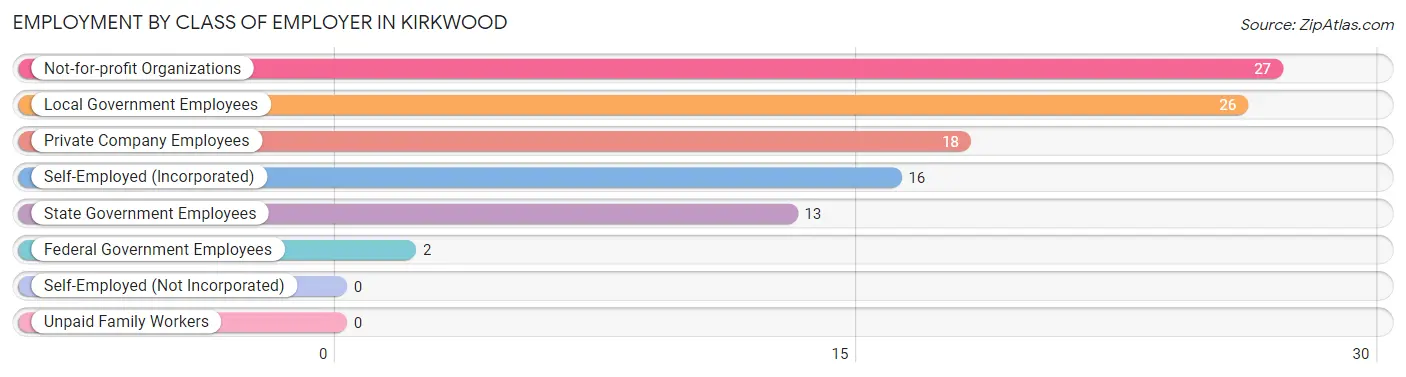
| Employer Class | # Employees | % Employees |
| Private Company Employees | 18 | 17.6% |
| Self-Employed (Incorporated) | 16 | 15.7% |
| Self-Employed (Not Incorporated) | 0 | 0.0% |
| Not-for-profit Organizations | 27 | 26.5% |
| Local Government Employees | 26 | 25.5% |
| State Government Employees | 13 | 12.8% |
| Federal Government Employees | 2 | 2.0% |
| Unpaid Family Workers | 0 | 0.0% |
| Total | 102 | 100.0% |
Employment Status by Age in Kirkwood
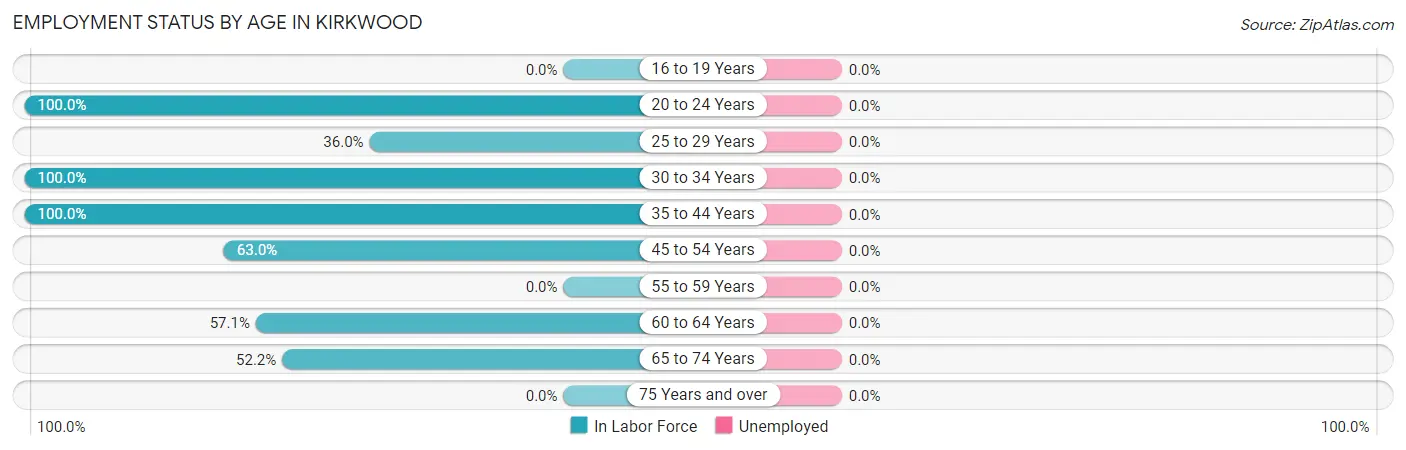
| Age Bracket | In Labor Force | Unemployed |
| 16 to 19 Years | 0 (0.0%) | 0 (0.0%) |
| 20 to 24 Years | 13 (100.0%) | 0 (0.0%) |
| 25 to 29 Years | 18 (36.0%) | 0 (0.0%) |
| 30 to 34 Years | 4 (100.0%) | 0 (0.0%) |
| 35 to 44 Years | 26 (100.0%) | 0 (0.0%) |
| 45 to 54 Years | 17 (63.0%) | 0 (0.0%) |
| 55 to 59 Years | 0 (0.0%) | 0 (0.0%) |
| 60 to 64 Years | 12 (57.1%) | 0 (0.0%) |
| 65 to 74 Years | 12 (52.2%) | 0 (0.0%) |
| 75 Years and over | 0 (0.0%) | 0 (0.0%) |
| Total | 102 (62.2%) | 0 (0.0%) |
Employment Status by Educational Attainment in Kirkwood
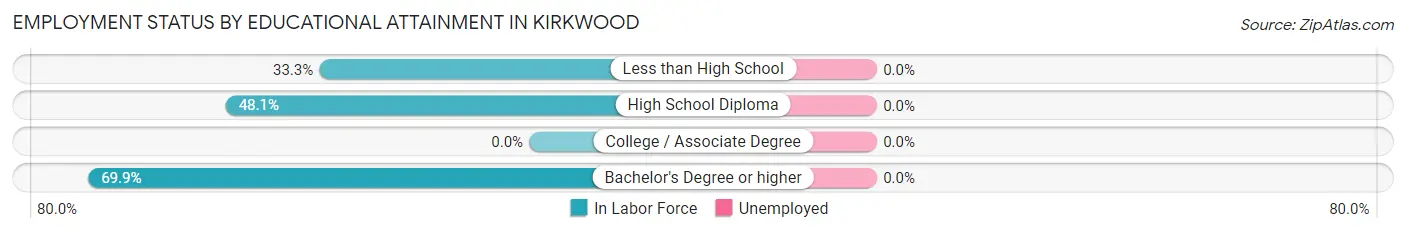
| Educational Attainment | In Labor Force | Unemployed |
| Less than High School | 6 (33.3%) | 0 (0.0%) |
| High School Diploma | 13 (48.1%) | 0 (0.0%) |
| College / Associate Degree | 0 (0.0%) | 0 (0.0%) |
| Bachelor's Degree or higher | 58 (69.9%) | 0 (0.0%) |
| Total | 77 (60.2%) | 0 (0.0%) |
Employment Occupations by Sex in Kirkwood
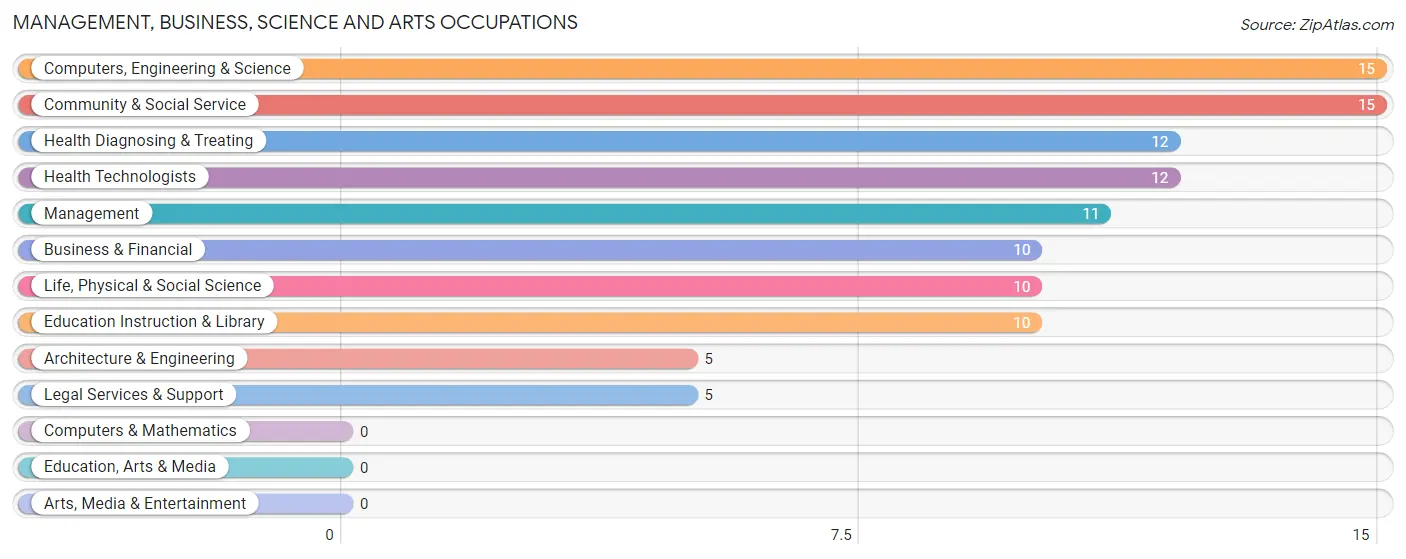
Management, Business, Science and Arts Occupations
The most common Management, Business, Science and Arts occupations in Kirkwood are Computers, Engineering & Science (15 | 14.7%), Community & Social Service (15 | 14.7%), Health Diagnosing & Treating (12 | 11.8%), Health Technologists (12 | 11.8%), and Management (11 | 10.8%).
Management, Business, Science and Arts Occupations by Sex
Within the Management, Business, Science and Arts occupations in Kirkwood, the most male-oriented occupations are Architecture & Engineering (100.0%), Education Instruction & Library (100.0%), and Health Diagnosing & Treating (100.0%), while the most female-oriented occupations are Management (100.0%), Business & Financial (100.0%), and Life, Physical & Social Science (100.0%).
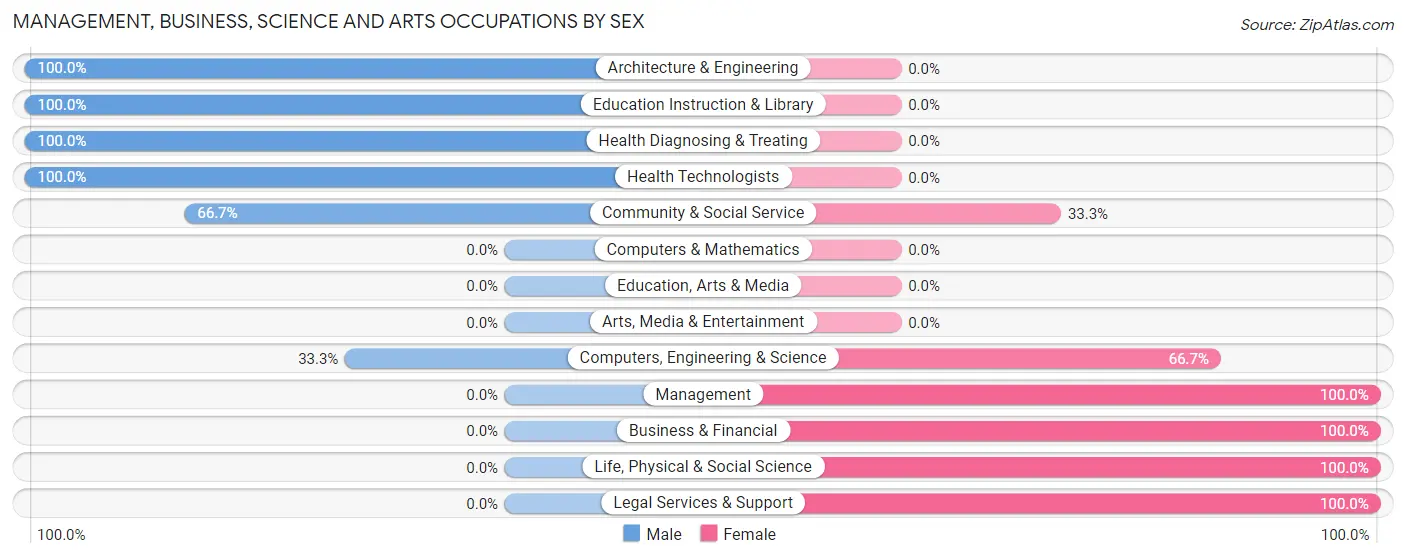
| Occupation | Male | Female |
| Management | 0 (0.0%) | 11 (100.0%) |
| Business & Financial | 0 (0.0%) | 10 (100.0%) |
| Computers, Engineering & Science | 5 (33.3%) | 10 (66.7%) |
| Computers & Mathematics | 0 (0.0%) | 0 (0.0%) |
| Architecture & Engineering | 5 (100.0%) | 0 (0.0%) |
| Life, Physical & Social Science | 0 (0.0%) | 10 (100.0%) |
| Community & Social Service | 10 (66.7%) | 5 (33.3%) |
| Education, Arts & Media | 0 (0.0%) | 0 (0.0%) |
| Legal Services & Support | 0 (0.0%) | 5 (100.0%) |
| Education Instruction & Library | 10 (100.0%) | 0 (0.0%) |
| Arts, Media & Entertainment | 0 (0.0%) | 0 (0.0%) |
| Health Diagnosing & Treating | 12 (100.0%) | 0 (0.0%) |
| Health Technologists | 12 (100.0%) | 0 (0.0%) |
| Total (Category) | 27 (42.9%) | 36 (57.1%) |
| Total (Overall) | 66 (64.7%) | 36 (35.3%) |
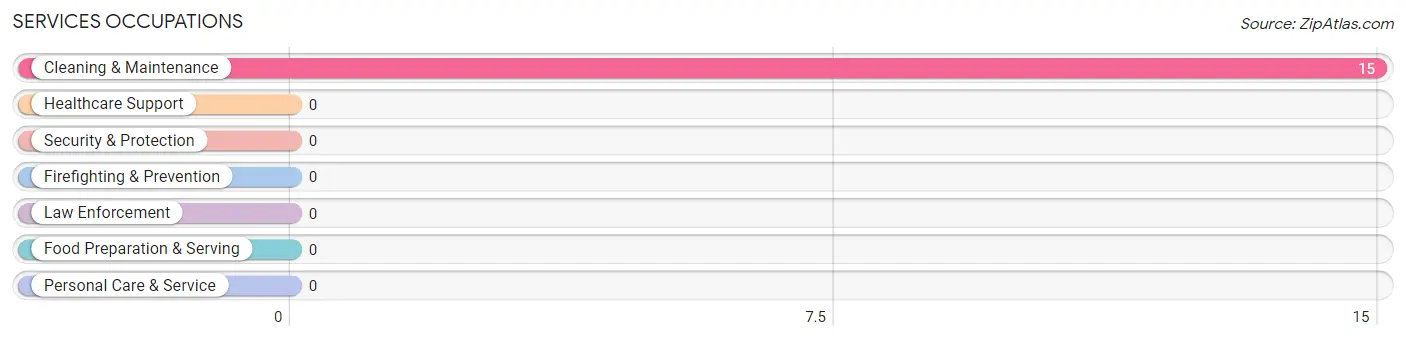
Services Occupations
The most common Services occupations in Kirkwood are , and Cleaning & Maintenance (15 | 14.7%).
Services Occupations by Sex
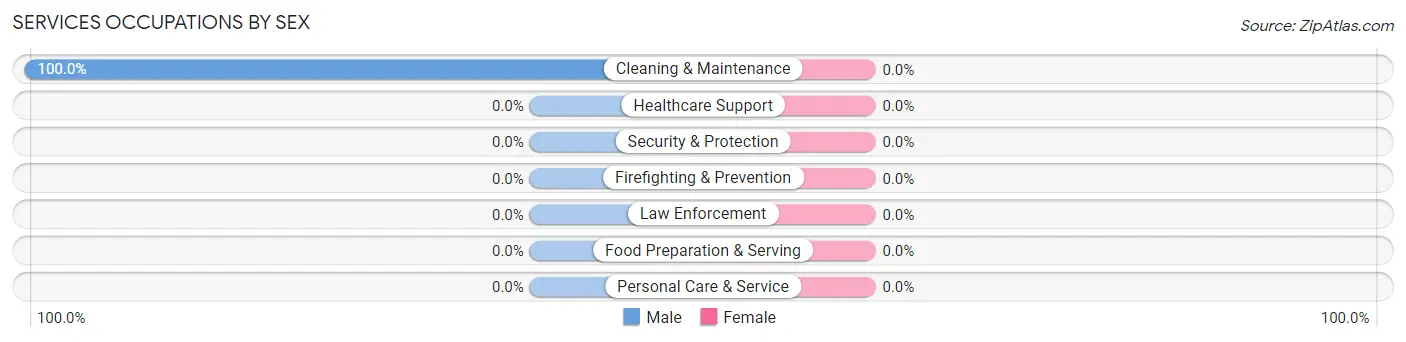
| Occupation | Male | Female |
| Healthcare Support | 0 (0.0%) | 0 (0.0%) |
| Security & Protection | 0 (0.0%) | 0 (0.0%) |
| Firefighting & Prevention | 0 (0.0%) | 0 (0.0%) |
| Law Enforcement | 0 (0.0%) | 0 (0.0%) |
| Food Preparation & Serving | 0 (0.0%) | 0 (0.0%) |
| Cleaning & Maintenance | 15 (100.0%) | 0 (0.0%) |
| Personal Care & Service | 0 (0.0%) | 0 (0.0%) |
| Total (Category) | 15 (100.0%) | 0 (0.0%) |
| Total (Overall) | 66 (64.7%) | 36 (35.3%) |
Sales and Office Occupations
The most common Sales and Office occupations in Kirkwood are , and Office & Administration (12 | 11.8%).
Sales and Office Occupations by Sex
| Occupation | Male | Female |
| Sales & Related | 0 (0.0%) | 0 (0.0%) |
| Office & Administration | 12 (100.0%) | 0 (0.0%) |
| Total (Category) | 12 (100.0%) | 0 (0.0%) |
| Total (Overall) | 66 (64.7%) | 36 (35.3%) |
Natural Resources, Construction and Maintenance Occupations
The most common Natural Resources, Construction and Maintenance occupations in Kirkwood are Farming, Fishing & Forestry (4 | 3.9%), and Construction & Extraction (2 | 2.0%).
Natural Resources, Construction and Maintenance Occupations by Sex
| Occupation | Male | Female |
| Farming, Fishing & Forestry | 4 (100.0%) | 0 (0.0%) |
| Construction & Extraction | 2 (100.0%) | 0 (0.0%) |
| Installation, Maintenance & Repair | 0 (0.0%) | 0 (0.0%) |
| Total (Category) | 6 (100.0%) | 0 (0.0%) |
| Total (Overall) | 66 (64.7%) | 36 (35.3%) |
Production, Transportation and Moving Occupations
The most common Production, Transportation and Moving occupations in Kirkwood are , and Production (6 | 5.9%).
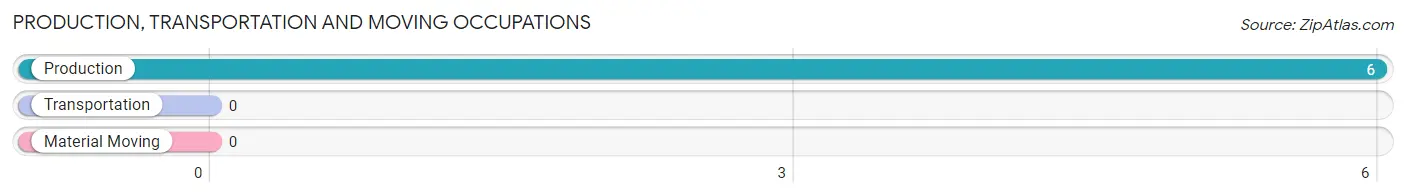
Production, Transportation and Moving Occupations by Sex
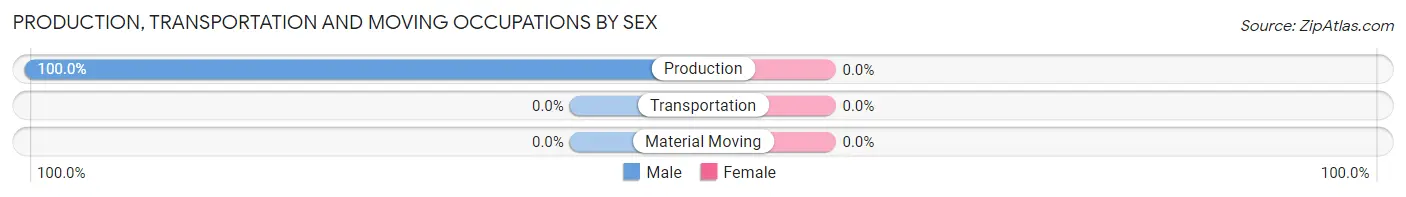
| Occupation | Male | Female |
| Production | 6 (100.0%) | 0 (0.0%) |
| Transportation | 0 (0.0%) | 0 (0.0%) |
| Material Moving | 0 (0.0%) | 0 (0.0%) |
| Total (Category) | 6 (100.0%) | 0 (0.0%) |
| Total (Overall) | 66 (64.7%) | 36 (35.3%) |
Employment Industries by Sex in Kirkwood
Employment Industries in Kirkwood
The major employment industries in Kirkwood include Health Care & Social Assistance (27 | 26.5%), Utilities (16 | 15.7%), Professional & Scientific (15 | 14.7%), Retail Trade (12 | 11.8%), and Educational Services (10 | 9.8%).
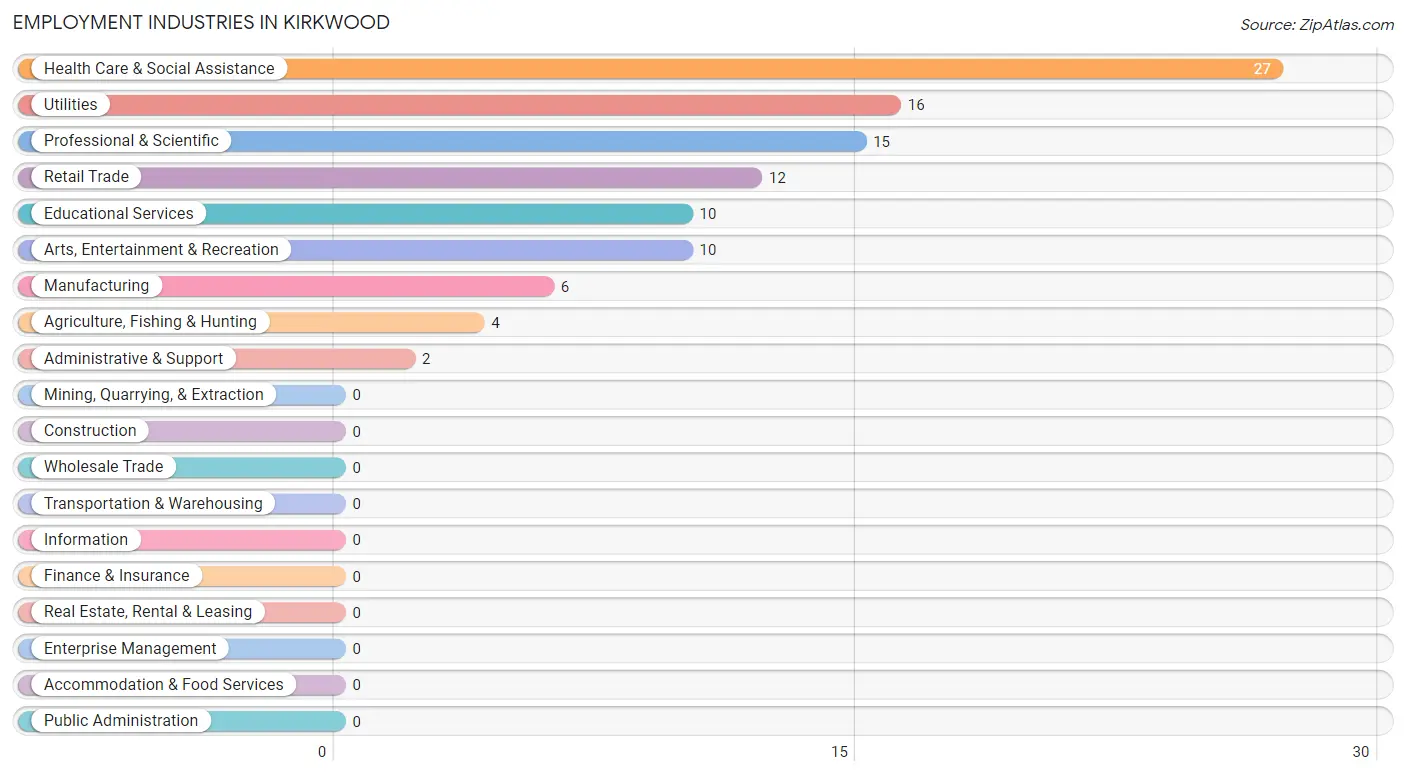
Employment Industries by Sex in Kirkwood
The Kirkwood industries that see more men than women are Agriculture, Fishing & Hunting (100.0%), Manufacturing (100.0%), and Retail Trade (100.0%), whereas the industries that tend to have a higher number of women are Professional & Scientific (100.0%), Arts, Entertainment & Recreation (100.0%), and Utilities (68.8%).
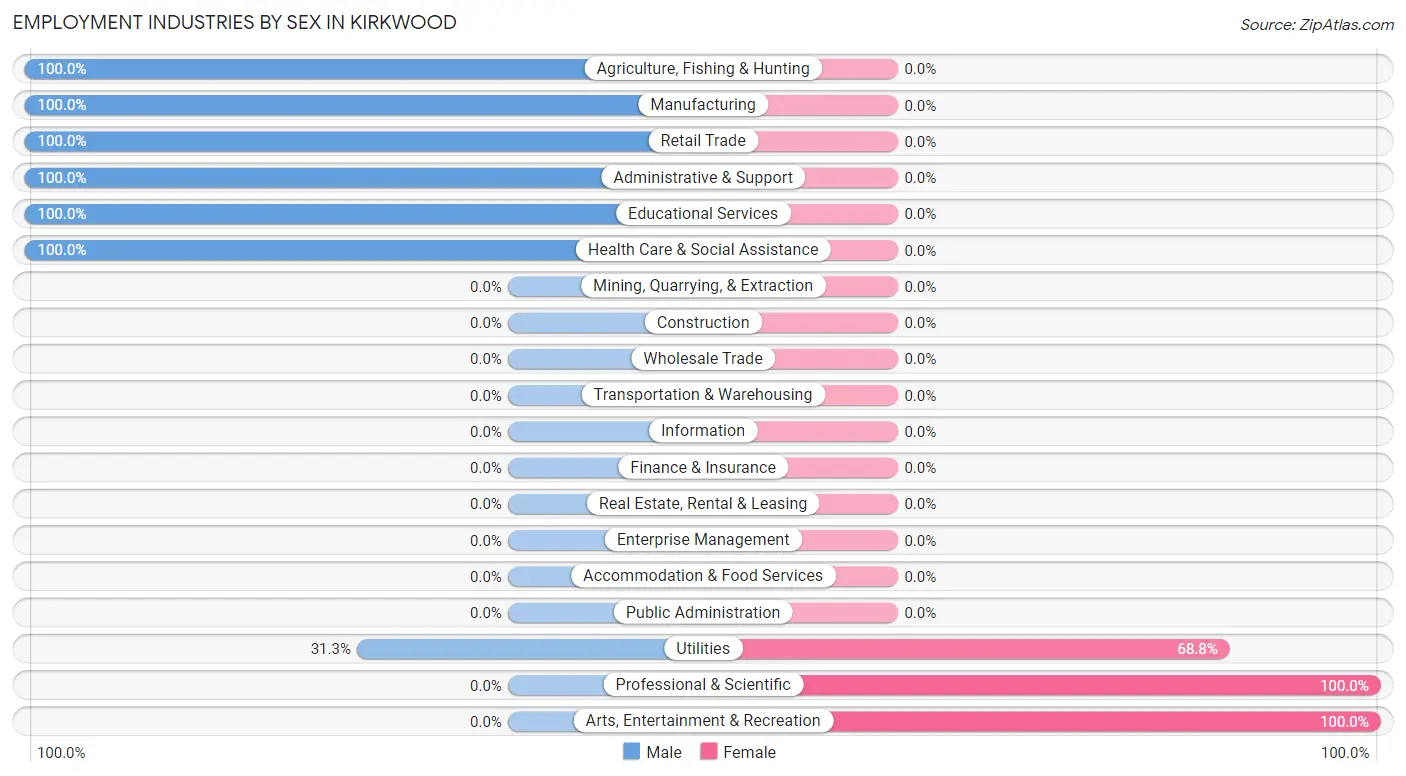
| Industry | Male | Female |
| Agriculture, Fishing & Hunting | 4 (100.0%) | 0 (0.0%) |
| Mining, Quarrying, & Extraction | 0 (0.0%) | 0 (0.0%) |
| Construction | 0 (0.0%) | 0 (0.0%) |
| Manufacturing | 6 (100.0%) | 0 (0.0%) |
| Wholesale Trade | 0 (0.0%) | 0 (0.0%) |
| Retail Trade | 12 (100.0%) | 0 (0.0%) |
| Transportation & Warehousing | 0 (0.0%) | 0 (0.0%) |
| Utilities | 5 (31.2%) | 11 (68.8%) |
| Information | 0 (0.0%) | 0 (0.0%) |
| Finance & Insurance | 0 (0.0%) | 0 (0.0%) |
| Real Estate, Rental & Leasing | 0 (0.0%) | 0 (0.0%) |
| Professional & Scientific | 0 (0.0%) | 15 (100.0%) |
| Enterprise Management | 0 (0.0%) | 0 (0.0%) |
| Administrative & Support | 2 (100.0%) | 0 (0.0%) |
| Educational Services | 10 (100.0%) | 0 (0.0%) |
| Health Care & Social Assistance | 27 (100.0%) | 0 (0.0%) |
| Arts, Entertainment & Recreation | 0 (0.0%) | 10 (100.0%) |
| Accommodation & Food Services | 0 (0.0%) | 0 (0.0%) |
| Public Administration | 0 (0.0%) | 0 (0.0%) |
| Total | 66 (64.7%) | 36 (35.3%) |
Education in Kirkwood
School Enrollment in Kirkwood
The most common levels of schooling among the 82 students in Kirkwood are nursery / preschool (29 | 35.4%), elementary school (27 | 32.9%), and college / undergraduate (14 | 17.1%).
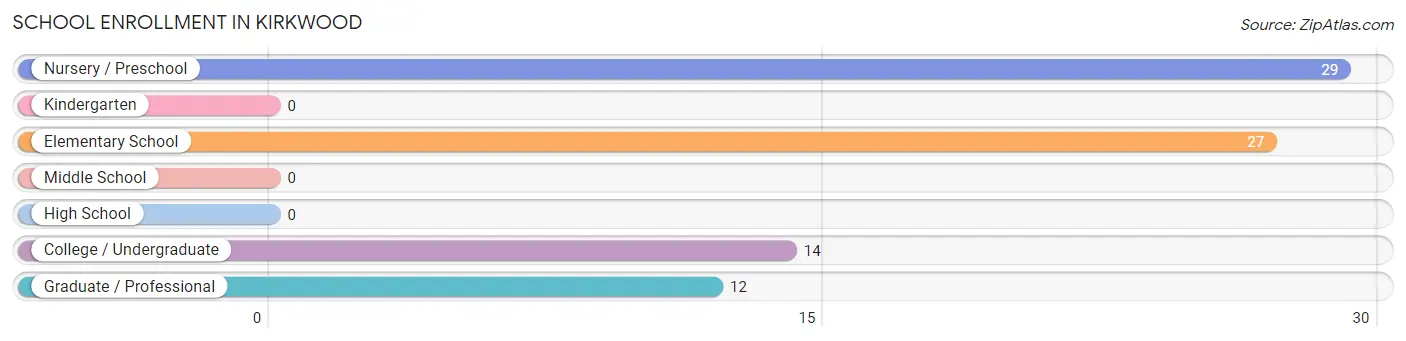
| School Level | # Students | % Students |
| Nursery / Preschool | 29 | 35.4% |
| Kindergarten | 0 | 0.0% |
| Elementary School | 27 | 32.9% |
| Middle School | 0 | 0.0% |
| High School | 0 | 0.0% |
| College / Undergraduate | 14 | 17.1% |
| Graduate / Professional | 12 | 14.6% |
| Total | 82 | 100.0% |
School Enrollment by Age by Funding Source in Kirkwood
Out of a total of 82 students who are enrolled in schools in Kirkwood, 14 (17.1%) attend a private institution, while the remaining 68 (82.9%) are enrolled in public schools. The age group of 25 to 34 year olds has the highest likelihood of being enrolled in private schools, with 14 (53.8% in the age bracket) enrolled. Conversely, the age group of 3 to 4 year olds has the lowest likelihood of being enrolled in a private school, with 29 (100.0% in the age bracket) attending a public institution.
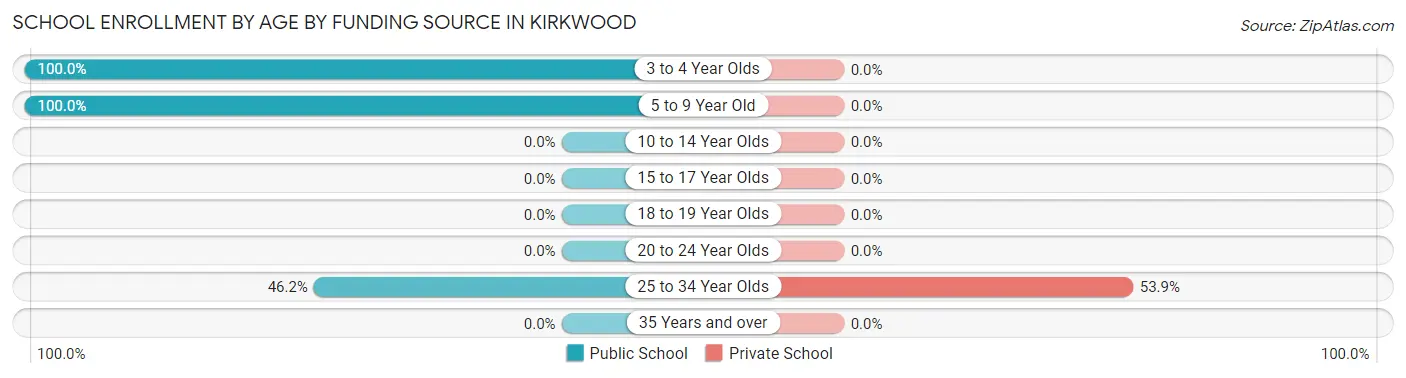
| Age Bracket | Public School | Private School |
| 3 to 4 Year Olds | 29 (100.0%) | 0 (0.0%) |
| 5 to 9 Year Old | 27 (100.0%) | 0 (0.0%) |
| 10 to 14 Year Olds | 0 (0.0%) | 0 (0.0%) |
| 15 to 17 Year Olds | 0 (0.0%) | 0 (0.0%) |
| 18 to 19 Year Olds | 0 (0.0%) | 0 (0.0%) |
| 20 to 24 Year Olds | 0 (0.0%) | 0 (0.0%) |
| 25 to 34 Year Olds | 12 (46.2%) | 14 (53.8%) |
| 35 Years and over | 0 (0.0%) | 0 (0.0%) |
| Total | 68 (82.9%) | 14 (17.1%) |
Educational Attainment by Field of Study in Kirkwood
Business (25 | 19.8%), literature & languages (22 | 17.5%), engineering (17 | 13.5%), arts & humanities (12 | 9.5%), and communications (11 | 8.7%) are the most common fields of study among 126 individuals in Kirkwood who have obtained a bachelor's degree or higher.
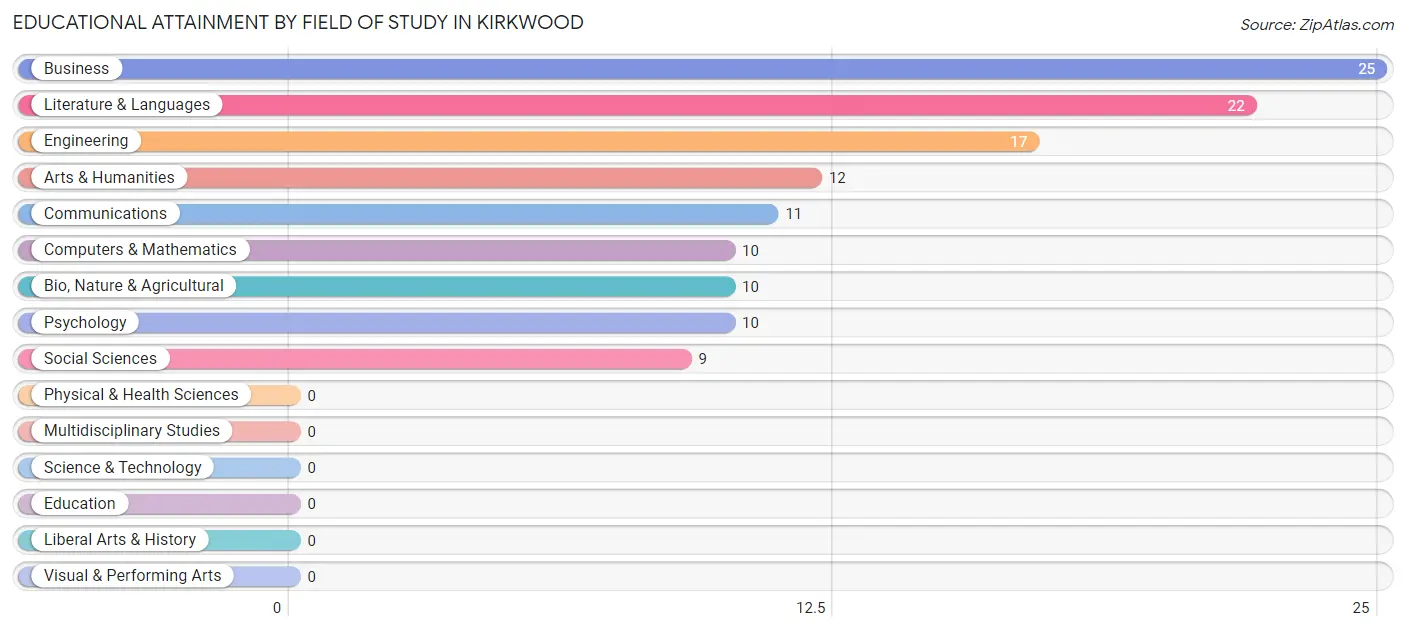
| Field of Study | # Graduates | % Graduates |
| Computers & Mathematics | 10 | 7.9% |
| Bio, Nature & Agricultural | 10 | 7.9% |
| Physical & Health Sciences | 0 | 0.0% |
| Psychology | 10 | 7.9% |
| Social Sciences | 9 | 7.1% |
| Engineering | 17 | 13.5% |
| Multidisciplinary Studies | 0 | 0.0% |
| Science & Technology | 0 | 0.0% |
| Business | 25 | 19.8% |
| Education | 0 | 0.0% |
| Literature & Languages | 22 | 17.5% |
| Liberal Arts & History | 0 | 0.0% |
| Visual & Performing Arts | 0 | 0.0% |
| Communications | 11 | 8.7% |
| Arts & Humanities | 12 | 9.5% |
| Total | 126 | 100.0% |
Transportation & Commute in Kirkwood
Vehicle Availability by Sex in Kirkwood
The most prevalent vehicle ownership categories in Kirkwood are males with 1 vehicle (27, accounting for 100.0%) and females with 1 vehicle (31, making up 75.0%).
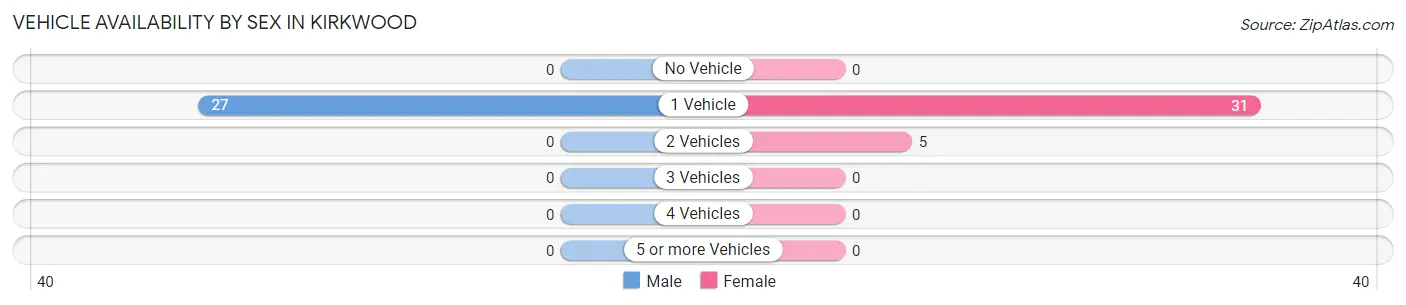
| Vehicles Available | Male | Female |
| No Vehicle | 0 (0.0%) | 0 (0.0%) |
| 1 Vehicle | 27 (100.0%) | 31 (86.1%) |
| 2 Vehicles | 0 (0.0%) | 5 (13.9%) |
| 3 Vehicles | 0 (0.0%) | 0 (0.0%) |
| 4 Vehicles | 0 (0.0%) | 0 (0.0%) |
| 5 or more Vehicles | 0 (0.0%) | 0 (0.0%) |
| Total | 27 (100.0%) | 36 (100.0%) |
Commute Time in Kirkwood
The most frequently occuring commute durations in Kirkwood are 5 to 9 minutes (18 commuters, 36.0%), 30 to 34 minutes (18 commuters, 36.0%), and 15 to 19 minutes (12 commuters, 24.0%).
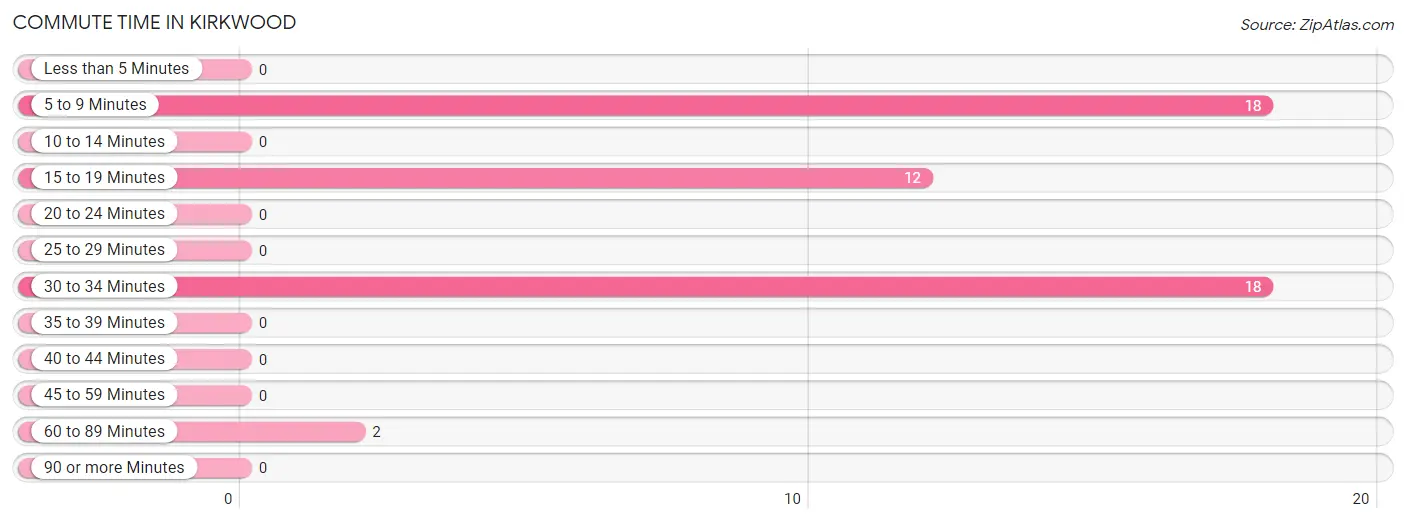
| Commute Time | # Commuters | % Commuters |
| Less than 5 Minutes | 0 | 0.0% |
| 5 to 9 Minutes | 18 | 36.0% |
| 10 to 14 Minutes | 0 | 0.0% |
| 15 to 19 Minutes | 12 | 24.0% |
| 20 to 24 Minutes | 0 | 0.0% |
| 25 to 29 Minutes | 0 | 0.0% |
| 30 to 34 Minutes | 18 | 36.0% |
| 35 to 39 Minutes | 0 | 0.0% |
| 40 to 44 Minutes | 0 | 0.0% |
| 45 to 59 Minutes | 0 | 0.0% |
| 60 to 89 Minutes | 2 | 4.0% |
| 90 or more Minutes | 0 | 0.0% |
Commute Time by Sex in Kirkwood
The most common commute times in Kirkwood are 30 to 34 minutes (18 commuters, 46.2%) for males and 5 to 9 minutes (11 commuters, 100.0%) for females.
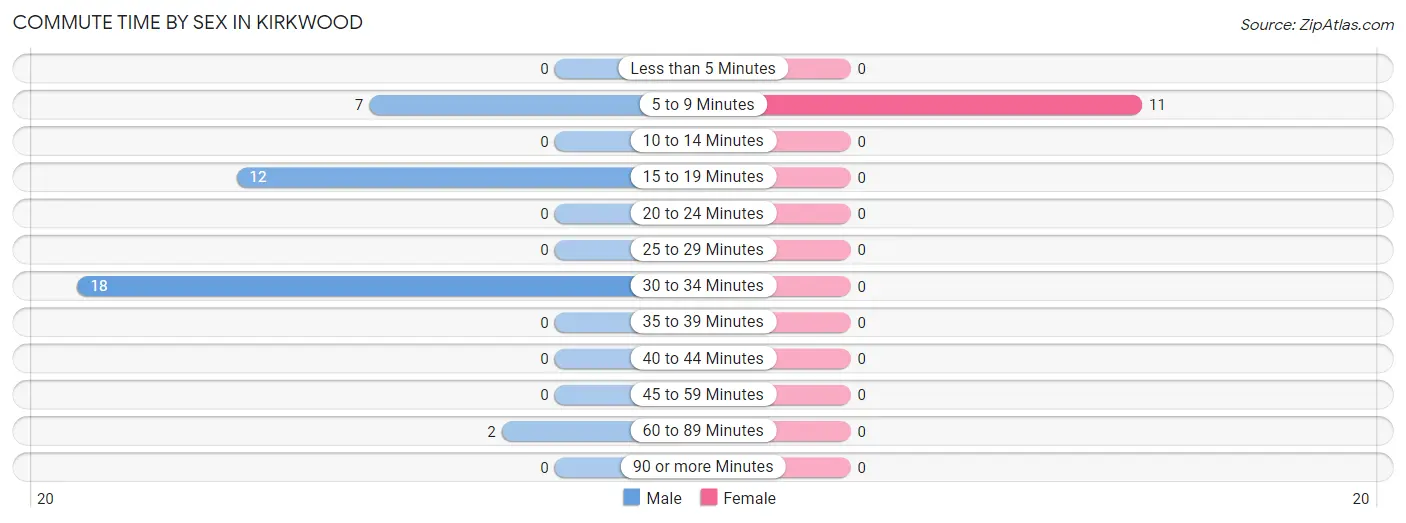
| Commute Time | Male | Female |
| Less than 5 Minutes | 0 (0.0%) | 0 (0.0%) |
| 5 to 9 Minutes | 7 (17.9%) | 11 (100.0%) |
| 10 to 14 Minutes | 0 (0.0%) | 0 (0.0%) |
| 15 to 19 Minutes | 12 (30.8%) | 0 (0.0%) |
| 20 to 24 Minutes | 0 (0.0%) | 0 (0.0%) |
| 25 to 29 Minutes | 0 (0.0%) | 0 (0.0%) |
| 30 to 34 Minutes | 18 (46.2%) | 0 (0.0%) |
| 35 to 39 Minutes | 0 (0.0%) | 0 (0.0%) |
| 40 to 44 Minutes | 0 (0.0%) | 0 (0.0%) |
| 45 to 59 Minutes | 0 (0.0%) | 0 (0.0%) |
| 60 to 89 Minutes | 2 (5.1%) | 0 (0.0%) |
| 90 or more Minutes | 0 (0.0%) | 0 (0.0%) |
Time of Departure to Work by Sex in Kirkwood
The most frequent times of departure to work in Kirkwood are 5:30 AM to 5:59 AM (12, 30.8%) for males and 7:00 AM to 7:29 AM (11, 100.0%) for females.
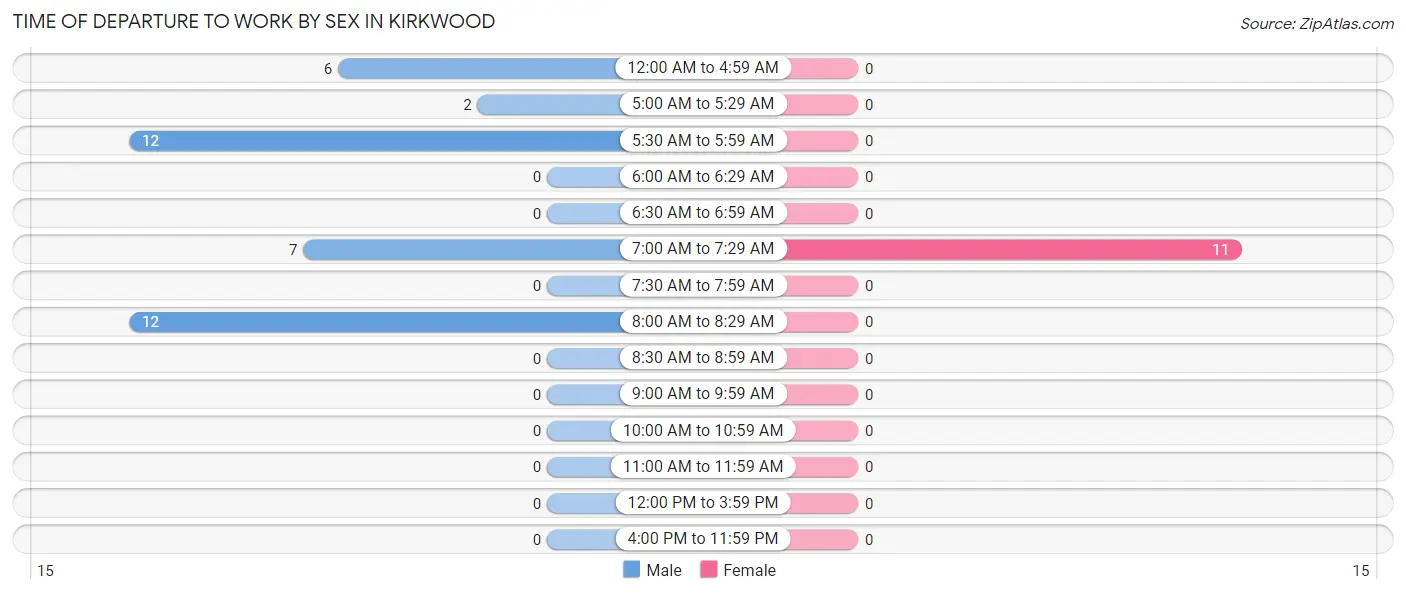
| Time of Departure | Male | Female |
| 12:00 AM to 4:59 AM | 6 (15.4%) | 0 (0.0%) |
| 5:00 AM to 5:29 AM | 2 (5.1%) | 0 (0.0%) |
| 5:30 AM to 5:59 AM | 12 (30.8%) | 0 (0.0%) |
| 6:00 AM to 6:29 AM | 0 (0.0%) | 0 (0.0%) |
| 6:30 AM to 6:59 AM | 0 (0.0%) | 0 (0.0%) |
| 7:00 AM to 7:29 AM | 7 (17.9%) | 11 (100.0%) |
| 7:30 AM to 7:59 AM | 0 (0.0%) | 0 (0.0%) |
| 8:00 AM to 8:29 AM | 12 (30.8%) | 0 (0.0%) |
| 8:30 AM to 8:59 AM | 0 (0.0%) | 0 (0.0%) |
| 9:00 AM to 9:59 AM | 0 (0.0%) | 0 (0.0%) |
| 10:00 AM to 10:59 AM | 0 (0.0%) | 0 (0.0%) |
| 11:00 AM to 11:59 AM | 0 (0.0%) | 0 (0.0%) |
| 12:00 PM to 3:59 PM | 0 (0.0%) | 0 (0.0%) |
| 4:00 PM to 11:59 PM | 0 (0.0%) | 0 (0.0%) |
| Total | 39 (100.0%) | 11 (100.0%) |
Housing Occupancy in Kirkwood
Occupancy by Ownership in Kirkwood
Of the total 59 dwellings in Kirkwood, owner-occupied units account for 47 (79.7%), while renter-occupied units make up 12 (20.3%).
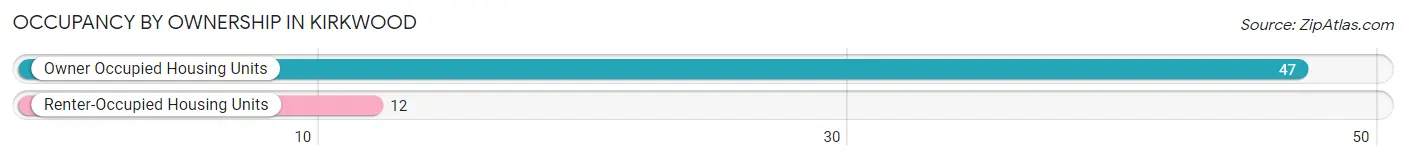
| Occupancy | # Housing Units | % Housing Units |
| Owner Occupied Housing Units | 47 | 79.7% |
| Renter-Occupied Housing Units | 12 | 20.3% |
| Total Occupied Housing Units | 59 | 100.0% |
Occupancy by Household Size in Kirkwood
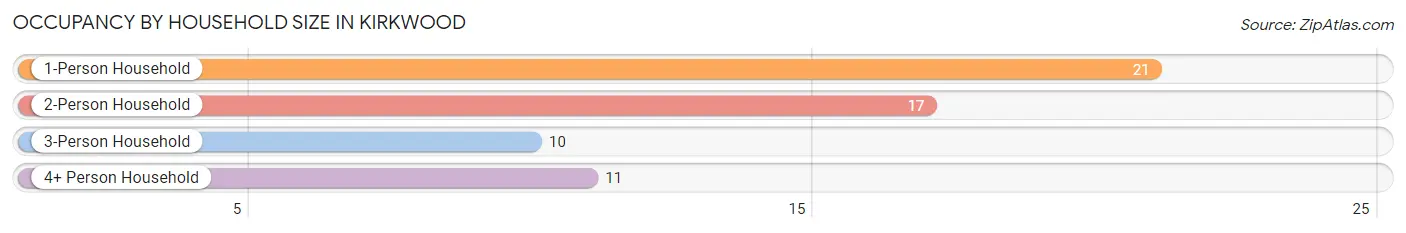
| Household Size | # Housing Units | % Housing Units |
| 1-Person Household | 21 | 35.6% |
| 2-Person Household | 17 | 28.8% |
| 3-Person Household | 10 | 17.0% |
| 4+ Person Household | 11 | 18.6% |
| Total Housing Units | 59 | 100.0% |
Occupancy by Ownership by Household Size in Kirkwood
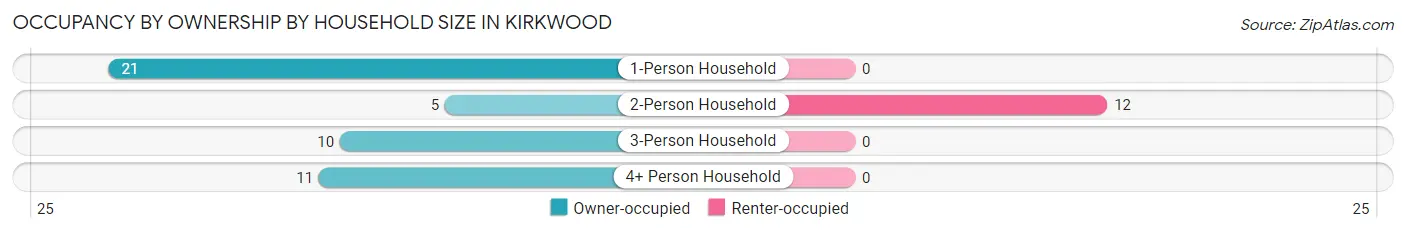
| Household Size | Owner-occupied | Renter-occupied |
| 1-Person Household | 21 (100.0%) | 0 (0.0%) |
| 2-Person Household | 5 (29.4%) | 12 (70.6%) |
| 3-Person Household | 10 (100.0%) | 0 (0.0%) |
| 4+ Person Household | 11 (100.0%) | 0 (0.0%) |
| Total Housing Units | 47 (79.7%) | 12 (20.3%) |
Occupancy by Educational Attainment in Kirkwood
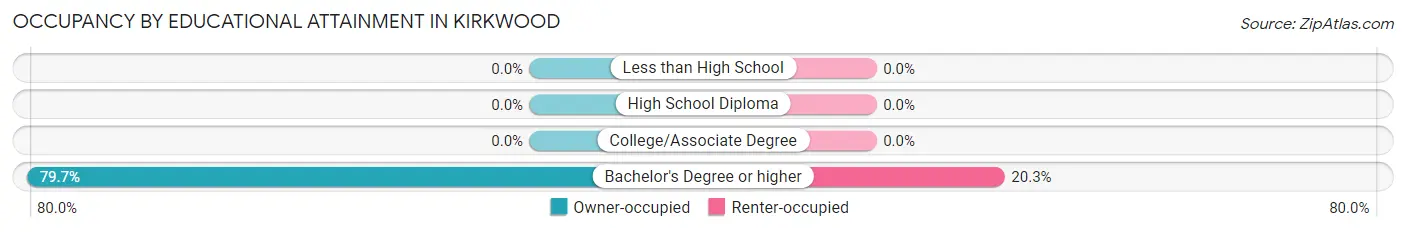
| Household Size | Owner-occupied | Renter-occupied |
| Less than High School | 0 (0.0%) | 0 (0.0%) |
| High School Diploma | 0 (0.0%) | 0 (0.0%) |
| College/Associate Degree | 0 (0.0%) | 0 (0.0%) |
| Bachelor's Degree or higher | 47 (79.7%) | 12 (20.3%) |
Occupancy by Age of Householder in Kirkwood
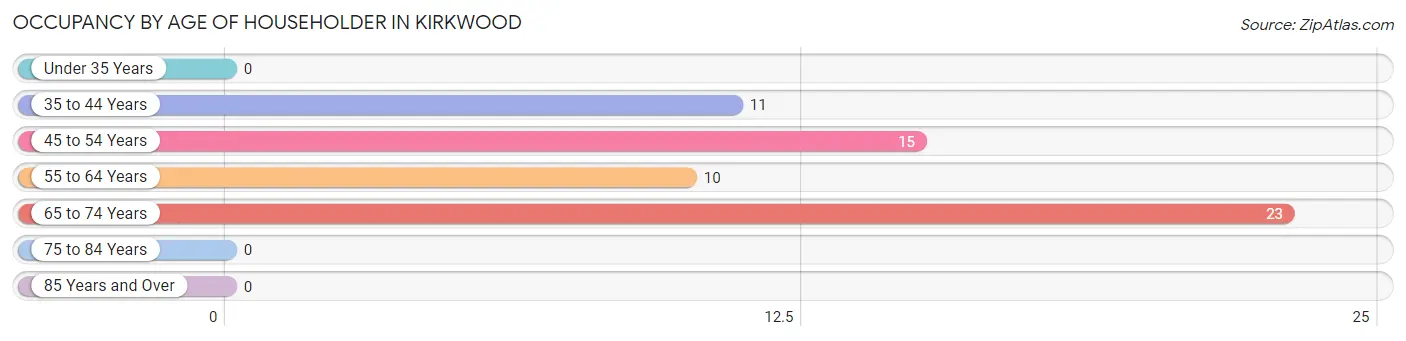
| Age Bracket | # Households | % Households |
| Under 35 Years | 0 | 0.0% |
| 35 to 44 Years | 11 | 18.6% |
| 45 to 54 Years | 15 | 25.4% |
| 55 to 64 Years | 10 | 17.0% |
| 65 to 74 Years | 23 | 39.0% |
| 75 to 84 Years | 0 | 0.0% |
| 85 Years and Over | 0 | 0.0% |
| Total | 59 | 100.0% |
Housing Finances in Kirkwood
Median Income by Occupancy in Kirkwood
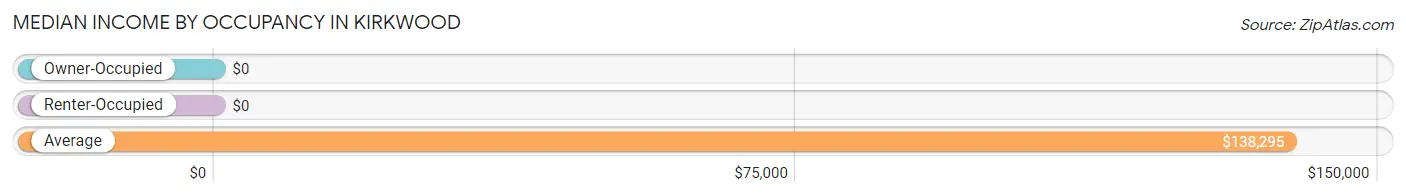
| Occupancy Type | # Households | Median Income |
| Owner-Occupied | 47 (79.7%) | $0 |
| Renter-Occupied | 12 (20.3%) | $0 |
| Average | 59 (100.0%) | $138,295 |
Occupancy by Householder Income Bracket in Kirkwood
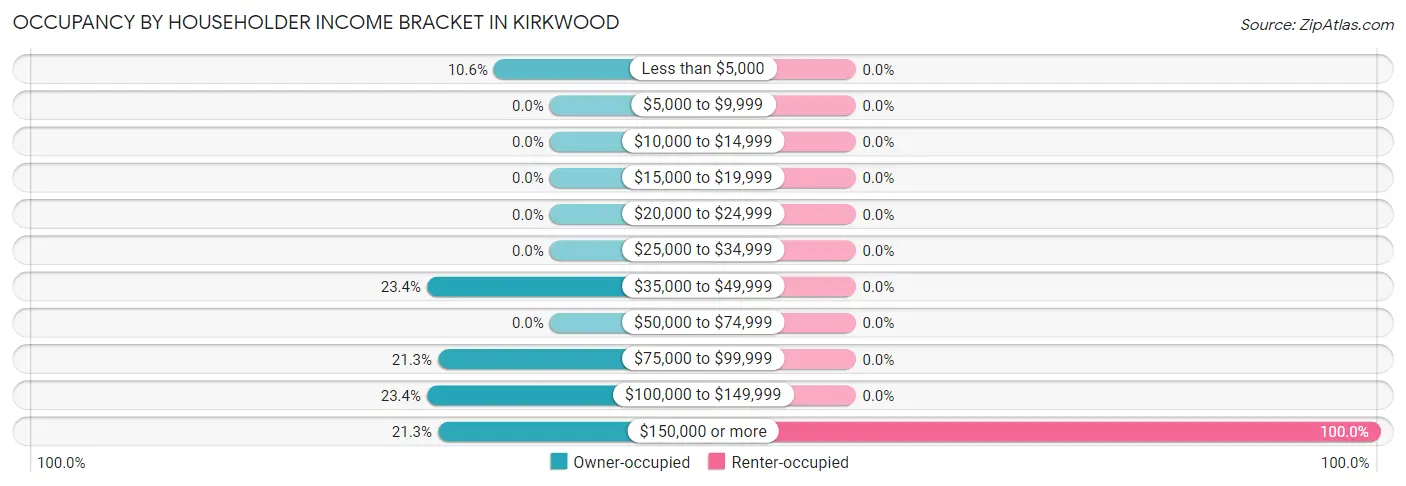
| Income Bracket | Owner-occupied | Renter-occupied |
| Less than $5,000 | 5 (10.6%) | 0 (0.0%) |
| $5,000 to $9,999 | 0 (0.0%) | 0 (0.0%) |
| $10,000 to $14,999 | 0 (0.0%) | 0 (0.0%) |
| $15,000 to $19,999 | 0 (0.0%) | 0 (0.0%) |
| $20,000 to $24,999 | 0 (0.0%) | 0 (0.0%) |
| $25,000 to $34,999 | 0 (0.0%) | 0 (0.0%) |
| $35,000 to $49,999 | 11 (23.4%) | 0 (0.0%) |
| $50,000 to $74,999 | 0 (0.0%) | 0 (0.0%) |
| $75,000 to $99,999 | 10 (21.3%) | 0 (0.0%) |
| $100,000 to $149,999 | 11 (23.4%) | 0 (0.0%) |
| $150,000 or more | 10 (21.3%) | 12 (100.0%) |
| Total | 47 (100.0%) | 12 (100.0%) |
Monthly Housing Cost Tiers in Kirkwood
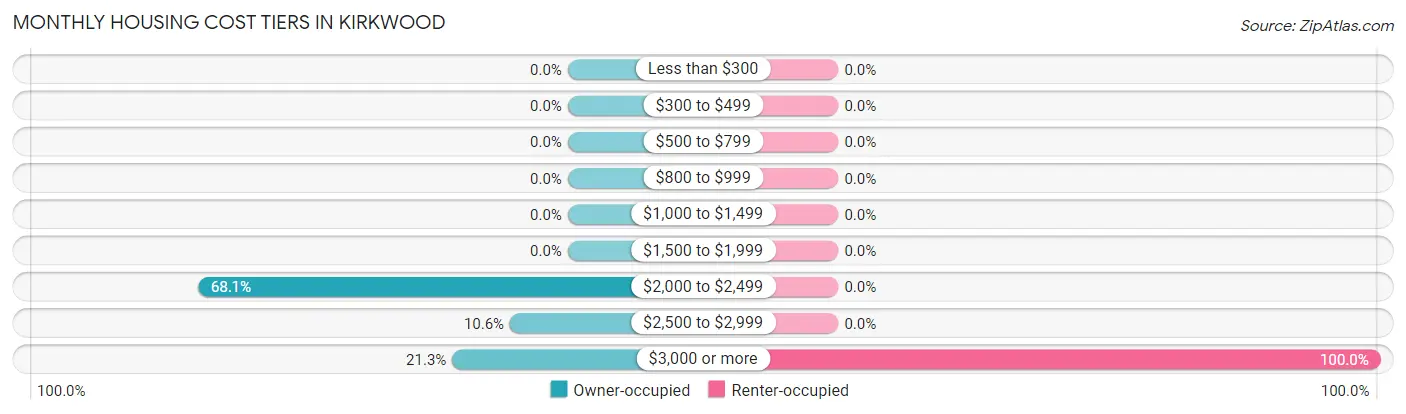
| Monthly Cost | Owner-occupied | Renter-occupied |
| Less than $300 | 0 (0.0%) | 0 (0.0%) |
| $300 to $499 | 0 (0.0%) | 0 (0.0%) |
| $500 to $799 | 0 (0.0%) | 0 (0.0%) |
| $800 to $999 | 0 (0.0%) | 0 (0.0%) |
| $1,000 to $1,499 | 0 (0.0%) | 0 (0.0%) |
| $1,500 to $1,999 | 0 (0.0%) | 0 (0.0%) |
| $2,000 to $2,499 | 32 (68.1%) | 0 (0.0%) |
| $2,500 to $2,999 | 5 (10.6%) | 0 (0.0%) |
| $3,000 or more | 10 (21.3%) | 12 (100.0%) |
| Total | 47 (100.0%) | 12 (100.0%) |
Physical Housing Characteristics in Kirkwood
Housing Structures in Kirkwood
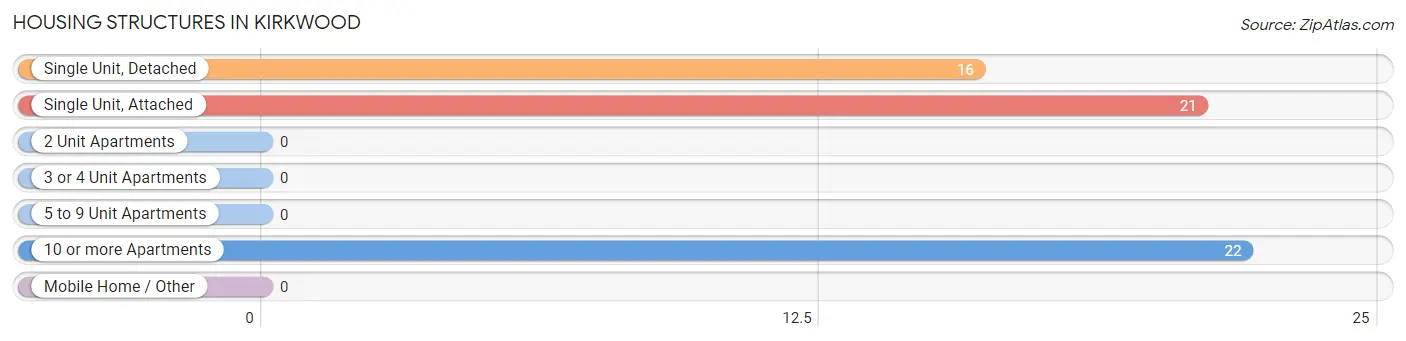
| Structure Type | # Housing Units | % Housing Units |
| Single Unit, Detached | 16 | 27.1% |
| Single Unit, Attached | 21 | 35.6% |
| 2 Unit Apartments | 0 | 0.0% |
| 3 or 4 Unit Apartments | 0 | 0.0% |
| 5 to 9 Unit Apartments | 0 | 0.0% |
| 10 or more Apartments | 22 | 37.3% |
| Mobile Home / Other | 0 | 0.0% |
| Total | 59 | 100.0% |
Housing Structures by Occupancy in Kirkwood
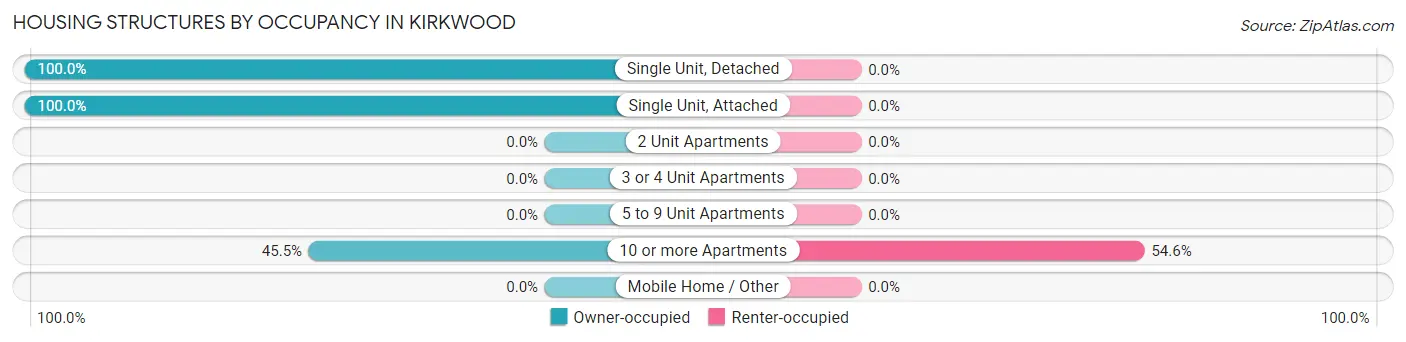
| Structure Type | Owner-occupied | Renter-occupied |
| Single Unit, Detached | 16 (100.0%) | 0 (0.0%) |
| Single Unit, Attached | 21 (100.0%) | 0 (0.0%) |
| 2 Unit Apartments | 0 (0.0%) | 0 (0.0%) |
| 3 or 4 Unit Apartments | 0 (0.0%) | 0 (0.0%) |
| 5 to 9 Unit Apartments | 0 (0.0%) | 0 (0.0%) |
| 10 or more Apartments | 10 (45.5%) | 12 (54.5%) |
| Mobile Home / Other | 0 (0.0%) | 0 (0.0%) |
| Total | 47 (79.7%) | 12 (20.3%) |
Housing Structures by Number of Rooms in Kirkwood
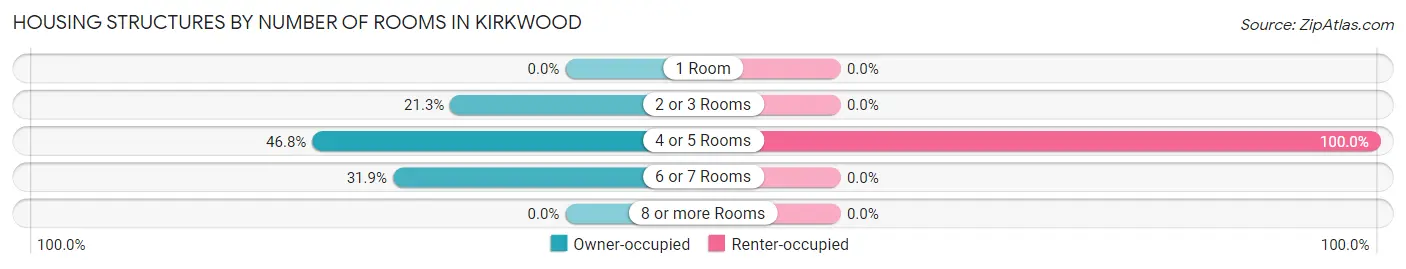
| Number of Rooms | Owner-occupied | Renter-occupied |
| 1 Room | 0 (0.0%) | 0 (0.0%) |
| 2 or 3 Rooms | 10 (21.3%) | 0 (0.0%) |
| 4 or 5 Rooms | 22 (46.8%) | 12 (100.0%) |
| 6 or 7 Rooms | 15 (31.9%) | 0 (0.0%) |
| 8 or more Rooms | 0 (0.0%) | 0 (0.0%) |
| Total | 47 (100.0%) | 12 (100.0%) |
Housing Structure by Heating Type in Kirkwood
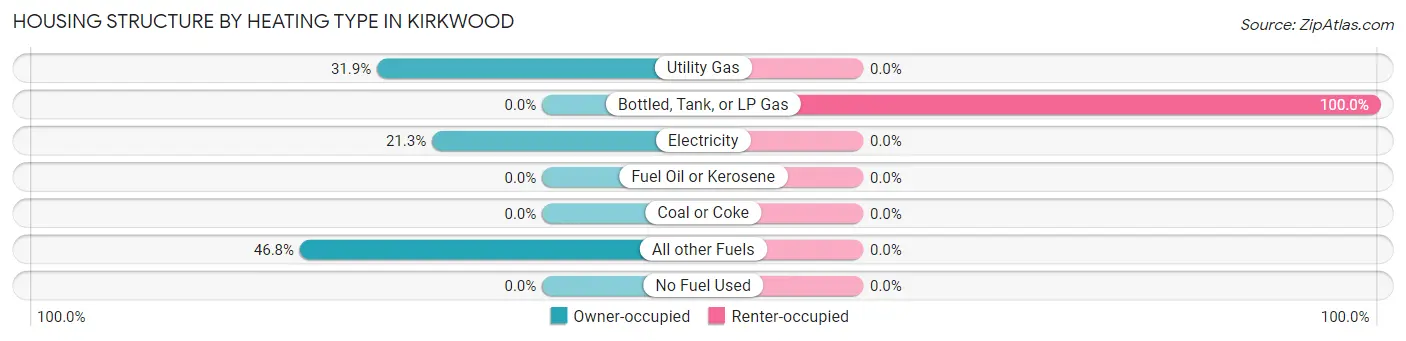
| Heating Type | Owner-occupied | Renter-occupied |
| Utility Gas | 15 (31.9%) | 0 (0.0%) |
| Bottled, Tank, or LP Gas | 0 (0.0%) | 12 (100.0%) |
| Electricity | 10 (21.3%) | 0 (0.0%) |
| Fuel Oil or Kerosene | 0 (0.0%) | 0 (0.0%) |
| Coal or Coke | 0 (0.0%) | 0 (0.0%) |
| All other Fuels | 22 (46.8%) | 0 (0.0%) |
| No Fuel Used | 0 (0.0%) | 0 (0.0%) |
| Total | 47 (100.0%) | 12 (100.0%) |
Household Vehicle Usage in Kirkwood
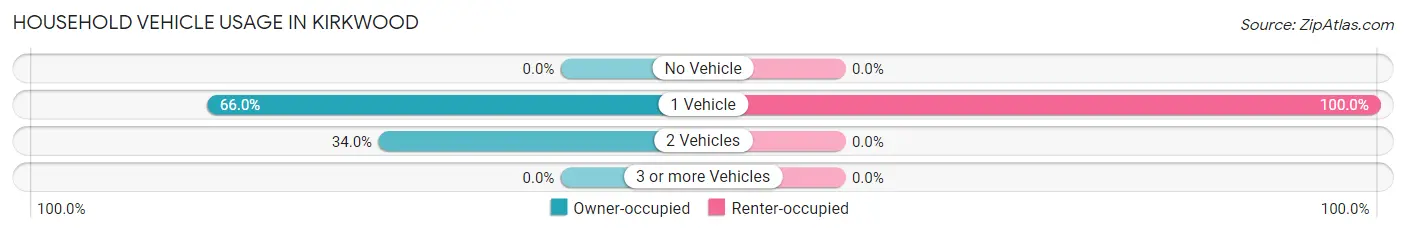
| Vehicles per Household | Owner-occupied | Renter-occupied |
| No Vehicle | 0 (0.0%) | 0 (0.0%) |
| 1 Vehicle | 31 (66.0%) | 12 (100.0%) |
| 2 Vehicles | 16 (34.0%) | 0 (0.0%) |
| 3 or more Vehicles | 0 (0.0%) | 0 (0.0%) |
| Total | 47 (100.0%) | 12 (100.0%) |
Real Estate & Mortgages in Kirkwood
Real Estate and Mortgage Overview in Kirkwood
| Characteristic | Without Mortgage | With Mortgage |
| Housing Units | 5 | 42 |
| Median Property Value | - | - |
| Median Household Income | - | - |
| Monthly Housing Costs | - | - |
| Real Estate Taxes | - | - |
Property Value by Mortgage Status in Kirkwood
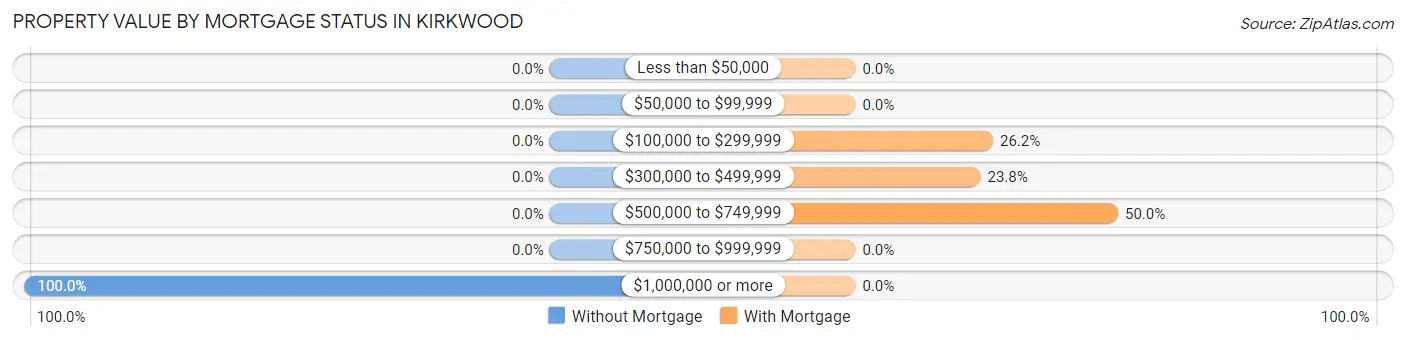
| Property Value | Without Mortgage | With Mortgage |
| Less than $50,000 | 0 (0.0%) | 0 (0.0%) |
| $50,000 to $99,999 | 0 (0.0%) | 0 (0.0%) |
| $100,000 to $299,999 | 0 (0.0%) | 11 (26.2%) |
| $300,000 to $499,999 | 0 (0.0%) | 10 (23.8%) |
| $500,000 to $749,999 | 0 (0.0%) | 21 (50.0%) |
| $750,000 to $999,999 | 0 (0.0%) | 0 (0.0%) |
| $1,000,000 or more | 5 (100.0%) | 0 (0.0%) |
| Total | 5 (100.0%) | 42 (100.0%) |
Household Income by Mortgage Status in Kirkwood
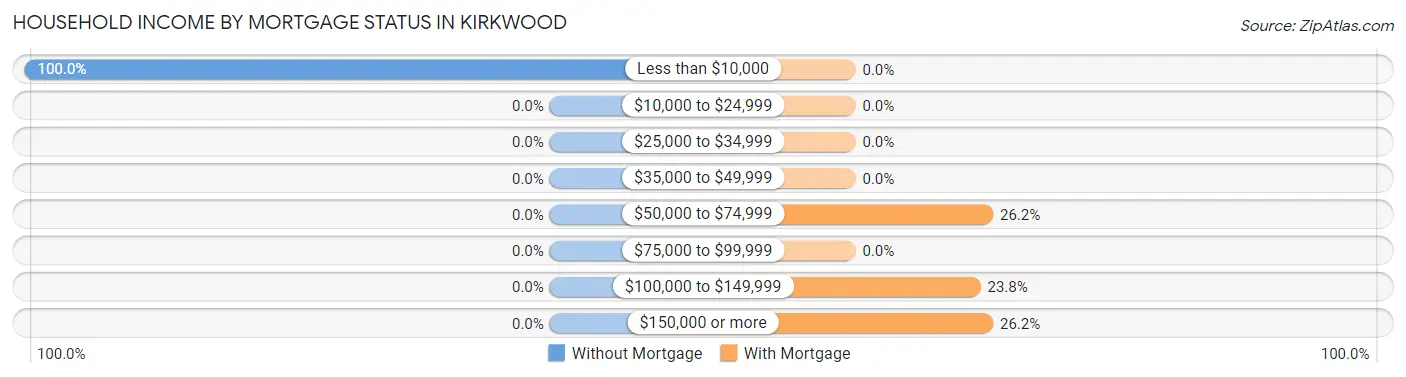
| Household Income | Without Mortgage | With Mortgage |
| Less than $10,000 | 5 (100.0%) | 0 (0.0%) |
| $10,000 to $24,999 | 0 (0.0%) | 0 (0.0%) |
| $25,000 to $34,999 | 0 (0.0%) | 0 (0.0%) |
| $35,000 to $49,999 | 0 (0.0%) | 0 (0.0%) |
| $50,000 to $74,999 | 0 (0.0%) | 11 (26.2%) |
| $75,000 to $99,999 | 0 (0.0%) | 0 (0.0%) |
| $100,000 to $149,999 | 0 (0.0%) | 10 (23.8%) |
| $150,000 or more | 0 (0.0%) | 11 (26.2%) |
| Total | 5 (100.0%) | 42 (100.0%) |
Property Value to Household Income Ratio in Kirkwood
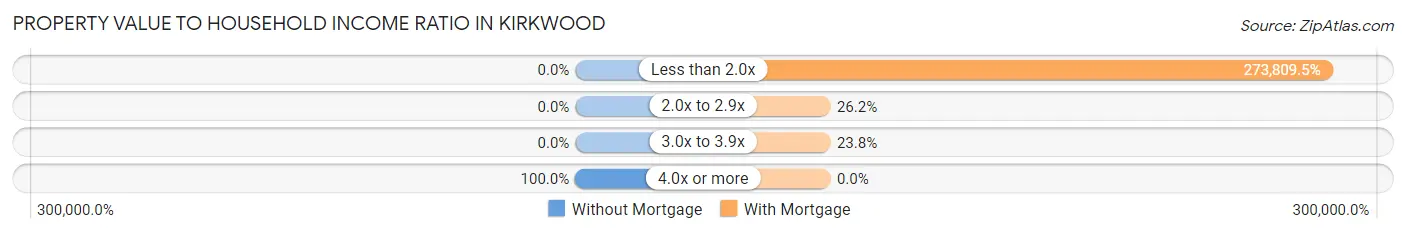
| Value-to-Income Ratio | Without Mortgage | With Mortgage |
| Less than 2.0x | 0 (0.0%) | 115,000 (273,809.5%) |
| 2.0x to 2.9x | 0 (0.0%) | 11 (26.2%) |
| 3.0x to 3.9x | 0 (0.0%) | 10 (23.8%) |
| 4.0x or more | 5 (100.0%) | 0 (0.0%) |
| Total | 5 (100.0%) | 42 (100.0%) |
Real Estate Taxes by Mortgage Status in Kirkwood
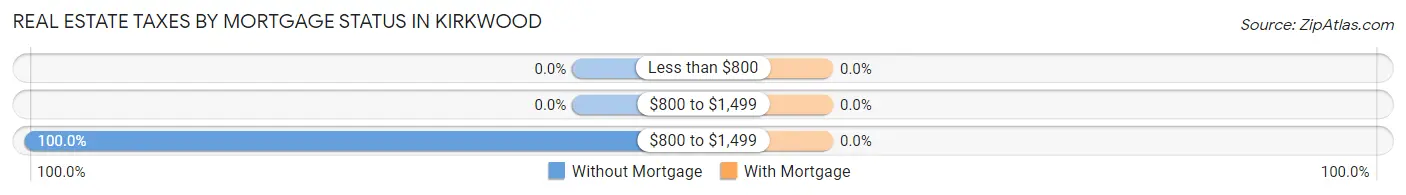
| Property Taxes | Without Mortgage | With Mortgage |
| Less than $800 | 0 (0.0%) | 0 (0.0%) |
| $800 to $1,499 | 0 (0.0%) | 0 (0.0%) |
| $800 to $1,499 | 5 (100.0%) | 0 (0.0%) |
| Total | 5 (100.0%) | 42 (100.0%) |
Health & Disability in Kirkwood
Health Insurance Coverage by Age in Kirkwood
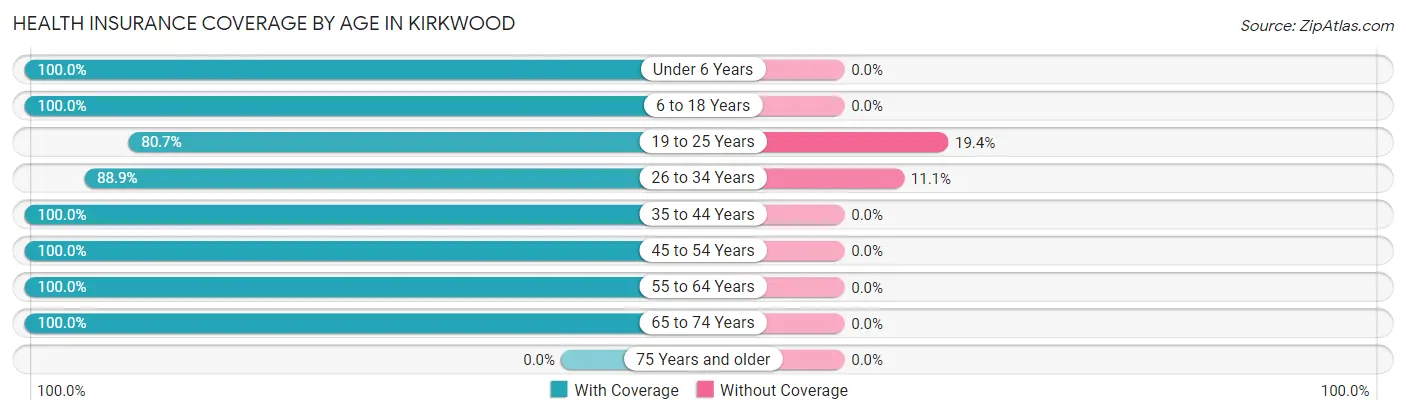
| Age Bracket | With Coverage | Without Coverage |
| Under 6 Years | 58 (100.0%) | 0 (0.0%) |
| 6 to 18 Years | 27 (100.0%) | 0 (0.0%) |
| 19 to 25 Years | 25 (80.6%) | 6 (19.4%) |
| 26 to 34 Years | 32 (88.9%) | 4 (11.1%) |
| 35 to 44 Years | 26 (100.0%) | 0 (0.0%) |
| 45 to 54 Years | 27 (100.0%) | 0 (0.0%) |
| 55 to 64 Years | 21 (100.0%) | 0 (0.0%) |
| 65 to 74 Years | 23 (100.0%) | 0 (0.0%) |
| 75 Years and older | 0 (0.0%) | 0 (0.0%) |
| Total | 239 (96.0%) | 10 (4.0%) |
Health Insurance Coverage by Citizenship Status in Kirkwood
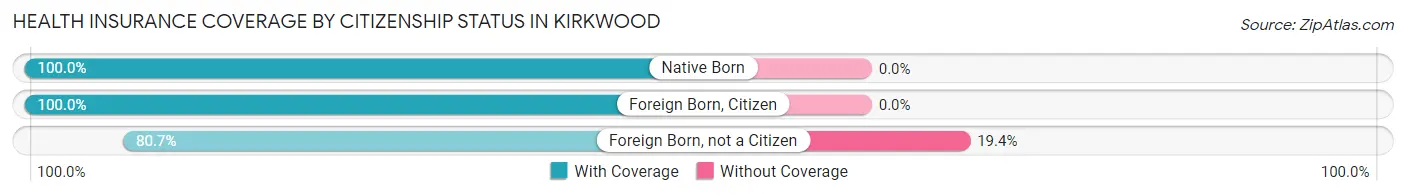
| Citizenship Status | With Coverage | Without Coverage |
| Native Born | 58 (100.0%) | 0 (0.0%) |
| Foreign Born, Citizen | 27 (100.0%) | 0 (0.0%) |
| Foreign Born, not a Citizen | 25 (80.6%) | 6 (19.4%) |
Health Insurance Coverage by Household Income in Kirkwood
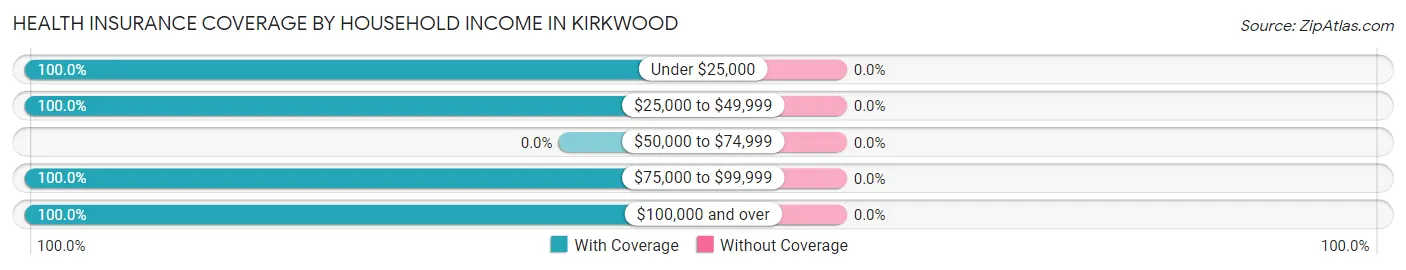
| Household Income | With Coverage | Without Coverage |
| Under $25,000 | 15 (100.0%) | 0 (0.0%) |
| $25,000 to $49,999 | 11 (100.0%) | 0 (0.0%) |
| $50,000 to $74,999 | 0 (0.0%) | 0 (0.0%) |
| $75,000 to $99,999 | 10 (100.0%) | 0 (0.0%) |
| $100,000 and over | 142 (100.0%) | 0 (0.0%) |
Public vs Private Health Insurance Coverage by Age in Kirkwood
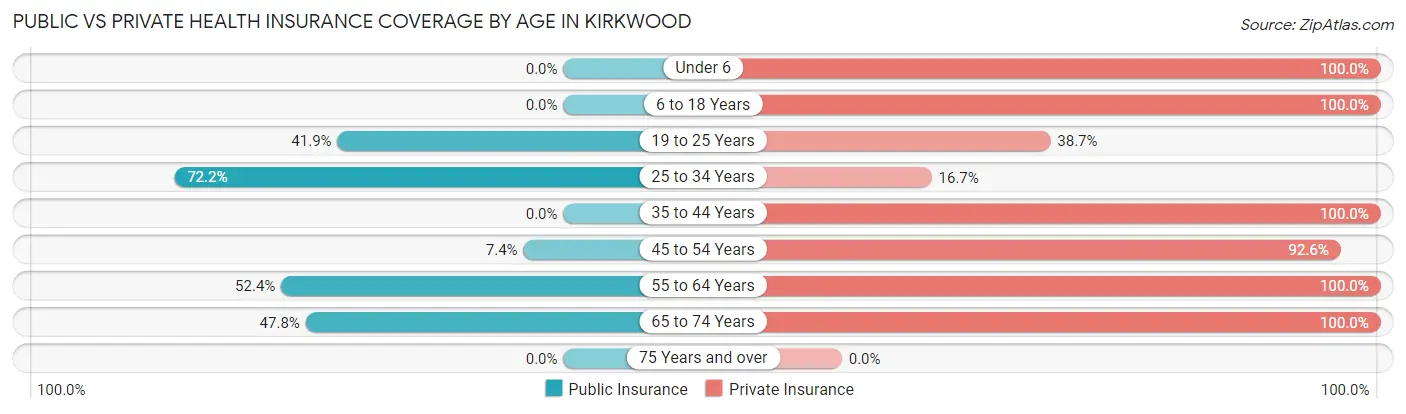
| Age Bracket | Public Insurance | Private Insurance |
| Under 6 | 0 (0.0%) | 58 (100.0%) |
| 6 to 18 Years | 0 (0.0%) | 27 (100.0%) |
| 19 to 25 Years | 13 (41.9%) | 12 (38.7%) |
| 25 to 34 Years | 26 (72.2%) | 6 (16.7%) |
| 35 to 44 Years | 0 (0.0%) | 26 (100.0%) |
| 45 to 54 Years | 2 (7.4%) | 25 (92.6%) |
| 55 to 64 Years | 11 (52.4%) | 21 (100.0%) |
| 65 to 74 Years | 11 (47.8%) | 23 (100.0%) |
| 75 Years and over | 0 (0.0%) | 0 (0.0%) |
| Total | 63 (25.3%) | 198 (79.5%) |
Disability Status by Sex by Age in Kirkwood
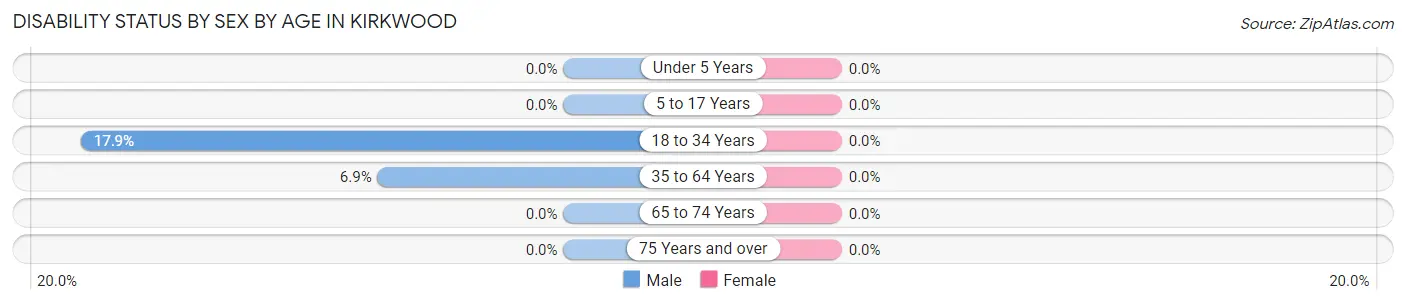
| Age Bracket | Male | Female |
| Under 5 Years | 0 (0.0%) | 0 (0.0%) |
| 5 to 17 Years | 0 (0.0%) | 0 (0.0%) |
| 18 to 34 Years | 12 (17.9%) | 0 (0.0%) |
| 35 to 64 Years | 2 (6.9%) | 0 (0.0%) |
| 65 to 74 Years | 0 (0.0%) | 0 (0.0%) |
| 75 Years and over | 0 (0.0%) | 0 (0.0%) |
Disability Class by Sex by Age in Kirkwood
Disability Class: Hearing Difficulty
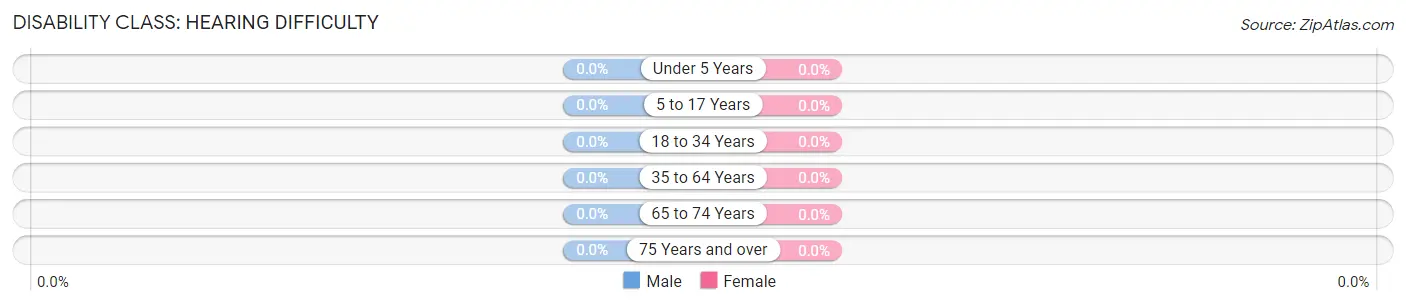
| Age Bracket | Male | Female |
| Under 5 Years | 0 (0.0%) | 0 (0.0%) |
| 5 to 17 Years | 0 (0.0%) | 0 (0.0%) |
| 18 to 34 Years | 0 (0.0%) | 0 (0.0%) |
| 35 to 64 Years | 0 (0.0%) | 0 (0.0%) |
| 65 to 74 Years | 0 (0.0%) | 0 (0.0%) |
| 75 Years and over | 0 (0.0%) | 0 (0.0%) |
Disability Class: Vision Difficulty
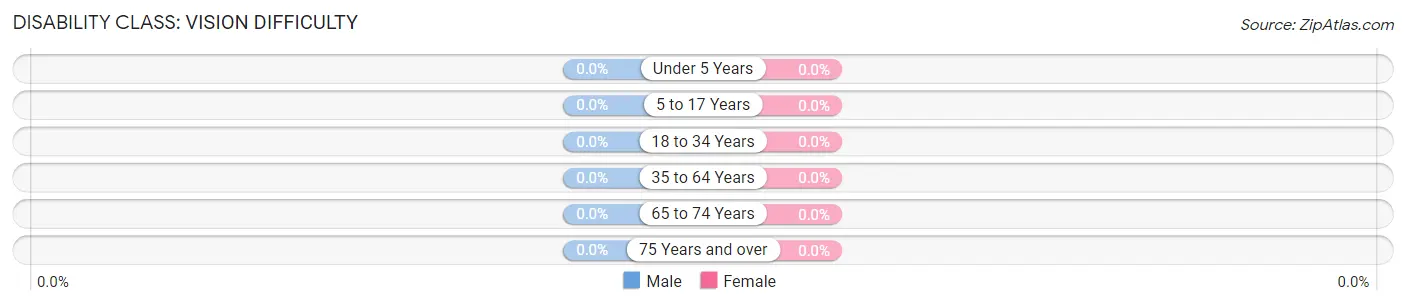
| Age Bracket | Male | Female |
| Under 5 Years | 0 (0.0%) | 0 (0.0%) |
| 5 to 17 Years | 0 (0.0%) | 0 (0.0%) |
| 18 to 34 Years | 0 (0.0%) | 0 (0.0%) |
| 35 to 64 Years | 0 (0.0%) | 0 (0.0%) |
| 65 to 74 Years | 0 (0.0%) | 0 (0.0%) |
| 75 Years and over | 0 (0.0%) | 0 (0.0%) |
Disability Class: Cognitive Difficulty
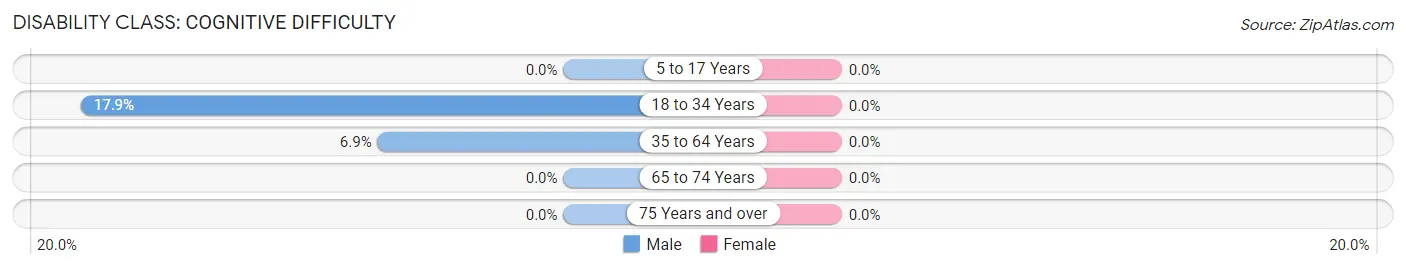
| Age Bracket | Male | Female |
| 5 to 17 Years | 0 (0.0%) | 0 (0.0%) |
| 18 to 34 Years | 12 (17.9%) | 0 (0.0%) |
| 35 to 64 Years | 2 (6.9%) | 0 (0.0%) |
| 65 to 74 Years | 0 (0.0%) | 0 (0.0%) |
| 75 Years and over | 0 (0.0%) | 0 (0.0%) |
Disability Class: Ambulatory Difficulty
| Age Bracket | Male | Female |
| 5 to 17 Years | 0 (0.0%) | 0 (0.0%) |
| 18 to 34 Years | 0 (0.0%) | 0 (0.0%) |
| 35 to 64 Years | 0 (0.0%) | 0 (0.0%) |
| 65 to 74 Years | 0 (0.0%) | 0 (0.0%) |
| 75 Years and over | 0 (0.0%) | 0 (0.0%) |
Disability Class: Self-Care Difficulty
| Age Bracket | Male | Female |
| 5 to 17 Years | 0 (0.0%) | 0 (0.0%) |
| 18 to 34 Years | 0 (0.0%) | 0 (0.0%) |
| 35 to 64 Years | 0 (0.0%) | 0 (0.0%) |
| 65 to 74 Years | 0 (0.0%) | 0 (0.0%) |
| 75 Years and over | 0 (0.0%) | 0 (0.0%) |
Technology Access in Kirkwood
Computing Device Access in Kirkwood
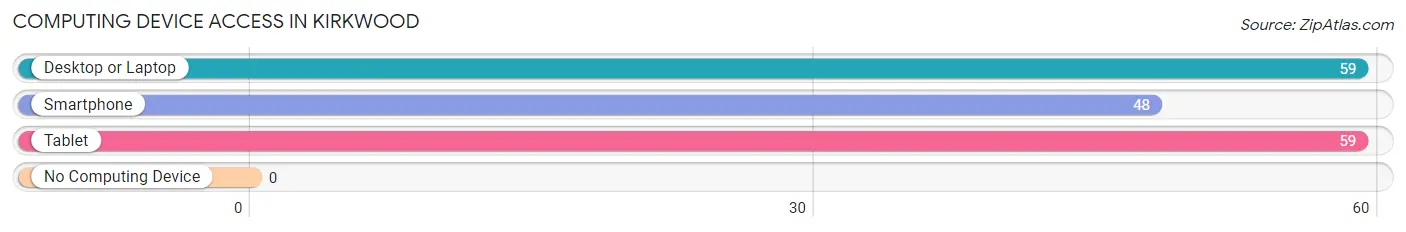
| Device Type | # Households | % Households |
| Desktop or Laptop | 59 | 100.0% |
| Smartphone | 48 | 81.4% |
| Tablet | 59 | 100.0% |
| No Computing Device | 0 | 0.0% |
| Total | 59 | 100.0% |
Internet Access in Kirkwood
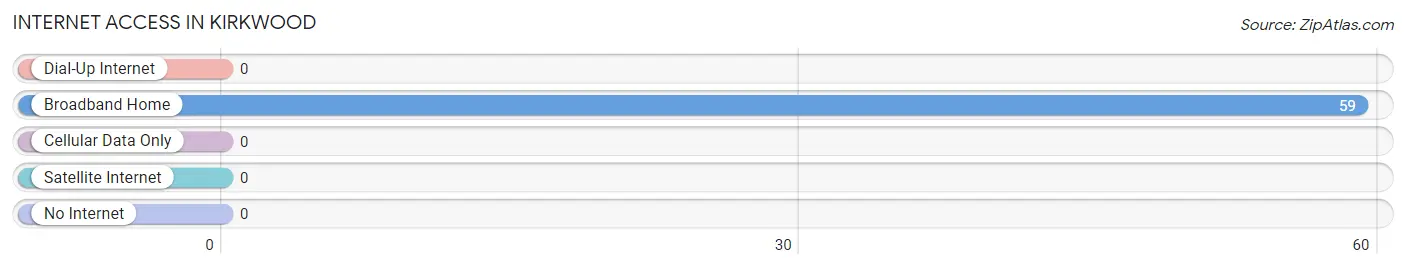
| Internet Type | # Households | % Households |
| Dial-Up Internet | 0 | 0.0% |
| Broadband Home | 59 | 100.0% |
| Cellular Data Only | 0 | 0.0% |
| Satellite Internet | 0 | 0.0% |
| No Internet | 0 | 0.0% |
| Total | 59 | 100.0% |
Kirkwood Summary
Kirkwood is a small mountain community located in the Sierra Nevada Mountains of California. It is situated in Alpine County, approximately two hours east of Sacramento and two hours south of Lake Tahoe. The town is located at an elevation of 7,800 feet and is surrounded by the Eldorado National Forest. Kirkwood is a popular destination for outdoor recreation, including skiing, snowboarding, hiking, mountain biking, and camping.
History
Kirkwood was founded in 1864 by James Kirkwood, a Scottish immigrant who had come to California during the Gold Rush. He purchased a large tract of land in the Sierra Nevada Mountains and began to develop it into a resort. In 1867, he built a hotel and a general store, and the town of Kirkwood was born.
The town grew slowly over the next few decades, and by the early 1900s, it had become a popular destination for tourists and outdoor enthusiasts. In the 1950s, the area was developed into a ski resort, and Kirkwood Mountain Resort opened in 1961. The resort has since become one of the most popular ski destinations in California.
Geography
Kirkwood is located in the Sierra Nevada Mountains of California, approximately two hours east of Sacramento and two hours south of Lake Tahoe. The town is situated at an elevation of 7,800 feet and is surrounded by the Eldorado National Forest. The area is known for its rugged terrain and stunning views of the surrounding mountains.
The town is located in a valley surrounded by the Carson Range to the east and the Sierra Nevada Range to the west. The Mokelumne River runs through the valley, and the town is situated at the base of Kirkwood Mountain.
Economy
Kirkwood’s economy is largely driven by tourism. The town is home to Kirkwood Mountain Resort, which is one of the most popular ski destinations in California. The resort offers a variety of activities, including skiing, snowboarding, hiking, mountain biking, and camping.
The town also has a number of restaurants, bars, and shops that cater to tourists. In addition, there are several bed and breakfasts, vacation rentals, and other lodging options in the area.
Demographics
As of the 2010 census, the population of Kirkwood was 1,072. The racial makeup of the town was 94.3% White, 0.7% African American, 0.3% Native American, 0.7% Asian, 0.1% Pacific Islander, 1.2% from other races, and 2.7% from two or more races. Hispanic or Latino of any race were 4.2% of the population.
The median household income in Kirkwood was $50,938, and the median family income was $58,750. The per capita income for the town was $30,945. About 8.3% of families and 11.2% of the population were below the poverty line, including 15.2% of those under age 18 and 4.2% of those age 65 or over.
Common Questions
What is Per Capita Income in Kirkwood?
Per Capita income in Kirkwood is $36,701.
What is the Median Family Income in Kirkwood?
Median Family Income in Kirkwood is $153,250.
What is the Median Household income in Kirkwood?
Median Household Income in Kirkwood is $138,295.
What is Inequality or Gini Index in Kirkwood?
Inequality or Gini Index in Kirkwood is 0.40.
What is the Total Population of Kirkwood?
Total Population of Kirkwood is 249.
What is the Total Male Population of Kirkwood?
Total Male Population of Kirkwood is 175.
What is the Total Female Population of Kirkwood?
Total Female Population of Kirkwood is 74.
What is the Ratio of Males per 100 Females in Kirkwood?
There are 236.49 Males per 100 Females in Kirkwood.
What is the Ratio of Females per 100 Males in Kirkwood?
There are 42.29 Females per 100 Males in Kirkwood.
What is the Median Population Age in Kirkwood?
Median Population Age in Kirkwood is 26.6 Years.
What is the Average Family Size in Kirkwood
Average Family Size in Kirkwood is 4.1 People.
What is the Average Household Size in Kirkwood
Average Household Size in Kirkwood is 3.0 People.
How Large is the Labor Force in Kirkwood?
There are 102 People in the Labor Forcein in Kirkwood.
What is the Percentage of People in the Labor Force in Kirkwood?
62.2% of People are in the Labor Force in Kirkwood.