Cities with the Highest Percentage of Population Employed in Legal Services & Support in Alabama
RELATED REPORTS & OPTIONS
Legal Services & Support
Alabama
Compare Cities
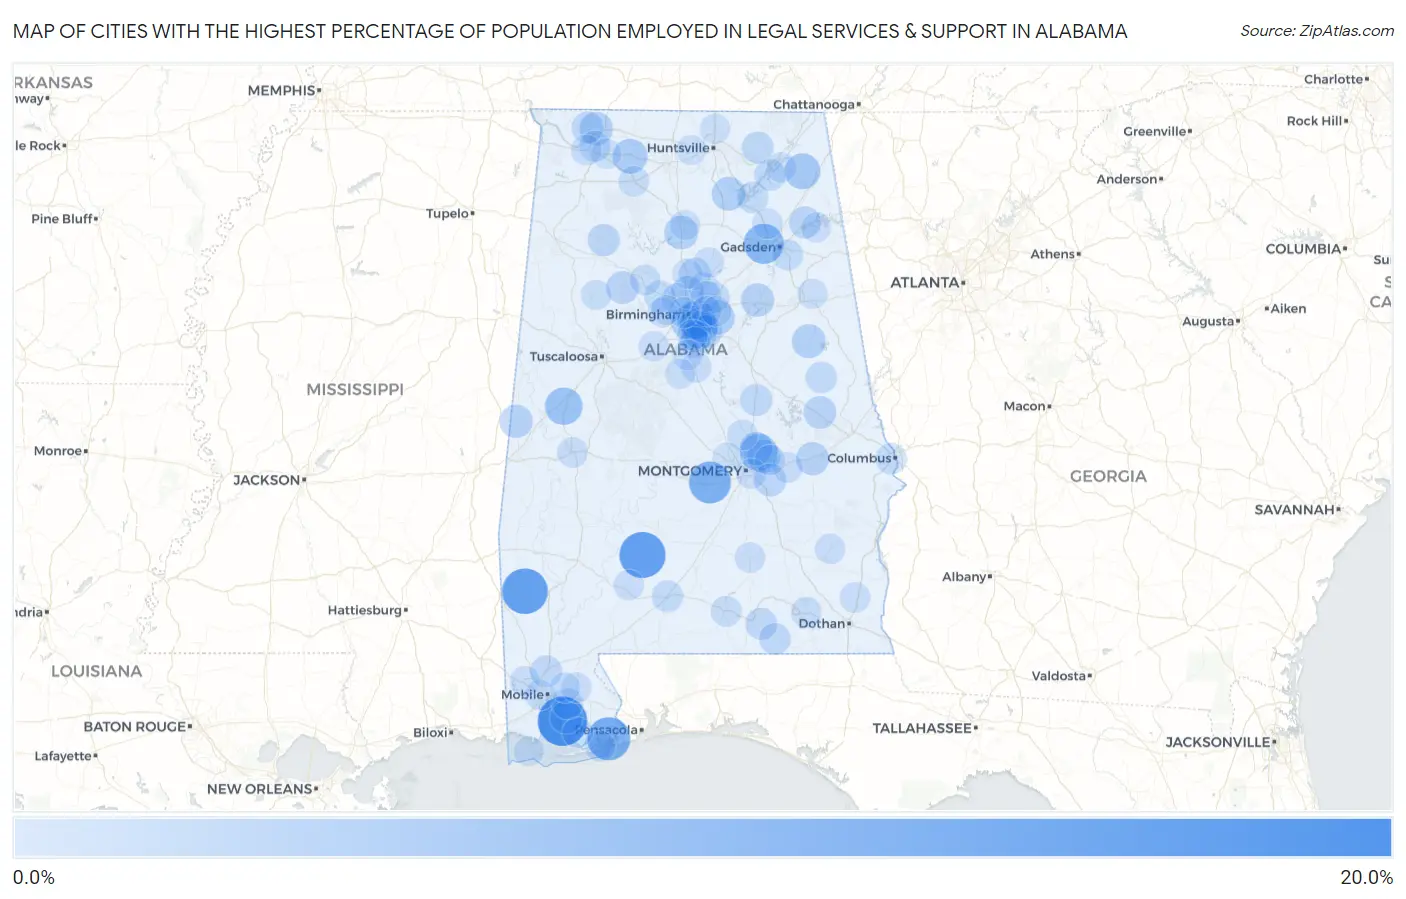
Map of Cities with the Highest Percentage of Population Employed in Legal Services & Support in Alabama
0.0%
20.0%
Cities with the Highest Percentage of Population Employed in Legal Services & Support in Alabama
| City | % Employed | vs State | vs National | |
| 1. | Point Clear | 19.1% | 0.90%(+18.2)#1 | 1.2%(+17.9)#64 |
| 2. | Beatrice | 15.8% | 0.90%(+14.9)#2 | 1.2%(+14.6)#93 |
| 3. | Chatom | 15.4% | 0.90%(+14.5)#3 | 1.2%(+14.2)#102 |
| 4. | Perdido Beach | 12.9% | 0.90%(+12.0)#4 | 1.2%(+11.7)#143 |
| 5. | Lowndesboro | 11.8% | 0.90%(+10.9)#5 | 1.2%(+10.6)#164 |
| 6. | Ivalee | 10.0% | 0.90%(+9.10)#6 | 1.2%(+8.82)#219 |
| 7. | Mountain Brook | 8.2% | 0.90%(+7.28)#7 | 1.2%(+6.99)#329 |
| 8. | Blue Ridge | 7.7% | 0.90%(+6.80)#8 | 1.2%(+6.51)#359 |
| 9. | Eutaw | 7.5% | 0.90%(+6.63)#9 | 1.2%(+6.34)#374 |
| 10. | Sylvania | 6.0% | 0.90%(+5.11)#10 | 1.2%(+4.83)#600 |
| 11. | Meadowbrook | 5.3% | 0.90%(+4.37)#11 | 1.2%(+4.09)#762 |
| 12. | Courtland | 5.2% | 0.90%(+4.28)#12 | 1.2%(+4.00)#796 |
| 13. | Homewood | 5.1% | 0.90%(+4.25)#13 | 1.2%(+3.96)#806 |
| 14. | Mount Olive Cdp Jefferson County | 4.8% | 0.90%(+3.90)#14 | 1.2%(+3.61)#912 |
| 15. | Dunnavant | 4.8% | 0.90%(+3.89)#15 | 1.2%(+3.60)#917 |
| 16. | Union Grove | 4.3% | 0.90%(+3.45)#16 | 1.2%(+3.16)#1,073 |
| 17. | Lineville | 4.3% | 0.90%(+3.37)#17 | 1.2%(+3.08)#1,103 |
| 18. | Good Hope | 4.2% | 0.90%(+3.32)#18 | 1.2%(+3.03)#1,126 |
| 19. | St Florian | 4.0% | 0.90%(+3.07)#19 | 1.2%(+2.79)#1,247 |
| 20. | Riverside | 3.8% | 0.90%(+2.92)#20 | 1.2%(+2.63)#1,320 |
| 21. | Redland | 3.8% | 0.90%(+2.89)#21 | 1.2%(+2.60)#1,330 |
| 22. | Emelle | 3.7% | 0.90%(+2.81)#22 | 1.2%(+2.52)#1,395 |
| 23. | Vestavia Hills | 3.7% | 0.90%(+2.80)#23 | 1.2%(+2.51)#1,403 |
| 24. | Wetumpka | 3.6% | 0.90%(+2.74)#24 | 1.2%(+2.46)#1,434 |
| 25. | Tuskegee | 3.5% | 0.90%(+2.64)#25 | 1.2%(+2.35)#1,506 |
| 26. | Gardendale | 3.3% | 0.90%(+2.44)#26 | 1.2%(+2.16)#1,649 |
| 27. | Camp Hill | 3.3% | 0.90%(+2.42)#27 | 1.2%(+2.14)#1,669 |
| 28. | Oakman | 3.3% | 0.90%(+2.38)#28 | 1.2%(+2.09)#1,701 |
| 29. | Highland Lakes | 3.2% | 0.90%(+2.29)#29 | 1.2%(+2.00)#1,765 |
| 30. | Pike Road | 3.2% | 0.90%(+2.28)#30 | 1.2%(+2.00)#1,776 |
| 31. | Fairhope | 3.0% | 0.90%(+2.08)#31 | 1.2%(+1.80)#1,955 |
| 32. | Lynn | 2.8% | 0.90%(+1.87)#32 | 1.2%(+1.58)#2,169 |
| 33. | Leesburg | 2.7% | 0.90%(+1.79)#33 | 1.2%(+1.50)#2,254 |
| 34. | Underwood Petersville | 2.6% | 0.90%(+1.73)#34 | 1.2%(+1.44)#2,312 |
| 35. | Rockford | 2.6% | 0.90%(+1.72)#35 | 1.2%(+1.43)#2,325 |
| 36. | Brook Highland | 2.6% | 0.90%(+1.68)#36 | 1.2%(+1.39)#2,376 |
| 37. | Trafford | 2.5% | 0.90%(+1.65)#37 | 1.2%(+1.36)#2,407 |
| 38. | Pleasant Groves | 2.5% | 0.90%(+1.59)#38 | 1.2%(+1.31)#2,454 |
| 39. | Satsuma | 2.4% | 0.90%(+1.53)#39 | 1.2%(+1.25)#2,538 |
| 40. | Kinston | 2.3% | 0.90%(+1.45)#40 | 1.2%(+1.17)#2,656 |
| 41. | Samson | 2.3% | 0.90%(+1.43)#41 | 1.2%(+1.14)#2,685 |
| 42. | Guntersville | 2.2% | 0.90%(+1.34)#42 | 1.2%(+1.05)#2,813 |
| 43. | Evergreen | 2.2% | 0.90%(+1.34)#43 | 1.2%(+1.05)#2,819 |
| 44. | West Jefferson | 2.2% | 0.90%(+1.33)#44 | 1.2%(+1.04)#2,842 |
| 45. | Langston | 2.2% | 0.90%(+1.25)#45 | 1.2%(+0.967)#2,961 |
| 46. | Trussville | 2.1% | 0.90%(+1.24)#46 | 1.2%(+0.957)#2,977 |
| 47. | Daviston | 2.1% | 0.90%(+1.23)#47 | 1.2%(+0.944)#2,991 |
| 48. | Brookside | 2.0% | 0.90%(+1.09)#48 | 1.2%(+0.800)#3,245 |
| 49. | Indian Springs Village | 1.9% | 0.90%(+1.02)#49 | 1.2%(+0.730)#3,372 |
| 50. | Phenix City | 1.9% | 0.90%(+1.02)#50 | 1.2%(+0.729)#3,378 |
| 51. | Daphne | 1.9% | 0.90%(+0.979)#51 | 1.2%(+0.692)#3,467 |
| 52. | Muscle Shoals | 1.8% | 0.90%(+0.896)#52 | 1.2%(+0.609)#3,664 |
| 53. | Glencoe | 1.7% | 0.90%(+0.833)#53 | 1.2%(+0.546)#3,801 |
| 54. | Pelham | 1.7% | 0.90%(+0.812)#54 | 1.2%(+0.525)#3,868 |
| 55. | Eagle Point | 1.7% | 0.90%(+0.785)#55 | 1.2%(+0.498)#3,932 |
| 56. | Pinson | 1.6% | 0.90%(+0.693)#56 | 1.2%(+0.406)#4,145 |
| 57. | Moulton | 1.6% | 0.90%(+0.671)#57 | 1.2%(+0.384)#4,201 |
| 58. | Orange Beach | 1.5% | 0.90%(+0.649)#58 | 1.2%(+0.362)#4,272 |
| 59. | Birmingham | 1.5% | 0.90%(+0.647)#59 | 1.2%(+0.360)#4,275 |
| 60. | Cordova | 1.5% | 0.90%(+0.613)#60 | 1.2%(+0.326)#4,379 |
| 61. | Andalusia | 1.5% | 0.90%(+0.596)#61 | 1.2%(+0.309)#4,427 |
| 62. | Hoover | 1.5% | 0.90%(+0.572)#62 | 1.2%(+0.285)#4,523 |
| 63. | Holtville | 1.4% | 0.90%(+0.546)#63 | 1.2%(+0.259)#4,605 |
| 64. | Level Plains | 1.4% | 0.90%(+0.525)#64 | 1.2%(+0.239)#4,671 |
| 65. | Tuscumbia | 1.4% | 0.90%(+0.501)#65 | 1.2%(+0.214)#4,753 |
| 66. | Demopolis | 1.4% | 0.90%(+0.484)#66 | 1.2%(+0.197)#4,804 |
| 67. | Stapleton | 1.4% | 0.90%(+0.480)#67 | 1.2%(+0.194)#4,816 |
| 68. | Newville | 1.4% | 0.90%(+0.473)#68 | 1.2%(+0.186)#4,836 |
| 69. | Shorter | 1.4% | 0.90%(+0.473)#69 | 1.2%(+0.186)#4,838 |
| 70. | Grayson Valley | 1.4% | 0.90%(+0.462)#70 | 1.2%(+0.175)#4,872 |
| 71. | Sardis City | 1.3% | 0.90%(+0.444)#71 | 1.2%(+0.158)#4,929 |
| 72. | Luverne | 1.3% | 0.90%(+0.399)#72 | 1.2%(+0.112)#5,076 |
| 73. | Mobile | 1.3% | 0.90%(+0.390)#73 | 1.2%(+0.103)#5,103 |
| 74. | Calera | 1.3% | 0.90%(+0.370)#74 | 1.2%(+0.083)#5,177 |
| 75. | Irondale | 1.3% | 0.90%(+0.367)#75 | 1.2%(+0.080)#5,196 |
| 76. | Monroeville | 1.3% | 0.90%(+0.361)#76 | 1.2%(+0.074)#5,222 |
| 77. | Montgomery | 1.3% | 0.90%(+0.356)#77 | 1.2%(+0.069)#5,242 |
| 78. | Spanish Fort | 1.2% | 0.90%(+0.352)#78 | 1.2%(+0.066)#5,263 |
| 79. | Semmes | 1.2% | 0.90%(+0.337)#79 | 1.2%(+0.050)#5,312 |
| 80. | Locust Fork | 1.2% | 0.90%(+0.318)#80 | 1.2%(+0.031)#5,402 |
| 81. | Alabaster | 1.2% | 0.90%(+0.317)#81 | 1.2%(+0.031)#5,403 |
| 82. | Lake View | 1.2% | 0.90%(+0.312)#82 | 1.2%(+0.026)#5,424 |
| 83. | Emerald Mountain | 1.2% | 0.90%(+0.290)#83 | 1.2%(+0.004)#5,507 |
| 84. | Louisville | 1.2% | 0.90%(+0.286)#84 | 1.2%(-0.000)#5,519 |
| 85. | Leeds | 1.2% | 0.90%(+0.272)#85 | 1.2%(-0.015)#5,573 |
| 86. | Magnolia Springs | 1.2% | 0.90%(+0.258)#86 | 1.2%(-0.029)#5,629 |
| 87. | Berry | 1.1% | 0.90%(+0.230)#87 | 1.2%(-0.057)#5,746 |
| 88. | Meridianville | 1.1% | 0.90%(+0.213)#88 | 1.2%(-0.074)#5,828 |
| 89. | Centre | 1.1% | 0.90%(+0.189)#89 | 1.2%(-0.098)#5,941 |
| 90. | Choccolocco | 1.1% | 0.90%(+0.173)#90 | 1.2%(-0.114)#6,011 |
| 91. | Warrior | 1.1% | 0.90%(+0.173)#91 | 1.2%(-0.114)#6,012 |
| 92. | Dauphin Island | 1.1% | 0.90%(+0.170)#92 | 1.2%(-0.117)#6,025 |
| 93. | Sylvan Springs | 1.0% | 0.90%(+0.136)#93 | 1.2%(-0.151)#6,203 |
| 94. | Leighton | 1.0% | 0.90%(+0.120)#94 | 1.2%(-0.167)#6,287 |
| 95. | Cullman | 1.0% | 0.90%(+0.113)#95 | 1.2%(-0.173)#6,320 |
| 96. | Prattville | 1.0% | 0.90%(+0.111)#96 | 1.2%(-0.176)#6,335 |
| 97. | Madison | 0.99% | 0.90%(+0.090)#97 | 1.2%(-0.196)#6,431 |
| 98. | Section | 0.98% | 0.90%(+0.087)#98 | 1.2%(-0.200)#6,447 |
| 99. | Wilton | 0.98% | 0.90%(+0.080)#99 | 1.2%(-0.207)#6,486 |
| 100. | Maytown | 0.96% | 0.90%(+0.065)#100 | 1.2%(-0.222)#6,559 |
Common Questions
What are the Top 10 Cities with the Highest Percentage of Population Employed in Legal Services & Support in Alabama?
Top 10 Cities with the Highest Percentage of Population Employed in Legal Services & Support in Alabama are:
#1
19.1%
#2
15.8%
#3
15.4%
#4
12.9%
#5
11.8%
#6
10.0%
#7
8.2%
#8
7.7%
#9
7.5%
#10
6.0%
What city has the Highest Percentage of Population Employed in Legal Services & Support in Alabama?
Point Clear has the Highest Percentage of Population Employed in Legal Services & Support in Alabama with 19.1%.
What is the Percentage of Population Employed in Legal Services & Support in the State of Alabama?
Percentage of Population Employed in Legal Services & Support in Alabama is 0.90%.
What is the Percentage of Population Employed in Legal Services & Support in the United States?
Percentage of Population Employed in Legal Services & Support in the United States is 1.2%.