South Pasadena, CA Map & Demographics
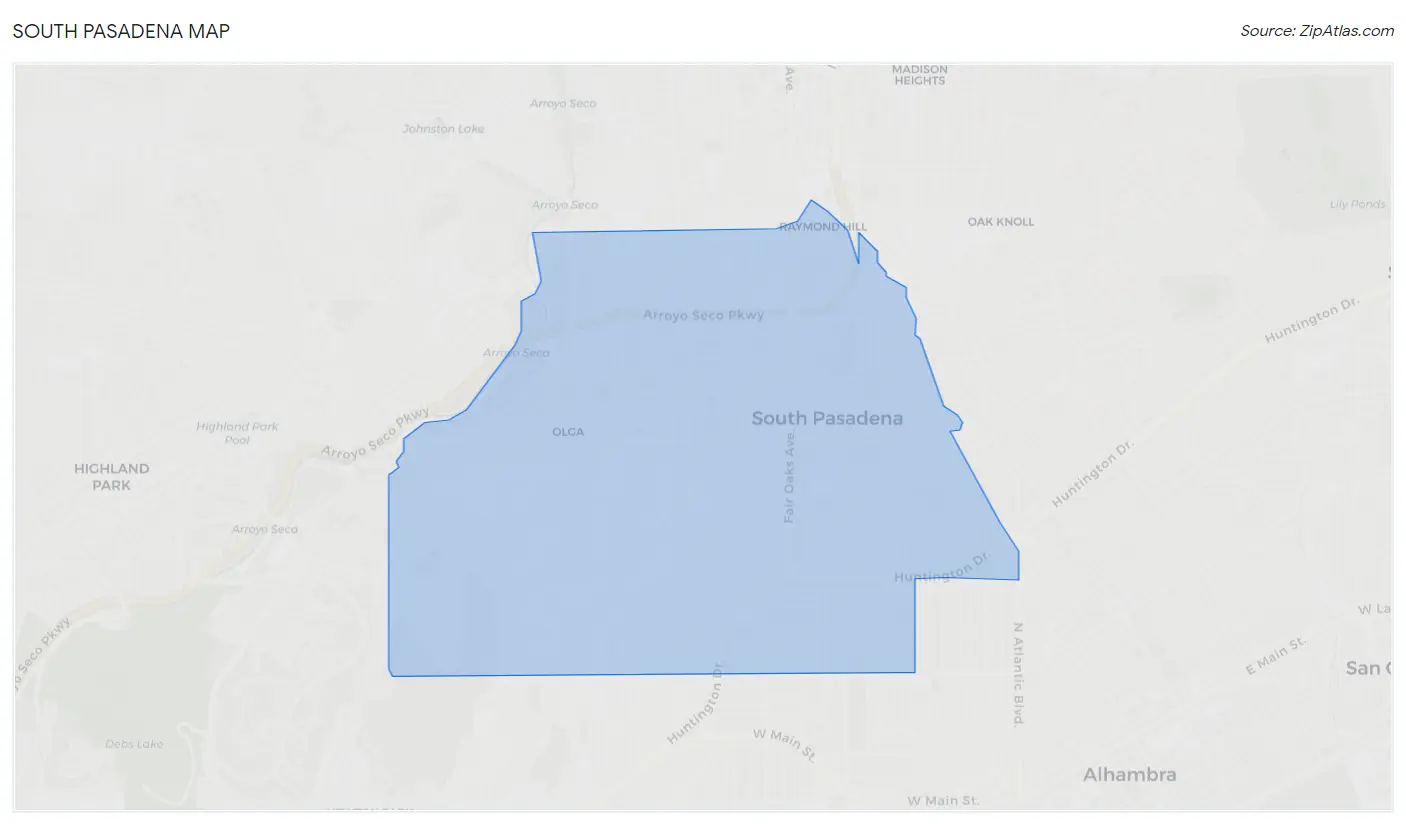
South Pasadena Map
South Pasadena Overview
$71,865
PER CAPITA INCOME
$170,366
AVG FAMILY INCOME
$127,882
AVG HOUSEHOLD INCOME
28.0%
WAGE / INCOME GAP [ % ]
72.0¢/ $1
WAGE / INCOME GAP [ $ ]
0.47
INEQUALITY / GINI INDEX
26,583
TOTAL POPULATION
13,299
MALE POPULATION
13,284
FEMALE POPULATION
100.11
MALES / 100 FEMALES
99.89
FEMALES / 100 MALES
40.6
MEDIAN AGE
3.2
AVG FAMILY SIZE
2.6
AVG HOUSEHOLD SIZE
14,713
LABOR FORCE [ PEOPLE ]
69.9%
PERCENT IN LABOR FORCE
5.2%
UNEMPLOYMENT RATE
South Pasadena Zip Codes
Income in South Pasadena
Income Overview in South Pasadena
Per Capita Income in South Pasadena is $71,865, while median incomes of families and households are $170,366 and $127,882 respectively.
| Characteristic | Number | Measure |
| Per Capita Income | 26,583 | $71,865 |
| Median Family Income | 6,805 | $170,366 |
| Mean Family Income | 6,805 | $225,187 |
| Median Household Income | 10,274 | $127,882 |
| Mean Household Income | 10,274 | $182,067 |
| Income Deficit | 6,805 | $0 |
| Wage / Income Gap (%) | 26,583 | 28.03% |
| Wage / Income Gap ($) | 26,583 | 71.97¢ per $1 |
| Gini / Inequality Index | 26,583 | 0.47 |
Earnings by Sex in South Pasadena
Average Earnings in South Pasadena are $76,886, $94,358 for men and $67,914 for women, a difference of 28.0%.
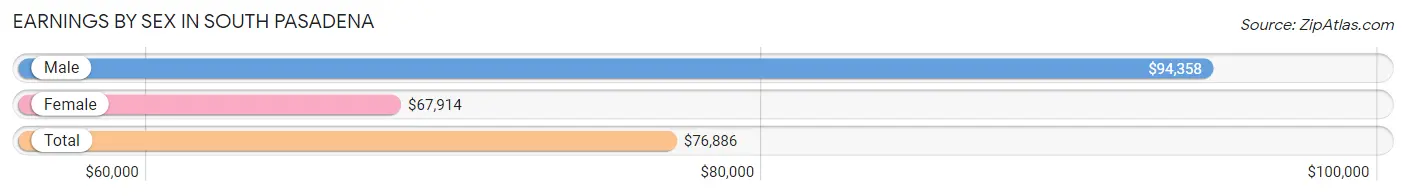
| Sex | Number | Average Earnings |
| Male | 7,979 (52.7%) | $94,358 |
| Female | 7,160 (47.3%) | $67,914 |
| Total | 15,139 (100.0%) | $76,886 |
Earnings by Sex by Income Bracket in South Pasadena
The most common earnings brackets in South Pasadena are $100,000+ for men (3,700 | 46.4%) and $100,000+ for women (2,197 | 30.7%).
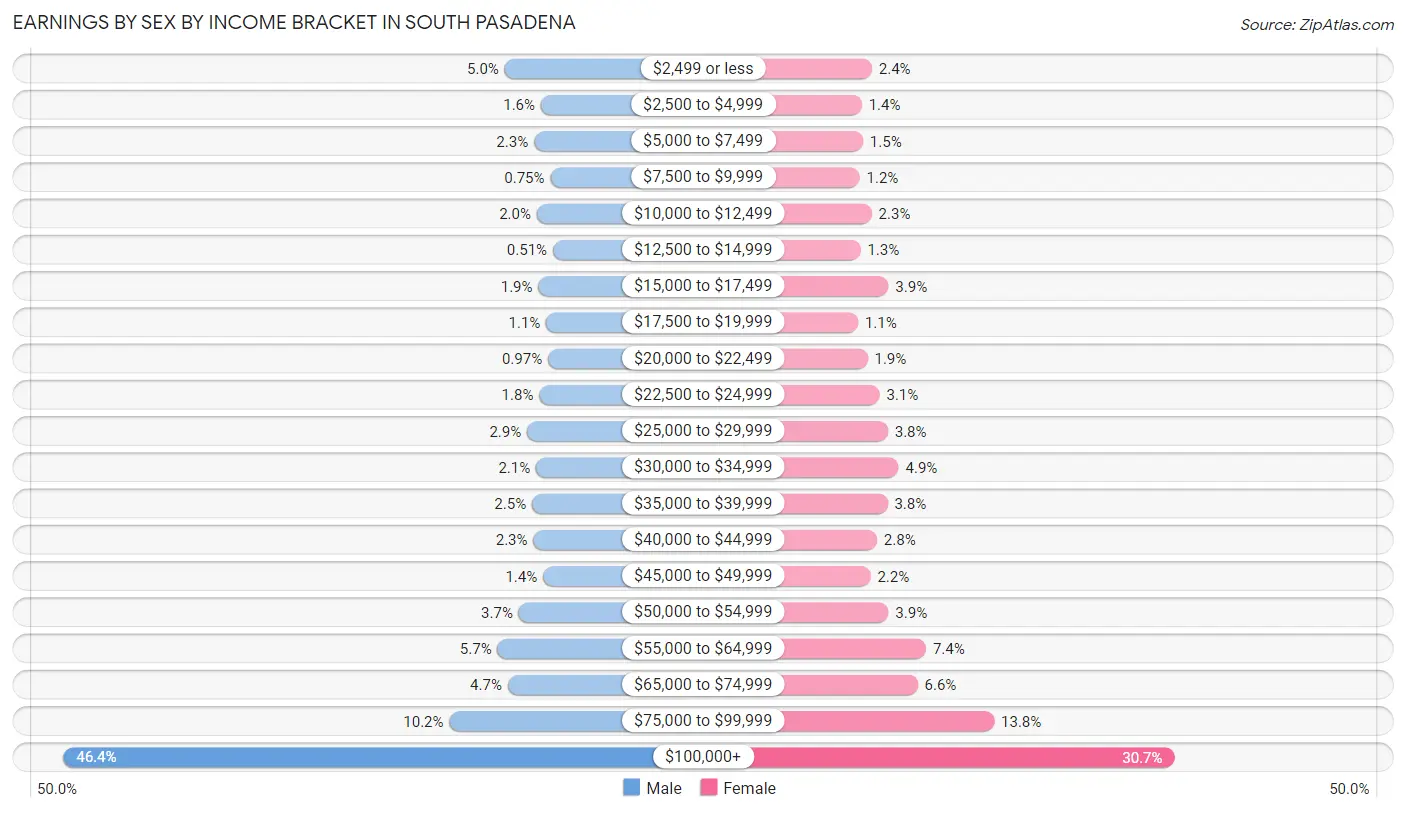
| Income | Male | Female |
| $2,499 or less | 401 (5.0%) | 168 (2.4%) |
| $2,500 to $4,999 | 131 (1.6%) | 100 (1.4%) |
| $5,000 to $7,499 | 182 (2.3%) | 108 (1.5%) |
| $7,500 to $9,999 | 60 (0.7%) | 86 (1.2%) |
| $10,000 to $12,499 | 161 (2.0%) | 167 (2.3%) |
| $12,500 to $14,999 | 41 (0.5%) | 92 (1.3%) |
| $15,000 to $17,499 | 149 (1.9%) | 279 (3.9%) |
| $17,500 to $19,999 | 91 (1.1%) | 75 (1.1%) |
| $20,000 to $22,499 | 77 (1.0%) | 139 (1.9%) |
| $22,500 to $24,999 | 143 (1.8%) | 220 (3.1%) |
| $25,000 to $29,999 | 234 (2.9%) | 275 (3.8%) |
| $30,000 to $34,999 | 167 (2.1%) | 347 (4.9%) |
| $35,000 to $39,999 | 197 (2.5%) | 273 (3.8%) |
| $40,000 to $44,999 | 187 (2.3%) | 202 (2.8%) |
| $45,000 to $49,999 | 114 (1.4%) | 159 (2.2%) |
| $50,000 to $54,999 | 296 (3.7%) | 279 (3.9%) |
| $55,000 to $64,999 | 455 (5.7%) | 531 (7.4%) |
| $65,000 to $74,999 | 378 (4.7%) | 475 (6.6%) |
| $75,000 to $99,999 | 815 (10.2%) | 988 (13.8%) |
| $100,000+ | 3,700 (46.4%) | 2,197 (30.7%) |
| Total | 7,979 (100.0%) | 7,160 (100.0%) |
Earnings by Sex by Educational Attainment in South Pasadena
Average earnings in South Pasadena are $99,143 for men and $69,731 for women, a difference of 29.7%. Men with an educational attainment of graduate degree enjoy the highest average annual earnings of $128,929, while those with college or associate's degree education earn the least with $50,147. Women with an educational attainment of graduate degree earn the most with the average annual earnings of $100,516, while those with less than high school education have the smallest earnings of $29,271.
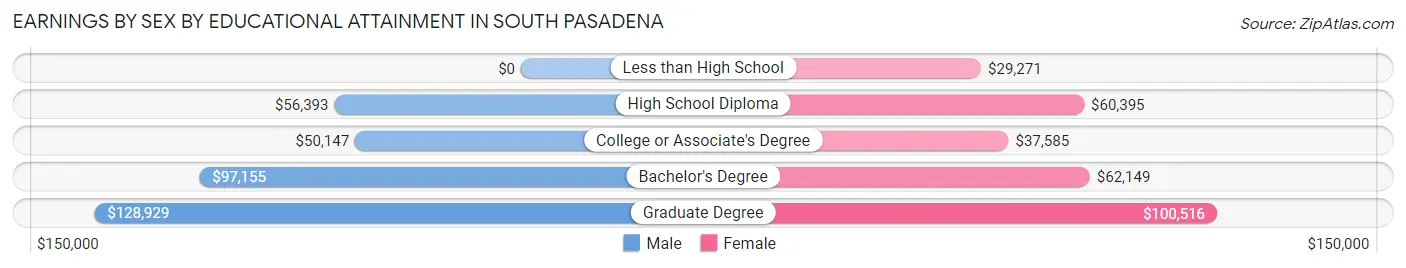
| Educational Attainment | Male Income | Female Income |
| Less than High School | - | - |
| High School Diploma | $56,393 | $60,395 |
| College or Associate's Degree | $50,147 | $37,585 |
| Bachelor's Degree | $97,155 | $62,149 |
| Graduate Degree | $128,929 | $100,516 |
| Total | $99,143 | $69,731 |
Family Income in South Pasadena
Family Income Brackets in South Pasadena
According to the South Pasadena family income data, there are 2,640 families falling into the $200,000+ income range, which is the most common income bracket and makes up 38.8% of all families. Conversely, the $15,000 to $24,999 income bracket is the least frequent group with only 61 families (0.9%) belonging to this category.
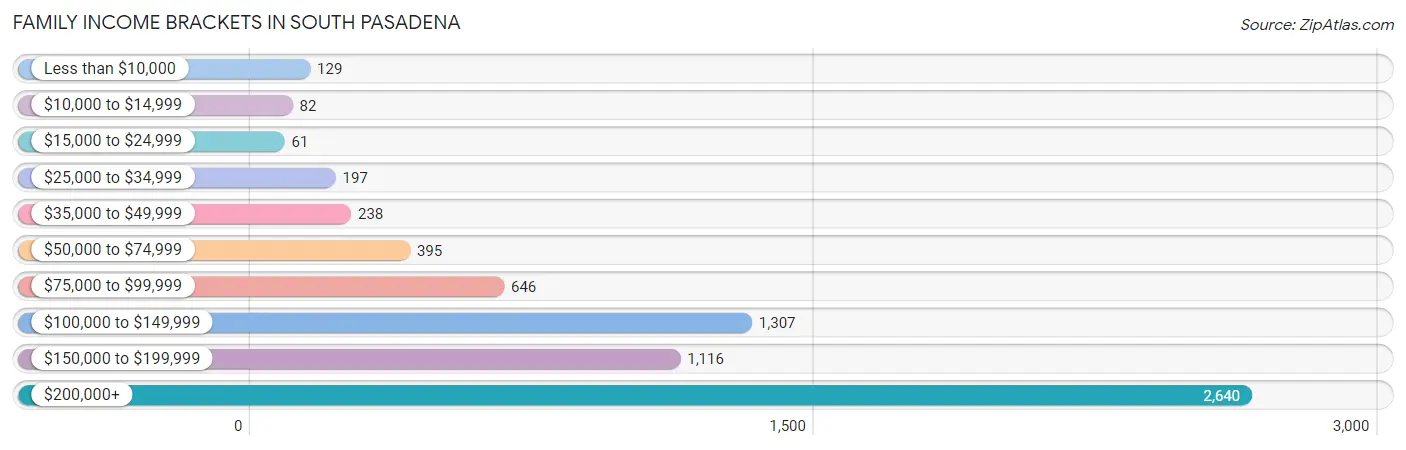
| Income Bracket | # Families | % Families |
| Less than $10,000 | 129 | 1.9% |
| $10,000 to $14,999 | 82 | 1.2% |
| $15,000 to $24,999 | 61 | 0.9% |
| $25,000 to $34,999 | 197 | 2.9% |
| $35,000 to $49,999 | 238 | 3.5% |
| $50,000 to $74,999 | 395 | 5.8% |
| $75,000 to $99,999 | 646 | 9.5% |
| $100,000 to $149,999 | 1,307 | 19.2% |
| $150,000 to $199,999 | 1,116 | 16.4% |
| $200,000+ | 2,640 | 38.8% |
Family Income by Famaliy Size in South Pasadena
5-person families (423 | 6.2%) account for the highest median family income in South Pasadena with $250,001 per family, while 2-person families (2,614 | 38.4%) have the highest median income of $66,666 per family member.
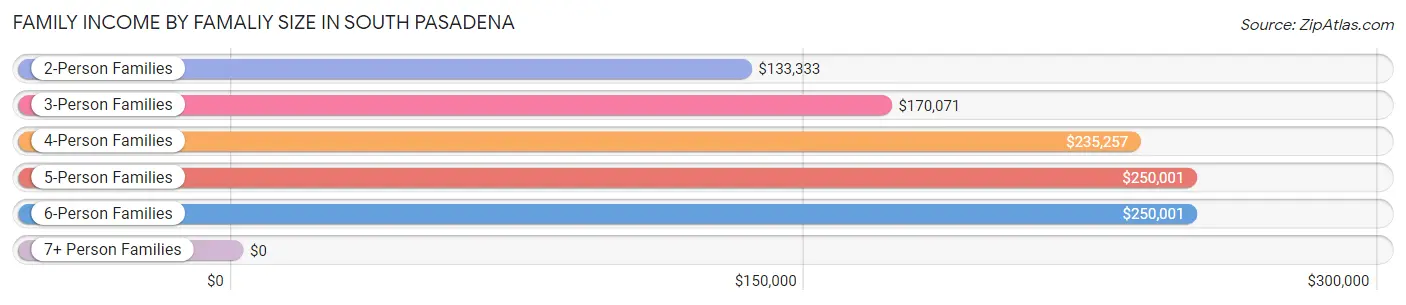
| Income Bracket | # Families | Median Income |
| 2-Person Families | 2,614 (38.4%) | $133,333 |
| 3-Person Families | 2,018 (29.6%) | $170,071 |
| 4-Person Families | 1,689 (24.8%) | $235,257 |
| 5-Person Families | 423 (6.2%) | $250,001 |
| 6-Person Families | 52 (0.8%) | $250,001 |
| 7+ Person Families | 9 (0.1%) | $0 |
| Total | 6,805 (100.0%) | $170,366 |
Family Income by Number of Earners in South Pasadena
The median family income in South Pasadena is $170,366, with families comprising 3+ earners (720) having the highest median family income of $198,017, while families with no earners (614) have the lowest median family income of $70,147, accounting for 10.6% and 9.0% of families, respectively.
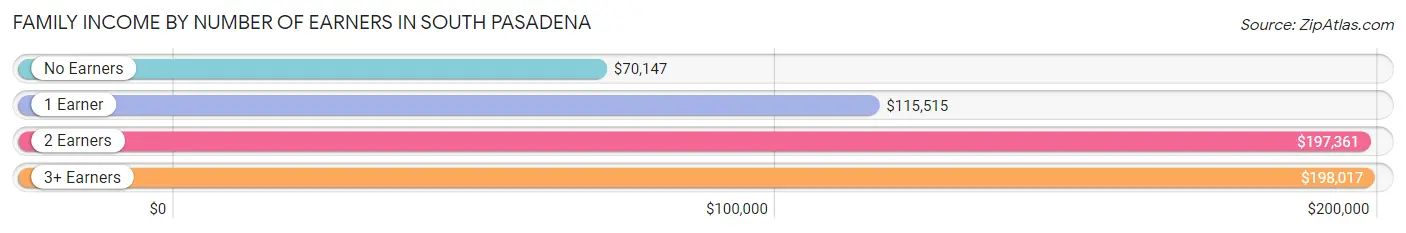
| Number of Earners | # Families | Median Income |
| No Earners | 614 (9.0%) | $70,147 |
| 1 Earner | 2,086 (30.6%) | $115,515 |
| 2 Earners | 3,385 (49.7%) | $197,361 |
| 3+ Earners | 720 (10.6%) | $198,017 |
| Total | 6,805 (100.0%) | $170,366 |
Household Income in South Pasadena
Household Income Brackets in South Pasadena
With 2,836 households falling in the category, the $200,000+ income range is the most frequent in South Pasadena, accounting for 27.6% of all households. In contrast, only 175 households (1.7%) fall into the $10,000 to $14,999 income bracket, making it the least populous group.
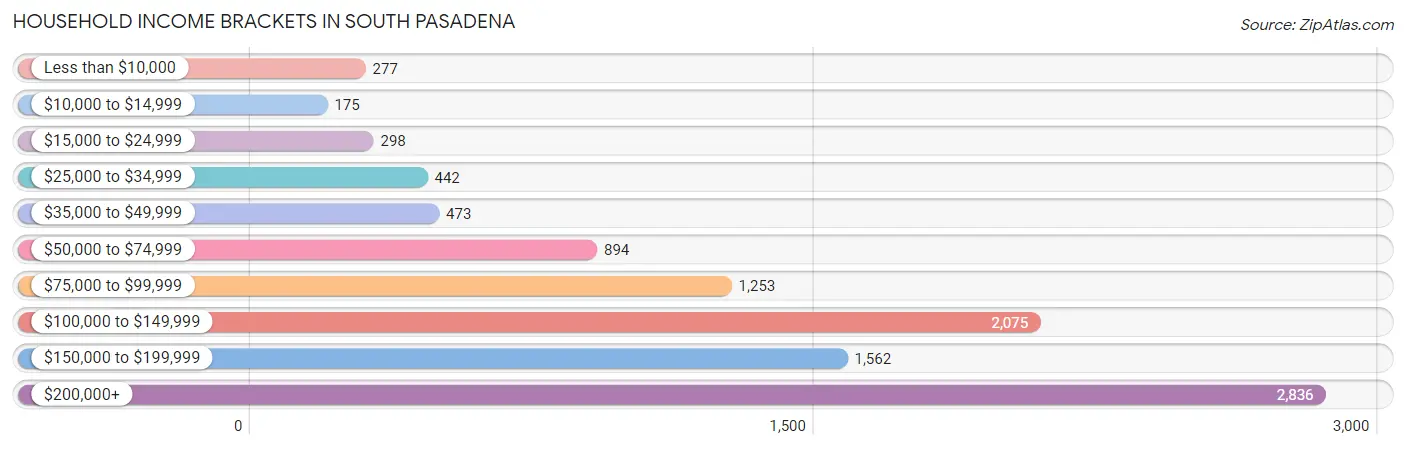
| Income Bracket | # Households | % Households |
| Less than $10,000 | 277 | 2.7% |
| $10,000 to $14,999 | 175 | 1.7% |
| $15,000 to $24,999 | 298 | 2.9% |
| $25,000 to $34,999 | 442 | 4.3% |
| $35,000 to $49,999 | 473 | 4.6% |
| $50,000 to $74,999 | 894 | 8.7% |
| $75,000 to $99,999 | 1,253 | 12.2% |
| $100,000 to $149,999 | 2,075 | 20.2% |
| $150,000 to $199,999 | 1,562 | 15.2% |
| $200,000+ | 2,836 | 27.6% |
Household Income by Householder Age in South Pasadena
The median household income in South Pasadena is $127,882, with the highest median household income of $160,303 found in the 45 to 64 years age bracket for the primary householder. A total of 4,246 households (41.3%) fall into this category. Meanwhile, the 15 to 24 years age bracket for the primary householder has the lowest median household income of $63,975, with 103 households (1.0%) in this group.
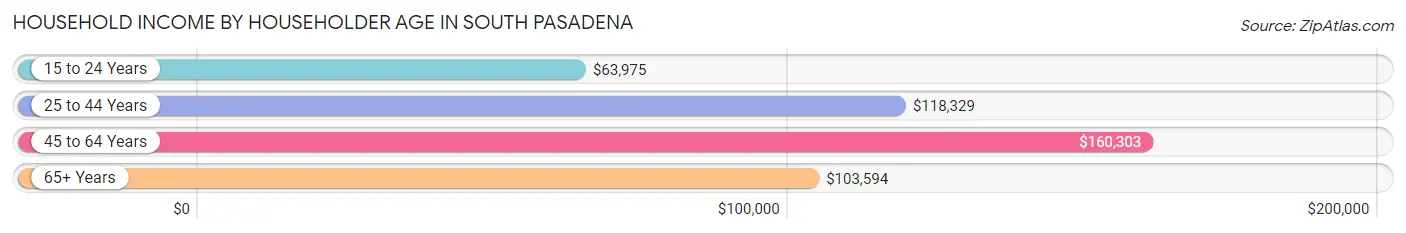
| Income Bracket | # Households | Median Income |
| 15 to 24 Years | 103 (1.0%) | $63,975 |
| 25 to 44 Years | 3,825 (37.2%) | $118,329 |
| 45 to 64 Years | 4,246 (41.3%) | $160,303 |
| 65+ Years | 2,100 (20.4%) | $103,594 |
| Total | 10,274 (100.0%) | $127,882 |
Poverty in South Pasadena
Income Below Poverty by Sex and Age in South Pasadena
With 4.6% poverty level for males and 5.0% for females among the residents of South Pasadena, 15 year old males and 25 to 34 year old females are the most vulnerable to poverty, with 26 males (13.5%) and 216 females (12.4%) in their respective age groups living below the poverty level.
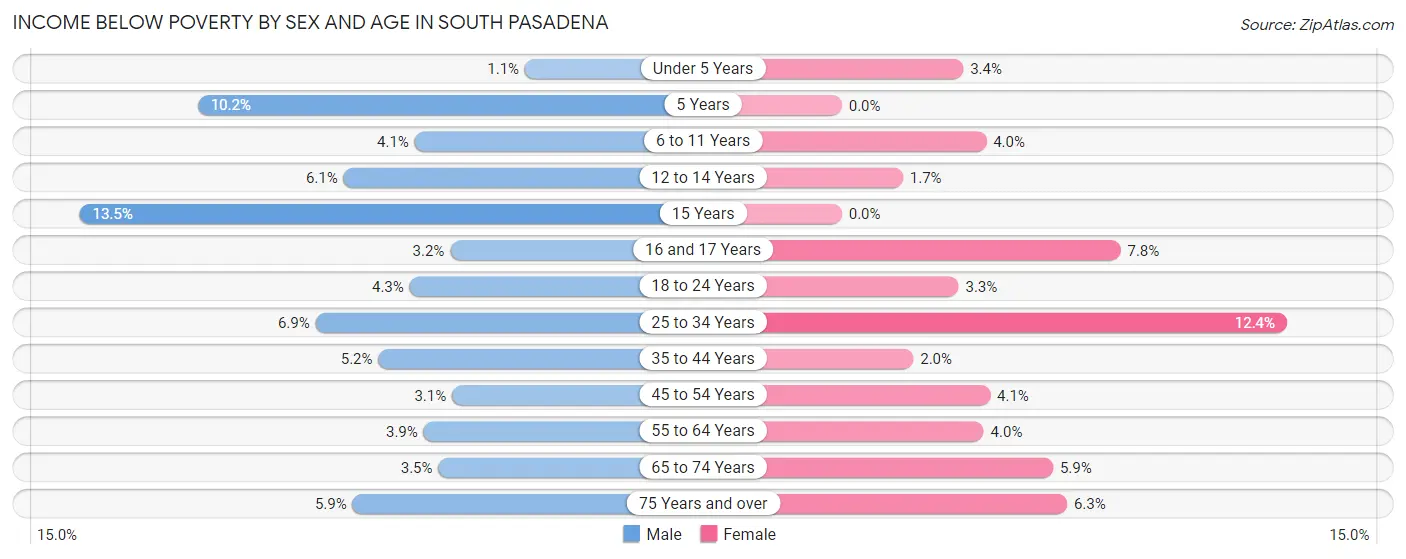
| Age Bracket | Male | Female |
| Under 5 Years | 10 (1.1%) | 21 (3.4%) |
| 5 Years | 17 (10.2%) | 0 (0.0%) |
| 6 to 11 Years | 46 (4.1%) | 40 (4.0%) |
| 12 to 14 Years | 41 (6.1%) | 9 (1.7%) |
| 15 Years | 26 (13.5%) | 0 (0.0%) |
| 16 and 17 Years | 8 (3.2%) | 27 (7.8%) |
| 18 to 24 Years | 34 (4.3%) | 16 (3.3%) |
| 25 to 34 Years | 102 (6.9%) | 216 (12.4%) |
| 35 to 44 Years | 132 (5.1%) | 45 (2.0%) |
| 45 to 54 Years | 61 (3.1%) | 98 (4.1%) |
| 55 to 64 Years | 57 (3.9%) | 56 (4.0%) |
| 65 to 74 Years | 35 (3.5%) | 69 (5.9%) |
| 75 Years and over | 37 (5.9%) | 59 (6.3%) |
| Total | 606 (4.6%) | 656 (5.0%) |
Income Above Poverty by Sex and Age in South Pasadena
According to the poverty statistics in South Pasadena, males aged under 5 years and females aged 5 years are the age groups that are most secure financially, with 98.9% of males and 100.0% of females in these age groups living above the poverty line.
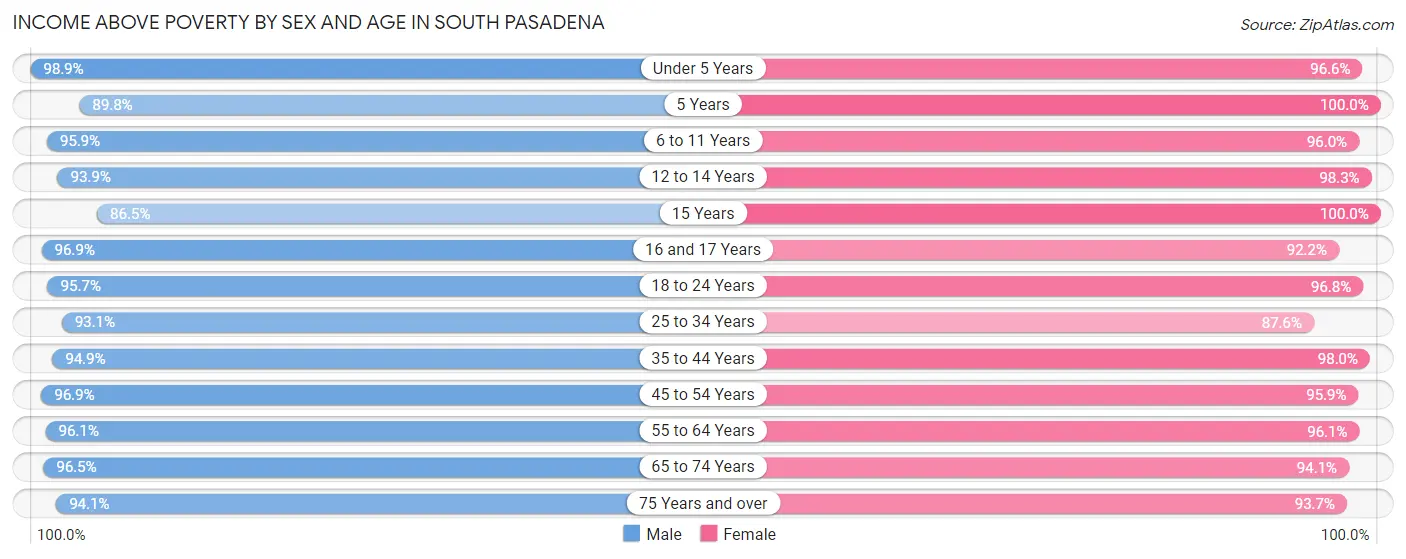
| Age Bracket | Male | Female |
| Under 5 Years | 925 (98.9%) | 600 (96.6%) |
| 5 Years | 150 (89.8%) | 168 (100.0%) |
| 6 to 11 Years | 1,066 (95.9%) | 956 (96.0%) |
| 12 to 14 Years | 629 (93.9%) | 520 (98.3%) |
| 15 Years | 167 (86.5%) | 121 (100.0%) |
| 16 and 17 Years | 246 (96.9%) | 321 (92.2%) |
| 18 to 24 Years | 760 (95.7%) | 477 (96.8%) |
| 25 to 34 Years | 1,377 (93.1%) | 1,527 (87.6%) |
| 35 to 44 Years | 2,433 (94.9%) | 2,219 (98.0%) |
| 45 to 54 Years | 1,905 (96.9%) | 2,273 (95.9%) |
| 55 to 64 Years | 1,407 (96.1%) | 1,363 (96.1%) |
| 65 to 74 Years | 971 (96.5%) | 1,105 (94.1%) |
| 75 Years and over | 593 (94.1%) | 882 (93.7%) |
| Total | 12,629 (95.4%) | 12,532 (95.0%) |
Income Below Poverty Among Married-Couple Families in South Pasadena
The poverty statistics for married-couple families in South Pasadena show that 2.1% or 115 of the total 5,346 families live below the poverty line. Families with 3 or 4 children have the highest poverty rate of 3.7%, comprising of 11 families. On the other hand, families with 1 or 2 children have the lowest poverty rate of 1.7%, which includes 39 families.
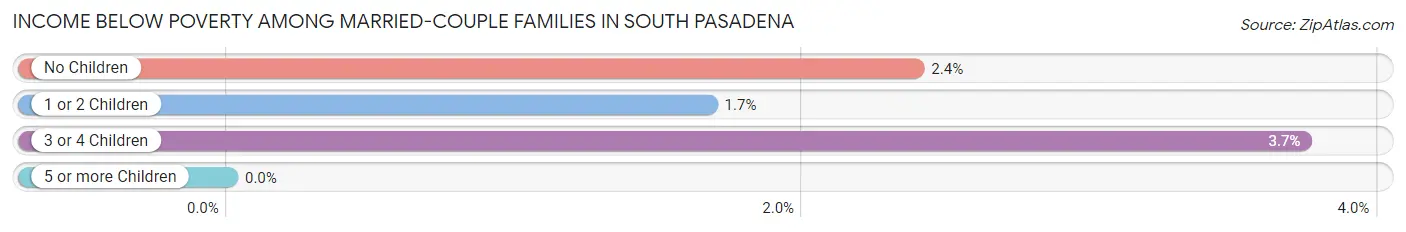
| Children | Above Poverty | Below Poverty |
| No Children | 2,650 (97.6%) | 65 (2.4%) |
| 1 or 2 Children | 2,298 (98.3%) | 39 (1.7%) |
| 3 or 4 Children | 283 (96.3%) | 11 (3.7%) |
| 5 or more Children | 0 (0.0%) | 0 (0.0%) |
| Total | 5,231 (97.9%) | 115 (2.1%) |
Income Below Poverty Among Single-Parent Households in South Pasadena
According to the poverty data in South Pasadena, 7.6% or 34 single-father households and 8.2% or 83 single-mother households are living below the poverty line. Among single-father households, those with 1 or 2 children have the highest poverty rate, with 34 households (15.9%) experiencing poverty. Likewise, among single-mother households, those with 1 or 2 children have the highest poverty rate, with 63 households (11.1%) falling below the poverty line.
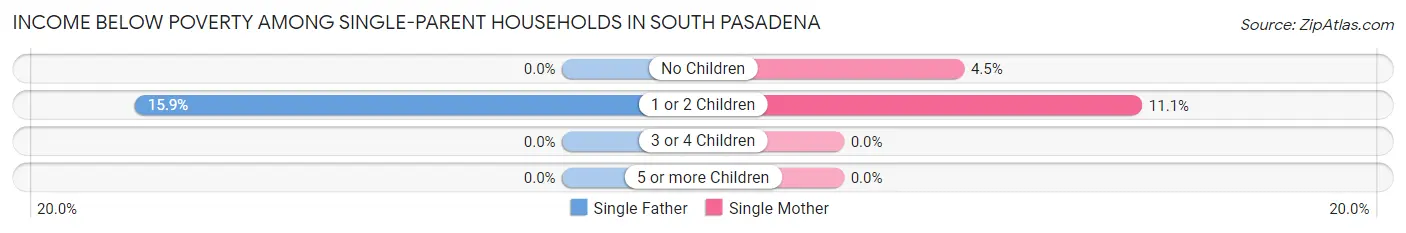
| Children | Single Father | Single Mother |
| No Children | 0 (0.0%) | 20 (4.5%) |
| 1 or 2 Children | 34 (15.9%) | 63 (11.1%) |
| 3 or 4 Children | 0 (0.0%) | 0 (0.0%) |
| 5 or more Children | 0 (0.0%) | 0 (0.0%) |
| Total | 34 (7.6%) | 83 (8.2%) |
Income Below Poverty Among Married-Couple vs Single-Parent Households in South Pasadena
The poverty data for South Pasadena shows that 115 of the married-couple family households (2.1%) and 117 of the single-parent households (8.0%) are living below the poverty level. Within the married-couple family households, those with 3 or 4 children have the highest poverty rate, with 11 households (3.7%) falling below the poverty line. Among the single-parent households, those with 1 or 2 children have the highest poverty rate, with 97 household (12.4%) living below poverty.
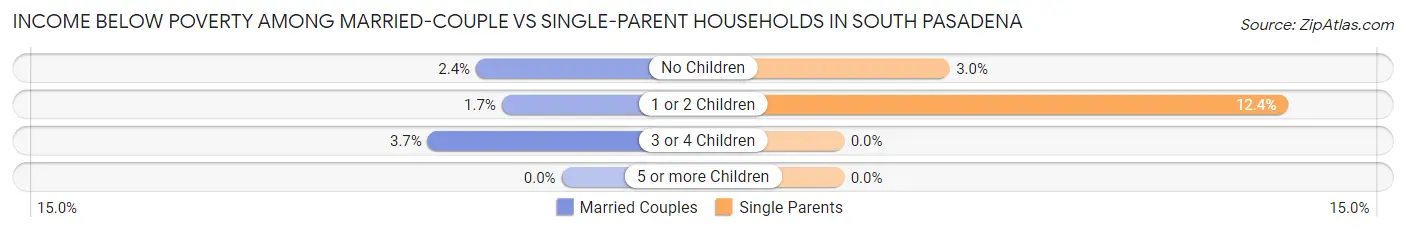
| Children | Married-Couple Families | Single-Parent Households |
| No Children | 65 (2.4%) | 20 (2.9%) |
| 1 or 2 Children | 39 (1.7%) | 97 (12.4%) |
| 3 or 4 Children | 11 (3.7%) | 0 (0.0%) |
| 5 or more Children | 0 (0.0%) | 0 (0.0%) |
| Total | 115 (2.1%) | 117 (8.0%) |
Race in South Pasadena
The most populous races in South Pasadena are White / Caucasian (11,970 | 45.0%), Asian (8,824 | 33.2%), and Hispanic or Latino (4,828 | 18.2%).
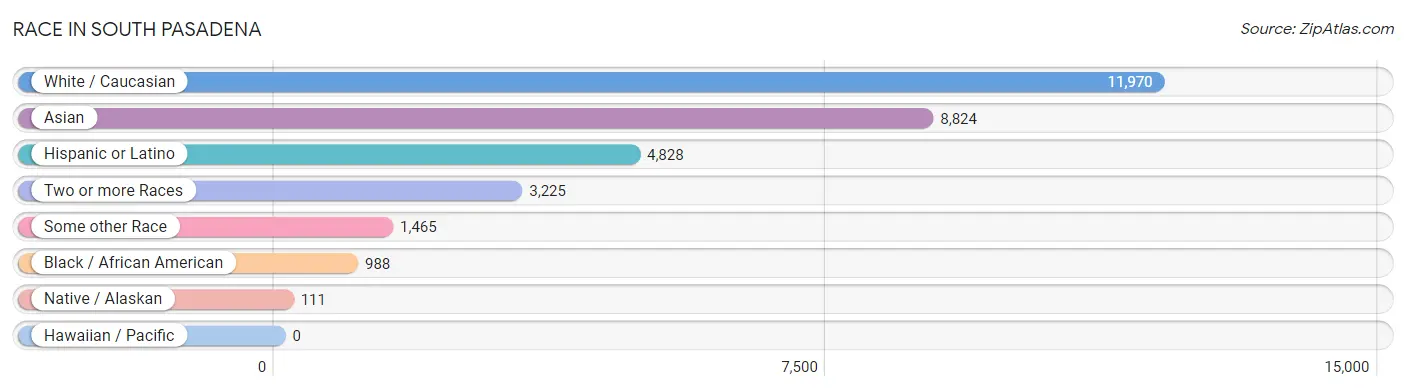
| Race | # Population | % Population |
| Asian | 8,824 | 33.2% |
| Black / African American | 988 | 3.7% |
| Hawaiian / Pacific | 0 | 0.0% |
| Hispanic or Latino | 4,828 | 18.2% |
| Native / Alaskan | 111 | 0.4% |
| White / Caucasian | 11,970 | 45.0% |
| Two or more Races | 3,225 | 12.1% |
| Some other Race | 1,465 | 5.5% |
| Total | 26,583 | 100.0% |
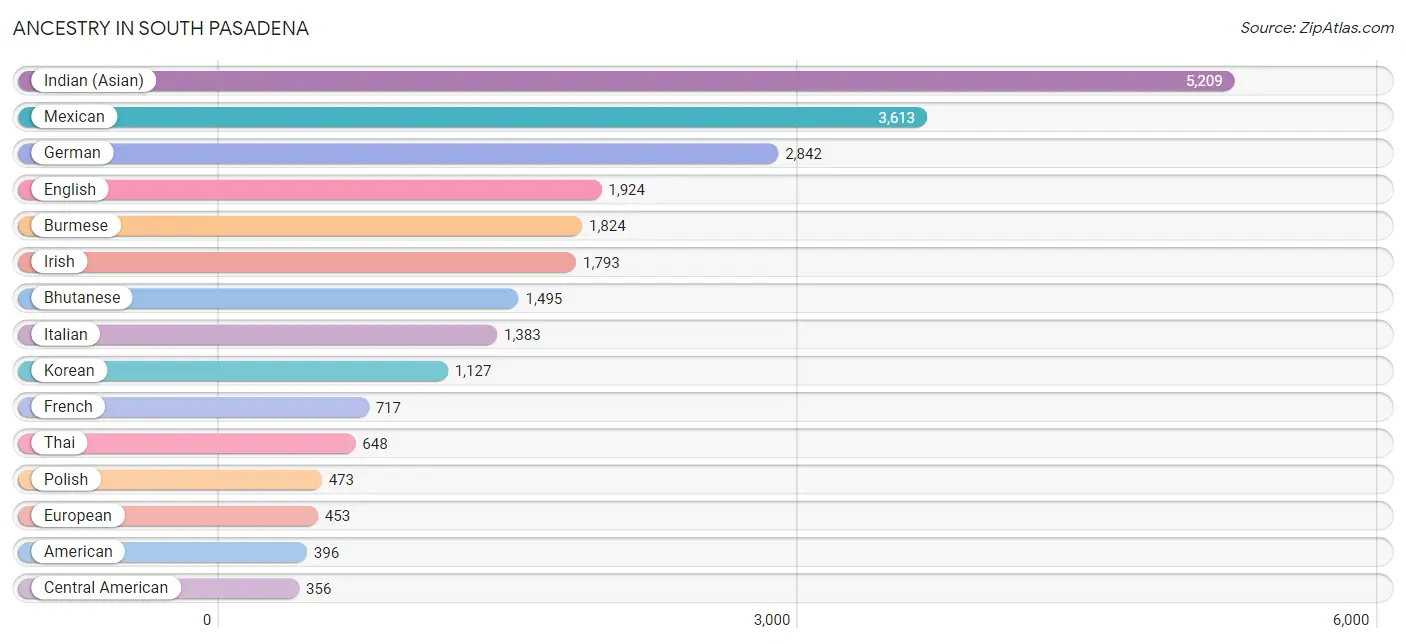
Ancestry in South Pasadena
The most populous ancestries reported in South Pasadena are Indian (Asian) (5,209 | 19.6%), Mexican (3,613 | 13.6%), German (2,842 | 10.7%), English (1,924 | 7.2%), and Burmese (1,824 | 6.9%), together accounting for 58.0% of all South Pasadena residents.
| Ancestry | # Population | % Population |
| American | 396 | 1.5% |
| Apache | 5 | 0.0% |
| Arab | 226 | 0.9% |
| Argentinean | 29 | 0.1% |
| Armenian | 78 | 0.3% |
| Australian | 43 | 0.2% |
| Austrian | 90 | 0.3% |
| Basque | 79 | 0.3% |
| Belgian | 46 | 0.2% |
| Bhutanese | 1,495 | 5.6% |
| British | 296 | 1.1% |
| Burmese | 1,824 | 6.9% |
| Canadian | 19 | 0.1% |
| Central American | 356 | 1.3% |
| Central American Indian | 47 | 0.2% |
| Cherokee | 77 | 0.3% |
| Chilean | 34 | 0.1% |
| Chinese | 14 | 0.1% |
| Colombian | 75 | 0.3% |
| Croatian | 11 | 0.0% |
| Cuban | 83 | 0.3% |
| Czech | 19 | 0.1% |
| Czechoslovakian | 29 | 0.1% |
| Danish | 86 | 0.3% |
| Dutch | 151 | 0.6% |
| Eastern European | 69 | 0.3% |
| Ecuadorian | 37 | 0.1% |
| English | 1,924 | 7.2% |
| Estonian | 19 | 0.1% |
| European | 453 | 1.7% |
| Filipino | 341 | 1.3% |
| Finnish | 84 | 0.3% |
| French | 717 | 2.7% |
| French American Indian | 17 | 0.1% |
| French Canadian | 158 | 0.6% |
| German | 2,842 | 10.7% |
| Greek | 126 | 0.5% |
| Guatemalan | 103 | 0.4% |
| Hopi | 3 | 0.0% |
| Hungarian | 94 | 0.4% |
| Indian (Asian) | 5,209 | 19.6% |
| Iranian | 167 | 0.6% |
| Iraqi | 66 | 0.3% |
| Irish | 1,793 | 6.7% |
| Italian | 1,383 | 5.2% |
| Jamaican | 22 | 0.1% |
| Japanese | 66 | 0.3% |
| Korean | 1,127 | 4.2% |
| Laotian | 25 | 0.1% |
| Latvian | 8 | 0.0% |
| Lebanese | 101 | 0.4% |
| Lithuanian | 41 | 0.2% |
| Mexican | 3,613 | 13.6% |
| Mexican American Indian | 76 | 0.3% |
| Native Hawaiian | 7 | 0.0% |
| Nicaraguan | 118 | 0.4% |
| Northern European | 46 | 0.2% |
| Norwegian | 179 | 0.7% |
| Okinawan | 26 | 0.1% |
| Pakistani | 131 | 0.5% |
| Palestinian | 103 | 0.4% |
| Peruvian | 36 | 0.1% |
| Polish | 473 | 1.8% |
| Portuguese | 146 | 0.5% |
| Puerto Rican | 96 | 0.4% |
| Romanian | 153 | 0.6% |
| Russian | 210 | 0.8% |
| Salvadoran | 135 | 0.5% |
| Samoan | 14 | 0.1% |
| Scandinavian | 40 | 0.2% |
| Scotch-Irish | 244 | 0.9% |
| Scottish | 321 | 1.2% |
| Serbian | 48 | 0.2% |
| Slavic | 38 | 0.1% |
| Slovak | 20 | 0.1% |
| South American | 211 | 0.8% |
| Spaniard | 156 | 0.6% |
| Spanish | 100 | 0.4% |
| Spanish American | 126 | 0.5% |
| Sri Lankan | 202 | 0.8% |
| Subsaharan African | 13 | 0.1% |
| Swedish | 334 | 1.3% |
| Swiss | 163 | 0.6% |
| Syrian | 22 | 0.1% |
| Thai | 648 | 2.4% |
| Trinidadian and Tobagonian | 13 | 0.1% |
| Turkish | 12 | 0.1% |
| Ukrainian | 130 | 0.5% |
| Welsh | 80 | 0.3% |
| West Indian | 12 | 0.1% |
| Yaqui | 35 | 0.1% |
| Yugoslavian | 22 | 0.1% | View All 92 Rows |
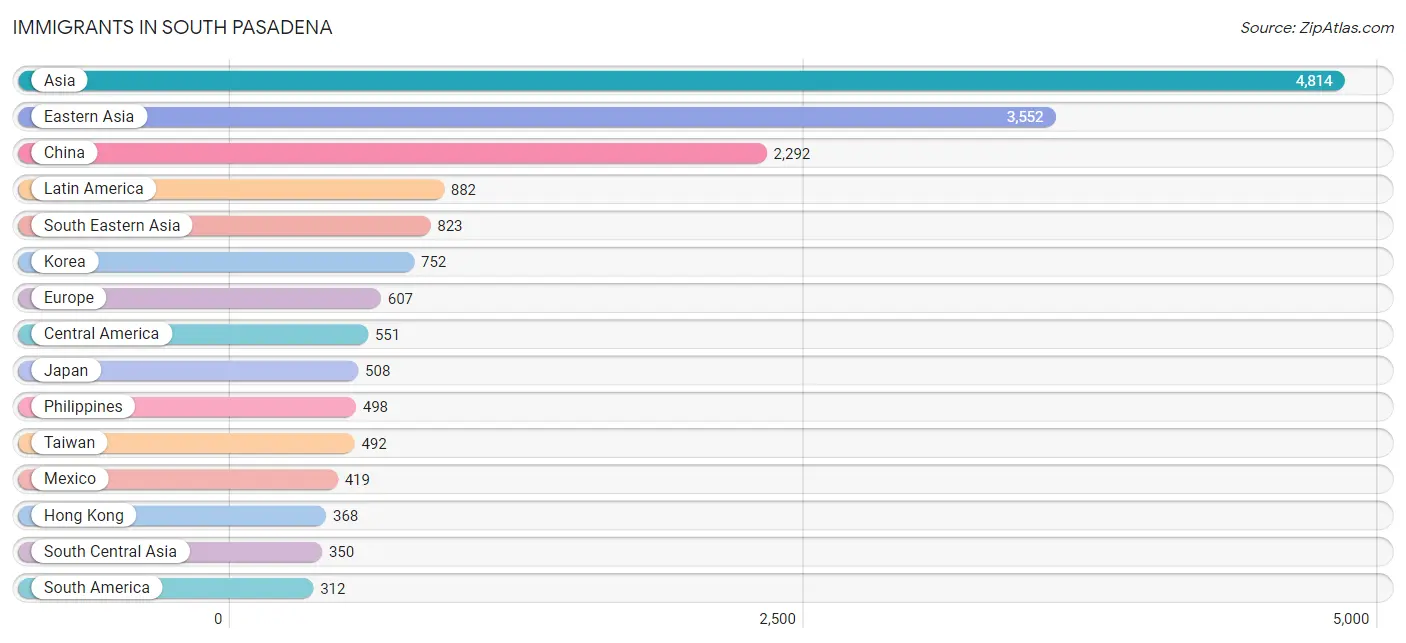
Immigrants in South Pasadena
The most numerous immigrant groups reported in South Pasadena came from Asia (4,814 | 18.1%), Eastern Asia (3,552 | 13.4%), China (2,292 | 8.6%), Latin America (882 | 3.3%), and South Eastern Asia (823 | 3.1%), together accounting for 46.5% of all South Pasadena residents.
| Immigration Origin | # Population | % Population |
| Africa | 12 | 0.1% |
| Argentina | 15 | 0.1% |
| Asia | 4,814 | 18.1% |
| Australia | 27 | 0.1% |
| Belgium | 69 | 0.3% |
| Brazil | 16 | 0.1% |
| Cambodia | 19 | 0.1% |
| Canada | 178 | 0.7% |
| Caribbean | 19 | 0.1% |
| Central America | 551 | 2.1% |
| Chile | 34 | 0.1% |
| China | 2,292 | 8.6% |
| Colombia | 20 | 0.1% |
| Croatia | 6 | 0.0% |
| Cuba | 9 | 0.0% |
| Czechoslovakia | 4 | 0.0% |
| Eastern Asia | 3,552 | 13.4% |
| Eastern Europe | 104 | 0.4% |
| El Salvador | 71 | 0.3% |
| England | 110 | 0.4% |
| Europe | 607 | 2.3% |
| France | 100 | 0.4% |
| Germany | 63 | 0.2% |
| Greece | 45 | 0.2% |
| Guatemala | 47 | 0.2% |
| Guyana | 168 | 0.6% |
| Hong Kong | 368 | 1.4% |
| India | 159 | 0.6% |
| Indonesia | 11 | 0.0% |
| Iran | 163 | 0.6% |
| Iraq | 16 | 0.1% |
| Italy | 19 | 0.1% |
| Jamaica | 10 | 0.0% |
| Japan | 508 | 1.9% |
| Korea | 752 | 2.8% |
| Latin America | 882 | 3.3% |
| Lebanon | 49 | 0.2% |
| Malaysia | 42 | 0.2% |
| Mexico | 419 | 1.6% |
| Nicaragua | 14 | 0.1% |
| Northern Europe | 134 | 0.5% |
| Oceania | 36 | 0.1% |
| Peru | 45 | 0.2% |
| Philippines | 498 | 1.9% |
| Portugal | 8 | 0.0% |
| Romania | 69 | 0.3% |
| Russia | 25 | 0.1% |
| Singapore | 8 | 0.0% |
| South America | 312 | 1.2% |
| South Central Asia | 350 | 1.3% |
| South Eastern Asia | 823 | 3.1% |
| Southern Europe | 137 | 0.5% |
| Spain | 65 | 0.2% |
| Sri Lanka | 28 | 0.1% |
| Taiwan | 492 | 1.8% |
| Thailand | 63 | 0.2% |
| Venezuela | 14 | 0.1% |
| Vietnam | 172 | 0.6% |
| Western Africa | 12 | 0.1% |
| Western Asia | 89 | 0.3% |
| Western Europe | 232 | 0.9% | View All 61 Rows |
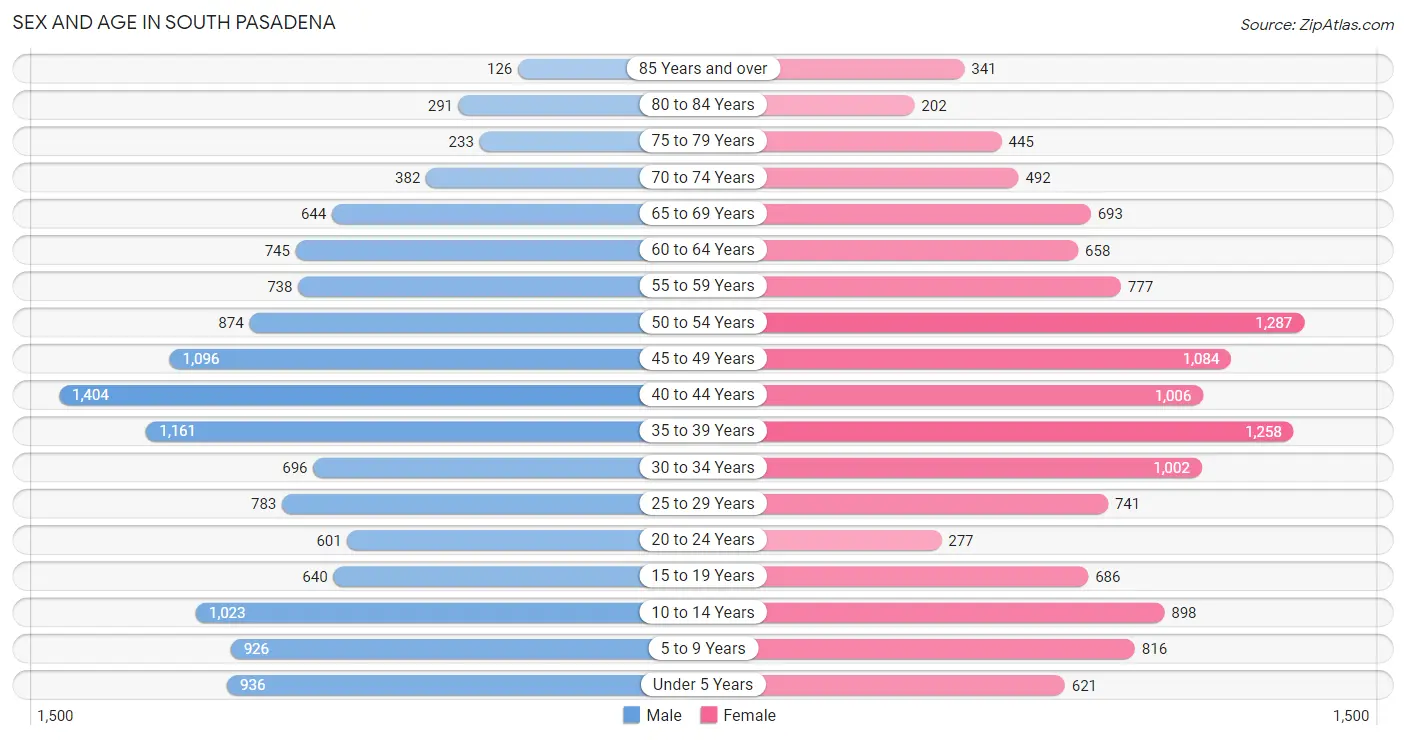
Sex and Age in South Pasadena
Sex and Age in South Pasadena
The most populous age groups in South Pasadena are 40 to 44 Years (1,404 | 10.6%) for men and 50 to 54 Years (1,287 | 9.7%) for women.
| Age Bracket | Male | Female |
| Under 5 Years | 936 (7.0%) | 621 (4.7%) |
| 5 to 9 Years | 926 (7.0%) | 816 (6.1%) |
| 10 to 14 Years | 1,023 (7.7%) | 898 (6.8%) |
| 15 to 19 Years | 640 (4.8%) | 686 (5.2%) |
| 20 to 24 Years | 601 (4.5%) | 277 (2.1%) |
| 25 to 29 Years | 783 (5.9%) | 741 (5.6%) |
| 30 to 34 Years | 696 (5.2%) | 1,002 (7.5%) |
| 35 to 39 Years | 1,161 (8.7%) | 1,258 (9.5%) |
| 40 to 44 Years | 1,404 (10.6%) | 1,006 (7.6%) |
| 45 to 49 Years | 1,096 (8.2%) | 1,084 (8.2%) |
| 50 to 54 Years | 874 (6.6%) | 1,287 (9.7%) |
| 55 to 59 Years | 738 (5.6%) | 777 (5.9%) |
| 60 to 64 Years | 745 (5.6%) | 658 (5.0%) |
| 65 to 69 Years | 644 (4.8%) | 693 (5.2%) |
| 70 to 74 Years | 382 (2.9%) | 492 (3.7%) |
| 75 to 79 Years | 233 (1.8%) | 445 (3.4%) |
| 80 to 84 Years | 291 (2.2%) | 202 (1.5%) |
| 85 Years and over | 126 (0.9%) | 341 (2.6%) |
| Total | 13,299 (100.0%) | 13,284 (100.0%) |
Families and Households in South Pasadena
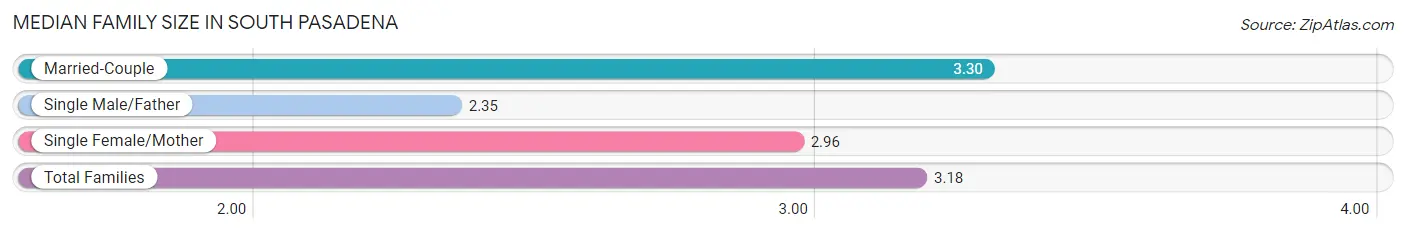
Median Family Size in South Pasadena
The median family size in South Pasadena is 3.18 persons per family, with married-couple families (5,346 | 78.6%) accounting for the largest median family size of 3.3 persons per family. On the other hand, single male/father families (446 | 6.6%) represent the smallest median family size with 2.35 persons per family.
| Family Type | # Families | Family Size |
| Married-Couple | 5,346 (78.6%) | 3.30 |
| Single Male/Father | 446 (6.6%) | 2.35 |
| Single Female/Mother | 1,013 (14.9%) | 2.96 |
| Total Families | 6,805 (100.0%) | 3.18 |
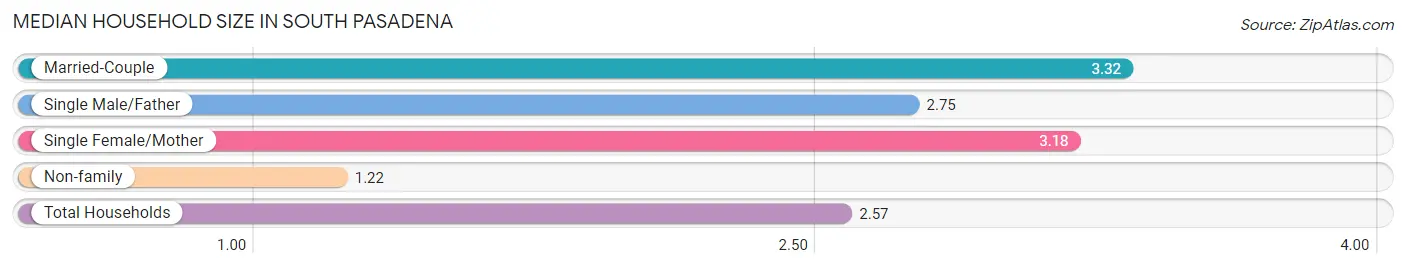
Median Household Size in South Pasadena
The median household size in South Pasadena is 2.57 persons per household, with married-couple households (5,346 | 52.0%) accounting for the largest median household size of 3.32 persons per household. non-family households (3,469 | 33.8%) represent the smallest median household size with 1.22 persons per household.
| Household Type | # Households | Household Size |
| Married-Couple | 5,346 (52.0%) | 3.32 |
| Single Male/Father | 446 (4.3%) | 2.75 |
| Single Female/Mother | 1,013 (9.9%) | 3.18 |
| Non-family | 3,469 (33.8%) | 1.22 |
| Total Households | 10,274 (100.0%) | 2.57 |
Household Size by Marriage Status in South Pasadena
Out of a total of 10,274 households in South Pasadena, 6,805 (66.2%) are family households, while 3,469 (33.8%) are nonfamily households. The most numerous type of family households are 2-person households, comprising 2,358, and the most common type of nonfamily households are 1-person households, comprising 2,803.
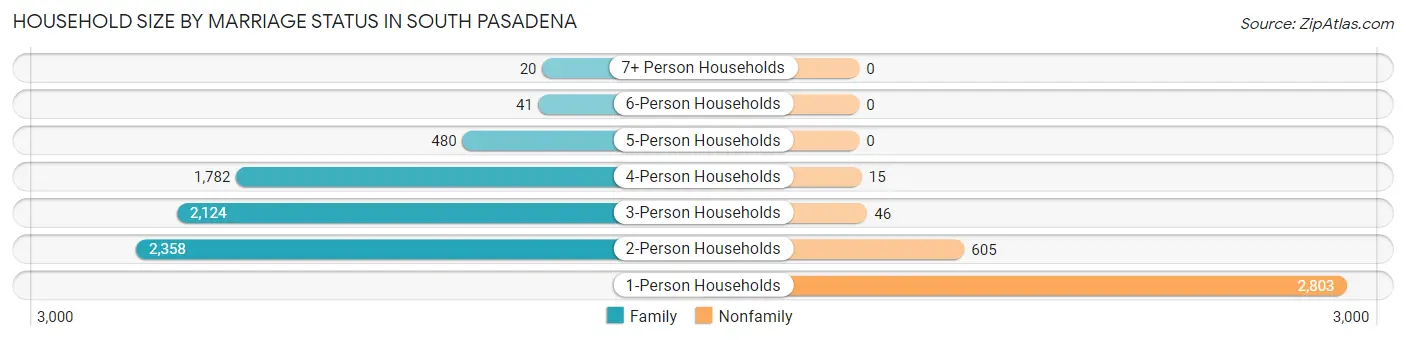
| Household Size | Family Households | Nonfamily Households |
| 1-Person Households | - | 2,803 (27.3%) |
| 2-Person Households | 2,358 (23.0%) | 605 (5.9%) |
| 3-Person Households | 2,124 (20.7%) | 46 (0.4%) |
| 4-Person Households | 1,782 (17.3%) | 15 (0.2%) |
| 5-Person Households | 480 (4.7%) | 0 (0.0%) |
| 6-Person Households | 41 (0.4%) | 0 (0.0%) |
| 7+ Person Households | 20 (0.2%) | 0 (0.0%) |
| Total | 6,805 (66.2%) | 3,469 (33.8%) |
Female Fertility in South Pasadena
Fertility by Age in South Pasadena
Average fertility rate in South Pasadena is 35.0 births per 1,000 women. Women in the age bracket of 20 to 34 years have the highest fertility rate with 48.0 births per 1,000 women. Women in the age bracket of 35 to 50 years acount for 57.2% of all women with births.
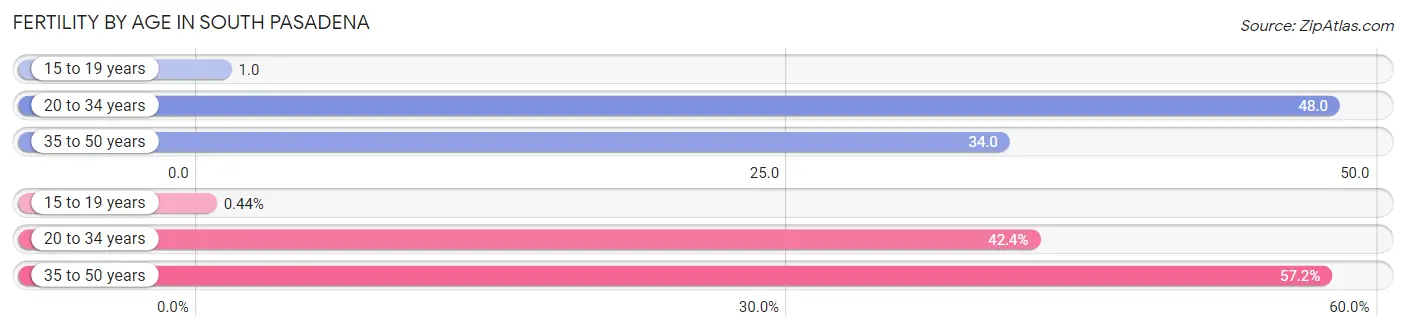
| Age Bracket | Women with Births | Births / 1,000 Women |
| 15 to 19 years | 1 (0.4%) | 1.0 |
| 20 to 34 years | 97 (42.4%) | 48.0 |
| 35 to 50 years | 131 (57.2%) | 34.0 |
| Total | 229 (100.0%) | 35.0 |
Fertility by Age by Marriage Status in South Pasadena
75.5% of women with births (229) in South Pasadena are married. The highest percentage of unmarried women with births falls into 20 to 34 years age bracket with 49.5% of them unmarried at the time of birth, while the lowest percentage of unmarried women with births belong to 15 to 19 years age bracket with 0.0% of them unmarried.
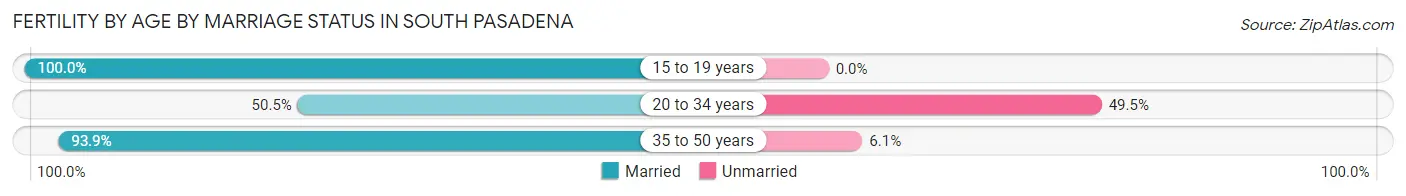
| Age Bracket | Married | Unmarried |
| 15 to 19 years | 1 (100.0%) | 0 (0.0%) |
| 20 to 34 years | 49 (50.5%) | 48 (49.5%) |
| 35 to 50 years | 123 (93.9%) | 8 (6.1%) |
| Total | 173 (75.5%) | 56 (24.4%) |
Fertility by Education in South Pasadena
Average fertility rate in South Pasadena is 35.0 births per 1,000 women. Women with the education attainment of high school diploma have the highest fertility rate of 117.0 births per 1,000 women, while women with the education attainment of less than high school have the lowest fertility at 2.0 births per 1,000 women. Women with the education attainment of bachelor's degree represent 39.7% of all women with births.
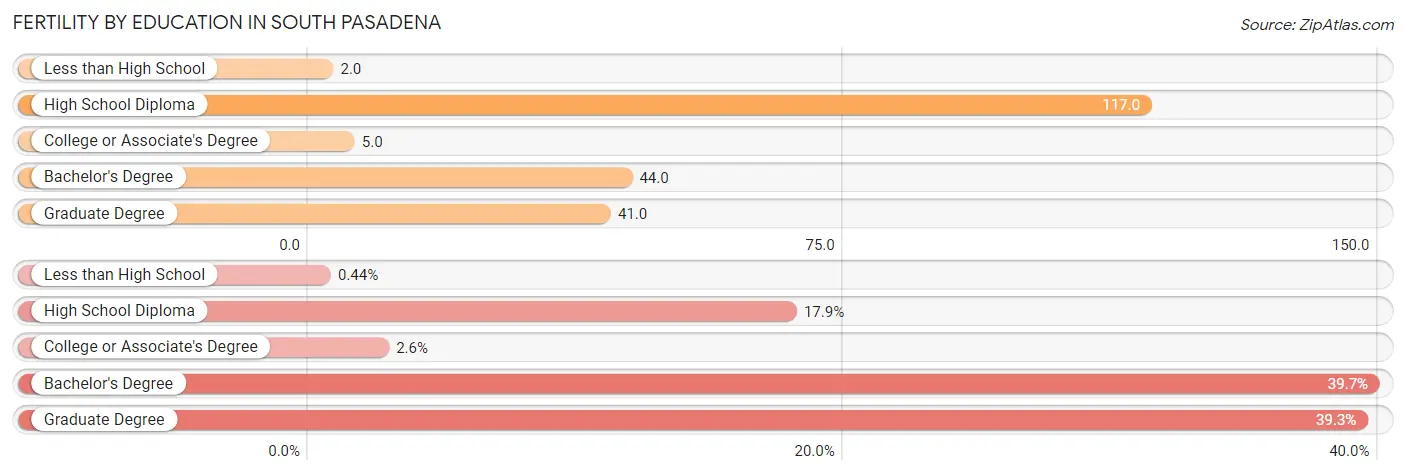
| Educational Attainment | Women with Births | Births / 1,000 Women |
| Less than High School | 1 (0.4%) | 2.0 |
| High School Diploma | 41 (17.9%) | 117.0 |
| College or Associate's Degree | 6 (2.6%) | 5.0 |
| Bachelor's Degree | 91 (39.7%) | 44.0 |
| Graduate Degree | 90 (39.3%) | 41.0 |
| Total | 229 (100.0%) | 35.0 |
Fertility by Education by Marriage Status in South Pasadena
24.4% of women with births in South Pasadena are unmarried. Women with the educational attainment of less than high school are most likely to be married with 100.0% of them married at childbirth, while women with the educational attainment of bachelor's degree are least likely to be married with 61.5% of them unmarried at childbirth.
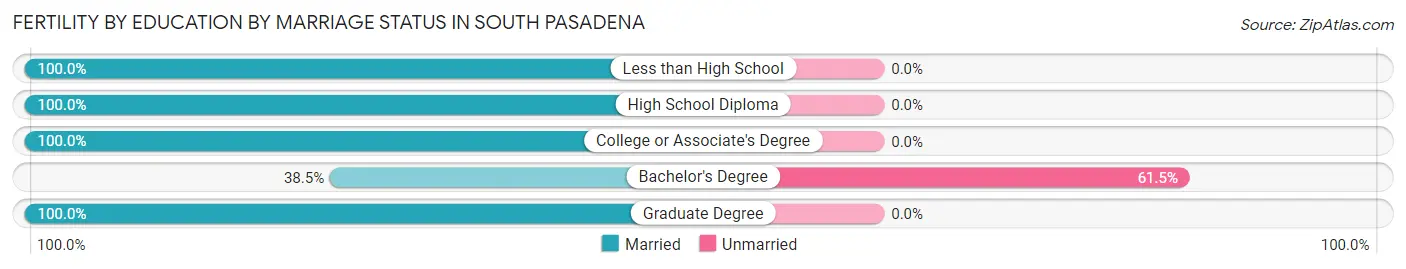
| Educational Attainment | Married | Unmarried |
| Less than High School | 1 (100.0%) | 0 (0.0%) |
| High School Diploma | 41 (100.0%) | 0 (0.0%) |
| College or Associate's Degree | 6 (100.0%) | 0 (0.0%) |
| Bachelor's Degree | 35 (38.5%) | 56 (61.5%) |
| Graduate Degree | 90 (100.0%) | 0 (0.0%) |
| Total | 173 (75.5%) | 56 (24.4%) |
Employment Characteristics in South Pasadena
Employment by Class of Employer in South Pasadena
Among the 13,759 employed individuals in South Pasadena, private company employees (7,833 | 56.9%), local government employees (1,626 | 11.8%), and not-for-profit organizations (1,452 | 10.5%) make up the most common classes of employment.
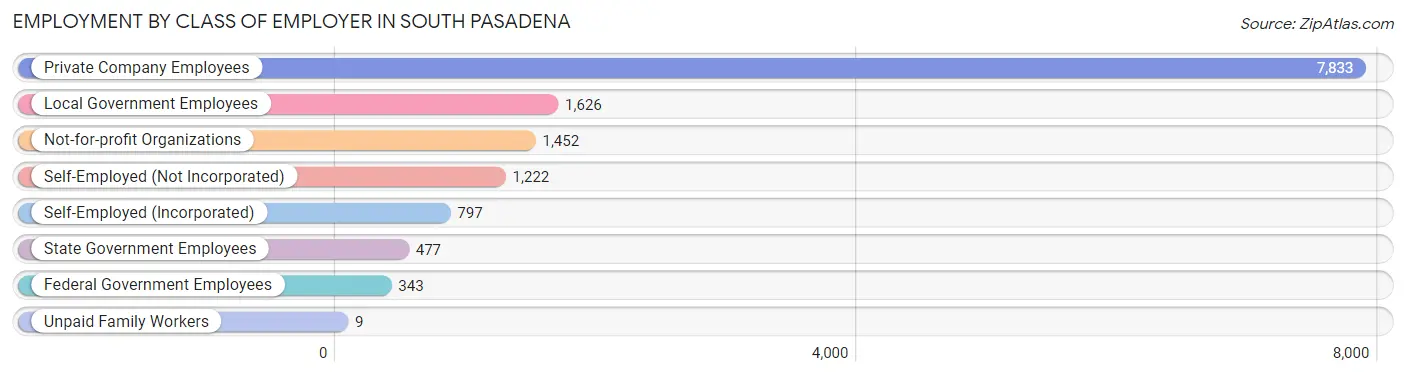
| Employer Class | # Employees | % Employees |
| Private Company Employees | 7,833 | 56.9% |
| Self-Employed (Incorporated) | 797 | 5.8% |
| Self-Employed (Not Incorporated) | 1,222 | 8.9% |
| Not-for-profit Organizations | 1,452 | 10.5% |
| Local Government Employees | 1,626 | 11.8% |
| State Government Employees | 477 | 3.5% |
| Federal Government Employees | 343 | 2.5% |
| Unpaid Family Workers | 9 | 0.1% |
| Total | 13,759 | 100.0% |
Employment Status by Age in South Pasadena
According to the labor force statistics for South Pasadena, out of the total population over 16 years of age (21,049), 69.9% or 14,713 individuals are in the labor force, with 5.2% or 765 of them unemployed. The age group with the highest labor force participation rate is 35 to 44 years, with 91.3% or 4,409 individuals in the labor force. Within the labor force, the 55 to 59 years age range has the highest percentage of unemployed individuals, with 12.3% or 148 of them being unemployed.
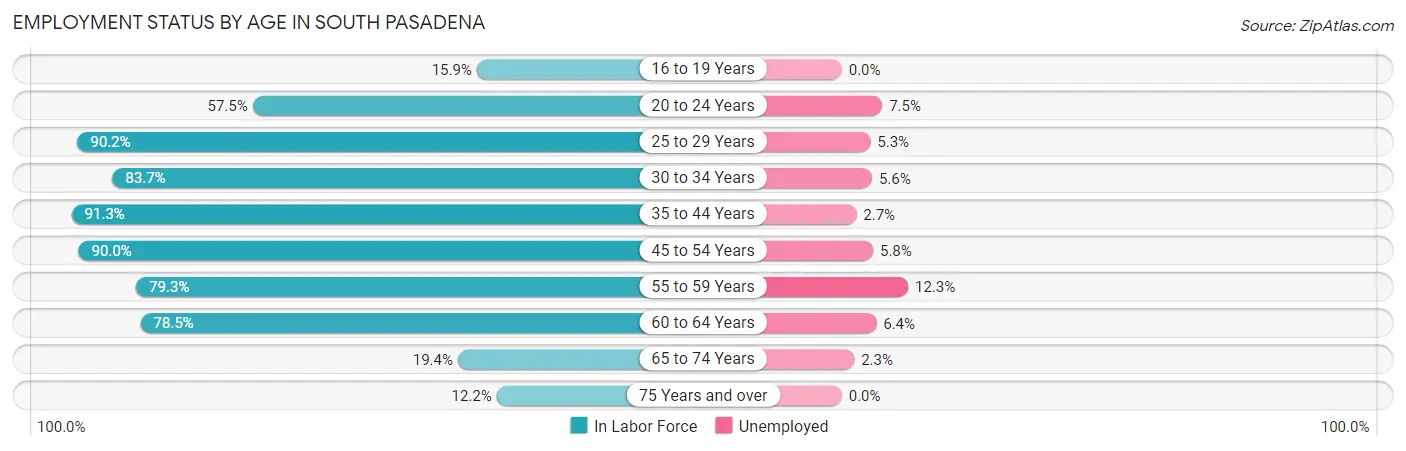
| Age Bracket | In Labor Force | Unemployed |
| 16 to 19 Years | 161 (15.9%) | 0 (0.0%) |
| 20 to 24 Years | 505 (57.5%) | 38 (7.5%) |
| 25 to 29 Years | 1,375 (90.2%) | 73 (5.3%) |
| 30 to 34 Years | 1,421 (83.7%) | 80 (5.6%) |
| 35 to 44 Years | 4,409 (91.3%) | 119 (2.7%) |
| 45 to 54 Years | 3,907 (90.0%) | 227 (5.8%) |
| 55 to 59 Years | 1,201 (79.3%) | 148 (12.3%) |
| 60 to 64 Years | 1,101 (78.5%) | 70 (6.4%) |
| 65 to 74 Years | 429 (19.4%) | 10 (2.3%) |
| 75 Years and over | 200 (12.2%) | 0 (0.0%) |
| Total | 14,713 (69.9%) | 765 (5.2%) |
Employment Status by Educational Attainment in South Pasadena
According to labor force statistics for South Pasadena, 87.6% of individuals (13,412) out of the total population between 25 and 64 years of age (15,310) are in the labor force, with 5.3% or 711 of them being unemployed. The group with the highest labor force participation rate are those with the educational attainment of bachelor's degree or higher, with 89.2% or 10,200 individuals in the labor force. Within the labor force, individuals with less than high school education have the highest percentage of unemployment, with 18.1% or 35 of them being unemployed.
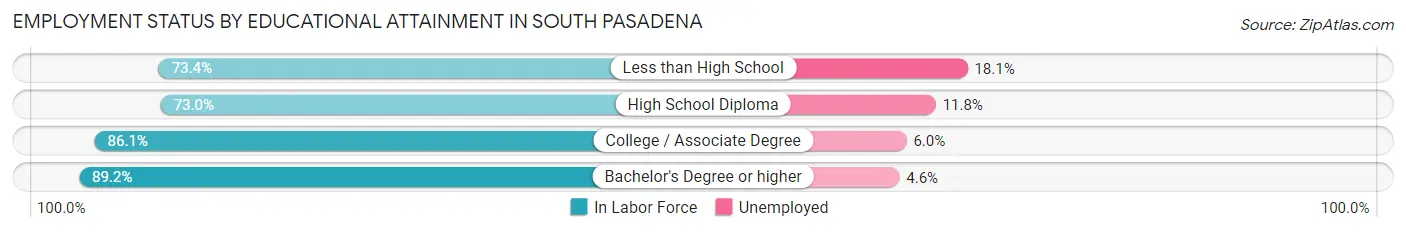
| Educational Attainment | In Labor Force | Unemployed |
| Less than High School | 193 (73.4%) | 48 (18.1%) |
| High School Diploma | 508 (73.0%) | 82 (11.8%) |
| College / Associate Degree | 2,511 (86.1%) | 175 (6.0%) |
| Bachelor's Degree or higher | 10,200 (89.2%) | 526 (4.6%) |
| Total | 13,412 (87.6%) | 811 (5.3%) |
Employment Occupations by Sex in South Pasadena
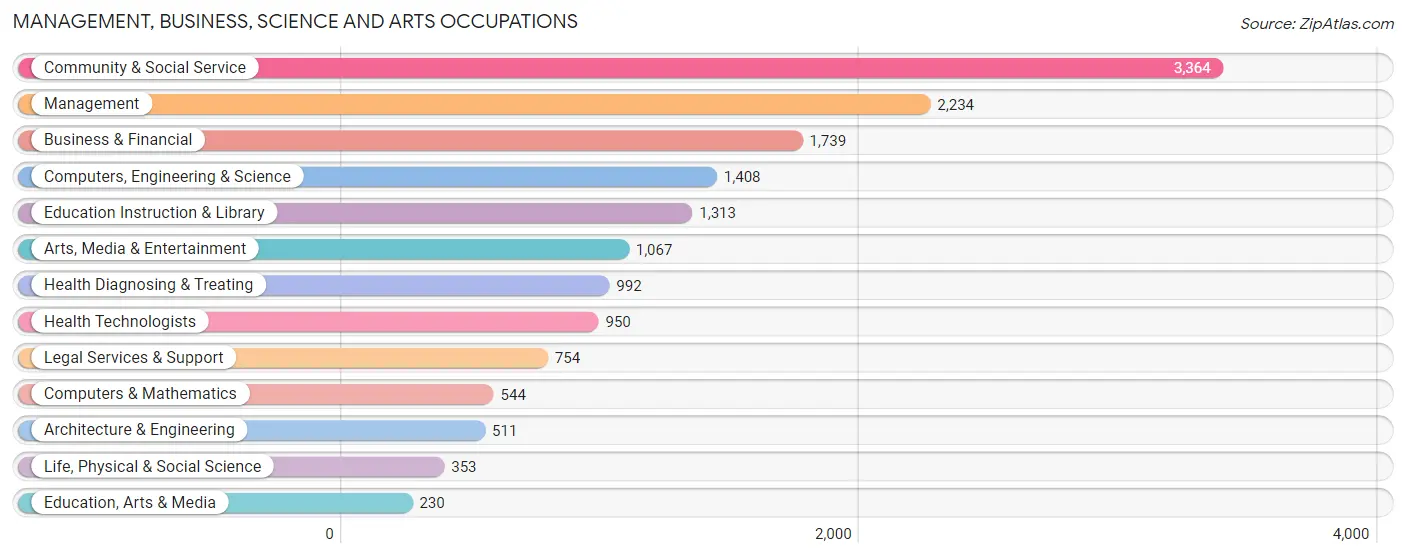
Management, Business, Science and Arts Occupations
The most common Management, Business, Science and Arts occupations in South Pasadena are Community & Social Service (3,364 | 24.1%), Management (2,234 | 16.0%), Business & Financial (1,739 | 12.5%), Computers, Engineering & Science (1,408 | 10.1%), and Education Instruction & Library (1,313 | 9.4%).
Management, Business, Science and Arts Occupations by Sex
Within the Management, Business, Science and Arts occupations in South Pasadena, the most male-oriented occupations are Architecture & Engineering (85.9%), Computers & Mathematics (81.6%), and Computers, Engineering & Science (74.9%), while the most female-oriented occupations are Education, Arts & Media (69.6%), Education Instruction & Library (61.6%), and Health Diagnosing & Treating (60.6%).
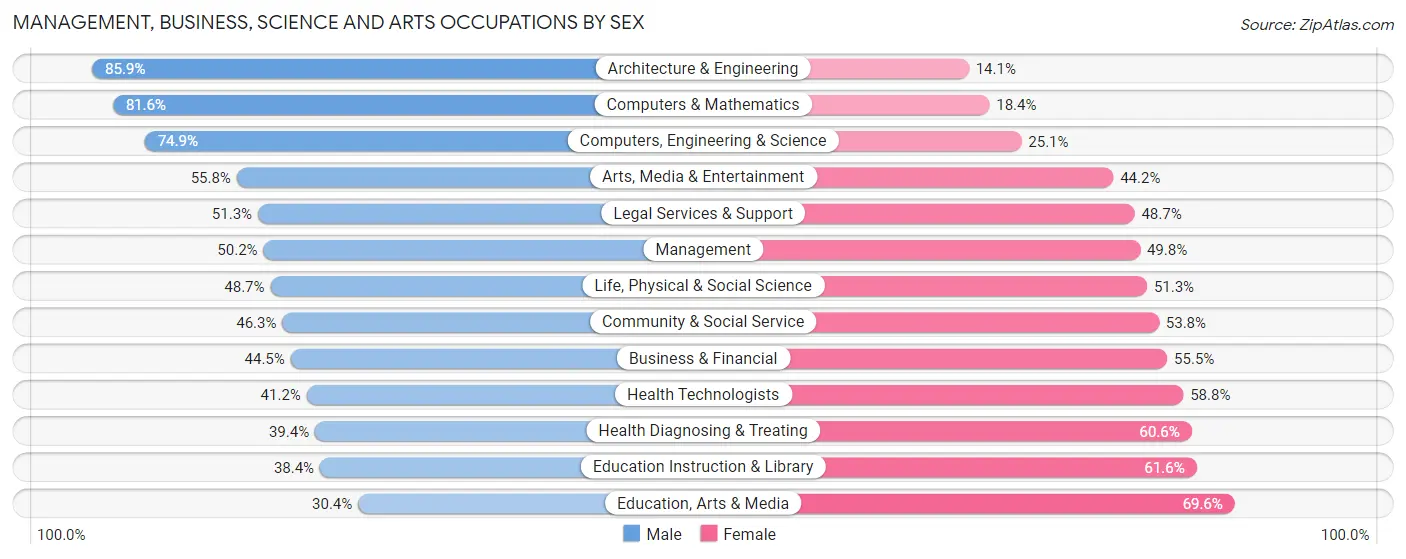
| Occupation | Male | Female |
| Management | 1,121 (50.2%) | 1,113 (49.8%) |
| Business & Financial | 774 (44.5%) | 965 (55.5%) |
| Computers, Engineering & Science | 1,055 (74.9%) | 353 (25.1%) |
| Computers & Mathematics | 444 (81.6%) | 100 (18.4%) |
| Architecture & Engineering | 439 (85.9%) | 72 (14.1%) |
| Life, Physical & Social Science | 172 (48.7%) | 181 (51.3%) |
| Community & Social Service | 1,556 (46.3%) | 1,808 (53.7%) |
| Education, Arts & Media | 70 (30.4%) | 160 (69.6%) |
| Legal Services & Support | 387 (51.3%) | 367 (48.7%) |
| Education Instruction & Library | 504 (38.4%) | 809 (61.6%) |
| Arts, Media & Entertainment | 595 (55.8%) | 472 (44.2%) |
| Health Diagnosing & Treating | 391 (39.4%) | 601 (60.6%) |
| Health Technologists | 391 (41.2%) | 559 (58.8%) |
| Total (Category) | 4,897 (50.3%) | 4,840 (49.7%) |
| Total (Overall) | 7,271 (52.1%) | 6,673 (47.9%) |
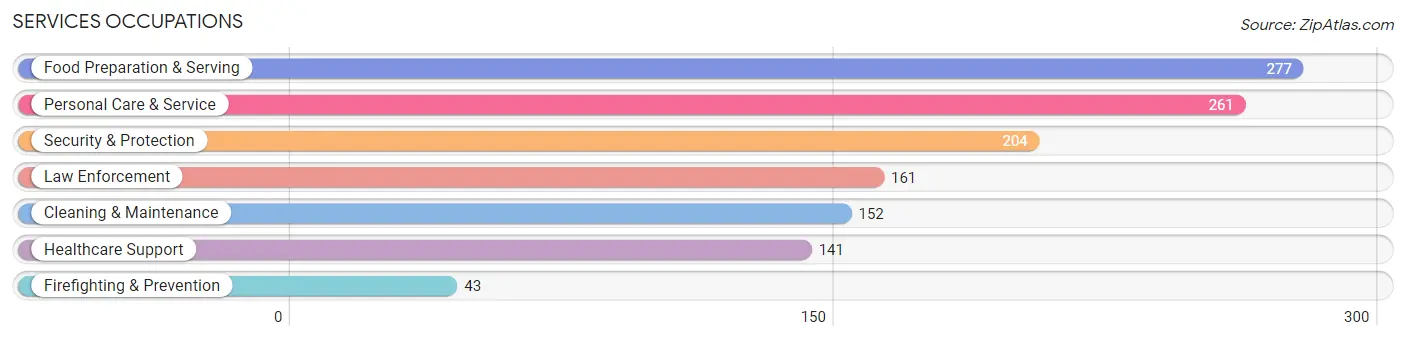
Services Occupations
The most common Services occupations in South Pasadena are Food Preparation & Serving (277 | 2.0%), Personal Care & Service (261 | 1.9%), Security & Protection (204 | 1.5%), Law Enforcement (161 | 1.1%), and Cleaning & Maintenance (152 | 1.1%).
Services Occupations by Sex
Within the Services occupations in South Pasadena, the most male-oriented occupations are Security & Protection (100.0%), Firefighting & Prevention (100.0%), and Law Enforcement (100.0%), while the most female-oriented occupations are Personal Care & Service (93.5%), Healthcare Support (90.8%), and Cleaning & Maintenance (28.3%).
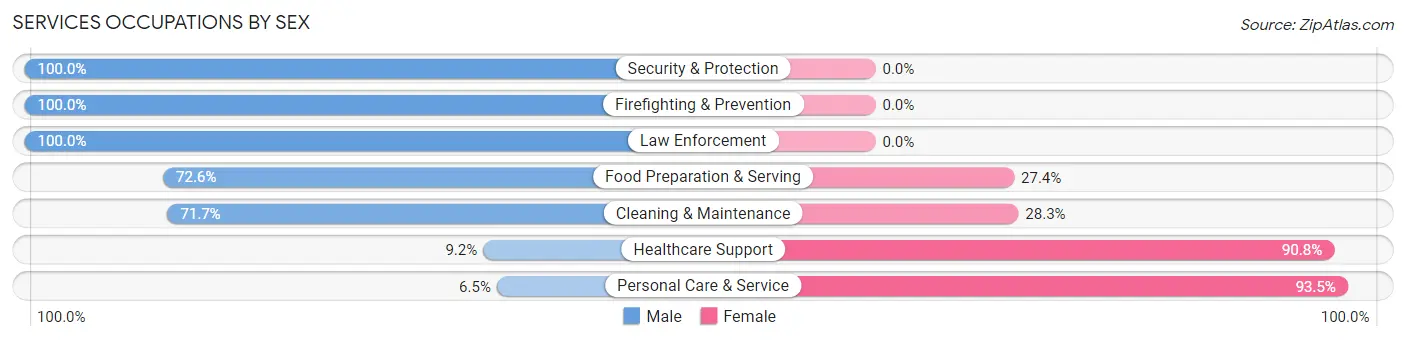
| Occupation | Male | Female |
| Healthcare Support | 13 (9.2%) | 128 (90.8%) |
| Security & Protection | 204 (100.0%) | 0 (0.0%) |
| Firefighting & Prevention | 43 (100.0%) | 0 (0.0%) |
| Law Enforcement | 161 (100.0%) | 0 (0.0%) |
| Food Preparation & Serving | 201 (72.6%) | 76 (27.4%) |
| Cleaning & Maintenance | 109 (71.7%) | 43 (28.3%) |
| Personal Care & Service | 17 (6.5%) | 244 (93.5%) |
| Total (Category) | 544 (52.6%) | 491 (47.4%) |
| Total (Overall) | 7,271 (52.1%) | 6,673 (47.9%) |
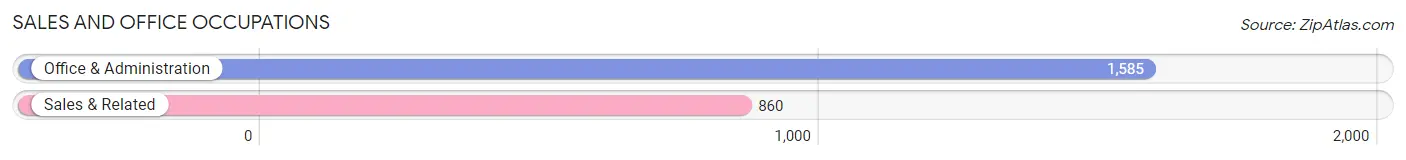
Sales and Office Occupations
The most common Sales and Office occupations in South Pasadena are Office & Administration (1,585 | 11.4%), and Sales & Related (860 | 6.2%).
Sales and Office Occupations by Sex
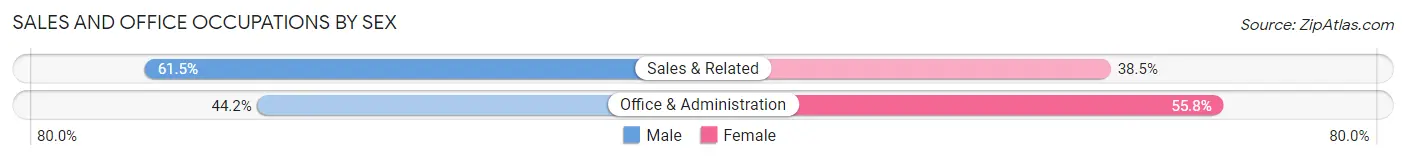
| Occupation | Male | Female |
| Sales & Related | 529 (61.5%) | 331 (38.5%) |
| Office & Administration | 700 (44.2%) | 885 (55.8%) |
| Total (Category) | 1,229 (50.3%) | 1,216 (49.7%) |
| Total (Overall) | 7,271 (52.1%) | 6,673 (47.9%) |
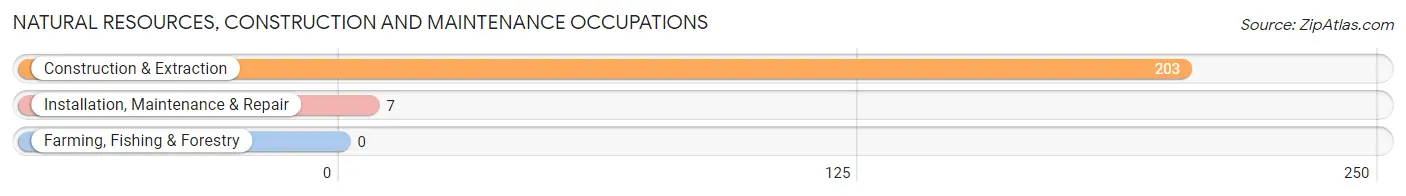
Natural Resources, Construction and Maintenance Occupations
The most common Natural Resources, Construction and Maintenance occupations in South Pasadena are Construction & Extraction (203 | 1.5%), and Installation, Maintenance & Repair (7 | 0.1%).
Natural Resources, Construction and Maintenance Occupations by Sex
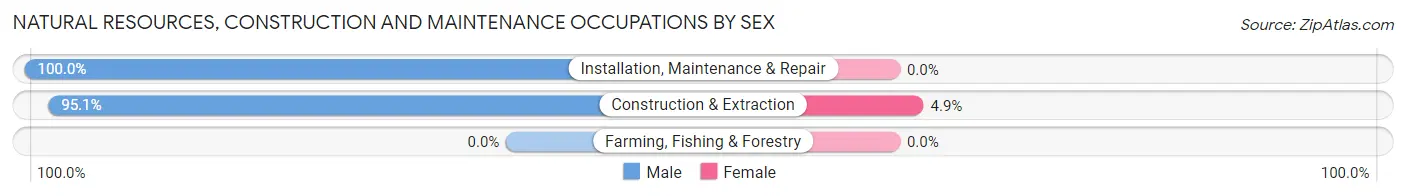
| Occupation | Male | Female |
| Farming, Fishing & Forestry | 0 (0.0%) | 0 (0.0%) |
| Construction & Extraction | 193 (95.1%) | 10 (4.9%) |
| Installation, Maintenance & Repair | 7 (100.0%) | 0 (0.0%) |
| Total (Category) | 200 (95.2%) | 10 (4.8%) |
| Total (Overall) | 7,271 (52.1%) | 6,673 (47.9%) |
Production, Transportation and Moving Occupations
The most common Production, Transportation and Moving occupations in South Pasadena are Production (212 | 1.5%), Material Moving (209 | 1.5%), and Transportation (96 | 0.7%).
Production, Transportation and Moving Occupations by Sex
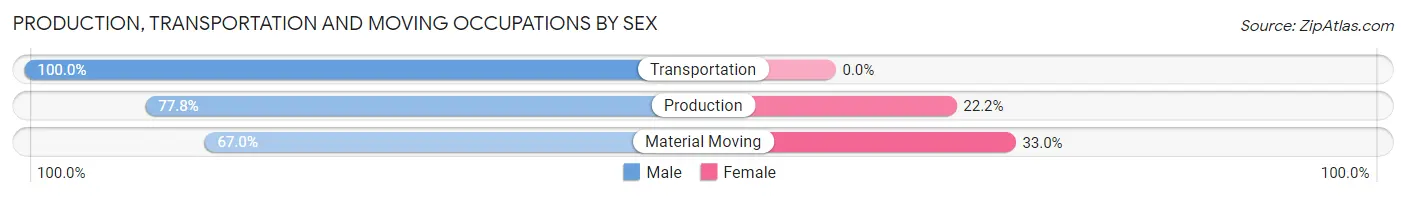
| Occupation | Male | Female |
| Production | 165 (77.8%) | 47 (22.2%) |
| Transportation | 96 (100.0%) | 0 (0.0%) |
| Material Moving | 140 (67.0%) | 69 (33.0%) |
| Total (Category) | 401 (77.6%) | 116 (22.4%) |
| Total (Overall) | 7,271 (52.1%) | 6,673 (47.9%) |
Employment Industries by Sex in South Pasadena
Employment Industries in South Pasadena
The major employment industries in South Pasadena include Professional & Scientific (2,605 | 18.7%), Educational Services (1,775 | 12.7%), Health Care & Social Assistance (1,676 | 12.0%), Public Administration (884 | 6.3%), and Finance & Insurance (882 | 6.3%).
Employment Industries by Sex in South Pasadena
The South Pasadena industries that see more men than women are Agriculture, Fishing & Hunting (100.0%), Transportation & Warehousing (92.8%), and Public Administration (79.2%), whereas the industries that tend to have a higher number of women are Health Care & Social Assistance (69.8%), Educational Services (62.4%), and Utilities (59.8%).
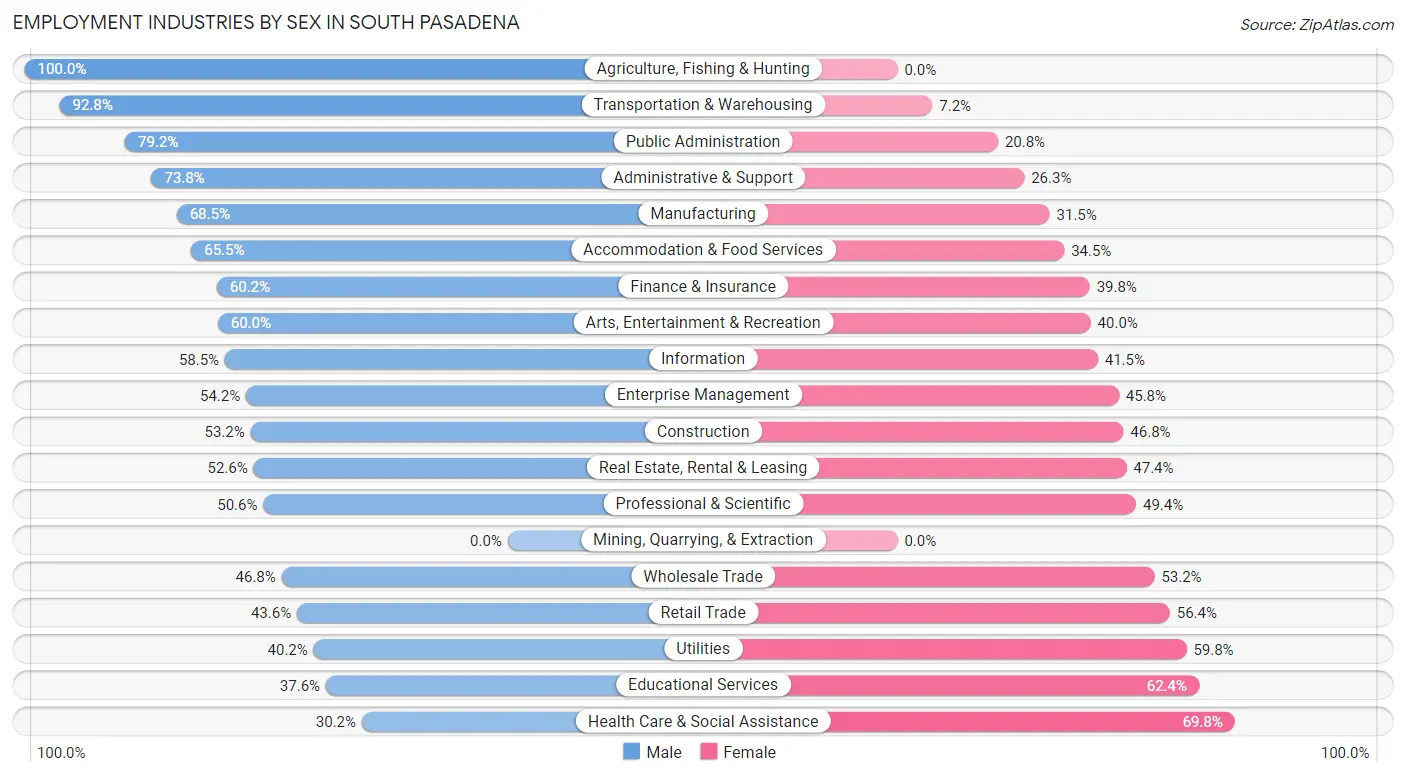
| Industry | Male | Female |
| Agriculture, Fishing & Hunting | 16 (100.0%) | 0 (0.0%) |
| Mining, Quarrying, & Extraction | 0 (0.0%) | 0 (0.0%) |
| Construction | 157 (53.2%) | 138 (46.8%) |
| Manufacturing | 461 (68.5%) | 212 (31.5%) |
| Wholesale Trade | 95 (46.8%) | 108 (53.2%) |
| Retail Trade | 335 (43.6%) | 433 (56.4%) |
| Transportation & Warehousing | 590 (92.8%) | 46 (7.2%) |
| Utilities | 88 (40.2%) | 131 (59.8%) |
| Information | 470 (58.5%) | 333 (41.5%) |
| Finance & Insurance | 531 (60.2%) | 351 (39.8%) |
| Real Estate, Rental & Leasing | 161 (52.6%) | 145 (47.4%) |
| Professional & Scientific | 1,318 (50.6%) | 1,287 (49.4%) |
| Enterprise Management | 117 (54.2%) | 99 (45.8%) |
| Administrative & Support | 250 (73.8%) | 89 (26.3%) |
| Educational Services | 668 (37.6%) | 1,107 (62.4%) |
| Health Care & Social Assistance | 506 (30.2%) | 1,170 (69.8%) |
| Arts, Entertainment & Recreation | 300 (60.0%) | 200 (40.0%) |
| Accommodation & Food Services | 349 (65.5%) | 184 (34.5%) |
| Public Administration | 700 (79.2%) | 184 (20.8%) |
| Total | 7,271 (52.1%) | 6,673 (47.9%) |
Education in South Pasadena
School Enrollment in South Pasadena
The most common levels of schooling among the 7,175 students in South Pasadena are middle school (1,427 | 19.9%), elementary school (1,358 | 18.9%), and high school (1,326 | 18.5%).
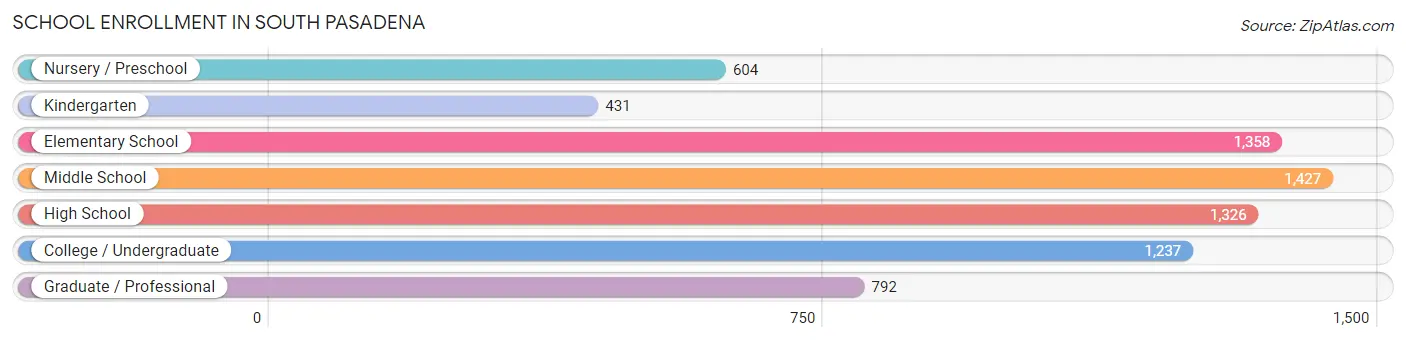
| School Level | # Students | % Students |
| Nursery / Preschool | 604 | 8.4% |
| Kindergarten | 431 | 6.0% |
| Elementary School | 1,358 | 18.9% |
| Middle School | 1,427 | 19.9% |
| High School | 1,326 | 18.5% |
| College / Undergraduate | 1,237 | 17.2% |
| Graduate / Professional | 792 | 11.0% |
| Total | 7,175 | 100.0% |
School Enrollment by Age by Funding Source in South Pasadena
Out of a total of 7,175 students who are enrolled in schools in South Pasadena, 1,729 (24.1%) attend a private institution, while the remaining 5,446 (75.9%) are enrolled in public schools. The age group of 3 to 4 year olds has the highest likelihood of being enrolled in private schools, with 392 (78.9% in the age bracket) enrolled. Conversely, the age group of 10 to 14 year olds has the lowest likelihood of being enrolled in a private school, with 1,739 (92.1% in the age bracket) attending a public institution.
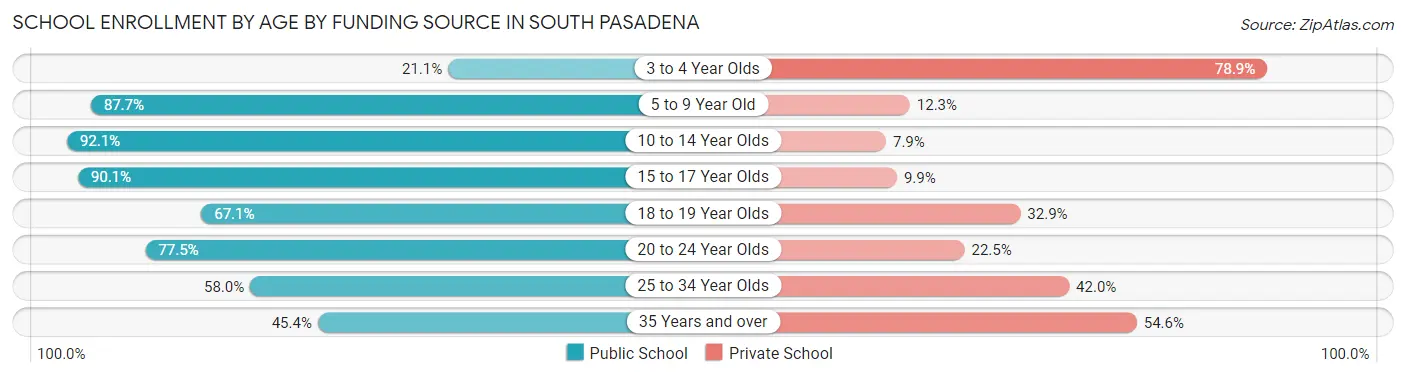
| Age Bracket | Public School | Private School |
| 3 to 4 Year Olds | 105 (21.1%) | 392 (78.9%) |
| 5 to 9 Year Old | 1,493 (87.7%) | 210 (12.3%) |
| 10 to 14 Year Olds | 1,739 (92.1%) | 149 (7.9%) |
| 15 to 17 Year Olds | 825 (90.1%) | 91 (9.9%) |
| 18 to 19 Year Olds | 269 (67.1%) | 132 (32.9%) |
| 20 to 24 Year Olds | 327 (77.5%) | 95 (22.5%) |
| 25 to 34 Year Olds | 359 (58.0%) | 260 (42.0%) |
| 35 Years and over | 331 (45.4%) | 398 (54.6%) |
| Total | 5,446 (75.9%) | 1,729 (24.1%) |
Educational Attainment by Field of Study in South Pasadena
Social sciences (2,202 | 14.6%), business (2,139 | 14.2%), visual & performing arts (1,464 | 9.7%), bio, nature & agricultural (1,406 | 9.3%), and science & technology (1,110 | 7.4%) are the most common fields of study among 15,035 individuals in South Pasadena who have obtained a bachelor's degree or higher.
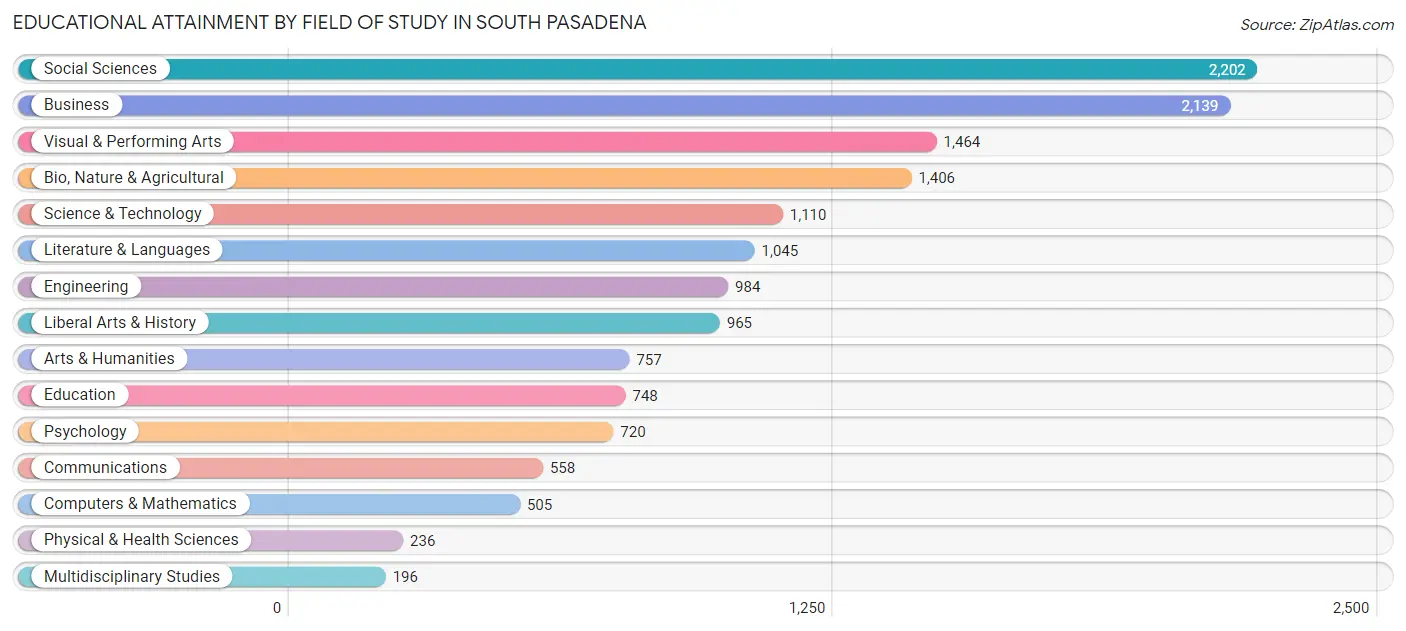
| Field of Study | # Graduates | % Graduates |
| Computers & Mathematics | 505 | 3.4% |
| Bio, Nature & Agricultural | 1,406 | 9.3% |
| Physical & Health Sciences | 236 | 1.6% |
| Psychology | 720 | 4.8% |
| Social Sciences | 2,202 | 14.6% |
| Engineering | 984 | 6.5% |
| Multidisciplinary Studies | 196 | 1.3% |
| Science & Technology | 1,110 | 7.4% |
| Business | 2,139 | 14.2% |
| Education | 748 | 5.0% |
| Literature & Languages | 1,045 | 7.0% |
| Liberal Arts & History | 965 | 6.4% |
| Visual & Performing Arts | 1,464 | 9.7% |
| Communications | 558 | 3.7% |
| Arts & Humanities | 757 | 5.0% |
| Total | 15,035 | 100.0% |
Transportation & Commute in South Pasadena
Vehicle Availability by Sex in South Pasadena
The most prevalent vehicle ownership categories in South Pasadena are males with 2 vehicles (3,626, accounting for 50.6%) and females with 2 vehicles (2,941, making up 54.9%).
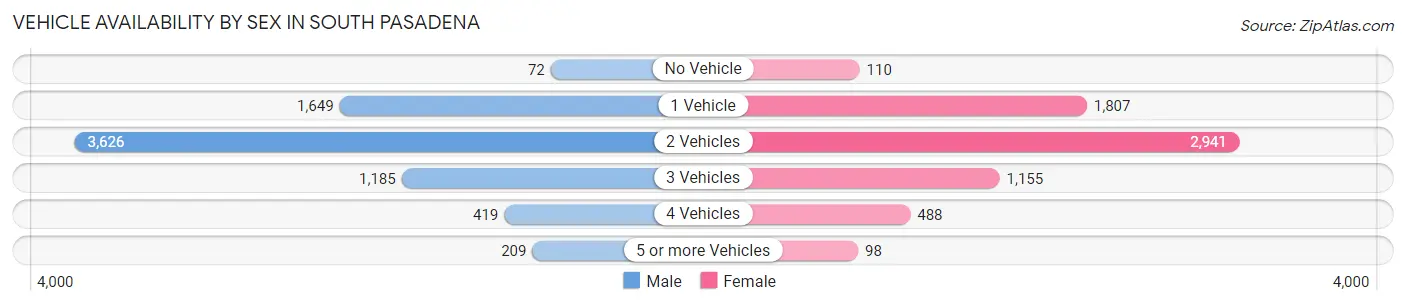
| Vehicles Available | Male | Female |
| No Vehicle | 72 (1.0%) | 110 (1.7%) |
| 1 Vehicle | 1,649 (23.0%) | 1,807 (27.4%) |
| 2 Vehicles | 3,626 (50.6%) | 2,941 (44.6%) |
| 3 Vehicles | 1,185 (16.6%) | 1,155 (17.5%) |
| 4 Vehicles | 419 (5.9%) | 488 (7.4%) |
| 5 or more Vehicles | 209 (2.9%) | 98 (1.5%) |
| Total | 7,160 (100.0%) | 6,599 (100.0%) |
Commute Time in South Pasadena
The most frequently occuring commute durations in South Pasadena are 30 to 34 minutes (1,944 commuters, 18.5%), 20 to 24 minutes (1,494 commuters, 14.2%), and 15 to 19 minutes (1,303 commuters, 12.4%).
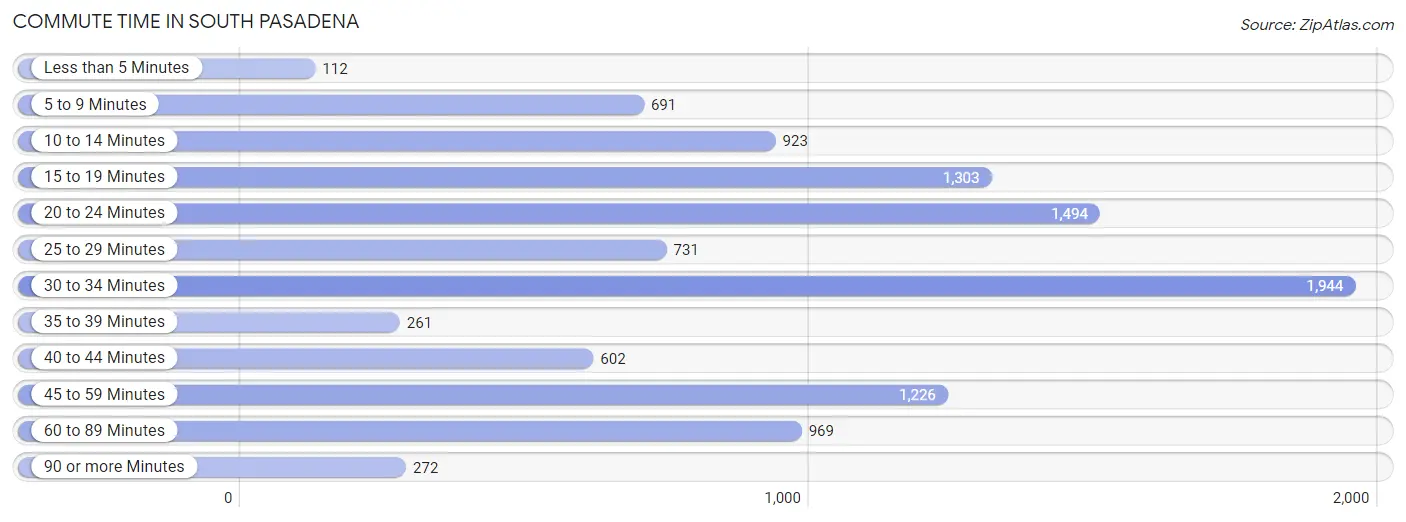
| Commute Time | # Commuters | % Commuters |
| Less than 5 Minutes | 112 | 1.1% |
| 5 to 9 Minutes | 691 | 6.6% |
| 10 to 14 Minutes | 923 | 8.8% |
| 15 to 19 Minutes | 1,303 | 12.4% |
| 20 to 24 Minutes | 1,494 | 14.2% |
| 25 to 29 Minutes | 731 | 6.9% |
| 30 to 34 Minutes | 1,944 | 18.5% |
| 35 to 39 Minutes | 261 | 2.5% |
| 40 to 44 Minutes | 602 | 5.7% |
| 45 to 59 Minutes | 1,226 | 11.7% |
| 60 to 89 Minutes | 969 | 9.2% |
| 90 or more Minutes | 272 | 2.6% |
Commute Time by Sex in South Pasadena
The most common commute times in South Pasadena are 30 to 34 minutes (934 commuters, 17.1%) for males and 30 to 34 minutes (1,010 commuters, 19.9%) for females.
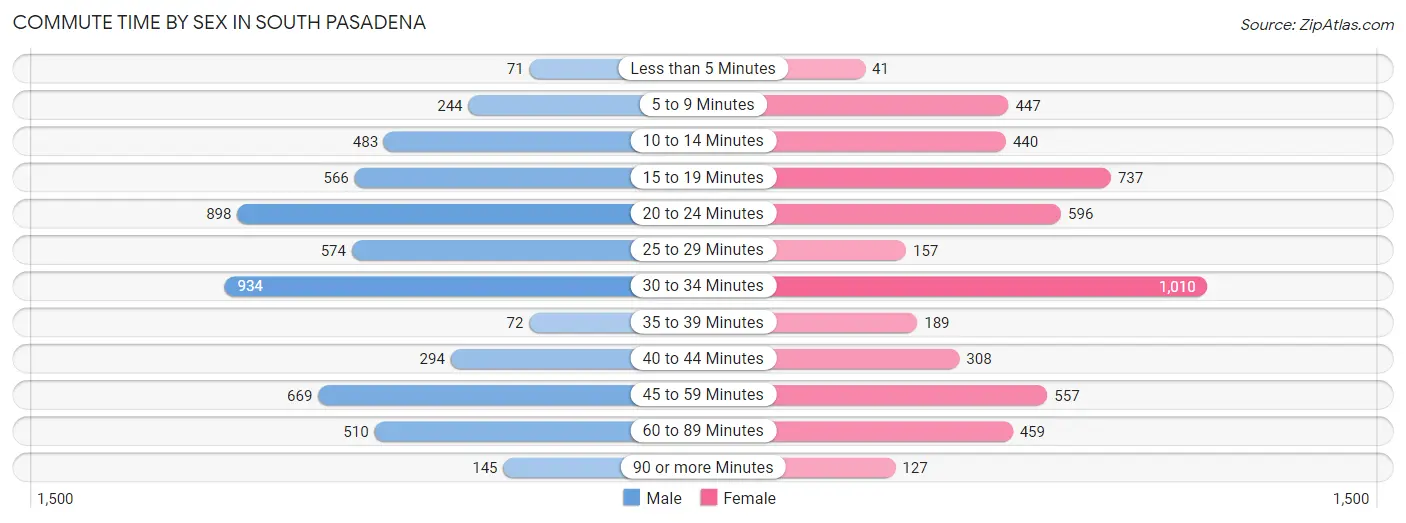
| Commute Time | Male | Female |
| Less than 5 Minutes | 71 (1.3%) | 41 (0.8%) |
| 5 to 9 Minutes | 244 (4.5%) | 447 (8.8%) |
| 10 to 14 Minutes | 483 (8.8%) | 440 (8.7%) |
| 15 to 19 Minutes | 566 (10.4%) | 737 (14.5%) |
| 20 to 24 Minutes | 898 (16.5%) | 596 (11.8%) |
| 25 to 29 Minutes | 574 (10.5%) | 157 (3.1%) |
| 30 to 34 Minutes | 934 (17.1%) | 1,010 (19.9%) |
| 35 to 39 Minutes | 72 (1.3%) | 189 (3.7%) |
| 40 to 44 Minutes | 294 (5.4%) | 308 (6.1%) |
| 45 to 59 Minutes | 669 (12.2%) | 557 (11.0%) |
| 60 to 89 Minutes | 510 (9.3%) | 459 (9.1%) |
| 90 or more Minutes | 145 (2.7%) | 127 (2.5%) |
Time of Departure to Work by Sex in South Pasadena
The most frequent times of departure to work in South Pasadena are 8:00 AM to 8:29 AM (926, 17.0%) for males and 8:00 AM to 8:29 AM (935, 18.4%) for females.
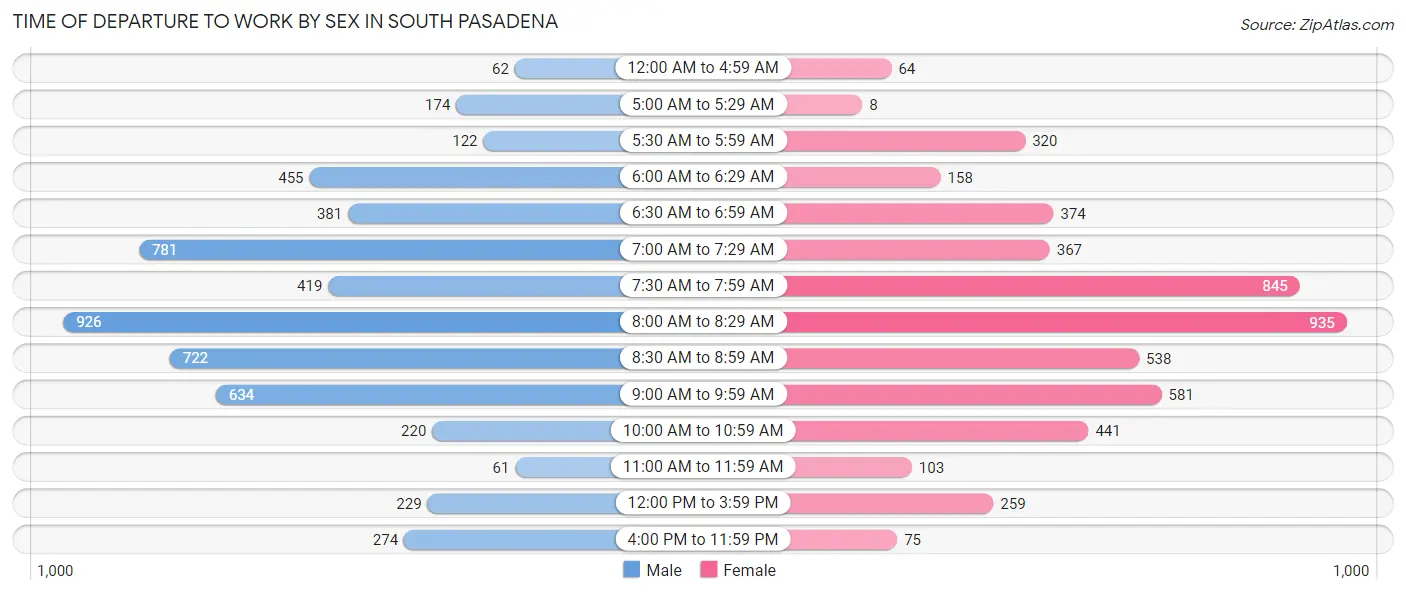
| Time of Departure | Male | Female |
| 12:00 AM to 4:59 AM | 62 (1.1%) | 64 (1.3%) |
| 5:00 AM to 5:29 AM | 174 (3.2%) | 8 (0.2%) |
| 5:30 AM to 5:59 AM | 122 (2.2%) | 320 (6.3%) |
| 6:00 AM to 6:29 AM | 455 (8.3%) | 158 (3.1%) |
| 6:30 AM to 6:59 AM | 381 (7.0%) | 374 (7.4%) |
| 7:00 AM to 7:29 AM | 781 (14.3%) | 367 (7.2%) |
| 7:30 AM to 7:59 AM | 419 (7.7%) | 845 (16.7%) |
| 8:00 AM to 8:29 AM | 926 (17.0%) | 935 (18.4%) |
| 8:30 AM to 8:59 AM | 722 (13.2%) | 538 (10.6%) |
| 9:00 AM to 9:59 AM | 634 (11.6%) | 581 (11.5%) |
| 10:00 AM to 10:59 AM | 220 (4.0%) | 441 (8.7%) |
| 11:00 AM to 11:59 AM | 61 (1.1%) | 103 (2.0%) |
| 12:00 PM to 3:59 PM | 229 (4.2%) | 259 (5.1%) |
| 4:00 PM to 11:59 PM | 274 (5.0%) | 75 (1.5%) |
| Total | 5,460 (100.0%) | 5,068 (100.0%) |
Housing Occupancy in South Pasadena
Occupancy by Ownership in South Pasadena
Of the total 10,274 dwellings in South Pasadena, owner-occupied units account for 4,787 (46.6%), while renter-occupied units make up 5,487 (53.4%).
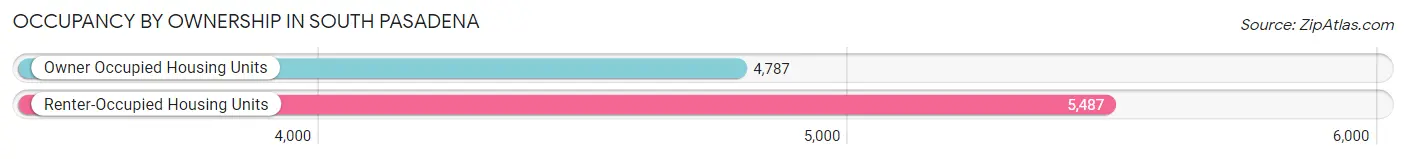
| Occupancy | # Housing Units | % Housing Units |
| Owner Occupied Housing Units | 4,787 | 46.6% |
| Renter-Occupied Housing Units | 5,487 | 53.4% |
| Total Occupied Housing Units | 10,274 | 100.0% |
Occupancy by Household Size in South Pasadena
| Household Size | # Housing Units | % Housing Units |
| 1-Person Household | 2,803 | 27.3% |
| 2-Person Household | 2,963 | 28.8% |
| 3-Person Household | 2,170 | 21.1% |
| 4+ Person Household | 2,338 | 22.8% |
| Total Housing Units | 10,274 | 100.0% |
Occupancy by Ownership by Household Size in South Pasadena
| Household Size | Owner-occupied | Renter-occupied |
| 1-Person Household | 886 (31.6%) | 1,917 (68.4%) |
| 2-Person Household | 1,439 (48.6%) | 1,524 (51.4%) |
| 3-Person Household | 1,070 (49.3%) | 1,100 (50.7%) |
| 4+ Person Household | 1,392 (59.5%) | 946 (40.5%) |
| Total Housing Units | 4,787 (46.6%) | 5,487 (53.4%) |
Occupancy by Educational Attainment in South Pasadena
| Household Size | Owner-occupied | Renter-occupied |
| Less than High School | 96 (46.2%) | 112 (53.8%) |
| High School Diploma | 267 (42.4%) | 363 (57.6%) |
| College/Associate Degree | 584 (33.8%) | 1,142 (66.2%) |
| Bachelor's Degree or higher | 3,840 (49.8%) | 3,870 (50.2%) |
Occupancy by Age of Householder in South Pasadena
| Age Bracket | # Households | % Households |
| Under 35 Years | 1,357 | 13.2% |
| 35 to 44 Years | 2,571 | 25.0% |
| 45 to 54 Years | 2,499 | 24.3% |
| 55 to 64 Years | 1,747 | 17.0% |
| 65 to 74 Years | 1,230 | 12.0% |
| 75 to 84 Years | 666 | 6.5% |
| 85 Years and Over | 204 | 2.0% |
| Total | 10,274 | 100.0% |
Housing Finances in South Pasadena
Median Income by Occupancy in South Pasadena
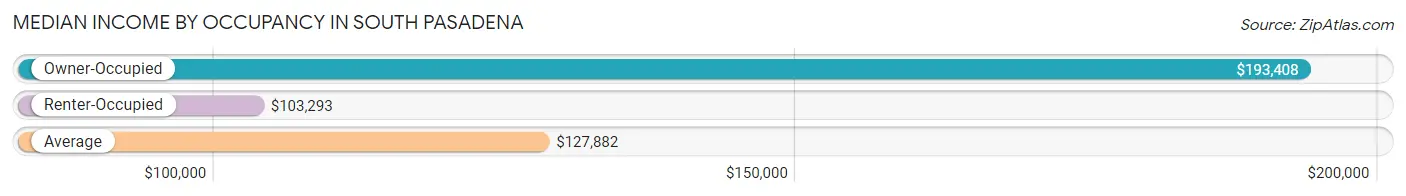
| Occupancy Type | # Households | Median Income |
| Owner-Occupied | 4,787 (46.6%) | $193,408 |
| Renter-Occupied | 5,487 (53.4%) | $103,293 |
| Average | 10,274 (100.0%) | $127,882 |
Occupancy by Householder Income Bracket in South Pasadena
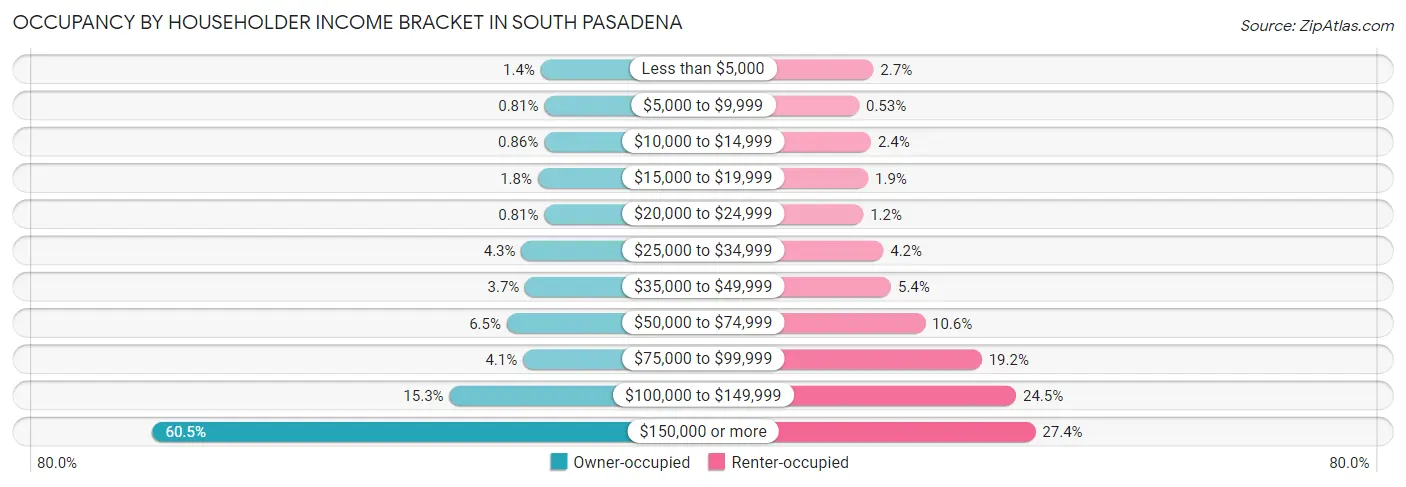
| Income Bracket | Owner-occupied | Renter-occupied |
| Less than $5,000 | 65 (1.4%) | 149 (2.7%) |
| $5,000 to $9,999 | 39 (0.8%) | 29 (0.5%) |
| $10,000 to $14,999 | 41 (0.9%) | 129 (2.4%) |
| $15,000 to $19,999 | 86 (1.8%) | 105 (1.9%) |
| $20,000 to $24,999 | 39 (0.8%) | 64 (1.2%) |
| $25,000 to $34,999 | 206 (4.3%) | 232 (4.2%) |
| $35,000 to $49,999 | 178 (3.7%) | 297 (5.4%) |
| $50,000 to $74,999 | 312 (6.5%) | 581 (10.6%) |
| $75,000 to $99,999 | 194 (4.1%) | 1,055 (19.2%) |
| $100,000 to $149,999 | 731 (15.3%) | 1,342 (24.5%) |
| $150,000 or more | 2,896 (60.5%) | 1,504 (27.4%) |
| Total | 4,787 (100.0%) | 5,487 (100.0%) |
Monthly Housing Cost Tiers in South Pasadena
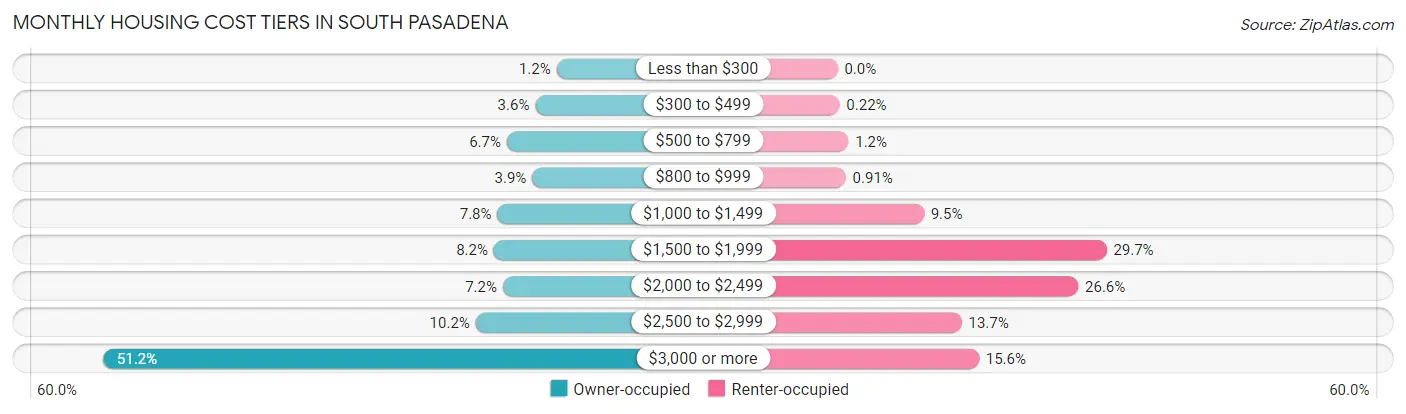
| Monthly Cost | Owner-occupied | Renter-occupied |
| Less than $300 | 59 (1.2%) | 0 (0.0%) |
| $300 to $499 | 172 (3.6%) | 12 (0.2%) |
| $500 to $799 | 322 (6.7%) | 66 (1.2%) |
| $800 to $999 | 188 (3.9%) | 50 (0.9%) |
| $1,000 to $1,499 | 372 (7.8%) | 523 (9.5%) |
| $1,500 to $1,999 | 391 (8.2%) | 1,631 (29.7%) |
| $2,000 to $2,499 | 343 (7.2%) | 1,459 (26.6%) |
| $2,500 to $2,999 | 487 (10.2%) | 752 (13.7%) |
| $3,000 or more | 2,453 (51.2%) | 857 (15.6%) |
| Total | 4,787 (100.0%) | 5,487 (100.0%) |
Physical Housing Characteristics in South Pasadena
Housing Structures in South Pasadena
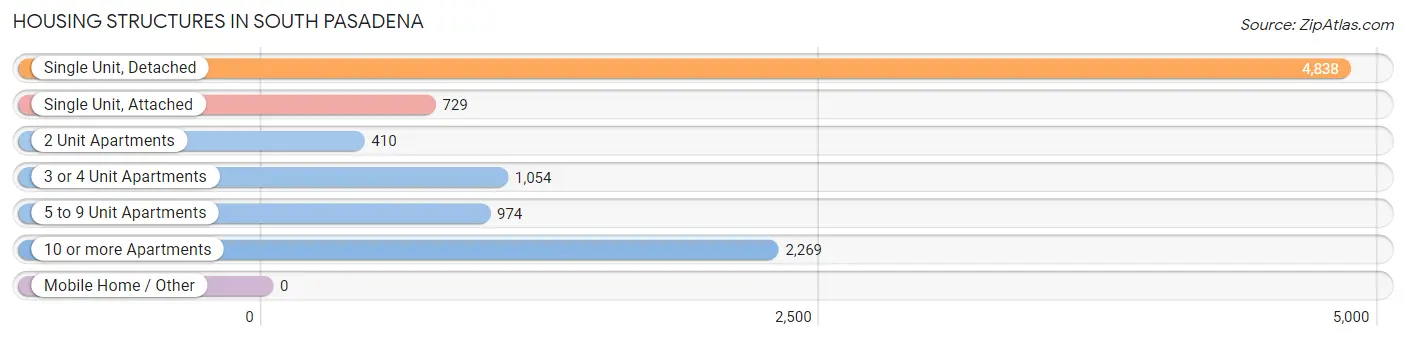
| Structure Type | # Housing Units | % Housing Units |
| Single Unit, Detached | 4,838 | 47.1% |
| Single Unit, Attached | 729 | 7.1% |
| 2 Unit Apartments | 410 | 4.0% |
| 3 or 4 Unit Apartments | 1,054 | 10.3% |
| 5 to 9 Unit Apartments | 974 | 9.5% |
| 10 or more Apartments | 2,269 | 22.1% |
| Mobile Home / Other | 0 | 0.0% |
| Total | 10,274 | 100.0% |
Housing Structures by Occupancy in South Pasadena
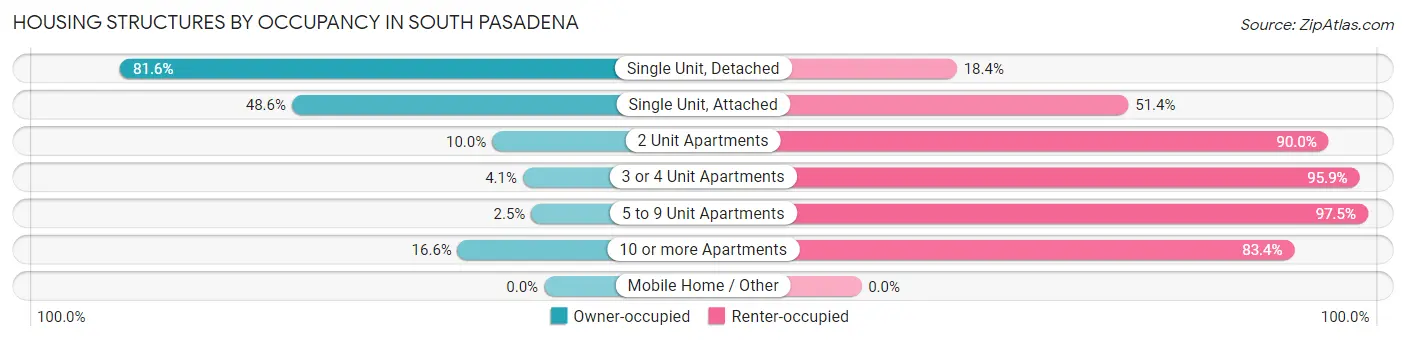
| Structure Type | Owner-occupied | Renter-occupied |
| Single Unit, Detached | 3,948 (81.6%) | 890 (18.4%) |
| Single Unit, Attached | 354 (48.6%) | 375 (51.4%) |
| 2 Unit Apartments | 41 (10.0%) | 369 (90.0%) |
| 3 or 4 Unit Apartments | 43 (4.1%) | 1,011 (95.9%) |
| 5 to 9 Unit Apartments | 24 (2.5%) | 950 (97.5%) |
| 10 or more Apartments | 377 (16.6%) | 1,892 (83.4%) |
| Mobile Home / Other | 0 (0.0%) | 0 (0.0%) |
| Total | 4,787 (46.6%) | 5,487 (53.4%) |
Housing Structures by Number of Rooms in South Pasadena
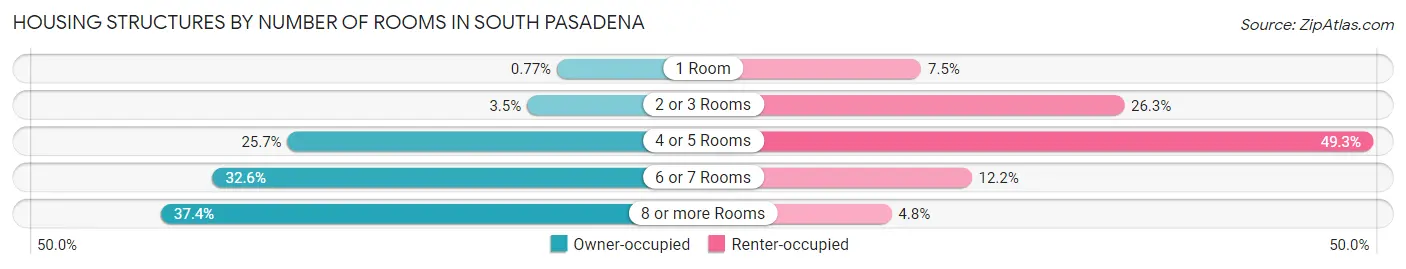
| Number of Rooms | Owner-occupied | Renter-occupied |
| 1 Room | 37 (0.8%) | 412 (7.5%) |
| 2 or 3 Rooms | 169 (3.5%) | 1,442 (26.3%) |
| 4 or 5 Rooms | 1,230 (25.7%) | 2,704 (49.3%) |
| 6 or 7 Rooms | 1,561 (32.6%) | 668 (12.2%) |
| 8 or more Rooms | 1,790 (37.4%) | 261 (4.8%) |
| Total | 4,787 (100.0%) | 5,487 (100.0%) |
Housing Structure by Heating Type in South Pasadena
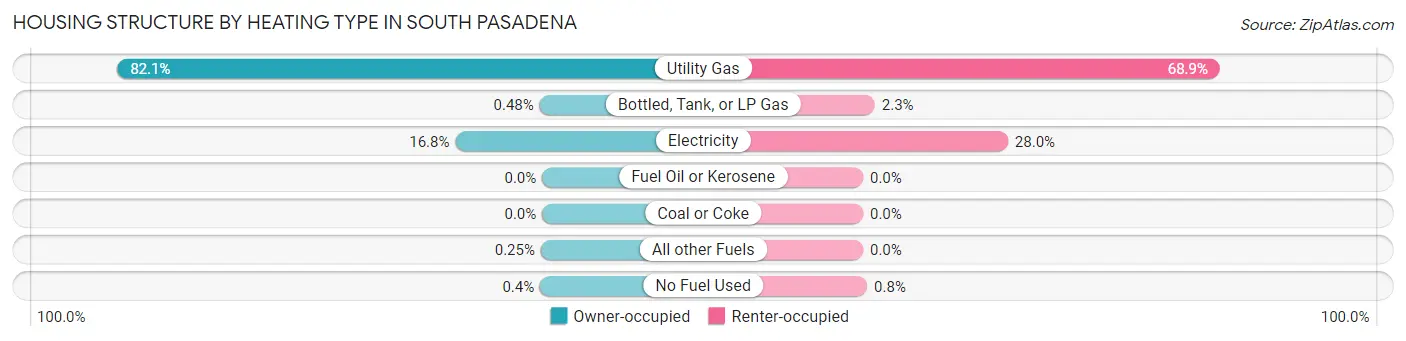
| Heating Type | Owner-occupied | Renter-occupied |
| Utility Gas | 3,930 (82.1%) | 3,782 (68.9%) |
| Bottled, Tank, or LP Gas | 23 (0.5%) | 125 (2.3%) |
| Electricity | 803 (16.8%) | 1,536 (28.0%) |
| Fuel Oil or Kerosene | 0 (0.0%) | 0 (0.0%) |
| Coal or Coke | 0 (0.0%) | 0 (0.0%) |
| All other Fuels | 12 (0.3%) | 0 (0.0%) |
| No Fuel Used | 19 (0.4%) | 44 (0.8%) |
| Total | 4,787 (100.0%) | 5,487 (100.0%) |
Household Vehicle Usage in South Pasadena
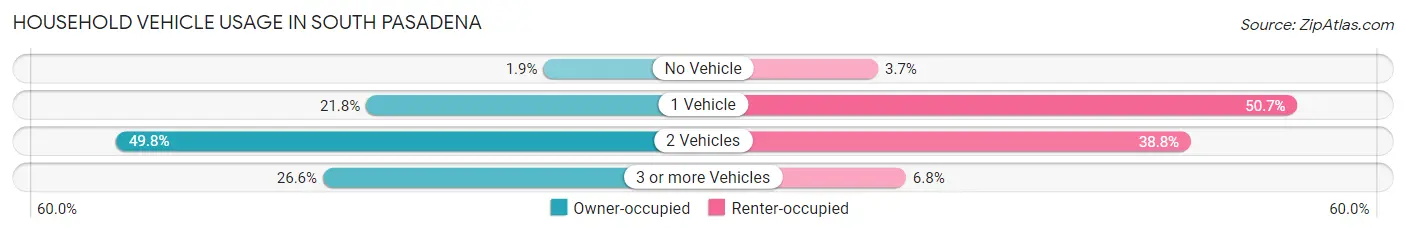
| Vehicles per Household | Owner-occupied | Renter-occupied |
| No Vehicle | 91 (1.9%) | 204 (3.7%) |
| 1 Vehicle | 1,041 (21.7%) | 2,781 (50.7%) |
| 2 Vehicles | 2,382 (49.8%) | 2,127 (38.8%) |
| 3 or more Vehicles | 1,273 (26.6%) | 375 (6.8%) |
| Total | 4,787 (100.0%) | 5,487 (100.0%) |
Real Estate & Mortgages in South Pasadena
Real Estate and Mortgage Overview in South Pasadena
| Characteristic | Without Mortgage | With Mortgage |
| Housing Units | 1,448 | 3,339 |
| Median Property Value | $1,235,500 | $1,509,100 |
| Median Household Income | $119,605 | $2,318 |
| Monthly Housing Costs | $1,010 | $2,445 |
| Real Estate Taxes | $5,343 | $0 |
Property Value by Mortgage Status in South Pasadena
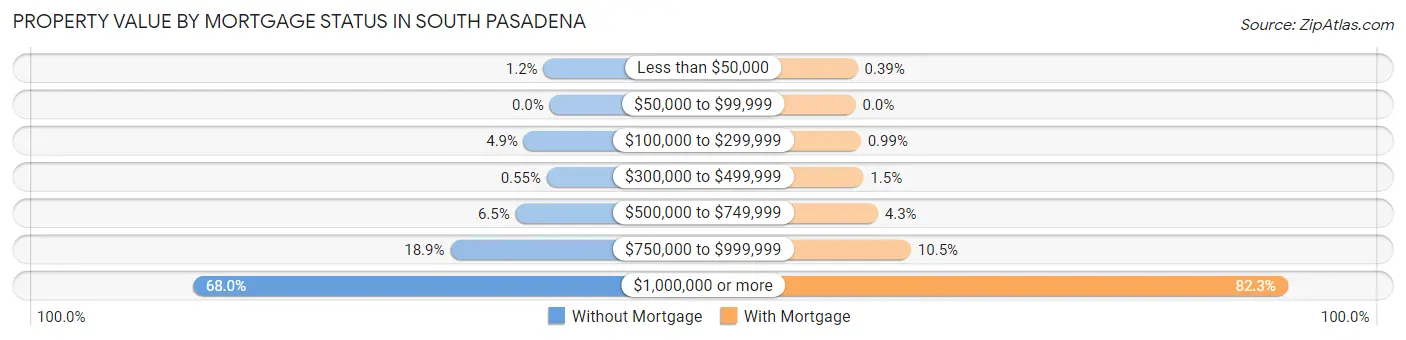
| Property Value | Without Mortgage | With Mortgage |
| Less than $50,000 | 17 (1.2%) | 13 (0.4%) |
| $50,000 to $99,999 | 0 (0.0%) | 0 (0.0%) |
| $100,000 to $299,999 | 71 (4.9%) | 33 (1.0%) |
| $300,000 to $499,999 | 8 (0.5%) | 50 (1.5%) |
| $500,000 to $749,999 | 94 (6.5%) | 142 (4.3%) |
| $750,000 to $999,999 | 274 (18.9%) | 352 (10.5%) |
| $1,000,000 or more | 984 (68.0%) | 2,749 (82.3%) |
| Total | 1,448 (100.0%) | 3,339 (100.0%) |
Household Income by Mortgage Status in South Pasadena
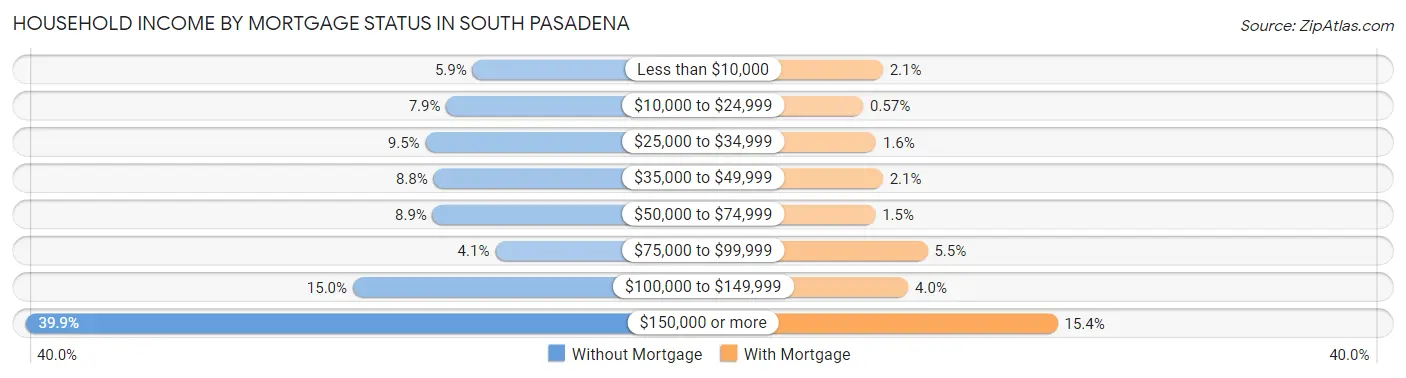
| Household Income | Without Mortgage | With Mortgage |
| Less than $10,000 | 85 (5.9%) | 69 (2.1%) |
| $10,000 to $24,999 | 114 (7.9%) | 19 (0.6%) |
| $25,000 to $34,999 | 137 (9.5%) | 52 (1.6%) |
| $35,000 to $49,999 | 128 (8.8%) | 69 (2.1%) |
| $50,000 to $74,999 | 129 (8.9%) | 50 (1.5%) |
| $75,000 to $99,999 | 60 (4.1%) | 183 (5.5%) |
| $100,000 to $149,999 | 217 (15.0%) | 134 (4.0%) |
| $150,000 or more | 578 (39.9%) | 514 (15.4%) |
| Total | 1,448 (100.0%) | 3,339 (100.0%) |
Property Value to Household Income Ratio in South Pasadena
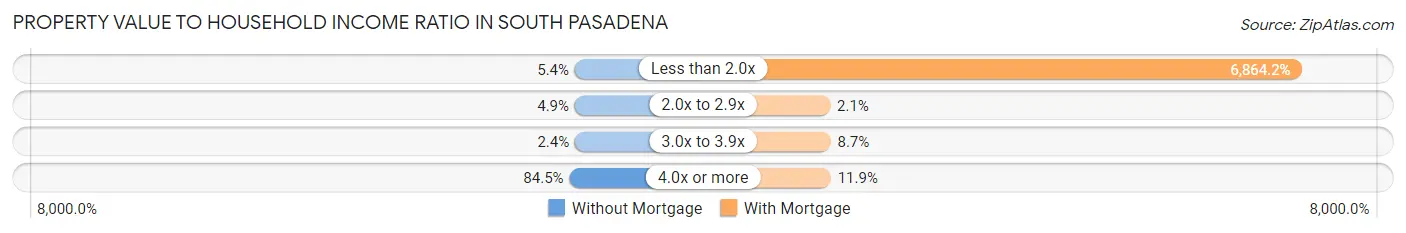
| Value-to-Income Ratio | Without Mortgage | With Mortgage |
| Less than 2.0x | 78 (5.4%) | 229,196 (6,864.2%) |
| 2.0x to 2.9x | 71 (4.9%) | 71 (2.1%) |
| 3.0x to 3.9x | 34 (2.4%) | 289 (8.7%) |
| 4.0x or more | 1,223 (84.5%) | 396 (11.9%) |
| Total | 1,448 (100.0%) | 3,339 (100.0%) |
Real Estate Taxes by Mortgage Status in South Pasadena
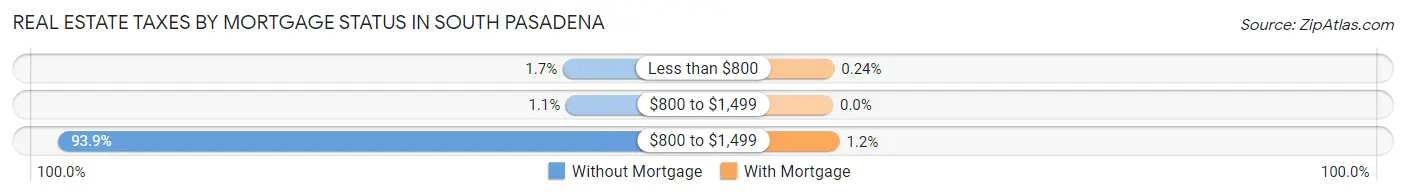
| Property Taxes | Without Mortgage | With Mortgage |
| Less than $800 | 24 (1.7%) | 8 (0.2%) |
| $800 to $1,499 | 16 (1.1%) | 0 (0.0%) |
| $800 to $1,499 | 1,359 (93.9%) | 39 (1.2%) |
| Total | 1,448 (100.0%) | 3,339 (100.0%) |
Health & Disability in South Pasadena
Health Insurance Coverage by Age in South Pasadena
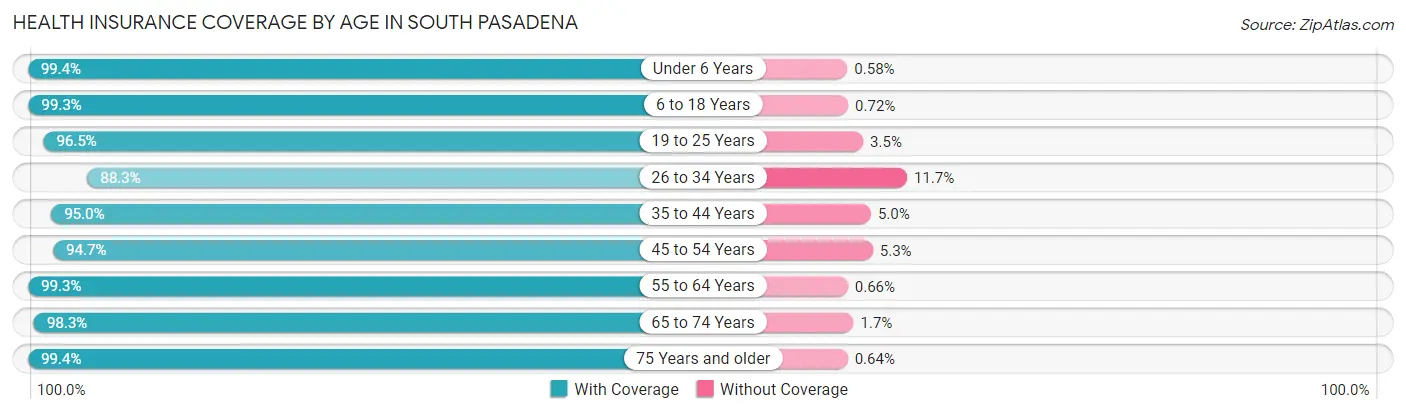
| Age Bracket | With Coverage | Without Coverage |
| Under 6 Years | 1,881 (99.4%) | 11 (0.6%) |
| 6 to 18 Years | 4,443 (99.3%) | 32 (0.7%) |
| 19 to 25 Years | 1,205 (96.5%) | 44 (3.5%) |
| 26 to 34 Years | 2,672 (88.3%) | 354 (11.7%) |
| 35 to 44 Years | 4,589 (95.0%) | 240 (5.0%) |
| 45 to 54 Years | 4,106 (94.7%) | 231 (5.3%) |
| 55 to 64 Years | 2,864 (99.3%) | 19 (0.7%) |
| 65 to 74 Years | 2,142 (98.3%) | 38 (1.7%) |
| 75 Years and older | 1,561 (99.4%) | 10 (0.6%) |
| Total | 25,463 (96.3%) | 979 (3.7%) |
Health Insurance Coverage by Citizenship Status in South Pasadena
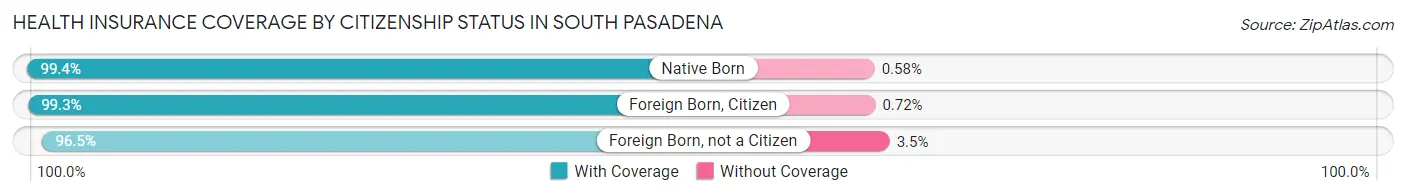
| Citizenship Status | With Coverage | Without Coverage |
| Native Born | 1,881 (99.4%) | 11 (0.6%) |
| Foreign Born, Citizen | 4,443 (99.3%) | 32 (0.7%) |
| Foreign Born, not a Citizen | 1,205 (96.5%) | 44 (3.5%) |
Health Insurance Coverage by Household Income in South Pasadena
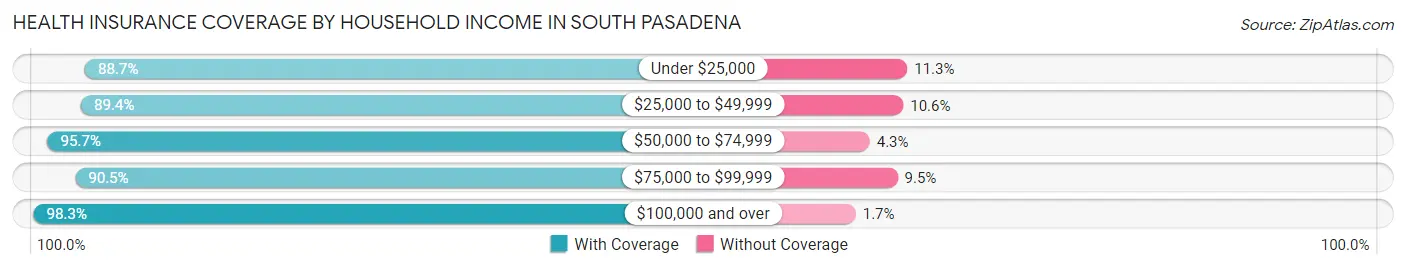
| Household Income | With Coverage | Without Coverage |
| Under $25,000 | 1,119 (88.7%) | 143 (11.3%) |
| $25,000 to $49,999 | 1,378 (89.4%) | 163 (10.6%) |
| $50,000 to $74,999 | 1,464 (95.7%) | 66 (4.3%) |
| $75,000 to $99,999 | 2,719 (90.5%) | 286 (9.5%) |
| $100,000 and over | 18,783 (98.3%) | 321 (1.7%) |
Public vs Private Health Insurance Coverage by Age in South Pasadena
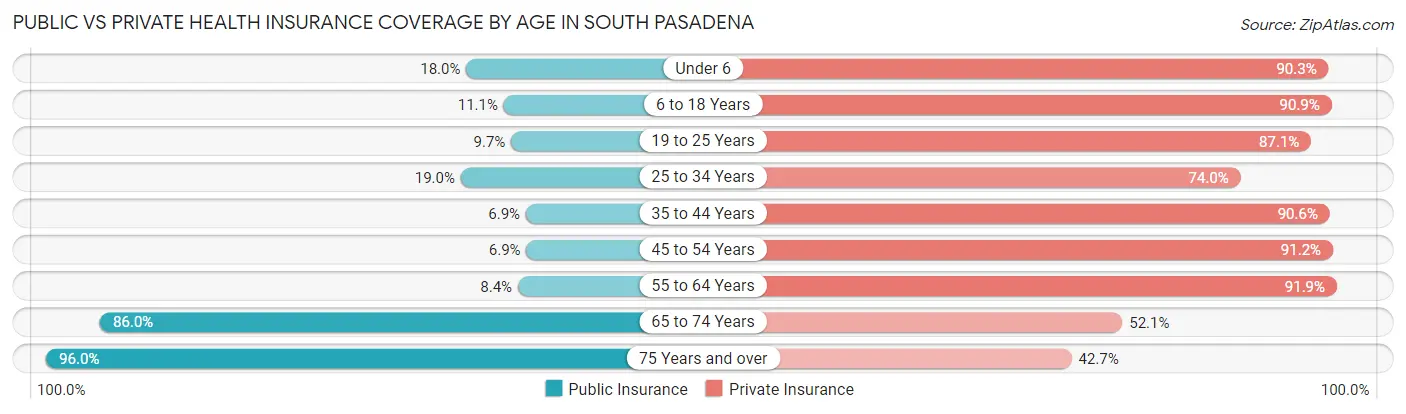
| Age Bracket | Public Insurance | Private Insurance |
| Under 6 | 341 (18.0%) | 1,709 (90.3%) |
| 6 to 18 Years | 495 (11.1%) | 4,068 (90.9%) |
| 19 to 25 Years | 121 (9.7%) | 1,088 (87.1%) |
| 25 to 34 Years | 576 (19.0%) | 2,240 (74.0%) |
| 35 to 44 Years | 335 (6.9%) | 4,373 (90.6%) |
| 45 to 54 Years | 297 (6.9%) | 3,953 (91.1%) |
| 55 to 64 Years | 243 (8.4%) | 2,649 (91.9%) |
| 65 to 74 Years | 1,875 (86.0%) | 1,135 (52.1%) |
| 75 Years and over | 1,508 (96.0%) | 670 (42.6%) |
| Total | 5,791 (21.9%) | 21,885 (82.8%) |
Disability Status by Sex by Age in South Pasadena
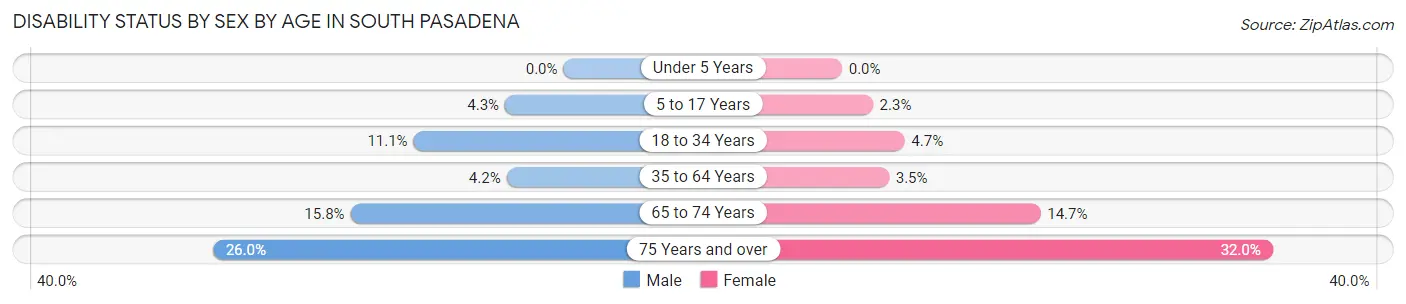
| Age Bracket | Male | Female |
| Under 5 Years | 0 (0.0%) | 0 (0.0%) |
| 5 to 17 Years | 104 (4.3%) | 50 (2.3%) |
| 18 to 34 Years | 253 (11.1%) | 104 (4.6%) |
| 35 to 64 Years | 253 (4.2%) | 211 (3.5%) |
| 65 to 74 Years | 159 (15.8%) | 173 (14.7%) |
| 75 Years and over | 164 (26.0%) | 301 (32.0%) |
Disability Class by Sex by Age in South Pasadena
Disability Class: Hearing Difficulty
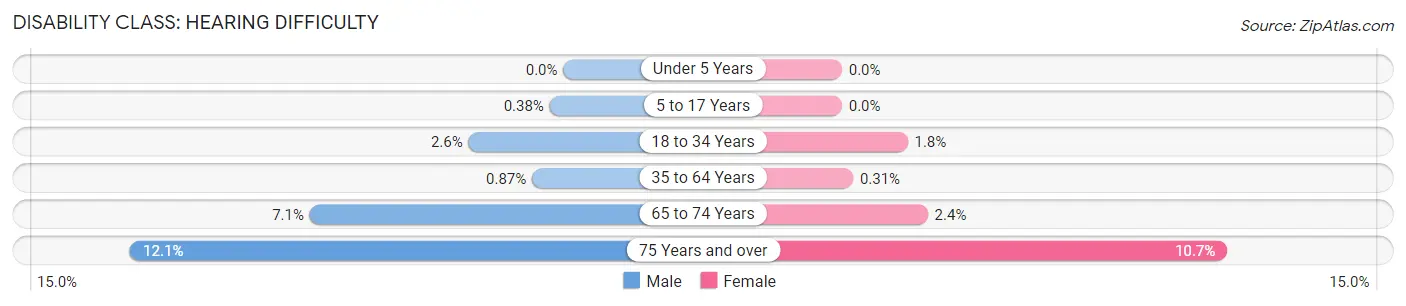
| Age Bracket | Male | Female |
| Under 5 Years | 0 (0.0%) | 0 (0.0%) |
| 5 to 17 Years | 9 (0.4%) | 0 (0.0%) |
| 18 to 34 Years | 60 (2.6%) | 41 (1.8%) |
| 35 to 64 Years | 52 (0.9%) | 19 (0.3%) |
| 65 to 74 Years | 71 (7.1%) | 28 (2.4%) |
| 75 Years and over | 76 (12.1%) | 101 (10.7%) |
Disability Class: Vision Difficulty
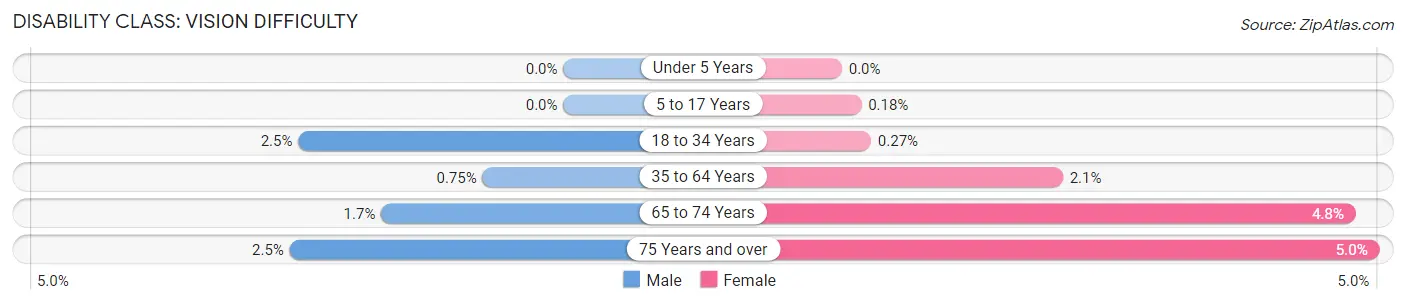
| Age Bracket | Male | Female |
| Under 5 Years | 0 (0.0%) | 0 (0.0%) |
| 5 to 17 Years | 0 (0.0%) | 4 (0.2%) |
| 18 to 34 Years | 56 (2.5%) | 6 (0.3%) |
| 35 to 64 Years | 45 (0.7%) | 124 (2.1%) |
| 65 to 74 Years | 17 (1.7%) | 56 (4.8%) |
| 75 Years and over | 16 (2.5%) | 47 (5.0%) |
Disability Class: Cognitive Difficulty
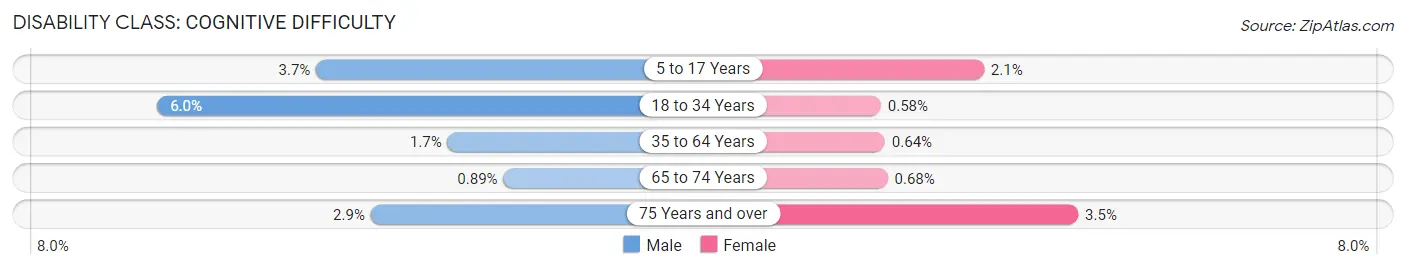
| Age Bracket | Male | Female |
| 5 to 17 Years | 88 (3.7%) | 46 (2.1%) |
| 18 to 34 Years | 137 (6.0%) | 13 (0.6%) |
| 35 to 64 Years | 103 (1.7%) | 39 (0.6%) |
| 65 to 74 Years | 9 (0.9%) | 8 (0.7%) |
| 75 Years and over | 18 (2.9%) | 33 (3.5%) |
Disability Class: Ambulatory Difficulty
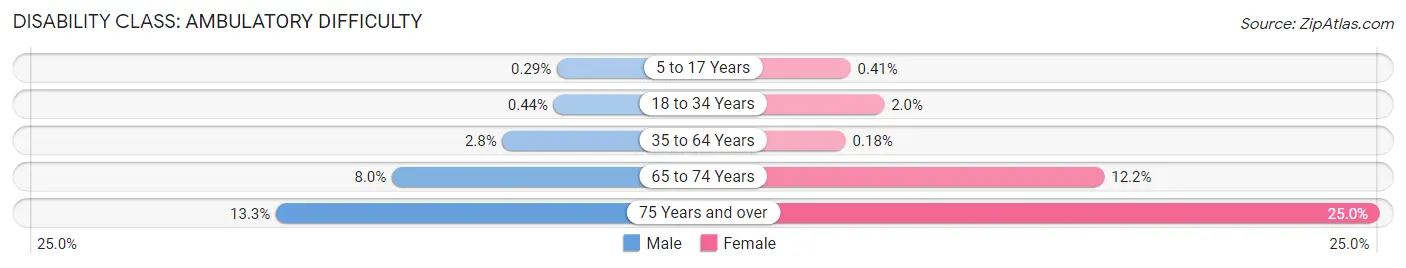
| Age Bracket | Male | Female |
| 5 to 17 Years | 7 (0.3%) | 9 (0.4%) |
| 18 to 34 Years | 10 (0.4%) | 44 (2.0%) |
| 35 to 64 Years | 169 (2.8%) | 11 (0.2%) |
| 65 to 74 Years | 80 (8.0%) | 143 (12.2%) |
| 75 Years and over | 84 (13.3%) | 235 (25.0%) |
Disability Class: Self-Care Difficulty
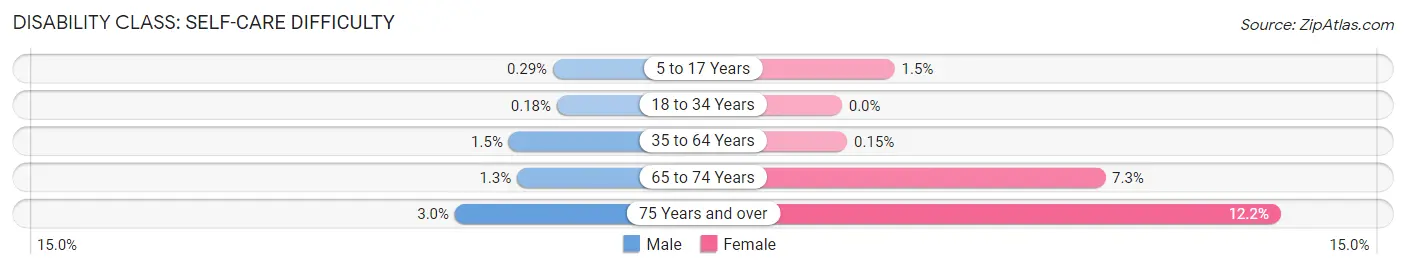
| Age Bracket | Male | Female |
| 5 to 17 Years | 7 (0.3%) | 32 (1.5%) |
| 18 to 34 Years | 4 (0.2%) | 0 (0.0%) |
| 35 to 64 Years | 91 (1.5%) | 9 (0.2%) |
| 65 to 74 Years | 13 (1.3%) | 86 (7.3%) |
| 75 Years and over | 19 (3.0%) | 115 (12.2%) |
Technology Access in South Pasadena
Computing Device Access in South Pasadena
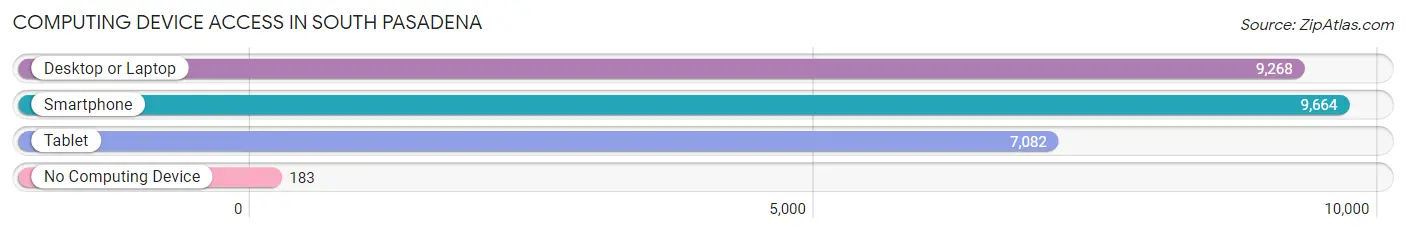
| Device Type | # Households | % Households |
| Desktop or Laptop | 9,268 | 90.2% |
| Smartphone | 9,664 | 94.1% |
| Tablet | 7,082 | 68.9% |
| No Computing Device | 183 | 1.8% |
| Total | 10,274 | 100.0% |
Internet Access in South Pasadena
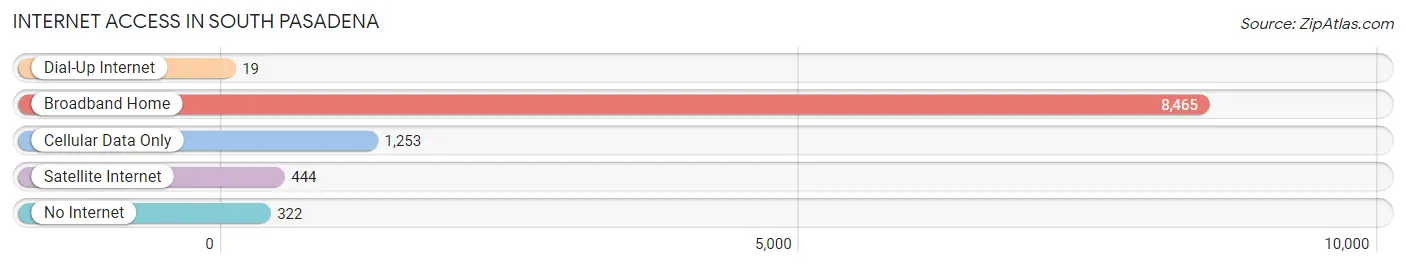
| Internet Type | # Households | % Households |
| Dial-Up Internet | 19 | 0.2% |
| Broadband Home | 8,465 | 82.4% |
| Cellular Data Only | 1,253 | 12.2% |
| Satellite Internet | 444 | 4.3% |
| No Internet | 322 | 3.1% |
| Total | 10,274 | 100.0% |
South Pasadena Summary
History
South Pasadena is a city located in Los Angeles County, California, United States. It is a small, affluent suburb of Los Angeles, located just south of Pasadena. The city was incorporated in 1888 and has a population of approximately 25,000 people.
The area that is now South Pasadena was originally inhabited by the Tongva people, who were later displaced by Spanish settlers in the late 18th century. The area was part of the Rancho San Pascual, which was granted to the Lugo family in 1837. The Lugo family sold the land to the John H. Woodworth family in 1875, who then subdivided the land and sold it off to developers.
The city of South Pasadena was officially incorporated in 1888, and the first mayor was elected in 1889. The city was originally known as “South Pasadenia”, but the name was changed to South Pasadena in 1895.
The city experienced rapid growth in the early 20th century, and by the 1920s it had become a popular residential area for wealthy Angelenos. The city was also home to a number of prominent businesses, including the Southern California Edison Company and the Pasadena Playhouse.
In the 1950s, South Pasadena experienced a period of decline as many of its residents moved to the suburbs. However, the city has since experienced a resurgence, and today it is a popular destination for tourists and locals alike.
Geography
South Pasadena is located in Los Angeles County, California, United States. It is situated just south of Pasadena, and is bordered by the cities of Alhambra, San Marino, and San Gabriel. The city covers an area of 4.2 square miles, and has a population of approximately 25,000 people.
The city is located in the San Gabriel Valley, and is surrounded by the San Gabriel Mountains to the north and the San Rafael Hills to the south. The Arroyo Seco runs through the city, and is a popular destination for hikers and cyclists.
Economy
South Pasadena is a small, affluent city, and its economy is largely based on the service industry. The city is home to a number of small businesses, including restaurants, retail stores, and professional services.
The city is also home to a number of large employers, including the Southern California Edison Company, the Pasadena Playhouse, and the South Pasadena Unified School District.
Demographics
As of the 2010 census, South Pasadena had a population of 25,619 people. The racial makeup of the city was 68.2% White, 11.3% Asian, 8.2% Hispanic or Latino, 6.3% African American, and 4.9% from other races.
The median household income in South Pasadena was $76,837, and the median family income was $93,837. The per capita income was $41,945.
Conclusion
South Pasadena is a small, affluent city located in Los Angeles County, California. It was originally inhabited by the Tongva people, and was later settled by Spanish settlers in the late 18th century. The city was incorporated in 1888, and has since become a popular destination for tourists and locals alike. The city has a population of approximately 25,000 people, and its economy is largely based on the service industry. The racial makeup of the city is predominantly White, with significant Asian, Hispanic, and African American populations. The median household income in South Pasadena is $76,837, and the per capita income is $41,945.
Common Questions
What is Per Capita Income in South Pasadena?
Per Capita income in South Pasadena is $71,865.
What is the Median Family Income in South Pasadena?
Median Family Income in South Pasadena is $170,366.
What is the Median Household income in South Pasadena?
Median Household Income in South Pasadena is $127,882.
What is Income or Wage Gap in South Pasadena?
Income or Wage Gap in South Pasadena is 28.0%.
Women in South Pasadena earn 72.0 cents for every dollar earned by a man.
What is Inequality or Gini Index in South Pasadena?
Inequality or Gini Index in South Pasadena is 0.47.
What is the Total Population of South Pasadena?
Total Population of South Pasadena is 26,583.
What is the Total Male Population of South Pasadena?
Total Male Population of South Pasadena is 13,299.
What is the Total Female Population of South Pasadena?
Total Female Population of South Pasadena is 13,284.
What is the Ratio of Males per 100 Females in South Pasadena?
There are 100.11 Males per 100 Females in South Pasadena.
What is the Ratio of Females per 100 Males in South Pasadena?
There are 99.89 Females per 100 Males in South Pasadena.
What is the Median Population Age in South Pasadena?
Median Population Age in South Pasadena is 40.6 Years.
What is the Average Family Size in South Pasadena
Average Family Size in South Pasadena is 3.2 People.
What is the Average Household Size in South Pasadena
Average Household Size in South Pasadena is 2.6 People.
How Large is the Labor Force in South Pasadena?
There are 14,713 People in the Labor Forcein in South Pasadena.
What is the Percentage of People in the Labor Force in South Pasadena?
69.9% of People are in the Labor Force in South Pasadena.
What is the Unemployment Rate in South Pasadena?
Unemployment Rate in South Pasadena is 5.2%.