Diablo, CA Map & Demographics
Diablo Map
Diablo Overview
$123,586
PER CAPITA INCOME
$250,001
AVG FAMILY INCOME
$250,001
AVG HOUSEHOLD INCOME
0.48
INEQUALITY / GINI INDEX
772
TOTAL POPULATION
349
MALE POPULATION
423
FEMALE POPULATION
82.51
MALES / 100 FEMALES
121.20
FEMALES / 100 MALES
37.4
MEDIAN AGE
3.2
AVG FAMILY SIZE
3.1
AVG HOUSEHOLD SIZE
288
LABOR FORCE [ PEOPLE ]
52.1%
PERCENT IN LABOR FORCE
14.9%
UNEMPLOYMENT RATE
Diablo Zip Codes
Income in Diablo
Income Overview in Diablo
Per Capita Income in Diablo is $123,586, while median incomes of families and households are $250,001 and $250,001 respectively.
| Characteristic | Number | Measure |
| Per Capita Income | 772 | $123,586 |
| Median Family Income | 237 | $250,001 |
| Mean Family Income | 237 | $391,579 |
| Median Household Income | 250 | $250,001 |
| Mean Household Income | 250 | $392,937 |
| Income Deficit | 237 | $0 |
| Wage / Income Gap (%) | 772 | 0.00% |
| Wage / Income Gap ($) | 772 | 100.00¢ per $1 |
| Gini / Inequality Index | 772 | 0.48 |
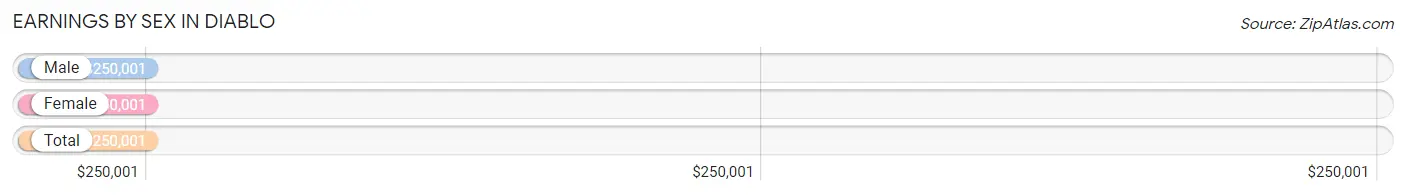
Earnings by Sex in Diablo
Average Earnings in Diablo are $250,001, $250,001 for men and $250,001 for women, a difference of 0.0%.
| Sex | Number | Average Earnings |
| Male | 190 (60.7%) | $250,001 |
| Female | 123 (39.3%) | $250,001 |
| Total | 313 (100.0%) | $250,001 |
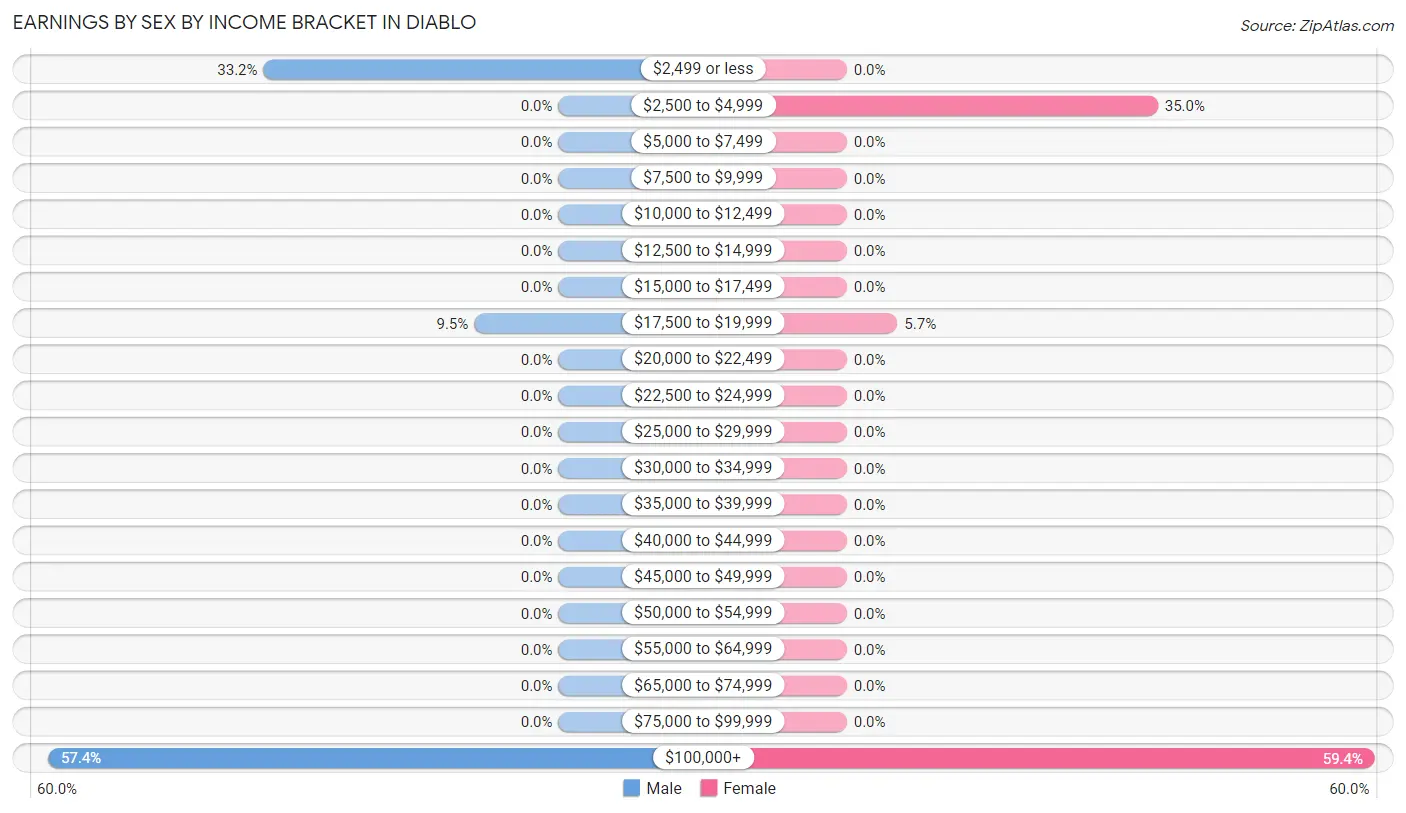
Earnings by Sex by Income Bracket in Diablo
The most common earnings brackets in Diablo are $100,000+ for men (109 | 57.4%) and $100,000+ for women (73 | 59.4%).
| Income | Male | Female |
| $2,499 or less | 63 (33.2%) | 0 (0.0%) |
| $2,500 to $4,999 | 0 (0.0%) | 43 (35.0%) |
| $5,000 to $7,499 | 0 (0.0%) | 0 (0.0%) |
| $7,500 to $9,999 | 0 (0.0%) | 0 (0.0%) |
| $10,000 to $12,499 | 0 (0.0%) | 0 (0.0%) |
| $12,500 to $14,999 | 0 (0.0%) | 0 (0.0%) |
| $15,000 to $17,499 | 0 (0.0%) | 0 (0.0%) |
| $17,500 to $19,999 | 18 (9.5%) | 7 (5.7%) |
| $20,000 to $22,499 | 0 (0.0%) | 0 (0.0%) |
| $22,500 to $24,999 | 0 (0.0%) | 0 (0.0%) |
| $25,000 to $29,999 | 0 (0.0%) | 0 (0.0%) |
| $30,000 to $34,999 | 0 (0.0%) | 0 (0.0%) |
| $35,000 to $39,999 | 0 (0.0%) | 0 (0.0%) |
| $40,000 to $44,999 | 0 (0.0%) | 0 (0.0%) |
| $45,000 to $49,999 | 0 (0.0%) | 0 (0.0%) |
| $50,000 to $54,999 | 0 (0.0%) | 0 (0.0%) |
| $55,000 to $64,999 | 0 (0.0%) | 0 (0.0%) |
| $65,000 to $74,999 | 0 (0.0%) | 0 (0.0%) |
| $75,000 to $99,999 | 0 (0.0%) | 0 (0.0%) |
| $100,000+ | 109 (57.4%) | 73 (59.4%) |
| Total | 190 (100.0%) | 123 (100.0%) |
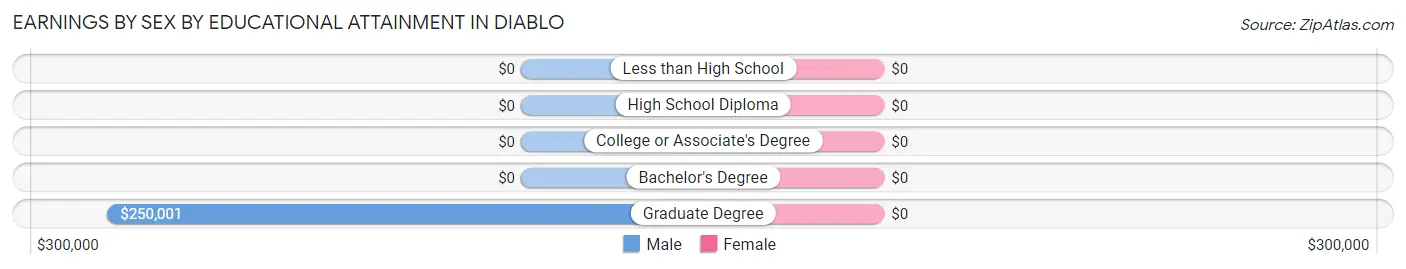
Earnings by Sex by Educational Attainment in Diablo
| Educational Attainment | Male Income | Female Income |
| Less than High School | - | - |
| High School Diploma | - | - |
| College or Associate's Degree | - | - |
| Bachelor's Degree | - | - |
| Graduate Degree | $250,001 | $0 |
| Total | $250,001 | $250,001 |
Family Income in Diablo
Family Income Brackets in Diablo
According to the Diablo family income data, there are 140 families falling into the $200,000+ income range, which is the most common income bracket and makes up 59.1% of all families.
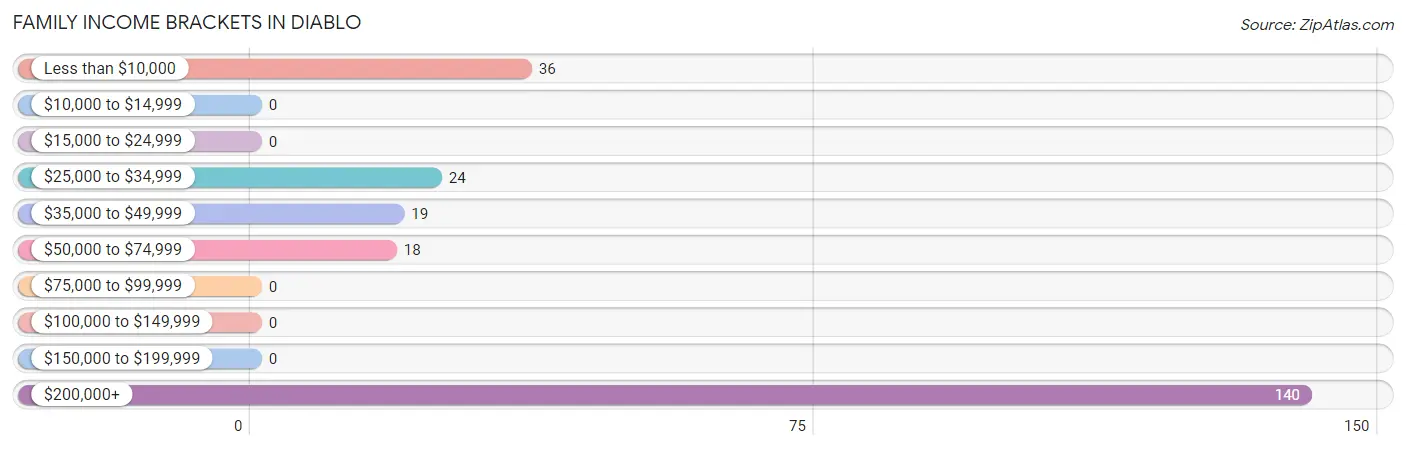
| Income Bracket | # Families | % Families |
| Less than $10,000 | 36 | 15.2% |
| $10,000 to $14,999 | 0 | 0.0% |
| $15,000 to $24,999 | 0 | 0.0% |
| $25,000 to $34,999 | 24 | 10.1% |
| $35,000 to $49,999 | 19 | 8.0% |
| $50,000 to $74,999 | 18 | 7.6% |
| $75,000 to $99,999 | 0 | 0.0% |
| $100,000 to $149,999 | 0 | 0.0% |
| $150,000 to $199,999 | 0 | 0.0% |
| $200,000+ | 140 | 59.1% |
Family Income by Famaliy Size in Diablo
2-person families (95 | 40.1%) account for the highest median family income in Diablo with $250,001 per family, while 2-person families (95 | 40.1%) have the highest median income of $125,000 per family member.
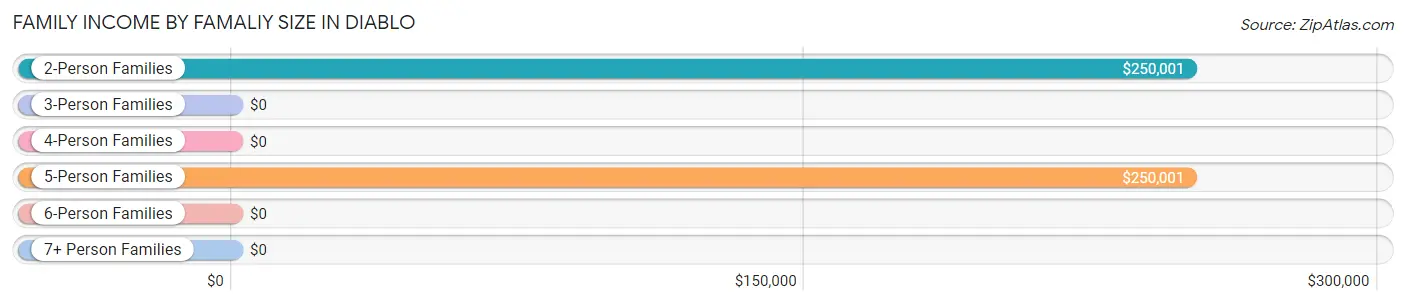
| Income Bracket | # Families | Median Income |
| 2-Person Families | 95 (40.1%) | $250,001 |
| 3-Person Families | 54 (22.8%) | $0 |
| 4-Person Families | 0 (0.0%) | $0 |
| 5-Person Families | 88 (37.1%) | $250,001 |
| 6-Person Families | 0 (0.0%) | $0 |
| 7+ Person Families | 0 (0.0%) | $0 |
| Total | 237 (100.0%) | $250,001 |
Family Income by Number of Earners in Diablo
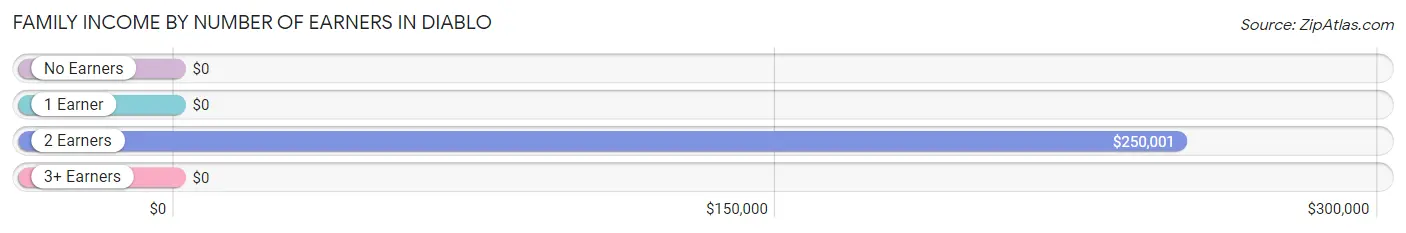
| Number of Earners | # Families | Median Income |
| No Earners | 75 (31.7%) | $0 |
| 1 Earner | 34 (14.3%) | $0 |
| 2 Earners | 121 (51.0%) | $250,001 |
| 3+ Earners | 7 (2.9%) | $0 |
| Total | 237 (100.0%) | $250,001 |
Household Income in Diablo
Household Income Brackets in Diablo
With 153 households falling in the category, the $200,000+ income range is the most frequent in Diablo, accounting for 61.2% of all households.
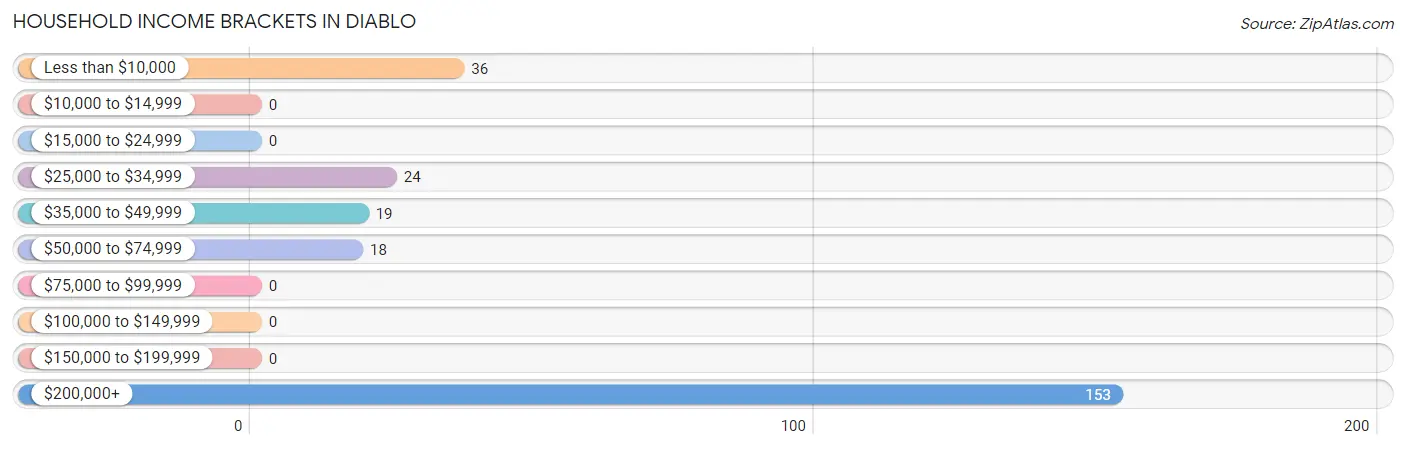
| Income Bracket | # Households | % Households |
| Less than $10,000 | 36 | 14.4% |
| $10,000 to $14,999 | 0 | 0.0% |
| $15,000 to $24,999 | 0 | 0.0% |
| $25,000 to $34,999 | 24 | 9.6% |
| $35,000 to $49,999 | 19 | 7.6% |
| $50,000 to $74,999 | 18 | 7.2% |
| $75,000 to $99,999 | 0 | 0.0% |
| $100,000 to $149,999 | 0 | 0.0% |
| $150,000 to $199,999 | 0 | 0.0% |
| $200,000+ | 153 | 61.2% |
Household Income by Householder Age in Diablo
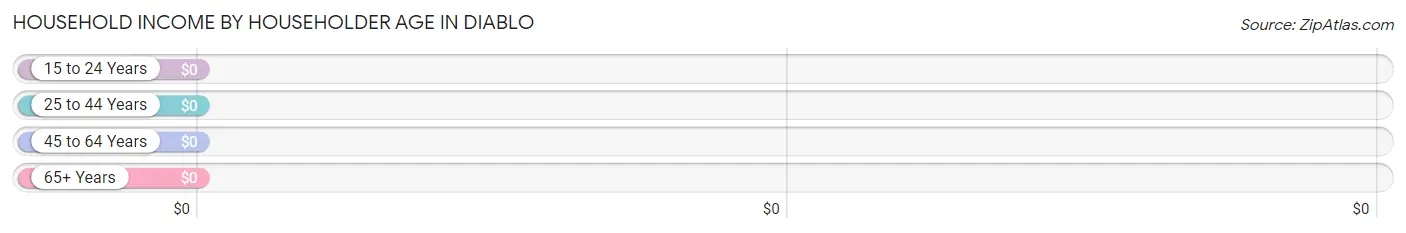
| Income Bracket | # Households | Median Income |
| 15 to 24 Years | 0 (0.0%) | $0 |
| 25 to 44 Years | 81 (32.4%) | $0 |
| 45 to 64 Years | 94 (37.6%) | $0 |
| 65+ Years | 75 (30.0%) | $0 |
| Total | 250 (100.0%) | $250,001 |
Poverty in Diablo
Income Below Poverty by Sex and Age in Diablo
With 12.9% poverty level for males and 18.7% for females among the residents of Diablo, 18 to 24 year old males and 18 to 24 year old females are the most vulnerable to poverty, with 45 males (100.0%) and 43 females (100.0%) in their respective age groups living below the poverty level.
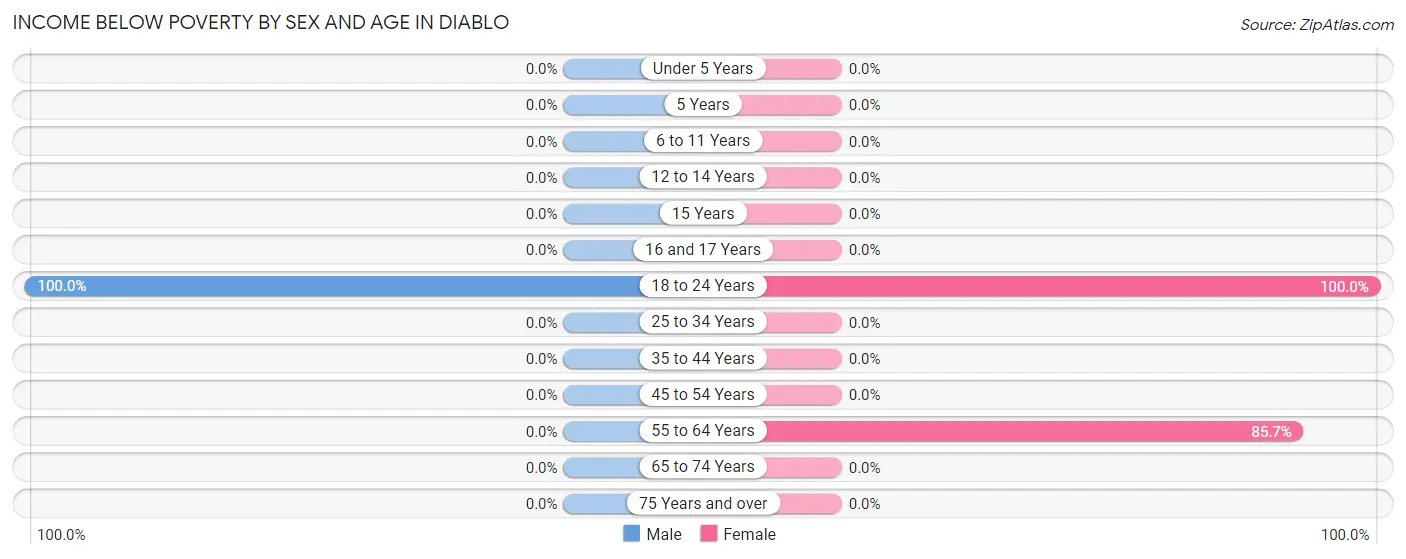
| Age Bracket | Male | Female |
| Under 5 Years | 0 (0.0%) | 0 (0.0%) |
| 5 Years | 0 (0.0%) | 0 (0.0%) |
| 6 to 11 Years | 0 (0.0%) | 0 (0.0%) |
| 12 to 14 Years | 0 (0.0%) | 0 (0.0%) |
| 15 Years | 0 (0.0%) | 0 (0.0%) |
| 16 and 17 Years | 0 (0.0%) | 0 (0.0%) |
| 18 to 24 Years | 45 (100.0%) | 43 (100.0%) |
| 25 to 34 Years | 0 (0.0%) | 0 (0.0%) |
| 35 to 44 Years | 0 (0.0%) | 0 (0.0%) |
| 45 to 54 Years | 0 (0.0%) | 0 (0.0%) |
| 55 to 64 Years | 0 (0.0%) | 36 (85.7%) |
| 65 to 74 Years | 0 (0.0%) | 0 (0.0%) |
| 75 Years and over | 0 (0.0%) | 0 (0.0%) |
| Total | 45 (12.9%) | 79 (18.7%) |
Income Above Poverty by Sex and Age in Diablo
According to the poverty statistics in Diablo, males aged under 5 years and females aged under 5 years are the age groups that are most secure financially, with 100.0% of males and 100.0% of females in these age groups living above the poverty line.
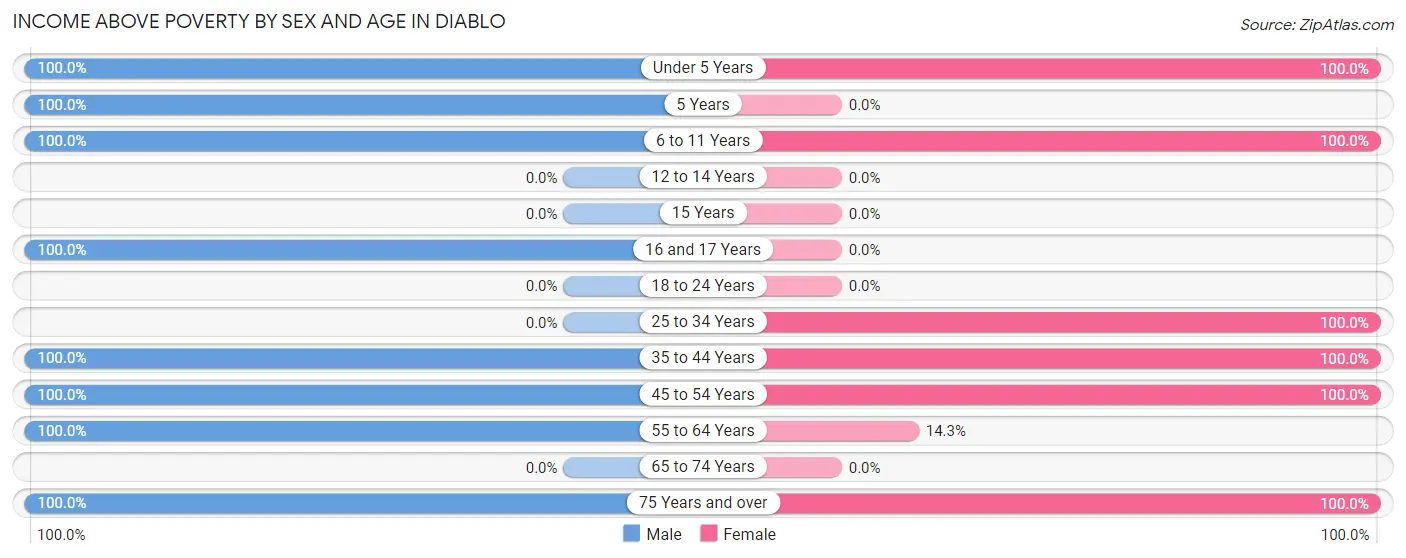
| Age Bracket | Male | Female |
| Under 5 Years | 12 (100.0%) | 67 (100.0%) |
| 5 Years | 59 (100.0%) | 0 (0.0%) |
| 6 to 11 Years | 13 (100.0%) | 68 (100.0%) |
| 12 to 14 Years | 0 (0.0%) | 0 (0.0%) |
| 15 Years | 0 (0.0%) | 0 (0.0%) |
| 16 and 17 Years | 18 (100.0%) | 0 (0.0%) |
| 18 to 24 Years | 0 (0.0%) | 0 (0.0%) |
| 25 to 34 Years | 0 (0.0%) | 7 (100.0%) |
| 35 to 44 Years | 81 (100.0%) | 72 (100.0%) |
| 45 to 54 Years | 21 (100.0%) | 50 (100.0%) |
| 55 to 64 Years | 25 (100.0%) | 6 (14.3%) |
| 65 to 74 Years | 0 (0.0%) | 0 (0.0%) |
| 75 Years and over | 75 (100.0%) | 74 (100.0%) |
| Total | 304 (87.1%) | 344 (81.3%) |
Income Below Poverty Among Married-Couple Families in Diablo
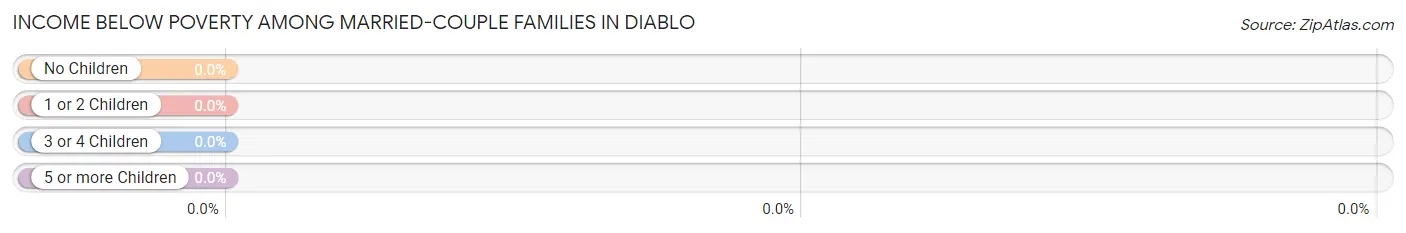
| Children | Above Poverty | Below Poverty |
| No Children | 95 (100.0%) | 0 (0.0%) |
| 1 or 2 Children | 25 (100.0%) | 0 (0.0%) |
| 3 or 4 Children | 81 (100.0%) | 0 (0.0%) |
| 5 or more Children | 0 (0.0%) | 0 (0.0%) |
| Total | 201 (100.0%) | 0 (0.0%) |
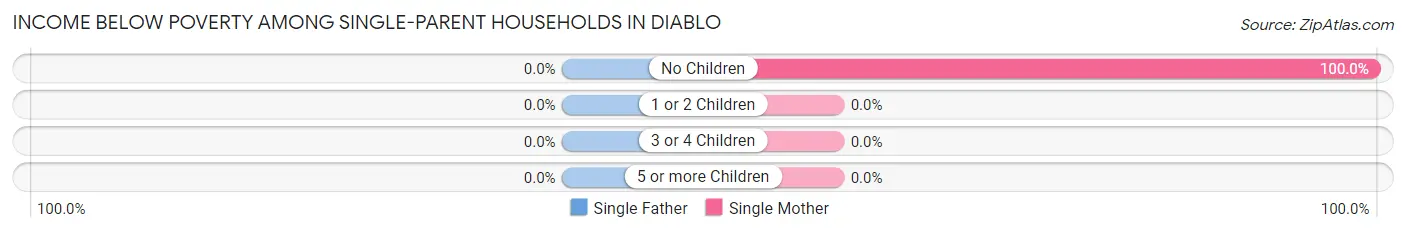
Income Below Poverty Among Single-Parent Households in Diablo
| Children | Single Father | Single Mother |
| No Children | 0 (0.0%) | 36 (100.0%) |
| 1 or 2 Children | 0 (0.0%) | 0 (0.0%) |
| 3 or 4 Children | 0 (0.0%) | 0 (0.0%) |
| 5 or more Children | 0 (0.0%) | 0 (0.0%) |
| Total | 0 (0.0%) | 36 (100.0%) |
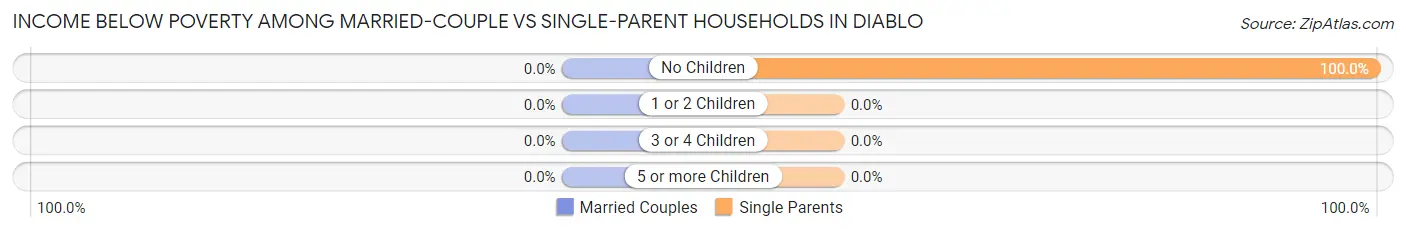
Income Below Poverty Among Married-Couple vs Single-Parent Households in Diablo
| Children | Married-Couple Families | Single-Parent Households |
| No Children | 0 (0.0%) | 36 (100.0%) |
| 1 or 2 Children | 0 (0.0%) | 0 (0.0%) |
| 3 or 4 Children | 0 (0.0%) | 0 (0.0%) |
| 5 or more Children | 0 (0.0%) | 0 (0.0%) |
| Total | 0 (0.0%) | 36 (100.0%) |
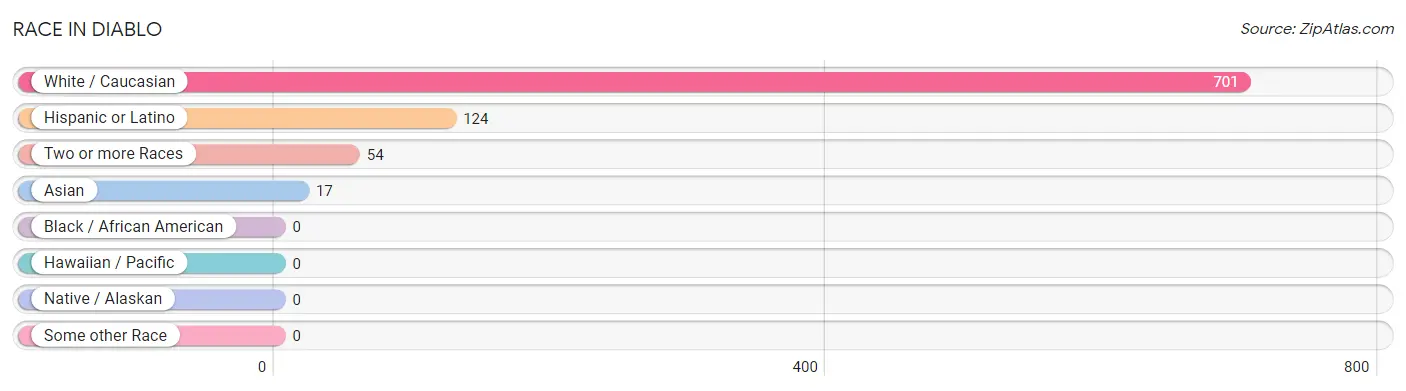
Race in Diablo
The most populous races in Diablo are White / Caucasian (701 | 90.8%), Hispanic or Latino (124 | 16.1%), and Two or more Races (54 | 7.0%).
| Race | # Population | % Population |
| Asian | 17 | 2.2% |
| Black / African American | 0 | 0.0% |
| Hawaiian / Pacific | 0 | 0.0% |
| Hispanic or Latino | 124 | 16.1% |
| Native / Alaskan | 0 | 0.0% |
| White / Caucasian | 701 | 90.8% |
| Two or more Races | 54 | 7.0% |
| Some other Race | 0 | 0.0% |
| Total | 772 | 100.0% |
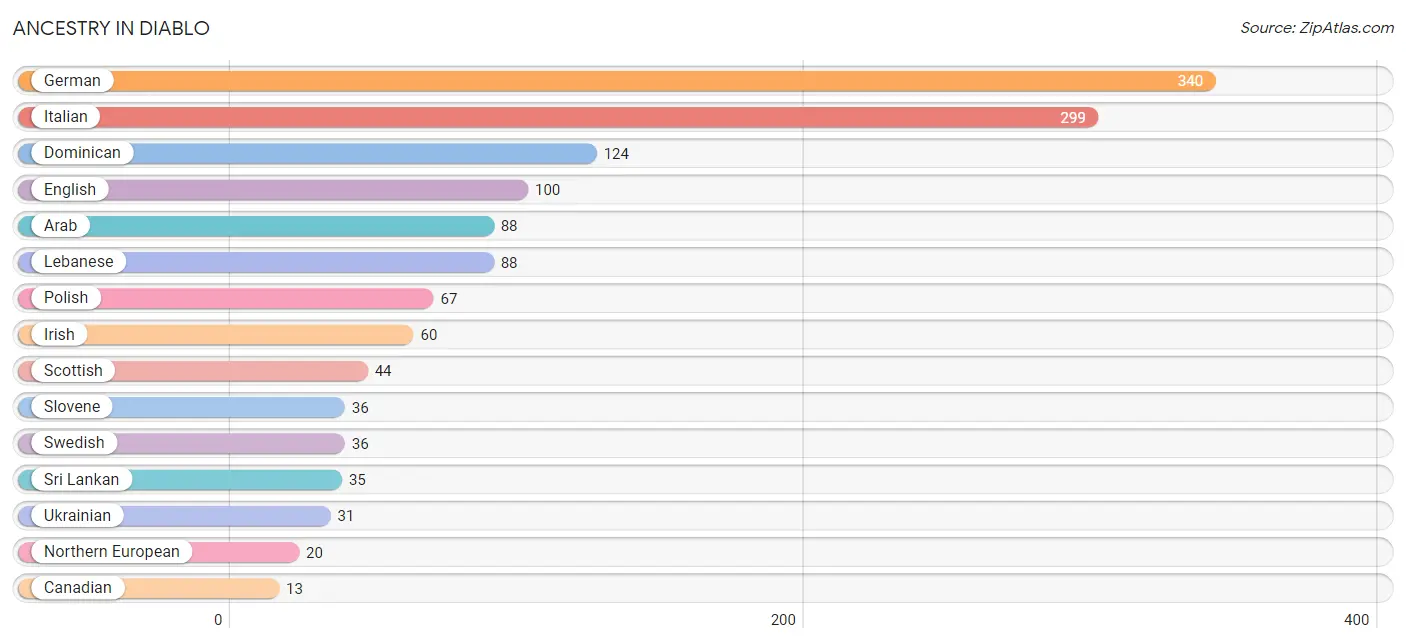
Ancestry in Diablo
The most populous ancestries reported in Diablo are German (340 | 44.0%), Italian (299 | 38.7%), Dominican (124 | 16.1%), English (100 | 13.0%), and Arab (88 | 11.4%), together accounting for 123.2% of all Diablo residents.
| Ancestry | # Population | % Population |
| Arab | 88 | 11.4% |
| Canadian | 13 | 1.7% |
| Dominican | 124 | 16.1% |
| English | 100 | 13.0% |
| German | 340 | 44.0% |
| Irish | 60 | 7.8% |
| Italian | 299 | 38.7% |
| Lebanese | 88 | 11.4% |
| Northern European | 20 | 2.6% |
| Polish | 67 | 8.7% |
| Scandinavian | 6 | 0.8% |
| Scottish | 44 | 5.7% |
| Slovene | 36 | 4.7% |
| Sri Lankan | 35 | 4.5% |
| Swedish | 36 | 4.7% |
| Ukrainian | 31 | 4.0% | View All 16 Rows |
Immigrants in Diablo
The most numerous immigrant groups reported in Diablo came from Caribbean (36 | 4.7%), Dominican Republic (36 | 4.7%), Latin America (36 | 4.7%), Asia (17 | 2.2%), and South Eastern Asia (17 | 2.2%), together accounting for 18.4% of all Diablo residents.
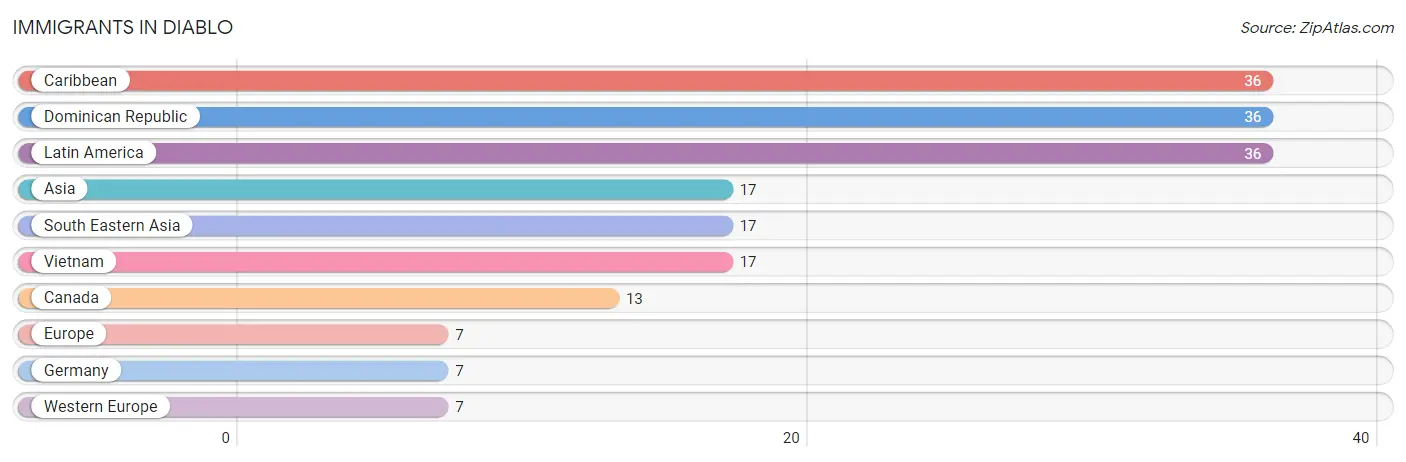
| Immigration Origin | # Population | % Population |
| Asia | 17 | 2.2% |
| Canada | 13 | 1.7% |
| Caribbean | 36 | 4.7% |
| Dominican Republic | 36 | 4.7% |
| Europe | 7 | 0.9% |
| Germany | 7 | 0.9% |
| Latin America | 36 | 4.7% |
| South Eastern Asia | 17 | 2.2% |
| Vietnam | 17 | 2.2% |
| Western Europe | 7 | 0.9% | View All 10 Rows |
Sex and Age in Diablo
Sex and Age in Diablo
The most populous age groups in Diablo are 35 to 39 Years (81 | 23.2%) for men and 75 to 79 Years (74 | 17.5%) for women.
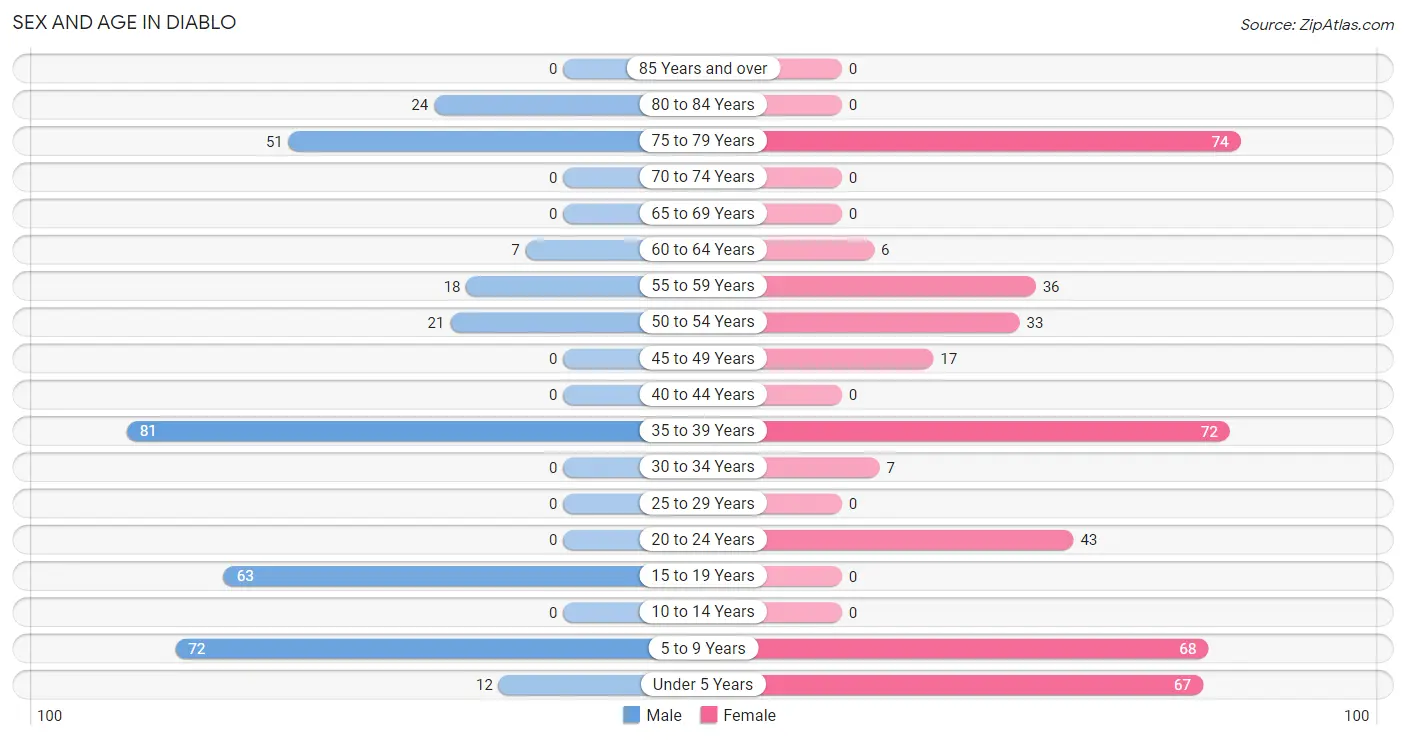
| Age Bracket | Male | Female |
| Under 5 Years | 12 (3.4%) | 67 (15.8%) |
| 5 to 9 Years | 72 (20.6%) | 68 (16.1%) |
| 10 to 14 Years | 0 (0.0%) | 0 (0.0%) |
| 15 to 19 Years | 63 (18.0%) | 0 (0.0%) |
| 20 to 24 Years | 0 (0.0%) | 43 (10.2%) |
| 25 to 29 Years | 0 (0.0%) | 0 (0.0%) |
| 30 to 34 Years | 0 (0.0%) | 7 (1.7%) |
| 35 to 39 Years | 81 (23.2%) | 72 (17.0%) |
| 40 to 44 Years | 0 (0.0%) | 0 (0.0%) |
| 45 to 49 Years | 0 (0.0%) | 17 (4.0%) |
| 50 to 54 Years | 21 (6.0%) | 33 (7.8%) |
| 55 to 59 Years | 18 (5.2%) | 36 (8.5%) |
| 60 to 64 Years | 7 (2.0%) | 6 (1.4%) |
| 65 to 69 Years | 0 (0.0%) | 0 (0.0%) |
| 70 to 74 Years | 0 (0.0%) | 0 (0.0%) |
| 75 to 79 Years | 51 (14.6%) | 74 (17.5%) |
| 80 to 84 Years | 24 (6.9%) | 0 (0.0%) |
| 85 Years and over | 0 (0.0%) | 0 (0.0%) |
| Total | 349 (100.0%) | 423 (100.0%) |
Families and Households in Diablo
Median Family Size in Diablo
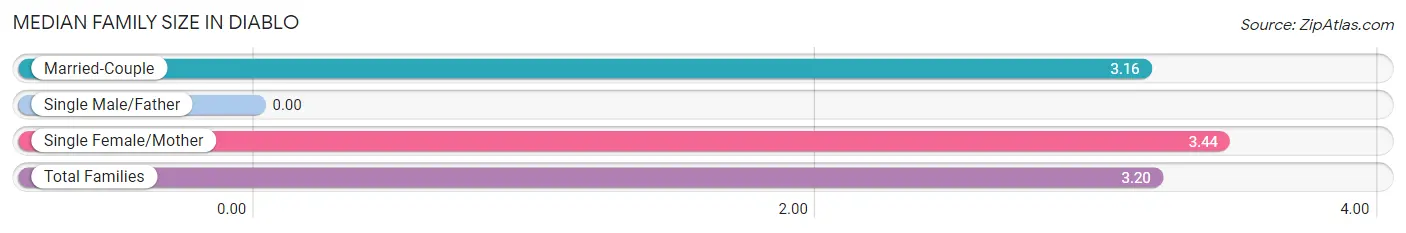
| Family Type | # Families | Family Size |
| Married-Couple | 201 (84.8%) | 3.16 |
| Single Male/Father | 0 (0.0%) | - |
| Single Female/Mother | 36 (15.2%) | 3.44 |
| Total Families | 237 (100.0%) | 3.20 |
Median Household Size in Diablo
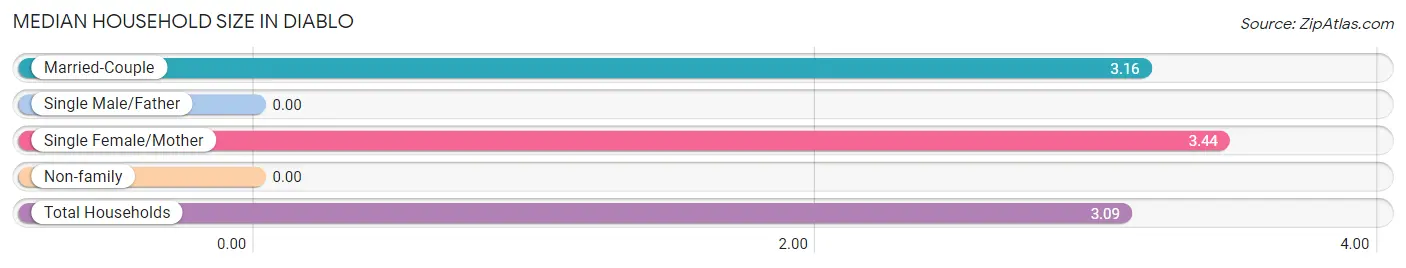
| Household Type | # Households | Household Size |
| Married-Couple | 201 (80.4%) | 3.16 |
| Single Male/Father | 0 (0.0%) | - |
| Single Female/Mother | 36 (14.4%) | 3.44 |
| Non-family | 13 (5.2%) | - |
| Total Households | 250 (100.0%) | 3.09 |
Household Size by Marriage Status in Diablo
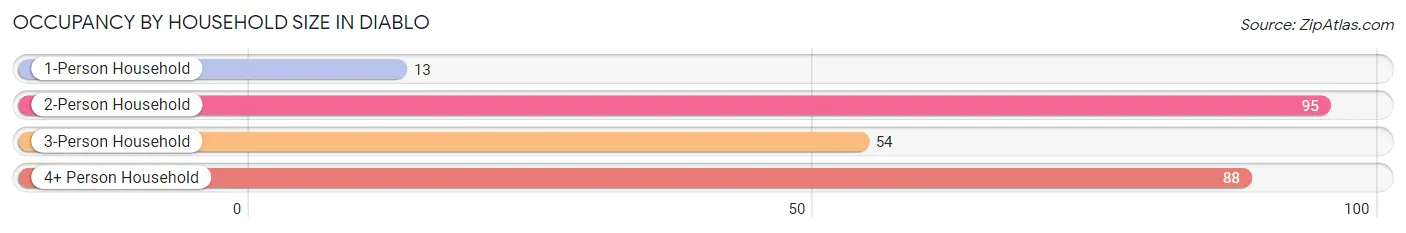
Out of a total of 250 households in Diablo, 237 (94.8%) are family households, while 13 (5.2%) are nonfamily households. The most numerous type of family households are 2-person households, comprising 95, and the most common type of nonfamily households are 1-person households, comprising 13.
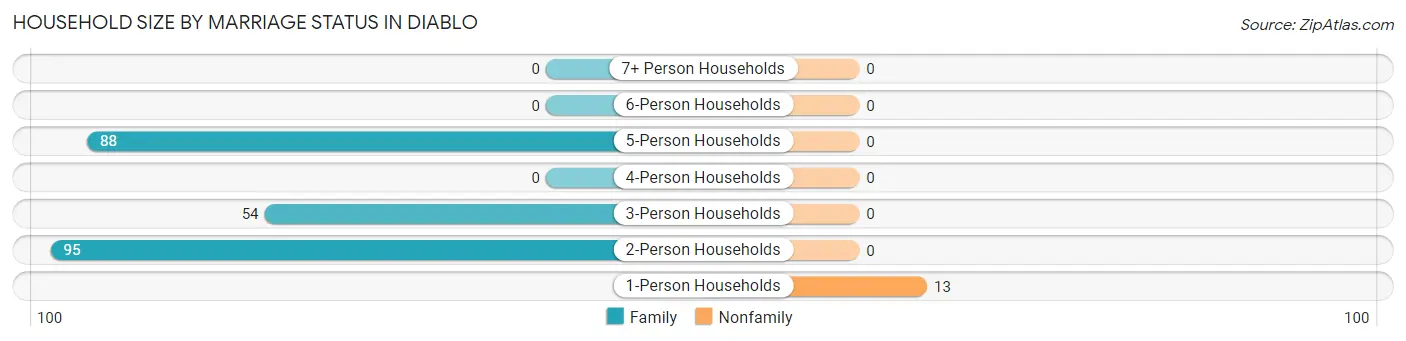
| Household Size | Family Households | Nonfamily Households |
| 1-Person Households | - | 13 (5.2%) |
| 2-Person Households | 95 (38.0%) | 0 (0.0%) |
| 3-Person Households | 54 (21.6%) | 0 (0.0%) |
| 4-Person Households | 0 (0.0%) | 0 (0.0%) |
| 5-Person Households | 88 (35.2%) | 0 (0.0%) |
| 6-Person Households | 0 (0.0%) | 0 (0.0%) |
| 7+ Person Households | 0 (0.0%) | 0 (0.0%) |
| Total | 237 (94.8%) | 13 (5.2%) |
Female Fertility in Diablo
Fertility by Age in Diablo
| Age Bracket | Women with Births | Births / 1,000 Women |
| 15 to 19 years | 0 (0.0%) | 0.0 |
| 20 to 34 years | 0 (0.0%) | 0.0 |
| 35 to 50 years | 0 (0.0%) | 0.0 |
| Total | 0 (0.0%) | 0.0 |
Fertility by Age by Marriage Status in Diablo
| Age Bracket | Married | Unmarried |
| 15 to 19 years | 0 (0.0%) | 0 (0.0%) |
| 20 to 34 years | 0 (0.0%) | 0 (0.0%) |
| 35 to 50 years | 0 (0.0%) | 0 (0.0%) |
| Total | 0 (0.0%) | 0 (0.0%) |
Fertility by Education in Diablo
| Educational Attainment | Women with Births | Births / 1,000 Women |
| Less than High School | 0 (0.0%) | 0.0 |
| High School Diploma | 0 (0.0%) | 0.0 |
| College or Associate's Degree | 0 (0.0%) | 0.0 |
| Bachelor's Degree | 0 (0.0%) | 0.0 |
| Graduate Degree | 0 (0.0%) | 0.0 |
| Total | 0 (0.0%) | 0.0 |
Fertility by Education by Marriage Status in Diablo
| Educational Attainment | Married | Unmarried |
| Less than High School | 0 (0.0%) | 0 (0.0%) |
| High School Diploma | 0 (0.0%) | 0 (0.0%) |
| College or Associate's Degree | 0 (0.0%) | 0 (0.0%) |
| Bachelor's Degree | 0 (0.0%) | 0 (0.0%) |
| Graduate Degree | 0 (0.0%) | 0 (0.0%) |
| Total | 0 (0.0%) | 0 (0.0%) |
Employment Characteristics in Diablo
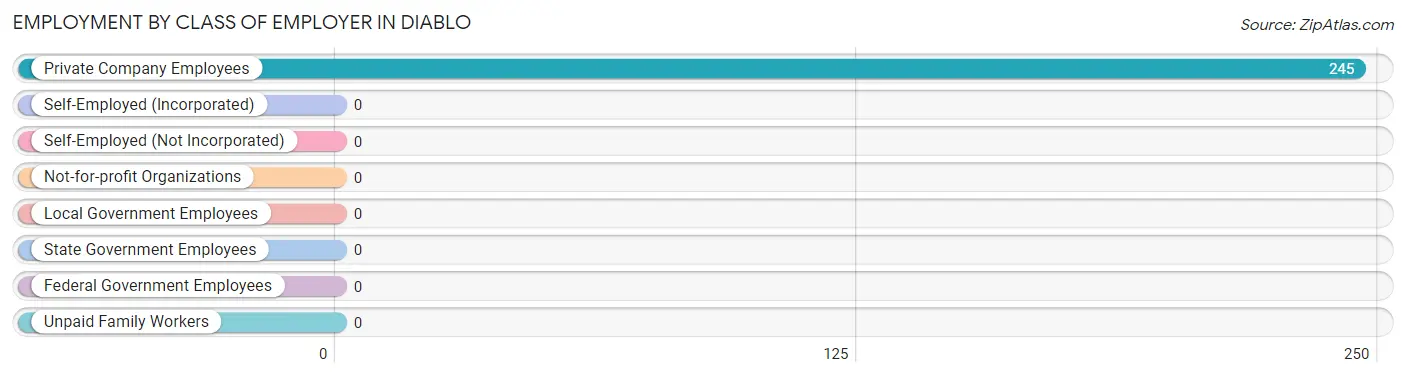
Employment by Class of Employer in Diablo
Among the 245 employed individuals in Diablo, , and private company employees (245 | 100.0%) make up the most common classes of employment.
| Employer Class | # Employees | % Employees |
| Private Company Employees | 245 | 100.0% |
| Self-Employed (Incorporated) | 0 | 0.0% |
| Self-Employed (Not Incorporated) | 0 | 0.0% |
| Not-for-profit Organizations | 0 | 0.0% |
| Local Government Employees | 0 | 0.0% |
| State Government Employees | 0 | 0.0% |
| Federal Government Employees | 0 | 0.0% |
| Unpaid Family Workers | 0 | 0.0% |
| Total | 245 | 100.0% |
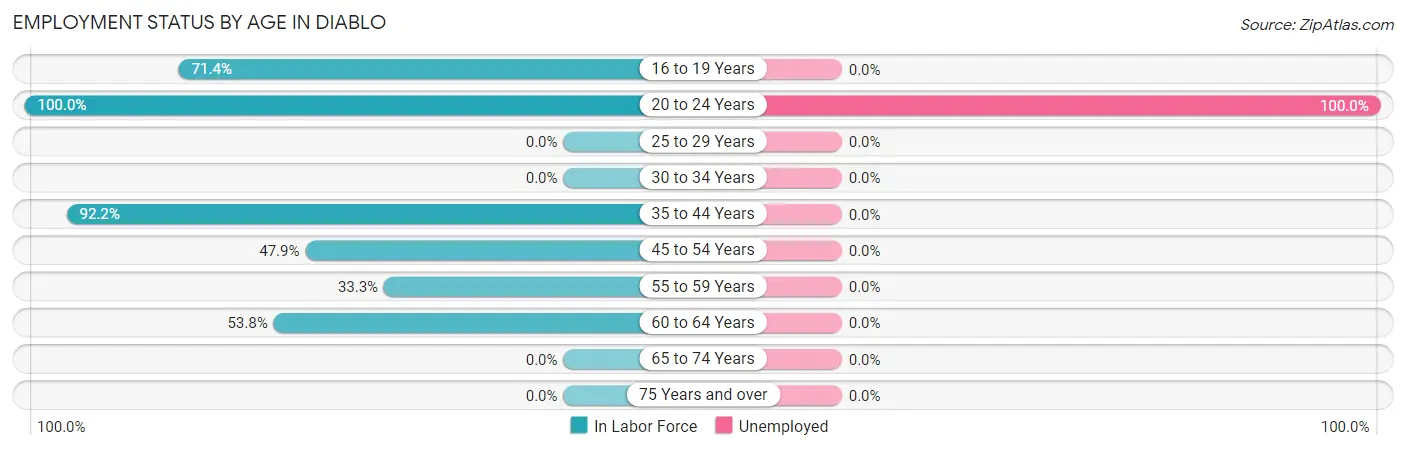
Employment Status by Age in Diablo
According to the labor force statistics for Diablo, out of the total population over 16 years of age (553), 52.1% or 288 individuals are in the labor force, with 14.9% or 43 of them unemployed. The age group with the highest labor force participation rate is 20 to 24 years, with 100.0% or 43 individuals in the labor force. Within the labor force, the 20 to 24 years age range has the highest percentage of unemployed individuals, with 100.0% or 43 of them being unemployed.
| Age Bracket | In Labor Force | Unemployed |
| 16 to 19 Years | 45 (71.4%) | 0 (0.0%) |
| 20 to 24 Years | 43 (100.0%) | 43 (100.0%) |
| 25 to 29 Years | 0 (0.0%) | 0 (0.0%) |
| 30 to 34 Years | 0 (0.0%) | 0 (0.0%) |
| 35 to 44 Years | 141 (92.2%) | 0 (0.0%) |
| 45 to 54 Years | 34 (47.9%) | 0 (0.0%) |
| 55 to 59 Years | 18 (33.3%) | 0 (0.0%) |
| 60 to 64 Years | 7 (53.8%) | 0 (0.0%) |
| 65 to 74 Years | 0 (0.0%) | 0 (0.0%) |
| 75 Years and over | 0 (0.0%) | 0 (0.0%) |
| Total | 288 (52.1%) | 43 (14.9%) |
Employment Status by Educational Attainment in Diablo
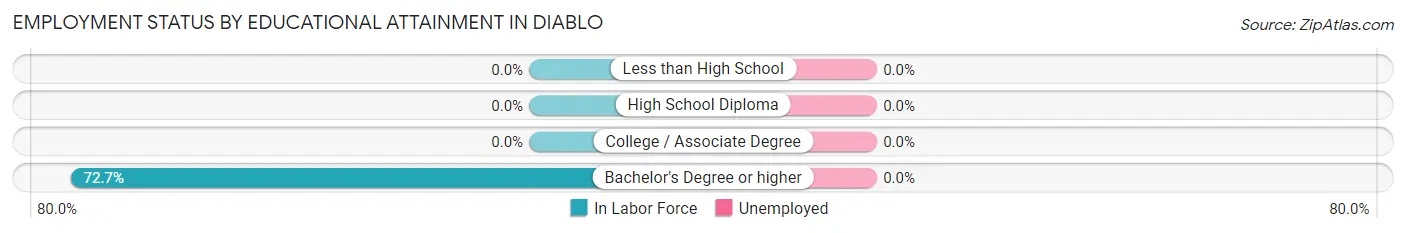
| Educational Attainment | In Labor Force | Unemployed |
| Less than High School | 0 (0.0%) | 0 (0.0%) |
| High School Diploma | 0 (0.0%) | 0 (0.0%) |
| College / Associate Degree | 0 (0.0%) | 0 (0.0%) |
| Bachelor's Degree or higher | 200 (72.7%) | 0 (0.0%) |
| Total | 200 (67.1%) | 0 (0.0%) |
Employment Occupations by Sex in Diablo
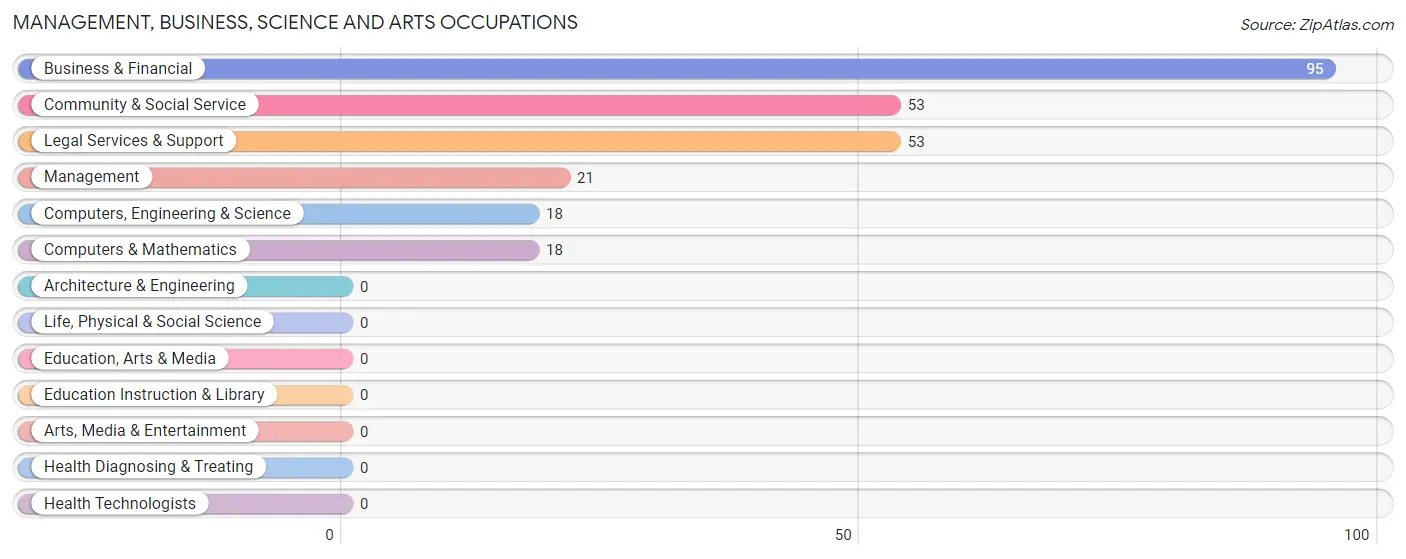
Management, Business, Science and Arts Occupations
The most common Management, Business, Science and Arts occupations in Diablo are Business & Financial (95 | 38.8%), Community & Social Service (53 | 21.6%), Legal Services & Support (53 | 21.6%), Management (21 | 8.6%), and Computers, Engineering & Science (18 | 7.3%).
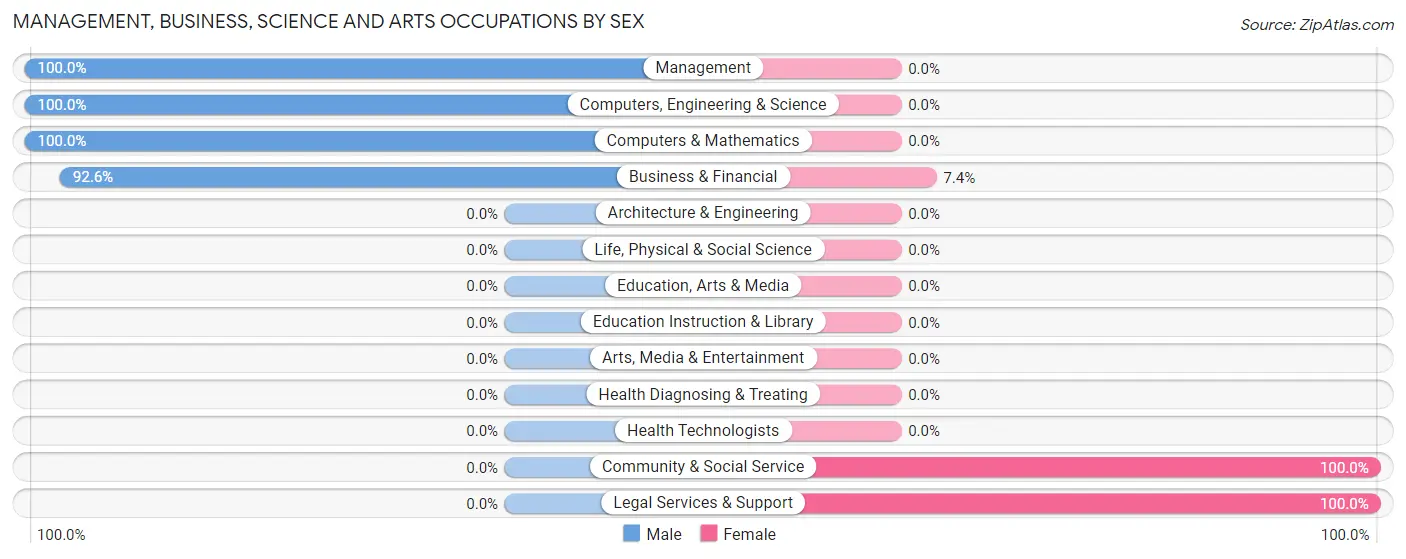
Management, Business, Science and Arts Occupations by Sex
Within the Management, Business, Science and Arts occupations in Diablo, the most male-oriented occupations are Management (100.0%), Computers, Engineering & Science (100.0%), and Computers & Mathematics (100.0%), while the most female-oriented occupations are Community & Social Service (100.0%), Legal Services & Support (100.0%), and Business & Financial (7.4%).
| Occupation | Male | Female |
| Management | 21 (100.0%) | 0 (0.0%) |
| Business & Financial | 88 (92.6%) | 7 (7.4%) |
| Computers, Engineering & Science | 18 (100.0%) | 0 (0.0%) |
| Computers & Mathematics | 18 (100.0%) | 0 (0.0%) |
| Architecture & Engineering | 0 (0.0%) | 0 (0.0%) |
| Life, Physical & Social Science | 0 (0.0%) | 0 (0.0%) |
| Community & Social Service | 0 (0.0%) | 53 (100.0%) |
| Education, Arts & Media | 0 (0.0%) | 0 (0.0%) |
| Legal Services & Support | 0 (0.0%) | 53 (100.0%) |
| Education Instruction & Library | 0 (0.0%) | 0 (0.0%) |
| Arts, Media & Entertainment | 0 (0.0%) | 0 (0.0%) |
| Health Diagnosing & Treating | 0 (0.0%) | 0 (0.0%) |
| Health Technologists | 0 (0.0%) | 0 (0.0%) |
| Total (Category) | 127 (67.9%) | 60 (32.1%) |
| Total (Overall) | 172 (70.2%) | 73 (29.8%) |
Services Occupations
Services Occupations by Sex
| Occupation | Male | Female |
| Healthcare Support | 0 (0.0%) | 0 (0.0%) |
| Security & Protection | 0 (0.0%) | 0 (0.0%) |
| Firefighting & Prevention | 0 (0.0%) | 0 (0.0%) |
| Law Enforcement | 0 (0.0%) | 0 (0.0%) |
| Food Preparation & Serving | 0 (0.0%) | 0 (0.0%) |
| Cleaning & Maintenance | 0 (0.0%) | 0 (0.0%) |
| Personal Care & Service | 0 (0.0%) | 0 (0.0%) |
| Total (Category) | 0 (0.0%) | 0 (0.0%) |
| Total (Overall) | 172 (70.2%) | 73 (29.8%) |
Sales and Office Occupations
The most common Sales and Office occupations in Diablo are , and Office & Administration (58 | 23.7%).
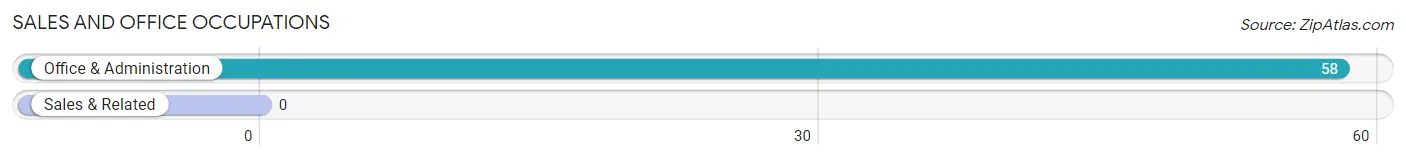
Sales and Office Occupations by Sex
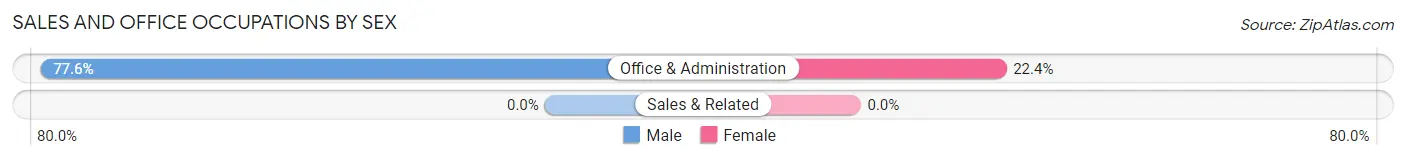
| Occupation | Male | Female |
| Sales & Related | 0 (0.0%) | 0 (0.0%) |
| Office & Administration | 45 (77.6%) | 13 (22.4%) |
| Total (Category) | 45 (77.6%) | 13 (22.4%) |
| Total (Overall) | 172 (70.2%) | 73 (29.8%) |
Natural Resources, Construction and Maintenance Occupations
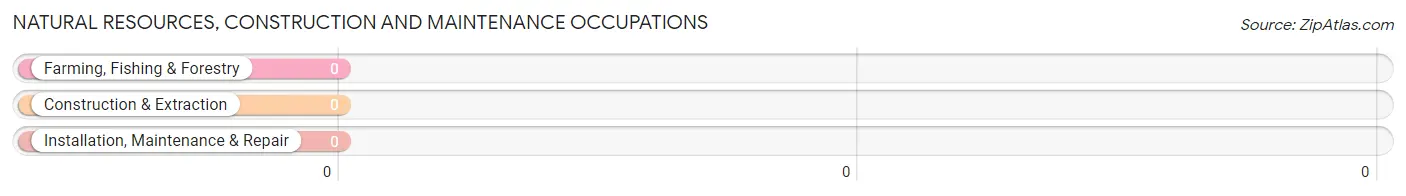
Natural Resources, Construction and Maintenance Occupations by Sex
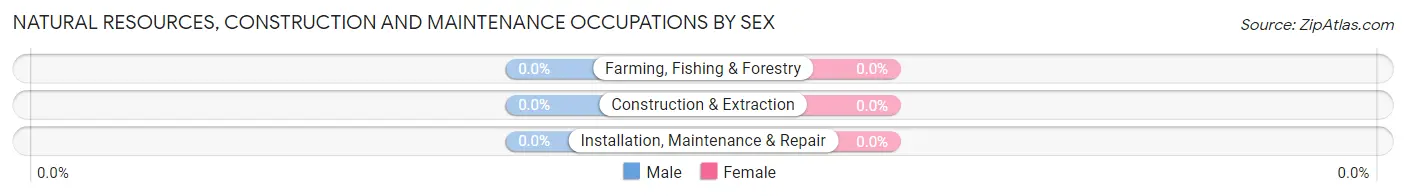
| Occupation | Male | Female |
| Farming, Fishing & Forestry | 0 (0.0%) | 0 (0.0%) |
| Construction & Extraction | 0 (0.0%) | 0 (0.0%) |
| Installation, Maintenance & Repair | 0 (0.0%) | 0 (0.0%) |
| Total (Category) | 0 (0.0%) | 0 (0.0%) |
| Total (Overall) | 172 (70.2%) | 73 (29.8%) |
Production, Transportation and Moving Occupations
Production, Transportation and Moving Occupations by Sex
| Occupation | Male | Female |
| Production | 0 (0.0%) | 0 (0.0%) |
| Transportation | 0 (0.0%) | 0 (0.0%) |
| Material Moving | 0 (0.0%) | 0 (0.0%) |
| Total (Category) | 0 (0.0%) | 0 (0.0%) |
| Total (Overall) | 172 (70.2%) | 73 (29.8%) |
Employment Industries by Sex in Diablo
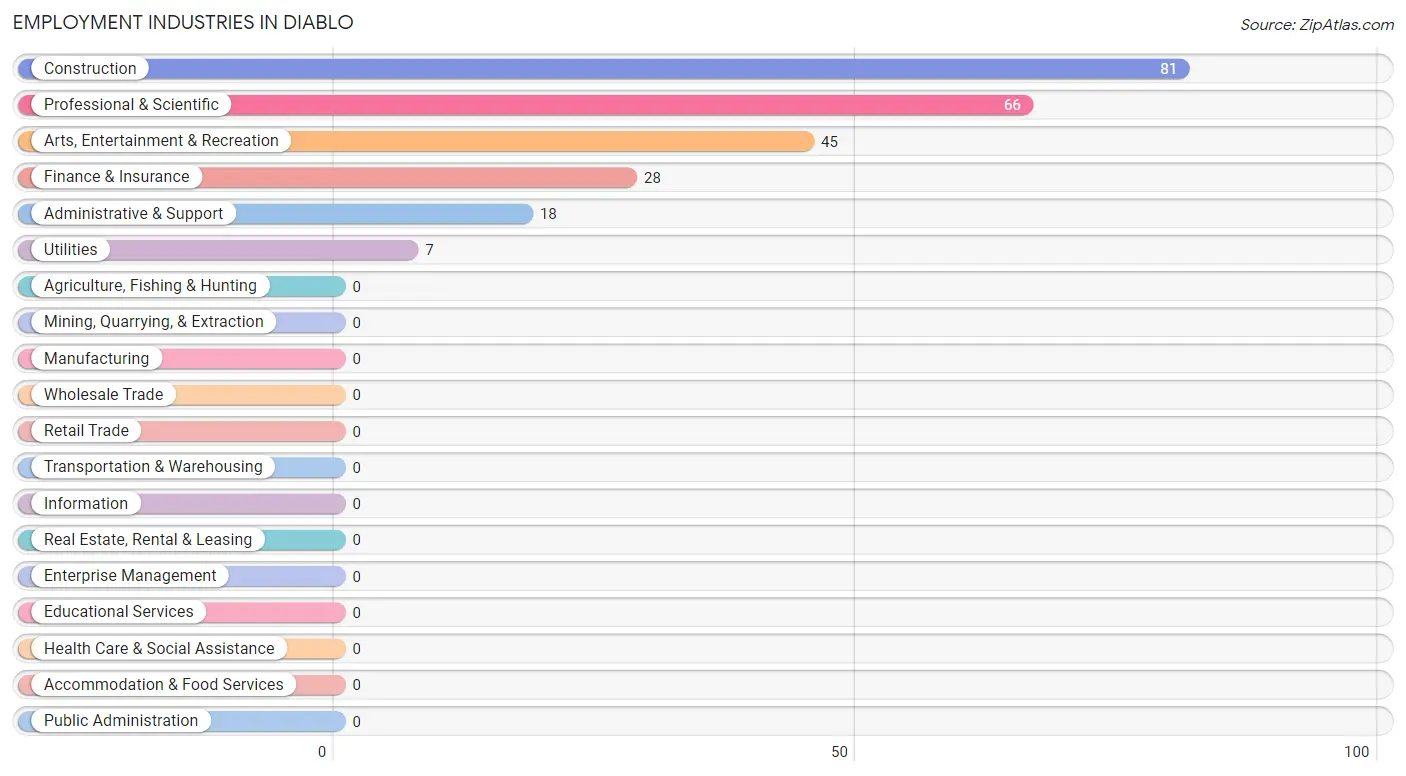
Employment Industries in Diablo
The major employment industries in Diablo include Construction (81 | 33.1%), Professional & Scientific (66 | 26.9%), Arts, Entertainment & Recreation (45 | 18.4%), Finance & Insurance (28 | 11.4%), and Administrative & Support (18 | 7.3%).
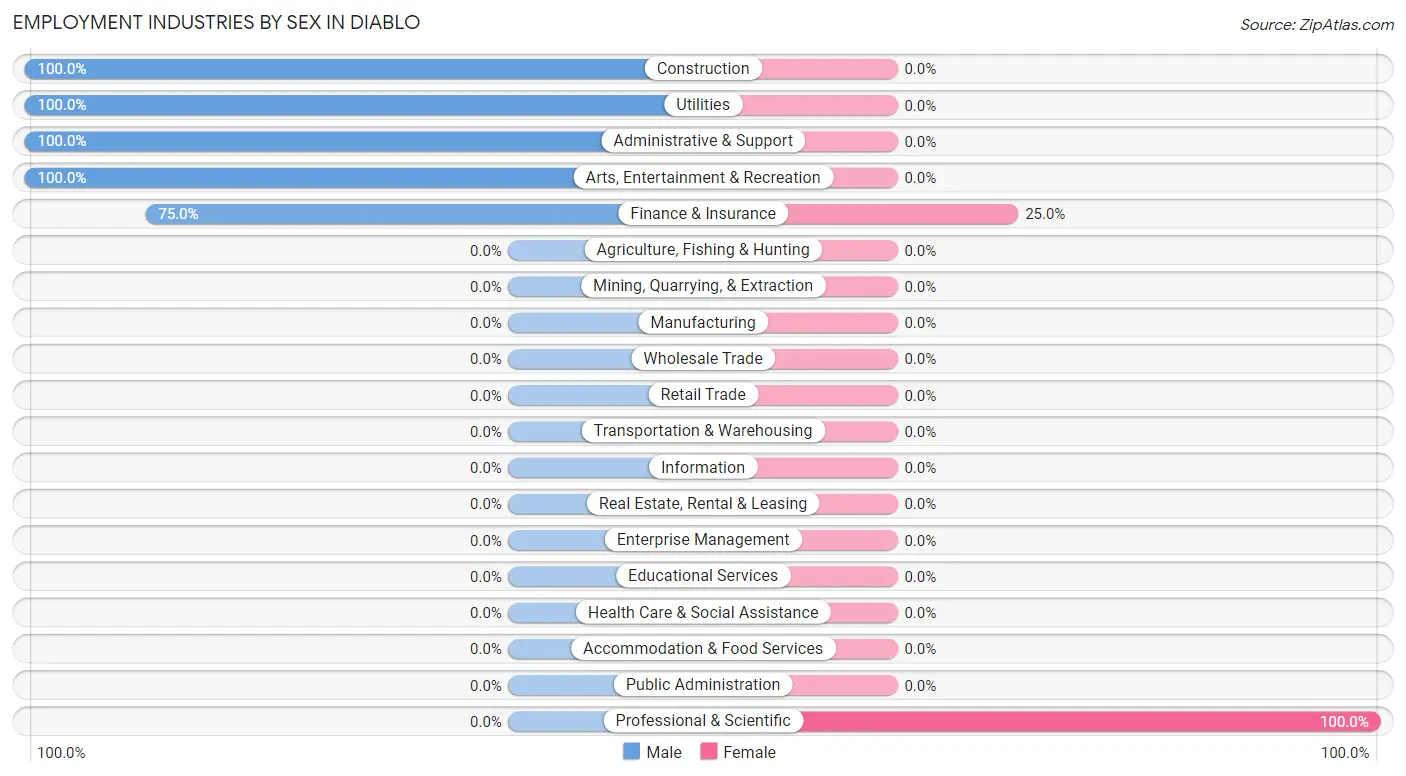
Employment Industries by Sex in Diablo
The Diablo industries that see more men than women are Construction (100.0%), Utilities (100.0%), and Administrative & Support (100.0%), whereas the industries that tend to have a higher number of women are Professional & Scientific (100.0%), and Finance & Insurance (25.0%).
| Industry | Male | Female |
| Agriculture, Fishing & Hunting | 0 (0.0%) | 0 (0.0%) |
| Mining, Quarrying, & Extraction | 0 (0.0%) | 0 (0.0%) |
| Construction | 81 (100.0%) | 0 (0.0%) |
| Manufacturing | 0 (0.0%) | 0 (0.0%) |
| Wholesale Trade | 0 (0.0%) | 0 (0.0%) |
| Retail Trade | 0 (0.0%) | 0 (0.0%) |
| Transportation & Warehousing | 0 (0.0%) | 0 (0.0%) |
| Utilities | 7 (100.0%) | 0 (0.0%) |
| Information | 0 (0.0%) | 0 (0.0%) |
| Finance & Insurance | 21 (75.0%) | 7 (25.0%) |
| Real Estate, Rental & Leasing | 0 (0.0%) | 0 (0.0%) |
| Professional & Scientific | 0 (0.0%) | 66 (100.0%) |
| Enterprise Management | 0 (0.0%) | 0 (0.0%) |
| Administrative & Support | 18 (100.0%) | 0 (0.0%) |
| Educational Services | 0 (0.0%) | 0 (0.0%) |
| Health Care & Social Assistance | 0 (0.0%) | 0 (0.0%) |
| Arts, Entertainment & Recreation | 45 (100.0%) | 0 (0.0%) |
| Accommodation & Food Services | 0 (0.0%) | 0 (0.0%) |
| Public Administration | 0 (0.0%) | 0 (0.0%) |
| Total | 172 (70.2%) | 73 (29.8%) |
Education in Diablo
School Enrollment in Diablo
The most common levels of schooling among the 320 students in Diablo are kindergarten (78 | 24.4%), nursery / preschool (67 | 20.9%), and high school (63 | 19.7%).
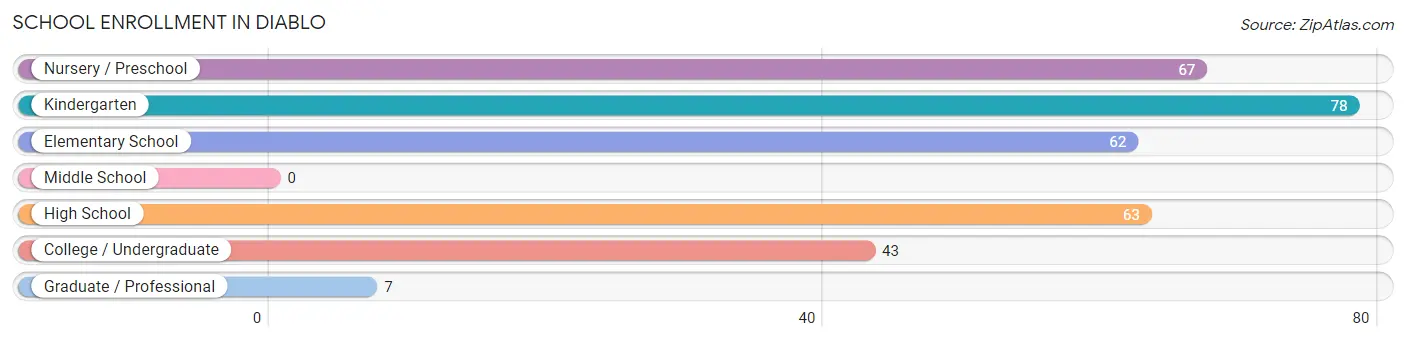
| School Level | # Students | % Students |
| Nursery / Preschool | 67 | 20.9% |
| Kindergarten | 78 | 24.4% |
| Elementary School | 62 | 19.4% |
| Middle School | 0 | 0.0% |
| High School | 63 | 19.7% |
| College / Undergraduate | 43 | 13.4% |
| Graduate / Professional | 7 | 2.2% |
| Total | 320 | 100.0% |
School Enrollment by Age by Funding Source in Diablo
Out of a total of 320 students who are enrolled in schools in Diablo, 139 (43.4%) attend a private institution, while the remaining 181 (56.6%) are enrolled in public schools. The age group of 15 to 17 year olds has the highest likelihood of being enrolled in private schools, with 18 (100.0% in the age bracket) enrolled. Conversely, the age group of 3 to 4 year olds has the lowest likelihood of being enrolled in a private school, with 67 (100.0% in the age bracket) attending a public institution.
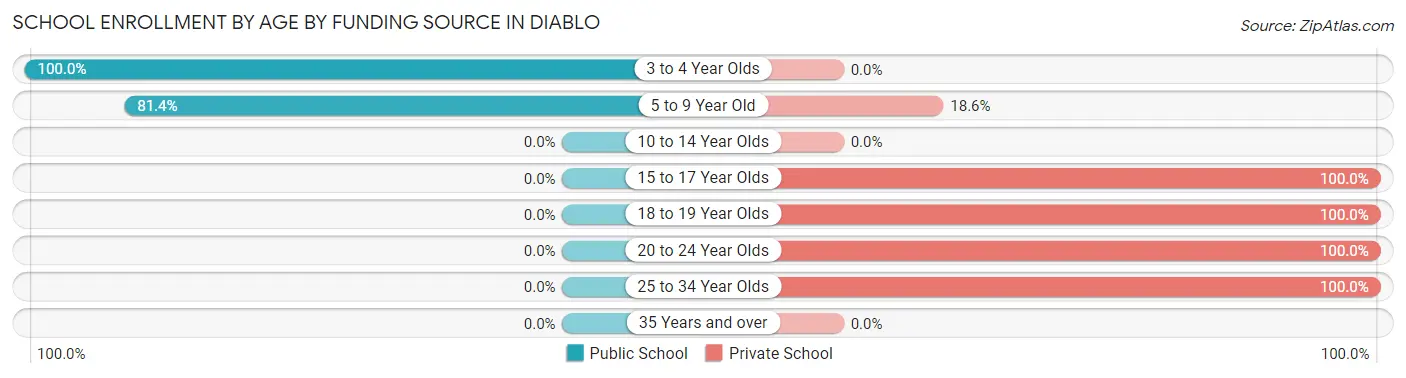
| Age Bracket | Public School | Private School |
| 3 to 4 Year Olds | 67 (100.0%) | 0 (0.0%) |
| 5 to 9 Year Old | 114 (81.4%) | 26 (18.6%) |
| 10 to 14 Year Olds | 0 (0.0%) | 0 (0.0%) |
| 15 to 17 Year Olds | 0 (0.0%) | 18 (100.0%) |
| 18 to 19 Year Olds | 0 (0.0%) | 45 (100.0%) |
| 20 to 24 Year Olds | 0 (0.0%) | 43 (100.0%) |
| 25 to 34 Year Olds | 0 (0.0%) | 7 (100.0%) |
| 35 Years and over | 0 (0.0%) | 0 (0.0%) |
| Total | 181 (56.6%) | 139 (43.4%) |
Educational Attainment by Field of Study in Diablo
Social sciences (96 | 22.5%), engineering (67 | 15.7%), literature & languages (53 | 12.4%), bio, nature & agricultural (50 | 11.7%), and business (37 | 8.7%) are the most common fields of study among 427 individuals in Diablo who have obtained a bachelor's degree or higher.
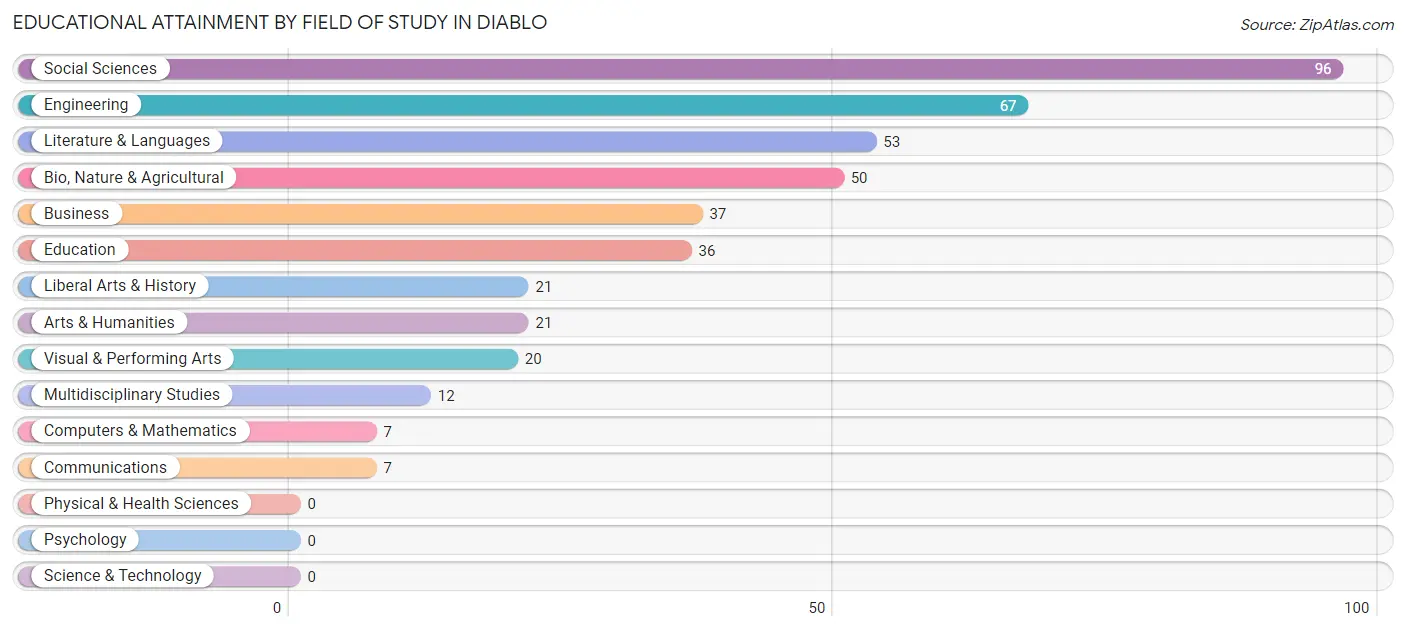
| Field of Study | # Graduates | % Graduates |
| Computers & Mathematics | 7 | 1.6% |
| Bio, Nature & Agricultural | 50 | 11.7% |
| Physical & Health Sciences | 0 | 0.0% |
| Psychology | 0 | 0.0% |
| Social Sciences | 96 | 22.5% |
| Engineering | 67 | 15.7% |
| Multidisciplinary Studies | 12 | 2.8% |
| Science & Technology | 0 | 0.0% |
| Business | 37 | 8.7% |
| Education | 36 | 8.4% |
| Literature & Languages | 53 | 12.4% |
| Liberal Arts & History | 21 | 4.9% |
| Visual & Performing Arts | 20 | 4.7% |
| Communications | 7 | 1.6% |
| Arts & Humanities | 21 | 4.9% |
| Total | 427 | 100.0% |
Transportation & Commute in Diablo
Vehicle Availability by Sex in Diablo
The most prevalent vehicle ownership categories in Diablo are males with 3 vehicles (151, accounting for 87.8%) and females with 3 vehicles (53, making up 206.8%).
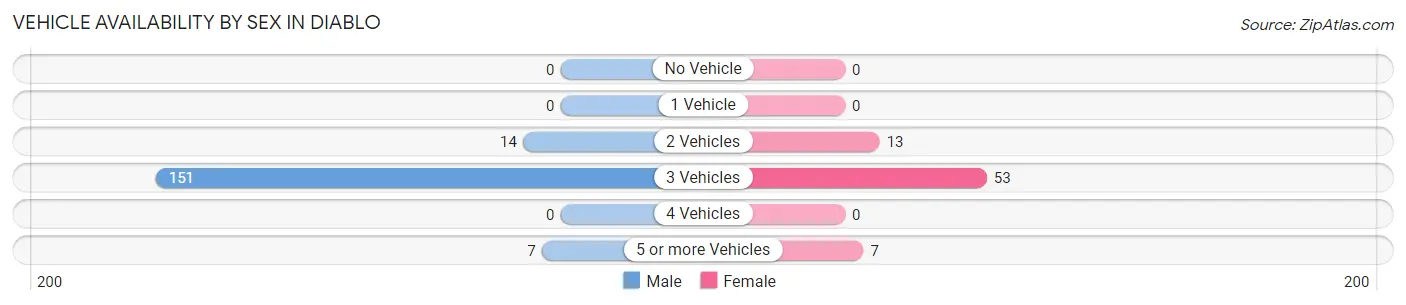
| Vehicles Available | Male | Female |
| No Vehicle | 0 (0.0%) | 0 (0.0%) |
| 1 Vehicle | 0 (0.0%) | 0 (0.0%) |
| 2 Vehicles | 14 (8.1%) | 13 (17.8%) |
| 3 Vehicles | 151 (87.8%) | 53 (72.6%) |
| 4 Vehicles | 0 (0.0%) | 0 (0.0%) |
| 5 or more Vehicles | 7 (4.1%) | 7 (9.6%) |
| Total | 172 (100.0%) | 73 (100.0%) |
Commute Time in Diablo
The most frequently occuring commute durations in Diablo are 45 to 59 minutes (74 commuters, 32.6%), 60 to 89 minutes (60 commuters, 26.4%), and 10 to 14 minutes (45 commuters, 19.8%).
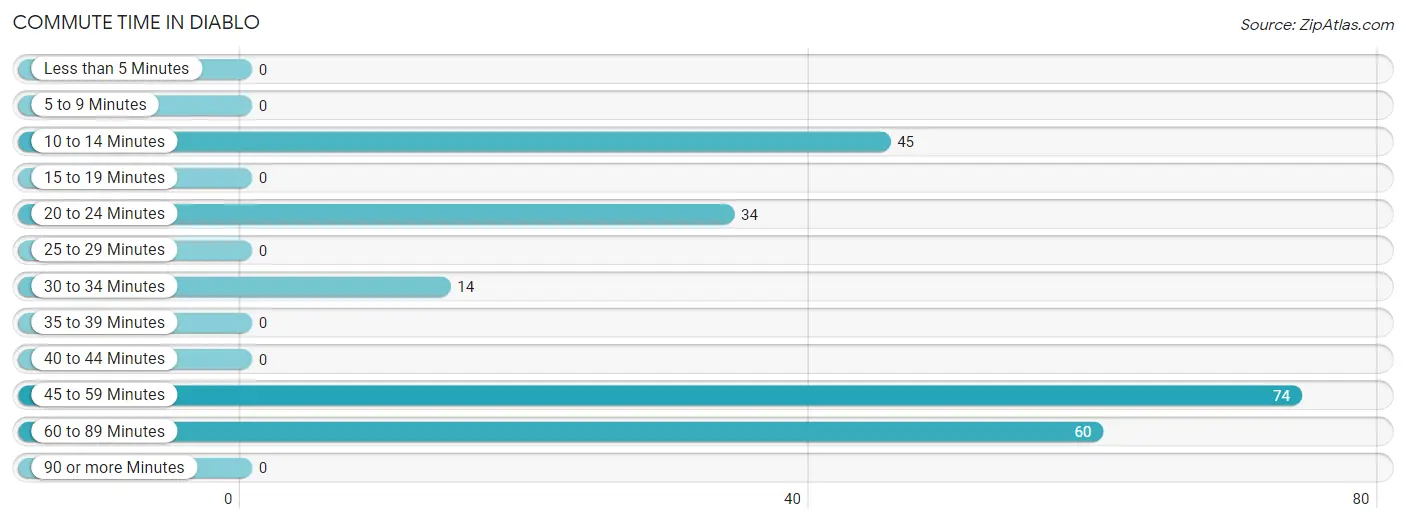
| Commute Time | # Commuters | % Commuters |
| Less than 5 Minutes | 0 | 0.0% |
| 5 to 9 Minutes | 0 | 0.0% |
| 10 to 14 Minutes | 45 | 19.8% |
| 15 to 19 Minutes | 0 | 0.0% |
| 20 to 24 Minutes | 34 | 15.0% |
| 25 to 29 Minutes | 0 | 0.0% |
| 30 to 34 Minutes | 14 | 6.2% |
| 35 to 39 Minutes | 0 | 0.0% |
| 40 to 44 Minutes | 0 | 0.0% |
| 45 to 59 Minutes | 74 | 32.6% |
| 60 to 89 Minutes | 60 | 26.4% |
| 90 or more Minutes | 0 | 0.0% |
Commute Time by Sex in Diablo
The most common commute times in Diablo are 45 to 59 minutes (74 commuters, 48.0%) for males and 60 to 89 minutes (60 commuters, 82.2%) for females.
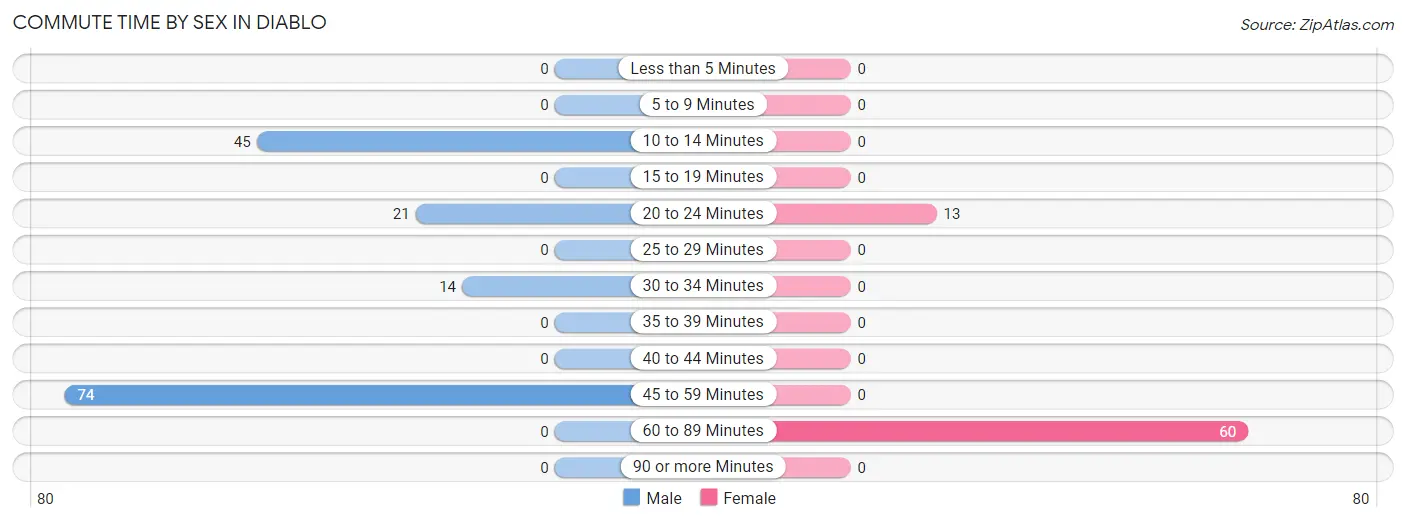
| Commute Time | Male | Female |
| Less than 5 Minutes | 0 (0.0%) | 0 (0.0%) |
| 5 to 9 Minutes | 0 (0.0%) | 0 (0.0%) |
| 10 to 14 Minutes | 45 (29.2%) | 0 (0.0%) |
| 15 to 19 Minutes | 0 (0.0%) | 0 (0.0%) |
| 20 to 24 Minutes | 21 (13.6%) | 13 (17.8%) |
| 25 to 29 Minutes | 0 (0.0%) | 0 (0.0%) |
| 30 to 34 Minutes | 14 (9.1%) | 0 (0.0%) |
| 35 to 39 Minutes | 0 (0.0%) | 0 (0.0%) |
| 40 to 44 Minutes | 0 (0.0%) | 0 (0.0%) |
| 45 to 59 Minutes | 74 (48.0%) | 0 (0.0%) |
| 60 to 89 Minutes | 0 (0.0%) | 60 (82.2%) |
| 90 or more Minutes | 0 (0.0%) | 0 (0.0%) |
Time of Departure to Work by Sex in Diablo
The most frequent times of departure to work in Diablo are 5:00 AM to 5:29 AM (67, 43.5%) for males and 9:00 AM to 9:59 AM (53, 72.6%) for females.
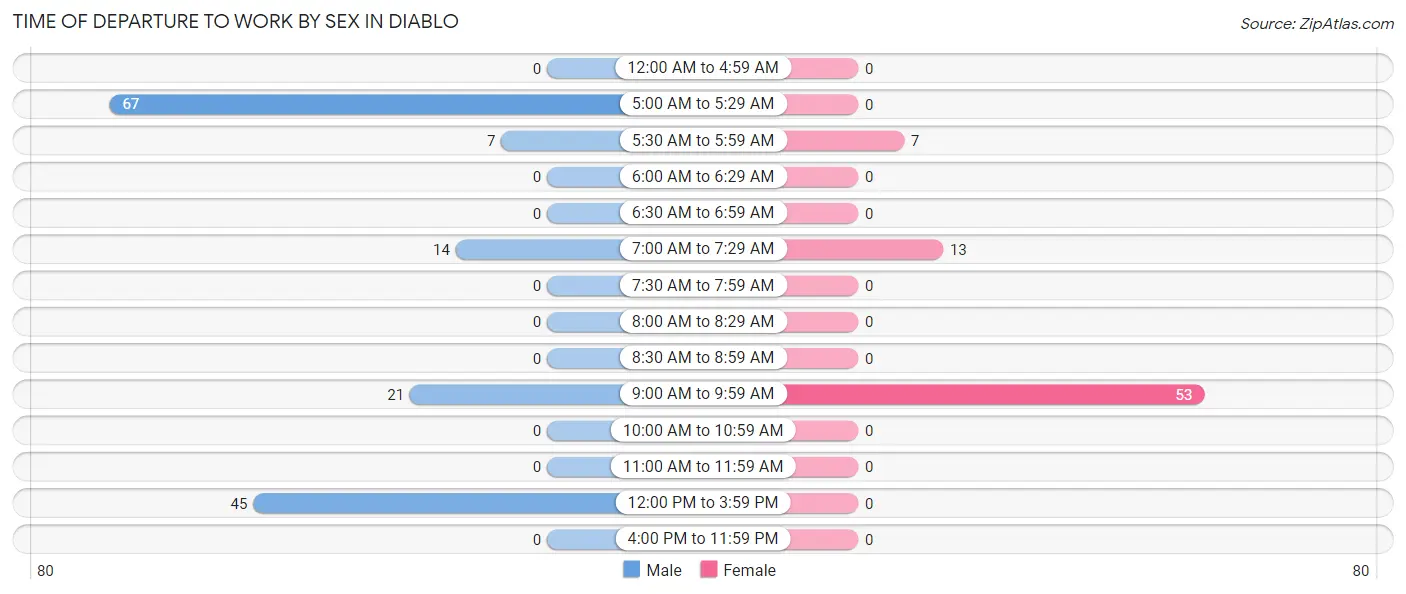
| Time of Departure | Male | Female |
| 12:00 AM to 4:59 AM | 0 (0.0%) | 0 (0.0%) |
| 5:00 AM to 5:29 AM | 67 (43.5%) | 0 (0.0%) |
| 5:30 AM to 5:59 AM | 7 (4.5%) | 7 (9.6%) |
| 6:00 AM to 6:29 AM | 0 (0.0%) | 0 (0.0%) |
| 6:30 AM to 6:59 AM | 0 (0.0%) | 0 (0.0%) |
| 7:00 AM to 7:29 AM | 14 (9.1%) | 13 (17.8%) |
| 7:30 AM to 7:59 AM | 0 (0.0%) | 0 (0.0%) |
| 8:00 AM to 8:29 AM | 0 (0.0%) | 0 (0.0%) |
| 8:30 AM to 8:59 AM | 0 (0.0%) | 0 (0.0%) |
| 9:00 AM to 9:59 AM | 21 (13.6%) | 53 (72.6%) |
| 10:00 AM to 10:59 AM | 0 (0.0%) | 0 (0.0%) |
| 11:00 AM to 11:59 AM | 0 (0.0%) | 0 (0.0%) |
| 12:00 PM to 3:59 PM | 45 (29.2%) | 0 (0.0%) |
| 4:00 PM to 11:59 PM | 0 (0.0%) | 0 (0.0%) |
| Total | 154 (100.0%) | 73 (100.0%) |
Housing Occupancy in Diablo
Occupancy by Ownership in Diablo
Of the total 250 dwellings in Diablo, owner-occupied units account for 250 (100.0%), while renter-occupied units make up 0 (0.0%).
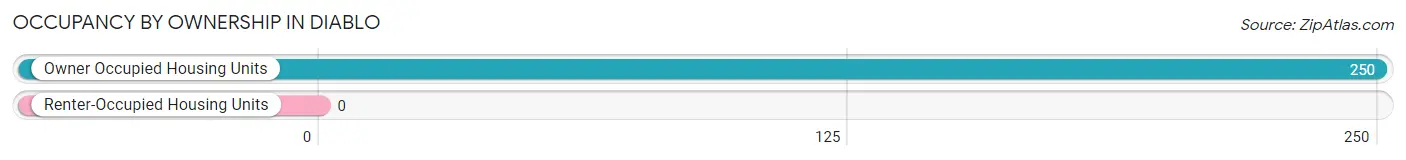
| Occupancy | # Housing Units | % Housing Units |
| Owner Occupied Housing Units | 250 | 100.0% |
| Renter-Occupied Housing Units | 0 | 0.0% |
| Total Occupied Housing Units | 250 | 100.0% |
Occupancy by Household Size in Diablo
| Household Size | # Housing Units | % Housing Units |
| 1-Person Household | 13 | 5.2% |
| 2-Person Household | 95 | 38.0% |
| 3-Person Household | 54 | 21.6% |
| 4+ Person Household | 88 | 35.2% |
| Total Housing Units | 250 | 100.0% |
Occupancy by Ownership by Household Size in Diablo
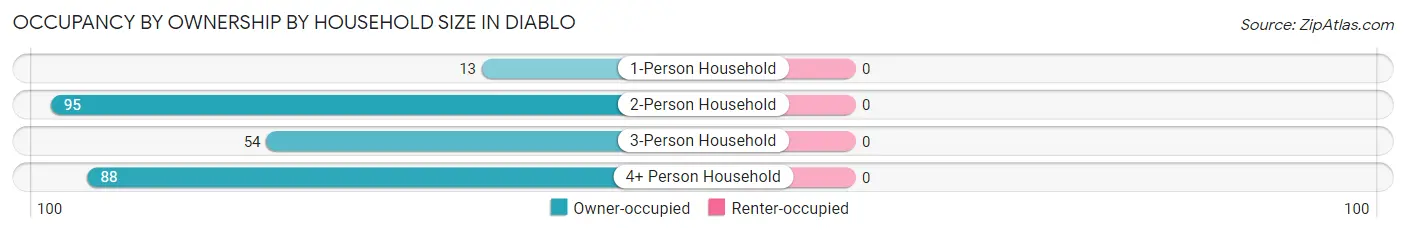
| Household Size | Owner-occupied | Renter-occupied |
| 1-Person Household | 13 (100.0%) | 0 (0.0%) |
| 2-Person Household | 95 (100.0%) | 0 (0.0%) |
| 3-Person Household | 54 (100.0%) | 0 (0.0%) |
| 4+ Person Household | 88 (100.0%) | 0 (0.0%) |
| Total Housing Units | 250 (100.0%) | 0 (0.0%) |
Occupancy by Educational Attainment in Diablo
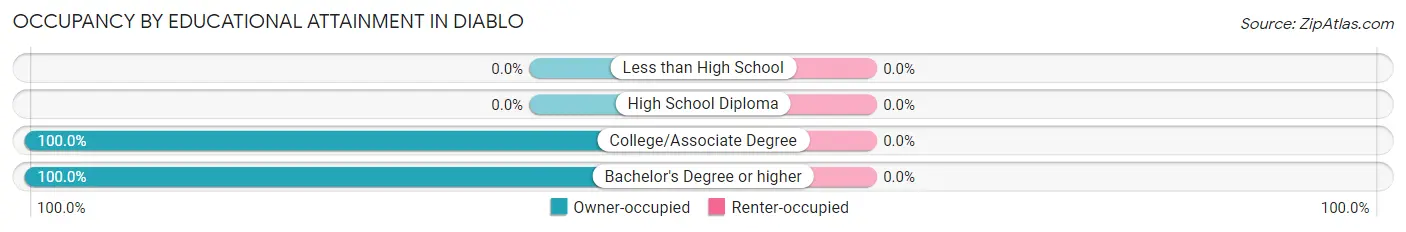
| Household Size | Owner-occupied | Renter-occupied |
| Less than High School | 0 (0.0%) | 0 (0.0%) |
| High School Diploma | 0 (0.0%) | 0 (0.0%) |
| College/Associate Degree | 19 (100.0%) | 0 (0.0%) |
| Bachelor's Degree or higher | 231 (100.0%) | 0 (0.0%) |
Occupancy by Age of Householder in Diablo
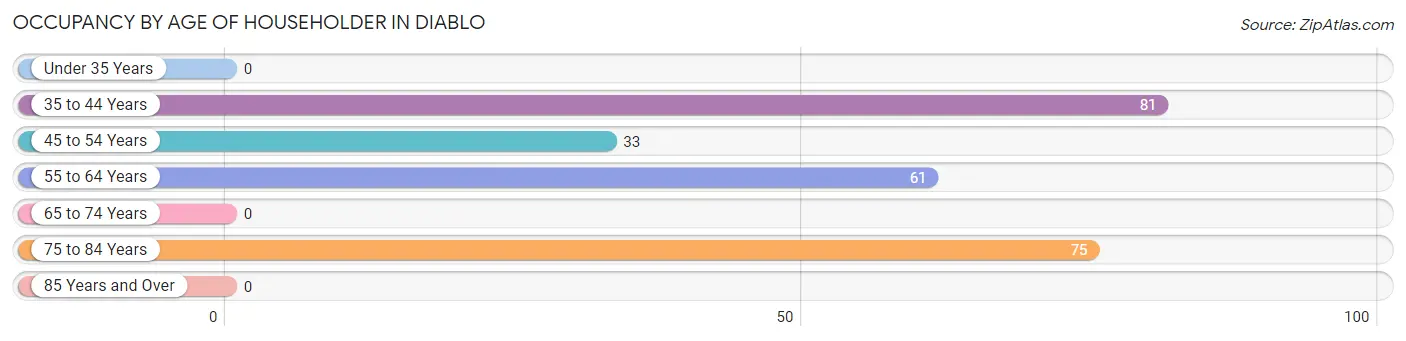
| Age Bracket | # Households | % Households |
| Under 35 Years | 0 | 0.0% |
| 35 to 44 Years | 81 | 32.4% |
| 45 to 54 Years | 33 | 13.2% |
| 55 to 64 Years | 61 | 24.4% |
| 65 to 74 Years | 0 | 0.0% |
| 75 to 84 Years | 75 | 30.0% |
| 85 Years and Over | 0 | 0.0% |
| Total | 250 | 100.0% |
Housing Finances in Diablo
Median Income by Occupancy in Diablo
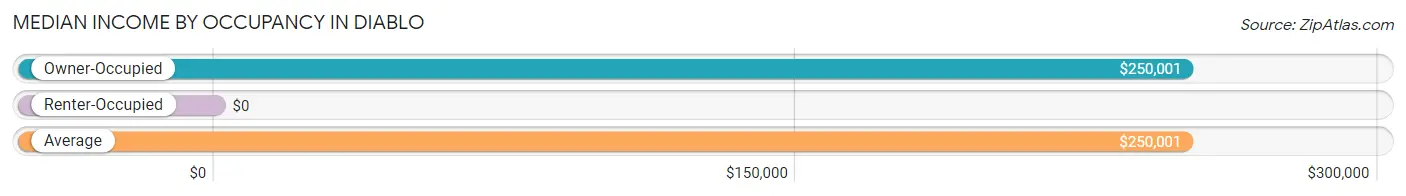
| Occupancy Type | # Households | Median Income |
| Owner-Occupied | 250 (100.0%) | $250,001 |
| Renter-Occupied | 0 (0.0%) | $0 |
| Average | 250 (100.0%) | $250,001 |
Occupancy by Householder Income Bracket in Diablo
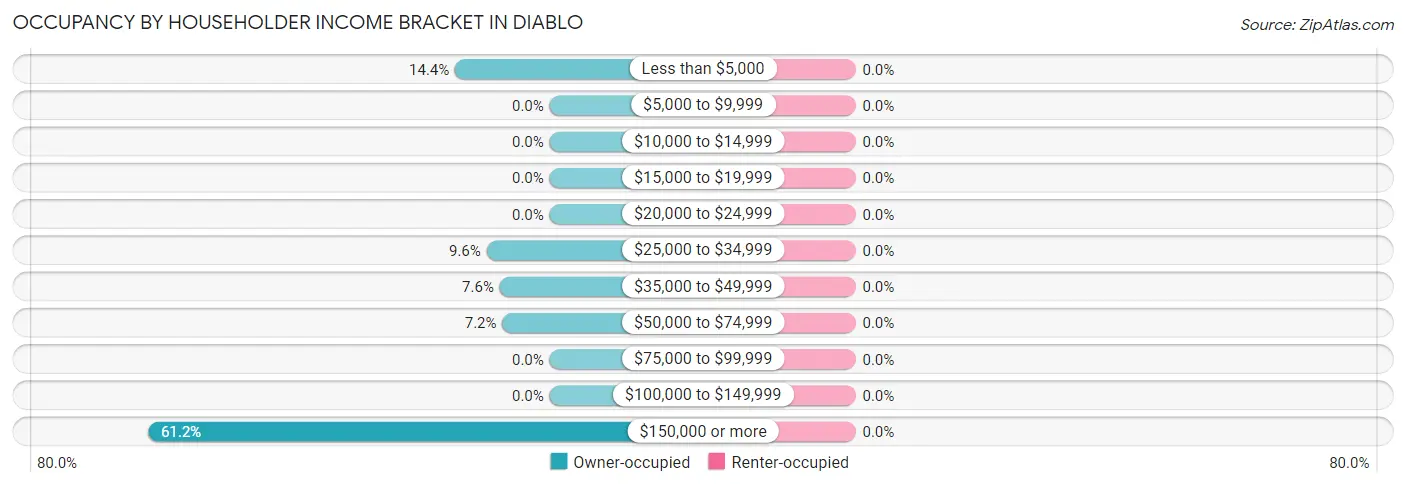
| Income Bracket | Owner-occupied | Renter-occupied |
| Less than $5,000 | 36 (14.4%) | 0 (0.0%) |
| $5,000 to $9,999 | 0 (0.0%) | 0 (0.0%) |
| $10,000 to $14,999 | 0 (0.0%) | 0 (0.0%) |
| $15,000 to $19,999 | 0 (0.0%) | 0 (0.0%) |
| $20,000 to $24,999 | 0 (0.0%) | 0 (0.0%) |
| $25,000 to $34,999 | 24 (9.6%) | 0 (0.0%) |
| $35,000 to $49,999 | 19 (7.6%) | 0 (0.0%) |
| $50,000 to $74,999 | 18 (7.2%) | 0 (0.0%) |
| $75,000 to $99,999 | 0 (0.0%) | 0 (0.0%) |
| $100,000 to $149,999 | 0 (0.0%) | 0 (0.0%) |
| $150,000 or more | 153 (61.2%) | 0 (0.0%) |
| Total | 250 (100.0%) | 0 (0.0%) |
Monthly Housing Cost Tiers in Diablo
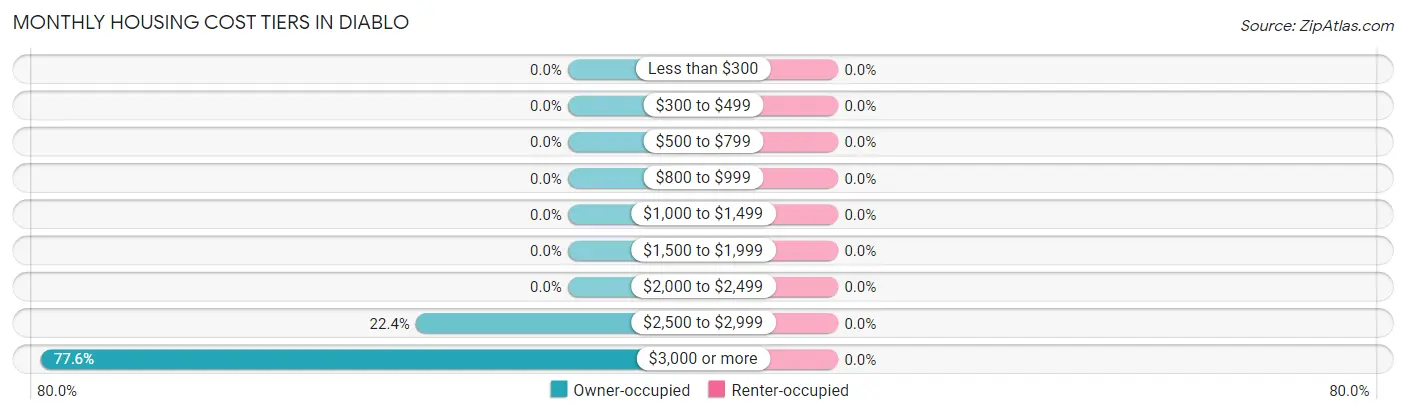
| Monthly Cost | Owner-occupied | Renter-occupied |
| Less than $300 | 0 (0.0%) | 0 (0.0%) |
| $300 to $499 | 0 (0.0%) | 0 (0.0%) |
| $500 to $799 | 0 (0.0%) | 0 (0.0%) |
| $800 to $999 | 0 (0.0%) | 0 (0.0%) |
| $1,000 to $1,499 | 0 (0.0%) | 0 (0.0%) |
| $1,500 to $1,999 | 0 (0.0%) | 0 (0.0%) |
| $2,000 to $2,499 | 0 (0.0%) | 0 (0.0%) |
| $2,500 to $2,999 | 56 (22.4%) | 0 (0.0%) |
| $3,000 or more | 194 (77.6%) | 0 (0.0%) |
| Total | 250 (100.0%) | 0 (0.0%) |
Physical Housing Characteristics in Diablo
Housing Structures in Diablo
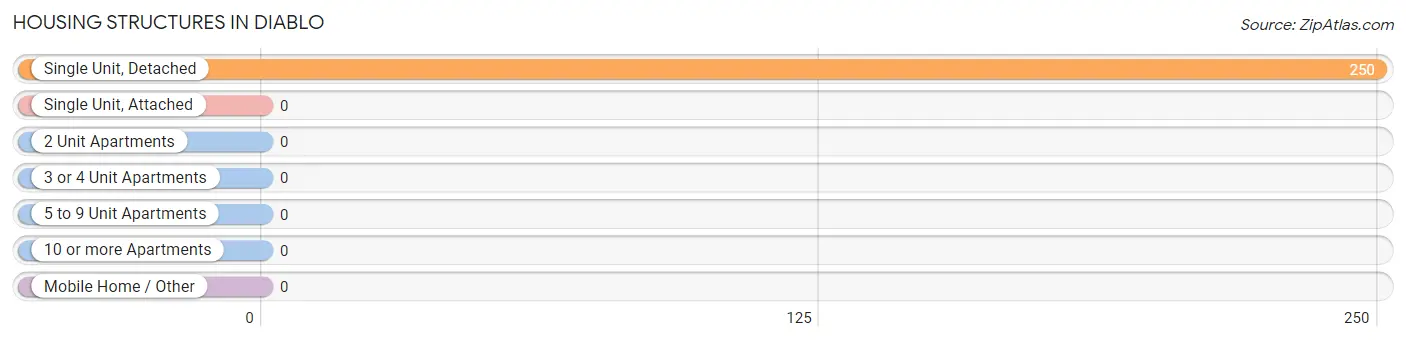
| Structure Type | # Housing Units | % Housing Units |
| Single Unit, Detached | 250 | 100.0% |
| Single Unit, Attached | 0 | 0.0% |
| 2 Unit Apartments | 0 | 0.0% |
| 3 or 4 Unit Apartments | 0 | 0.0% |
| 5 to 9 Unit Apartments | 0 | 0.0% |
| 10 or more Apartments | 0 | 0.0% |
| Mobile Home / Other | 0 | 0.0% |
| Total | 250 | 100.0% |
Housing Structures by Occupancy in Diablo
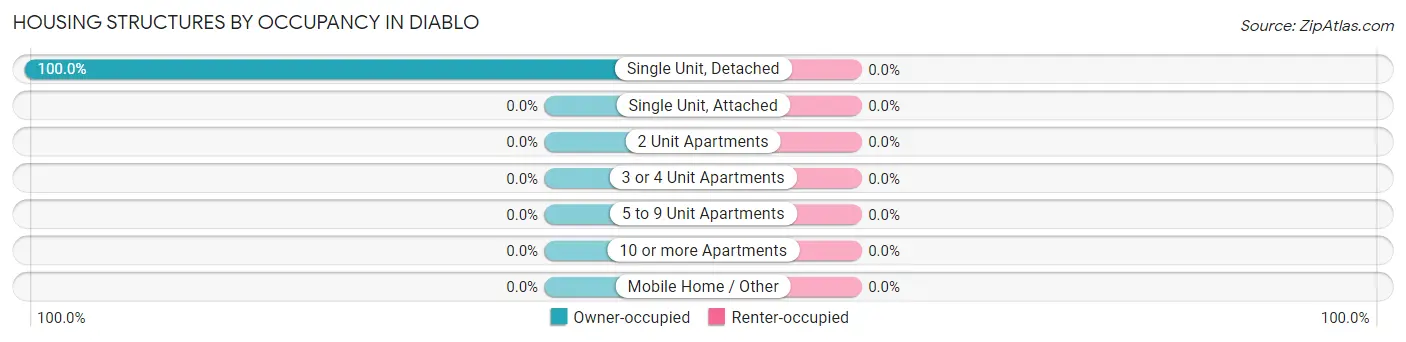
| Structure Type | Owner-occupied | Renter-occupied |
| Single Unit, Detached | 250 (100.0%) | 0 (0.0%) |
| Single Unit, Attached | 0 (0.0%) | 0 (0.0%) |
| 2 Unit Apartments | 0 (0.0%) | 0 (0.0%) |
| 3 or 4 Unit Apartments | 0 (0.0%) | 0 (0.0%) |
| 5 to 9 Unit Apartments | 0 (0.0%) | 0 (0.0%) |
| 10 or more Apartments | 0 (0.0%) | 0 (0.0%) |
| Mobile Home / Other | 0 (0.0%) | 0 (0.0%) |
| Total | 250 (100.0%) | 0 (0.0%) |
Housing Structures by Number of Rooms in Diablo
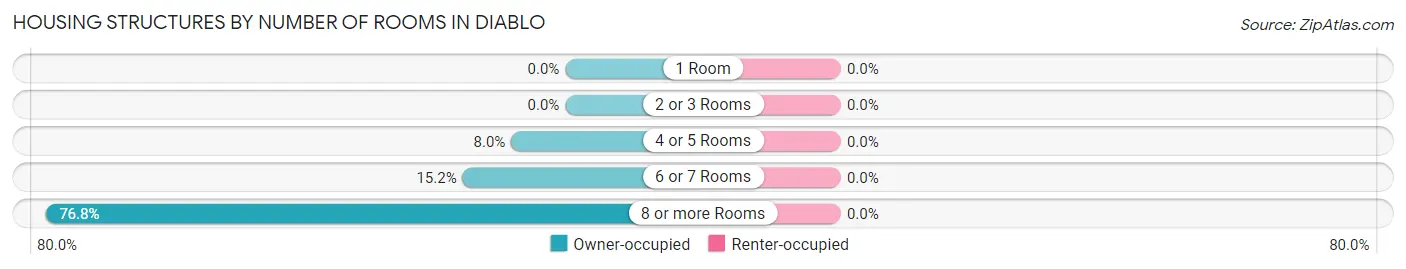
| Number of Rooms | Owner-occupied | Renter-occupied |
| 1 Room | 0 (0.0%) | 0 (0.0%) |
| 2 or 3 Rooms | 0 (0.0%) | 0 (0.0%) |
| 4 or 5 Rooms | 20 (8.0%) | 0 (0.0%) |
| 6 or 7 Rooms | 38 (15.2%) | 0 (0.0%) |
| 8 or more Rooms | 192 (76.8%) | 0 (0.0%) |
| Total | 250 (100.0%) | 0 (0.0%) |
Housing Structure by Heating Type in Diablo
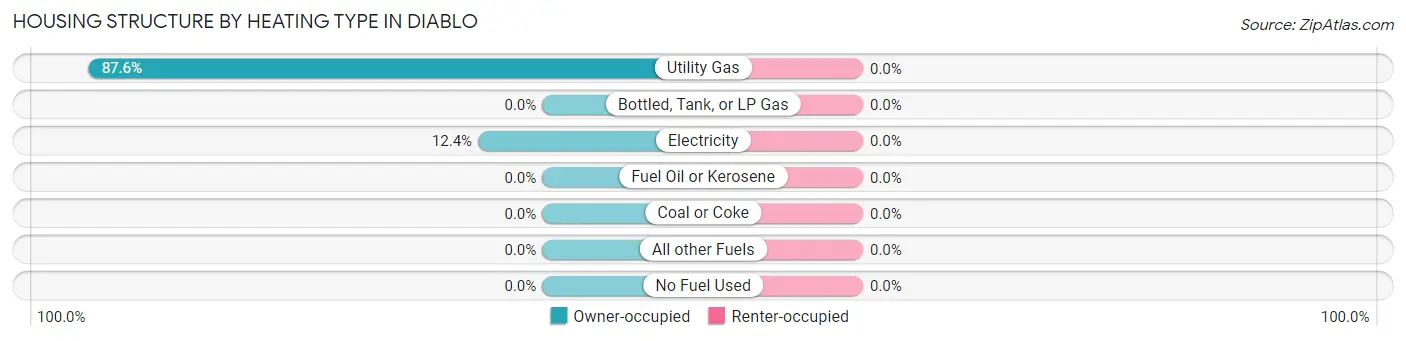
| Heating Type | Owner-occupied | Renter-occupied |
| Utility Gas | 219 (87.6%) | 0 (0.0%) |
| Bottled, Tank, or LP Gas | 0 (0.0%) | 0 (0.0%) |
| Electricity | 31 (12.4%) | 0 (0.0%) |
| Fuel Oil or Kerosene | 0 (0.0%) | 0 (0.0%) |
| Coal or Coke | 0 (0.0%) | 0 (0.0%) |
| All other Fuels | 0 (0.0%) | 0 (0.0%) |
| No Fuel Used | 0 (0.0%) | 0 (0.0%) |
| Total | 250 (100.0%) | 0 (0.0%) |
Household Vehicle Usage in Diablo
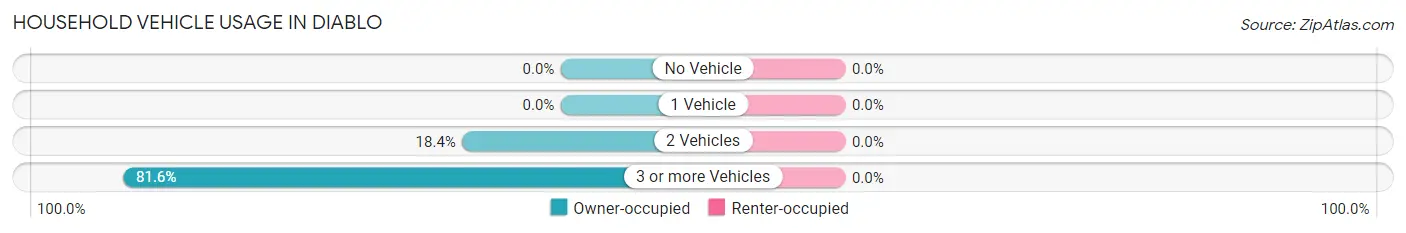
| Vehicles per Household | Owner-occupied | Renter-occupied |
| No Vehicle | 0 (0.0%) | 0 (0.0%) |
| 1 Vehicle | 0 (0.0%) | 0 (0.0%) |
| 2 Vehicles | 46 (18.4%) | 0 (0.0%) |
| 3 or more Vehicles | 204 (81.6%) | 0 (0.0%) |
| Total | 250 (100.0%) | 0 (0.0%) |
Real Estate & Mortgages in Diablo
Real Estate and Mortgage Overview in Diablo
| Characteristic | Without Mortgage | With Mortgage |
| Housing Units | 74 | 176 |
| Median Property Value | $2,000,001 | $2,000,001 |
| Median Household Income | - | - |
| Monthly Housing Costs | $1,501 | $176 |
| Real Estate Taxes | $10,001 | $0 |
Property Value by Mortgage Status in Diablo
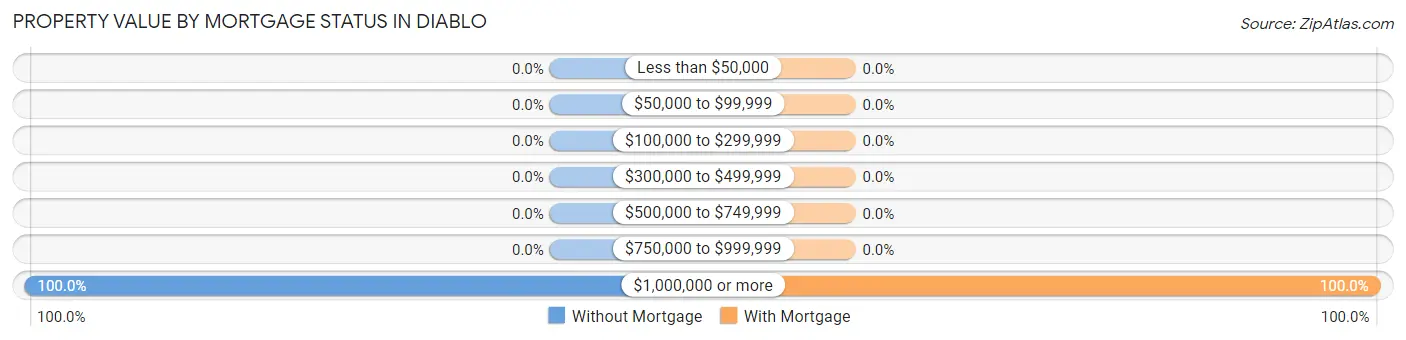
| Property Value | Without Mortgage | With Mortgage |
| Less than $50,000 | 0 (0.0%) | 0 (0.0%) |
| $50,000 to $99,999 | 0 (0.0%) | 0 (0.0%) |
| $100,000 to $299,999 | 0 (0.0%) | 0 (0.0%) |
| $300,000 to $499,999 | 0 (0.0%) | 0 (0.0%) |
| $500,000 to $749,999 | 0 (0.0%) | 0 (0.0%) |
| $750,000 to $999,999 | 0 (0.0%) | 0 (0.0%) |
| $1,000,000 or more | 74 (100.0%) | 176 (100.0%) |
| Total | 74 (100.0%) | 176 (100.0%) |
Household Income by Mortgage Status in Diablo
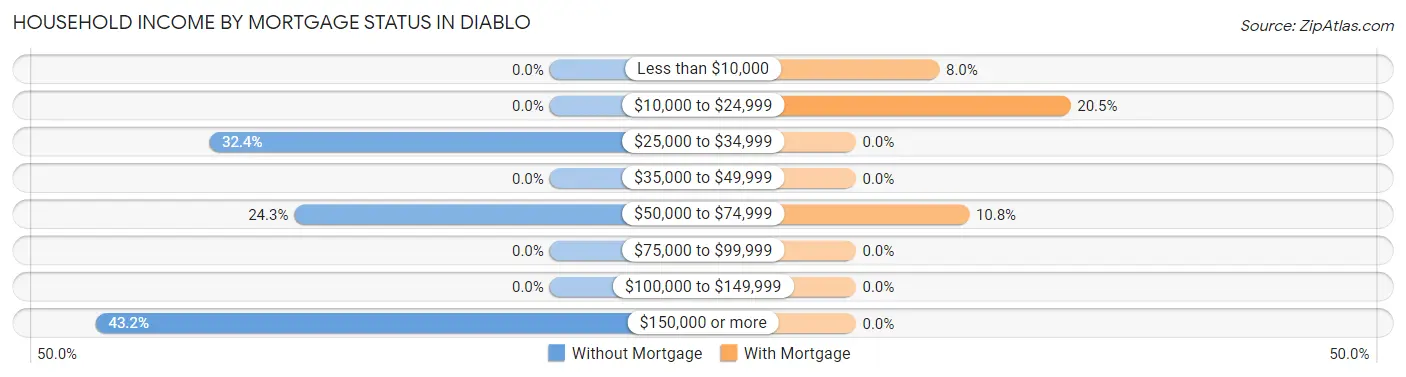
| Household Income | Without Mortgage | With Mortgage |
| Less than $10,000 | 0 (0.0%) | 14 (8.0%) |
| $10,000 to $24,999 | 0 (0.0%) | 36 (20.4%) |
| $25,000 to $34,999 | 24 (32.4%) | 0 (0.0%) |
| $35,000 to $49,999 | 0 (0.0%) | 0 (0.0%) |
| $50,000 to $74,999 | 18 (24.3%) | 19 (10.8%) |
| $75,000 to $99,999 | 0 (0.0%) | 0 (0.0%) |
| $100,000 to $149,999 | 0 (0.0%) | 0 (0.0%) |
| $150,000 or more | 32 (43.2%) | 0 (0.0%) |
| Total | 74 (100.0%) | 176 (100.0%) |
Property Value to Household Income Ratio in Diablo
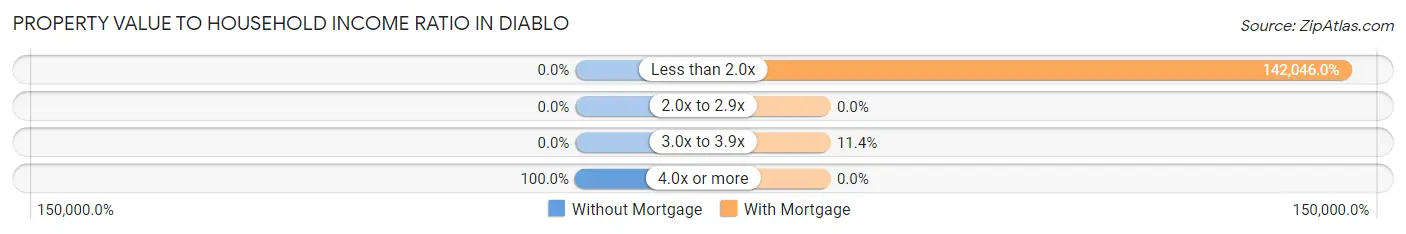
| Value-to-Income Ratio | Without Mortgage | With Mortgage |
| Less than 2.0x | 0 (0.0%) | 250,001 (142,046.0%) |
| 2.0x to 2.9x | 0 (0.0%) | 0 (0.0%) |
| 3.0x to 3.9x | 0 (0.0%) | 20 (11.4%) |
| 4.0x or more | 74 (100.0%) | 0 (0.0%) |
| Total | 74 (100.0%) | 176 (100.0%) |
Real Estate Taxes by Mortgage Status in Diablo
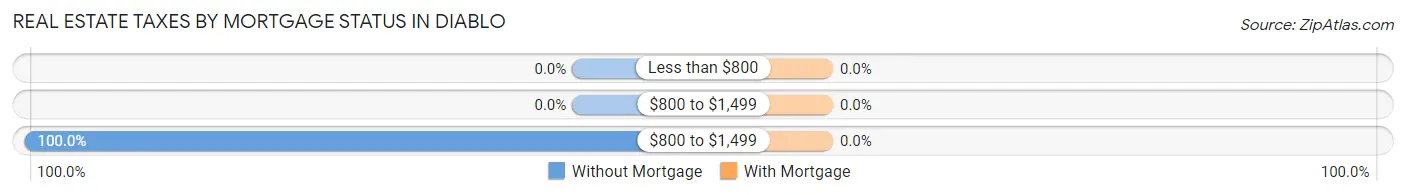
| Property Taxes | Without Mortgage | With Mortgage |
| Less than $800 | 0 (0.0%) | 0 (0.0%) |
| $800 to $1,499 | 0 (0.0%) | 0 (0.0%) |
| $800 to $1,499 | 74 (100.0%) | 0 (0.0%) |
| Total | 74 (100.0%) | 176 (100.0%) |
Health & Disability in Diablo
Health Insurance Coverage by Age in Diablo
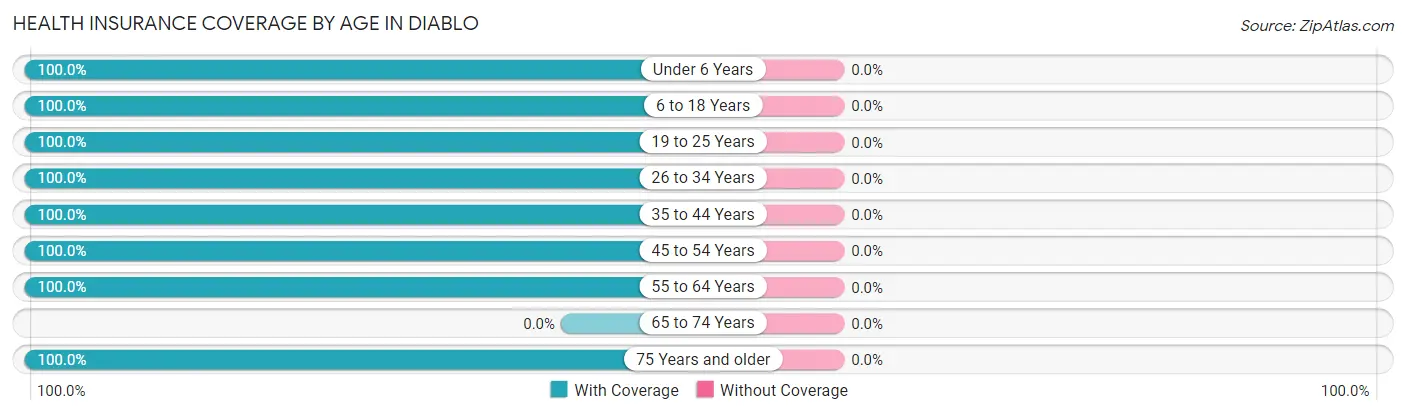
| Age Bracket | With Coverage | Without Coverage |
| Under 6 Years | 138 (100.0%) | 0 (0.0%) |
| 6 to 18 Years | 144 (100.0%) | 0 (0.0%) |
| 19 to 25 Years | 43 (100.0%) | 0 (0.0%) |
| 26 to 34 Years | 7 (100.0%) | 0 (0.0%) |
| 35 to 44 Years | 153 (100.0%) | 0 (0.0%) |
| 45 to 54 Years | 71 (100.0%) | 0 (0.0%) |
| 55 to 64 Years | 67 (100.0%) | 0 (0.0%) |
| 65 to 74 Years | 0 (0.0%) | 0 (0.0%) |
| 75 Years and older | 149 (100.0%) | 0 (0.0%) |
| Total | 772 (100.0%) | 0 (0.0%) |
Health Insurance Coverage by Citizenship Status in Diablo
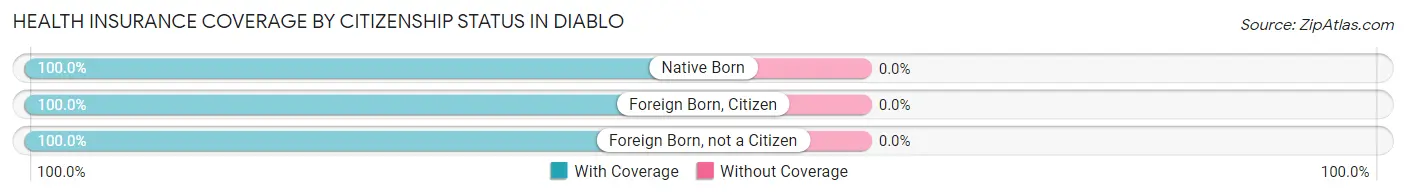
| Citizenship Status | With Coverage | Without Coverage |
| Native Born | 138 (100.0%) | 0 (0.0%) |
| Foreign Born, Citizen | 144 (100.0%) | 0 (0.0%) |
| Foreign Born, not a Citizen | 43 (100.0%) | 0 (0.0%) |
Health Insurance Coverage by Household Income in Diablo
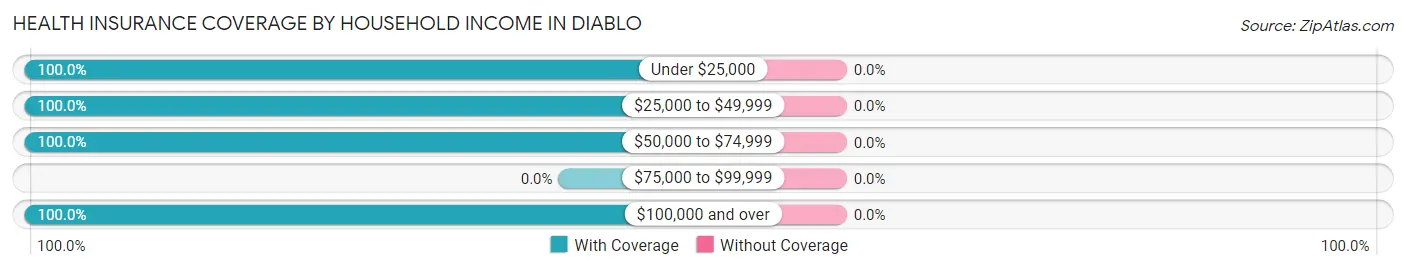
| Household Income | With Coverage | Without Coverage |
| Under $25,000 | 124 (100.0%) | 0 (0.0%) |
| $25,000 to $49,999 | 86 (100.0%) | 0 (0.0%) |
| $50,000 to $74,999 | 53 (100.0%) | 0 (0.0%) |
| $75,000 to $99,999 | 0 (0.0%) | 0 (0.0%) |
| $100,000 and over | 509 (100.0%) | 0 (0.0%) |
Public vs Private Health Insurance Coverage by Age in Diablo
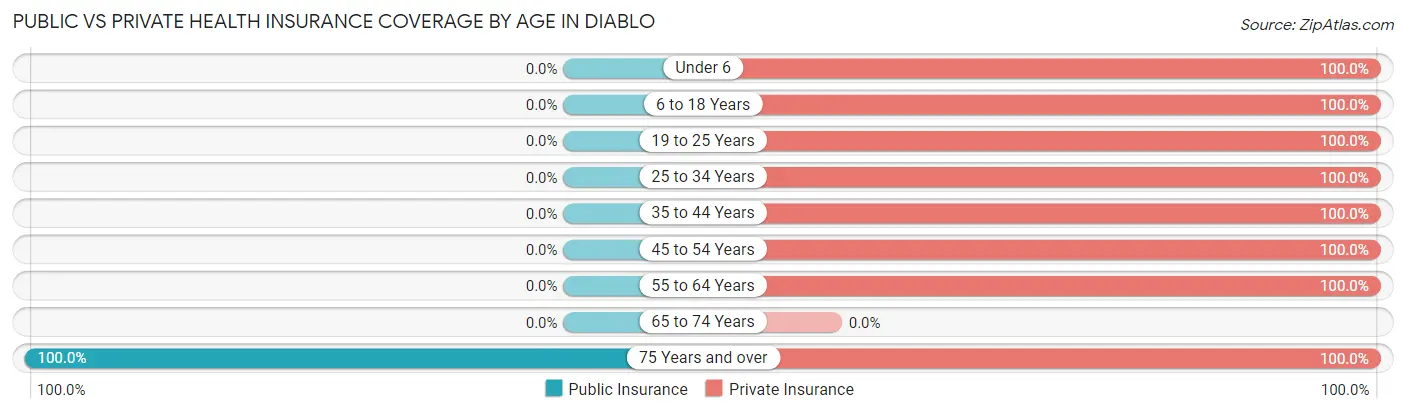
| Age Bracket | Public Insurance | Private Insurance |
| Under 6 | 0 (0.0%) | 138 (100.0%) |
| 6 to 18 Years | 0 (0.0%) | 144 (100.0%) |
| 19 to 25 Years | 0 (0.0%) | 43 (100.0%) |
| 25 to 34 Years | 0 (0.0%) | 7 (100.0%) |
| 35 to 44 Years | 0 (0.0%) | 153 (100.0%) |
| 45 to 54 Years | 0 (0.0%) | 71 (100.0%) |
| 55 to 64 Years | 0 (0.0%) | 67 (100.0%) |
| 65 to 74 Years | 0 (0.0%) | 0 (0.0%) |
| 75 Years and over | 149 (100.0%) | 149 (100.0%) |
| Total | 149 (19.3%) | 772 (100.0%) |
Disability Status by Sex by Age in Diablo
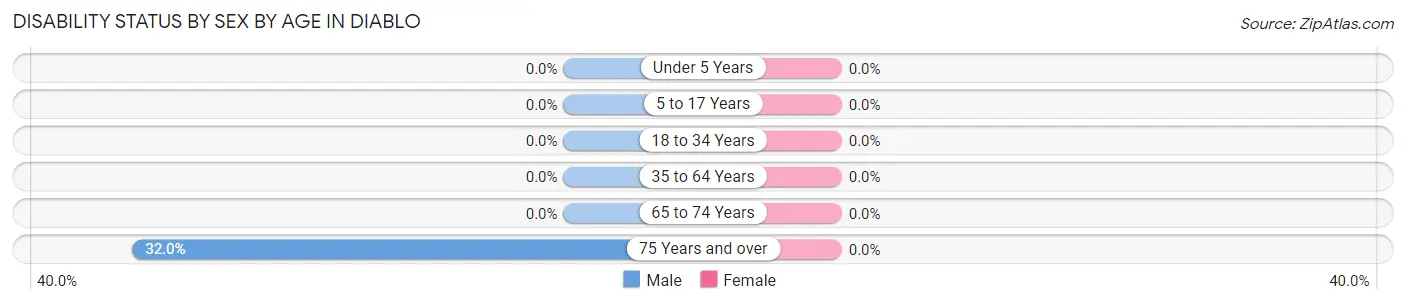
| Age Bracket | Male | Female |
| Under 5 Years | 0 (0.0%) | 0 (0.0%) |
| 5 to 17 Years | 0 (0.0%) | 0 (0.0%) |
| 18 to 34 Years | 0 (0.0%) | 0 (0.0%) |
| 35 to 64 Years | 0 (0.0%) | 0 (0.0%) |
| 65 to 74 Years | 0 (0.0%) | 0 (0.0%) |
| 75 Years and over | 24 (32.0%) | 0 (0.0%) |
Disability Class by Sex by Age in Diablo
Disability Class: Hearing Difficulty
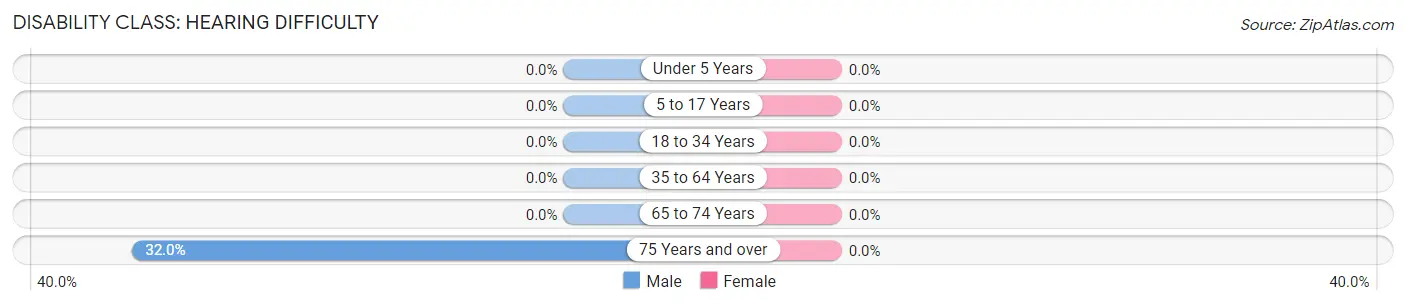
| Age Bracket | Male | Female |
| Under 5 Years | 0 (0.0%) | 0 (0.0%) |
| 5 to 17 Years | 0 (0.0%) | 0 (0.0%) |
| 18 to 34 Years | 0 (0.0%) | 0 (0.0%) |
| 35 to 64 Years | 0 (0.0%) | 0 (0.0%) |
| 65 to 74 Years | 0 (0.0%) | 0 (0.0%) |
| 75 Years and over | 24 (32.0%) | 0 (0.0%) |
Disability Class: Vision Difficulty
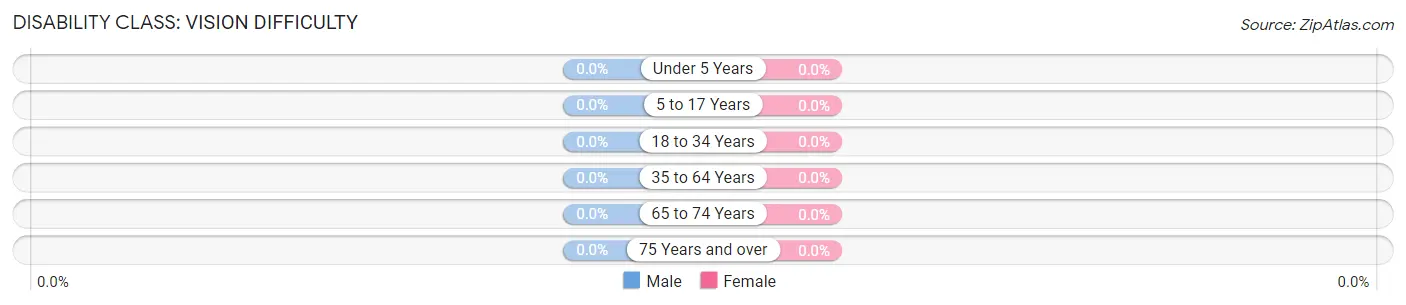
| Age Bracket | Male | Female |
| Under 5 Years | 0 (0.0%) | 0 (0.0%) |
| 5 to 17 Years | 0 (0.0%) | 0 (0.0%) |
| 18 to 34 Years | 0 (0.0%) | 0 (0.0%) |
| 35 to 64 Years | 0 (0.0%) | 0 (0.0%) |
| 65 to 74 Years | 0 (0.0%) | 0 (0.0%) |
| 75 Years and over | 0 (0.0%) | 0 (0.0%) |
Disability Class: Cognitive Difficulty

| Age Bracket | Male | Female |
| 5 to 17 Years | 0 (0.0%) | 0 (0.0%) |
| 18 to 34 Years | 0 (0.0%) | 0 (0.0%) |
| 35 to 64 Years | 0 (0.0%) | 0 (0.0%) |
| 65 to 74 Years | 0 (0.0%) | 0 (0.0%) |
| 75 Years and over | 0 (0.0%) | 0 (0.0%) |
Disability Class: Ambulatory Difficulty
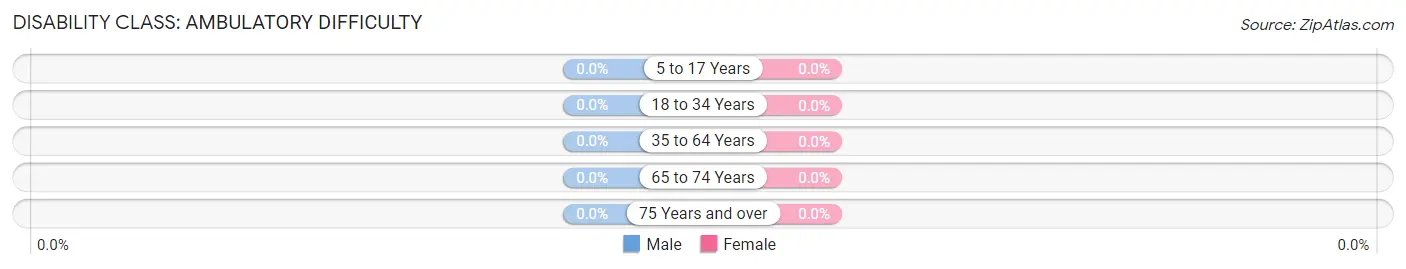
| Age Bracket | Male | Female |
| 5 to 17 Years | 0 (0.0%) | 0 (0.0%) |
| 18 to 34 Years | 0 (0.0%) | 0 (0.0%) |
| 35 to 64 Years | 0 (0.0%) | 0 (0.0%) |
| 65 to 74 Years | 0 (0.0%) | 0 (0.0%) |
| 75 Years and over | 0 (0.0%) | 0 (0.0%) |
Disability Class: Self-Care Difficulty
| Age Bracket | Male | Female |
| 5 to 17 Years | 0 (0.0%) | 0 (0.0%) |
| 18 to 34 Years | 0 (0.0%) | 0 (0.0%) |
| 35 to 64 Years | 0 (0.0%) | 0 (0.0%) |
| 65 to 74 Years | 0 (0.0%) | 0 (0.0%) |
| 75 Years and over | 0 (0.0%) | 0 (0.0%) |
Technology Access in Diablo
Computing Device Access in Diablo
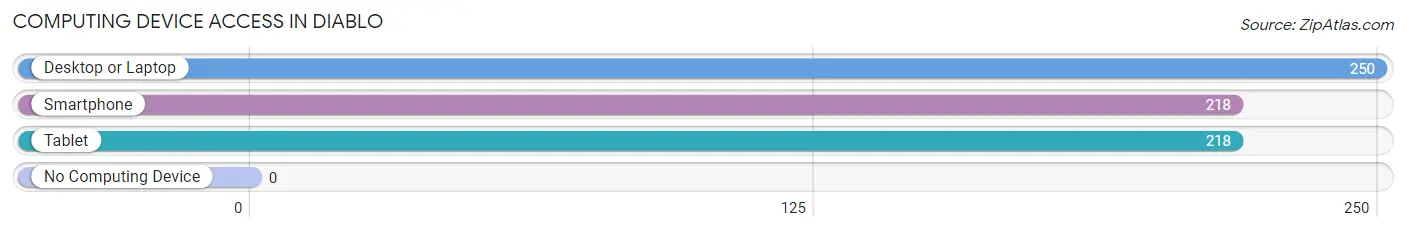
| Device Type | # Households | % Households |
| Desktop or Laptop | 250 | 100.0% |
| Smartphone | 218 | 87.2% |
| Tablet | 218 | 87.2% |
| No Computing Device | 0 | 0.0% |
| Total | 250 | 100.0% |
Internet Access in Diablo
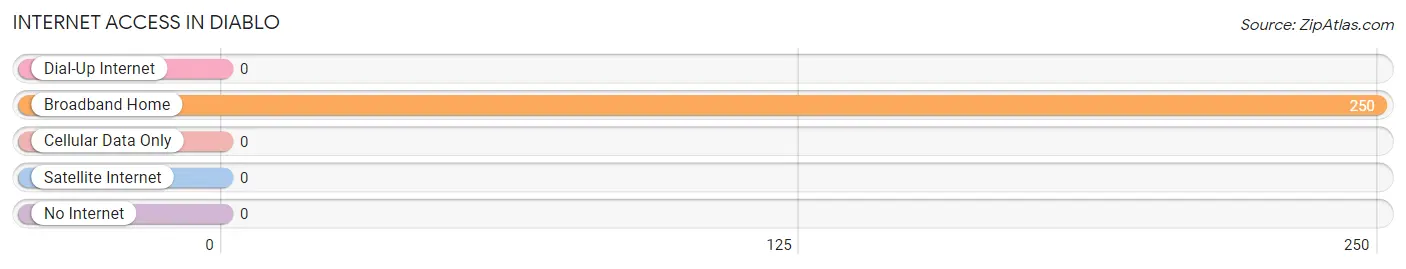
| Internet Type | # Households | % Households |
| Dial-Up Internet | 0 | 0.0% |
| Broadband Home | 250 | 100.0% |
| Cellular Data Only | 0 | 0.0% |
| Satellite Internet | 0 | 0.0% |
| No Internet | 0 | 0.0% |
| Total | 250 | 100.0% |
Diablo Summary
Diablo, California is a small unincorporated community located in Contra Costa County, California. It is situated in the foothills of Mount Diablo, a mountain that is part of the Diablo Range. The town is located approximately 25 miles east of San Francisco and is part of the San Ramon Valley. The population of Diablo was estimated to be 1,890 in 2019.
History
Diablo was originally inhabited by the Ohlone people, who lived in the area for thousands of years before the arrival of Europeans. The first Europeans to settle in the area were Spanish missionaries, who established a mission in the area in 1797. The mission was abandoned in 1834, and the area was later settled by ranchers and farmers.
In 1855, the town of Diablo was founded by William B. Ide, who named it after the nearby mountain. Ide was a former leader of the California Republic and the first president of the California State Senate. The town grew slowly over the next few decades, and by the early 1900s, it had become a popular tourist destination.
Geography
Diablo is located in the foothills of Mount Diablo, which is part of the Diablo Range. The town is situated at an elevation of 1,000 feet above sea level. The area is characterized by rolling hills and valleys, with the town itself located in a small valley. The climate in Diablo is Mediterranean, with hot, dry summers and mild, wet winters.
Economy
The economy of Diablo is largely based on tourism and agriculture. The town is home to several wineries, and it is a popular destination for wine tasting and other activities. The town is also home to several small businesses, including restaurants, shops, and art galleries.
Demographics
The population of Diablo was estimated to be 1,890 in 2019. The racial makeup of the town is predominantly white (83.3%), followed by Asian (7.2%), Hispanic or Latino (4.7%), and African American (2.2%). The median household income in Diablo is $117,000, and the median home value is $1.2 million.
Conclusion
Diablo, California is a small unincorporated community located in Contra Costa County, California. It is situated in the foothills of Mount Diablo, a mountain that is part of the Diablo Range. The town is home to several wineries, and it is a popular destination for wine tasting and other activities. The population of Diablo was estimated to be 1,890 in 2019, and the racial makeup of the town is predominantly white. The economy of Diablo is largely based on tourism and agriculture, and the median household income in Diablo is $117,000.
Common Questions
What is Per Capita Income in Diablo?
Per Capita income in Diablo is $123,586.
What is the Median Family Income in Diablo?
Median Family Income in Diablo is $250,001.
What is the Median Household income in Diablo?
Median Household Income in Diablo is $250,001.
What is Inequality or Gini Index in Diablo?
Inequality or Gini Index in Diablo is 0.48.
What is the Total Population of Diablo?
Total Population of Diablo is 772.
What is the Total Male Population of Diablo?
Total Male Population of Diablo is 349.
What is the Total Female Population of Diablo?
Total Female Population of Diablo is 423.
What is the Ratio of Males per 100 Females in Diablo?
There are 82.51 Males per 100 Females in Diablo.
What is the Ratio of Females per 100 Males in Diablo?
There are 121.20 Females per 100 Males in Diablo.
What is the Median Population Age in Diablo?
Median Population Age in Diablo is 37.4 Years.
What is the Average Family Size in Diablo
Average Family Size in Diablo is 3.2 People.
What is the Average Household Size in Diablo
Average Household Size in Diablo is 3.1 People.
How Large is the Labor Force in Diablo?
There are 288 People in the Labor Forcein in Diablo.
What is the Percentage of People in the Labor Force in Diablo?
52.1% of People are in the Labor Force in Diablo.
What is the Unemployment Rate in Diablo?
Unemployment Rate in Diablo is 14.9%.