Palos Verdes Estates, CA Map & Demographics
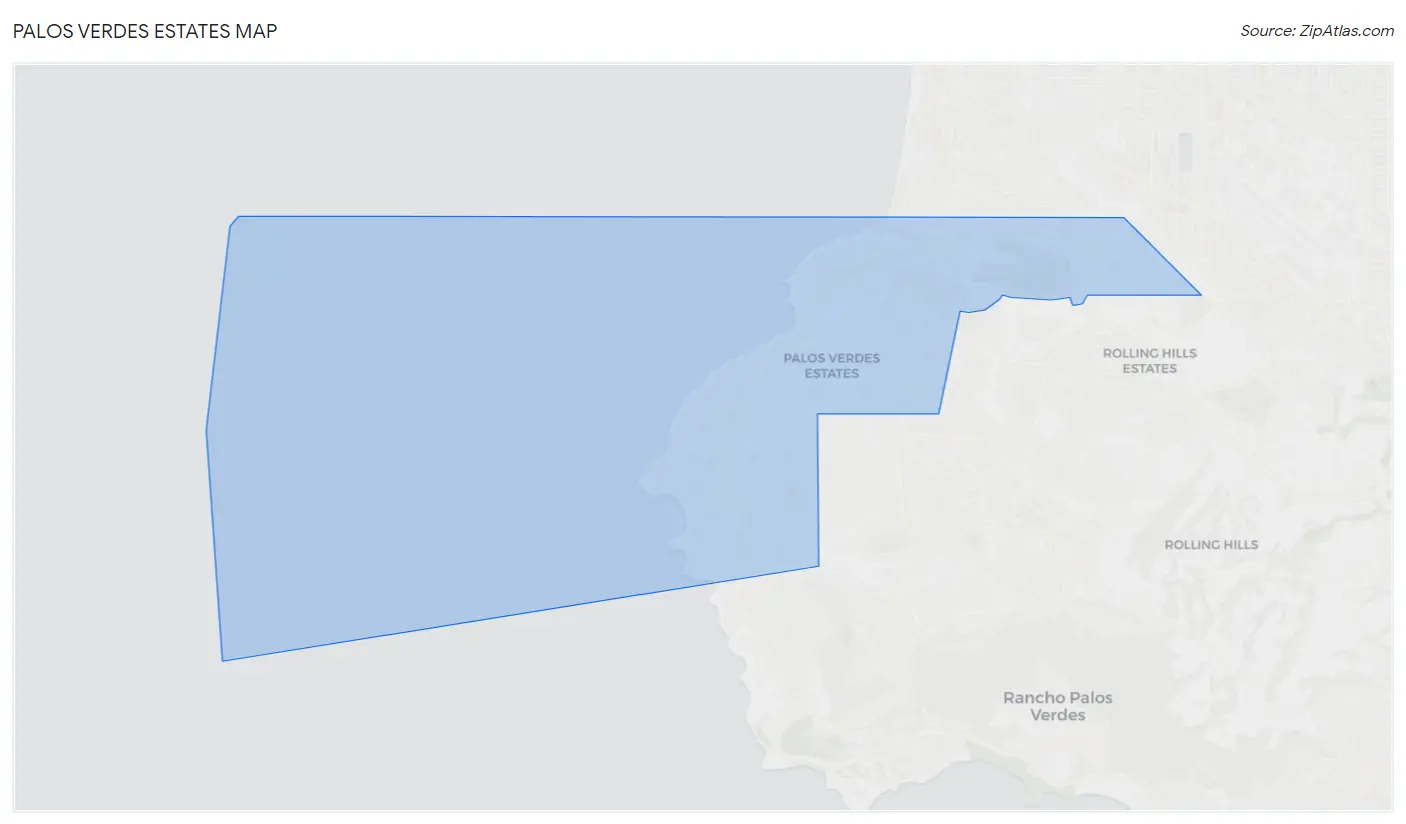
Palos Verdes Estates Map
Palos Verdes Estates Overview
$133,004
PER CAPITA INCOME
$250,001
AVG FAMILY INCOME
$224,766
AVG HOUSEHOLD INCOME
62.9%
WAGE / INCOME GAP [ % ]
37.1¢/ $1
WAGE / INCOME GAP [ $ ]
0.52
INEQUALITY / GINI INDEX
13,219
TOTAL POPULATION
6,614
MALE POPULATION
6,605
FEMALE POPULATION
100.14
MALES / 100 FEMALES
99.86
FEMALES / 100 MALES
53.3
MEDIAN AGE
3.0
AVG FAMILY SIZE
2.6
AVG HOUSEHOLD SIZE
5,402
LABOR FORCE [ PEOPLE ]
50.9%
PERCENT IN LABOR FORCE
2.3%
UNEMPLOYMENT RATE
Palos Verdes Estates Area Codes
Income in Palos Verdes Estates
Income Overview in Palos Verdes Estates
Per Capita Income in Palos Verdes Estates is $133,004, while median incomes of families and households are $250,001 and $224,766 respectively.
| Characteristic | Number | Measure |
| Per Capita Income | 13,219 | $133,004 |
| Median Family Income | 3,923 | $250,001 |
| Mean Family Income | 3,923 | $387,259 |
| Median Household Income | 5,123 | $224,766 |
| Mean Household Income | 5,123 | $342,463 |
| Income Deficit | 3,923 | $0 |
| Wage / Income Gap (%) | 13,219 | 62.92% |
| Wage / Income Gap ($) | 13,219 | 37.08¢ per $1 |
| Gini / Inequality Index | 13,219 | 0.52 |
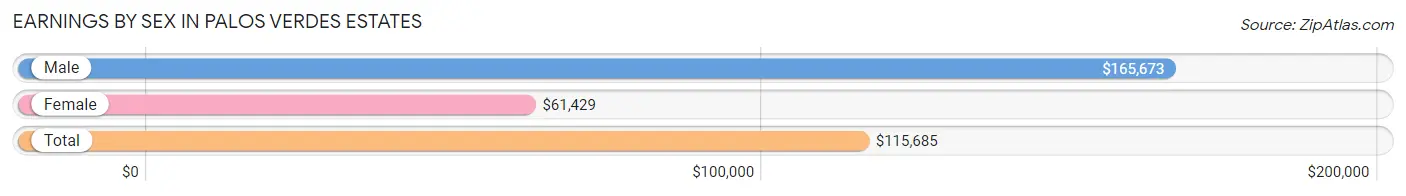
Earnings by Sex in Palos Verdes Estates
Average Earnings in Palos Verdes Estates are $115,685, $165,673 for men and $61,429 for women, a difference of 62.9%.
| Sex | Number | Average Earnings |
| Male | 3,467 (59.2%) | $165,673 |
| Female | 2,392 (40.8%) | $61,429 |
| Total | 5,859 (100.0%) | $115,685 |
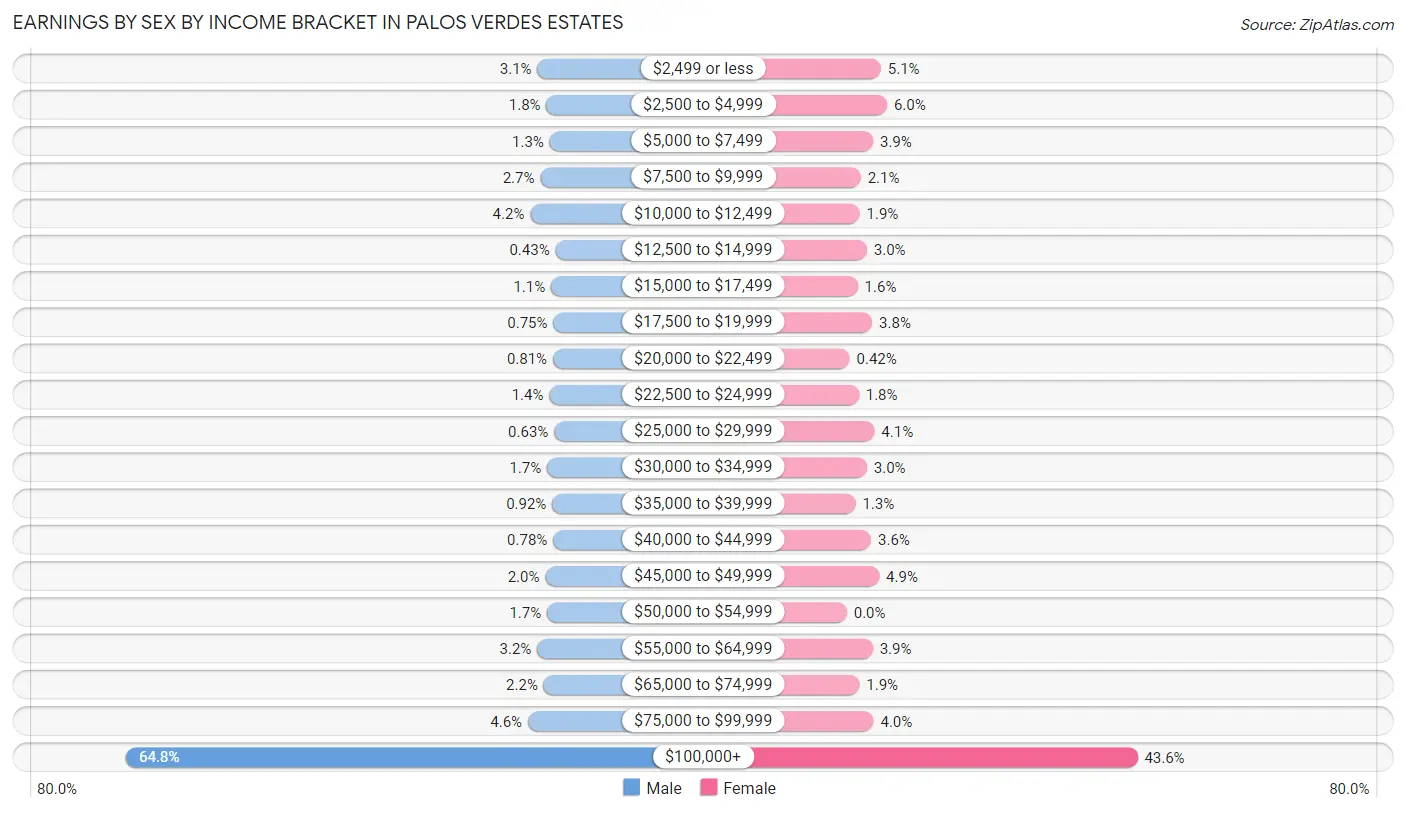
Earnings by Sex by Income Bracket in Palos Verdes Estates
The most common earnings brackets in Palos Verdes Estates are $100,000+ for men (2,246 | 64.8%) and $100,000+ for women (1,042 | 43.6%).
| Income | Male | Female |
| $2,499 or less | 109 (3.1%) | 122 (5.1%) |
| $2,500 to $4,999 | 62 (1.8%) | 144 (6.0%) |
| $5,000 to $7,499 | 45 (1.3%) | 94 (3.9%) |
| $7,500 to $9,999 | 94 (2.7%) | 50 (2.1%) |
| $10,000 to $12,499 | 146 (4.2%) | 46 (1.9%) |
| $12,500 to $14,999 | 15 (0.4%) | 72 (3.0%) |
| $15,000 to $17,499 | 38 (1.1%) | 39 (1.6%) |
| $17,500 to $19,999 | 26 (0.7%) | 91 (3.8%) |
| $20,000 to $22,499 | 28 (0.8%) | 10 (0.4%) |
| $22,500 to $24,999 | 47 (1.4%) | 43 (1.8%) |
| $25,000 to $29,999 | 22 (0.6%) | 99 (4.1%) |
| $30,000 to $34,999 | 59 (1.7%) | 72 (3.0%) |
| $35,000 to $39,999 | 32 (0.9%) | 31 (1.3%) |
| $40,000 to $44,999 | 27 (0.8%) | 87 (3.6%) |
| $45,000 to $49,999 | 68 (2.0%) | 116 (4.9%) |
| $50,000 to $54,999 | 59 (1.7%) | 0 (0.0%) |
| $55,000 to $64,999 | 110 (3.2%) | 93 (3.9%) |
| $65,000 to $74,999 | 76 (2.2%) | 45 (1.9%) |
| $75,000 to $99,999 | 158 (4.6%) | 96 (4.0%) |
| $100,000+ | 2,246 (64.8%) | 1,042 (43.6%) |
| Total | 3,467 (100.0%) | 2,392 (100.0%) |
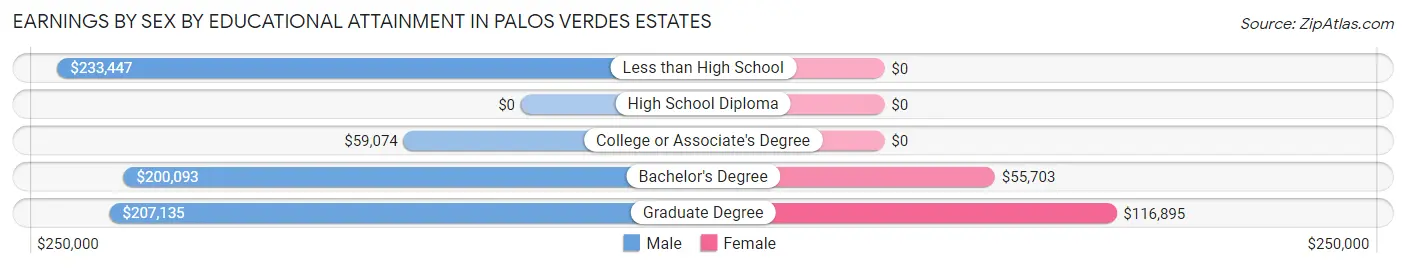
Earnings by Sex by Educational Attainment in Palos Verdes Estates
Average earnings in Palos Verdes Estates are $181,897 for men and $77,083 for women, a difference of 57.6%. Men with an educational attainment of less than high school enjoy the highest average annual earnings of $233,447, while those with college or associate's degree education earn the least with $59,074. Women with an educational attainment of graduate degree earn the most with the average annual earnings of $116,895, while those with bachelor's degree education have the smallest earnings of $55,703.
| Educational Attainment | Male Income | Female Income |
| Less than High School | $233,447 | $0 |
| High School Diploma | - | - |
| College or Associate's Degree | $59,074 | $0 |
| Bachelor's Degree | $200,093 | $55,703 |
| Graduate Degree | $207,135 | $116,895 |
| Total | $181,897 | $77,083 |
Family Income in Palos Verdes Estates
Family Income Brackets in Palos Verdes Estates
According to the Palos Verdes Estates family income data, there are 2,381 families falling into the $200,000+ income range, which is the most common income bracket and makes up 60.7% of all families. Conversely, the $10,000 to $14,999 income bracket is the least frequent group with only 12 families (0.3%) belonging to this category.
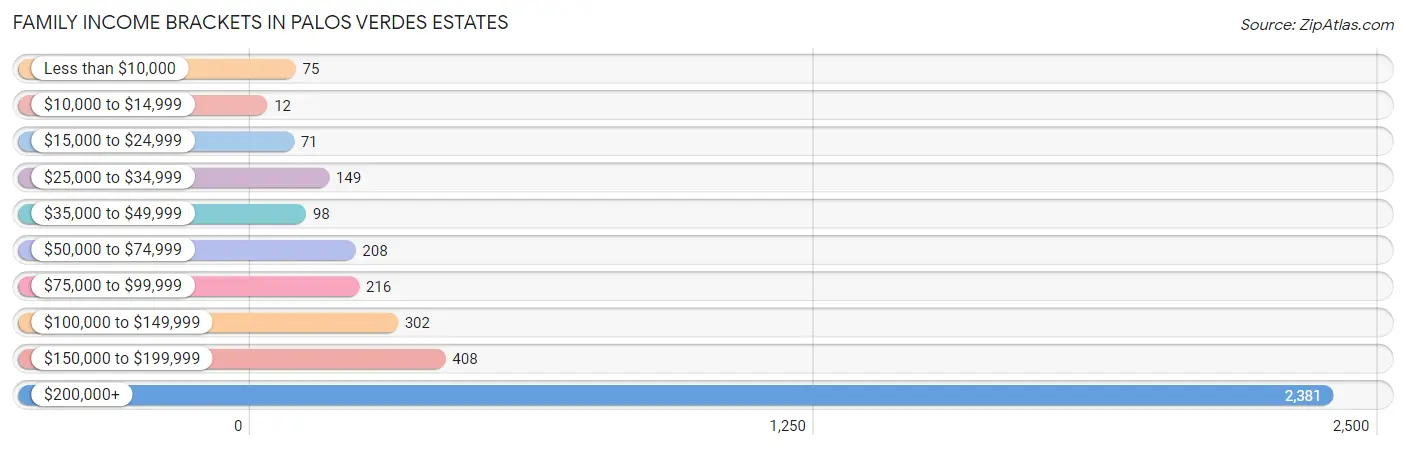
| Income Bracket | # Families | % Families |
| Less than $10,000 | 75 | 1.9% |
| $10,000 to $14,999 | 12 | 0.3% |
| $15,000 to $24,999 | 71 | 1.8% |
| $25,000 to $34,999 | 149 | 3.8% |
| $35,000 to $49,999 | 98 | 2.5% |
| $50,000 to $74,999 | 208 | 5.3% |
| $75,000 to $99,999 | 216 | 5.5% |
| $100,000 to $149,999 | 302 | 7.7% |
| $150,000 to $199,999 | 408 | 10.4% |
| $200,000+ | 2,381 | 60.7% |
Family Income by Famaliy Size in Palos Verdes Estates
3-person families (936 | 23.9%) account for the highest median family income in Palos Verdes Estates with $250,001 per family, while 2-person families (1,912 | 48.7%) have the highest median income of $116,322 per family member.
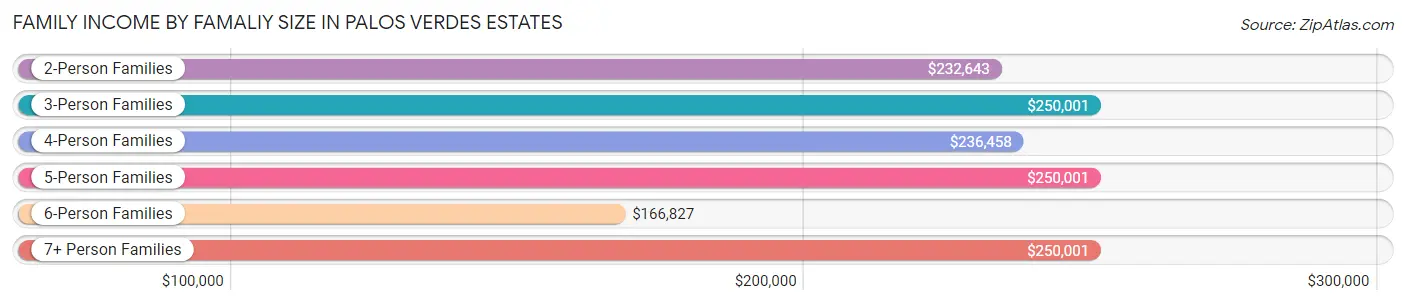
| Income Bracket | # Families | Median Income |
| 2-Person Families | 1,912 (48.7%) | $232,643 |
| 3-Person Families | 936 (23.9%) | $250,001 |
| 4-Person Families | 720 (18.3%) | $236,458 |
| 5-Person Families | 246 (6.3%) | $250,001 |
| 6-Person Families | 39 (1.0%) | $166,827 |
| 7+ Person Families | 70 (1.8%) | $250,001 |
| Total | 3,923 (100.0%) | $250,001 |
Family Income by Number of Earners in Palos Verdes Estates
The median family income in Palos Verdes Estates is $250,001, with families comprising 2 earners (1,401) having the highest median family income of $250,001, while families with no earners (811) have the lowest median family income of $125,260, accounting for 35.7% and 20.7% of families, respectively.
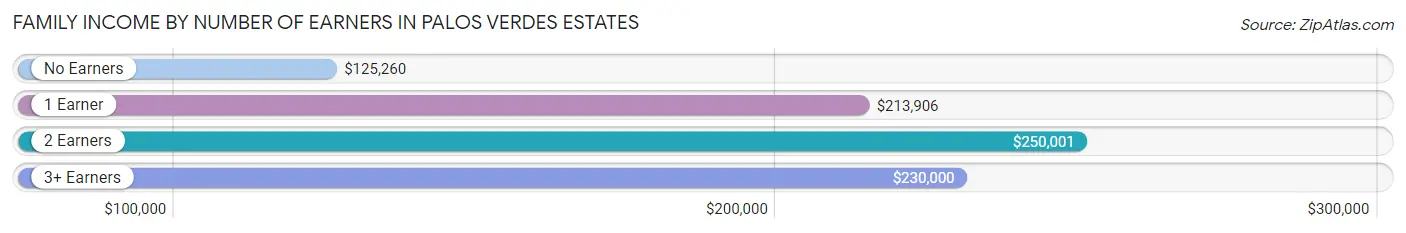
| Number of Earners | # Families | Median Income |
| No Earners | 811 (20.7%) | $125,260 |
| 1 Earner | 1,379 (35.1%) | $213,906 |
| 2 Earners | 1,401 (35.7%) | $250,001 |
| 3+ Earners | 332 (8.5%) | $230,000 |
| Total | 3,923 (100.0%) | $250,001 |
Household Income in Palos Verdes Estates
Household Income Brackets in Palos Verdes Estates
With 2,813 households falling in the category, the $200,000+ income range is the most frequent in Palos Verdes Estates, accounting for 54.9% of all households. In contrast, only 20 households (0.4%) fall into the $10,000 to $14,999 income bracket, making it the least populous group.
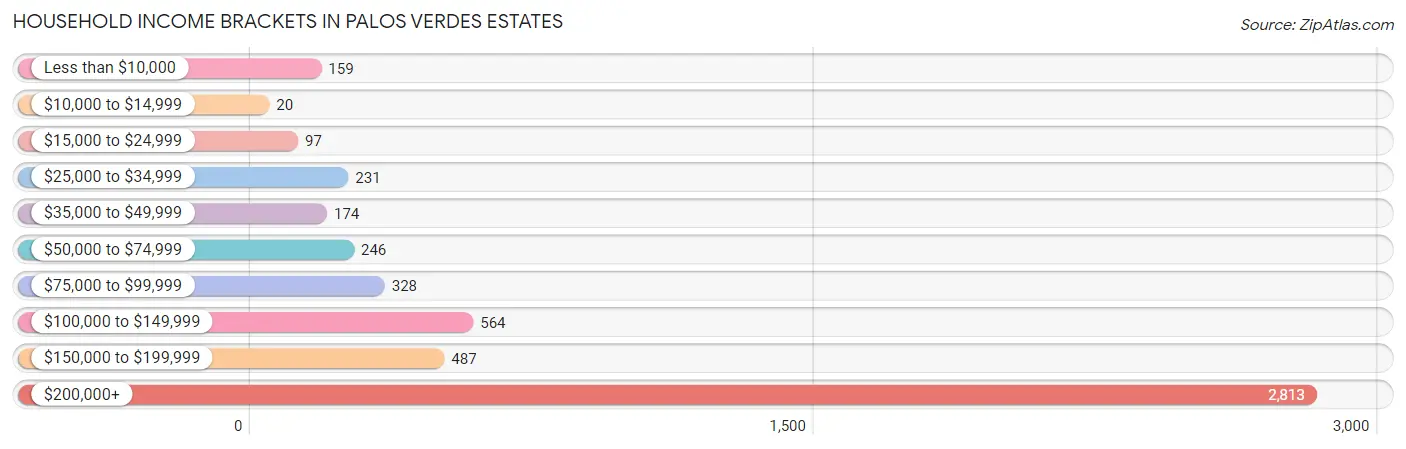
| Income Bracket | # Households | % Households |
| Less than $10,000 | 159 | 3.1% |
| $10,000 to $14,999 | 20 | 0.4% |
| $15,000 to $24,999 | 97 | 1.9% |
| $25,000 to $34,999 | 231 | 4.5% |
| $35,000 to $49,999 | 174 | 3.4% |
| $50,000 to $74,999 | 246 | 4.8% |
| $75,000 to $99,999 | 328 | 6.4% |
| $100,000 to $149,999 | 564 | 11.0% |
| $150,000 to $199,999 | 487 | 9.5% |
| $200,000+ | 2,813 | 54.9% |
Household Income by Householder Age in Palos Verdes Estates
The median household income in Palos Verdes Estates is $224,766, with the highest median household income of $250,001 found in the 25 to 44 years age bracket for the primary householder. A total of 515 households (10.1%) fall into this category. Meanwhile, the 15 to 24 years age bracket for the primary householder has the lowest median household income of $0, with 11 households (0.2%) in this group.
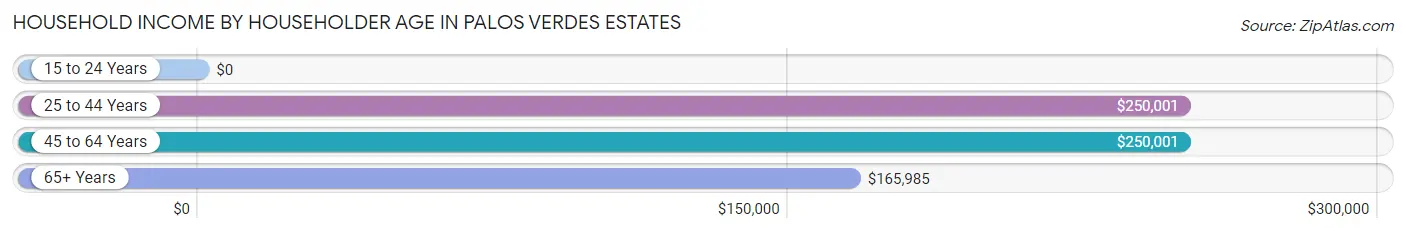
| Income Bracket | # Households | Median Income |
| 15 to 24 Years | 11 (0.2%) | $0 |
| 25 to 44 Years | 515 (10.1%) | $250,001 |
| 45 to 64 Years | 2,444 (47.7%) | $250,001 |
| 65+ Years | 2,153 (42.0%) | $165,985 |
| Total | 5,123 (100.0%) | $224,766 |
Poverty in Palos Verdes Estates
Income Below Poverty by Sex and Age in Palos Verdes Estates
With 3.5% poverty level for males and 4.1% for females among the residents of Palos Verdes Estates, 75 year old and over males and 18 to 24 year old females are the most vulnerable to poverty, with 60 males (6.6%) and 21 females (13.1%) in their respective age groups living below the poverty level.
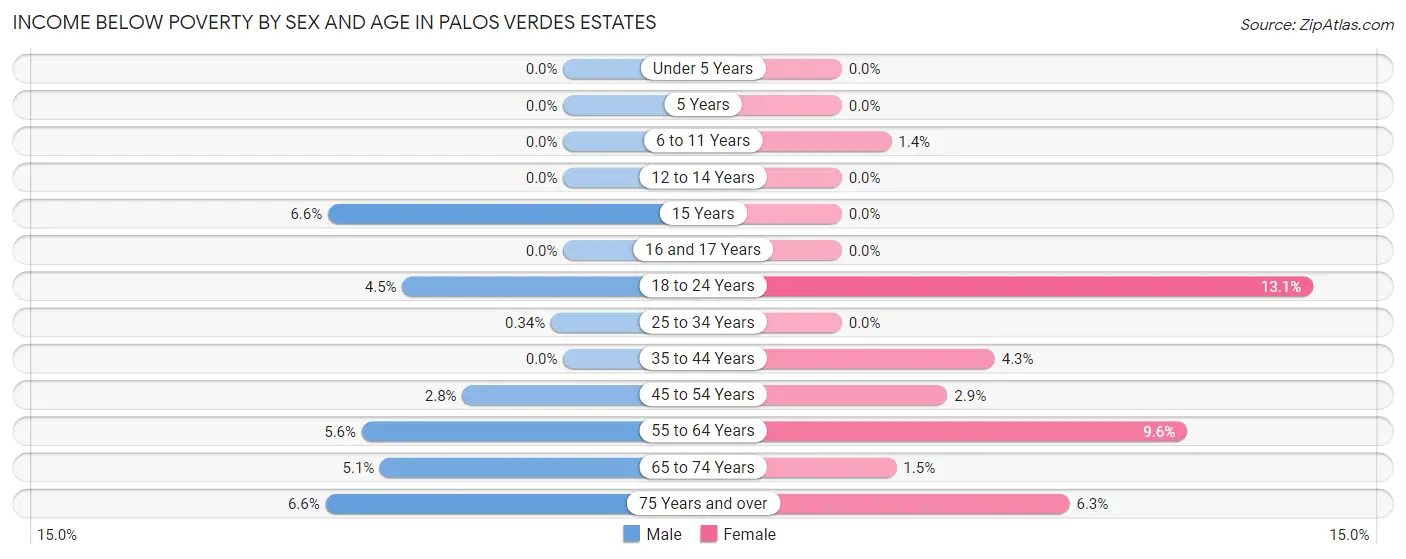
| Age Bracket | Male | Female |
| Under 5 Years | 0 (0.0%) | 0 (0.0%) |
| 5 Years | 0 (0.0%) | 0 (0.0%) |
| 6 to 11 Years | 0 (0.0%) | 11 (1.4%) |
| 12 to 14 Years | 0 (0.0%) | 0 (0.0%) |
| 15 Years | 11 (6.6%) | 0 (0.0%) |
| 16 and 17 Years | 0 (0.0%) | 0 (0.0%) |
| 18 to 24 Years | 15 (4.5%) | 21 (13.1%) |
| 25 to 34 Years | 1 (0.3%) | 0 (0.0%) |
| 35 to 44 Years | 0 (0.0%) | 22 (4.3%) |
| 45 to 54 Years | 25 (2.8%) | 32 (2.9%) |
| 55 to 64 Years | 79 (5.6%) | 108 (9.6%) |
| 65 to 74 Years | 43 (5.1%) | 15 (1.5%) |
| 75 Years and over | 60 (6.6%) | 62 (6.3%) |
| Total | 234 (3.5%) | 271 (4.1%) |
Income Above Poverty by Sex and Age in Palos Verdes Estates
According to the poverty statistics in Palos Verdes Estates, males aged under 5 years and females aged under 5 years are the age groups that are most secure financially, with 100.0% of males and 100.0% of females in these age groups living above the poverty line.
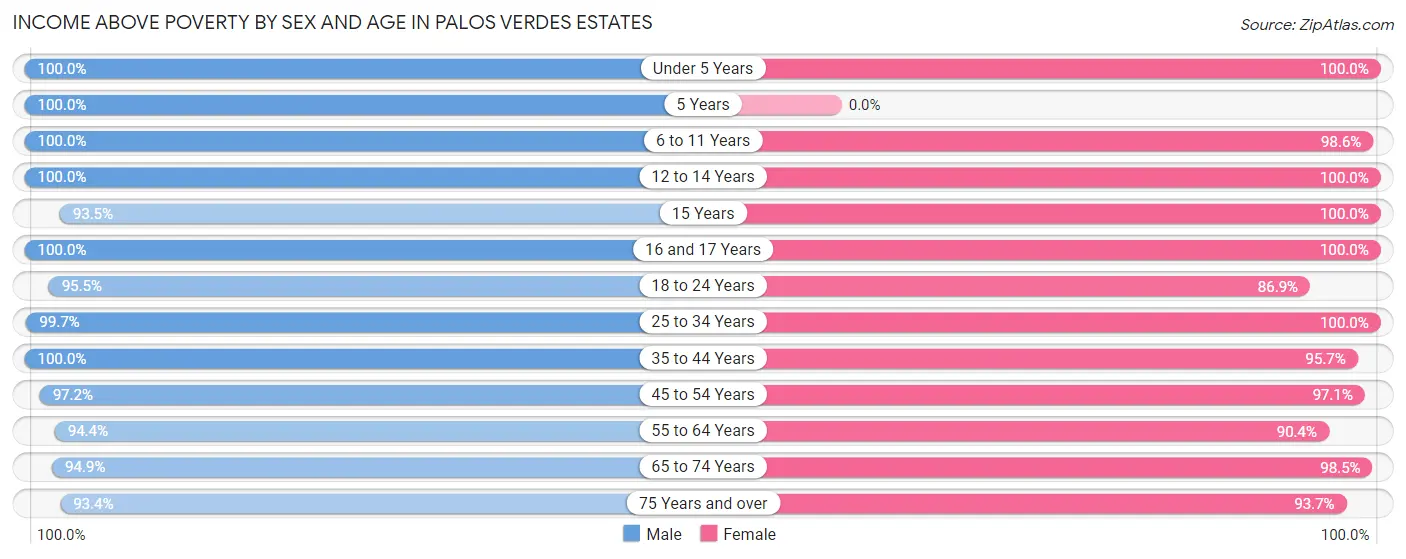
| Age Bracket | Male | Female |
| Under 5 Years | 260 (100.0%) | 225 (100.0%) |
| 5 Years | 48 (100.0%) | 0 (0.0%) |
| 6 to 11 Years | 292 (100.0%) | 787 (98.6%) |
| 12 to 14 Years | 449 (100.0%) | 301 (100.0%) |
| 15 Years | 157 (93.4%) | 65 (100.0%) |
| 16 and 17 Years | 318 (100.0%) | 126 (100.0%) |
| 18 to 24 Years | 320 (95.5%) | 139 (86.9%) |
| 25 to 34 Years | 290 (99.7%) | 236 (100.0%) |
| 35 to 44 Years | 405 (100.0%) | 495 (95.7%) |
| 45 to 54 Years | 865 (97.2%) | 1,056 (97.1%) |
| 55 to 64 Years | 1,329 (94.4%) | 1,016 (90.4%) |
| 65 to 74 Years | 800 (94.9%) | 972 (98.5%) |
| 75 Years and over | 847 (93.4%) | 916 (93.7%) |
| Total | 6,380 (96.5%) | 6,334 (95.9%) |
Income Below Poverty Among Married-Couple Families in Palos Verdes Estates
The poverty statistics for married-couple families in Palos Verdes Estates show that 4.1% or 142 of the total 3,468 families live below the poverty line. Families with no children have the highest poverty rate of 6.3%, comprising of 132 families. On the other hand, families with 3 or 4 children have the lowest poverty rate of 0.0%, which includes 0 families.
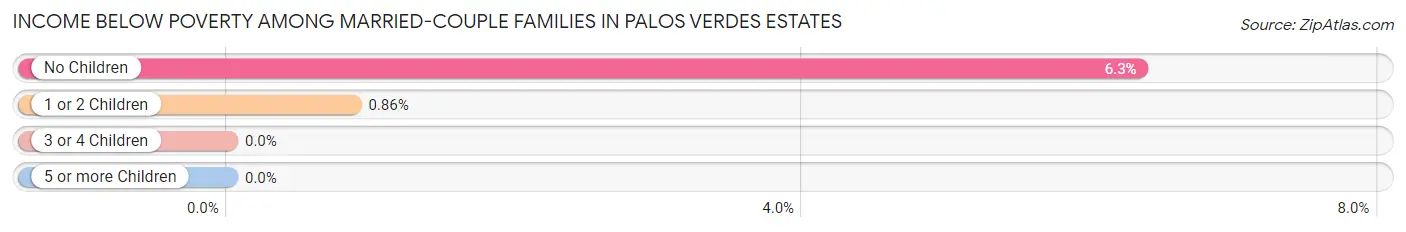
| Children | Above Poverty | Below Poverty |
| No Children | 1,951 (93.7%) | 132 (6.3%) |
| 1 or 2 Children | 1,149 (99.1%) | 10 (0.9%) |
| 3 or 4 Children | 180 (100.0%) | 0 (0.0%) |
| 5 or more Children | 46 (100.0%) | 0 (0.0%) |
| Total | 3,326 (95.9%) | 142 (4.1%) |
Income Below Poverty Among Single-Parent Households in Palos Verdes Estates
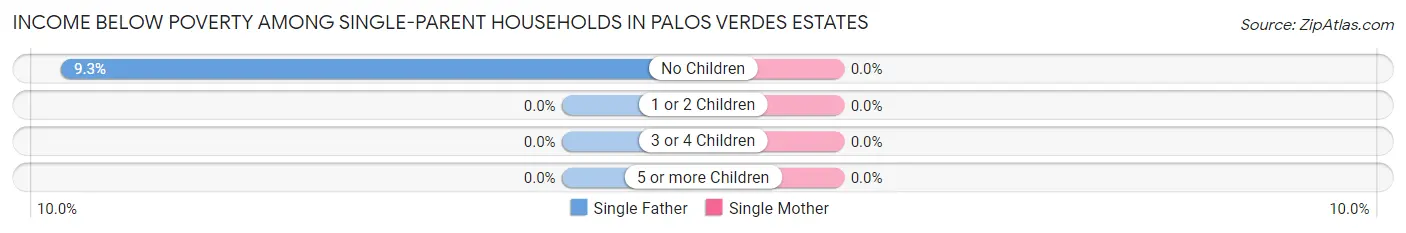
| Children | Single Father | Single Mother |
| No Children | 11 (9.3%) | 0 (0.0%) |
| 1 or 2 Children | 0 (0.0%) | 0 (0.0%) |
| 3 or 4 Children | 0 (0.0%) | 0 (0.0%) |
| 5 or more Children | 0 (0.0%) | 0 (0.0%) |
| Total | 11 (8.3%) | 0 (0.0%) |
Income Below Poverty Among Married-Couple vs Single-Parent Households in Palos Verdes Estates
The poverty data for Palos Verdes Estates shows that 142 of the married-couple family households (4.1%) and 11 of the single-parent households (2.4%) are living below the poverty level. Within the married-couple family households, those with no children have the highest poverty rate, with 132 households (6.3%) falling below the poverty line. Among the single-parent households, those with no children have the highest poverty rate, with 11 household (3.3%) living below poverty.
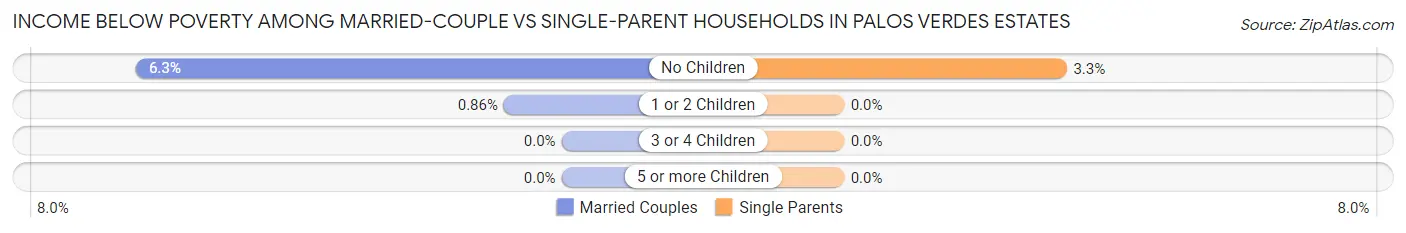
| Children | Married-Couple Families | Single-Parent Households |
| No Children | 132 (6.3%) | 11 (3.3%) |
| 1 or 2 Children | 10 (0.9%) | 0 (0.0%) |
| 3 or 4 Children | 0 (0.0%) | 0 (0.0%) |
| 5 or more Children | 0 (0.0%) | 0 (0.0%) |
| Total | 142 (4.1%) | 11 (2.4%) |
Race in Palos Verdes Estates
The most populous races in Palos Verdes Estates are White / Caucasian (8,551 | 64.7%), Asian (3,316 | 25.1%), and Two or more Races (953 | 7.2%).
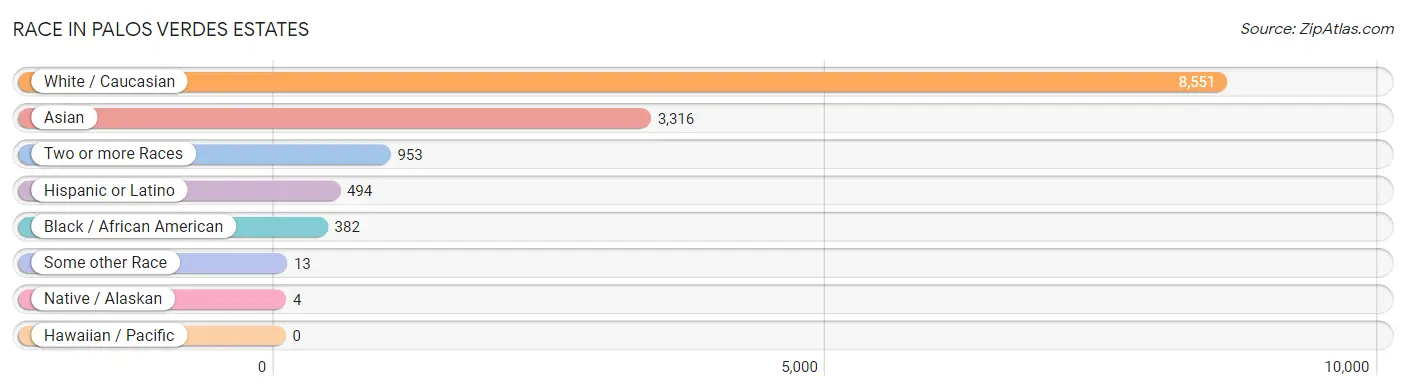
| Race | # Population | % Population |
| Asian | 3,316 | 25.1% |
| Black / African American | 382 | 2.9% |
| Hawaiian / Pacific | 0 | 0.0% |
| Hispanic or Latino | 494 | 3.7% |
| Native / Alaskan | 4 | 0.0% |
| White / Caucasian | 8,551 | 64.7% |
| Two or more Races | 953 | 7.2% |
| Some other Race | 13 | 0.1% |
| Total | 13,219 | 100.0% |
Ancestry in Palos Verdes Estates
The most populous ancestries reported in Palos Verdes Estates are Irish (1,745 | 13.2%), German (1,528 | 11.6%), English (1,492 | 11.3%), Indian (Asian) (1,332 | 10.1%), and Bhutanese (1,161 | 8.8%), together accounting for 54.9% of all Palos Verdes Estates residents.
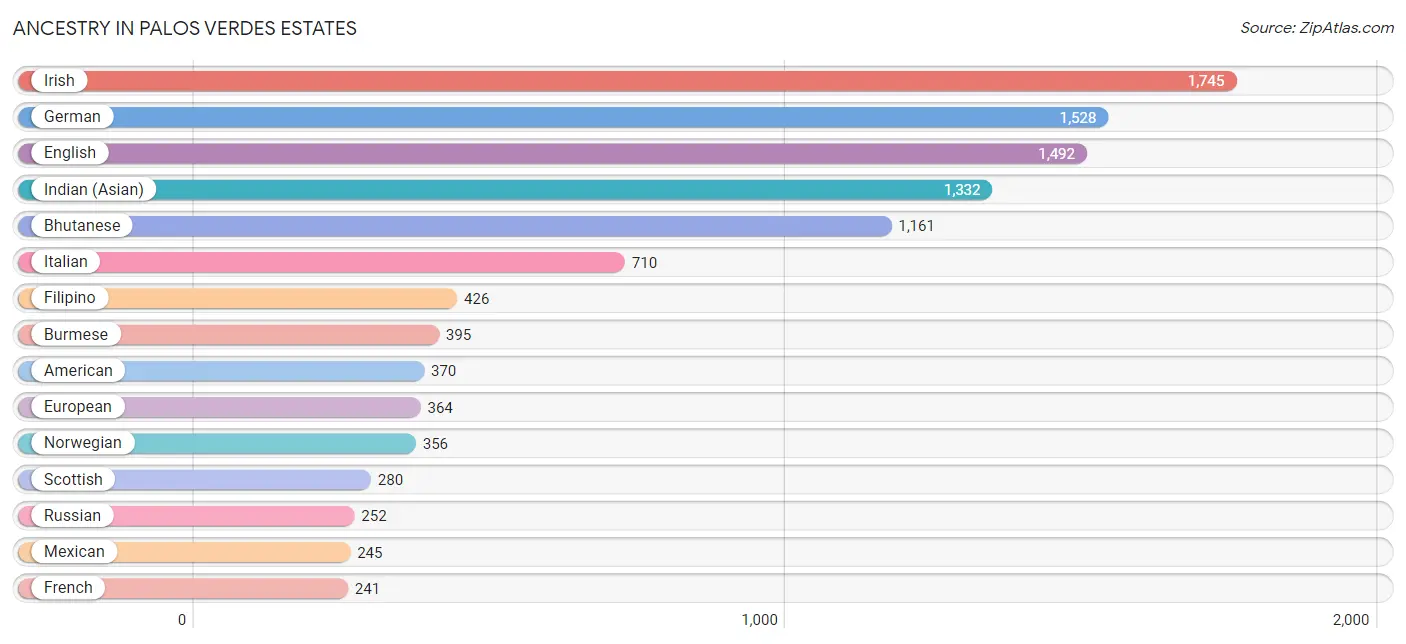
| Ancestry | # Population | % Population |
| Albanian | 14 | 0.1% |
| American | 370 | 2.8% |
| Arab | 199 | 1.5% |
| Argentinean | 84 | 0.6% |
| Armenian | 105 | 0.8% |
| Austrian | 39 | 0.3% |
| Bhutanese | 1,161 | 8.8% |
| British | 142 | 1.1% |
| Burmese | 395 | 3.0% |
| Canadian | 56 | 0.4% |
| Central American | 17 | 0.1% |
| Colombian | 7 | 0.1% |
| Costa Rican | 17 | 0.1% |
| Croatian | 71 | 0.5% |
| Cuban | 70 | 0.5% |
| Czech | 16 | 0.1% |
| Czechoslovakian | 6 | 0.1% |
| Danish | 39 | 0.3% |
| Dutch | 113 | 0.9% |
| Eastern European | 56 | 0.4% |
| Ecuadorian | 16 | 0.1% |
| Egyptian | 59 | 0.4% |
| English | 1,492 | 11.3% |
| European | 364 | 2.8% |
| Filipino | 426 | 3.2% |
| Finnish | 10 | 0.1% |
| French | 241 | 1.8% |
| French American Indian | 80 | 0.6% |
| French Canadian | 73 | 0.5% |
| German | 1,528 | 11.6% |
| Greek | 84 | 0.6% |
| Hungarian | 177 | 1.3% |
| Indian (Asian) | 1,332 | 10.1% |
| Indonesian | 99 | 0.7% |
| Iranian | 128 | 1.0% |
| Iraqi | 12 | 0.1% |
| Irish | 1,745 | 13.2% |
| Italian | 710 | 5.4% |
| Japanese | 2 | 0.0% |
| Korean | 205 | 1.5% |
| Lebanese | 24 | 0.2% |
| Lithuanian | 58 | 0.4% |
| Luxembourger | 13 | 0.1% |
| Macedonian | 32 | 0.2% |
| Mexican | 245 | 1.8% |
| Moroccan | 27 | 0.2% |
| New Zealander | 8 | 0.1% |
| Nigerian | 61 | 0.5% |
| Northern European | 63 | 0.5% |
| Norwegian | 356 | 2.7% |
| Polish | 215 | 1.6% |
| Romanian | 100 | 0.8% |
| Russian | 252 | 1.9% |
| Scandinavian | 51 | 0.4% |
| Scotch-Irish | 81 | 0.6% |
| Scottish | 280 | 2.1% |
| Serbian | 28 | 0.2% |
| Sioux | 6 | 0.1% |
| Slovak | 13 | 0.1% |
| Slovene | 9 | 0.1% |
| South African | 11 | 0.1% |
| South American | 107 | 0.8% |
| Spanish | 47 | 0.4% |
| Sri Lankan | 128 | 1.0% |
| Subsaharan African | 72 | 0.5% |
| Swedish | 209 | 1.6% |
| Swiss | 132 | 1.0% |
| Syrian | 21 | 0.2% |
| Thai | 213 | 1.6% |
| Ukrainian | 39 | 0.3% |
| Welsh | 24 | 0.2% | View All 71 Rows |
Immigrants in Palos Verdes Estates
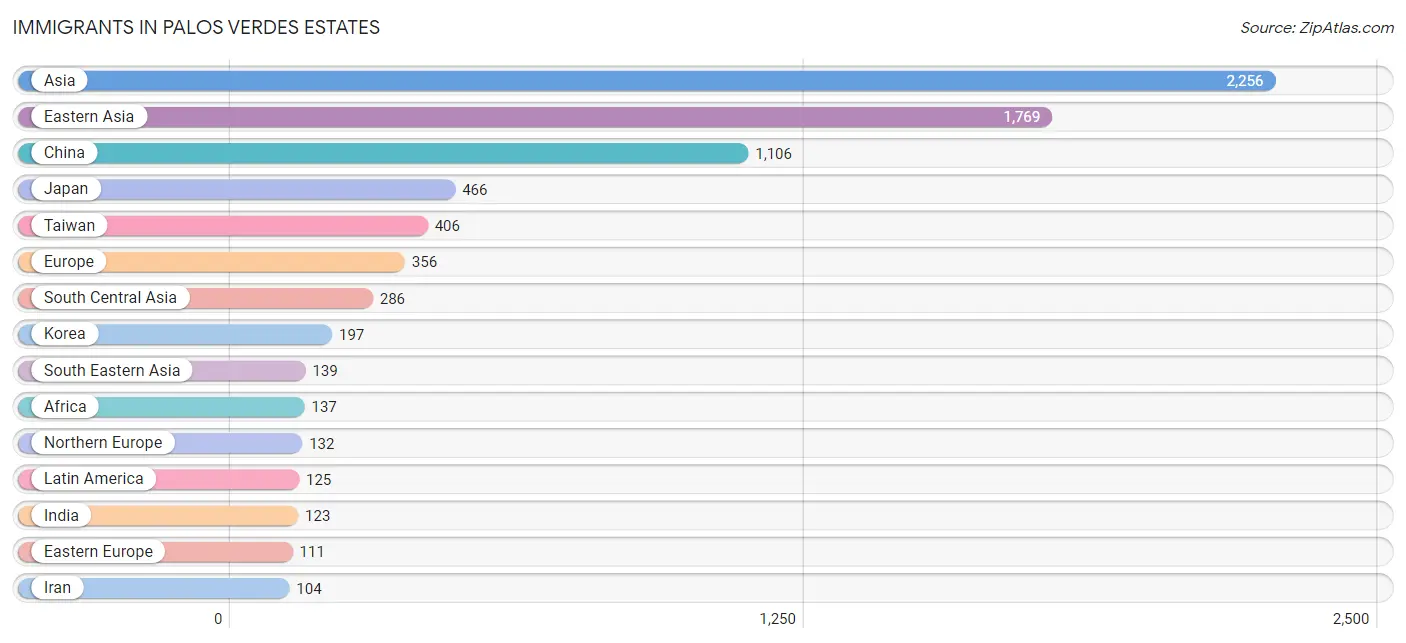
The most numerous immigrant groups reported in Palos Verdes Estates came from Asia (2,256 | 17.1%), Eastern Asia (1,769 | 13.4%), China (1,106 | 8.4%), Japan (466 | 3.5%), and Taiwan (406 | 3.1%), together accounting for 45.4% of all Palos Verdes Estates residents.
| Immigration Origin | # Population | % Population |
| Africa | 137 | 1.0% |
| Argentina | 50 | 0.4% |
| Asia | 2,256 | 17.1% |
| Australia | 11 | 0.1% |
| Bangladesh | 18 | 0.1% |
| Barbados | 16 | 0.1% |
| Cambodia | 2 | 0.0% |
| Canada | 10 | 0.1% |
| Caribbean | 40 | 0.3% |
| Central America | 35 | 0.3% |
| China | 1,106 | 8.4% |
| Cuba | 24 | 0.2% |
| Eastern Asia | 1,769 | 13.4% |
| Eastern Europe | 111 | 0.8% |
| Egypt | 38 | 0.3% |
| England | 55 | 0.4% |
| Europe | 356 | 2.7% |
| Fiji | 7 | 0.1% |
| France | 16 | 0.1% |
| Germany | 35 | 0.3% |
| Hong Kong | 61 | 0.5% |
| Hungary | 29 | 0.2% |
| India | 123 | 0.9% |
| Iran | 104 | 0.8% |
| Italy | 28 | 0.2% |
| Japan | 466 | 3.5% |
| Jordan | 9 | 0.1% |
| Korea | 197 | 1.5% |
| Latin America | 125 | 0.9% |
| Lebanon | 11 | 0.1% |
| Mexico | 35 | 0.3% |
| Morocco | 27 | 0.2% |
| Netherlands | 21 | 0.2% |
| Nigeria | 61 | 0.5% |
| Northern Africa | 65 | 0.5% |
| Northern Europe | 132 | 1.0% |
| Norway | 12 | 0.1% |
| Oceania | 26 | 0.2% |
| Pakistan | 7 | 0.1% |
| Philippines | 25 | 0.2% |
| Poland | 38 | 0.3% |
| Romania | 11 | 0.1% |
| Scotland | 6 | 0.1% |
| Singapore | 21 | 0.2% |
| South Africa | 11 | 0.1% |
| South America | 50 | 0.4% |
| South Central Asia | 286 | 2.2% |
| South Eastern Asia | 139 | 1.1% |
| Southern Europe | 28 | 0.2% |
| Sri Lanka | 34 | 0.3% |
| Sweden | 23 | 0.2% |
| Switzerland | 13 | 0.1% |
| Syria | 42 | 0.3% |
| Taiwan | 406 | 3.1% |
| Ukraine | 33 | 0.3% |
| Vietnam | 67 | 0.5% |
| Western Africa | 61 | 0.5% |
| Western Asia | 62 | 0.5% |
| Western Europe | 85 | 0.6% | View All 59 Rows |
Sex and Age in Palos Verdes Estates
Sex and Age in Palos Verdes Estates
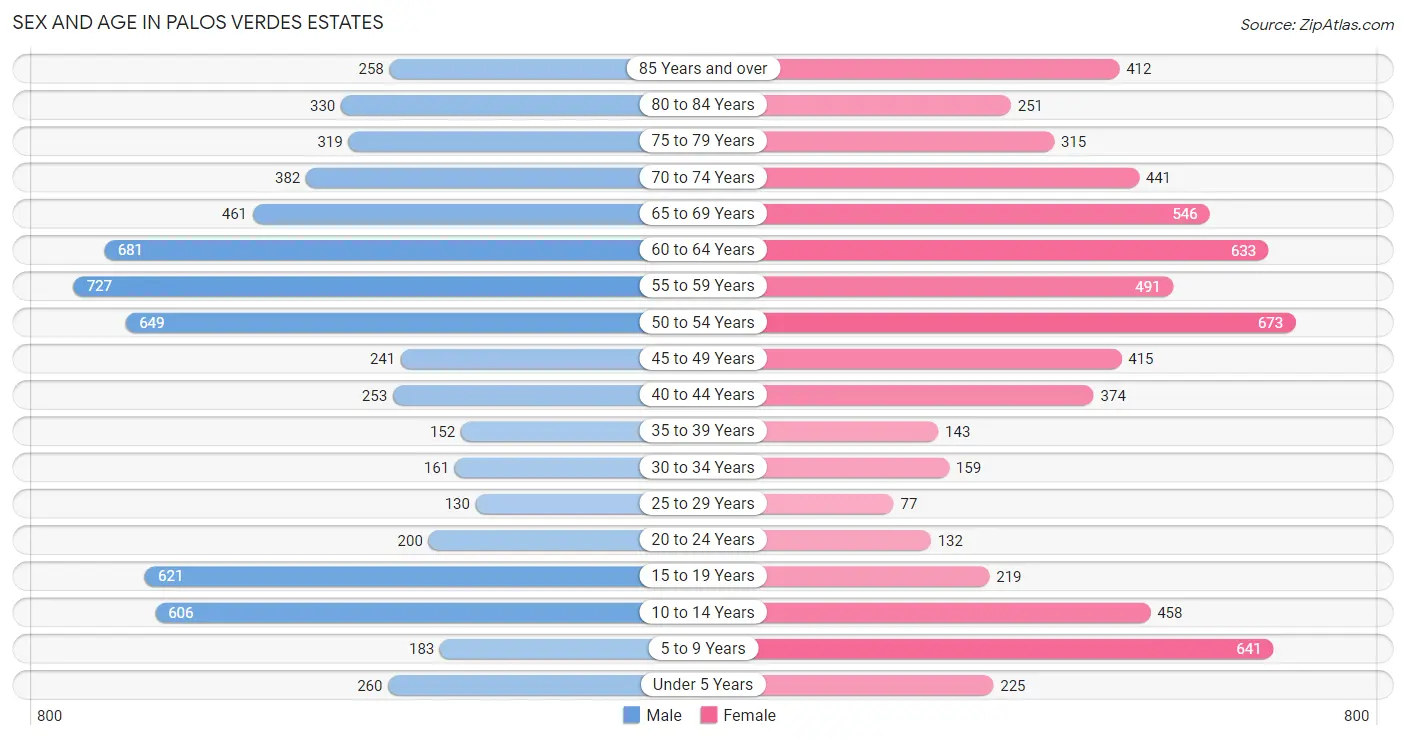
The most populous age groups in Palos Verdes Estates are 55 to 59 Years (727 | 11.0%) for men and 50 to 54 Years (673 | 10.2%) for women.
| Age Bracket | Male | Female |
| Under 5 Years | 260 (3.9%) | 225 (3.4%) |
| 5 to 9 Years | 183 (2.8%) | 641 (9.7%) |
| 10 to 14 Years | 606 (9.2%) | 458 (6.9%) |
| 15 to 19 Years | 621 (9.4%) | 219 (3.3%) |
| 20 to 24 Years | 200 (3.0%) | 132 (2.0%) |
| 25 to 29 Years | 130 (2.0%) | 77 (1.2%) |
| 30 to 34 Years | 161 (2.4%) | 159 (2.4%) |
| 35 to 39 Years | 152 (2.3%) | 143 (2.2%) |
| 40 to 44 Years | 253 (3.8%) | 374 (5.7%) |
| 45 to 49 Years | 241 (3.6%) | 415 (6.3%) |
| 50 to 54 Years | 649 (9.8%) | 673 (10.2%) |
| 55 to 59 Years | 727 (11.0%) | 491 (7.4%) |
| 60 to 64 Years | 681 (10.3%) | 633 (9.6%) |
| 65 to 69 Years | 461 (7.0%) | 546 (8.3%) |
| 70 to 74 Years | 382 (5.8%) | 441 (6.7%) |
| 75 to 79 Years | 319 (4.8%) | 315 (4.8%) |
| 80 to 84 Years | 330 (5.0%) | 251 (3.8%) |
| 85 Years and over | 258 (3.9%) | 412 (6.2%) |
| Total | 6,614 (100.0%) | 6,605 (100.0%) |
Families and Households in Palos Verdes Estates
Median Family Size in Palos Verdes Estates
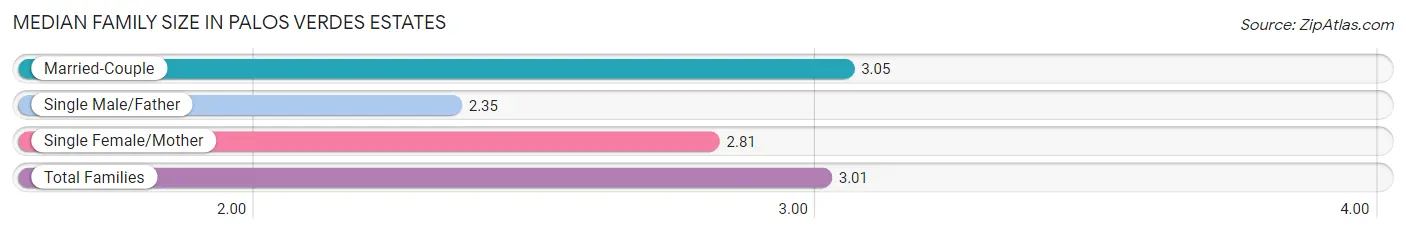
The median family size in Palos Verdes Estates is 3.01 persons per family, with married-couple families (3,468 | 88.4%) accounting for the largest median family size of 3.05 persons per family. On the other hand, single male/father families (133 | 3.4%) represent the smallest median family size with 2.35 persons per family.
| Family Type | # Families | Family Size |
| Married-Couple | 3,468 (88.4%) | 3.05 |
| Single Male/Father | 133 (3.4%) | 2.35 |
| Single Female/Mother | 322 (8.2%) | 2.81 |
| Total Families | 3,923 (100.0%) | 3.01 |
Median Household Size in Palos Verdes Estates
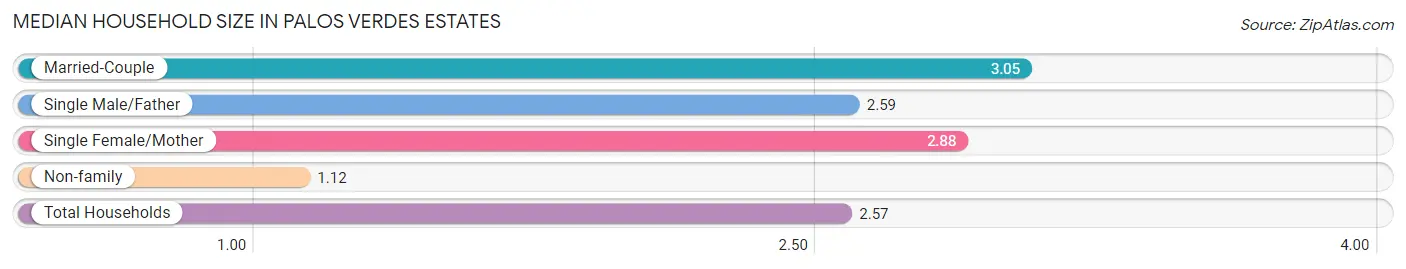
The median household size in Palos Verdes Estates is 2.57 persons per household, with married-couple households (3,468 | 67.7%) accounting for the largest median household size of 3.05 persons per household. non-family households (1,200 | 23.4%) represent the smallest median household size with 1.12 persons per household.
| Household Type | # Households | Household Size |
| Married-Couple | 3,468 (67.7%) | 3.05 |
| Single Male/Father | 133 (2.6%) | 2.59 |
| Single Female/Mother | 322 (6.3%) | 2.88 |
| Non-family | 1,200 (23.4%) | 1.12 |
| Total Households | 5,123 (100.0%) | 2.57 |
Household Size by Marriage Status in Palos Verdes Estates
Out of a total of 5,123 households in Palos Verdes Estates, 3,923 (76.6%) are family households, while 1,200 (23.4%) are nonfamily households. The most numerous type of family households are 2-person households, comprising 1,903, and the most common type of nonfamily households are 1-person households, comprising 1,065.
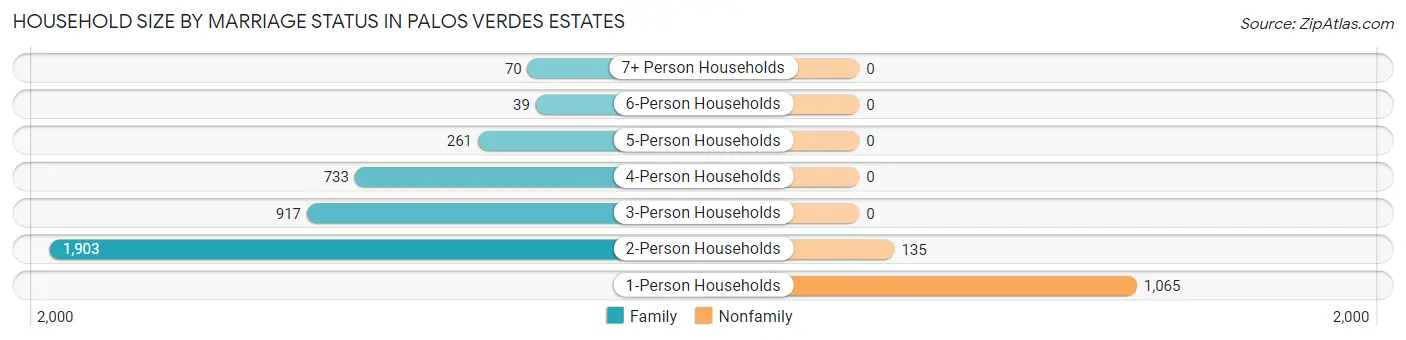
| Household Size | Family Households | Nonfamily Households |
| 1-Person Households | - | 1,065 (20.8%) |
| 2-Person Households | 1,903 (37.1%) | 135 (2.6%) |
| 3-Person Households | 917 (17.9%) | 0 (0.0%) |
| 4-Person Households | 733 (14.3%) | 0 (0.0%) |
| 5-Person Households | 261 (5.1%) | 0 (0.0%) |
| 6-Person Households | 39 (0.8%) | 0 (0.0%) |
| 7+ Person Households | 70 (1.4%) | 0 (0.0%) |
| Total | 3,923 (76.6%) | 1,200 (23.4%) |
Female Fertility in Palos Verdes Estates
Fertility by Age in Palos Verdes Estates
Average fertility rate in Palos Verdes Estates is 35.0 births per 1,000 women. Women in the age bracket of 20 to 34 years have the highest fertility rate with 41.0 births per 1,000 women. Women in the age bracket of 35 to 50 years acount for 73.7% of all women with births.
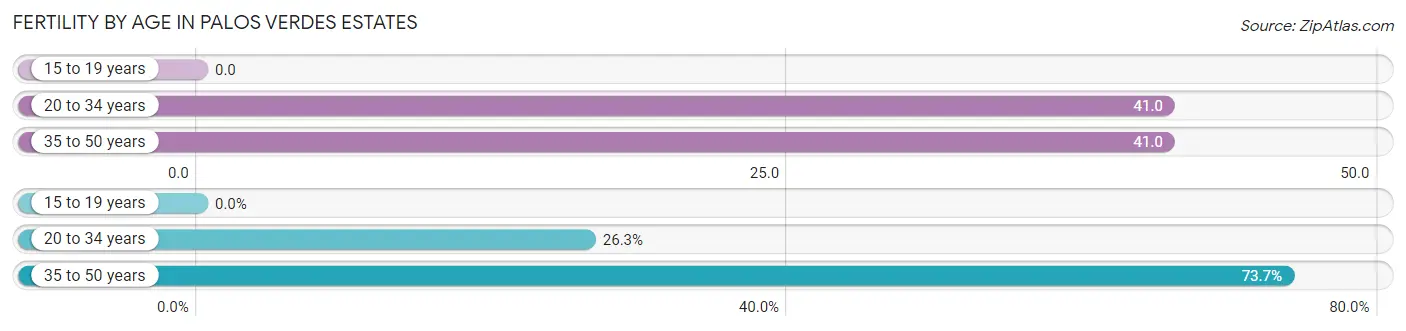
| Age Bracket | Women with Births | Births / 1,000 Women |
| 15 to 19 years | 0 (0.0%) | 0.0 |
| 20 to 34 years | 15 (26.3%) | 41.0 |
| 35 to 50 years | 42 (73.7%) | 41.0 |
| Total | 57 (100.0%) | 35.0 |
Fertility by Age by Marriage Status in Palos Verdes Estates
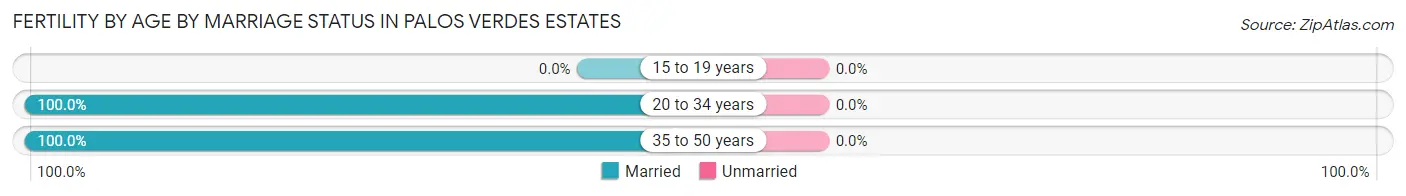
| Age Bracket | Married | Unmarried |
| 15 to 19 years | 0 (0.0%) | 0 (0.0%) |
| 20 to 34 years | 15 (100.0%) | 0 (0.0%) |
| 35 to 50 years | 42 (100.0%) | 0 (0.0%) |
| Total | 57 (100.0%) | 0 (0.0%) |
Fertility by Education in Palos Verdes Estates
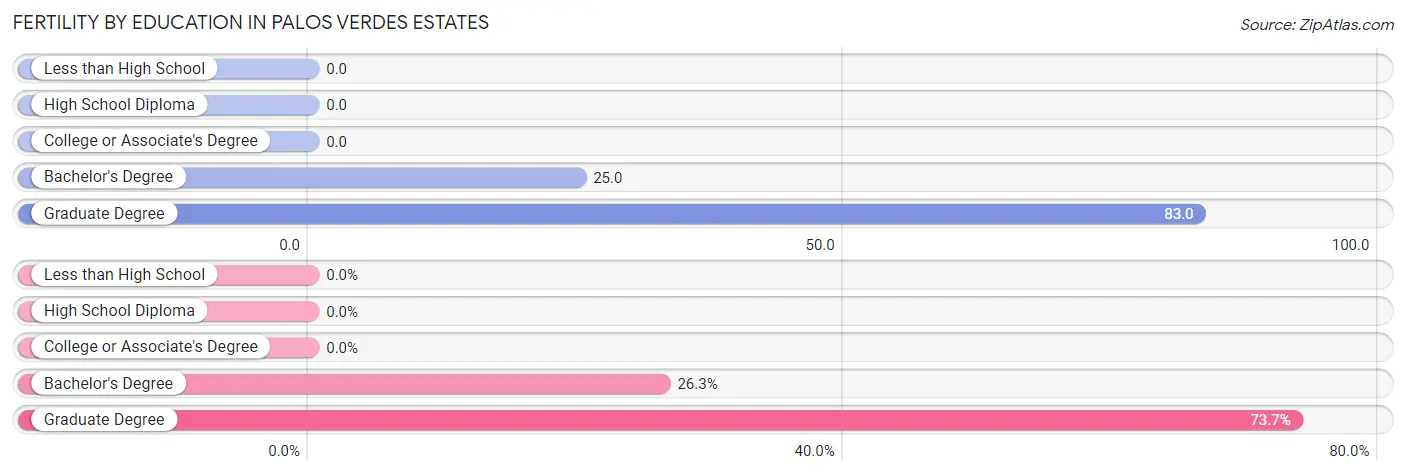
| Educational Attainment | Women with Births | Births / 1,000 Women |
| Less than High School | 0 (0.0%) | 0.0 |
| High School Diploma | 0 (0.0%) | 0.0 |
| College or Associate's Degree | 0 (0.0%) | 0.0 |
| Bachelor's Degree | 15 (26.3%) | 25.0 |
| Graduate Degree | 42 (73.7%) | 83.0 |
| Total | 57 (100.0%) | 35.0 |
Fertility by Education by Marriage Status in Palos Verdes Estates
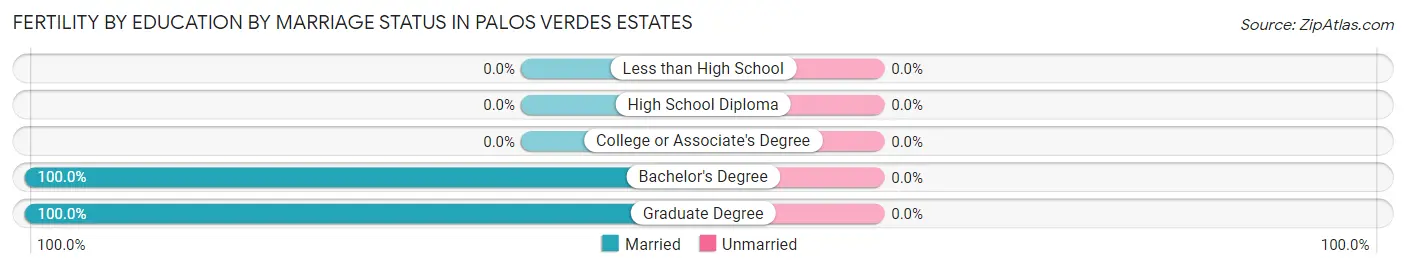
| Educational Attainment | Married | Unmarried |
| Less than High School | 0 (0.0%) | 0 (0.0%) |
| High School Diploma | 0 (0.0%) | 0 (0.0%) |
| College or Associate's Degree | 0 (0.0%) | 0 (0.0%) |
| Bachelor's Degree | 15 (100.0%) | 0 (0.0%) |
| Graduate Degree | 42 (100.0%) | 0 (0.0%) |
| Total | 57 (100.0%) | 0 (0.0%) |
Employment Characteristics in Palos Verdes Estates
Employment by Class of Employer in Palos Verdes Estates
Among the 5,120 employed individuals in Palos Verdes Estates, private company employees (2,687 | 52.5%), self-employed (incorporated) (1,091 | 21.3%), and self-employed (not incorporated) (630 | 12.3%) make up the most common classes of employment.
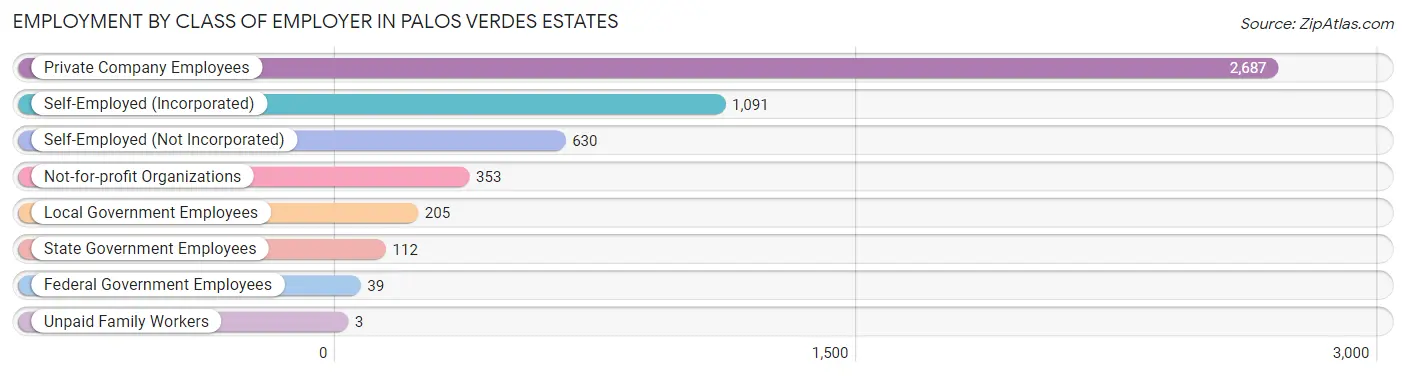
| Employer Class | # Employees | % Employees |
| Private Company Employees | 2,687 | 52.5% |
| Self-Employed (Incorporated) | 1,091 | 21.3% |
| Self-Employed (Not Incorporated) | 630 | 12.3% |
| Not-for-profit Organizations | 353 | 6.9% |
| Local Government Employees | 205 | 4.0% |
| State Government Employees | 112 | 2.2% |
| Federal Government Employees | 39 | 0.8% |
| Unpaid Family Workers | 3 | 0.1% |
| Total | 5,120 | 100.0% |
Employment Status by Age in Palos Verdes Estates
According to the labor force statistics for Palos Verdes Estates, out of the total population over 16 years of age (10,613), 50.9% or 5,402 individuals are in the labor force, with 2.3% or 124 of them unemployed. The age group with the highest labor force participation rate is 25 to 29 years, with 98.1% or 203 individuals in the labor force. Within the labor force, the 30 to 34 years age range has the highest percentage of unemployed individuals, with 19.0% or 53 of them being unemployed.
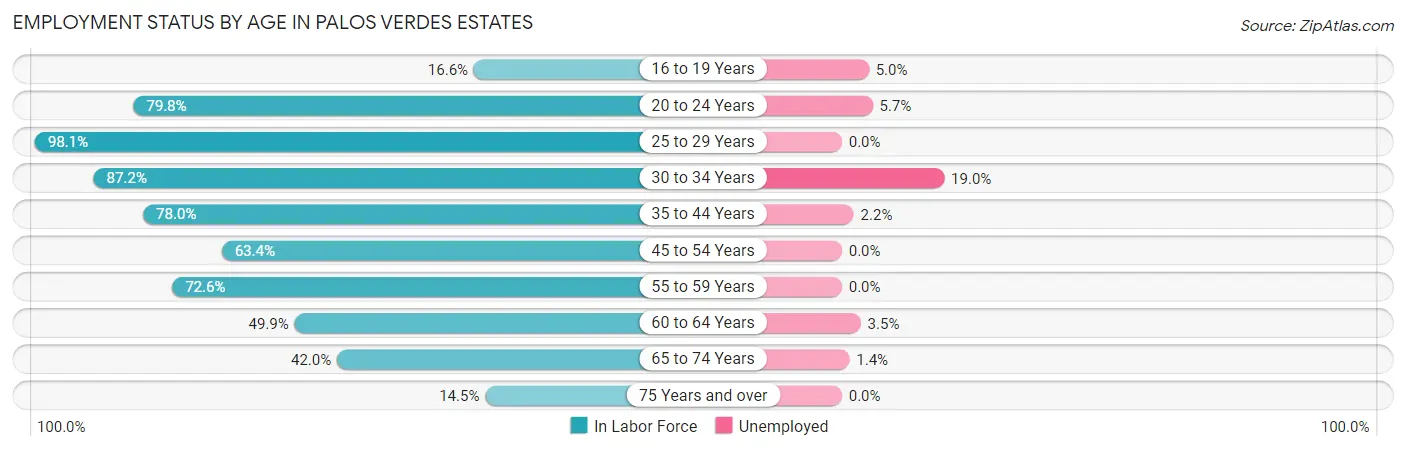
| Age Bracket | In Labor Force | Unemployed |
| 16 to 19 Years | 101 (16.6%) | 5 (5.0%) |
| 20 to 24 Years | 265 (79.8%) | 15 (5.7%) |
| 25 to 29 Years | 203 (98.1%) | 0 (0.0%) |
| 30 to 34 Years | 279 (87.2%) | 53 (19.0%) |
| 35 to 44 Years | 719 (78.0%) | 16 (2.2%) |
| 45 to 54 Years | 1,254 (63.4%) | 0 (0.0%) |
| 55 to 59 Years | 884 (72.6%) | 0 (0.0%) |
| 60 to 64 Years | 656 (49.9%) | 23 (3.5%) |
| 65 to 74 Years | 769 (42.0%) | 11 (1.4%) |
| 75 Years and over | 273 (14.5%) | 0 (0.0%) |
| Total | 5,402 (50.9%) | 124 (2.3%) |
Employment Status by Educational Attainment in Palos Verdes Estates
According to labor force statistics for Palos Verdes Estates, 67.1% of individuals (3,998) out of the total population between 25 and 64 years of age (5,959) are in the labor force, with 2.3% or 92 of them being unemployed. The group with the highest labor force participation rate are those with the educational attainment of bachelor's degree or higher, with 69.0% or 3,462 individuals in the labor force. Within the labor force, individuals with high school diploma education have the highest percentage of unemployment, with 12.4% or 20 of them being unemployed.
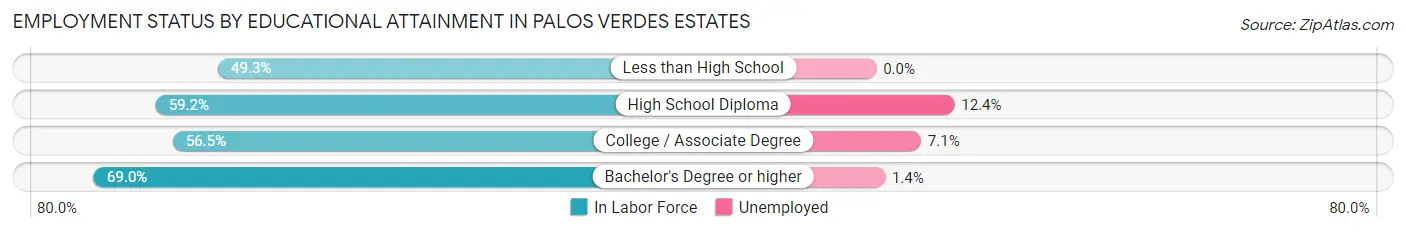
| Educational Attainment | In Labor Force | Unemployed |
| Less than High School | 36 (49.3%) | 0 (0.0%) |
| High School Diploma | 161 (59.2%) | 34 (12.4%) |
| College / Associate Degree | 337 (56.5%) | 42 (7.1%) |
| Bachelor's Degree or higher | 3,462 (69.0%) | 70 (1.4%) |
| Total | 3,998 (67.1%) | 137 (2.3%) |
Employment Occupations by Sex in Palos Verdes Estates
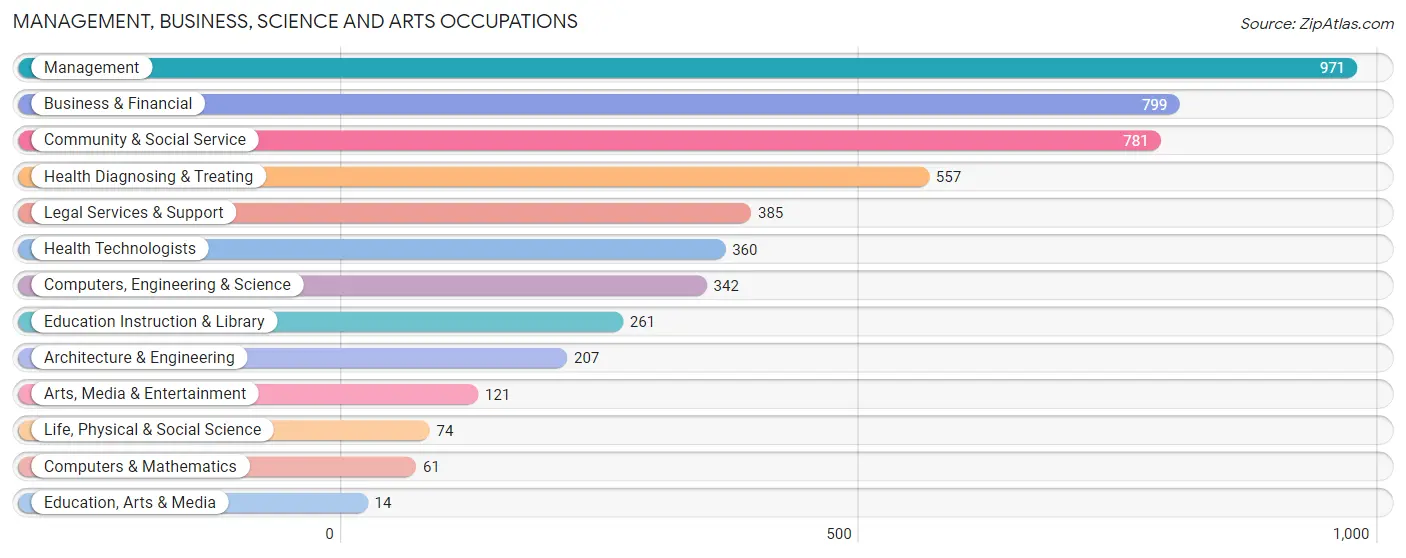
Management, Business, Science and Arts Occupations
The most common Management, Business, Science and Arts occupations in Palos Verdes Estates are Management (971 | 18.4%), Business & Financial (799 | 15.1%), Community & Social Service (781 | 14.8%), Health Diagnosing & Treating (557 | 10.5%), and Legal Services & Support (385 | 7.3%).
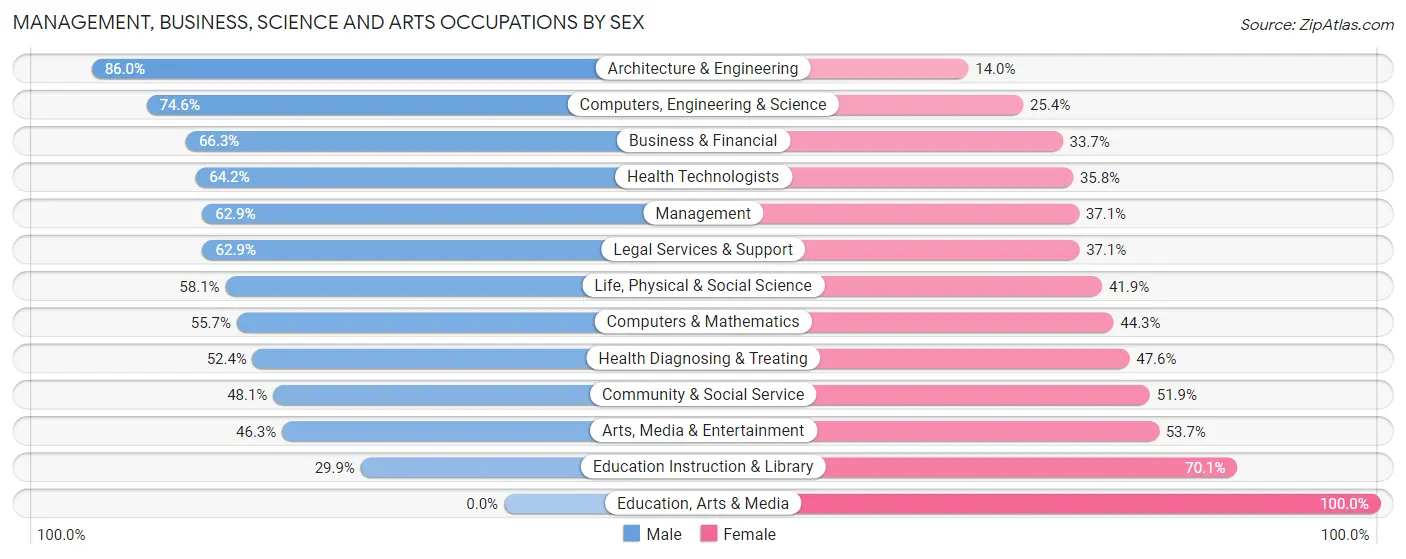
Management, Business, Science and Arts Occupations by Sex
Within the Management, Business, Science and Arts occupations in Palos Verdes Estates, the most male-oriented occupations are Architecture & Engineering (86.0%), Computers, Engineering & Science (74.6%), and Business & Financial (66.3%), while the most female-oriented occupations are Education, Arts & Media (100.0%), Education Instruction & Library (70.1%), and Arts, Media & Entertainment (53.7%).
| Occupation | Male | Female |
| Management | 611 (62.9%) | 360 (37.1%) |
| Business & Financial | 530 (66.3%) | 269 (33.7%) |
| Computers, Engineering & Science | 255 (74.6%) | 87 (25.4%) |
| Computers & Mathematics | 34 (55.7%) | 27 (44.3%) |
| Architecture & Engineering | 178 (86.0%) | 29 (14.0%) |
| Life, Physical & Social Science | 43 (58.1%) | 31 (41.9%) |
| Community & Social Service | 376 (48.1%) | 405 (51.9%) |
| Education, Arts & Media | 0 (0.0%) | 14 (100.0%) |
| Legal Services & Support | 242 (62.9%) | 143 (37.1%) |
| Education Instruction & Library | 78 (29.9%) | 183 (70.1%) |
| Arts, Media & Entertainment | 56 (46.3%) | 65 (53.7%) |
| Health Diagnosing & Treating | 292 (52.4%) | 265 (47.6%) |
| Health Technologists | 231 (64.2%) | 129 (35.8%) |
| Total (Category) | 2,064 (59.8%) | 1,386 (40.2%) |
| Total (Overall) | 3,224 (61.1%) | 2,056 (38.9%) |
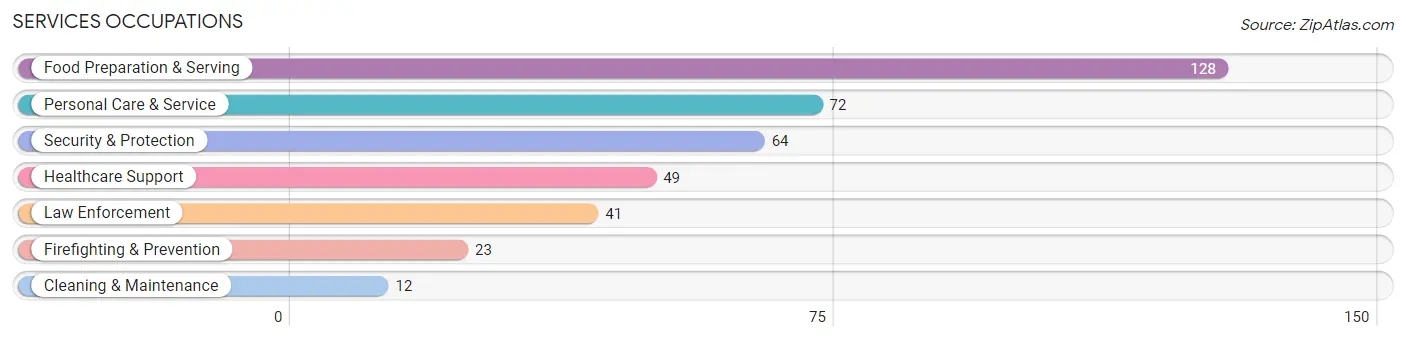
Services Occupations
The most common Services occupations in Palos Verdes Estates are Food Preparation & Serving (128 | 2.4%), Personal Care & Service (72 | 1.4%), Security & Protection (64 | 1.2%), Healthcare Support (49 | 0.9%), and Law Enforcement (41 | 0.8%).
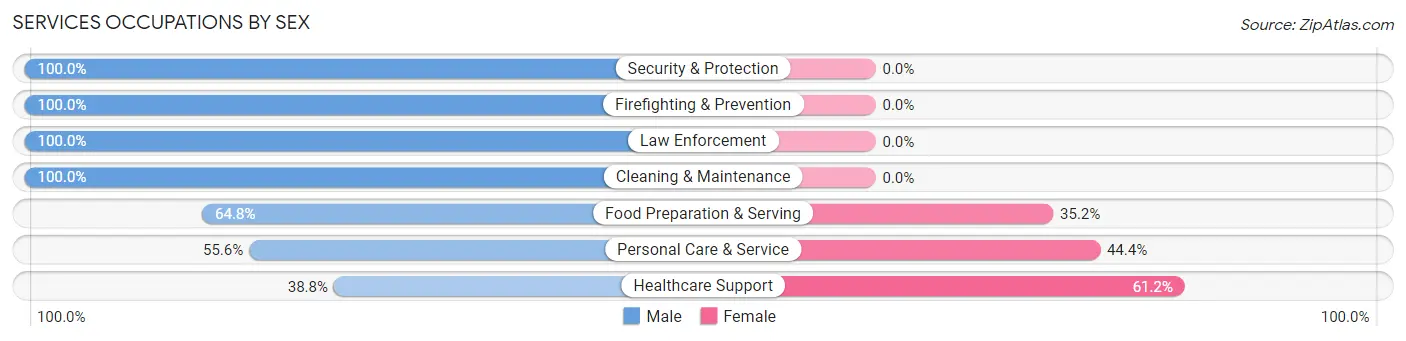
Services Occupations by Sex
Within the Services occupations in Palos Verdes Estates, the most male-oriented occupations are Security & Protection (100.0%), Firefighting & Prevention (100.0%), and Law Enforcement (100.0%), while the most female-oriented occupations are Healthcare Support (61.2%), Personal Care & Service (44.4%), and Food Preparation & Serving (35.2%).
| Occupation | Male | Female |
| Healthcare Support | 19 (38.8%) | 30 (61.2%) |
| Security & Protection | 64 (100.0%) | 0 (0.0%) |
| Firefighting & Prevention | 23 (100.0%) | 0 (0.0%) |
| Law Enforcement | 41 (100.0%) | 0 (0.0%) |
| Food Preparation & Serving | 83 (64.8%) | 45 (35.2%) |
| Cleaning & Maintenance | 12 (100.0%) | 0 (0.0%) |
| Personal Care & Service | 40 (55.6%) | 32 (44.4%) |
| Total (Category) | 218 (67.1%) | 107 (32.9%) |
| Total (Overall) | 3,224 (61.1%) | 2,056 (38.9%) |
Sales and Office Occupations
The most common Sales and Office occupations in Palos Verdes Estates are Sales & Related (963 | 18.2%), and Office & Administration (391 | 7.4%).
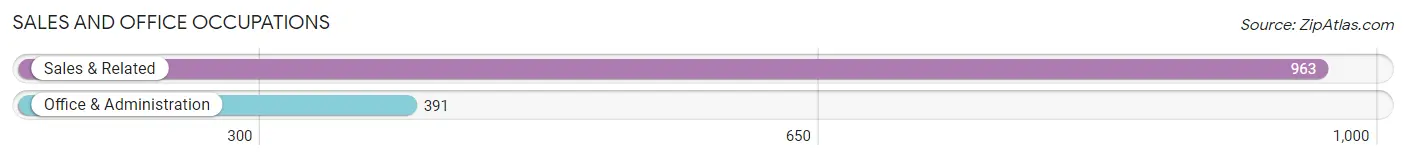
Sales and Office Occupations by Sex

| Occupation | Male | Female |
| Sales & Related | 724 (75.2%) | 239 (24.8%) |
| Office & Administration | 67 (17.1%) | 324 (82.9%) |
| Total (Category) | 791 (58.4%) | 563 (41.6%) |
| Total (Overall) | 3,224 (61.1%) | 2,056 (38.9%) |
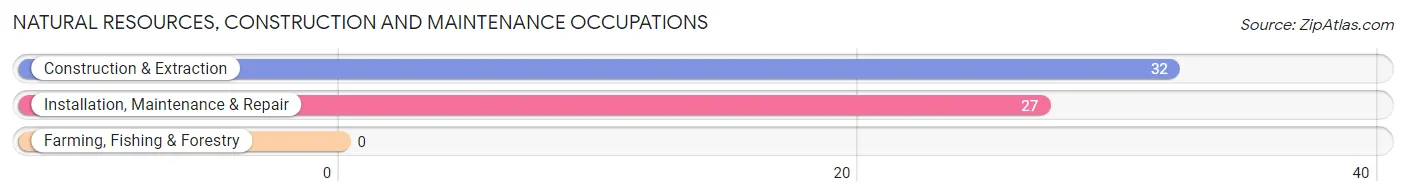
Natural Resources, Construction and Maintenance Occupations
The most common Natural Resources, Construction and Maintenance occupations in Palos Verdes Estates are Construction & Extraction (32 | 0.6%), and Installation, Maintenance & Repair (27 | 0.5%).
Natural Resources, Construction and Maintenance Occupations by Sex
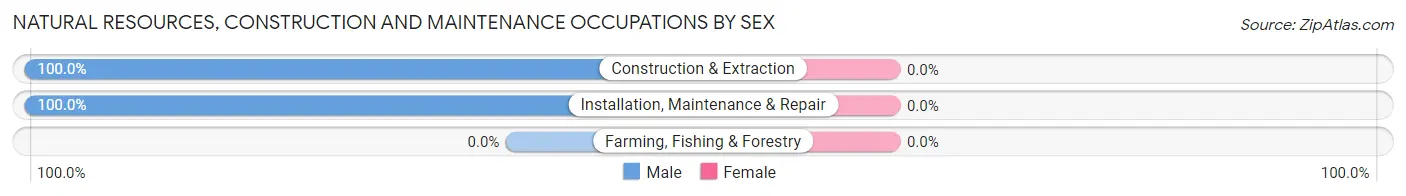
| Occupation | Male | Female |
| Farming, Fishing & Forestry | 0 (0.0%) | 0 (0.0%) |
| Construction & Extraction | 32 (100.0%) | 0 (0.0%) |
| Installation, Maintenance & Repair | 27 (100.0%) | 0 (0.0%) |
| Total (Category) | 59 (100.0%) | 0 (0.0%) |
| Total (Overall) | 3,224 (61.1%) | 2,056 (38.9%) |
Production, Transportation and Moving Occupations
The most common Production, Transportation and Moving occupations in Palos Verdes Estates are Material Moving (39 | 0.7%), Production (29 | 0.5%), and Transportation (24 | 0.4%).
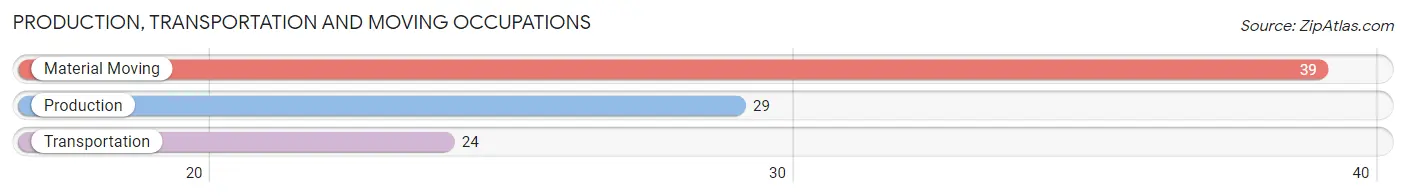
Production, Transportation and Moving Occupations by Sex
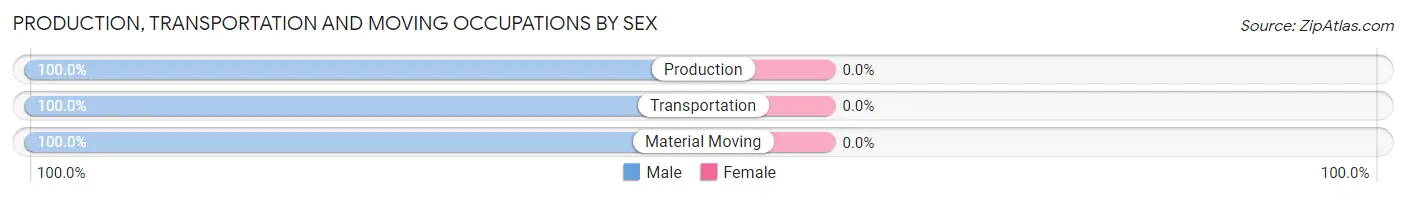
| Occupation | Male | Female |
| Production | 29 (100.0%) | 0 (0.0%) |
| Transportation | 24 (100.0%) | 0 (0.0%) |
| Material Moving | 39 (100.0%) | 0 (0.0%) |
| Total (Category) | 92 (100.0%) | 0 (0.0%) |
| Total (Overall) | 3,224 (61.1%) | 2,056 (38.9%) |
Employment Industries by Sex in Palos Verdes Estates
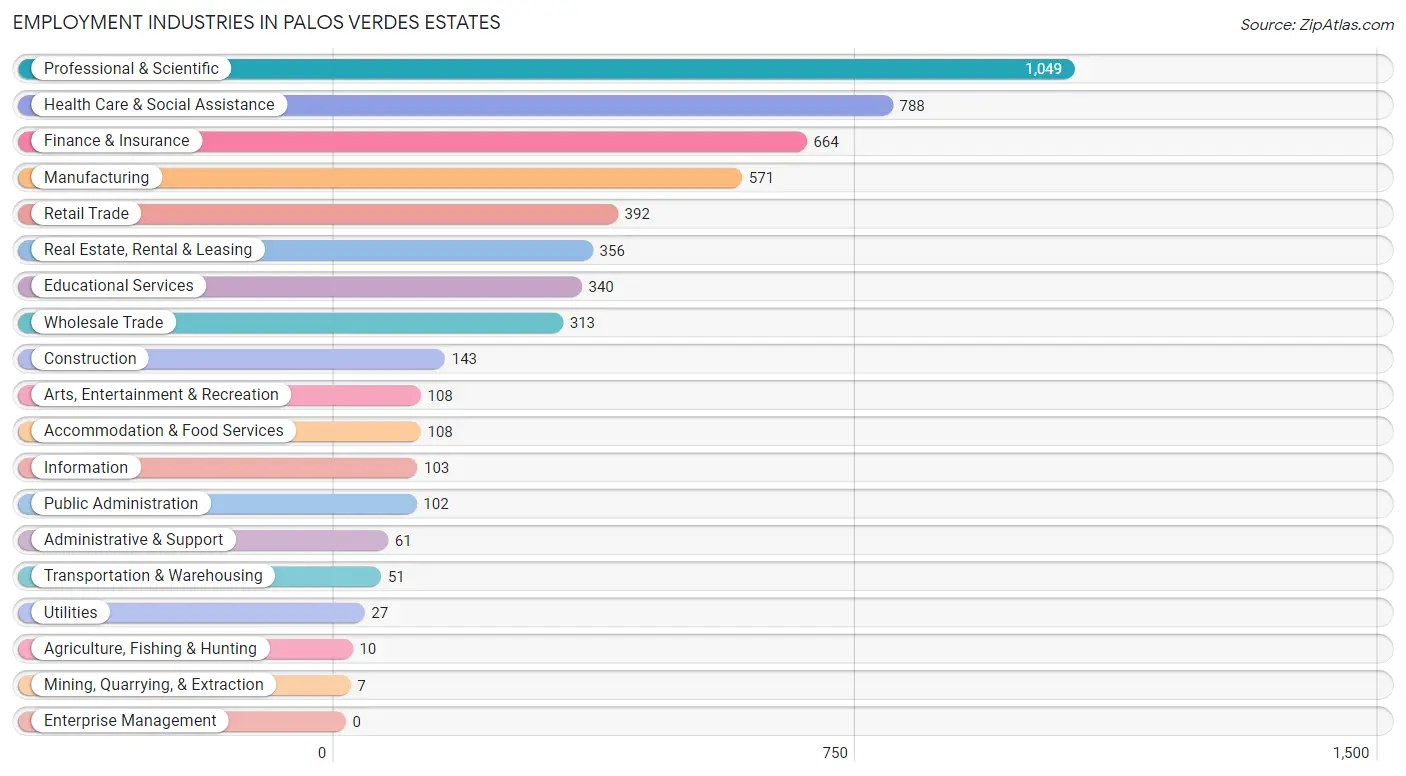
Employment Industries in Palos Verdes Estates
The major employment industries in Palos Verdes Estates include Professional & Scientific (1,049 | 19.9%), Health Care & Social Assistance (788 | 14.9%), Finance & Insurance (664 | 12.6%), Manufacturing (571 | 10.8%), and Retail Trade (392 | 7.4%).
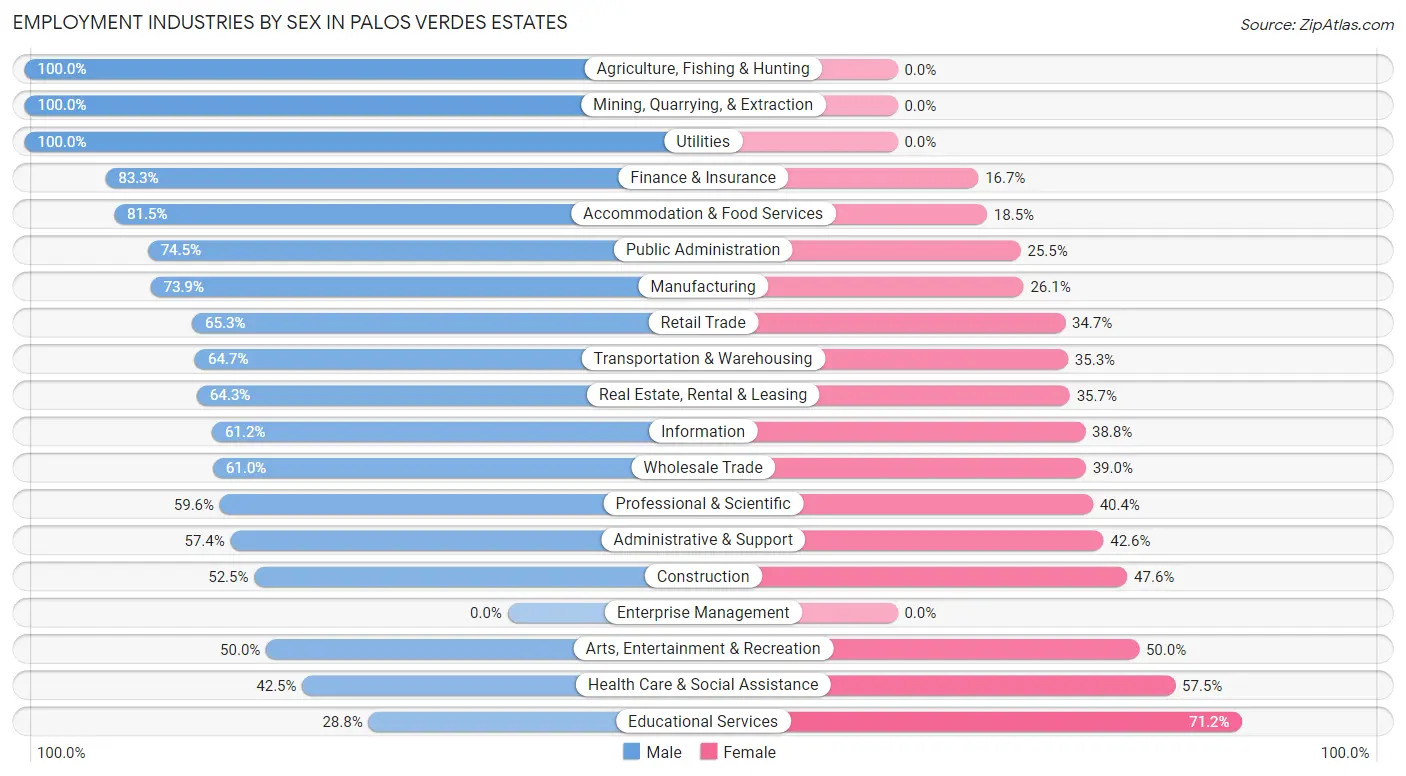
Employment Industries by Sex in Palos Verdes Estates
The Palos Verdes Estates industries that see more men than women are Agriculture, Fishing & Hunting (100.0%), Mining, Quarrying, & Extraction (100.0%), and Utilities (100.0%), whereas the industries that tend to have a higher number of women are Educational Services (71.2%), Health Care & Social Assistance (57.5%), and Arts, Entertainment & Recreation (50.0%).
| Industry | Male | Female |
| Agriculture, Fishing & Hunting | 10 (100.0%) | 0 (0.0%) |
| Mining, Quarrying, & Extraction | 7 (100.0%) | 0 (0.0%) |
| Construction | 75 (52.4%) | 68 (47.5%) |
| Manufacturing | 422 (73.9%) | 149 (26.1%) |
| Wholesale Trade | 191 (61.0%) | 122 (39.0%) |
| Retail Trade | 256 (65.3%) | 136 (34.7%) |
| Transportation & Warehousing | 33 (64.7%) | 18 (35.3%) |
| Utilities | 27 (100.0%) | 0 (0.0%) |
| Information | 63 (61.2%) | 40 (38.8%) |
| Finance & Insurance | 553 (83.3%) | 111 (16.7%) |
| Real Estate, Rental & Leasing | 229 (64.3%) | 127 (35.7%) |
| Professional & Scientific | 625 (59.6%) | 424 (40.4%) |
| Enterprise Management | 0 (0.0%) | 0 (0.0%) |
| Administrative & Support | 35 (57.4%) | 26 (42.6%) |
| Educational Services | 98 (28.8%) | 242 (71.2%) |
| Health Care & Social Assistance | 335 (42.5%) | 453 (57.5%) |
| Arts, Entertainment & Recreation | 54 (50.0%) | 54 (50.0%) |
| Accommodation & Food Services | 88 (81.5%) | 20 (18.5%) |
| Public Administration | 76 (74.5%) | 26 (25.5%) |
| Total | 3,224 (61.1%) | 2,056 (38.9%) |
Education in Palos Verdes Estates
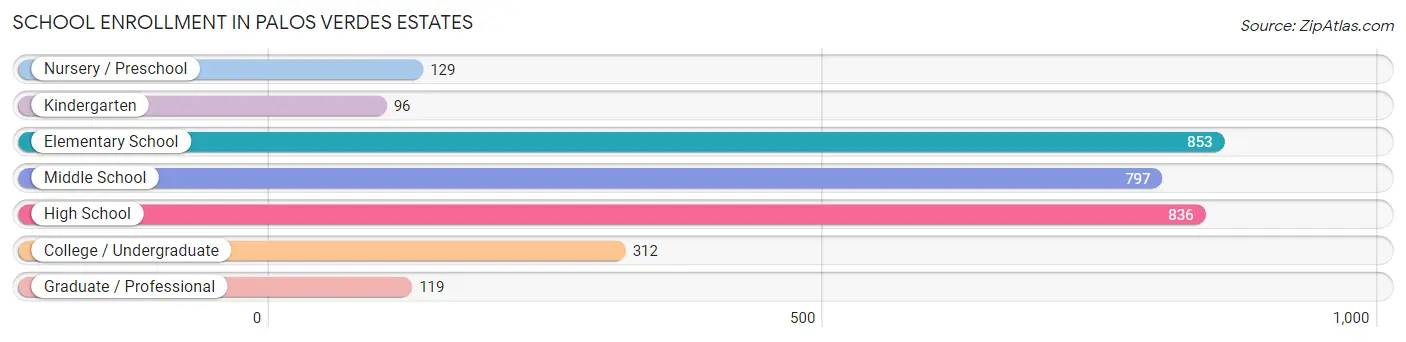
School Enrollment in Palos Verdes Estates
The most common levels of schooling among the 3,142 students in Palos Verdes Estates are elementary school (853 | 27.2%), high school (836 | 26.6%), and middle school (797 | 25.4%).
| School Level | # Students | % Students |
| Nursery / Preschool | 129 | 4.1% |
| Kindergarten | 96 | 3.1% |
| Elementary School | 853 | 27.2% |
| Middle School | 797 | 25.4% |
| High School | 836 | 26.6% |
| College / Undergraduate | 312 | 9.9% |
| Graduate / Professional | 119 | 3.8% |
| Total | 3,142 | 100.0% |
School Enrollment by Age by Funding Source in Palos Verdes Estates
Out of a total of 3,142 students who are enrolled in schools in Palos Verdes Estates, 738 (23.5%) attend a private institution, while the remaining 2,404 (76.5%) are enrolled in public schools. The age group of 35 years and over has the highest likelihood of being enrolled in private schools, with 95 (53.4% in the age bracket) enrolled. Conversely, the age group of 25 to 34 year olds has the lowest likelihood of being enrolled in a private school, with 33 (100.0% in the age bracket) attending a public institution.
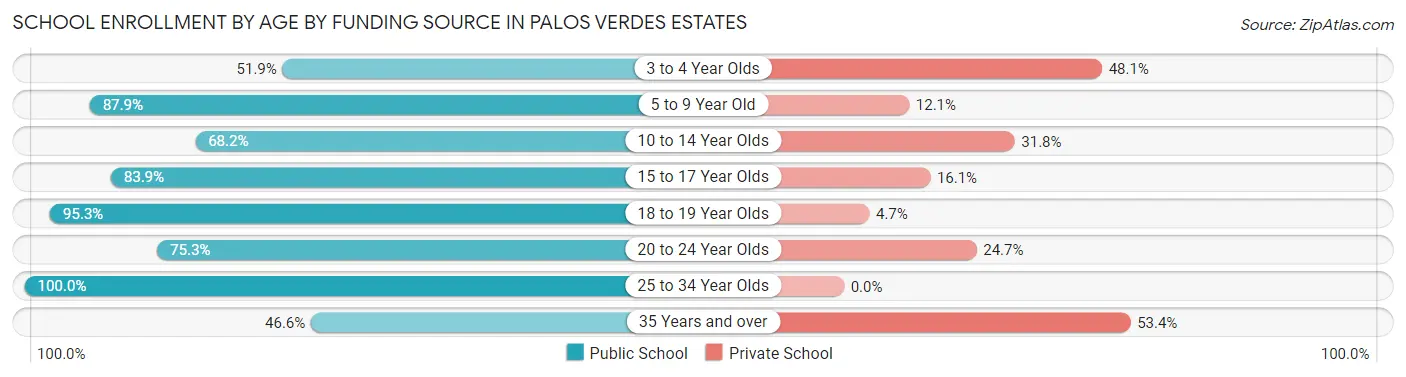
| Age Bracket | Public School | Private School |
| 3 to 4 Year Olds | 67 (51.9%) | 62 (48.1%) |
| 5 to 9 Year Old | 724 (87.9%) | 100 (12.1%) |
| 10 to 14 Year Olds | 708 (68.2%) | 330 (31.8%) |
| 15 to 17 Year Olds | 543 (83.9%) | 104 (16.1%) |
| 18 to 19 Year Olds | 121 (95.3%) | 6 (4.7%) |
| 20 to 24 Year Olds | 125 (75.3%) | 41 (24.7%) |
| 25 to 34 Year Olds | 33 (100.0%) | 0 (0.0%) |
| 35 Years and over | 83 (46.6%) | 95 (53.4%) |
| Total | 2,404 (76.5%) | 738 (23.5%) |
Educational Attainment by Field of Study in Palos Verdes Estates
Business (1,924 | 23.0%), social sciences (1,163 | 13.9%), engineering (977 | 11.7%), literature & languages (661 | 7.9%), and bio, nature & agricultural (594 | 7.1%) are the most common fields of study among 8,359 individuals in Palos Verdes Estates who have obtained a bachelor's degree or higher.
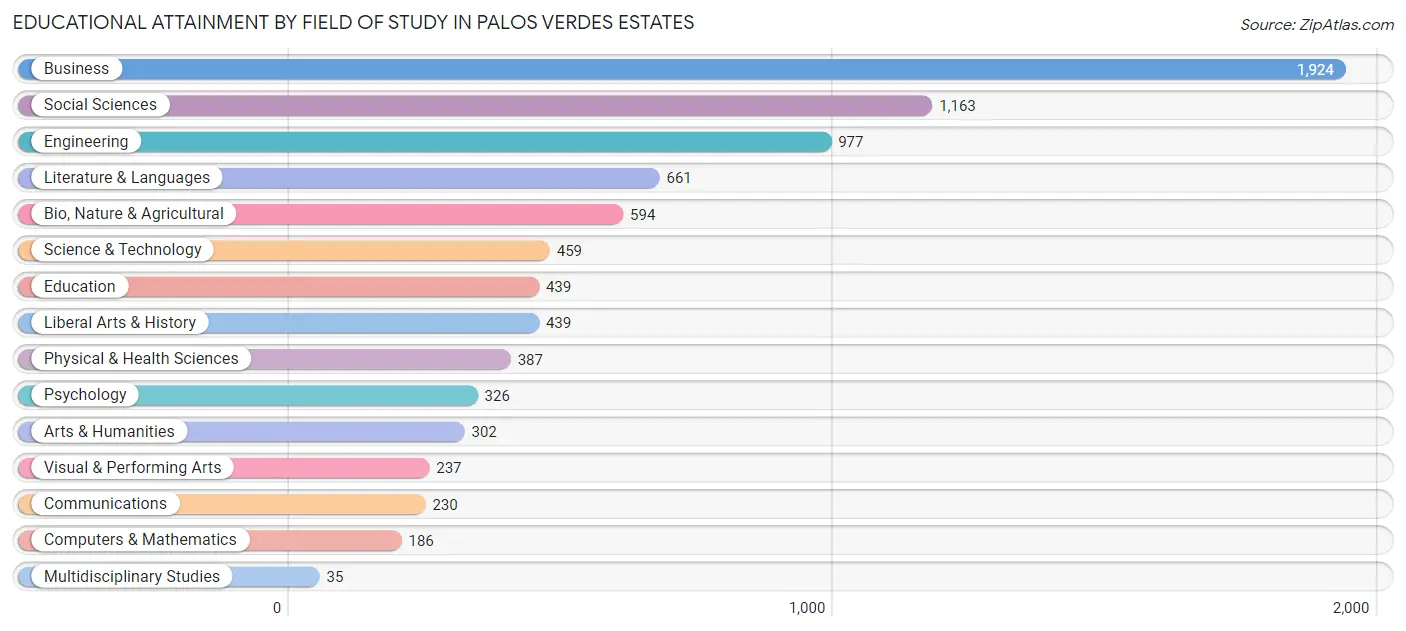
| Field of Study | # Graduates | % Graduates |
| Computers & Mathematics | 186 | 2.2% |
| Bio, Nature & Agricultural | 594 | 7.1% |
| Physical & Health Sciences | 387 | 4.6% |
| Psychology | 326 | 3.9% |
| Social Sciences | 1,163 | 13.9% |
| Engineering | 977 | 11.7% |
| Multidisciplinary Studies | 35 | 0.4% |
| Science & Technology | 459 | 5.5% |
| Business | 1,924 | 23.0% |
| Education | 439 | 5.2% |
| Literature & Languages | 661 | 7.9% |
| Liberal Arts & History | 439 | 5.2% |
| Visual & Performing Arts | 237 | 2.8% |
| Communications | 230 | 2.8% |
| Arts & Humanities | 302 | 3.6% |
| Total | 8,359 | 100.0% |
Transportation & Commute in Palos Verdes Estates
Vehicle Availability by Sex in Palos Verdes Estates
The most prevalent vehicle ownership categories in Palos Verdes Estates are males with 2 vehicles (1,306, accounting for 41.1%) and females with 2 vehicles (986, making up 67.3%).
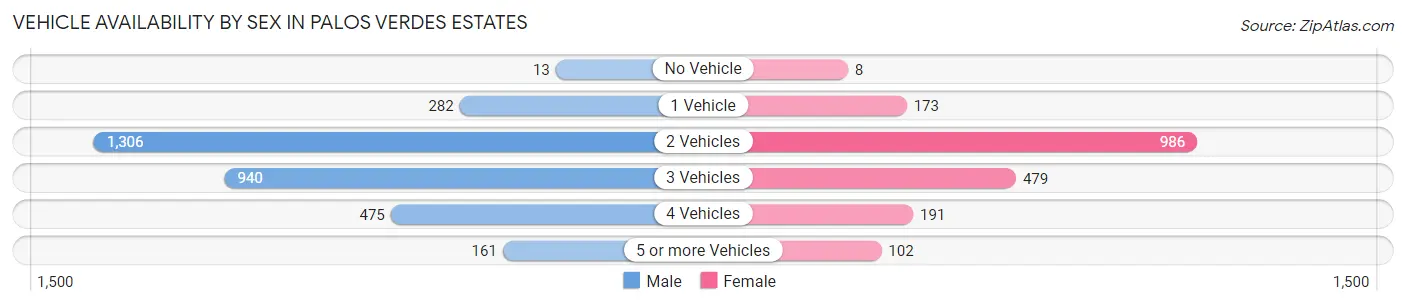
| Vehicles Available | Male | Female |
| No Vehicle | 13 (0.4%) | 8 (0.4%) |
| 1 Vehicle | 282 (8.9%) | 173 (8.9%) |
| 2 Vehicles | 1,306 (41.1%) | 986 (50.8%) |
| 3 Vehicles | 940 (29.6%) | 479 (24.7%) |
| 4 Vehicles | 475 (14.9%) | 191 (9.9%) |
| 5 or more Vehicles | 161 (5.1%) | 102 (5.3%) |
| Total | 3,177 (100.0%) | 1,939 (100.0%) |
Commute Time in Palos Verdes Estates
The most frequently occuring commute durations in Palos Verdes Estates are 30 to 34 minutes (691 commuters, 17.2%), 60 to 89 minutes (539 commuters, 13.4%), and 45 to 59 minutes (528 commuters, 13.1%).
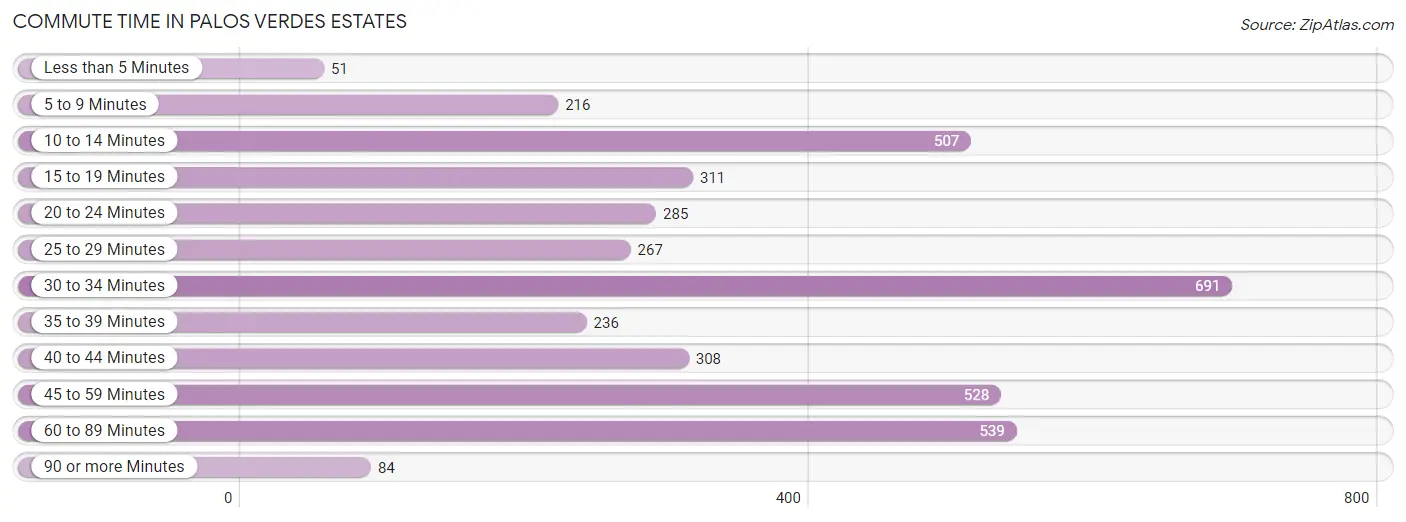
| Commute Time | # Commuters | % Commuters |
| Less than 5 Minutes | 51 | 1.3% |
| 5 to 9 Minutes | 216 | 5.4% |
| 10 to 14 Minutes | 507 | 12.6% |
| 15 to 19 Minutes | 311 | 7.7% |
| 20 to 24 Minutes | 285 | 7.1% |
| 25 to 29 Minutes | 267 | 6.6% |
| 30 to 34 Minutes | 691 | 17.2% |
| 35 to 39 Minutes | 236 | 5.9% |
| 40 to 44 Minutes | 308 | 7.7% |
| 45 to 59 Minutes | 528 | 13.1% |
| 60 to 89 Minutes | 539 | 13.4% |
| 90 or more Minutes | 84 | 2.1% |
Commute Time by Sex in Palos Verdes Estates
The most common commute times in Palos Verdes Estates are 30 to 34 minutes (427 commuters, 16.4%) for males and 30 to 34 minutes (264 commuters, 18.6%) for females.
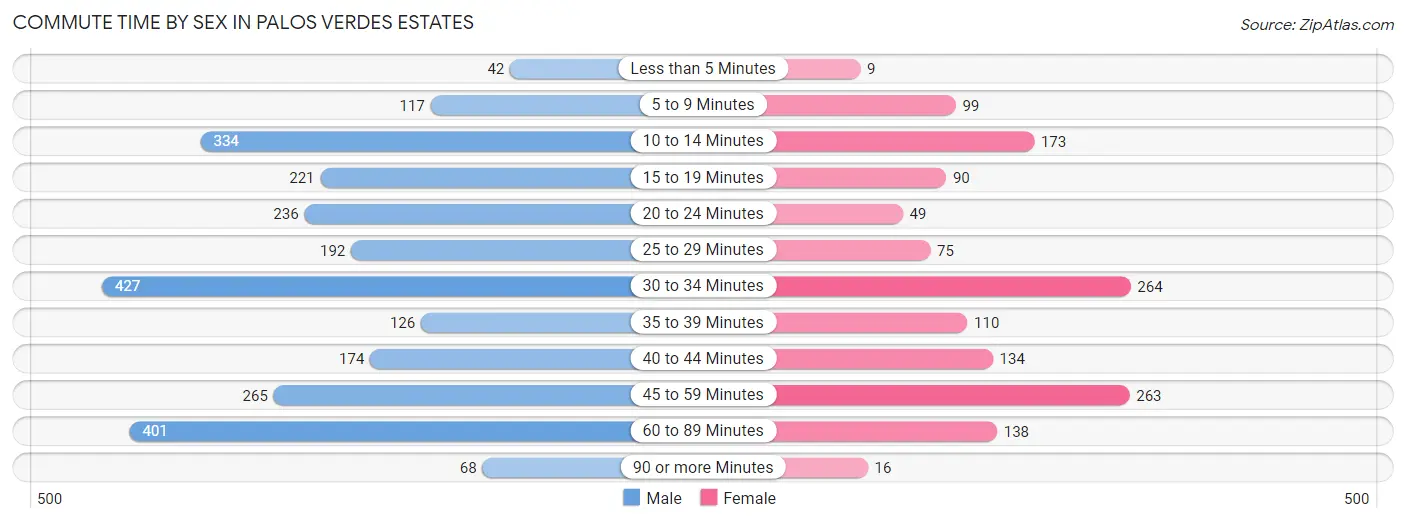
| Commute Time | Male | Female |
| Less than 5 Minutes | 42 (1.6%) | 9 (0.6%) |
| 5 to 9 Minutes | 117 (4.5%) | 99 (7.0%) |
| 10 to 14 Minutes | 334 (12.8%) | 173 (12.2%) |
| 15 to 19 Minutes | 221 (8.5%) | 90 (6.3%) |
| 20 to 24 Minutes | 236 (9.1%) | 49 (3.5%) |
| 25 to 29 Minutes | 192 (7.4%) | 75 (5.3%) |
| 30 to 34 Minutes | 427 (16.4%) | 264 (18.6%) |
| 35 to 39 Minutes | 126 (4.8%) | 110 (7.7%) |
| 40 to 44 Minutes | 174 (6.7%) | 134 (9.4%) |
| 45 to 59 Minutes | 265 (10.2%) | 263 (18.5%) |
| 60 to 89 Minutes | 401 (15.4%) | 138 (9.7%) |
| 90 or more Minutes | 68 (2.6%) | 16 (1.1%) |
Time of Departure to Work by Sex in Palos Verdes Estates
The most frequent times of departure to work in Palos Verdes Estates are 8:00 AM to 8:29 AM (465, 17.9%) for males and 8:00 AM to 8:29 AM (313, 22.0%) for females.
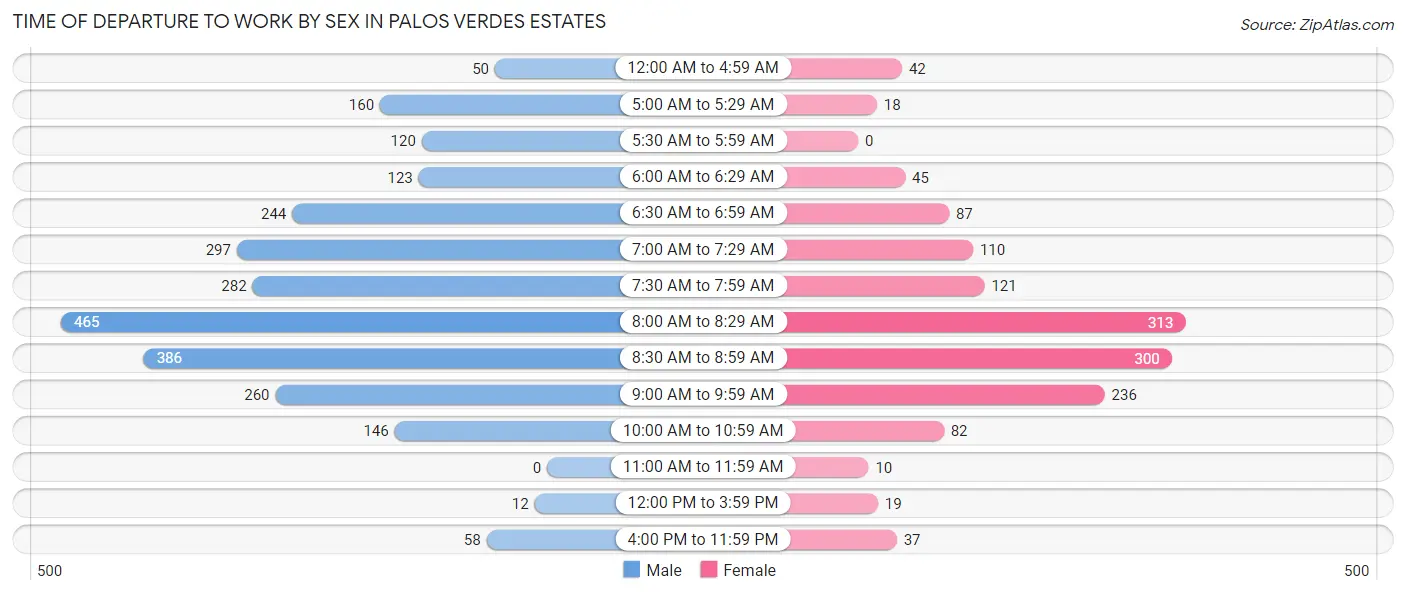
| Time of Departure | Male | Female |
| 12:00 AM to 4:59 AM | 50 (1.9%) | 42 (3.0%) |
| 5:00 AM to 5:29 AM | 160 (6.1%) | 18 (1.3%) |
| 5:30 AM to 5:59 AM | 120 (4.6%) | 0 (0.0%) |
| 6:00 AM to 6:29 AM | 123 (4.7%) | 45 (3.2%) |
| 6:30 AM to 6:59 AM | 244 (9.4%) | 87 (6.1%) |
| 7:00 AM to 7:29 AM | 297 (11.4%) | 110 (7.7%) |
| 7:30 AM to 7:59 AM | 282 (10.8%) | 121 (8.5%) |
| 8:00 AM to 8:29 AM | 465 (17.9%) | 313 (22.0%) |
| 8:30 AM to 8:59 AM | 386 (14.8%) | 300 (21.1%) |
| 9:00 AM to 9:59 AM | 260 (10.0%) | 236 (16.6%) |
| 10:00 AM to 10:59 AM | 146 (5.6%) | 82 (5.8%) |
| 11:00 AM to 11:59 AM | 0 (0.0%) | 10 (0.7%) |
| 12:00 PM to 3:59 PM | 12 (0.5%) | 19 (1.3%) |
| 4:00 PM to 11:59 PM | 58 (2.2%) | 37 (2.6%) |
| Total | 2,603 (100.0%) | 1,420 (100.0%) |
Housing Occupancy in Palos Verdes Estates
Occupancy by Ownership in Palos Verdes Estates
Of the total 5,123 dwellings in Palos Verdes Estates, owner-occupied units account for 4,561 (89.0%), while renter-occupied units make up 562 (11.0%).
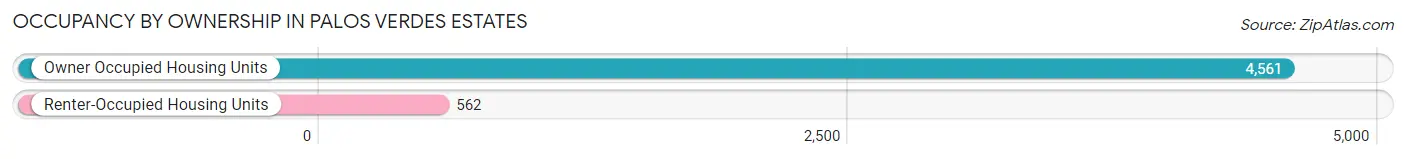
| Occupancy | # Housing Units | % Housing Units |
| Owner Occupied Housing Units | 4,561 | 89.0% |
| Renter-Occupied Housing Units | 562 | 11.0% |
| Total Occupied Housing Units | 5,123 | 100.0% |
Occupancy by Household Size in Palos Verdes Estates
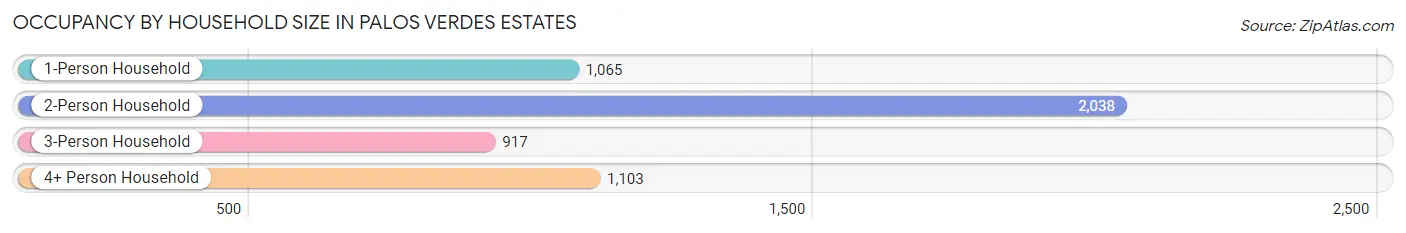
| Household Size | # Housing Units | % Housing Units |
| 1-Person Household | 1,065 | 20.8% |
| 2-Person Household | 2,038 | 39.8% |
| 3-Person Household | 917 | 17.9% |
| 4+ Person Household | 1,103 | 21.5% |
| Total Housing Units | 5,123 | 100.0% |
Occupancy by Ownership by Household Size in Palos Verdes Estates
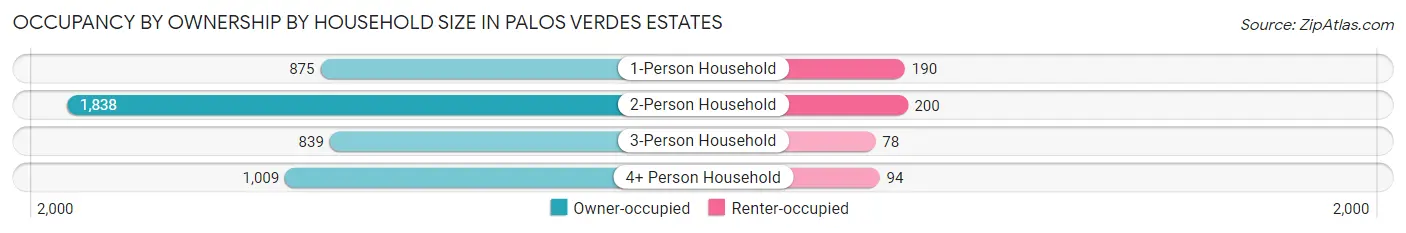
| Household Size | Owner-occupied | Renter-occupied |
| 1-Person Household | 875 (82.2%) | 190 (17.8%) |
| 2-Person Household | 1,838 (90.2%) | 200 (9.8%) |
| 3-Person Household | 839 (91.5%) | 78 (8.5%) |
| 4+ Person Household | 1,009 (91.5%) | 94 (8.5%) |
| Total Housing Units | 4,561 (89.0%) | 562 (11.0%) |
Occupancy by Educational Attainment in Palos Verdes Estates
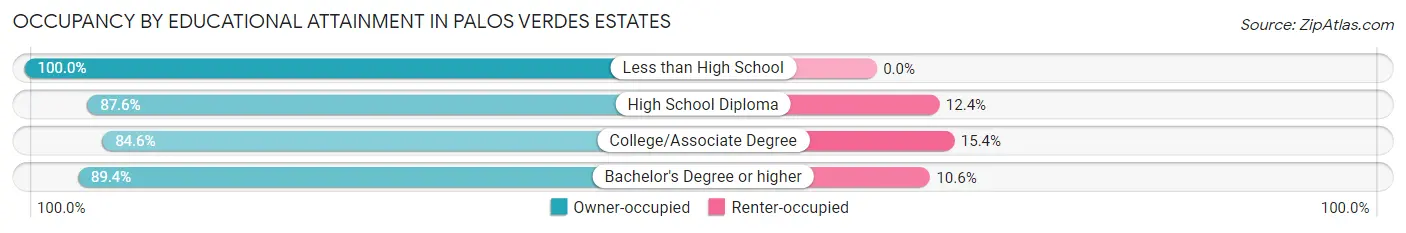
| Household Size | Owner-occupied | Renter-occupied |
| Less than High School | 158 (100.0%) | 0 (0.0%) |
| High School Diploma | 169 (87.6%) | 24 (12.4%) |
| College/Associate Degree | 588 (84.6%) | 107 (15.4%) |
| Bachelor's Degree or higher | 3,646 (89.4%) | 431 (10.6%) |
Occupancy by Age of Householder in Palos Verdes Estates
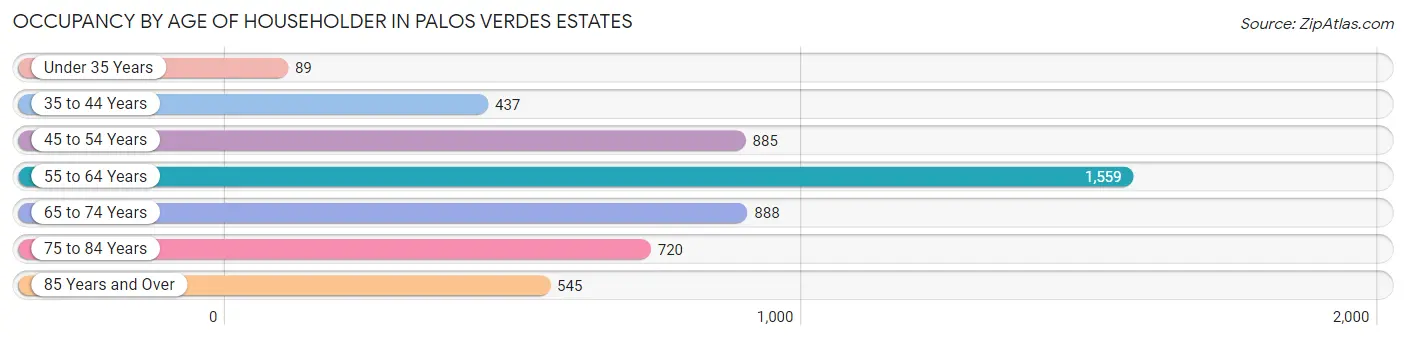
| Age Bracket | # Households | % Households |
| Under 35 Years | 89 | 1.7% |
| 35 to 44 Years | 437 | 8.5% |
| 45 to 54 Years | 885 | 17.3% |
| 55 to 64 Years | 1,559 | 30.4% |
| 65 to 74 Years | 888 | 17.3% |
| 75 to 84 Years | 720 | 14.1% |
| 85 Years and Over | 545 | 10.6% |
| Total | 5,123 | 100.0% |
Housing Finances in Palos Verdes Estates
Median Income by Occupancy in Palos Verdes Estates
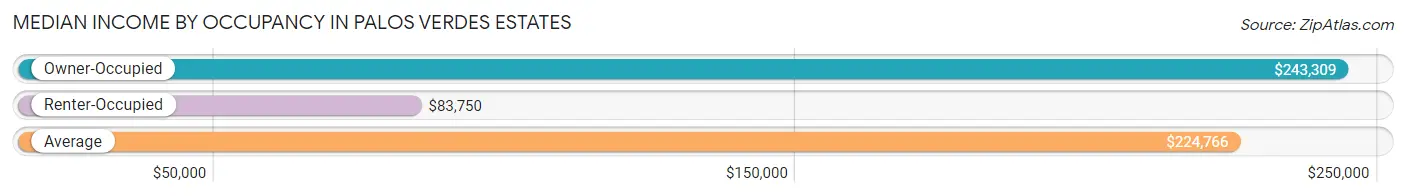
| Occupancy Type | # Households | Median Income |
| Owner-Occupied | 4,561 (89.0%) | $243,309 |
| Renter-Occupied | 562 (11.0%) | $83,750 |
| Average | 5,123 (100.0%) | $224,766 |
Occupancy by Householder Income Bracket in Palos Verdes Estates
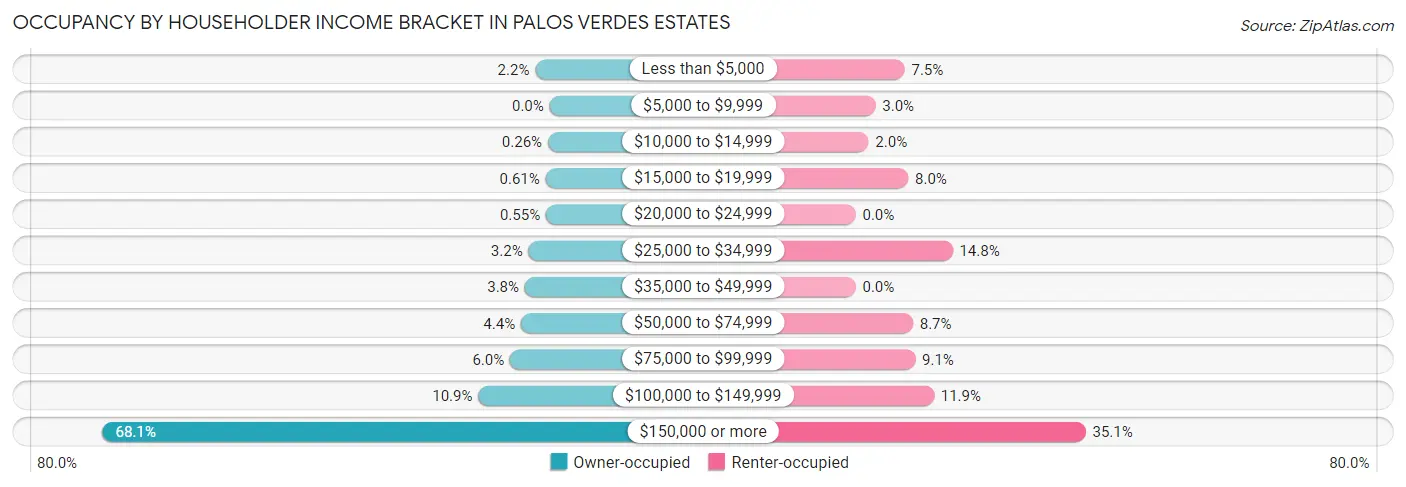
| Income Bracket | Owner-occupied | Renter-occupied |
| Less than $5,000 | 100 (2.2%) | 42 (7.5%) |
| $5,000 to $9,999 | 0 (0.0%) | 17 (3.0%) |
| $10,000 to $14,999 | 12 (0.3%) | 11 (2.0%) |
| $15,000 to $19,999 | 28 (0.6%) | 45 (8.0%) |
| $20,000 to $24,999 | 25 (0.5%) | 0 (0.0%) |
| $25,000 to $34,999 | 147 (3.2%) | 83 (14.8%) |
| $35,000 to $49,999 | 172 (3.8%) | 0 (0.0%) |
| $50,000 to $74,999 | 199 (4.4%) | 49 (8.7%) |
| $75,000 to $99,999 | 275 (6.0%) | 51 (9.1%) |
| $100,000 to $149,999 | 496 (10.9%) | 67 (11.9%) |
| $150,000 or more | 3,107 (68.1%) | 197 (35.0%) |
| Total | 4,561 (100.0%) | 562 (100.0%) |
Monthly Housing Cost Tiers in Palos Verdes Estates
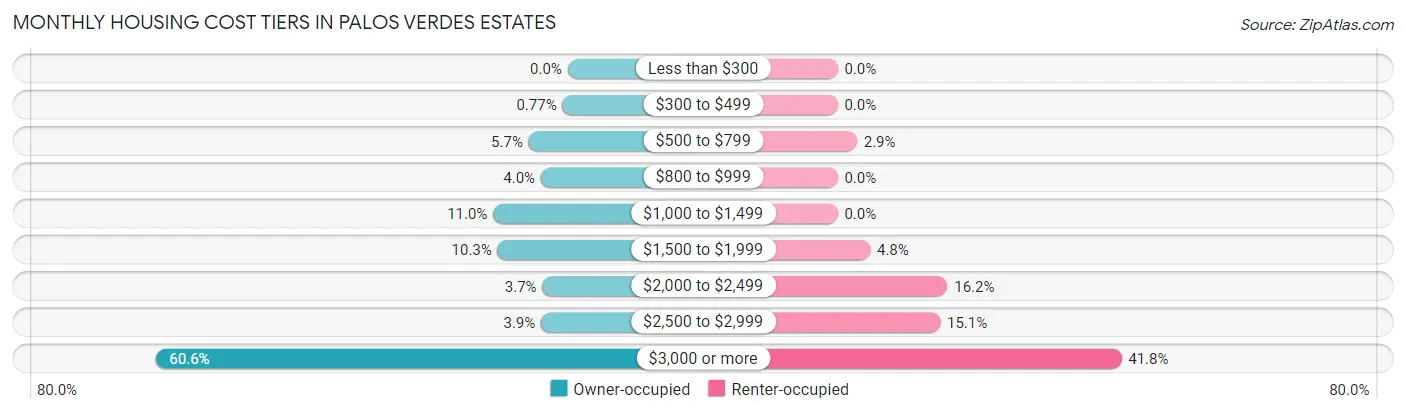
| Monthly Cost | Owner-occupied | Renter-occupied |
| Less than $300 | 0 (0.0%) | 0 (0.0%) |
| $300 to $499 | 35 (0.8%) | 0 (0.0%) |
| $500 to $799 | 262 (5.7%) | 16 (2.9%) |
| $800 to $999 | 180 (4.0%) | 0 (0.0%) |
| $1,000 to $1,499 | 501 (11.0%) | 0 (0.0%) |
| $1,500 to $1,999 | 471 (10.3%) | 27 (4.8%) |
| $2,000 to $2,499 | 170 (3.7%) | 91 (16.2%) |
| $2,500 to $2,999 | 179 (3.9%) | 85 (15.1%) |
| $3,000 or more | 2,763 (60.6%) | 235 (41.8%) |
| Total | 4,561 (100.0%) | 562 (100.0%) |
Physical Housing Characteristics in Palos Verdes Estates
Housing Structures in Palos Verdes Estates
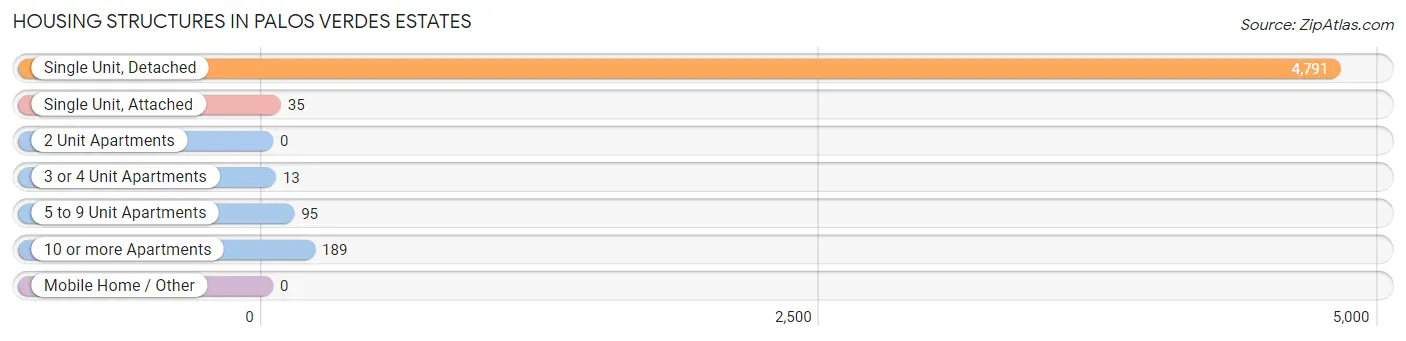
| Structure Type | # Housing Units | % Housing Units |
| Single Unit, Detached | 4,791 | 93.5% |
| Single Unit, Attached | 35 | 0.7% |
| 2 Unit Apartments | 0 | 0.0% |
| 3 or 4 Unit Apartments | 13 | 0.3% |
| 5 to 9 Unit Apartments | 95 | 1.8% |
| 10 or more Apartments | 189 | 3.7% |
| Mobile Home / Other | 0 | 0.0% |
| Total | 5,123 | 100.0% |
Housing Structures by Occupancy in Palos Verdes Estates
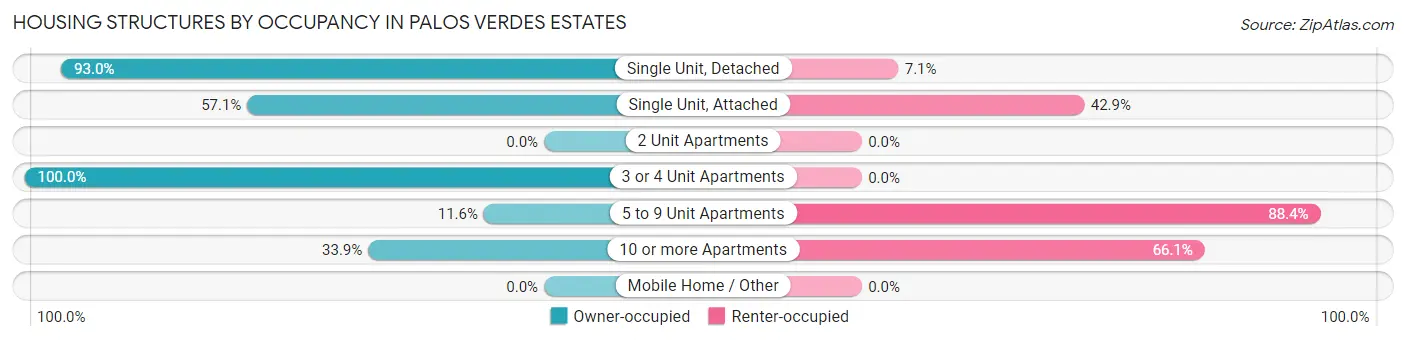
| Structure Type | Owner-occupied | Renter-occupied |
| Single Unit, Detached | 4,453 (92.9%) | 338 (7.0%) |
| Single Unit, Attached | 20 (57.1%) | 15 (42.9%) |
| 2 Unit Apartments | 0 (0.0%) | 0 (0.0%) |
| 3 or 4 Unit Apartments | 13 (100.0%) | 0 (0.0%) |
| 5 to 9 Unit Apartments | 11 (11.6%) | 84 (88.4%) |
| 10 or more Apartments | 64 (33.9%) | 125 (66.1%) |
| Mobile Home / Other | 0 (0.0%) | 0 (0.0%) |
| Total | 4,561 (89.0%) | 562 (11.0%) |
Housing Structures by Number of Rooms in Palos Verdes Estates
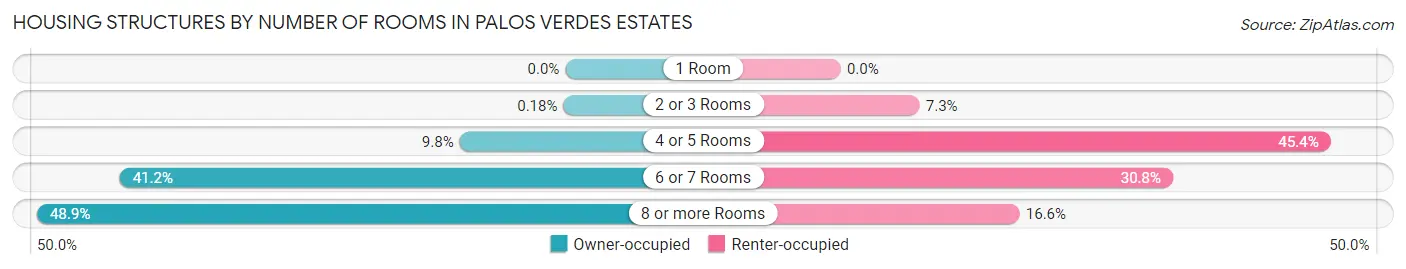
| Number of Rooms | Owner-occupied | Renter-occupied |
| 1 Room | 0 (0.0%) | 0 (0.0%) |
| 2 or 3 Rooms | 8 (0.2%) | 41 (7.3%) |
| 4 or 5 Rooms | 446 (9.8%) | 255 (45.4%) |
| 6 or 7 Rooms | 1,879 (41.2%) | 173 (30.8%) |
| 8 or more Rooms | 2,228 (48.8%) | 93 (16.6%) |
| Total | 4,561 (100.0%) | 562 (100.0%) |
Housing Structure by Heating Type in Palos Verdes Estates
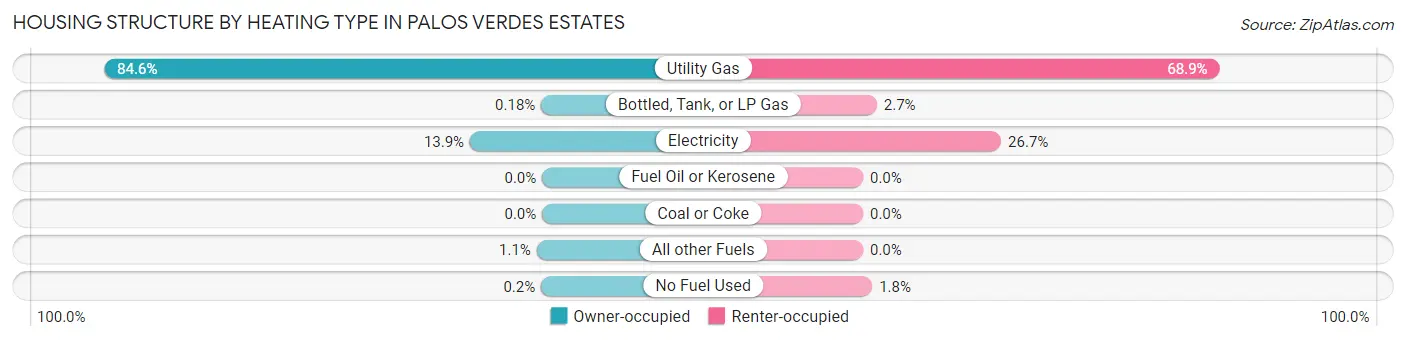
| Heating Type | Owner-occupied | Renter-occupied |
| Utility Gas | 3,860 (84.6%) | 387 (68.9%) |
| Bottled, Tank, or LP Gas | 8 (0.2%) | 15 (2.7%) |
| Electricity | 636 (13.9%) | 150 (26.7%) |
| Fuel Oil or Kerosene | 0 (0.0%) | 0 (0.0%) |
| Coal or Coke | 0 (0.0%) | 0 (0.0%) |
| All other Fuels | 48 (1.1%) | 0 (0.0%) |
| No Fuel Used | 9 (0.2%) | 10 (1.8%) |
| Total | 4,561 (100.0%) | 562 (100.0%) |
Household Vehicle Usage in Palos Verdes Estates
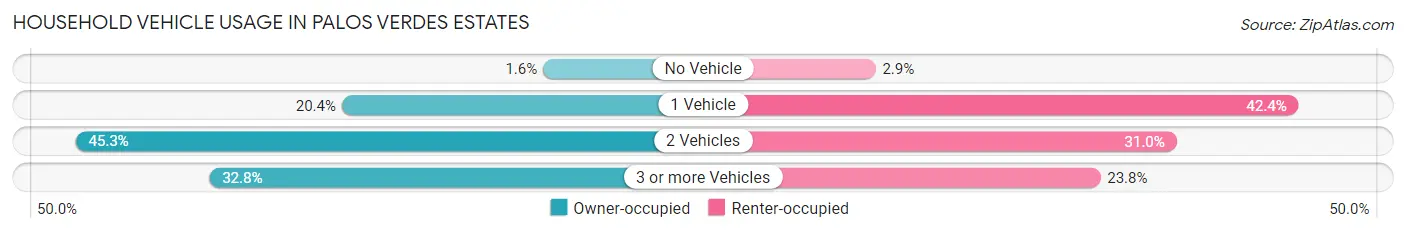
| Vehicles per Household | Owner-occupied | Renter-occupied |
| No Vehicle | 73 (1.6%) | 16 (2.9%) |
| 1 Vehicle | 930 (20.4%) | 238 (42.3%) |
| 2 Vehicles | 2,064 (45.3%) | 174 (31.0%) |
| 3 or more Vehicles | 1,494 (32.8%) | 134 (23.8%) |
| Total | 4,561 (100.0%) | 562 (100.0%) |
Real Estate & Mortgages in Palos Verdes Estates
Real Estate and Mortgage Overview in Palos Verdes Estates
| Characteristic | Without Mortgage | With Mortgage |
| Housing Units | 1,693 | 2,868 |
| Median Property Value | $2,000,001 | $2,000,001 |
| Median Household Income | $139,674 | $2,283 |
| Monthly Housing Costs | $1,501 | $2,499 |
| Real Estate Taxes | $10,001 | $12 |
Property Value by Mortgage Status in Palos Verdes Estates
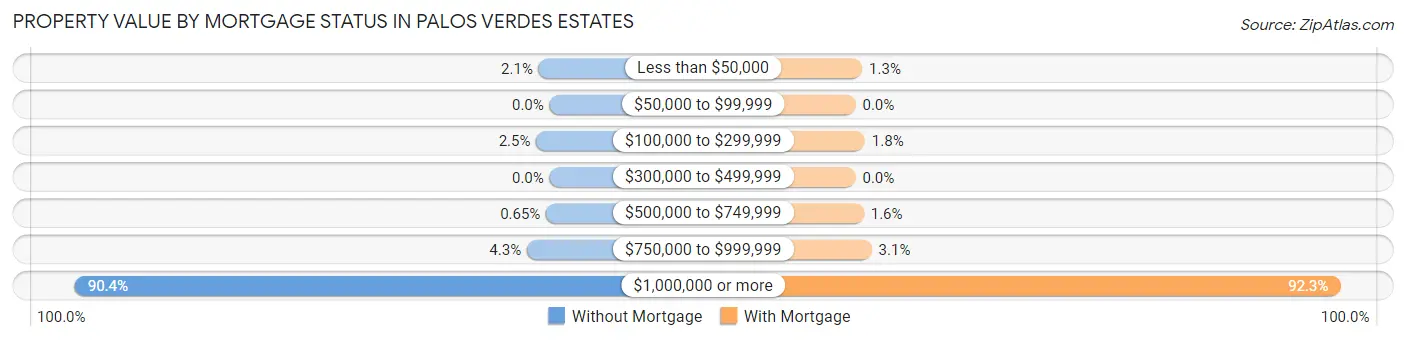
| Property Value | Without Mortgage | With Mortgage |
| Less than $50,000 | 35 (2.1%) | 36 (1.3%) |
| $50,000 to $99,999 | 0 (0.0%) | 0 (0.0%) |
| $100,000 to $299,999 | 43 (2.5%) | 51 (1.8%) |
| $300,000 to $499,999 | 0 (0.0%) | 0 (0.0%) |
| $500,000 to $749,999 | 11 (0.6%) | 45 (1.6%) |
| $750,000 to $999,999 | 73 (4.3%) | 88 (3.1%) |
| $1,000,000 or more | 1,531 (90.4%) | 2,648 (92.3%) |
| Total | 1,693 (100.0%) | 2,868 (100.0%) |
Household Income by Mortgage Status in Palos Verdes Estates
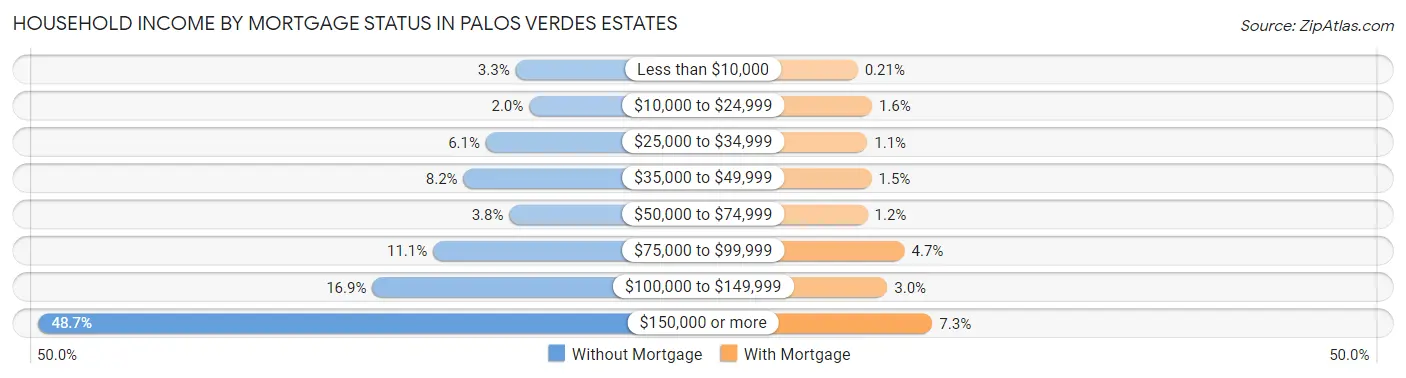
| Household Income | Without Mortgage | With Mortgage |
| Less than $10,000 | 55 (3.3%) | 6 (0.2%) |
| $10,000 to $24,999 | 33 (1.9%) | 45 (1.6%) |
| $25,000 to $34,999 | 103 (6.1%) | 32 (1.1%) |
| $35,000 to $49,999 | 139 (8.2%) | 44 (1.5%) |
| $50,000 to $74,999 | 65 (3.8%) | 33 (1.1%) |
| $75,000 to $99,999 | 188 (11.1%) | 134 (4.7%) |
| $100,000 to $149,999 | 286 (16.9%) | 87 (3.0%) |
| $150,000 or more | 824 (48.7%) | 210 (7.3%) |
| Total | 1,693 (100.0%) | 2,868 (100.0%) |
Property Value to Household Income Ratio in Palos Verdes Estates
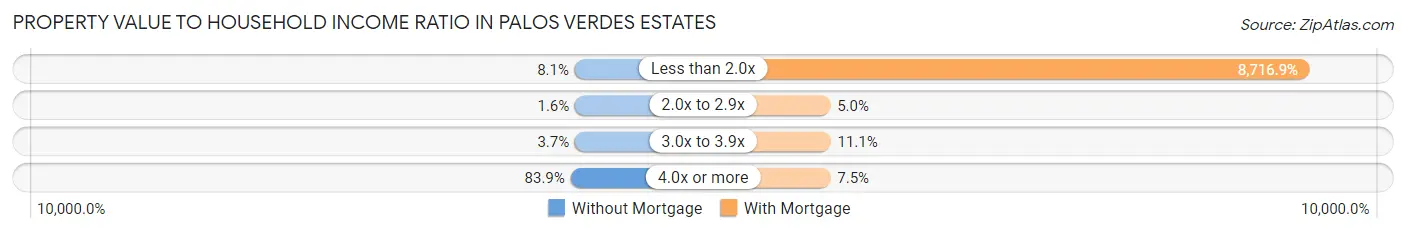
| Value-to-Income Ratio | Without Mortgage | With Mortgage |
| Less than 2.0x | 137 (8.1%) | 250,001 (8,716.9%) |
| 2.0x to 2.9x | 27 (1.6%) | 142 (5.0%) |
| 3.0x to 3.9x | 62 (3.7%) | 318 (11.1%) |
| 4.0x or more | 1,421 (83.9%) | 216 (7.5%) |
| Total | 1,693 (100.0%) | 2,868 (100.0%) |
Real Estate Taxes by Mortgage Status in Palos Verdes Estates
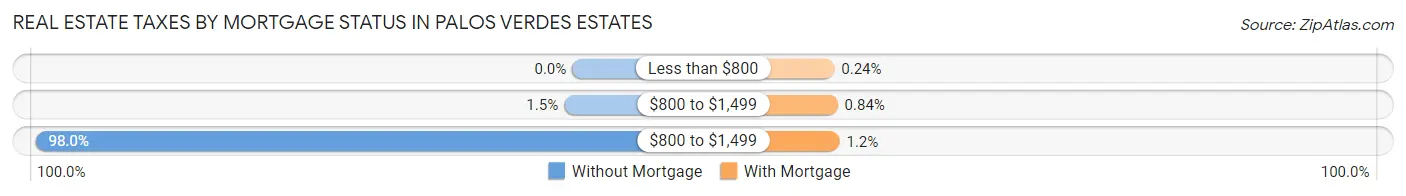
| Property Taxes | Without Mortgage | With Mortgage |
| Less than $800 | 0 (0.0%) | 7 (0.2%) |
| $800 to $1,499 | 25 (1.5%) | 24 (0.8%) |
| $800 to $1,499 | 1,659 (98.0%) | 34 (1.2%) |
| Total | 1,693 (100.0%) | 2,868 (100.0%) |
Health & Disability in Palos Verdes Estates
Health Insurance Coverage by Age in Palos Verdes Estates
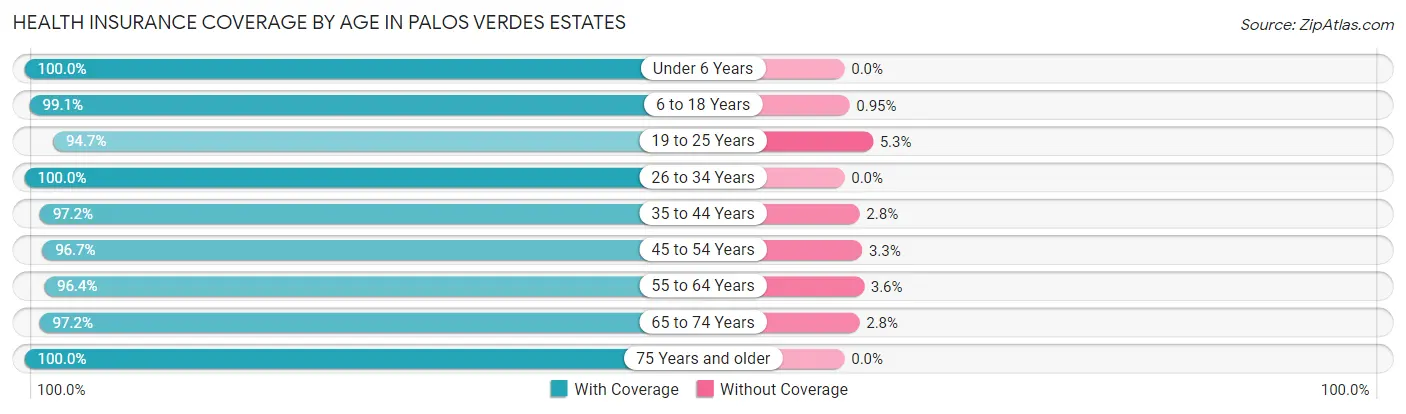
| Age Bracket | With Coverage | Without Coverage |
| Under 6 Years | 533 (100.0%) | 0 (0.0%) |
| 6 to 18 Years | 2,604 (99.1%) | 25 (0.9%) |
| 19 to 25 Years | 429 (94.7%) | 24 (5.3%) |
| 26 to 34 Years | 457 (100.0%) | 0 (0.0%) |
| 35 to 44 Years | 896 (97.2%) | 26 (2.8%) |
| 45 to 54 Years | 1,913 (96.7%) | 65 (3.3%) |
| 55 to 64 Years | 2,440 (96.4%) | 92 (3.6%) |
| 65 to 74 Years | 1,779 (97.2%) | 51 (2.8%) |
| 75 Years and older | 1,885 (100.0%) | 0 (0.0%) |
| Total | 12,936 (97.9%) | 283 (2.1%) |
Health Insurance Coverage by Citizenship Status in Palos Verdes Estates

| Citizenship Status | With Coverage | Without Coverage |
| Native Born | 533 (100.0%) | 0 (0.0%) |
| Foreign Born, Citizen | 2,604 (99.1%) | 25 (0.9%) |
| Foreign Born, not a Citizen | 429 (94.7%) | 24 (5.3%) |
Health Insurance Coverage by Household Income in Palos Verdes Estates
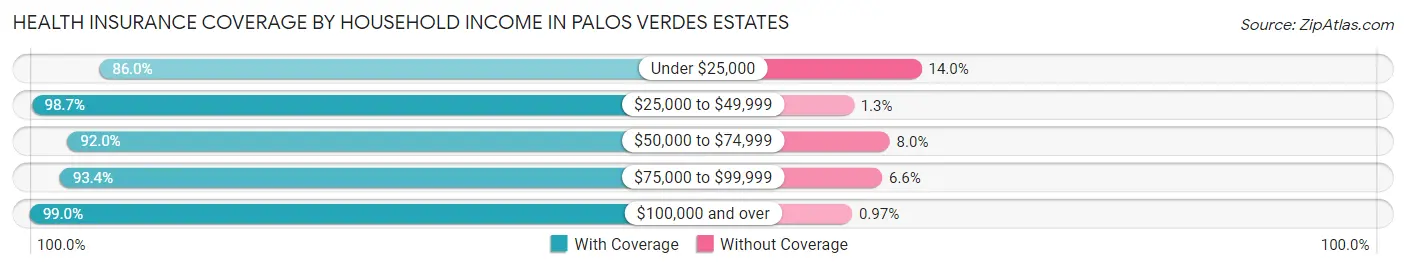
| Household Income | With Coverage | Without Coverage |
| Under $25,000 | 393 (86.0%) | 64 (14.0%) |
| $25,000 to $49,999 | 761 (98.7%) | 10 (1.3%) |
| $50,000 to $74,999 | 607 (92.0%) | 53 (8.0%) |
| $75,000 to $99,999 | 594 (93.4%) | 42 (6.6%) |
| $100,000 and over | 10,563 (99.0%) | 103 (1.0%) |
Public vs Private Health Insurance Coverage by Age in Palos Verdes Estates
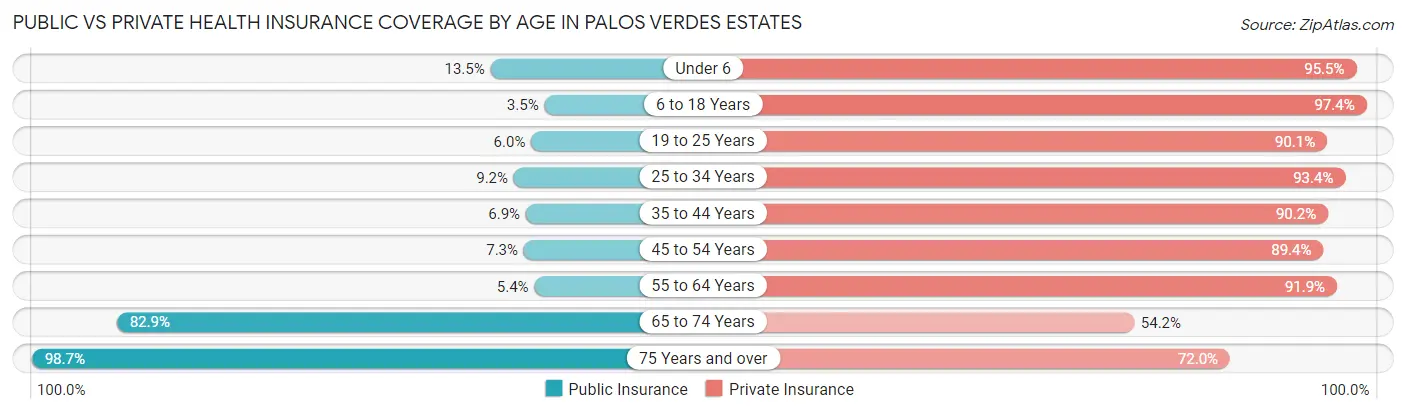
| Age Bracket | Public Insurance | Private Insurance |
| Under 6 | 72 (13.5%) | 509 (95.5%) |
| 6 to 18 Years | 92 (3.5%) | 2,560 (97.4%) |
| 19 to 25 Years | 27 (6.0%) | 408 (90.1%) |
| 25 to 34 Years | 42 (9.2%) | 427 (93.4%) |
| 35 to 44 Years | 64 (6.9%) | 832 (90.2%) |
| 45 to 54 Years | 145 (7.3%) | 1,768 (89.4%) |
| 55 to 64 Years | 136 (5.4%) | 2,327 (91.9%) |
| 65 to 74 Years | 1,517 (82.9%) | 992 (54.2%) |
| 75 Years and over | 1,860 (98.7%) | 1,358 (72.0%) |
| Total | 3,955 (29.9%) | 11,181 (84.6%) |
Disability Status by Sex by Age in Palos Verdes Estates
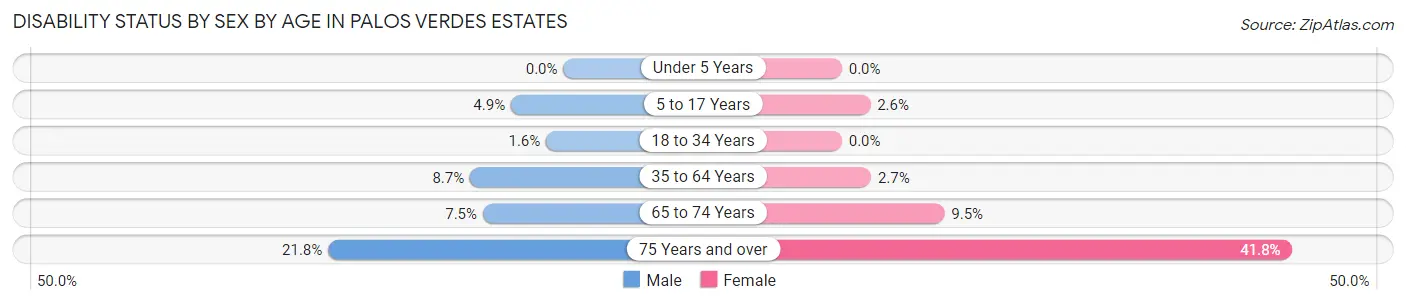
| Age Bracket | Male | Female |
| Under 5 Years | 0 (0.0%) | 0 (0.0%) |
| 5 to 17 Years | 62 (4.9%) | 34 (2.6%) |
| 18 to 34 Years | 10 (1.6%) | 0 (0.0%) |
| 35 to 64 Years | 234 (8.7%) | 74 (2.7%) |
| 65 to 74 Years | 63 (7.5%) | 94 (9.5%) |
| 75 Years and over | 198 (21.8%) | 409 (41.8%) |
Disability Class by Sex by Age in Palos Verdes Estates
Disability Class: Hearing Difficulty
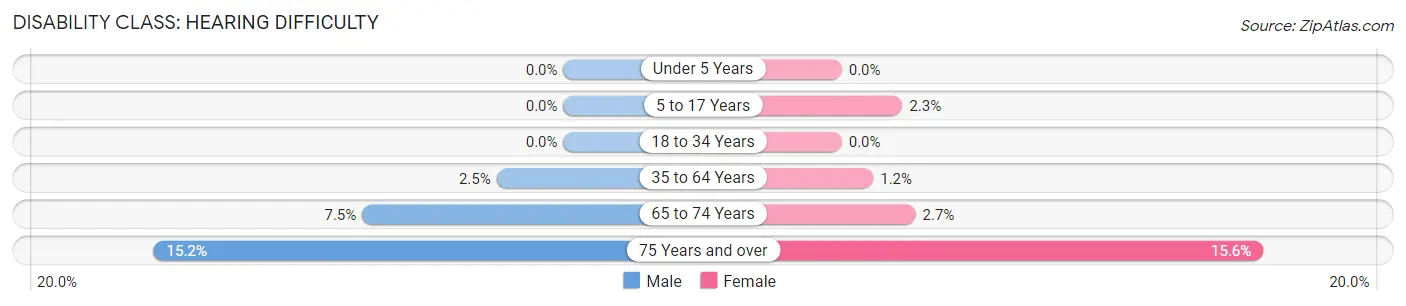
| Age Bracket | Male | Female |
| Under 5 Years | 0 (0.0%) | 0 (0.0%) |
| 5 to 17 Years | 0 (0.0%) | 29 (2.2%) |
| 18 to 34 Years | 0 (0.0%) | 0 (0.0%) |
| 35 to 64 Years | 67 (2.5%) | 32 (1.2%) |
| 65 to 74 Years | 63 (7.5%) | 27 (2.7%) |
| 75 Years and over | 138 (15.2%) | 153 (15.6%) |
Disability Class: Vision Difficulty
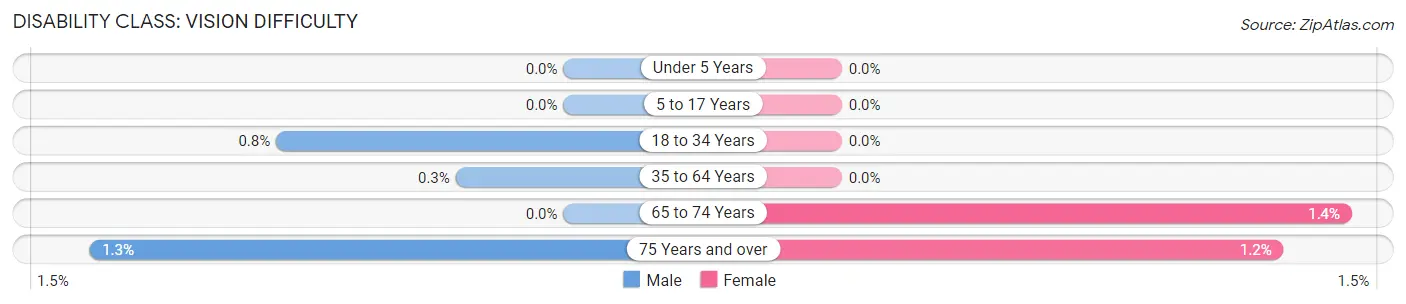
| Age Bracket | Male | Female |
| Under 5 Years | 0 (0.0%) | 0 (0.0%) |
| 5 to 17 Years | 0 (0.0%) | 0 (0.0%) |
| 18 to 34 Years | 5 (0.8%) | 0 (0.0%) |
| 35 to 64 Years | 8 (0.3%) | 0 (0.0%) |
| 65 to 74 Years | 0 (0.0%) | 14 (1.4%) |
| 75 Years and over | 12 (1.3%) | 12 (1.2%) |
Disability Class: Cognitive Difficulty
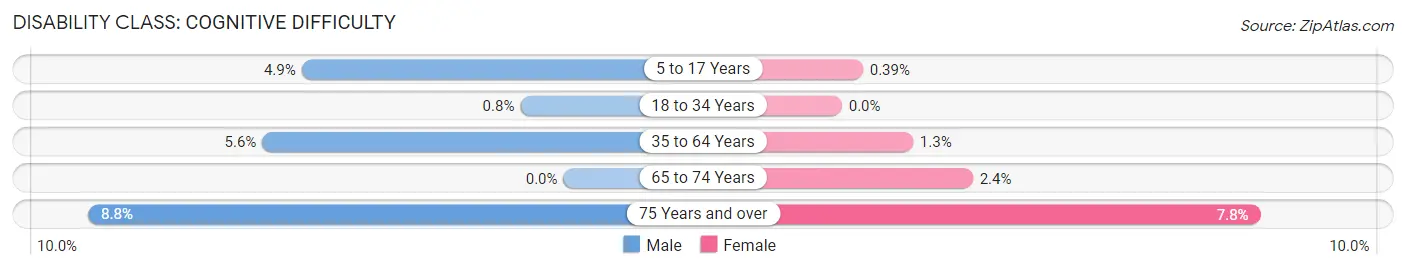
| Age Bracket | Male | Female |
| 5 to 17 Years | 62 (4.9%) | 5 (0.4%) |
| 18 to 34 Years | 5 (0.8%) | 0 (0.0%) |
| 35 to 64 Years | 151 (5.6%) | 36 (1.3%) |
| 65 to 74 Years | 0 (0.0%) | 24 (2.4%) |
| 75 Years and over | 80 (8.8%) | 76 (7.8%) |
Disability Class: Ambulatory Difficulty
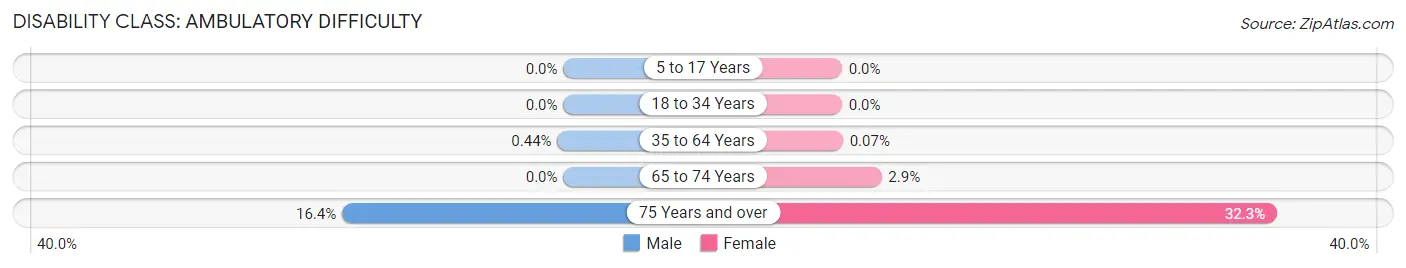
| Age Bracket | Male | Female |
| 5 to 17 Years | 0 (0.0%) | 0 (0.0%) |
| 18 to 34 Years | 0 (0.0%) | 0 (0.0%) |
| 35 to 64 Years | 12 (0.4%) | 2 (0.1%) |
| 65 to 74 Years | 0 (0.0%) | 29 (2.9%) |
| 75 Years and over | 149 (16.4%) | 316 (32.3%) |
Disability Class: Self-Care Difficulty
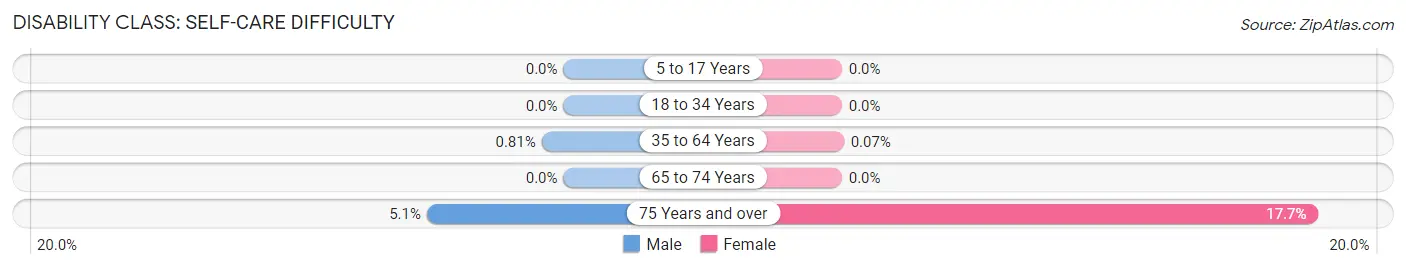
| Age Bracket | Male | Female |
| 5 to 17 Years | 0 (0.0%) | 0 (0.0%) |
| 18 to 34 Years | 0 (0.0%) | 0 (0.0%) |
| 35 to 64 Years | 22 (0.8%) | 2 (0.1%) |
| 65 to 74 Years | 0 (0.0%) | 0 (0.0%) |
| 75 Years and over | 46 (5.1%) | 173 (17.7%) |
Technology Access in Palos Verdes Estates
Computing Device Access in Palos Verdes Estates
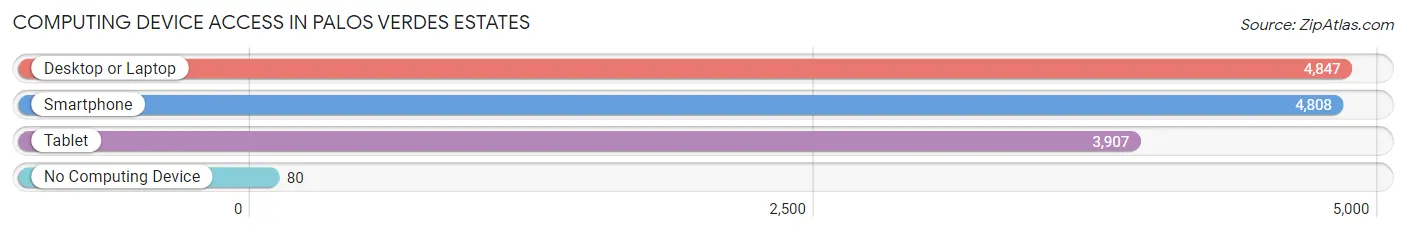
| Device Type | # Households | % Households |
| Desktop or Laptop | 4,847 | 94.6% |
| Smartphone | 4,808 | 93.9% |
| Tablet | 3,907 | 76.3% |
| No Computing Device | 80 | 1.6% |
| Total | 5,123 | 100.0% |
Internet Access in Palos Verdes Estates
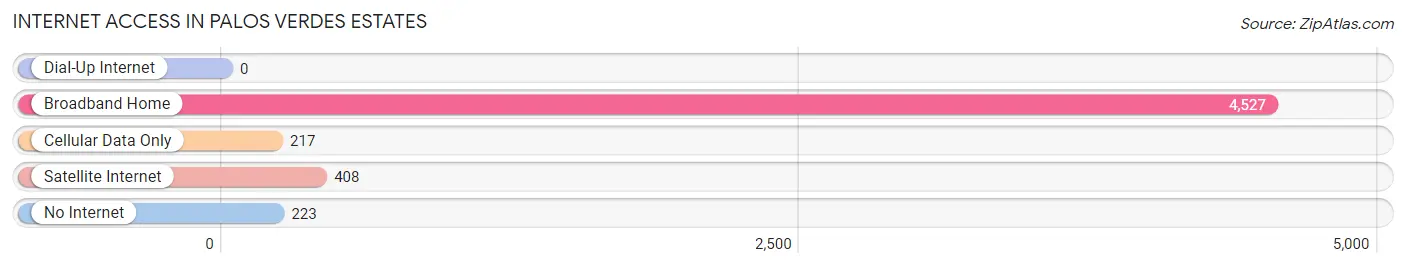
| Internet Type | # Households | % Households |
| Dial-Up Internet | 0 | 0.0% |
| Broadband Home | 4,527 | 88.4% |
| Cellular Data Only | 217 | 4.2% |
| Satellite Internet | 408 | 8.0% |
| No Internet | 223 | 4.3% |
| Total | 5,123 | 100.0% |
Palos Verdes Estates Summary
Palos Verdes Estates is a city located in Los Angeles County, California. It is situated on the Palos Verdes Peninsula, which is a part of the greater Los Angeles metropolitan area. The city is known for its beautiful views of the Pacific Ocean, its rolling hills, and its Mediterranean climate. The population of Palos Verdes Estates was 13,438 as of the 2010 census.
History
The area that is now Palos Verdes Estates was originally inhabited by the Tongva Native American tribe. The first Europeans to explore the area were Spanish explorers in the late 1700s. In the early 1800s, the area was part of the Rancho de los Palos Verdes land grant. In the late 1800s, the area was developed by Frank Vanderlip, who purchased the land from the Palos Verdes Land and Water Company. Vanderlip developed the area into a residential community, and in 1939, the city of Palos Verdes Estates was incorporated.
Geography
Palos Verdes Estates is located on the Palos Verdes Peninsula, which is a part of the greater Los Angeles metropolitan area. The city is bordered by the cities of Rolling Hills, Rolling Hills Estates, and Rancho Palos Verdes. The city is situated on a hillside overlooking the Pacific Ocean, and it is known for its beautiful views of the ocean and its rolling hills. The city has a total area of 8.4 square miles, of which 8.2 square miles is land and 0.2 square miles is water.
Economy
The economy of Palos Verdes Estates is largely based on the service industry. The city is home to a variety of restaurants, retail stores, and other businesses. The city is also home to a number of corporate offices, including those of the Palos Verdes Estates Chamber of Commerce and the Palos Verdes Estates Police Department. The city is also home to a number of educational institutions, including the Palos Verdes Peninsula Unified School District and the Palos Verdes Peninsula College.
Demographics
As of the 2010 census, the population of Palos Verdes Estates was 13,438. The racial makeup of the city was 87.3% White, 1.2% African American, 0.2% Native American, 8.2% Asian, 0.1% Pacific Islander, 1.2% from other races, and 2.0% from two or more races. The median household income in the city was $133,929, and the median family income was $152,945. The per capita income in the city was $68,945.
Palos Verdes Estates is a beautiful city with a rich history and a vibrant economy. The city is known for its stunning views of the Pacific Ocean, its rolling hills, and its Mediterranean climate. The city is home to a variety of businesses, educational institutions, and other amenities, making it an attractive place to live and work.
Common Questions
What is Per Capita Income in Palos Verdes Estates?
Per Capita income in Palos Verdes Estates is $133,004.
What is the Median Family Income in Palos Verdes Estates?
Median Family Income in Palos Verdes Estates is $250,001.
What is the Median Household income in Palos Verdes Estates?
Median Household Income in Palos Verdes Estates is $224,766.
What is Income or Wage Gap in Palos Verdes Estates?
Income or Wage Gap in Palos Verdes Estates is 62.9%.
Women in Palos Verdes Estates earn 37.1 cents for every dollar earned by a man.
What is Inequality or Gini Index in Palos Verdes Estates?
Inequality or Gini Index in Palos Verdes Estates is 0.52.
What is the Total Population of Palos Verdes Estates?
Total Population of Palos Verdes Estates is 13,219.
What is the Total Male Population of Palos Verdes Estates?
Total Male Population of Palos Verdes Estates is 6,614.
What is the Total Female Population of Palos Verdes Estates?
Total Female Population of Palos Verdes Estates is 6,605.
What is the Ratio of Males per 100 Females in Palos Verdes Estates?
There are 100.14 Males per 100 Females in Palos Verdes Estates.
What is the Ratio of Females per 100 Males in Palos Verdes Estates?
There are 99.86 Females per 100 Males in Palos Verdes Estates.
What is the Median Population Age in Palos Verdes Estates?
Median Population Age in Palos Verdes Estates is 53.3 Years.
What is the Average Family Size in Palos Verdes Estates
Average Family Size in Palos Verdes Estates is 3.0 People.
What is the Average Household Size in Palos Verdes Estates
Average Household Size in Palos Verdes Estates is 2.6 People.
How Large is the Labor Force in Palos Verdes Estates?
There are 5,402 People in the Labor Forcein in Palos Verdes Estates.
What is the Percentage of People in the Labor Force in Palos Verdes Estates?
50.9% of People are in the Labor Force in Palos Verdes Estates.
What is the Unemployment Rate in Palos Verdes Estates?
Unemployment Rate in Palos Verdes Estates is 2.3%.