East Shore, CA Map & Demographics
East Shore Map
East Shore Overview
$35,283
PER CAPITA INCOME
$111,302
AVG FAMILY INCOME
$110,729
AVG HOUSEHOLD INCOME
0.31
INEQUALITY / GINI INDEX
209
TOTAL POPULATION
56
MALE POPULATION
153
FEMALE POPULATION
36.60
MALES / 100 FEMALES
273.21
FEMALES / 100 MALES
39.3
MEDIAN AGE
4.3
AVG FAMILY SIZE
2.9
AVG HOUSEHOLD SIZE
46
LABOR FORCE [ PEOPLE ]
34.1%
PERCENT IN LABOR FORCE
26.1%
UNEMPLOYMENT RATE
Income in East Shore
Income Overview in East Shore
Per Capita Income in East Shore is $35,283, while median incomes of families and households are $111,302 and $110,729 respectively.
| Characteristic | Number | Measure |
| Per Capita Income | 209 | $35,283 |
| Median Family Income | 37 | $111,302 |
| Mean Family Income | 37 | $129,970 |
| Median Household Income | 72 | $110,729 |
| Mean Household Income | 72 | $102,894 |
| Income Deficit | 37 | $0 |
| Wage / Income Gap (%) | 209 | 0.00% |
| Wage / Income Gap ($) | 209 | 100.00¢ per $1 |
| Gini / Inequality Index | 209 | 0.31 |
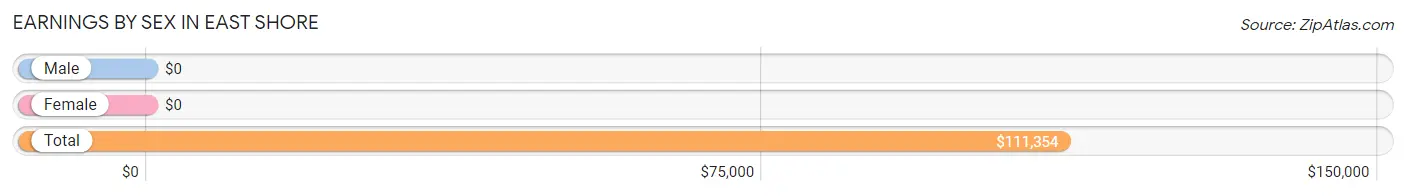
Earnings by Sex in East Shore
| Sex | Number | Average Earnings |
| Male | 24 (52.2%) | $0 |
| Female | 22 (47.8%) | $0 |
| Total | 46 (100.0%) | $111,354 |
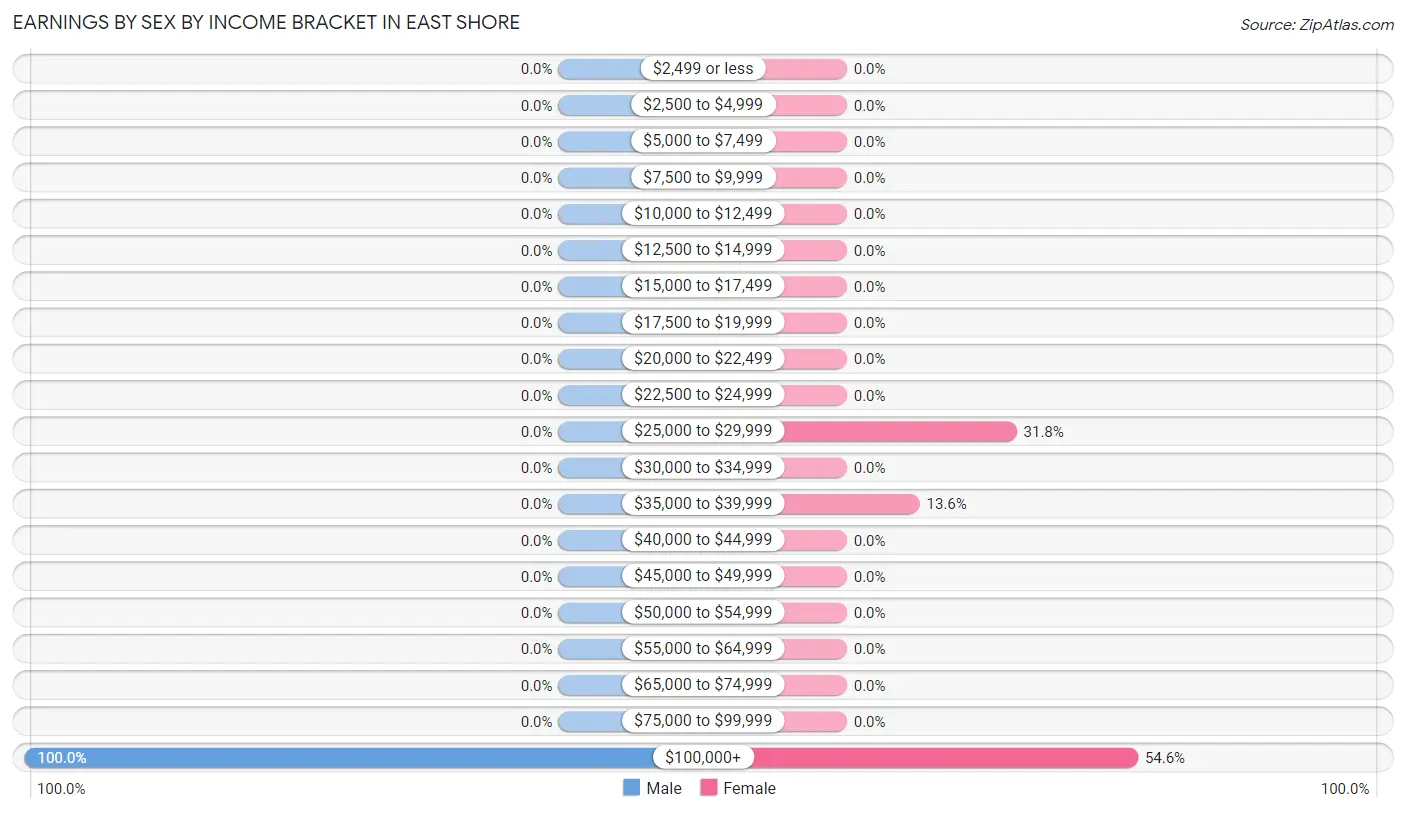
Earnings by Sex by Income Bracket in East Shore
The most common earnings brackets in East Shore are $100,000+ for men (24 | 100.0%) and $100,000+ for women (12 | 54.5%).
| Income | Male | Female |
| $2,499 or less | 0 (0.0%) | 0 (0.0%) |
| $2,500 to $4,999 | 0 (0.0%) | 0 (0.0%) |
| $5,000 to $7,499 | 0 (0.0%) | 0 (0.0%) |
| $7,500 to $9,999 | 0 (0.0%) | 0 (0.0%) |
| $10,000 to $12,499 | 0 (0.0%) | 0 (0.0%) |
| $12,500 to $14,999 | 0 (0.0%) | 0 (0.0%) |
| $15,000 to $17,499 | 0 (0.0%) | 0 (0.0%) |
| $17,500 to $19,999 | 0 (0.0%) | 0 (0.0%) |
| $20,000 to $22,499 | 0 (0.0%) | 0 (0.0%) |
| $22,500 to $24,999 | 0 (0.0%) | 0 (0.0%) |
| $25,000 to $29,999 | 0 (0.0%) | 7 (31.8%) |
| $30,000 to $34,999 | 0 (0.0%) | 0 (0.0%) |
| $35,000 to $39,999 | 0 (0.0%) | 3 (13.6%) |
| $40,000 to $44,999 | 0 (0.0%) | 0 (0.0%) |
| $45,000 to $49,999 | 0 (0.0%) | 0 (0.0%) |
| $50,000 to $54,999 | 0 (0.0%) | 0 (0.0%) |
| $55,000 to $64,999 | 0 (0.0%) | 0 (0.0%) |
| $65,000 to $74,999 | 0 (0.0%) | 0 (0.0%) |
| $75,000 to $99,999 | 0 (0.0%) | 0 (0.0%) |
| $100,000+ | 24 (100.0%) | 12 (54.5%) |
| Total | 24 (100.0%) | 22 (100.0%) |
Earnings by Sex by Educational Attainment in East Shore
| Educational Attainment | Male Income | Female Income |
| Less than High School | - | - |
| High School Diploma | - | - |
| College or Associate's Degree | - | - |
| Bachelor's Degree | - | - |
| Graduate Degree | - | - |
| Total | - | - |
Family Income in East Shore
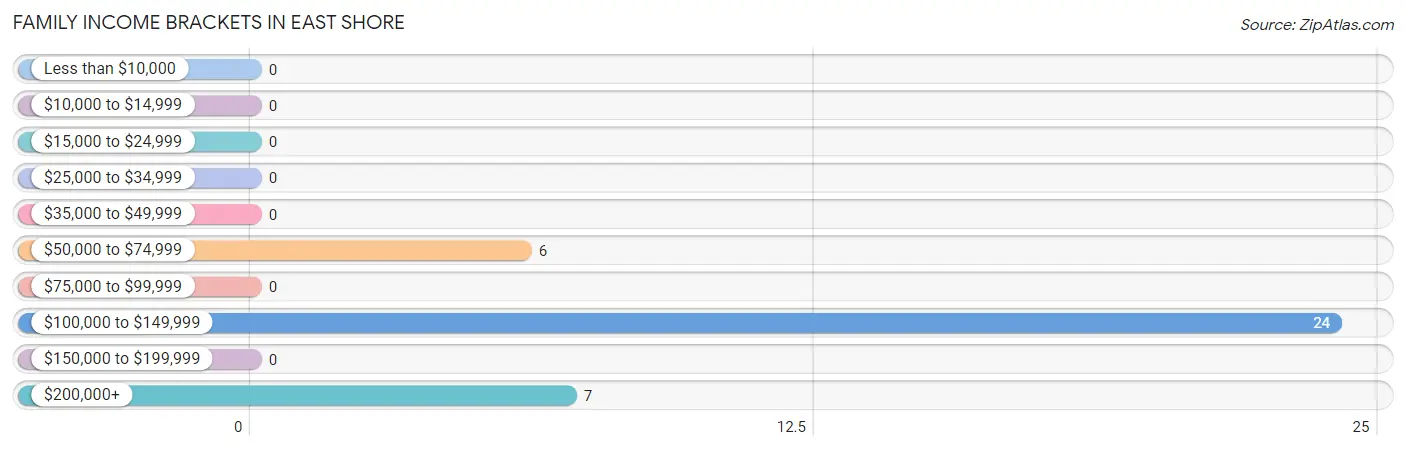
Family Income Brackets in East Shore
According to the East Shore family income data, there are 24 families falling into the $100,000 to $149,999 income range, which is the most common income bracket and makes up 64.9% of all families.
| Income Bracket | # Families | % Families |
| Less than $10,000 | 0 | 0.0% |
| $10,000 to $14,999 | 0 | 0.0% |
| $15,000 to $24,999 | 0 | 0.0% |
| $25,000 to $34,999 | 0 | 0.0% |
| $35,000 to $49,999 | 0 | 0.0% |
| $50,000 to $74,999 | 6 | 16.2% |
| $75,000 to $99,999 | 0 | 0.0% |
| $100,000 to $149,999 | 24 | 64.9% |
| $150,000 to $199,999 | 0 | 0.0% |
| $200,000+ | 7 | 18.9% |
Family Income by Famaliy Size in East Shore
| Income Bracket | # Families | Median Income |
| 2-Person Families | 13 (35.1%) | $0 |
| 3-Person Families | 0 (0.0%) | $0 |
| 4-Person Families | 0 (0.0%) | $0 |
| 5-Person Families | 24 (64.9%) | $0 |
| 6-Person Families | 0 (0.0%) | $0 |
| 7+ Person Families | 0 (0.0%) | $0 |
| Total | 37 (100.0%) | $111,302 |
Family Income by Number of Earners in East Shore
| Number of Earners | # Families | Median Income |
| No Earners | 6 (16.2%) | $0 |
| 1 Earner | 31 (83.8%) | $0 |
| 2 Earners | 0 (0.0%) | $0 |
| 3+ Earners | 0 (0.0%) | $0 |
| Total | 37 (100.0%) | $111,302 |
Household Income in East Shore
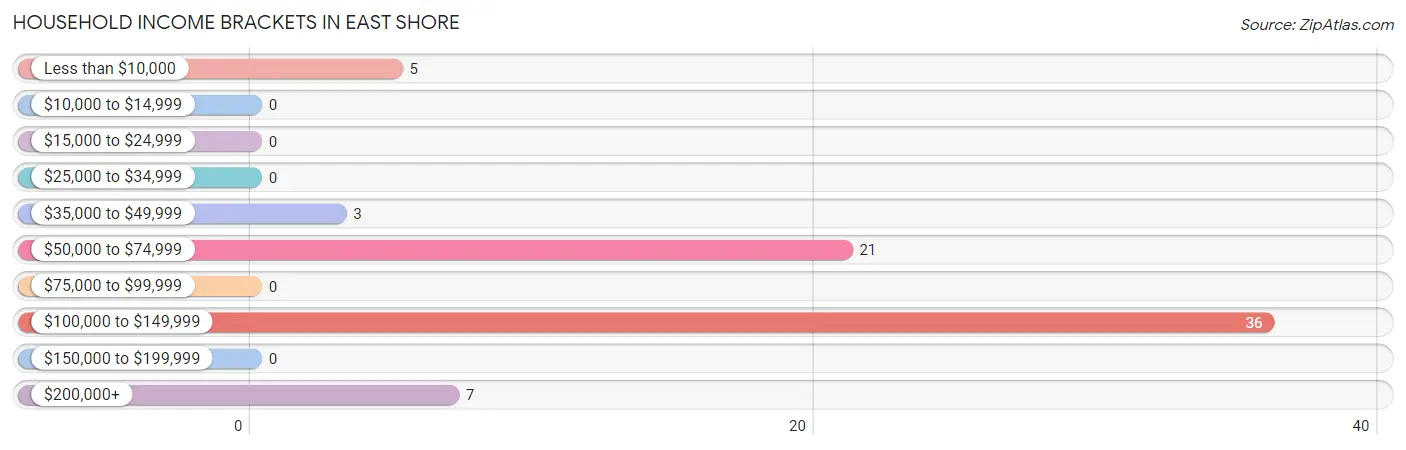
Household Income Brackets in East Shore
With 36 households falling in the category, the $100,000 to $149,999 income range is the most frequent in East Shore, accounting for 50.0% of all households.
| Income Bracket | # Households | % Households |
| Less than $10,000 | 5 | 6.9% |
| $10,000 to $14,999 | 0 | 0.0% |
| $15,000 to $24,999 | 0 | 0.0% |
| $25,000 to $34,999 | 0 | 0.0% |
| $35,000 to $49,999 | 3 | 4.2% |
| $50,000 to $74,999 | 21 | 29.2% |
| $75,000 to $99,999 | 0 | 0.0% |
| $100,000 to $149,999 | 36 | 50.0% |
| $150,000 to $199,999 | 0 | 0.0% |
| $200,000+ | 7 | 9.7% |
Household Income by Householder Age in East Shore
The median household income in East Shore is $110,729, with the highest median household income of $65,333 found in the 65+ years age bracket for the primary householder. A total of 26 households (36.1%) fall into this category.
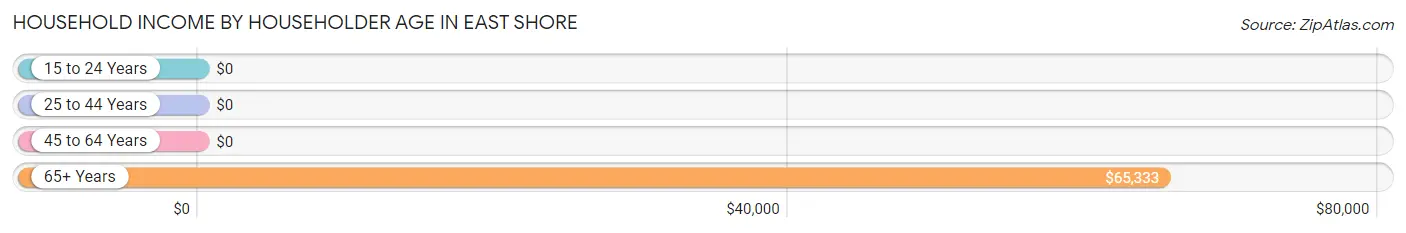
| Income Bracket | # Households | Median Income |
| 15 to 24 Years | 0 (0.0%) | $0 |
| 25 to 44 Years | 36 (50.0%) | $0 |
| 45 to 64 Years | 10 (13.9%) | $0 |
| 65+ Years | 26 (36.1%) | $65,333 |
| Total | 72 (100.0%) | $110,729 |
Poverty in East Shore
Income Below Poverty by Sex and Age in East Shore
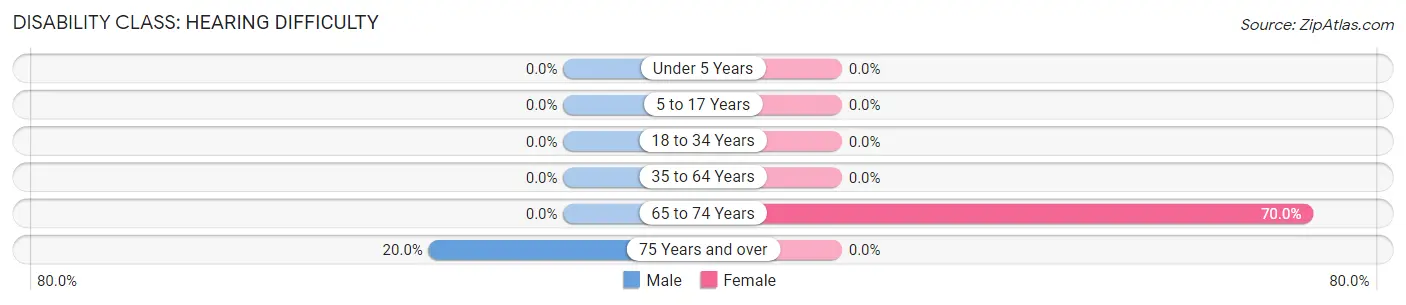
With 8.9% poverty level for males and 9.1% for females among the residents of East Shore, 75 year old and over males and 65 to 74 year old females are the most vulnerable to poverty, with 5 males (20.0%) and 14 females (70.0%) in their respective age groups living below the poverty level.
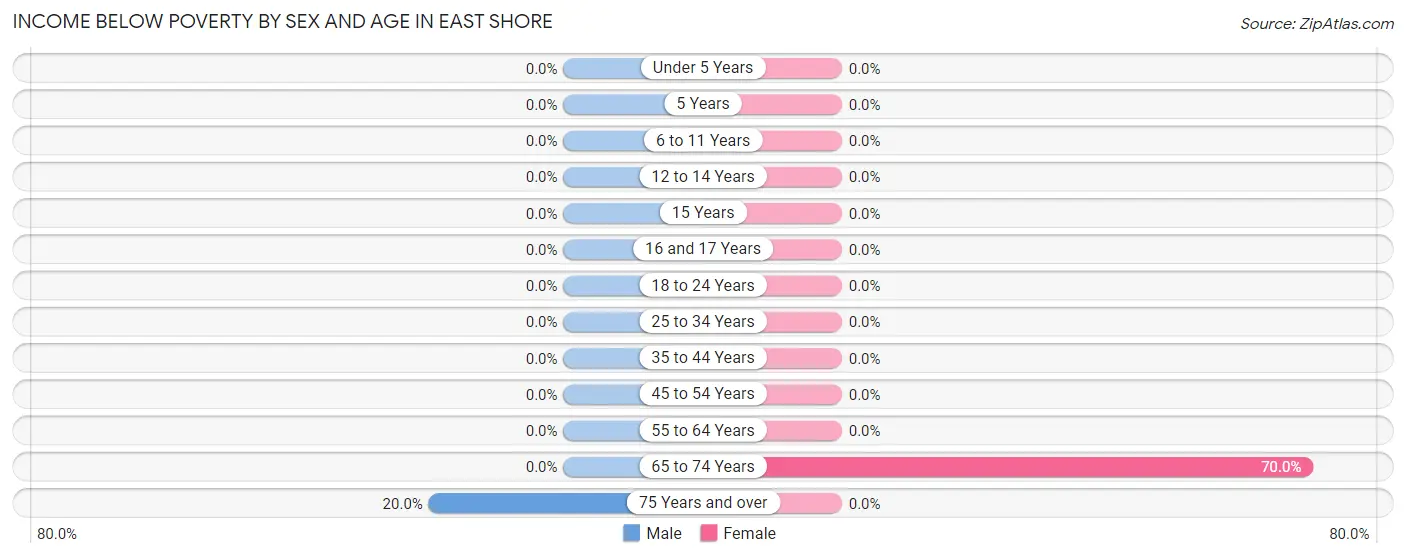
| Age Bracket | Male | Female |
| Under 5 Years | 0 (0.0%) | 0 (0.0%) |
| 5 Years | 0 (0.0%) | 0 (0.0%) |
| 6 to 11 Years | 0 (0.0%) | 0 (0.0%) |
| 12 to 14 Years | 0 (0.0%) | 0 (0.0%) |
| 15 Years | 0 (0.0%) | 0 (0.0%) |
| 16 and 17 Years | 0 (0.0%) | 0 (0.0%) |
| 18 to 24 Years | 0 (0.0%) | 0 (0.0%) |
| 25 to 34 Years | 0 (0.0%) | 0 (0.0%) |
| 35 to 44 Years | 0 (0.0%) | 0 (0.0%) |
| 45 to 54 Years | 0 (0.0%) | 0 (0.0%) |
| 55 to 64 Years | 0 (0.0%) | 0 (0.0%) |
| 65 to 74 Years | 0 (0.0%) | 14 (70.0%) |
| 75 Years and over | 5 (20.0%) | 0 (0.0%) |
| Total | 5 (8.9%) | 14 (9.1%) |
Income Above Poverty by Sex and Age in East Shore
According to the poverty statistics in East Shore, males aged 35 to 44 years and females aged under 5 years are the age groups that are most secure financially, with 100.0% of males and 100.0% of females in these age groups living above the poverty line.
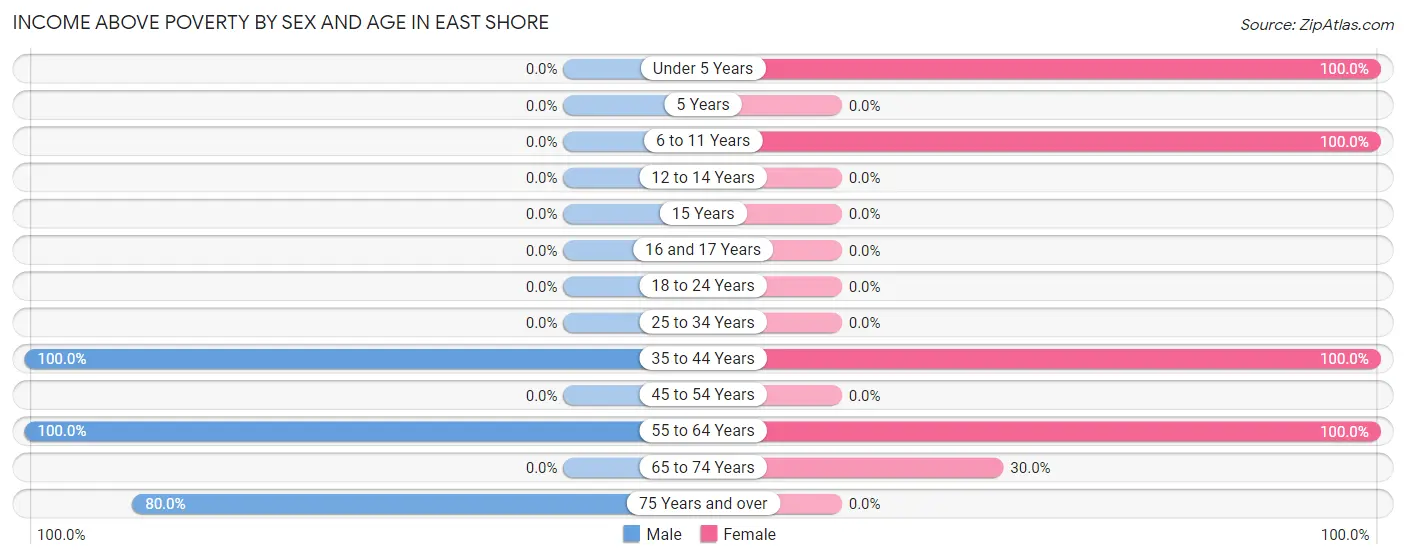
| Age Bracket | Male | Female |
| Under 5 Years | 0 (0.0%) | 24 (100.0%) |
| 5 Years | 0 (0.0%) | 0 (0.0%) |
| 6 to 11 Years | 0 (0.0%) | 50 (100.0%) |
| 12 to 14 Years | 0 (0.0%) | 0 (0.0%) |
| 15 Years | 0 (0.0%) | 0 (0.0%) |
| 16 and 17 Years | 0 (0.0%) | 0 (0.0%) |
| 18 to 24 Years | 0 (0.0%) | 0 (0.0%) |
| 25 to 34 Years | 0 (0.0%) | 0 (0.0%) |
| 35 to 44 Years | 24 (100.0%) | 49 (100.0%) |
| 45 to 54 Years | 0 (0.0%) | 0 (0.0%) |
| 55 to 64 Years | 7 (100.0%) | 10 (100.0%) |
| 65 to 74 Years | 0 (0.0%) | 6 (30.0%) |
| 75 Years and over | 20 (80.0%) | 0 (0.0%) |
| Total | 51 (91.1%) | 139 (90.8%) |
Income Below Poverty Among Married-Couple Families in East Shore
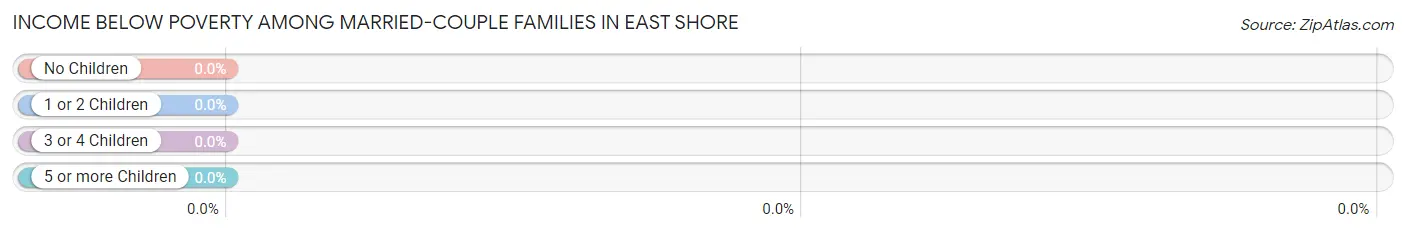
| Children | Above Poverty | Below Poverty |
| No Children | 13 (100.0%) | 0 (0.0%) |
| 1 or 2 Children | 0 (0.0%) | 0 (0.0%) |
| 3 or 4 Children | 24 (100.0%) | 0 (0.0%) |
| 5 or more Children | 0 (0.0%) | 0 (0.0%) |
| Total | 37 (100.0%) | 0 (0.0%) |
Income Below Poverty Among Single-Parent Households in East Shore
| Children | Single Father | Single Mother |
| No Children | 0 (0.0%) | 0 (0.0%) |
| 1 or 2 Children | 0 (0.0%) | 0 (0.0%) |
| 3 or 4 Children | 0 (0.0%) | 0 (0.0%) |
| 5 or more Children | 0 (0.0%) | 0 (0.0%) |
| Total | 0 (0.0%) | 0 (0.0%) |
Income Below Poverty Among Married-Couple vs Single-Parent Households in East Shore
| Children | Married-Couple Families | Single-Parent Households |
| No Children | 0 (0.0%) | 0 (0.0%) |
| 1 or 2 Children | 0 (0.0%) | 0 (0.0%) |
| 3 or 4 Children | 0 (0.0%) | 0 (0.0%) |
| 5 or more Children | 0 (0.0%) | 0 (0.0%) |
| Total | 0 (0.0%) | 0 (0.0%) |
Race in East Shore
The most populous races in East Shore are White / Caucasian (202 | 96.7%), and Two or more Races (7 | 3.4%).
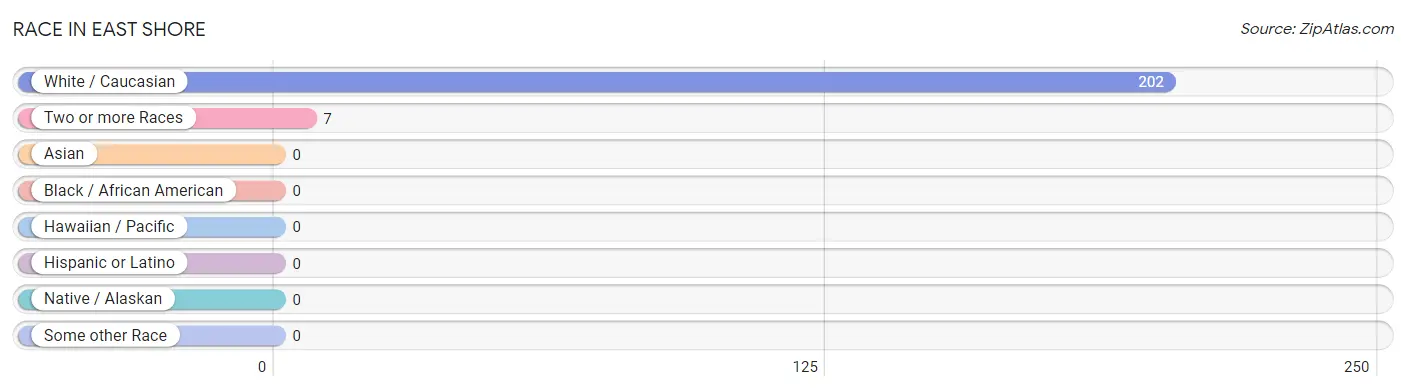
| Race | # Population | % Population |
| Asian | 0 | 0.0% |
| Black / African American | 0 | 0.0% |
| Hawaiian / Pacific | 0 | 0.0% |
| Hispanic or Latino | 0 | 0.0% |
| Native / Alaskan | 0 | 0.0% |
| White / Caucasian | 202 | 96.7% |
| Two or more Races | 7 | 3.4% |
| Some other Race | 0 | 0.0% |
| Total | 209 | 100.0% |
Ancestry in East Shore
The most populous ancestries reported in East Shore are German (147 | 70.3%), Irish (121 | 57.9%), Portuguese (14 | 6.7%), English (12 | 5.7%), and French (7 | 3.4%), together accounting for 144.0% of all East Shore residents.
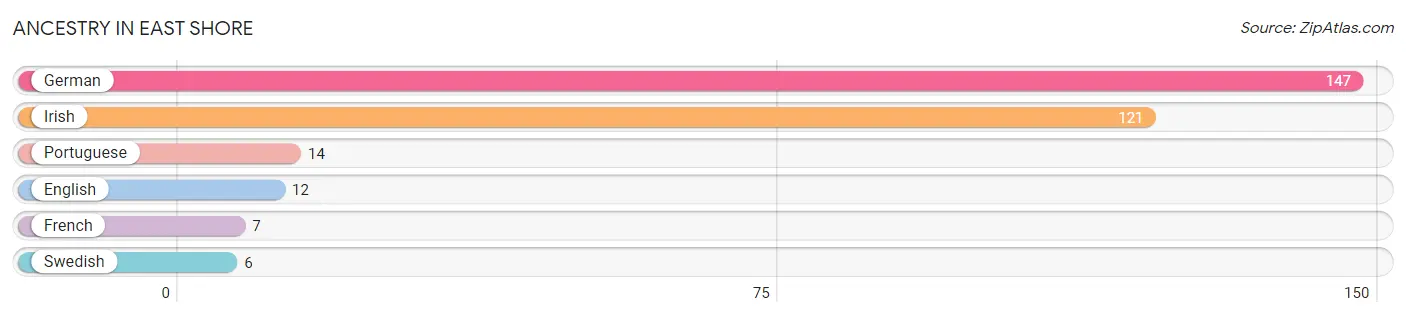
| Ancestry | # Population | % Population |
| English | 12 | 5.7% |
| French | 7 | 3.4% |
| German | 147 | 70.3% |
| Irish | 121 | 57.9% |
| Portuguese | 14 | 6.7% |
| Swedish | 6 | 2.9% | View All 6 Rows |
Immigrants in East Shore

| Immigration Origin | # Population | % Population | View All 0 Rows |
Sex and Age in East Shore
Sex and Age in East Shore
The most populous age groups in East Shore are 75 to 79 Years (25 | 44.6%) for men and 35 to 39 Years (49 | 32.0%) for women.
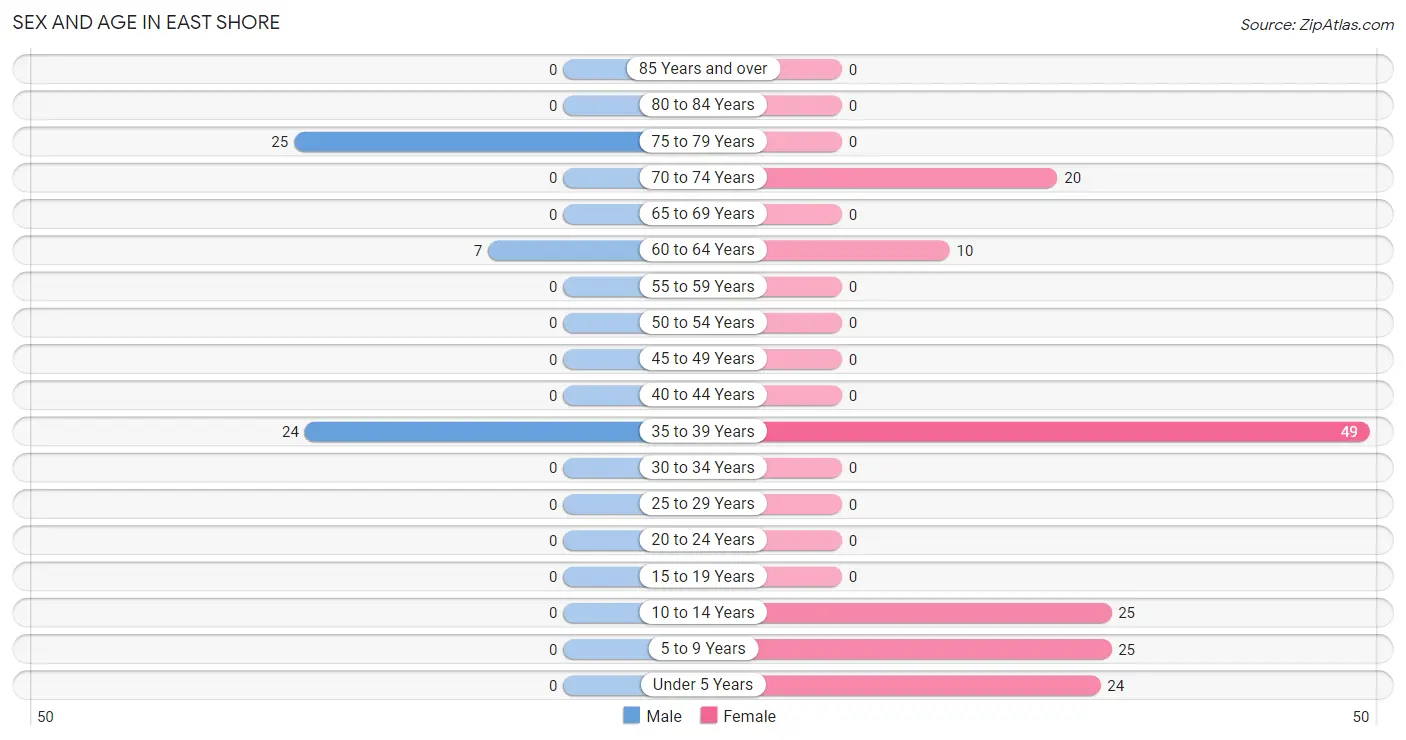
| Age Bracket | Male | Female |
| Under 5 Years | 0 (0.0%) | 24 (15.7%) |
| 5 to 9 Years | 0 (0.0%) | 25 (16.3%) |
| 10 to 14 Years | 0 (0.0%) | 25 (16.3%) |
| 15 to 19 Years | 0 (0.0%) | 0 (0.0%) |
| 20 to 24 Years | 0 (0.0%) | 0 (0.0%) |
| 25 to 29 Years | 0 (0.0%) | 0 (0.0%) |
| 30 to 34 Years | 0 (0.0%) | 0 (0.0%) |
| 35 to 39 Years | 24 (42.9%) | 49 (32.0%) |
| 40 to 44 Years | 0 (0.0%) | 0 (0.0%) |
| 45 to 49 Years | 0 (0.0%) | 0 (0.0%) |
| 50 to 54 Years | 0 (0.0%) | 0 (0.0%) |
| 55 to 59 Years | 0 (0.0%) | 0 (0.0%) |
| 60 to 64 Years | 7 (12.5%) | 10 (6.5%) |
| 65 to 69 Years | 0 (0.0%) | 0 (0.0%) |
| 70 to 74 Years | 0 (0.0%) | 20 (13.1%) |
| 75 to 79 Years | 25 (44.6%) | 0 (0.0%) |
| 80 to 84 Years | 0 (0.0%) | 0 (0.0%) |
| 85 Years and over | 0 (0.0%) | 0 (0.0%) |
| Total | 56 (100.0%) | 153 (100.0%) |
Families and Households in East Shore
Median Family Size in East Shore
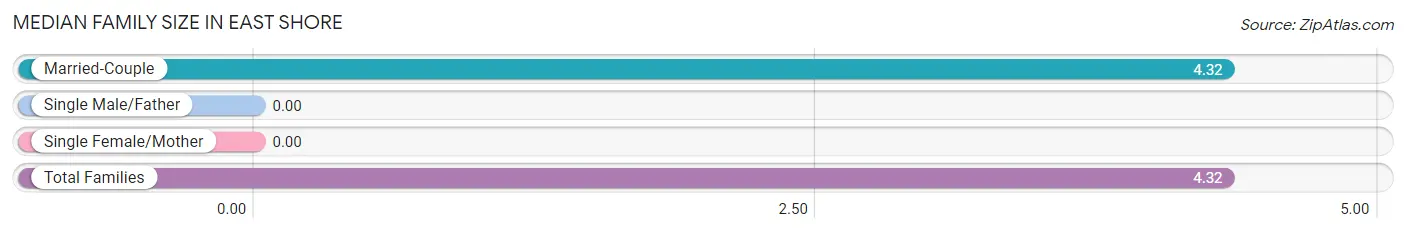
| Family Type | # Families | Family Size |
| Married-Couple | 37 (100.0%) | 4.32 |
| Single Male/Father | 0 (0.0%) | - |
| Single Female/Mother | 0 (0.0%) | - |
| Total Families | 37 (100.0%) | 4.32 |
Median Household Size in East Shore
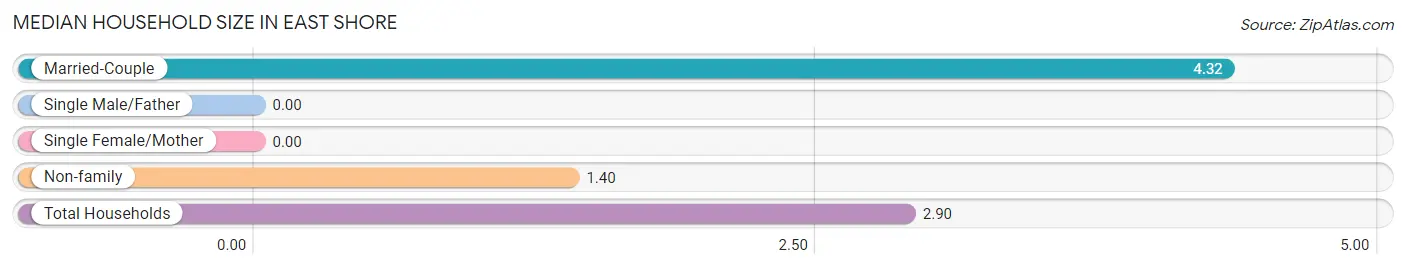
| Household Type | # Households | Household Size |
| Married-Couple | 37 (51.4%) | 4.32 |
| Single Male/Father | 0 (0.0%) | - |
| Single Female/Mother | 0 (0.0%) | - |
| Non-family | 35 (48.6%) | 1.40 |
| Total Households | 72 (100.0%) | 2.90 |
Household Size by Marriage Status in East Shore
Out of a total of 72 households in East Shore, 37 (51.4%) are family households, while 35 (48.6%) are nonfamily households. The most numerous type of family households are 5-person households, comprising 24, and the most common type of nonfamily households are 1-person households, comprising 20.
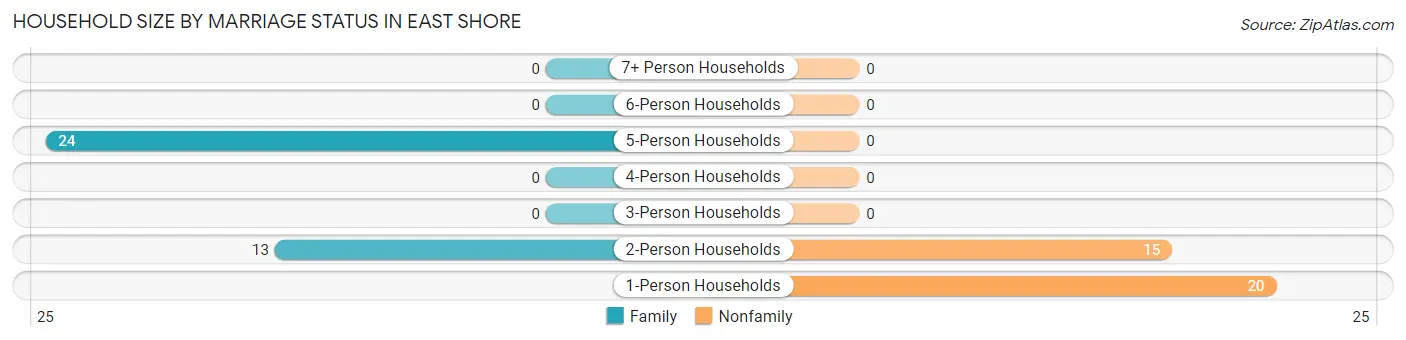
| Household Size | Family Households | Nonfamily Households |
| 1-Person Households | - | 20 (27.8%) |
| 2-Person Households | 13 (18.1%) | 15 (20.8%) |
| 3-Person Households | 0 (0.0%) | 0 (0.0%) |
| 4-Person Households | 0 (0.0%) | 0 (0.0%) |
| 5-Person Households | 24 (33.3%) | 0 (0.0%) |
| 6-Person Households | 0 (0.0%) | 0 (0.0%) |
| 7+ Person Households | 0 (0.0%) | 0 (0.0%) |
| Total | 37 (51.4%) | 35 (48.6%) |
Female Fertility in East Shore
Fertility by Age in East Shore
| Age Bracket | Women with Births | Births / 1,000 Women |
| 15 to 19 years | 0 (0.0%) | 0.0 |
| 20 to 34 years | 0 (0.0%) | 0.0 |
| 35 to 50 years | 0 (0.0%) | 0.0 |
| Total | 0 (0.0%) | 0.0 |
Fertility by Age by Marriage Status in East Shore
| Age Bracket | Married | Unmarried |
| 15 to 19 years | 0 (0.0%) | 0 (0.0%) |
| 20 to 34 years | 0 (0.0%) | 0 (0.0%) |
| 35 to 50 years | 0 (0.0%) | 0 (0.0%) |
| Total | 0 (0.0%) | 0 (0.0%) |
Fertility by Education in East Shore
| Educational Attainment | Women with Births | Births / 1,000 Women |
| Less than High School | 0 (0.0%) | 0.0 |
| High School Diploma | 0 (0.0%) | 0.0 |
| College or Associate's Degree | 0 (0.0%) | 0.0 |
| Bachelor's Degree | 0 (0.0%) | 0.0 |
| Graduate Degree | 0 (0.0%) | 0.0 |
| Total | 0 (0.0%) | 0.0 |
Fertility by Education by Marriage Status in East Shore
| Educational Attainment | Married | Unmarried |
| Less than High School | 0 (0.0%) | 0 (0.0%) |
| High School Diploma | 0 (0.0%) | 0 (0.0%) |
| College or Associate's Degree | 0 (0.0%) | 0 (0.0%) |
| Bachelor's Degree | 0 (0.0%) | 0 (0.0%) |
| Graduate Degree | 0 (0.0%) | 0 (0.0%) |
| Total | 0 (0.0%) | 0 (0.0%) |
Employment Characteristics in East Shore
Employment by Class of Employer in East Shore
Among the 34 employed individuals in East Shore, private company employees (27 | 79.4%), and self-employed (not incorporated) (7 | 20.6%) make up the most common classes of employment.
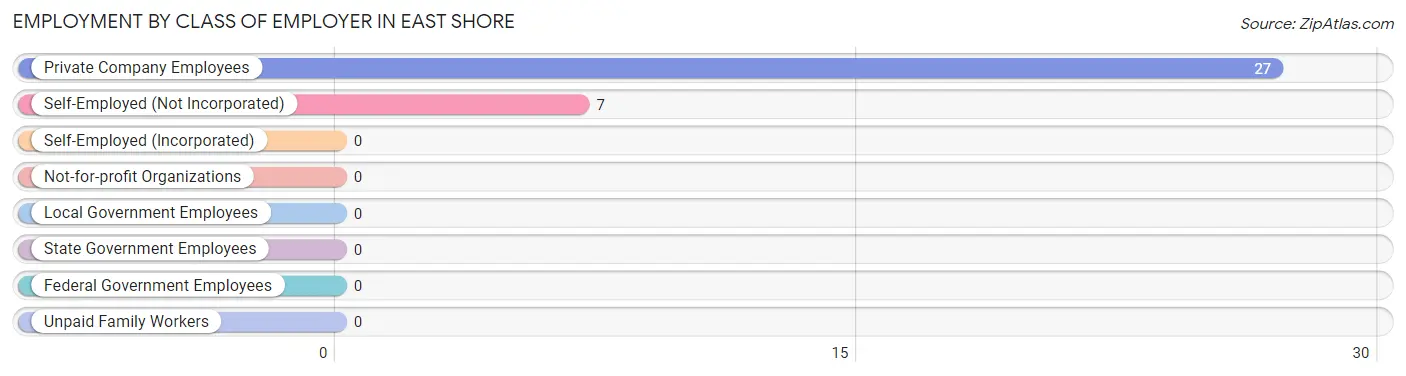
| Employer Class | # Employees | % Employees |
| Private Company Employees | 27 | 79.4% |
| Self-Employed (Incorporated) | 0 | 0.0% |
| Self-Employed (Not Incorporated) | 7 | 20.6% |
| Not-for-profit Organizations | 0 | 0.0% |
| Local Government Employees | 0 | 0.0% |
| State Government Employees | 0 | 0.0% |
| Federal Government Employees | 0 | 0.0% |
| Unpaid Family Workers | 0 | 0.0% |
| Total | 34 | 100.0% |
Employment Status by Age in East Shore
According to the labor force statistics for East Shore, out of the total population over 16 years of age (135), 34.1% or 46 individuals are in the labor force, with 26.1% or 12 of them unemployed. The age group with the highest labor force participation rate is 60 to 64 years, with 58.8% or 10 individuals in the labor force. Within the labor force, the 35 to 44 years age range has the highest percentage of unemployed individuals, with 33.3% or 12 of them being unemployed.
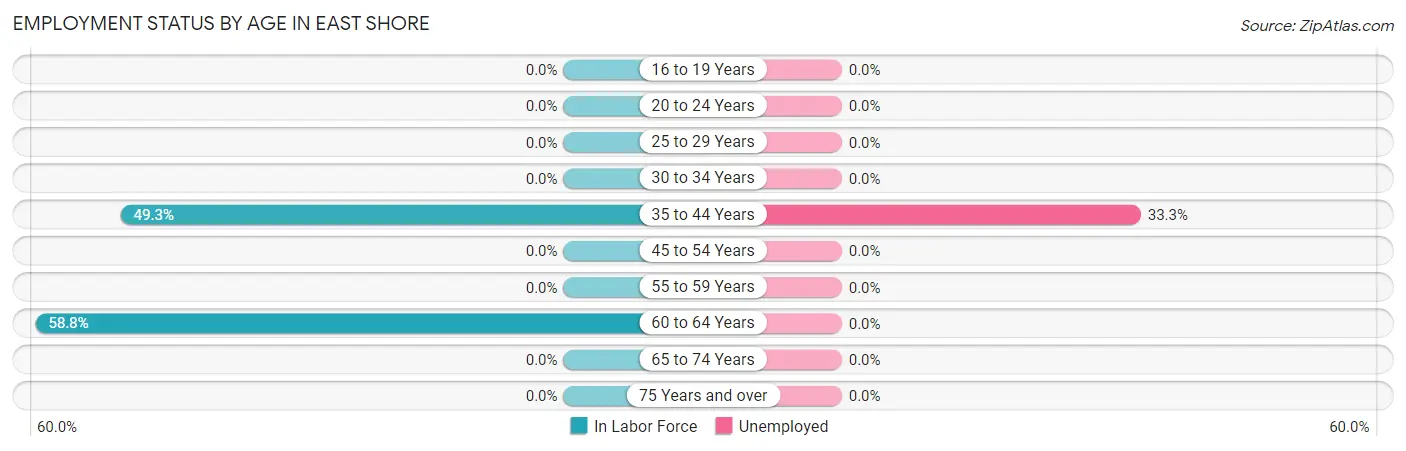
| Age Bracket | In Labor Force | Unemployed |
| 16 to 19 Years | 0 (0.0%) | 0 (0.0%) |
| 20 to 24 Years | 0 (0.0%) | 0 (0.0%) |
| 25 to 29 Years | 0 (0.0%) | 0 (0.0%) |
| 30 to 34 Years | 0 (0.0%) | 0 (0.0%) |
| 35 to 44 Years | 36 (49.3%) | 12 (33.3%) |
| 45 to 54 Years | 0 (0.0%) | 0 (0.0%) |
| 55 to 59 Years | 0 (0.0%) | 0 (0.0%) |
| 60 to 64 Years | 10 (58.8%) | 0 (0.0%) |
| 65 to 74 Years | 0 (0.0%) | 0 (0.0%) |
| 75 Years and over | 0 (0.0%) | 0 (0.0%) |
| Total | 46 (34.1%) | 12 (26.1%) |
Employment Status by Educational Attainment in East Shore
According to labor force statistics for East Shore, 51.1% of individuals (46) out of the total population between 25 and 64 years of age (90) are in the labor force, with 26.1% or 12 of them being unemployed. The group with the highest labor force participation rate are those with the educational attainment of bachelor's degree or higher, with 63.2% or 12 individuals in the labor force. Within the labor force, individuals with bachelor's degree or higher education have the highest percentage of unemployment, with 100.0% or 12 of them being unemployed.
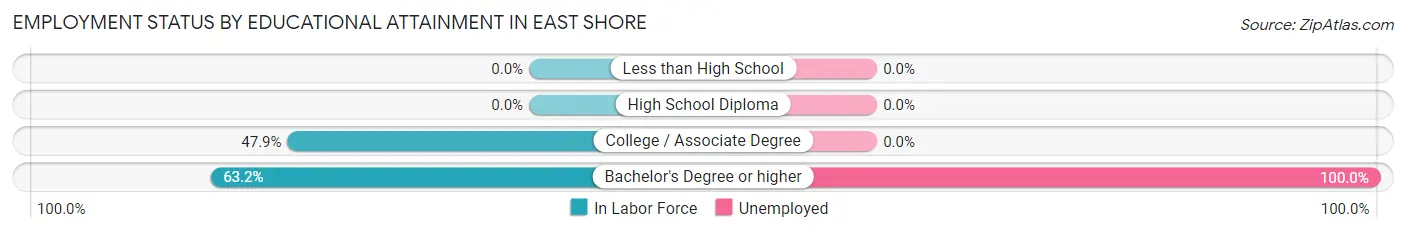
| Educational Attainment | In Labor Force | Unemployed |
| Less than High School | 0 (0.0%) | 0 (0.0%) |
| High School Diploma | 0 (0.0%) | 0 (0.0%) |
| College / Associate Degree | 34 (47.9%) | 0 (0.0%) |
| Bachelor's Degree or higher | 12 (63.2%) | 19 (100.0%) |
| Total | 46 (51.1%) | 23 (26.1%) |
Employment Occupations by Sex in East Shore
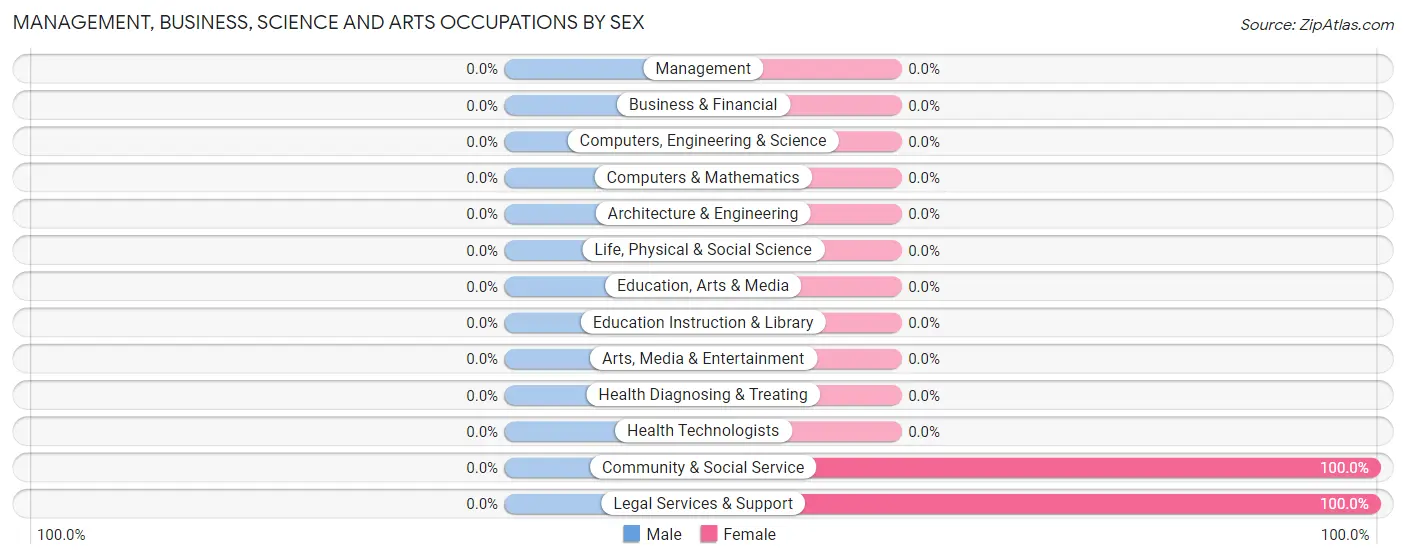
Management, Business, Science and Arts Occupations
The most common Management, Business, Science and Arts occupations in East Shore are Community & Social Service (3 | 8.8%), and Legal Services & Support (3 | 8.8%).
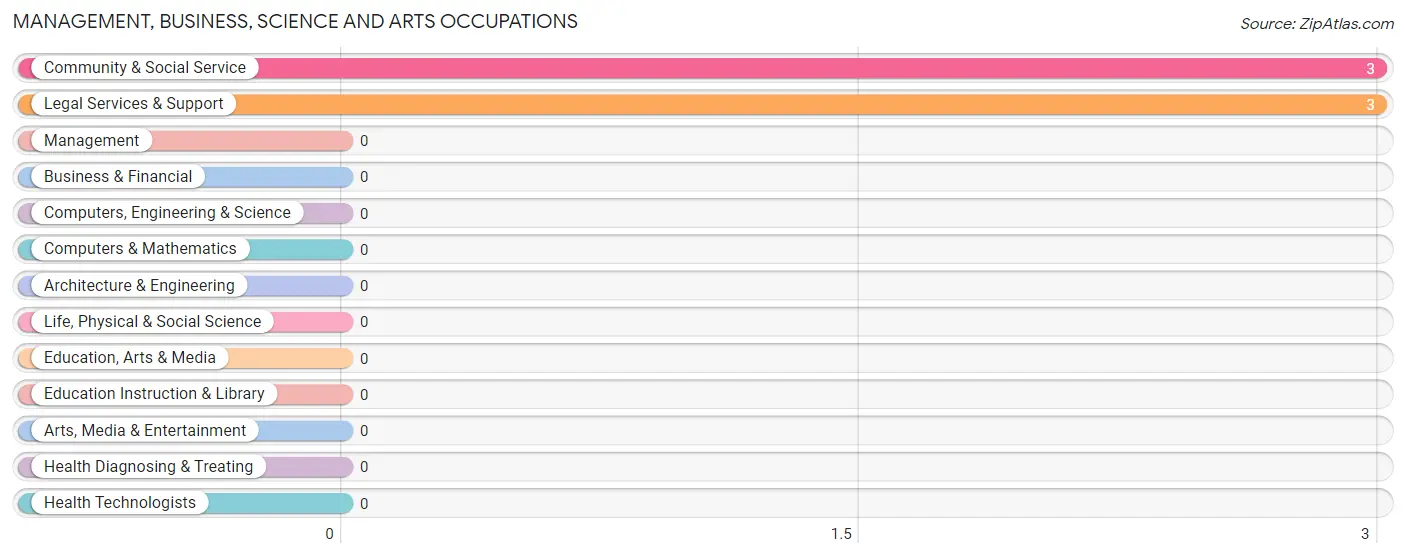
Management, Business, Science and Arts Occupations by Sex
| Occupation | Male | Female |
| Management | 0 (0.0%) | 0 (0.0%) |
| Business & Financial | 0 (0.0%) | 0 (0.0%) |
| Computers, Engineering & Science | 0 (0.0%) | 0 (0.0%) |
| Computers & Mathematics | 0 (0.0%) | 0 (0.0%) |
| Architecture & Engineering | 0 (0.0%) | 0 (0.0%) |
| Life, Physical & Social Science | 0 (0.0%) | 0 (0.0%) |
| Community & Social Service | 0 (0.0%) | 3 (100.0%) |
| Education, Arts & Media | 0 (0.0%) | 0 (0.0%) |
| Legal Services & Support | 0 (0.0%) | 3 (100.0%) |
| Education Instruction & Library | 0 (0.0%) | 0 (0.0%) |
| Arts, Media & Entertainment | 0 (0.0%) | 0 (0.0%) |
| Health Diagnosing & Treating | 0 (0.0%) | 0 (0.0%) |
| Health Technologists | 0 (0.0%) | 0 (0.0%) |
| Total (Category) | 0 (0.0%) | 3 (100.0%) |
| Total (Overall) | 24 (70.6%) | 10 (29.4%) |
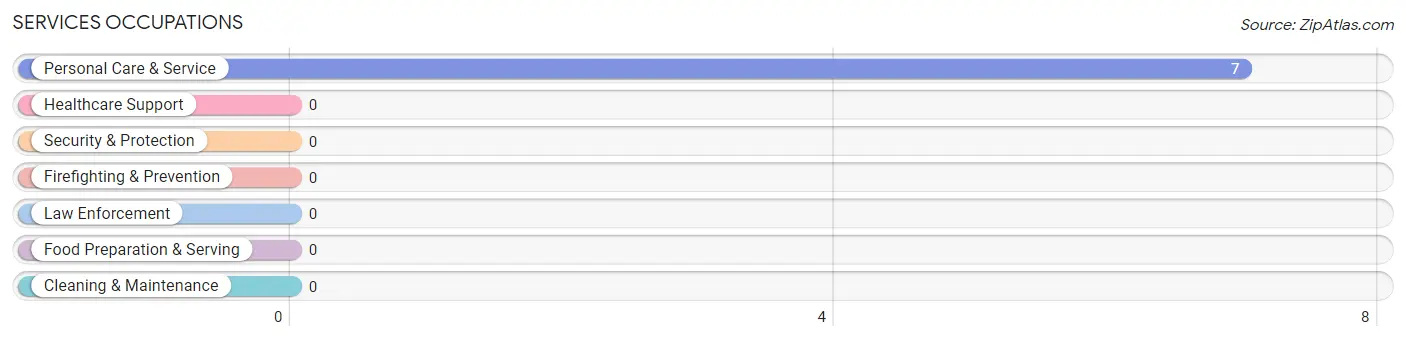
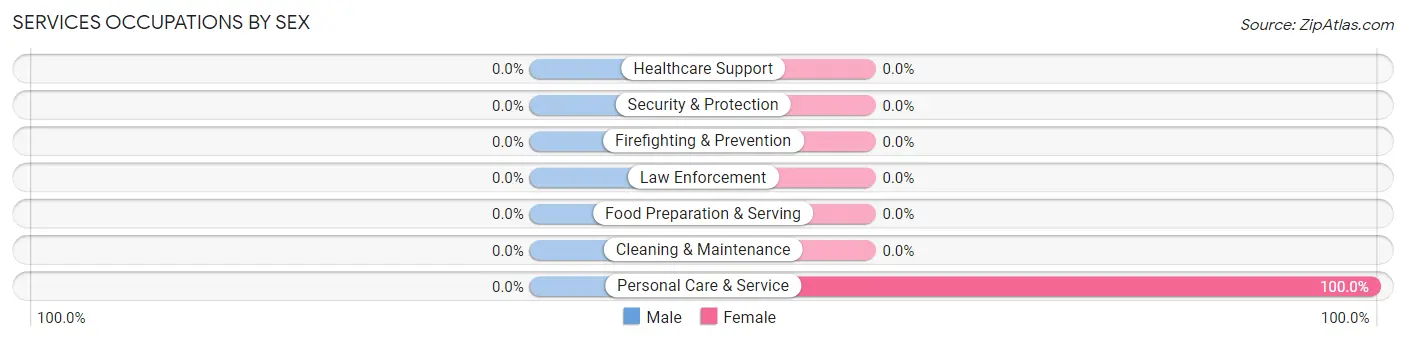
Services Occupations
The most common Services occupations in East Shore are , and Personal Care & Service (7 | 20.6%).
Services Occupations by Sex
| Occupation | Male | Female |
| Healthcare Support | 0 (0.0%) | 0 (0.0%) |
| Security & Protection | 0 (0.0%) | 0 (0.0%) |
| Firefighting & Prevention | 0 (0.0%) | 0 (0.0%) |
| Law Enforcement | 0 (0.0%) | 0 (0.0%) |
| Food Preparation & Serving | 0 (0.0%) | 0 (0.0%) |
| Cleaning & Maintenance | 0 (0.0%) | 0 (0.0%) |
| Personal Care & Service | 0 (0.0%) | 7 (100.0%) |
| Total (Category) | 0 (0.0%) | 7 (100.0%) |
| Total (Overall) | 24 (70.6%) | 10 (29.4%) |
Sales and Office Occupations
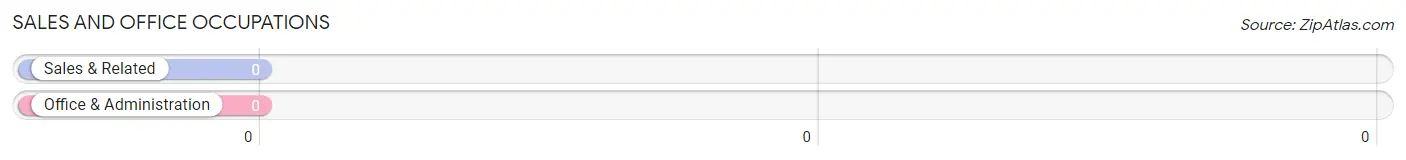
Sales and Office Occupations by Sex
| Occupation | Male | Female |
| Sales & Related | 0 (0.0%) | 0 (0.0%) |
| Office & Administration | 0 (0.0%) | 0 (0.0%) |
| Total (Category) | 0 (0.0%) | 0 (0.0%) |
| Total (Overall) | 24 (70.6%) | 10 (29.4%) |
Natural Resources, Construction and Maintenance Occupations
The most common Natural Resources, Construction and Maintenance occupations in East Shore are , and Construction & Extraction (24 | 70.6%).
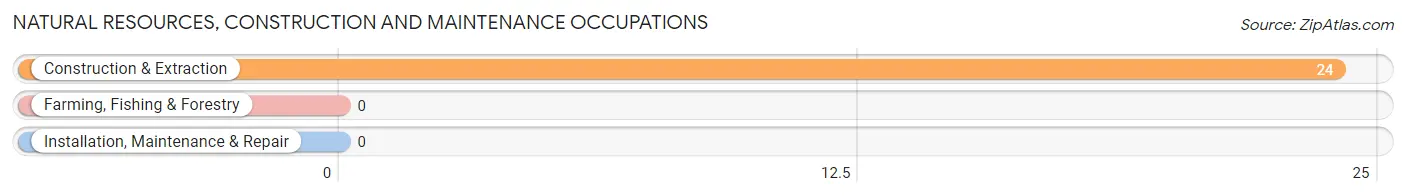
Natural Resources, Construction and Maintenance Occupations by Sex
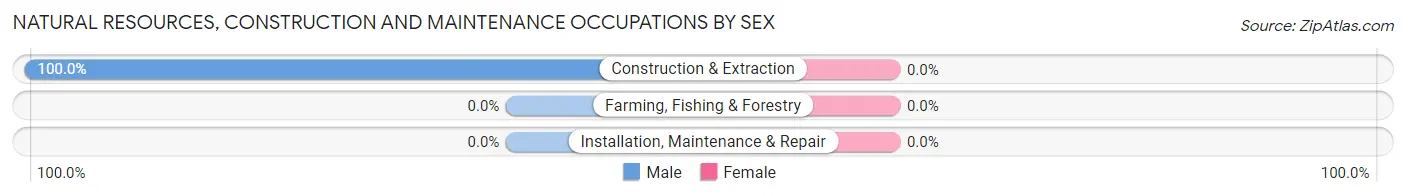
| Occupation | Male | Female |
| Farming, Fishing & Forestry | 0 (0.0%) | 0 (0.0%) |
| Construction & Extraction | 24 (100.0%) | 0 (0.0%) |
| Installation, Maintenance & Repair | 0 (0.0%) | 0 (0.0%) |
| Total (Category) | 24 (100.0%) | 0 (0.0%) |
| Total (Overall) | 24 (70.6%) | 10 (29.4%) |
Production, Transportation and Moving Occupations
Production, Transportation and Moving Occupations by Sex
| Occupation | Male | Female |
| Production | 0 (0.0%) | 0 (0.0%) |
| Transportation | 0 (0.0%) | 0 (0.0%) |
| Material Moving | 0 (0.0%) | 0 (0.0%) |
| Total (Category) | 0 (0.0%) | 0 (0.0%) |
| Total (Overall) | 24 (70.6%) | 10 (29.4%) |
Employment Industries by Sex in East Shore
Employment Industries in East Shore
The major employment industries in East Shore include Construction (24 | 70.6%), and Professional & Scientific (3 | 8.8%).
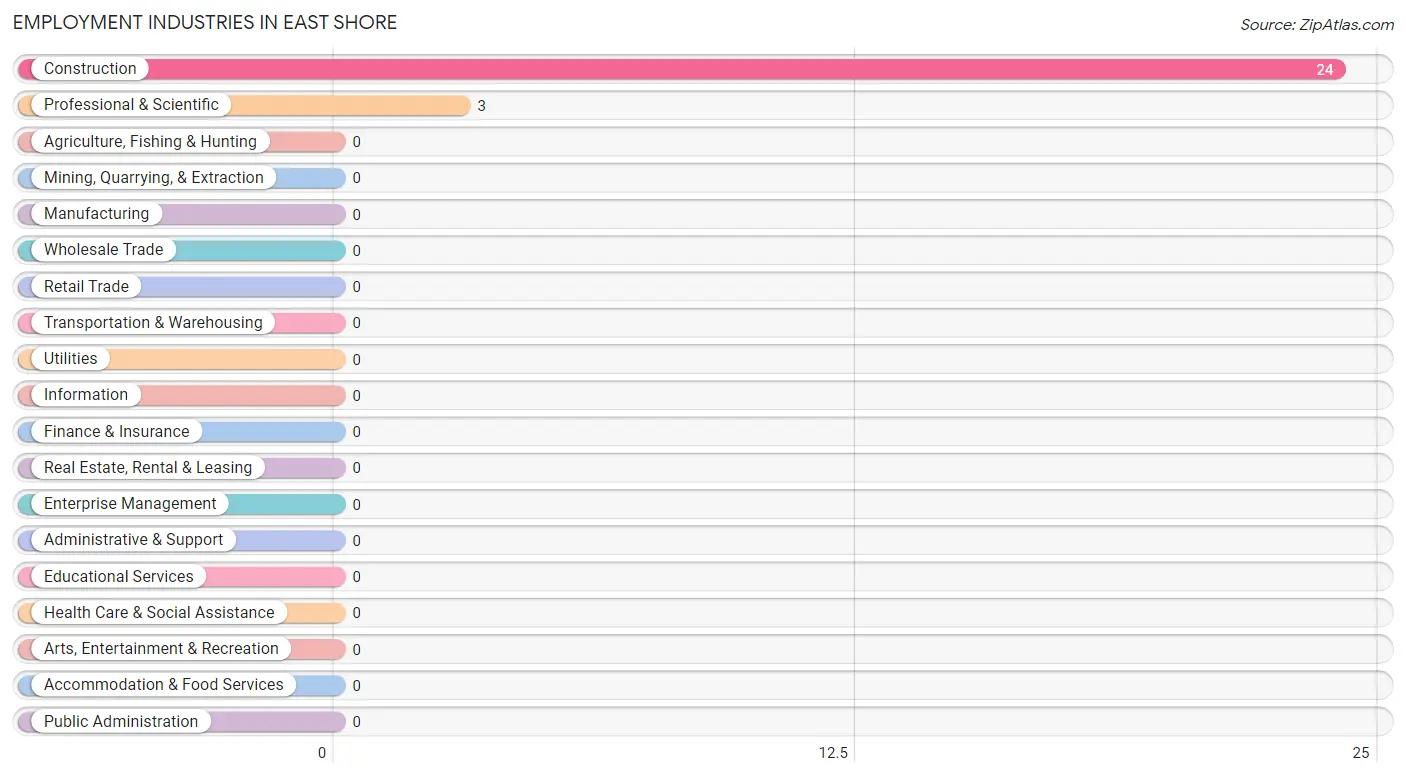
Employment Industries by Sex in East Shore
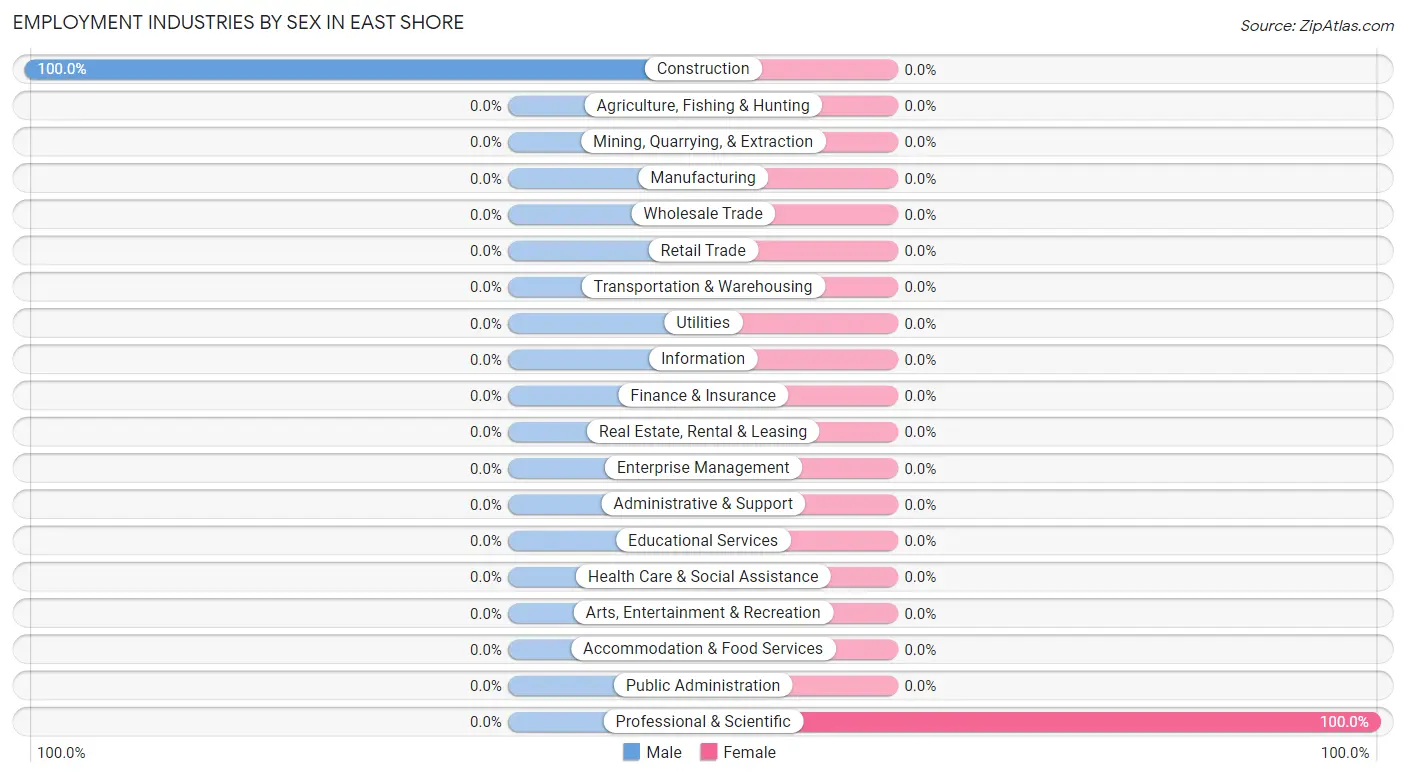
| Industry | Male | Female |
| Agriculture, Fishing & Hunting | 0 (0.0%) | 0 (0.0%) |
| Mining, Quarrying, & Extraction | 0 (0.0%) | 0 (0.0%) |
| Construction | 24 (100.0%) | 0 (0.0%) |
| Manufacturing | 0 (0.0%) | 0 (0.0%) |
| Wholesale Trade | 0 (0.0%) | 0 (0.0%) |
| Retail Trade | 0 (0.0%) | 0 (0.0%) |
| Transportation & Warehousing | 0 (0.0%) | 0 (0.0%) |
| Utilities | 0 (0.0%) | 0 (0.0%) |
| Information | 0 (0.0%) | 0 (0.0%) |
| Finance & Insurance | 0 (0.0%) | 0 (0.0%) |
| Real Estate, Rental & Leasing | 0 (0.0%) | 0 (0.0%) |
| Professional & Scientific | 0 (0.0%) | 3 (100.0%) |
| Enterprise Management | 0 (0.0%) | 0 (0.0%) |
| Administrative & Support | 0 (0.0%) | 0 (0.0%) |
| Educational Services | 0 (0.0%) | 0 (0.0%) |
| Health Care & Social Assistance | 0 (0.0%) | 0 (0.0%) |
| Arts, Entertainment & Recreation | 0 (0.0%) | 0 (0.0%) |
| Accommodation & Food Services | 0 (0.0%) | 0 (0.0%) |
| Public Administration | 0 (0.0%) | 0 (0.0%) |
| Total | 24 (70.6%) | 10 (29.4%) |
Education in East Shore
School Enrollment in East Shore
The most common levels of schooling among the 62 students in East Shore are elementary school (25 | 40.3%), middle school (25 | 40.3%), and college / undergraduate (12 | 19.4%).
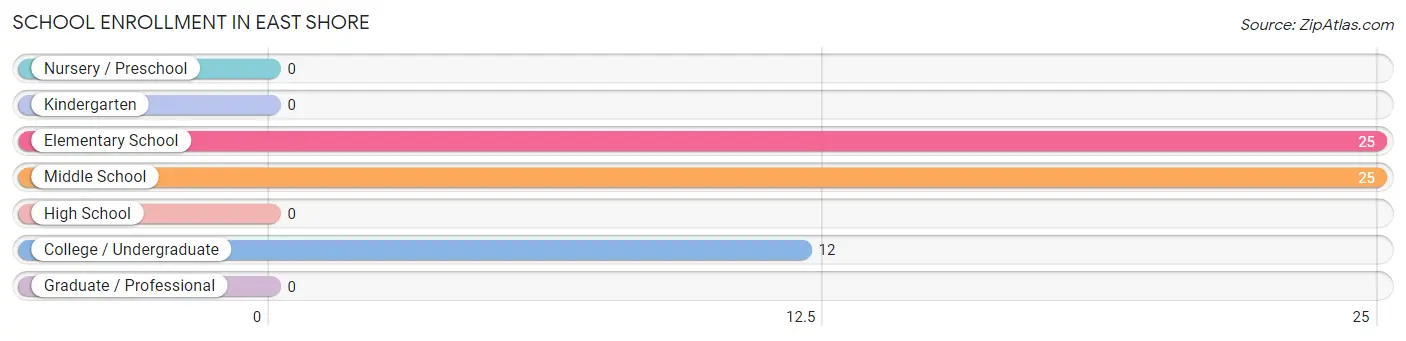
| School Level | # Students | % Students |
| Nursery / Preschool | 0 | 0.0% |
| Kindergarten | 0 | 0.0% |
| Elementary School | 25 | 40.3% |
| Middle School | 25 | 40.3% |
| High School | 0 | 0.0% |
| College / Undergraduate | 12 | 19.4% |
| Graduate / Professional | 0 | 0.0% |
| Total | 62 | 100.0% |
School Enrollment by Age by Funding Source in East Shore
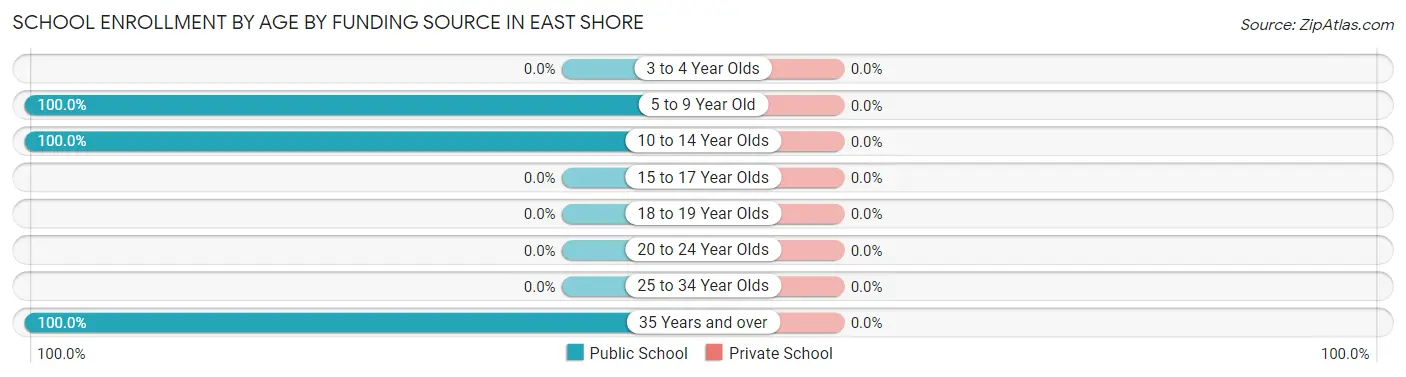
| Age Bracket | Public School | Private School |
| 3 to 4 Year Olds | 0 (0.0%) | 0 (0.0%) |
| 5 to 9 Year Old | 25 (100.0%) | 0 (0.0%) |
| 10 to 14 Year Olds | 25 (100.0%) | 0 (0.0%) |
| 15 to 17 Year Olds | 0 (0.0%) | 0 (0.0%) |
| 18 to 19 Year Olds | 0 (0.0%) | 0 (0.0%) |
| 20 to 24 Year Olds | 0 (0.0%) | 0 (0.0%) |
| 25 to 34 Year Olds | 0 (0.0%) | 0 (0.0%) |
| 35 Years and over | 12 (100.0%) | 0 (0.0%) |
| Total | 62 (100.0%) | 0 (0.0%) |
Educational Attainment by Field of Study in East Shore
Bio, nature & agricultural (19 | 35.8%), education (19 | 35.8%), and business (15 | 28.3%) are the most common fields of study among 53 individuals in East Shore who have obtained a bachelor's degree or higher.
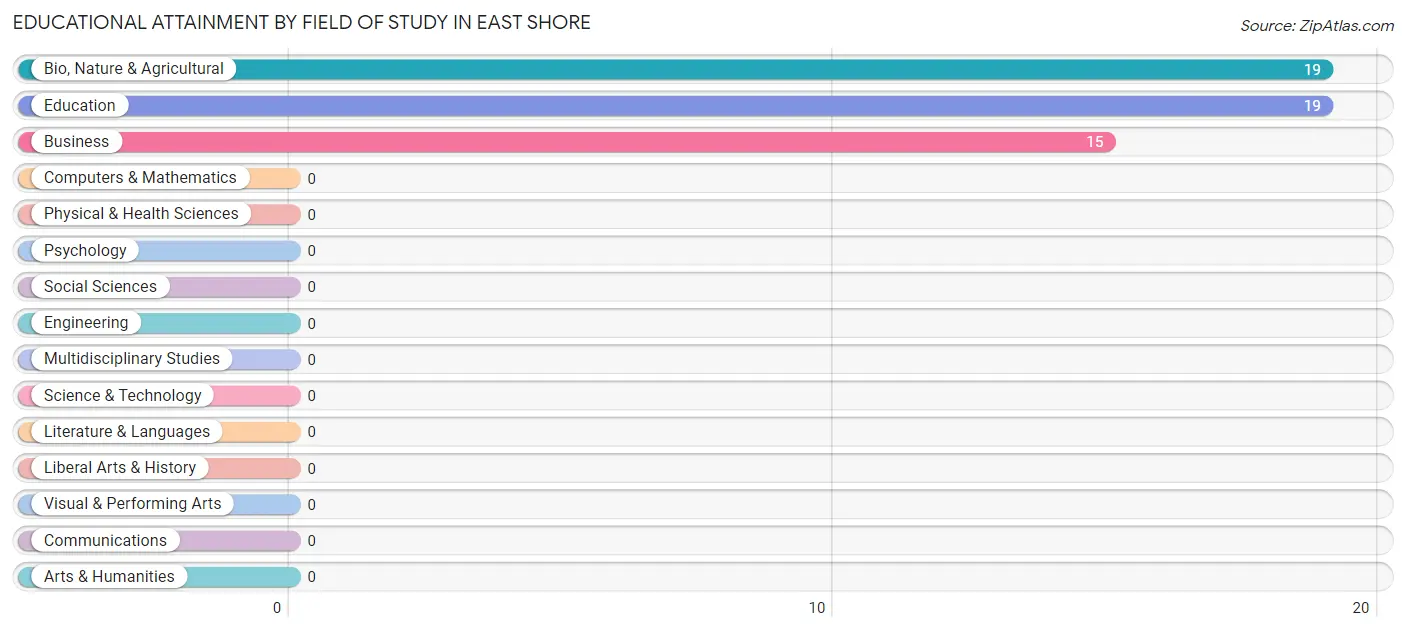
| Field of Study | # Graduates | % Graduates |
| Computers & Mathematics | 0 | 0.0% |
| Bio, Nature & Agricultural | 19 | 35.8% |
| Physical & Health Sciences | 0 | 0.0% |
| Psychology | 0 | 0.0% |
| Social Sciences | 0 | 0.0% |
| Engineering | 0 | 0.0% |
| Multidisciplinary Studies | 0 | 0.0% |
| Science & Technology | 0 | 0.0% |
| Business | 15 | 28.3% |
| Education | 19 | 35.8% |
| Literature & Languages | 0 | 0.0% |
| Liberal Arts & History | 0 | 0.0% |
| Visual & Performing Arts | 0 | 0.0% |
| Communications | 0 | 0.0% |
| Arts & Humanities | 0 | 0.0% |
| Total | 53 | 100.0% |
Transportation & Commute in East Shore
Vehicle Availability by Sex in East Shore
The most prevalent vehicle ownership categories in East Shore are males with 4 vehicles (24, accounting for 100.0%) and females with 4 vehicles (0, making up 240.0%).
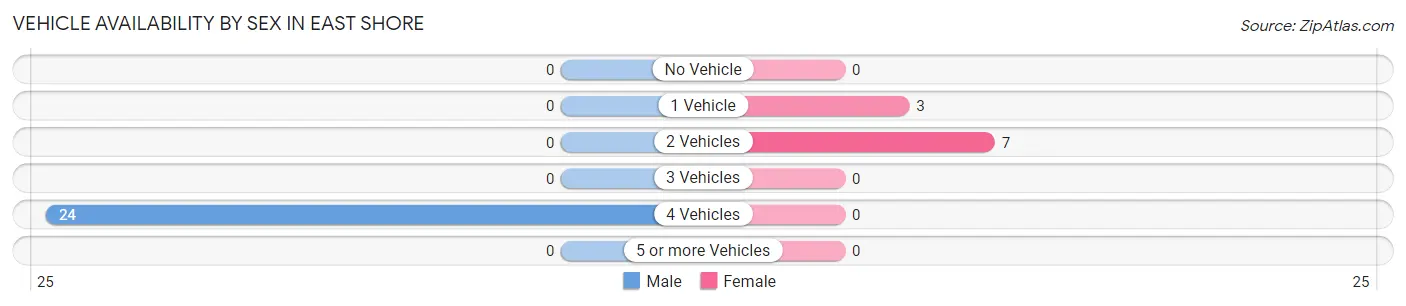
| Vehicles Available | Male | Female |
| No Vehicle | 0 (0.0%) | 0 (0.0%) |
| 1 Vehicle | 0 (0.0%) | 3 (30.0%) |
| 2 Vehicles | 0 (0.0%) | 7 (70.0%) |
| 3 Vehicles | 0 (0.0%) | 0 (0.0%) |
| 4 Vehicles | 24 (100.0%) | 0 (0.0%) |
| 5 or more Vehicles | 0 (0.0%) | 0 (0.0%) |
| Total | 24 (100.0%) | 10 (100.0%) |
Commute Time in East Shore
The most frequently occuring commute durations in East Shore are 45 to 59 minutes (24 commuters, 70.6%), 5 to 9 minutes (7 commuters, 20.6%), and 40 to 44 minutes (3 commuters, 8.8%).
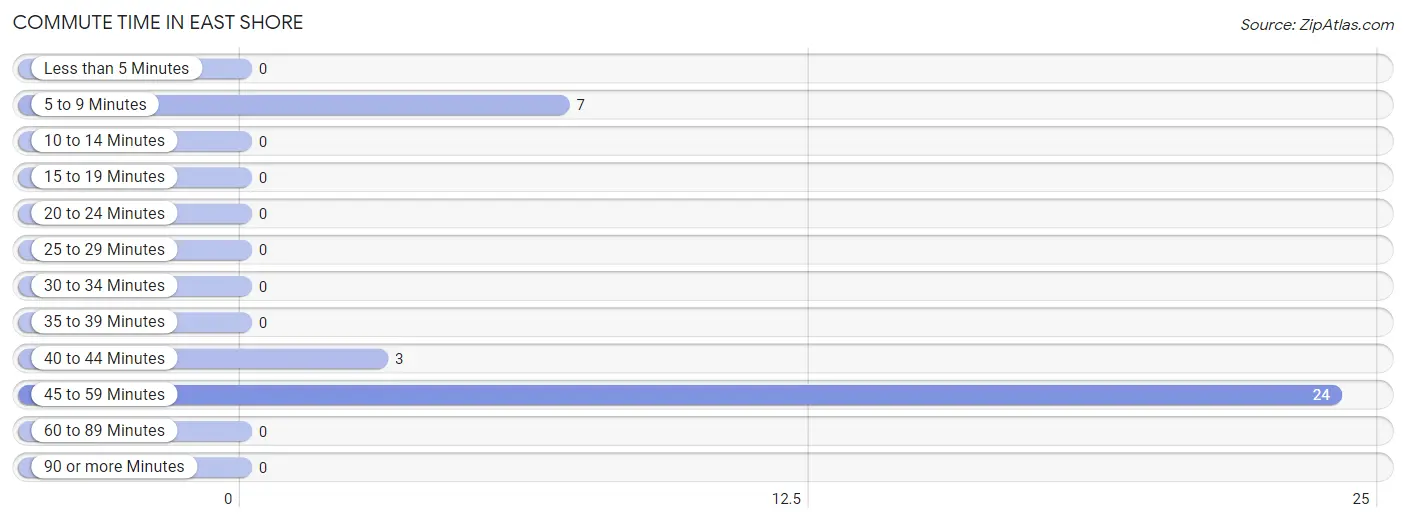
| Commute Time | # Commuters | % Commuters |
| Less than 5 Minutes | 0 | 0.0% |
| 5 to 9 Minutes | 7 | 20.6% |
| 10 to 14 Minutes | 0 | 0.0% |
| 15 to 19 Minutes | 0 | 0.0% |
| 20 to 24 Minutes | 0 | 0.0% |
| 25 to 29 Minutes | 0 | 0.0% |
| 30 to 34 Minutes | 0 | 0.0% |
| 35 to 39 Minutes | 0 | 0.0% |
| 40 to 44 Minutes | 3 | 8.8% |
| 45 to 59 Minutes | 24 | 70.6% |
| 60 to 89 Minutes | 0 | 0.0% |
| 90 or more Minutes | 0 | 0.0% |
Commute Time by Sex in East Shore
The most common commute times in East Shore are 45 to 59 minutes (24 commuters, 100.0%) for males and 5 to 9 minutes (7 commuters, 70.0%) for females.
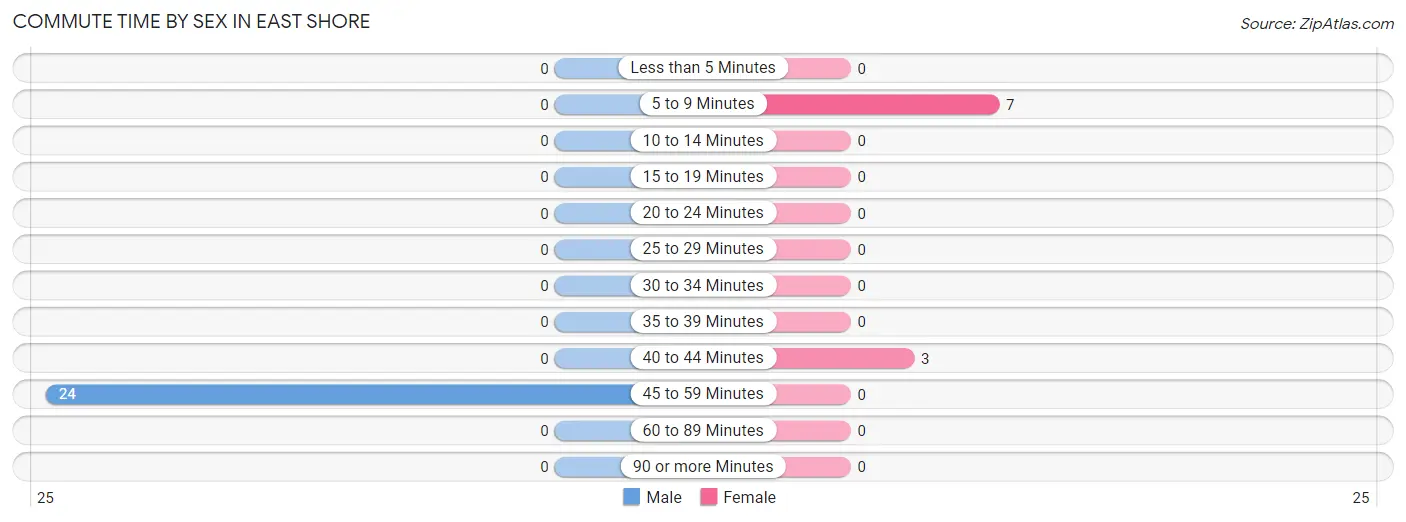
| Commute Time | Male | Female |
| Less than 5 Minutes | 0 (0.0%) | 0 (0.0%) |
| 5 to 9 Minutes | 0 (0.0%) | 7 (70.0%) |
| 10 to 14 Minutes | 0 (0.0%) | 0 (0.0%) |
| 15 to 19 Minutes | 0 (0.0%) | 0 (0.0%) |
| 20 to 24 Minutes | 0 (0.0%) | 0 (0.0%) |
| 25 to 29 Minutes | 0 (0.0%) | 0 (0.0%) |
| 30 to 34 Minutes | 0 (0.0%) | 0 (0.0%) |
| 35 to 39 Minutes | 0 (0.0%) | 0 (0.0%) |
| 40 to 44 Minutes | 0 (0.0%) | 3 (30.0%) |
| 45 to 59 Minutes | 24 (100.0%) | 0 (0.0%) |
| 60 to 89 Minutes | 0 (0.0%) | 0 (0.0%) |
| 90 or more Minutes | 0 (0.0%) | 0 (0.0%) |
Time of Departure to Work by Sex in East Shore
The most frequent times of departure to work in East Shore are 12:00 AM to 4:59 AM (24, 100.0%) for males and 8:30 AM to 8:59 AM (7, 70.0%) for females.
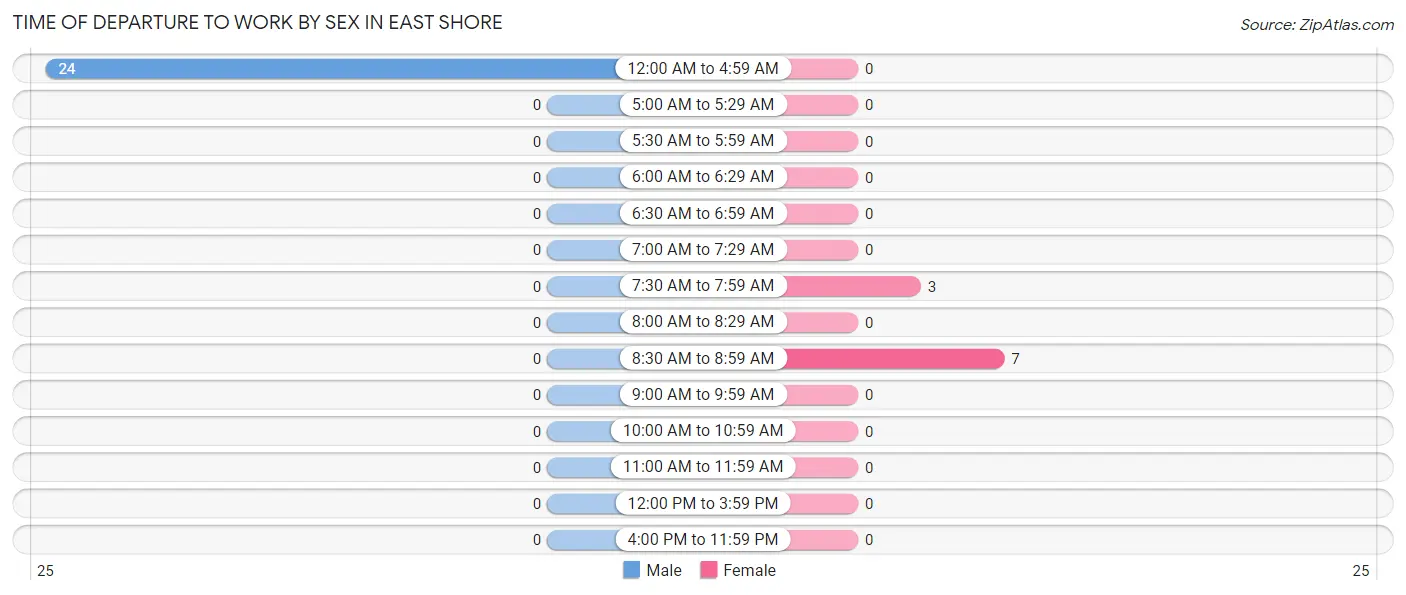
| Time of Departure | Male | Female |
| 12:00 AM to 4:59 AM | 24 (100.0%) | 0 (0.0%) |
| 5:00 AM to 5:29 AM | 0 (0.0%) | 0 (0.0%) |
| 5:30 AM to 5:59 AM | 0 (0.0%) | 0 (0.0%) |
| 6:00 AM to 6:29 AM | 0 (0.0%) | 0 (0.0%) |
| 6:30 AM to 6:59 AM | 0 (0.0%) | 0 (0.0%) |
| 7:00 AM to 7:29 AM | 0 (0.0%) | 0 (0.0%) |
| 7:30 AM to 7:59 AM | 0 (0.0%) | 3 (30.0%) |
| 8:00 AM to 8:29 AM | 0 (0.0%) | 0 (0.0%) |
| 8:30 AM to 8:59 AM | 0 (0.0%) | 7 (70.0%) |
| 9:00 AM to 9:59 AM | 0 (0.0%) | 0 (0.0%) |
| 10:00 AM to 10:59 AM | 0 (0.0%) | 0 (0.0%) |
| 11:00 AM to 11:59 AM | 0 (0.0%) | 0 (0.0%) |
| 12:00 PM to 3:59 PM | 0 (0.0%) | 0 (0.0%) |
| 4:00 PM to 11:59 PM | 0 (0.0%) | 0 (0.0%) |
| Total | 24 (100.0%) | 10 (100.0%) |
Housing Occupancy in East Shore
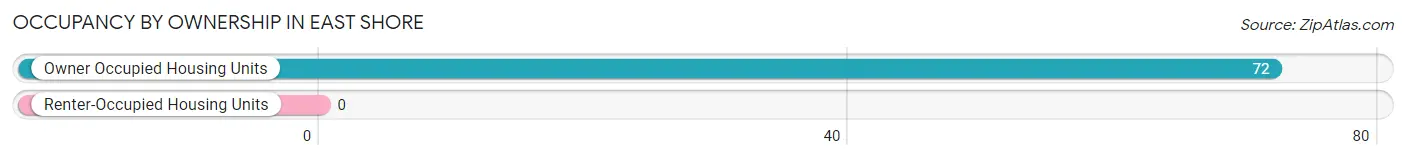
Occupancy by Ownership in East Shore
Of the total 72 dwellings in East Shore, owner-occupied units account for 72 (100.0%), while renter-occupied units make up 0 (0.0%).
| Occupancy | # Housing Units | % Housing Units |
| Owner Occupied Housing Units | 72 | 100.0% |
| Renter-Occupied Housing Units | 0 | 0.0% |
| Total Occupied Housing Units | 72 | 100.0% |
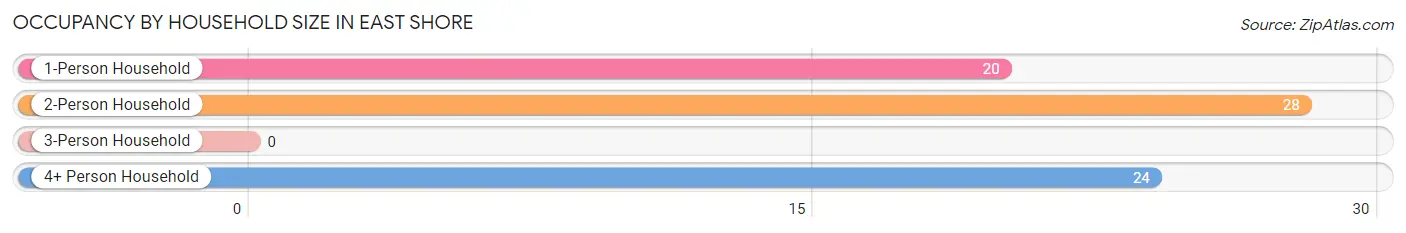
Occupancy by Household Size in East Shore
| Household Size | # Housing Units | % Housing Units |
| 1-Person Household | 20 | 27.8% |
| 2-Person Household | 28 | 38.9% |
| 3-Person Household | 0 | 0.0% |
| 4+ Person Household | 24 | 33.3% |
| Total Housing Units | 72 | 100.0% |
Occupancy by Ownership by Household Size in East Shore
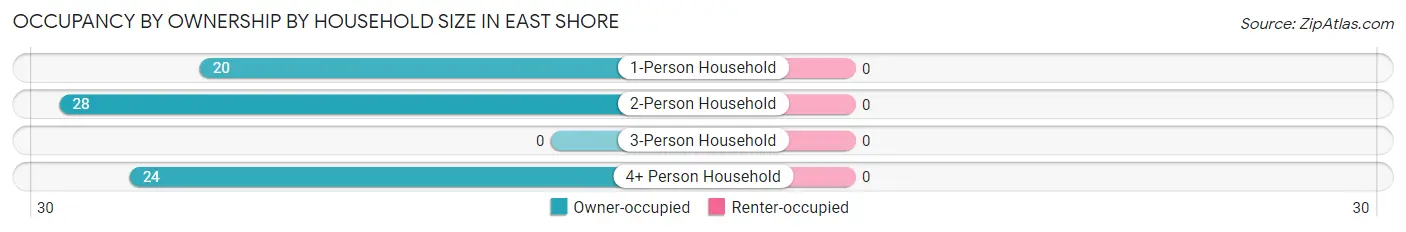
| Household Size | Owner-occupied | Renter-occupied |
| 1-Person Household | 20 (100.0%) | 0 (0.0%) |
| 2-Person Household | 28 (100.0%) | 0 (0.0%) |
| 3-Person Household | 0 (0.0%) | 0 (0.0%) |
| 4+ Person Household | 24 (100.0%) | 0 (0.0%) |
| Total Housing Units | 72 (100.0%) | 0 (0.0%) |
Occupancy by Educational Attainment in East Shore
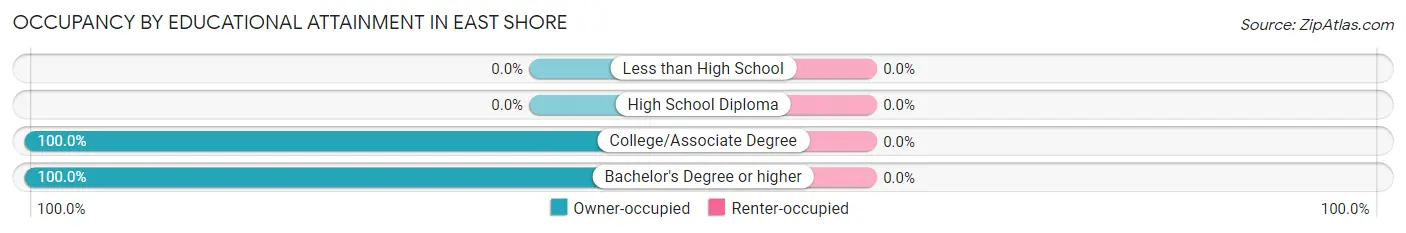
| Household Size | Owner-occupied | Renter-occupied |
| Less than High School | 0 (0.0%) | 0 (0.0%) |
| High School Diploma | 0 (0.0%) | 0 (0.0%) |
| College/Associate Degree | 33 (100.0%) | 0 (0.0%) |
| Bachelor's Degree or higher | 39 (100.0%) | 0 (0.0%) |
Occupancy by Age of Householder in East Shore
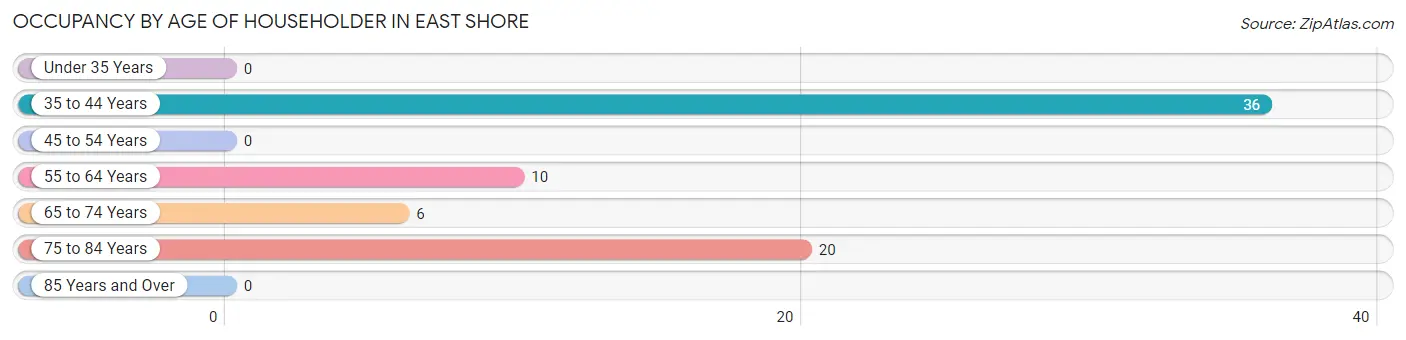
| Age Bracket | # Households | % Households |
| Under 35 Years | 0 | 0.0% |
| 35 to 44 Years | 36 | 50.0% |
| 45 to 54 Years | 0 | 0.0% |
| 55 to 64 Years | 10 | 13.9% |
| 65 to 74 Years | 6 | 8.3% |
| 75 to 84 Years | 20 | 27.8% |
| 85 Years and Over | 0 | 0.0% |
| Total | 72 | 100.0% |
Housing Finances in East Shore
Median Income by Occupancy in East Shore
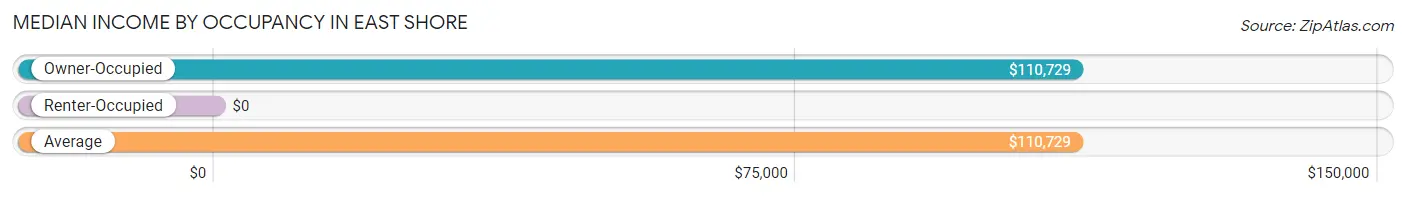
| Occupancy Type | # Households | Median Income |
| Owner-Occupied | 72 (100.0%) | $110,729 |
| Renter-Occupied | 0 (0.0%) | $0 |
| Average | 72 (100.0%) | $110,729 |
Occupancy by Householder Income Bracket in East Shore
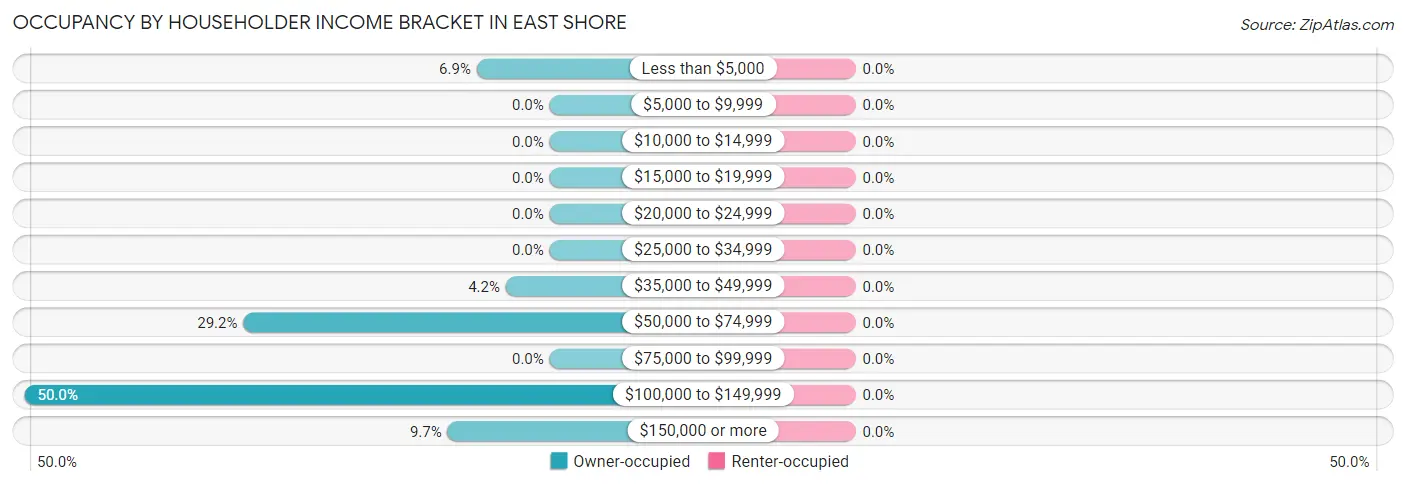
| Income Bracket | Owner-occupied | Renter-occupied |
| Less than $5,000 | 5 (6.9%) | 0 (0.0%) |
| $5,000 to $9,999 | 0 (0.0%) | 0 (0.0%) |
| $10,000 to $14,999 | 0 (0.0%) | 0 (0.0%) |
| $15,000 to $19,999 | 0 (0.0%) | 0 (0.0%) |
| $20,000 to $24,999 | 0 (0.0%) | 0 (0.0%) |
| $25,000 to $34,999 | 0 (0.0%) | 0 (0.0%) |
| $35,000 to $49,999 | 3 (4.2%) | 0 (0.0%) |
| $50,000 to $74,999 | 21 (29.2%) | 0 (0.0%) |
| $75,000 to $99,999 | 0 (0.0%) | 0 (0.0%) |
| $100,000 to $149,999 | 36 (50.0%) | 0 (0.0%) |
| $150,000 or more | 7 (9.7%) | 0 (0.0%) |
| Total | 72 (100.0%) | 0 (0.0%) |
Monthly Housing Cost Tiers in East Shore
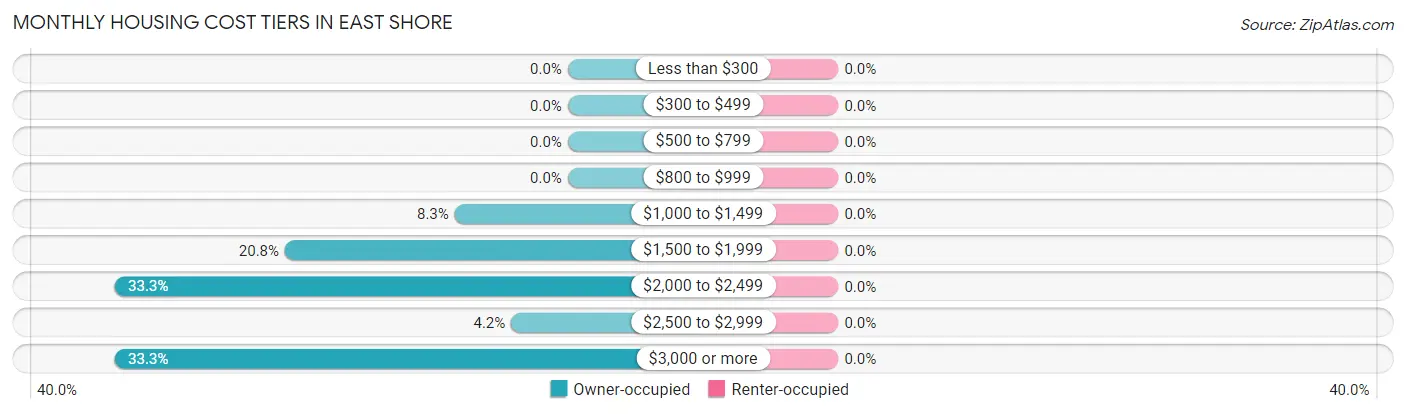
| Monthly Cost | Owner-occupied | Renter-occupied |
| Less than $300 | 0 (0.0%) | 0 (0.0%) |
| $300 to $499 | 0 (0.0%) | 0 (0.0%) |
| $500 to $799 | 0 (0.0%) | 0 (0.0%) |
| $800 to $999 | 0 (0.0%) | 0 (0.0%) |
| $1,000 to $1,499 | 6 (8.3%) | 0 (0.0%) |
| $1,500 to $1,999 | 15 (20.8%) | 0 (0.0%) |
| $2,000 to $2,499 | 24 (33.3%) | 0 (0.0%) |
| $2,500 to $2,999 | 3 (4.2%) | 0 (0.0%) |
| $3,000 or more | 24 (33.3%) | 0 (0.0%) |
| Total | 72 (100.0%) | 0 (0.0%) |
Physical Housing Characteristics in East Shore
Housing Structures in East Shore
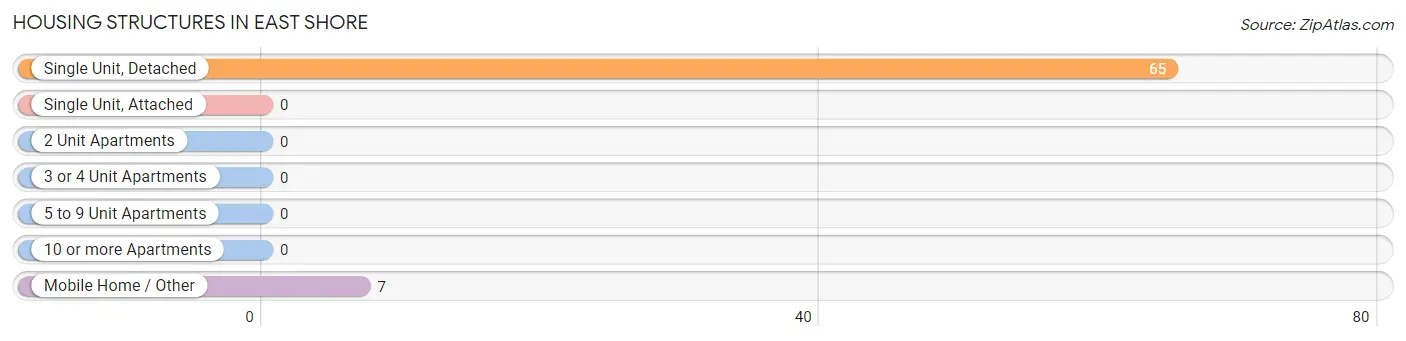
| Structure Type | # Housing Units | % Housing Units |
| Single Unit, Detached | 65 | 90.3% |
| Single Unit, Attached | 0 | 0.0% |
| 2 Unit Apartments | 0 | 0.0% |
| 3 or 4 Unit Apartments | 0 | 0.0% |
| 5 to 9 Unit Apartments | 0 | 0.0% |
| 10 or more Apartments | 0 | 0.0% |
| Mobile Home / Other | 7 | 9.7% |
| Total | 72 | 100.0% |
Housing Structures by Occupancy in East Shore
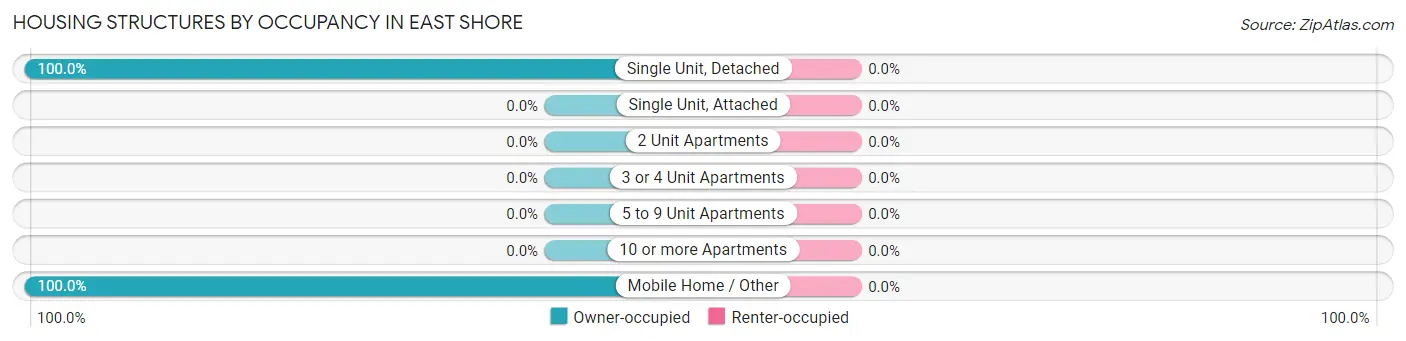
| Structure Type | Owner-occupied | Renter-occupied |
| Single Unit, Detached | 65 (100.0%) | 0 (0.0%) |
| Single Unit, Attached | 0 (0.0%) | 0 (0.0%) |
| 2 Unit Apartments | 0 (0.0%) | 0 (0.0%) |
| 3 or 4 Unit Apartments | 0 (0.0%) | 0 (0.0%) |
| 5 to 9 Unit Apartments | 0 (0.0%) | 0 (0.0%) |
| 10 or more Apartments | 0 (0.0%) | 0 (0.0%) |
| Mobile Home / Other | 7 (100.0%) | 0 (0.0%) |
| Total | 72 (100.0%) | 0 (0.0%) |
Housing Structures by Number of Rooms in East Shore
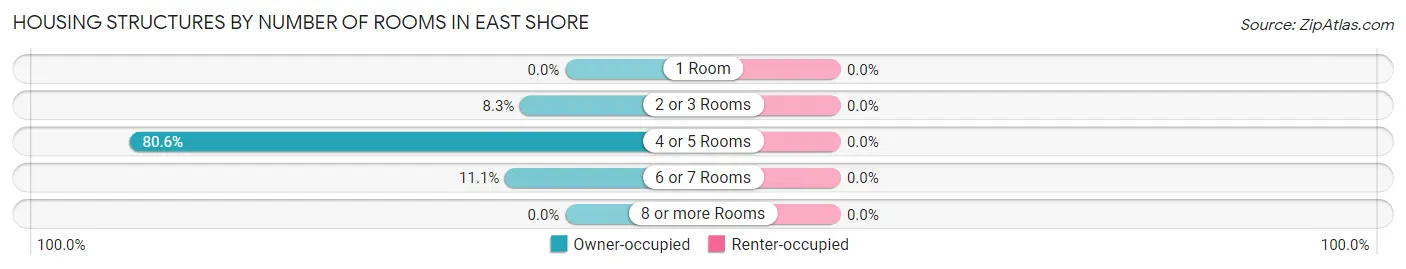
| Number of Rooms | Owner-occupied | Renter-occupied |
| 1 Room | 0 (0.0%) | 0 (0.0%) |
| 2 or 3 Rooms | 6 (8.3%) | 0 (0.0%) |
| 4 or 5 Rooms | 58 (80.6%) | 0 (0.0%) |
| 6 or 7 Rooms | 8 (11.1%) | 0 (0.0%) |
| 8 or more Rooms | 0 (0.0%) | 0 (0.0%) |
| Total | 72 (100.0%) | 0 (0.0%) |
Housing Structure by Heating Type in East Shore
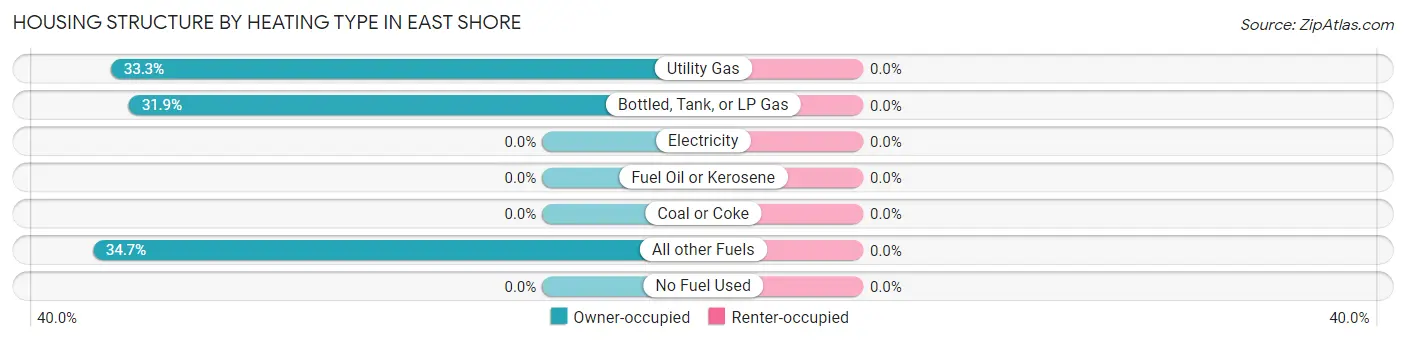
| Heating Type | Owner-occupied | Renter-occupied |
| Utility Gas | 24 (33.3%) | 0 (0.0%) |
| Bottled, Tank, or LP Gas | 23 (31.9%) | 0 (0.0%) |
| Electricity | 0 (0.0%) | 0 (0.0%) |
| Fuel Oil or Kerosene | 0 (0.0%) | 0 (0.0%) |
| Coal or Coke | 0 (0.0%) | 0 (0.0%) |
| All other Fuels | 25 (34.7%) | 0 (0.0%) |
| No Fuel Used | 0 (0.0%) | 0 (0.0%) |
| Total | 72 (100.0%) | 0 (0.0%) |
Household Vehicle Usage in East Shore
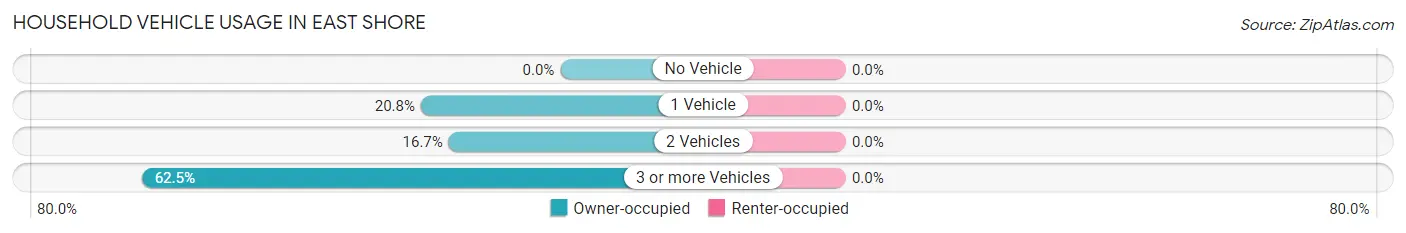
| Vehicles per Household | Owner-occupied | Renter-occupied |
| No Vehicle | 0 (0.0%) | 0 (0.0%) |
| 1 Vehicle | 15 (20.8%) | 0 (0.0%) |
| 2 Vehicles | 12 (16.7%) | 0 (0.0%) |
| 3 or more Vehicles | 45 (62.5%) | 0 (0.0%) |
| Total | 72 (100.0%) | 0 (0.0%) |
Real Estate & Mortgages in East Shore
Real Estate and Mortgage Overview in East Shore
| Characteristic | Without Mortgage | With Mortgage |
| Housing Units | 6 | 66 |
| Median Property Value | - | - |
| Median Household Income | - | - |
| Monthly Housing Costs | - | - |
| Real Estate Taxes | - | - |
Property Value by Mortgage Status in East Shore
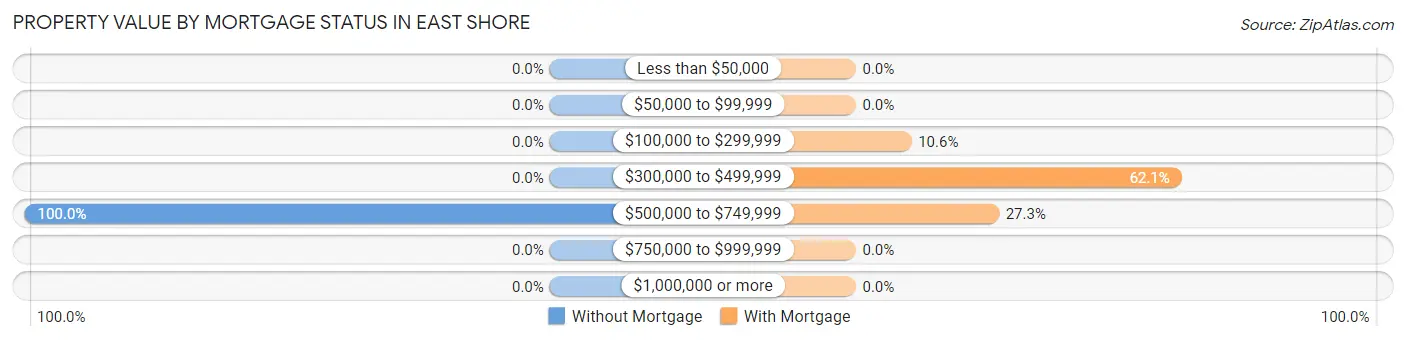
| Property Value | Without Mortgage | With Mortgage |
| Less than $50,000 | 0 (0.0%) | 0 (0.0%) |
| $50,000 to $99,999 | 0 (0.0%) | 0 (0.0%) |
| $100,000 to $299,999 | 0 (0.0%) | 7 (10.6%) |
| $300,000 to $499,999 | 0 (0.0%) | 41 (62.1%) |
| $500,000 to $749,999 | 6 (100.0%) | 18 (27.3%) |
| $750,000 to $999,999 | 0 (0.0%) | 0 (0.0%) |
| $1,000,000 or more | 0 (0.0%) | 0 (0.0%) |
| Total | 6 (100.0%) | 66 (100.0%) |
Household Income by Mortgage Status in East Shore
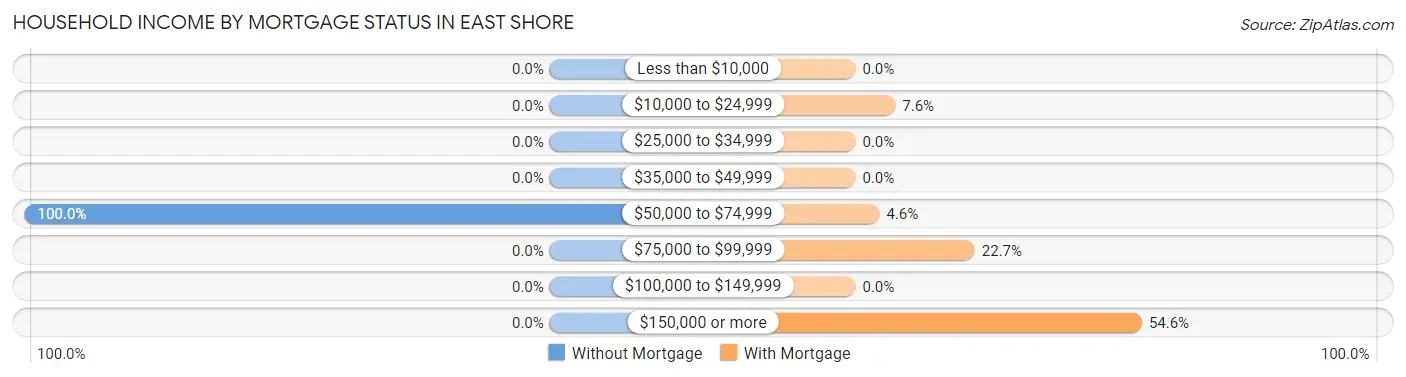
| Household Income | Without Mortgage | With Mortgage |
| Less than $10,000 | 0 (0.0%) | 0 (0.0%) |
| $10,000 to $24,999 | 0 (0.0%) | 5 (7.6%) |
| $25,000 to $34,999 | 0 (0.0%) | 0 (0.0%) |
| $35,000 to $49,999 | 0 (0.0%) | 0 (0.0%) |
| $50,000 to $74,999 | 6 (100.0%) | 3 (4.5%) |
| $75,000 to $99,999 | 0 (0.0%) | 15 (22.7%) |
| $100,000 to $149,999 | 0 (0.0%) | 0 (0.0%) |
| $150,000 or more | 0 (0.0%) | 36 (54.5%) |
| Total | 6 (100.0%) | 66 (100.0%) |
Property Value to Household Income Ratio in East Shore
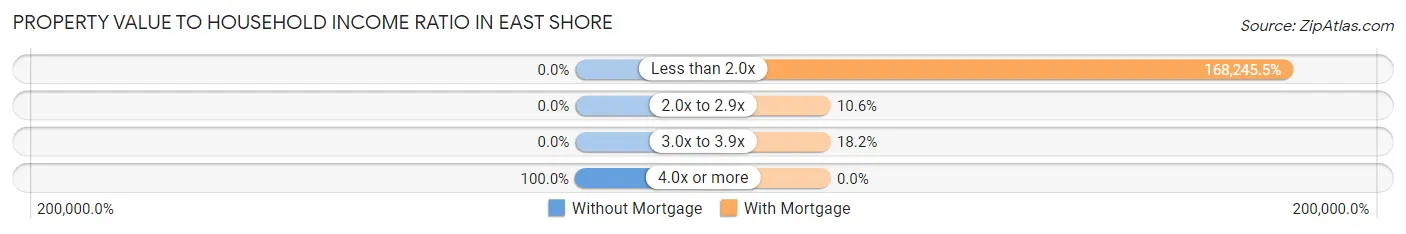
| Value-to-Income Ratio | Without Mortgage | With Mortgage |
| Less than 2.0x | 0 (0.0%) | 111,042 (168,245.5%) |
| 2.0x to 2.9x | 0 (0.0%) | 7 (10.6%) |
| 3.0x to 3.9x | 0 (0.0%) | 12 (18.2%) |
| 4.0x or more | 6 (100.0%) | 0 (0.0%) |
| Total | 6 (100.0%) | 66 (100.0%) |
Real Estate Taxes by Mortgage Status in East Shore
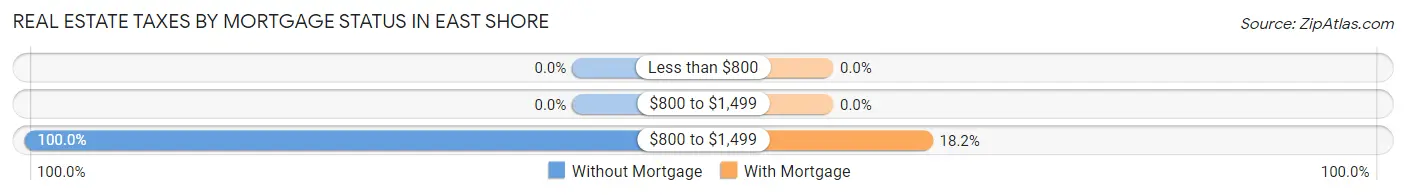
| Property Taxes | Without Mortgage | With Mortgage |
| Less than $800 | 0 (0.0%) | 0 (0.0%) |
| $800 to $1,499 | 0 (0.0%) | 0 (0.0%) |
| $800 to $1,499 | 6 (100.0%) | 12 (18.2%) |
| Total | 6 (100.0%) | 66 (100.0%) |
Health & Disability in East Shore
Health Insurance Coverage by Age in East Shore
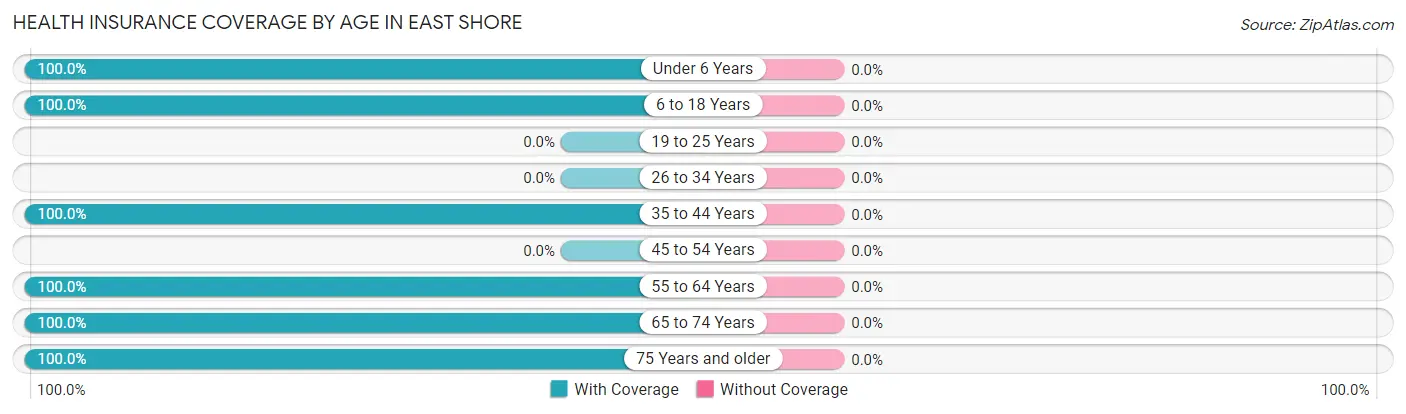
| Age Bracket | With Coverage | Without Coverage |
| Under 6 Years | 24 (100.0%) | 0 (0.0%) |
| 6 to 18 Years | 50 (100.0%) | 0 (0.0%) |
| 19 to 25 Years | 0 (0.0%) | 0 (0.0%) |
| 26 to 34 Years | 0 (0.0%) | 0 (0.0%) |
| 35 to 44 Years | 73 (100.0%) | 0 (0.0%) |
| 45 to 54 Years | 0 (0.0%) | 0 (0.0%) |
| 55 to 64 Years | 17 (100.0%) | 0 (0.0%) |
| 65 to 74 Years | 20 (100.0%) | 0 (0.0%) |
| 75 Years and older | 25 (100.0%) | 0 (0.0%) |
| Total | 209 (100.0%) | 0 (0.0%) |
Health Insurance Coverage by Citizenship Status in East Shore
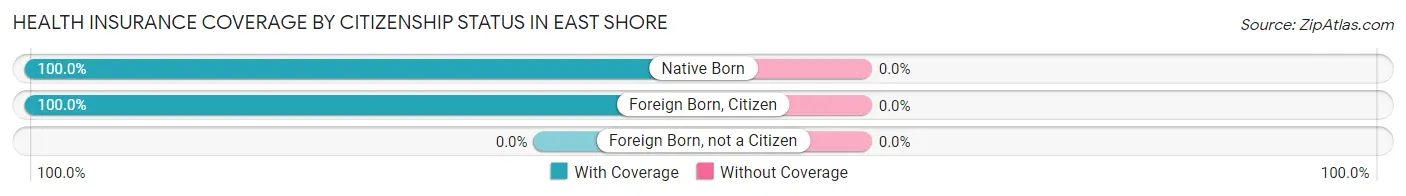
| Citizenship Status | With Coverage | Without Coverage |
| Native Born | 24 (100.0%) | 0 (0.0%) |
| Foreign Born, Citizen | 50 (100.0%) | 0 (0.0%) |
| Foreign Born, not a Citizen | 0 (0.0%) | 0 (0.0%) |
Health Insurance Coverage by Household Income in East Shore
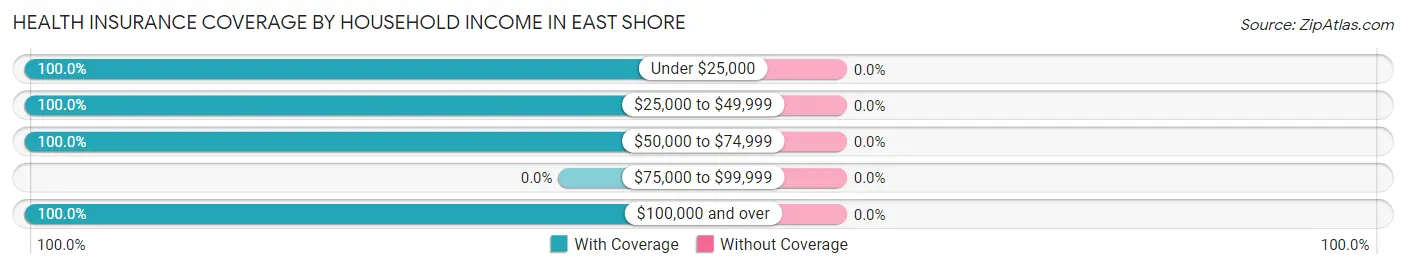
| Household Income | With Coverage | Without Coverage |
| Under $25,000 | 5 (100.0%) | 0 (0.0%) |
| $25,000 to $49,999 | 3 (100.0%) | 0 (0.0%) |
| $50,000 to $74,999 | 40 (100.0%) | 0 (0.0%) |
| $75,000 to $99,999 | 0 (0.0%) | 0 (0.0%) |
| $100,000 and over | 161 (100.0%) | 0 (0.0%) |
Public vs Private Health Insurance Coverage by Age in East Shore
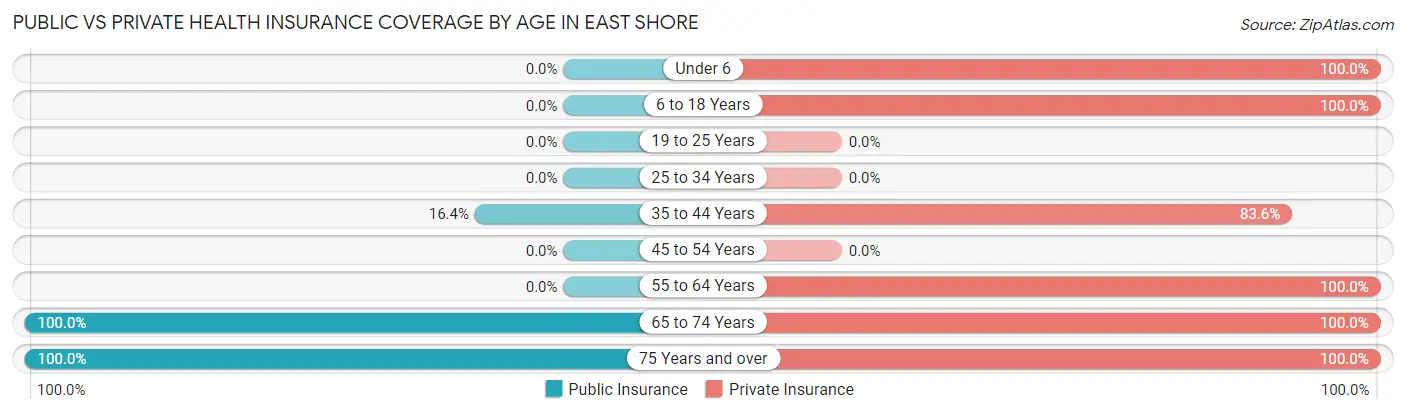
| Age Bracket | Public Insurance | Private Insurance |
| Under 6 | 0 (0.0%) | 24 (100.0%) |
| 6 to 18 Years | 0 (0.0%) | 50 (100.0%) |
| 19 to 25 Years | 0 (0.0%) | 0 (0.0%) |
| 25 to 34 Years | 0 (0.0%) | 0 (0.0%) |
| 35 to 44 Years | 12 (16.4%) | 61 (83.6%) |
| 45 to 54 Years | 0 (0.0%) | 0 (0.0%) |
| 55 to 64 Years | 0 (0.0%) | 17 (100.0%) |
| 65 to 74 Years | 20 (100.0%) | 20 (100.0%) |
| 75 Years and over | 25 (100.0%) | 25 (100.0%) |
| Total | 57 (27.3%) | 197 (94.3%) |
Disability Status by Sex by Age in East Shore
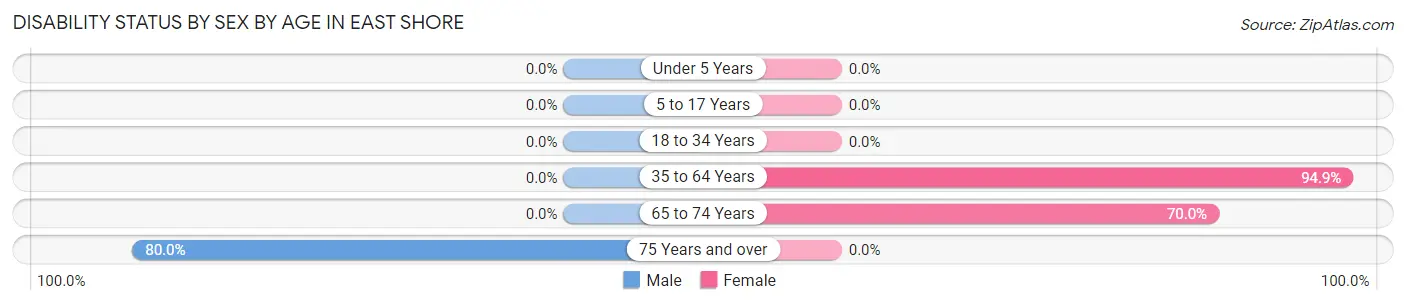
| Age Bracket | Male | Female |
| Under 5 Years | 0 (0.0%) | 0 (0.0%) |
| 5 to 17 Years | 0 (0.0%) | 0 (0.0%) |
| 18 to 34 Years | 0 (0.0%) | 0 (0.0%) |
| 35 to 64 Years | 0 (0.0%) | 56 (94.9%) |
| 65 to 74 Years | 0 (0.0%) | 14 (70.0%) |
| 75 Years and over | 20 (80.0%) | 0 (0.0%) |
Disability Class by Sex by Age in East Shore
Disability Class: Hearing Difficulty
| Age Bracket | Male | Female |
| Under 5 Years | 0 (0.0%) | 0 (0.0%) |
| 5 to 17 Years | 0 (0.0%) | 0 (0.0%) |
| 18 to 34 Years | 0 (0.0%) | 0 (0.0%) |
| 35 to 64 Years | 0 (0.0%) | 0 (0.0%) |
| 65 to 74 Years | 0 (0.0%) | 14 (70.0%) |
| 75 Years and over | 5 (20.0%) | 0 (0.0%) |
Disability Class: Vision Difficulty
| Age Bracket | Male | Female |
| Under 5 Years | 0 (0.0%) | 0 (0.0%) |
| 5 to 17 Years | 0 (0.0%) | 0 (0.0%) |
| 18 to 34 Years | 0 (0.0%) | 0 (0.0%) |
| 35 to 64 Years | 0 (0.0%) | 0 (0.0%) |
| 65 to 74 Years | 0 (0.0%) | 0 (0.0%) |
| 75 Years and over | 0 (0.0%) | 0 (0.0%) |
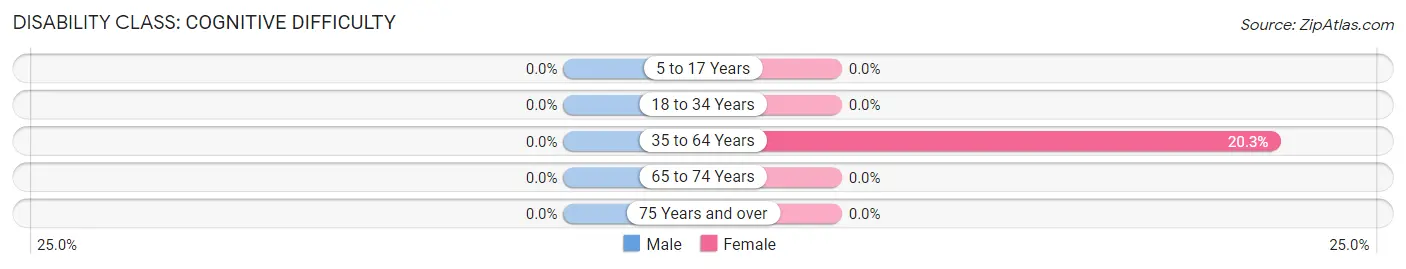
Disability Class: Cognitive Difficulty
| Age Bracket | Male | Female |
| 5 to 17 Years | 0 (0.0%) | 0 (0.0%) |
| 18 to 34 Years | 0 (0.0%) | 0 (0.0%) |
| 35 to 64 Years | 0 (0.0%) | 12 (20.3%) |
| 65 to 74 Years | 0 (0.0%) | 0 (0.0%) |
| 75 Years and over | 0 (0.0%) | 0 (0.0%) |
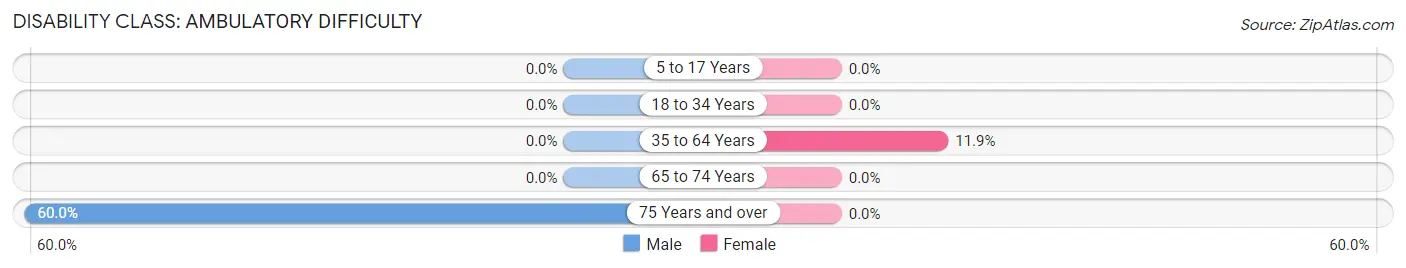
Disability Class: Ambulatory Difficulty
| Age Bracket | Male | Female |
| 5 to 17 Years | 0 (0.0%) | 0 (0.0%) |
| 18 to 34 Years | 0 (0.0%) | 0 (0.0%) |
| 35 to 64 Years | 0 (0.0%) | 7 (11.9%) |
| 65 to 74 Years | 0 (0.0%) | 0 (0.0%) |
| 75 Years and over | 15 (60.0%) | 0 (0.0%) |
Disability Class: Self-Care Difficulty
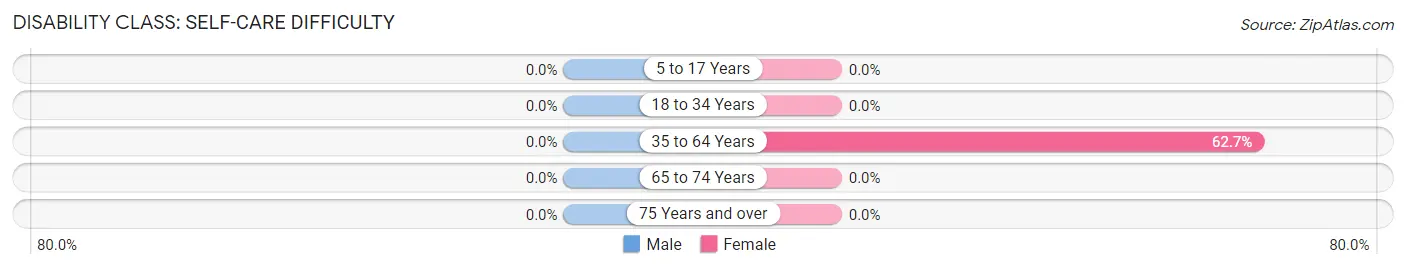
| Age Bracket | Male | Female |
| 5 to 17 Years | 0 (0.0%) | 0 (0.0%) |
| 18 to 34 Years | 0 (0.0%) | 0 (0.0%) |
| 35 to 64 Years | 0 (0.0%) | 37 (62.7%) |
| 65 to 74 Years | 0 (0.0%) | 0 (0.0%) |
| 75 Years and over | 0 (0.0%) | 0 (0.0%) |
Technology Access in East Shore
Computing Device Access in East Shore
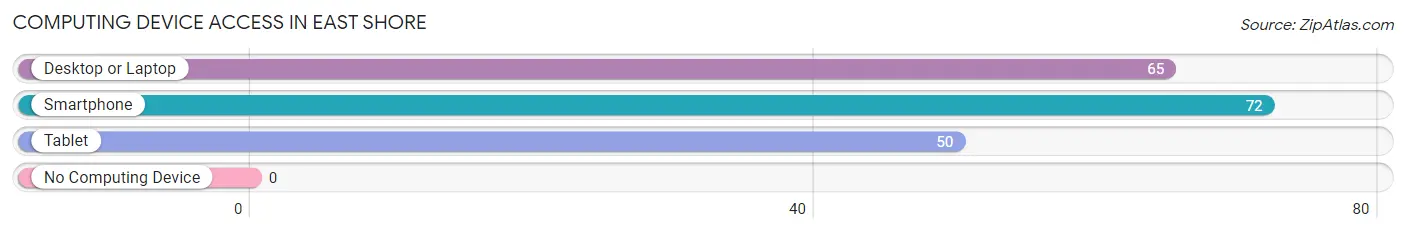
| Device Type | # Households | % Households |
| Desktop or Laptop | 65 | 90.3% |
| Smartphone | 72 | 100.0% |
| Tablet | 50 | 69.4% |
| No Computing Device | 0 | 0.0% |
| Total | 72 | 100.0% |
Internet Access in East Shore
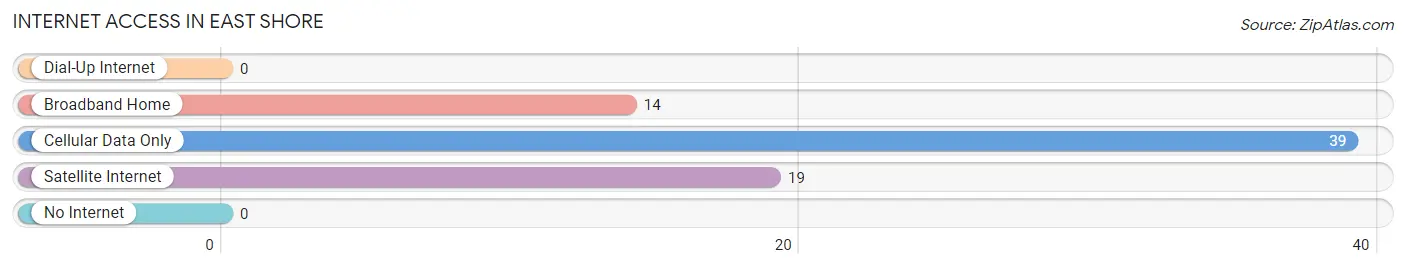
| Internet Type | # Households | % Households |
| Dial-Up Internet | 0 | 0.0% |
| Broadband Home | 14 | 19.4% |
| Cellular Data Only | 39 | 54.2% |
| Satellite Internet | 19 | 26.4% |
| No Internet | 0 | 0.0% |
| Total | 72 | 100.0% |
East Shore Summary
East Shore is a small unincorporated community located in the San Francisco Bay Area of California. It is situated on the eastern shore of the San Francisco Bay, just south of the city of Oakland. The community is bordered by the cities of Emeryville and Berkeley to the north, and the cities of Alameda and San Leandro to the south. East Shore is home to a diverse population of approximately 5,000 people.
History
East Shore was originally inhabited by the Ohlone people, who lived in the area for thousands of years before the arrival of Europeans. The first Europeans to settle in the area were Spanish missionaries, who established a mission in the area in 1776. The mission was abandoned in 1834, and the area was subsequently settled by American settlers.
In the late 19th century, East Shore became a popular destination for wealthy San Franciscans, who built large estates in the area. The area was also home to a number of small farms and orchards.
In the early 20th century, East Shore began to experience rapid growth as a result of the development of the nearby cities of Oakland and Berkeley. The area was annexed by the city of Oakland in 1909, and the population of East Shore increased significantly in the following decades.
Geography
East Shore is located on the eastern shore of the San Francisco Bay, just south of the city of Oakland. The community is bordered by the cities of Emeryville and Berkeley to the north, and the cities of Alameda and San Leandro to the south.
The area is characterized by rolling hills and valleys, with the highest point in the area being the summit of Grizzly Peak, which rises to an elevation of 1,898 feet. The area is home to a number of parks and open spaces, including Tilden Regional Park, which is located just south of East Shore.
Economy
East Shore is primarily a residential community, and the local economy is largely based on the service industry. The area is home to a number of small businesses, including restaurants, retail stores, and professional services.
The area is also home to a number of large employers, including the University of California, Berkeley, and the Lawrence Berkeley National Laboratory. The area is also home to a number of technology companies, including Oracle Corporation and Autodesk.
Demographics
As of the 2010 census, East Shore had a population of 5,000 people. The racial makeup of the area was 57.3% White, 22.2% Asian, 11.2% African American, 5.2% Hispanic or Latino, and 4.1% other.
The median household income in East Shore was $76,000, and the median family income was $90,000. The per capita income in East Shore was $37,000. The unemployment rate in East Shore was 4.2%.
East Shore is home to a diverse population, with a variety of religious and cultural backgrounds. The area is home to a number of churches, including the East Shore United Methodist Church and the East Shore Presbyterian Church. The area is also home to a number of cultural organizations, including the East Shore Arts Council and the East Shore Cultural Center.
Common Questions
What is Per Capita Income in East Shore?
Per Capita income in East Shore is $35,283.
What is the Median Family Income in East Shore?
Median Family Income in East Shore is $111,302.
What is the Median Household income in East Shore?
Median Household Income in East Shore is $110,729.
What is Inequality or Gini Index in East Shore?
Inequality or Gini Index in East Shore is 0.31.
What is the Total Population of East Shore?
Total Population of East Shore is 209.
What is the Total Male Population of East Shore?
Total Male Population of East Shore is 56.
What is the Total Female Population of East Shore?
Total Female Population of East Shore is 153.
What is the Ratio of Males per 100 Females in East Shore?
There are 36.60 Males per 100 Females in East Shore.
What is the Ratio of Females per 100 Males in East Shore?
There are 273.21 Females per 100 Males in East Shore.
What is the Median Population Age in East Shore?
Median Population Age in East Shore is 39.3 Years.
What is the Average Family Size in East Shore
Average Family Size in East Shore is 4.3 People.
What is the Average Household Size in East Shore
Average Household Size in East Shore is 2.9 People.
How Large is the Labor Force in East Shore?
There are 46 People in the Labor Forcein in East Shore.
What is the Percentage of People in the Labor Force in East Shore?
34.1% of People are in the Labor Force in East Shore.
What is the Unemployment Rate in East Shore?
Unemployment Rate in East Shore is 26.1%.