Cities with the Highest Percentage of Population Employed in Legal Services & Support in Ohio
RELATED REPORTS & OPTIONS
Legal Services & Support
Ohio
Compare Cities
Map of Cities with the Highest Percentage of Population Employed in Legal Services & Support in Ohio
0.0%
50.0%
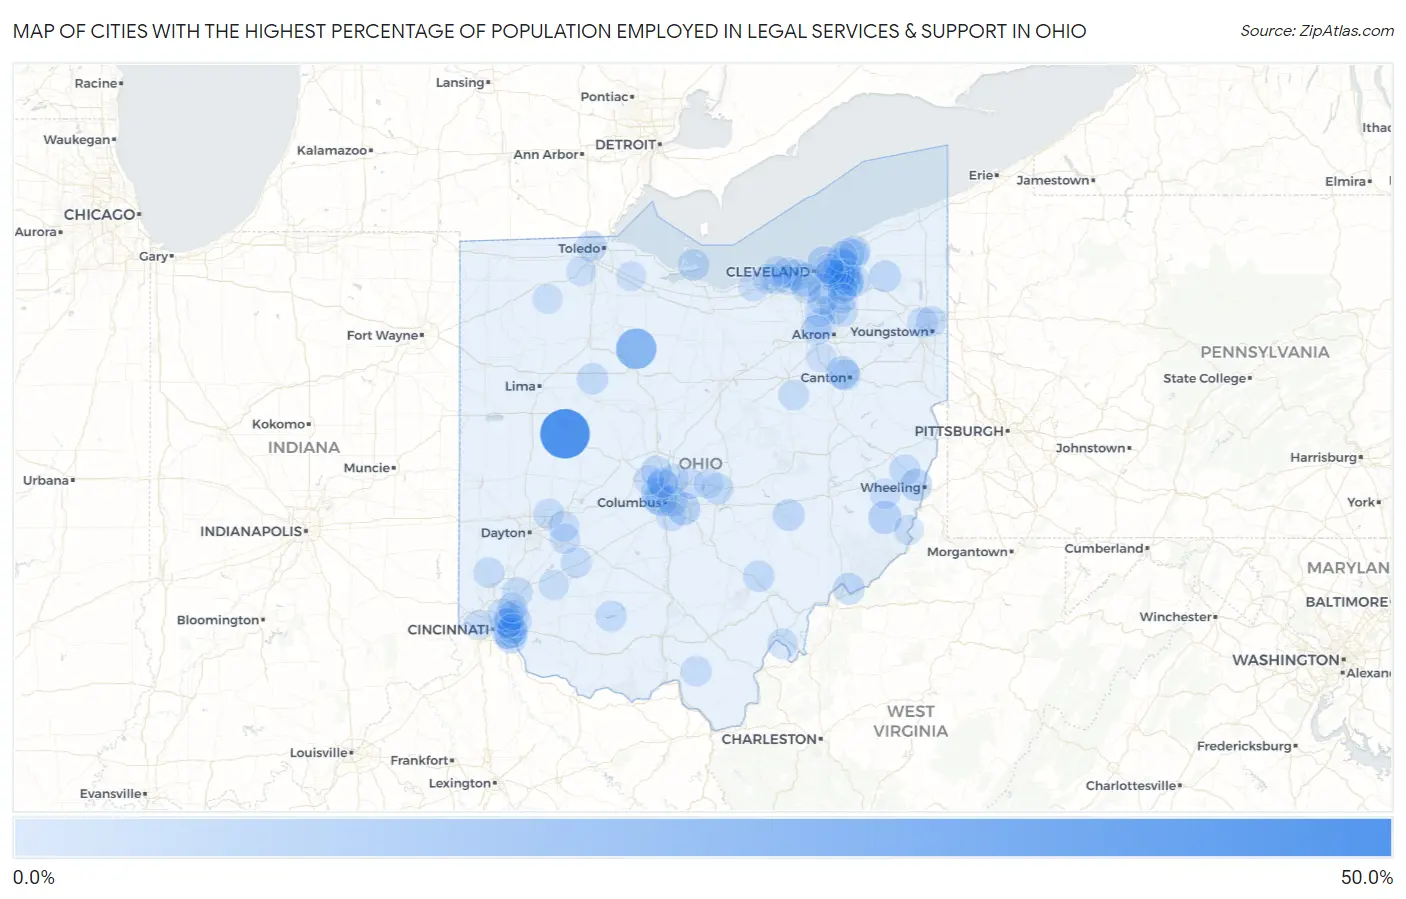
Cities with the Highest Percentage of Population Employed in Legal Services & Support in Ohio
| City | % Employed | vs State | vs National | |
| 1. | Lewistown | 48.0% | 0.92%(+47.1)#1 | 1.2%(+46.8)#10 |
| 2. | Mccutchenville | 25.9% | 0.92%(+25.0)#2 | 1.2%(+24.7)#31 |
| 3. | Woodsdale | 14.3% | 0.92%(+13.3)#3 | 1.2%(+13.1)#118 |
| 4. | Bentleyville | 9.8% | 0.92%(+8.88)#4 | 1.2%(+8.62)#235 |
| 5. | Linndale | 9.7% | 0.92%(+8.78)#5 | 1.2%(+8.52)#244 |
| 6. | Wilson | 9.1% | 0.92%(+8.17)#6 | 1.2%(+7.91)#266 |
| 7. | Brice | 8.5% | 0.92%(+7.59)#7 | 1.2%(+7.33)#304 |
| 8. | Hills And Dales | 8.3% | 0.92%(+7.41)#8 | 1.2%(+7.15)#318 |
| 9. | Bratenahl | 7.6% | 0.92%(+6.69)#9 | 1.2%(+6.43)#365 |
| 10. | Grandview Heights | 7.4% | 0.92%(+6.43)#10 | 1.2%(+6.17)#397 |
| 11. | Highland Heights | 6.7% | 0.92%(+5.77)#11 | 1.2%(+5.51)#475 |
| 12. | Lansing | 6.6% | 0.92%(+5.68)#12 | 1.2%(+5.42)#488 |
| 13. | Gates Mills | 6.4% | 0.92%(+5.50)#13 | 1.2%(+5.24)#529 |
| 14. | Middlefield | 6.1% | 0.92%(+5.19)#14 | 1.2%(+4.93)#581 |
| 15. | Duncan Falls | 6.0% | 0.92%(+5.09)#15 | 1.2%(+4.83)#599 |
| 16. | Coldstream | 5.9% | 0.92%(+4.93)#16 | 1.2%(+4.67)#632 |
| 17. | Orange | 5.6% | 0.92%(+4.66)#17 | 1.2%(+4.41)#691 |
| 18. | Reno | 5.6% | 0.92%(+4.65)#18 | 1.2%(+4.39)#694 |
| 19. | Fruit Hill | 5.3% | 0.92%(+4.41)#19 | 1.2%(+4.15)#751 |
| 20. | Moreland Hills | 5.3% | 0.92%(+4.35)#20 | 1.2%(+4.09)#761 |
| 21. | Lakeside | 5.3% | 0.92%(+4.34)#21 | 1.2%(+4.08)#765 |
| 22. | Dunkirk | 5.2% | 0.92%(+4.26)#22 | 1.2%(+4.00)#795 |
| 23. | Rocky River | 5.2% | 0.92%(+4.23)#23 | 1.2%(+3.97)#805 |
| 24. | Granville South | 5.1% | 0.92%(+4.21)#24 | 1.2%(+3.95)#811 |
| 25. | Buchtel | 5.1% | 0.92%(+4.20)#25 | 1.2%(+3.94)#814 |
| 26. | Waite Hill | 5.0% | 0.92%(+4.08)#26 | 1.2%(+3.82)#838 |
| 27. | Kirtland | 4.6% | 0.92%(+3.72)#27 | 1.2%(+3.46)#971 |
| 28. | Hunting Valley | 4.5% | 0.92%(+3.53)#28 | 1.2%(+3.27)#1,028 |
| 29. | Upper Arlington | 4.4% | 0.92%(+3.51)#29 | 1.2%(+3.25)#1,036 |
| 30. | Harrisville | 4.4% | 0.92%(+3.49)#30 | 1.2%(+3.23)#1,043 |
| 31. | Highland Holiday | 4.4% | 0.92%(+3.44)#31 | 1.2%(+3.19)#1,054 |
| 32. | Meyers Lake | 4.2% | 0.92%(+3.31)#32 | 1.2%(+3.05)#1,115 |
| 33. | Marble Cliff | 4.2% | 0.92%(+3.29)#33 | 1.2%(+3.03)#1,128 |
| 34. | Shaker Heights | 4.2% | 0.92%(+3.23)#34 | 1.2%(+2.97)#1,157 |
| 35. | Port William | 4.0% | 0.92%(+3.04)#35 | 1.2%(+2.78)#1,250 |
| 36. | Bexley | 3.9% | 0.92%(+3.00)#36 | 1.2%(+2.74)#1,272 |
| 37. | Powell | 3.9% | 0.92%(+2.99)#37 | 1.2%(+2.73)#1,274 |
| 38. | Riverlea | 3.8% | 0.92%(+2.92)#38 | 1.2%(+2.66)#1,305 |
| 39. | Boston Heights | 3.8% | 0.92%(+2.84)#39 | 1.2%(+2.58)#1,342 |
| 40. | Pepper Pike | 3.7% | 0.92%(+2.79)#40 | 1.2%(+2.53)#1,385 |
| 41. | Forestville | 3.7% | 0.92%(+2.77)#41 | 1.2%(+2.51)#1,402 |
| 42. | Salem Heights | 3.7% | 0.92%(+2.76)#42 | 1.2%(+2.50)#1,407 |
| 43. | Kirtland Hills | 3.7% | 0.92%(+2.76)#43 | 1.2%(+2.50)#1,413 |
| 44. | Hudson | 3.7% | 0.92%(+2.75)#44 | 1.2%(+2.49)#1,415 |
| 45. | Terrace Park | 3.6% | 0.92%(+2.71)#45 | 1.2%(+2.45)#1,442 |
| 46. | Richfield | 3.5% | 0.92%(+2.59)#46 | 1.2%(+2.34)#1,521 |
| 47. | Montrose Ghent | 3.5% | 0.92%(+2.59)#47 | 1.2%(+2.33)#1,523 |
| 48. | Mason | 3.5% | 0.92%(+2.55)#48 | 1.2%(+2.29)#1,557 |
| 49. | Chagrin Falls | 3.4% | 0.92%(+2.50)#49 | 1.2%(+2.24)#1,592 |
| 50. | Yellow Springs | 3.4% | 0.92%(+2.48)#50 | 1.2%(+2.22)#1,608 |
| 51. | Avon | 3.4% | 0.92%(+2.44)#51 | 1.2%(+2.18)#1,631 |
| 52. | Ottawa Hills | 3.3% | 0.92%(+2.40)#52 | 1.2%(+2.14)#1,668 |
| 53. | South Russell | 3.3% | 0.92%(+2.39)#53 | 1.2%(+2.13)#1,672 |
| 54. | Hilltop | 3.3% | 0.92%(+2.37)#54 | 1.2%(+2.11)#1,688 |
| 55. | Fredericksburg | 3.3% | 0.92%(+2.35)#55 | 1.2%(+2.09)#1,704 |
| 56. | Beachwood | 3.2% | 0.92%(+2.28)#56 | 1.2%(+2.02)#1,751 |
| 57. | Ridgewood | 3.2% | 0.92%(+2.28)#57 | 1.2%(+2.02)#1,752 |
| 58. | South Webster | 3.2% | 0.92%(+2.27)#58 | 1.2%(+2.01)#1,759 |
| 59. | Syracuse | 3.2% | 0.92%(+2.27)#59 | 1.2%(+2.01)#1,763 |
| 60. | Crystal Lakes | 3.2% | 0.92%(+2.26)#60 | 1.2%(+2.00)#1,771 |
| 61. | Valley View | 3.2% | 0.92%(+2.25)#61 | 1.2%(+1.99)#1,784 |
| 62. | Seven Mile | 3.2% | 0.92%(+2.24)#62 | 1.2%(+1.98)#1,795 |
| 63. | Bethesda | 3.1% | 0.92%(+2.16)#63 | 1.2%(+1.90)#1,845 |
| 64. | Worthington | 3.0% | 0.92%(+2.09)#64 | 1.2%(+1.83)#1,912 |
| 65. | Brecksville | 3.0% | 0.92%(+2.03)#65 | 1.2%(+1.77)#1,982 |
| 66. | Bay Village | 2.9% | 0.92%(+2.01)#66 | 1.2%(+1.75)#2,003 |
| 67. | Wilberforce | 2.9% | 0.92%(+1.94)#67 | 1.2%(+1.68)#2,053 |
| 68. | Amherst | 2.9% | 0.92%(+1.93)#68 | 1.2%(+1.68)#2,061 |
| 69. | Fairfax | 2.8% | 0.92%(+1.90)#69 | 1.2%(+1.64)#2,102 |
| 70. | Westlake | 2.8% | 0.92%(+1.87)#70 | 1.2%(+1.62)#2,130 |
| 71. | Pigeon Creek | 2.8% | 0.92%(+1.86)#71 | 1.2%(+1.60)#2,147 |
| 72. | Dublin | 2.7% | 0.92%(+1.81)#72 | 1.2%(+1.55)#2,199 |
| 73. | Amberley | 2.7% | 0.92%(+1.79)#73 | 1.2%(+1.53)#2,228 |
| 74. | Churchill | 2.6% | 0.92%(+1.70)#74 | 1.2%(+1.44)#2,308 |
| 75. | Covedale | 2.6% | 0.92%(+1.70)#75 | 1.2%(+1.44)#2,322 |
| 76. | Mariemont | 2.5% | 0.92%(+1.60)#76 | 1.2%(+1.34)#2,425 |
| 77. | Solon | 2.5% | 0.92%(+1.59)#77 | 1.2%(+1.33)#2,430 |
| 78. | Clarksville | 2.5% | 0.92%(+1.58)#78 | 1.2%(+1.32)#2,442 |
| 79. | Roseland | 2.4% | 0.92%(+1.51)#79 | 1.2%(+1.26)#2,517 |
| 80. | Clarington | 2.4% | 0.92%(+1.51)#80 | 1.2%(+1.26)#2,523 |
| 81. | New Albany | 2.4% | 0.92%(+1.51)#81 | 1.2%(+1.25)#2,527 |
| 82. | Avon Lake | 2.4% | 0.92%(+1.49)#82 | 1.2%(+1.23)#2,569 |
| 83. | Westerville | 2.4% | 0.92%(+1.43)#83 | 1.2%(+1.17)#2,652 |
| 84. | Madeira | 2.3% | 0.92%(+1.41)#84 | 1.2%(+1.15)#2,671 |
| 85. | University Heights | 2.2% | 0.92%(+1.32)#85 | 1.2%(+1.06)#2,803 |
| 86. | Elmore | 2.2% | 0.92%(+1.31)#86 | 1.2%(+1.05)#2,824 |
| 87. | The Village Of Indian Hill | 2.2% | 0.92%(+1.25)#87 | 1.2%(+0.994)#2,907 |
| 88. | Waterville | 2.1% | 0.92%(+1.21)#88 | 1.2%(+0.948)#2,984 |
| 89. | Willoughby Hills | 2.1% | 0.92%(+1.17)#89 | 1.2%(+0.913)#3,044 |
| 90. | Malinta | 2.1% | 0.92%(+1.14)#90 | 1.2%(+0.885)#3,093 |
| 91. | Dry Run | 2.1% | 0.92%(+1.14)#91 | 1.2%(+0.878)#3,105 |
| 92. | Cleveland Heights | 2.1% | 0.92%(+1.14)#92 | 1.2%(+0.878)#3,108 |
| 93. | Alexandria | 2.0% | 0.92%(+1.11)#93 | 1.2%(+0.850)#3,151 |
| 94. | Obetz | 2.0% | 0.92%(+1.11)#94 | 1.2%(+0.849)#3,154 |
| 95. | Oakwood Village Paulding County | 2.0% | 0.92%(+1.11)#95 | 1.2%(+0.847)#3,160 |
| 96. | Montgomery | 2.0% | 0.92%(+1.10)#96 | 1.2%(+0.844)#3,164 |
| 97. | Sheffield | 2.0% | 0.92%(+1.09)#97 | 1.2%(+0.833)#3,177 |
| 98. | Parma Heights | 2.0% | 0.92%(+1.09)#98 | 1.2%(+0.832)#3,183 |
| 99. | Clinton | 2.0% | 0.92%(+1.09)#99 | 1.2%(+0.832)#3,184 |
| 100. | Twinsburg | 2.0% | 0.92%(+1.07)#100 | 1.2%(+0.809)#3,227 |
Common Questions
What are the Top 10 Cities with the Highest Percentage of Population Employed in Legal Services & Support in Ohio?
Top 10 Cities with the Highest Percentage of Population Employed in Legal Services & Support in Ohio are:
#1
48.0%
#2
25.9%
#3
9.8%
#4
9.7%
#5
9.1%
#6
8.5%
#7
8.3%
#8
7.6%
#9
7.4%
#10
6.7%
What city has the Highest Percentage of Population Employed in Legal Services & Support in Ohio?
Lewistown has the Highest Percentage of Population Employed in Legal Services & Support in Ohio with 48.0%.
What is the Percentage of Population Employed in Legal Services & Support in the State of Ohio?
Percentage of Population Employed in Legal Services & Support in Ohio is 0.92%.
What is the Percentage of Population Employed in Legal Services & Support in the United States?
Percentage of Population Employed in Legal Services & Support in the United States is 1.2%.