Topanga, CA Map & Demographics
Topanga Map
Topanga Overview
$81,015
PER CAPITA INCOME
$170,179
AVG FAMILY INCOME
$138,400
AVG HOUSEHOLD INCOME
13.5%
WAGE / INCOME GAP [ % ]
86.5¢/ $1
WAGE / INCOME GAP [ $ ]
0.48
INEQUALITY / GINI INDEX
8,202
TOTAL POPULATION
4,113
MALE POPULATION
4,089
FEMALE POPULATION
100.59
MALES / 100 FEMALES
99.42
FEMALES / 100 MALES
46.3
MEDIAN AGE
3.1
AVG FAMILY SIZE
2.7
AVG HOUSEHOLD SIZE
4,376
LABOR FORCE [ PEOPLE ]
64.5%
PERCENT IN LABOR FORCE
7.2%
UNEMPLOYMENT RATE
Topanga Zip Codes
Topanga Area Codes
Income in Topanga
Income Overview in Topanga
Per Capita Income in Topanga is $81,015, while median incomes of families and households are $170,179 and $138,400 respectively.
| Characteristic | Number | Measure |
| Per Capita Income | 8,202 | $81,015 |
| Median Family Income | 2,065 | $170,179 |
| Mean Family Income | 2,065 | $243,110 |
| Median Household Income | 3,029 | $138,400 |
| Mean Household Income | 3,029 | $213,244 |
| Income Deficit | 2,065 | $0 |
| Wage / Income Gap (%) | 8,202 | 13.50% |
| Wage / Income Gap ($) | 8,202 | 86.50¢ per $1 |
| Gini / Inequality Index | 8,202 | 0.48 |
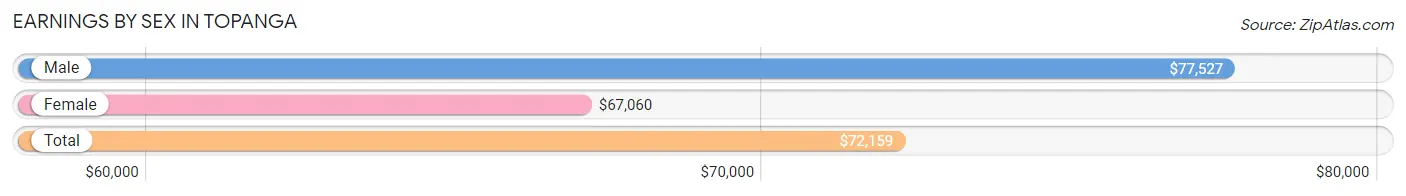
Earnings by Sex in Topanga
Average Earnings in Topanga are $72,159, $77,527 for men and $67,060 for women, a difference of 13.5%.
| Sex | Number | Average Earnings |
| Male | 2,402 (52.2%) | $77,527 |
| Female | 2,195 (47.7%) | $67,060 |
| Total | 4,597 (100.0%) | $72,159 |
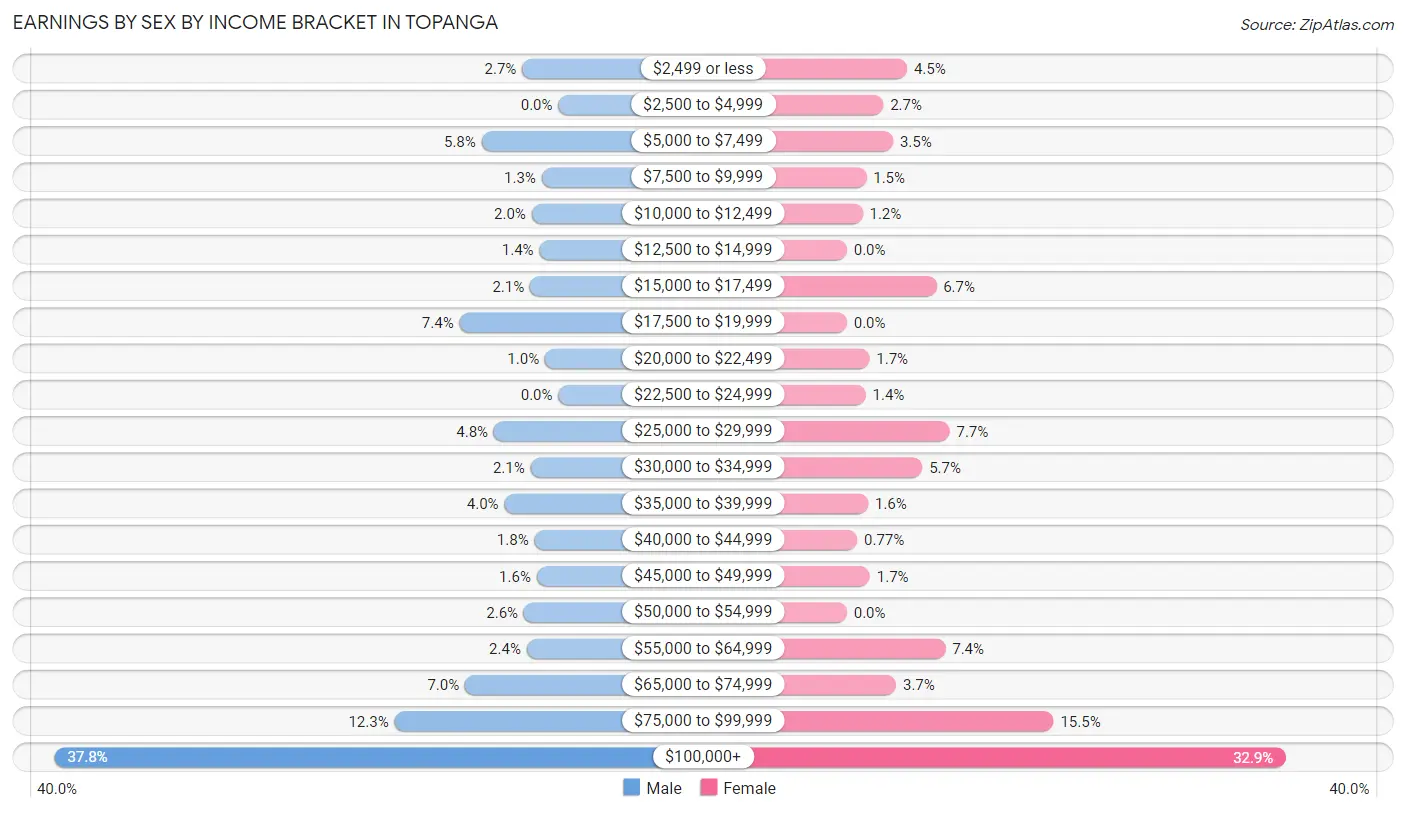
Earnings by Sex by Income Bracket in Topanga
The most common earnings brackets in Topanga are $100,000+ for men (907 | 37.8%) and $100,000+ for women (721 | 32.9%).
| Income | Male | Female |
| $2,499 or less | 65 (2.7%) | 99 (4.5%) |
| $2,500 to $4,999 | 0 (0.0%) | 60 (2.7%) |
| $5,000 to $7,499 | 138 (5.8%) | 76 (3.5%) |
| $7,500 to $9,999 | 30 (1.3%) | 32 (1.5%) |
| $10,000 to $12,499 | 48 (2.0%) | 26 (1.2%) |
| $12,500 to $14,999 | 34 (1.4%) | 0 (0.0%) |
| $15,000 to $17,499 | 51 (2.1%) | 147 (6.7%) |
| $17,500 to $19,999 | 178 (7.4%) | 0 (0.0%) |
| $20,000 to $22,499 | 24 (1.0%) | 37 (1.7%) |
| $22,500 to $24,999 | 0 (0.0%) | 31 (1.4%) |
| $25,000 to $29,999 | 116 (4.8%) | 169 (7.7%) |
| $30,000 to $34,999 | 50 (2.1%) | 124 (5.7%) |
| $35,000 to $39,999 | 97 (4.0%) | 35 (1.6%) |
| $40,000 to $44,999 | 43 (1.8%) | 17 (0.8%) |
| $45,000 to $49,999 | 39 (1.6%) | 38 (1.7%) |
| $50,000 to $54,999 | 62 (2.6%) | 0 (0.0%) |
| $55,000 to $64,999 | 57 (2.4%) | 162 (7.4%) |
| $65,000 to $74,999 | 168 (7.0%) | 81 (3.7%) |
| $75,000 to $99,999 | 295 (12.3%) | 340 (15.5%) |
| $100,000+ | 907 (37.8%) | 721 (32.9%) |
| Total | 2,402 (100.0%) | 2,195 (100.0%) |
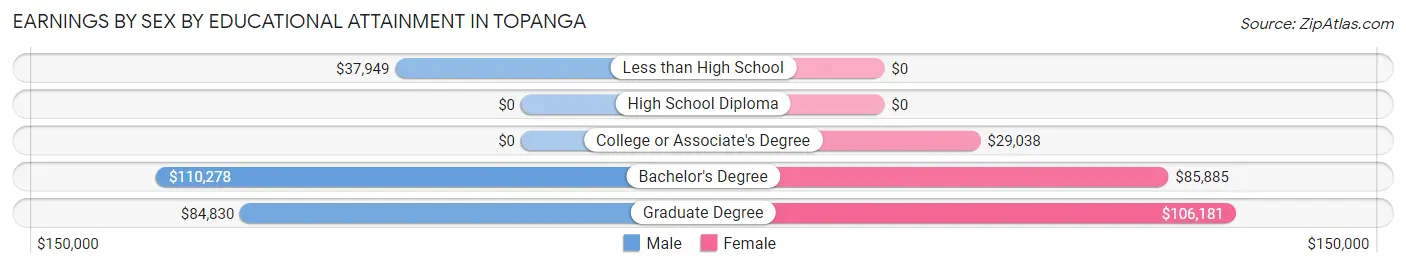
Earnings by Sex by Educational Attainment in Topanga
Average earnings in Topanga are $77,830 for men and $79,328 for women, a difference of 1.9%. Men with an educational attainment of bachelor's degree enjoy the highest average annual earnings of $110,278, while those with less than high school education earn the least with $37,949. Women with an educational attainment of graduate degree earn the most with the average annual earnings of $106,181, while those with college or associate's degree education have the smallest earnings of $29,038.
| Educational Attainment | Male Income | Female Income |
| Less than High School | $37,949 | $0 |
| High School Diploma | - | - |
| College or Associate's Degree | - | - |
| Bachelor's Degree | $110,278 | $85,885 |
| Graduate Degree | $84,830 | $106,181 |
| Total | $77,830 | $79,328 |
Family Income in Topanga
Family Income Brackets in Topanga
According to the Topanga family income data, there are 919 families falling into the $200,000+ income range, which is the most common income bracket and makes up 44.5% of all families. Conversely, the $10,000 to $14,999 income bracket is the least frequent group with only 19 families (0.9%) belonging to this category.
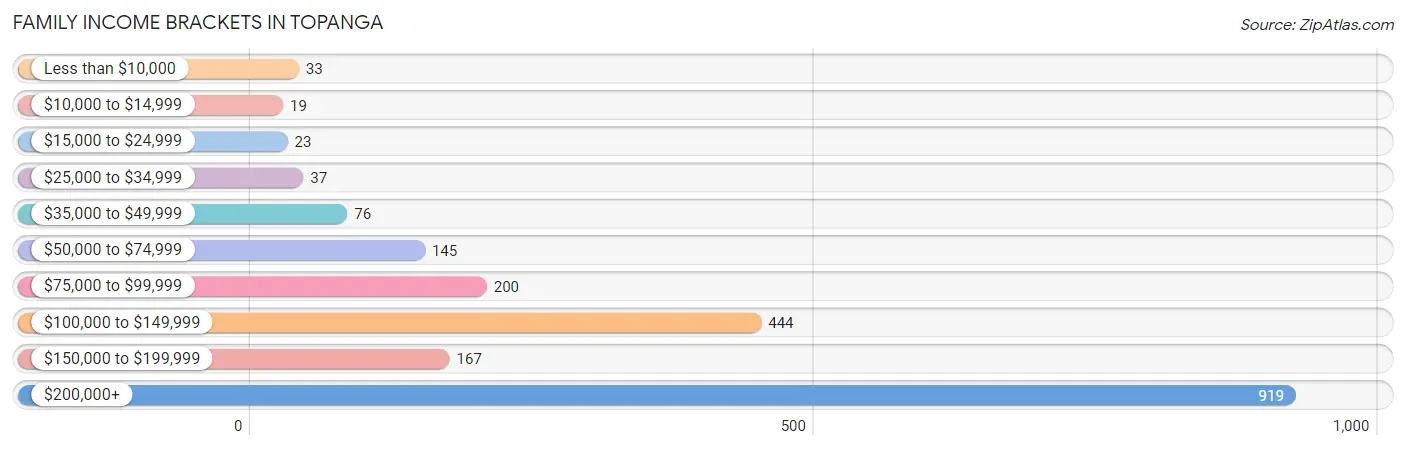
| Income Bracket | # Families | % Families |
| Less than $10,000 | 33 | 1.6% |
| $10,000 to $14,999 | 19 | 0.9% |
| $15,000 to $24,999 | 23 | 1.1% |
| $25,000 to $34,999 | 37 | 1.8% |
| $35,000 to $49,999 | 76 | 3.7% |
| $50,000 to $74,999 | 145 | 7.0% |
| $75,000 to $99,999 | 200 | 9.7% |
| $100,000 to $149,999 | 444 | 21.5% |
| $150,000 to $199,999 | 167 | 8.1% |
| $200,000+ | 919 | 44.5% |
Family Income by Famaliy Size in Topanga
3-person families (363 | 17.6%) account for the highest median family income in Topanga with $250,001 per family, while 3-person families (363 | 17.6%) have the highest median income of $83,334 per family member.
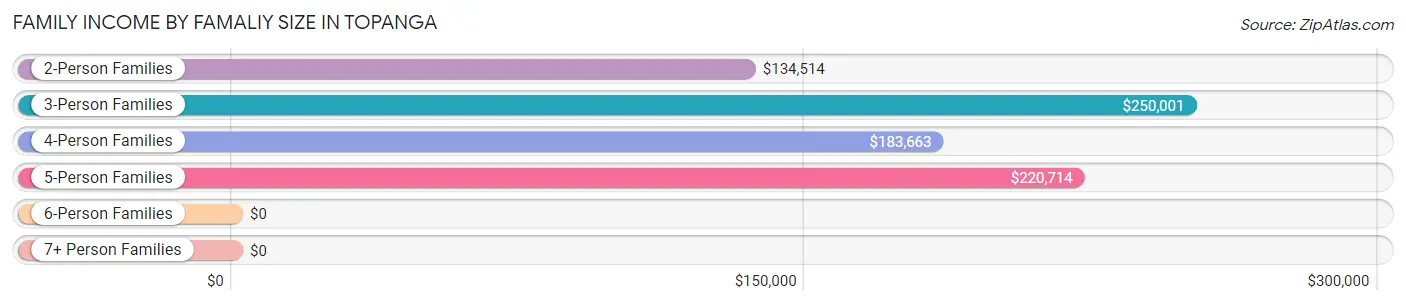
| Income Bracket | # Families | Median Income |
| 2-Person Families | 1,089 (52.7%) | $134,514 |
| 3-Person Families | 363 (17.6%) | $250,001 |
| 4-Person Families | 400 (19.4%) | $183,663 |
| 5-Person Families | 88 (4.3%) | $220,714 |
| 6-Person Families | 60 (2.9%) | $0 |
| 7+ Person Families | 65 (3.2%) | $0 |
| Total | 2,065 (100.0%) | $170,179 |
Family Income by Number of Earners in Topanga
The median family income in Topanga is $170,179, with families comprising 2 earners (978) having the highest median family income of $250,001, while families with no earners (318) have the lowest median family income of $74,167, accounting for 47.4% and 15.4% of families, respectively.
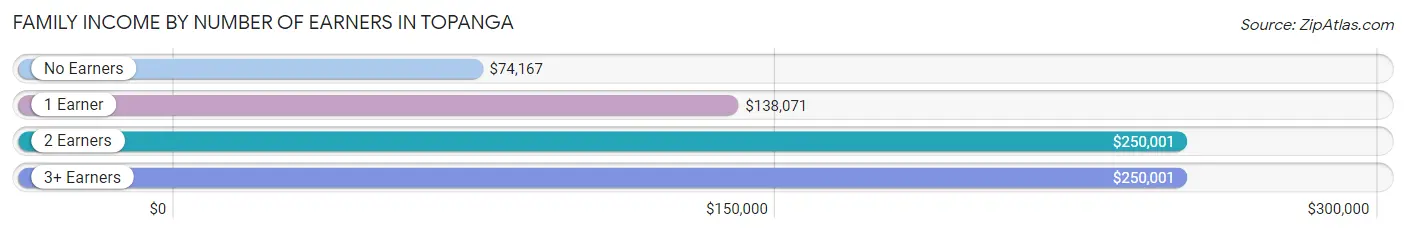
| Number of Earners | # Families | Median Income |
| No Earners | 318 (15.4%) | $74,167 |
| 1 Earner | 617 (29.9%) | $138,071 |
| 2 Earners | 978 (47.4%) | $250,001 |
| 3+ Earners | 152 (7.4%) | $250,001 |
| Total | 2,065 (100.0%) | $170,179 |
Household Income in Topanga
Household Income Brackets in Topanga
With 1,084 households falling in the category, the $200,000+ income range is the most frequent in Topanga, accounting for 35.8% of all households. In contrast, only 27 households (0.9%) fall into the $10,000 to $14,999 income bracket, making it the least populous group.
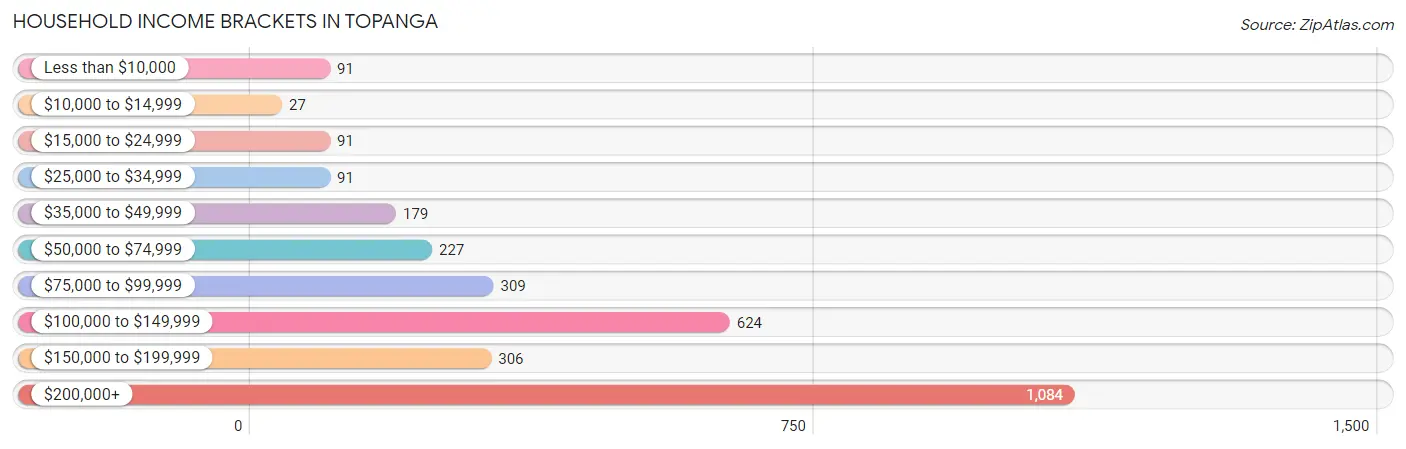
| Income Bracket | # Households | % Households |
| Less than $10,000 | 91 | 3.0% |
| $10,000 to $14,999 | 27 | 0.9% |
| $15,000 to $24,999 | 91 | 3.0% |
| $25,000 to $34,999 | 91 | 3.0% |
| $35,000 to $49,999 | 179 | 5.9% |
| $50,000 to $74,999 | 227 | 7.5% |
| $75,000 to $99,999 | 309 | 10.2% |
| $100,000 to $149,999 | 624 | 20.6% |
| $150,000 to $199,999 | 306 | 10.1% |
| $200,000+ | 1,084 | 35.8% |
Household Income by Householder Age in Topanga
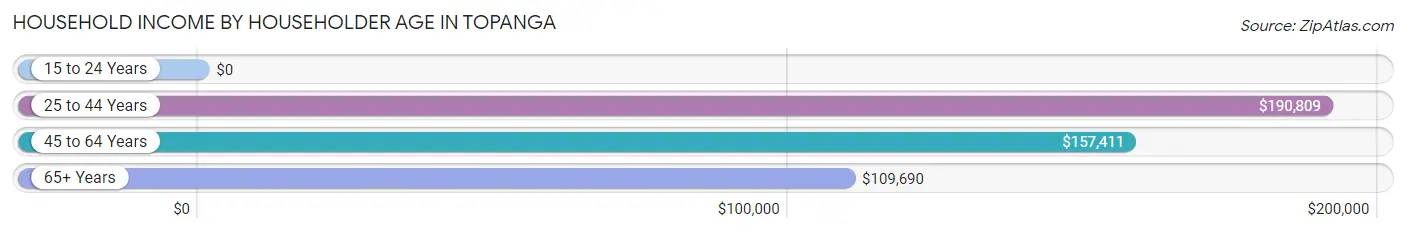
The median household income in Topanga is $138,400, with the highest median household income of $190,809 found in the 25 to 44 years age bracket for the primary householder. A total of 515 households (17.0%) fall into this category. Meanwhile, the 15 to 24 years age bracket for the primary householder has the lowest median household income of $0, with 19 households (0.6%) in this group.
| Income Bracket | # Households | Median Income |
| 15 to 24 Years | 19 (0.6%) | $0 |
| 25 to 44 Years | 515 (17.0%) | $190,809 |
| 45 to 64 Years | 1,424 (47.0%) | $157,411 |
| 65+ Years | 1,071 (35.4%) | $109,690 |
| Total | 3,029 (100.0%) | $138,400 |
Poverty in Topanga
Income Below Poverty by Sex and Age in Topanga
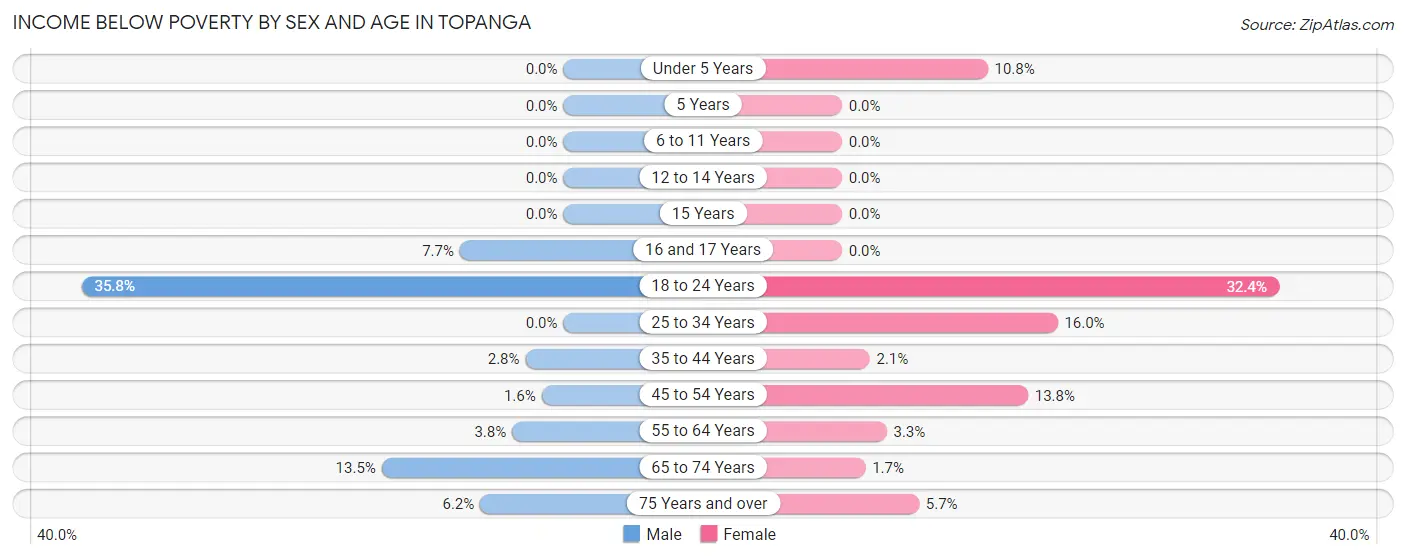
With 4.6% poverty level for males and 8.3% for females among the residents of Topanga, 18 to 24 year old males and 18 to 24 year old females are the most vulnerable to poverty, with 49 males (35.8%) and 97 females (32.4%) in their respective age groups living below the poverty level.
| Age Bracket | Male | Female |
| Under 5 Years | 0 (0.0%) | 21 (10.8%) |
| 5 Years | 0 (0.0%) | 0 (0.0%) |
| 6 to 11 Years | 0 (0.0%) | 0 (0.0%) |
| 12 to 14 Years | 0 (0.0%) | 0 (0.0%) |
| 15 Years | 0 (0.0%) | 0 (0.0%) |
| 16 and 17 Years | 9 (7.7%) | 0 (0.0%) |
| 18 to 24 Years | 49 (35.8%) | 97 (32.4%) |
| 25 to 34 Years | 0 (0.0%) | 69 (16.0%) |
| 35 to 44 Years | 17 (2.8%) | 10 (2.1%) |
| 45 to 54 Years | 12 (1.6%) | 87 (13.8%) |
| 55 to 64 Years | 28 (3.8%) | 21 (3.3%) |
| 65 to 74 Years | 46 (13.5%) | 8 (1.7%) |
| 75 Years and over | 29 (6.2%) | 25 (5.7%) |
| Total | 190 (4.6%) | 338 (8.3%) |
Income Above Poverty by Sex and Age in Topanga
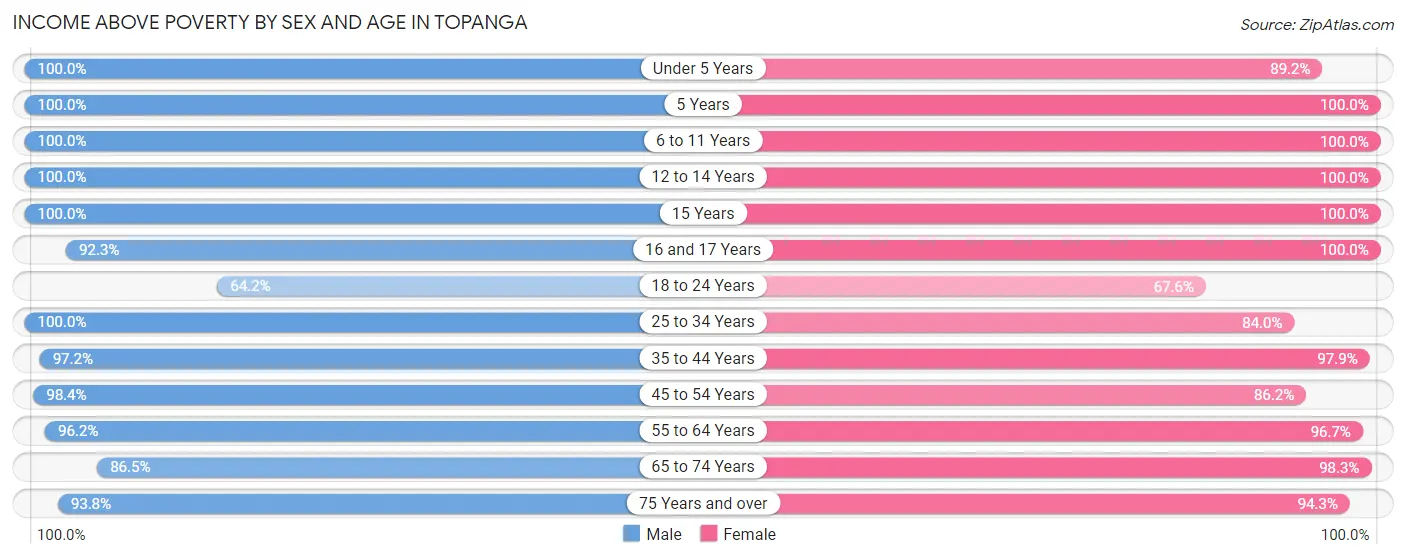
According to the poverty statistics in Topanga, males aged under 5 years and females aged 5 years are the age groups that are most secure financially, with 100.0% of males and 100.0% of females in these age groups living above the poverty line.
| Age Bracket | Male | Female |
| Under 5 Years | 189 (100.0%) | 173 (89.2%) |
| 5 Years | 37 (100.0%) | 20 (100.0%) |
| 6 to 11 Years | 302 (100.0%) | 247 (100.0%) |
| 12 to 14 Years | 148 (100.0%) | 101 (100.0%) |
| 15 Years | 147 (100.0%) | 32 (100.0%) |
| 16 and 17 Years | 108 (92.3%) | 118 (100.0%) |
| 18 to 24 Years | 88 (64.2%) | 202 (67.6%) |
| 25 to 34 Years | 150 (100.0%) | 362 (84.0%) |
| 35 to 44 Years | 585 (97.2%) | 476 (97.9%) |
| 45 to 54 Years | 727 (98.4%) | 543 (86.2%) |
| 55 to 64 Years | 707 (96.2%) | 612 (96.7%) |
| 65 to 74 Years | 295 (86.5%) | 453 (98.3%) |
| 75 Years and over | 440 (93.8%) | 412 (94.3%) |
| Total | 3,923 (95.4%) | 3,751 (91.7%) |
Income Below Poverty Among Married-Couple Families in Topanga
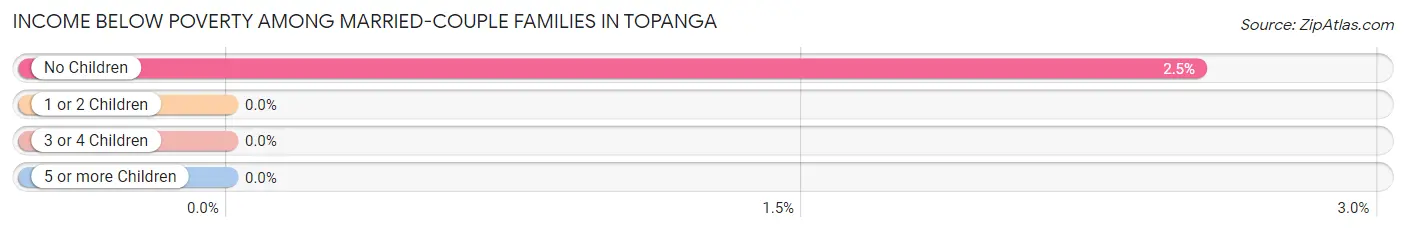
The poverty statistics for married-couple families in Topanga show that 1.5% or 25 of the total 1,684 families live below the poverty line. Families with no children have the highest poverty rate of 2.5%, comprising of 25 families. On the other hand, families with 1 or 2 children have the lowest poverty rate of 0.0%, which includes 0 families.
| Children | Above Poverty | Below Poverty |
| No Children | 964 (97.5%) | 25 (2.5%) |
| 1 or 2 Children | 646 (100.0%) | 0 (0.0%) |
| 3 or 4 Children | 49 (100.0%) | 0 (0.0%) |
| 5 or more Children | 0 (0.0%) | 0 (0.0%) |
| Total | 1,659 (98.5%) | 25 (1.5%) |
Income Below Poverty Among Single-Parent Households in Topanga
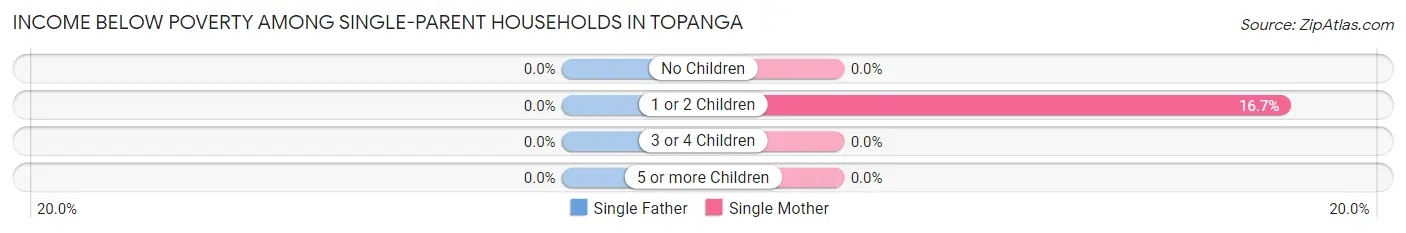
| Children | Single Father | Single Mother |
| No Children | 0 (0.0%) | 0 (0.0%) |
| 1 or 2 Children | 0 (0.0%) | 27 (16.7%) |
| 3 or 4 Children | 0 (0.0%) | 0 (0.0%) |
| 5 or more Children | 0 (0.0%) | 0 (0.0%) |
| Total | 0 (0.0%) | 27 (10.7%) |
Income Below Poverty Among Married-Couple vs Single-Parent Households in Topanga
The poverty data for Topanga shows that 25 of the married-couple family households (1.5%) and 27 of the single-parent households (7.1%) are living below the poverty level. Within the married-couple family households, those with no children have the highest poverty rate, with 25 households (2.5%) falling below the poverty line. Among the single-parent households, those with 1 or 2 children have the highest poverty rate, with 27 household (11.5%) living below poverty.
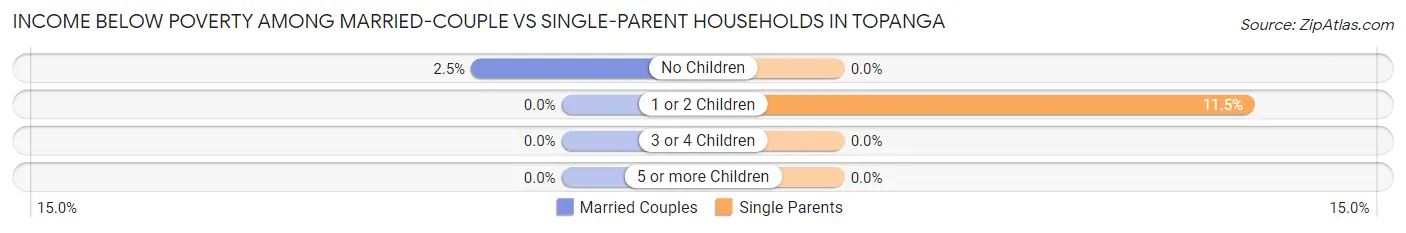
| Children | Married-Couple Families | Single-Parent Households |
| No Children | 25 (2.5%) | 0 (0.0%) |
| 1 or 2 Children | 0 (0.0%) | 27 (11.5%) |
| 3 or 4 Children | 0 (0.0%) | 0 (0.0%) |
| 5 or more Children | 0 (0.0%) | 0 (0.0%) |
| Total | 25 (1.5%) | 27 (7.1%) |
Race in Topanga
The most populous races in Topanga are White / Caucasian (5,981 | 72.9%), Hispanic or Latino (1,061 | 12.9%), and Asian (887 | 10.8%).
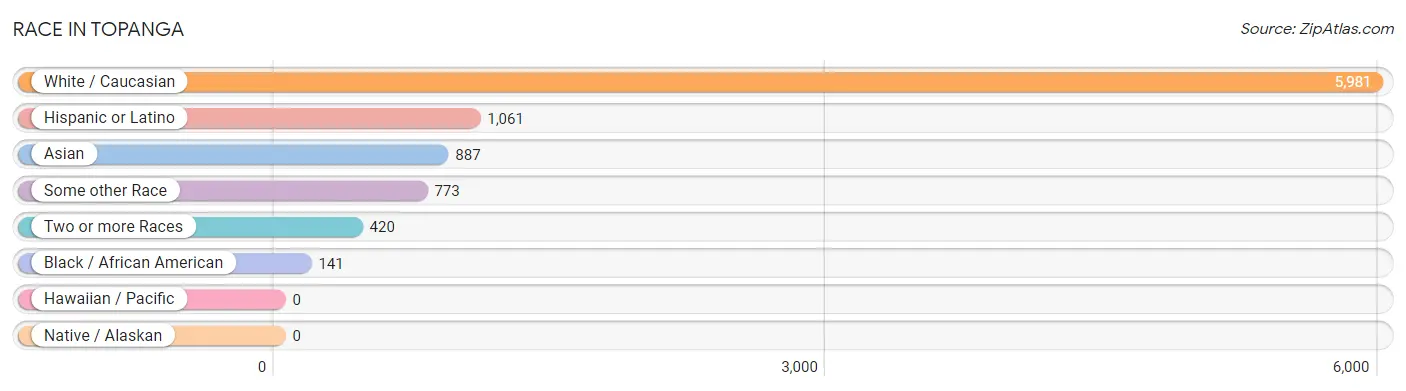
| Race | # Population | % Population |
| Asian | 887 | 10.8% |
| Black / African American | 141 | 1.7% |
| Hawaiian / Pacific | 0 | 0.0% |
| Hispanic or Latino | 1,061 | 12.9% |
| Native / Alaskan | 0 | 0.0% |
| White / Caucasian | 5,981 | 72.9% |
| Two or more Races | 420 | 5.1% |
| Some other Race | 773 | 9.4% |
| Total | 8,202 | 100.0% |
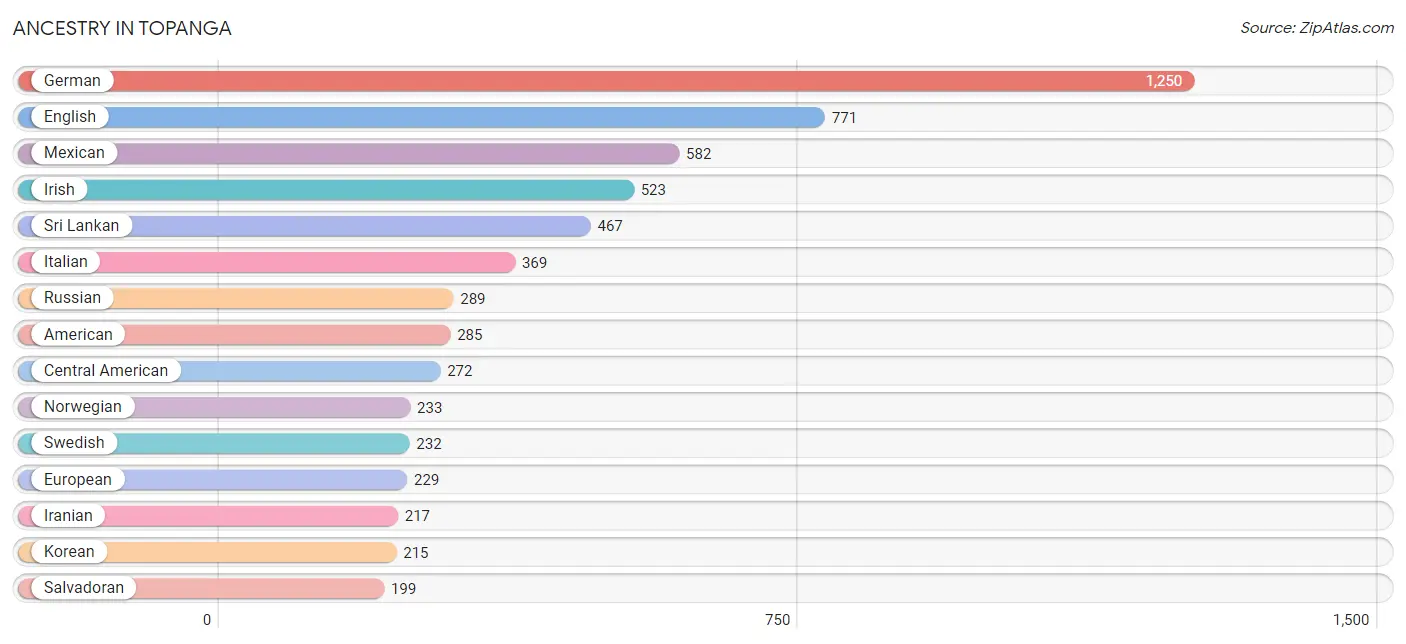
Ancestry in Topanga
The most populous ancestries reported in Topanga are German (1,250 | 15.2%), English (771 | 9.4%), Mexican (582 | 7.1%), Irish (523 | 6.4%), and Sri Lankan (467 | 5.7%), together accounting for 43.8% of all Topanga residents.
| Ancestry | # Population | % Population |
| African | 57 | 0.7% |
| American | 285 | 3.5% |
| Arab | 41 | 0.5% |
| Argentinean | 31 | 0.4% |
| Armenian | 6 | 0.1% |
| Austrian | 35 | 0.4% |
| Bhutanese | 91 | 1.1% |
| Brazilian | 12 | 0.2% |
| British | 148 | 1.8% |
| Burmese | 44 | 0.5% |
| Canadian | 13 | 0.2% |
| Central American | 272 | 3.3% |
| Chilean | 33 | 0.4% |
| Chippewa | 33 | 0.4% |
| Choctaw | 36 | 0.4% |
| Colombian | 9 | 0.1% |
| Costa Rican | 64 | 0.8% |
| Croatian | 12 | 0.2% |
| Cuban | 15 | 0.2% |
| Czech | 80 | 1.0% |
| Danish | 60 | 0.7% |
| Dutch | 14 | 0.2% |
| Eastern European | 193 | 2.4% |
| Ecuadorian | 46 | 0.6% |
| English | 771 | 9.4% |
| European | 229 | 2.8% |
| Filipino | 12 | 0.2% |
| Finnish | 46 | 0.6% |
| French | 158 | 1.9% |
| French Canadian | 52 | 0.6% |
| German | 1,250 | 15.2% |
| Greek | 58 | 0.7% |
| Hungarian | 96 | 1.2% |
| Indian (Asian) | 75 | 0.9% |
| Iranian | 217 | 2.6% |
| Irish | 523 | 6.4% |
| Italian | 369 | 4.5% |
| Korean | 215 | 2.6% |
| Mexican | 582 | 7.1% |
| Mexican American Indian | 13 | 0.2% |
| New Zealander | 18 | 0.2% |
| Nicaraguan | 9 | 0.1% |
| Northern European | 22 | 0.3% |
| Norwegian | 233 | 2.8% |
| Polish | 109 | 1.3% |
| Portuguese | 54 | 0.7% |
| Romanian | 19 | 0.2% |
| Russian | 289 | 3.5% |
| Salvadoran | 199 | 2.4% |
| Scandinavian | 85 | 1.0% |
| Scotch-Irish | 48 | 0.6% |
| Scottish | 173 | 2.1% |
| Slovak | 55 | 0.7% |
| South American | 119 | 1.5% |
| Spaniard | 45 | 0.5% |
| Spanish | 11 | 0.1% |
| Sri Lankan | 467 | 5.7% |
| Subsaharan African | 57 | 0.7% |
| Swedish | 232 | 2.8% |
| Swiss | 27 | 0.3% |
| Thai | 140 | 1.7% |
| Turkish | 18 | 0.2% |
| Ukrainian | 18 | 0.2% |
| Welsh | 96 | 1.2% | View All 64 Rows |
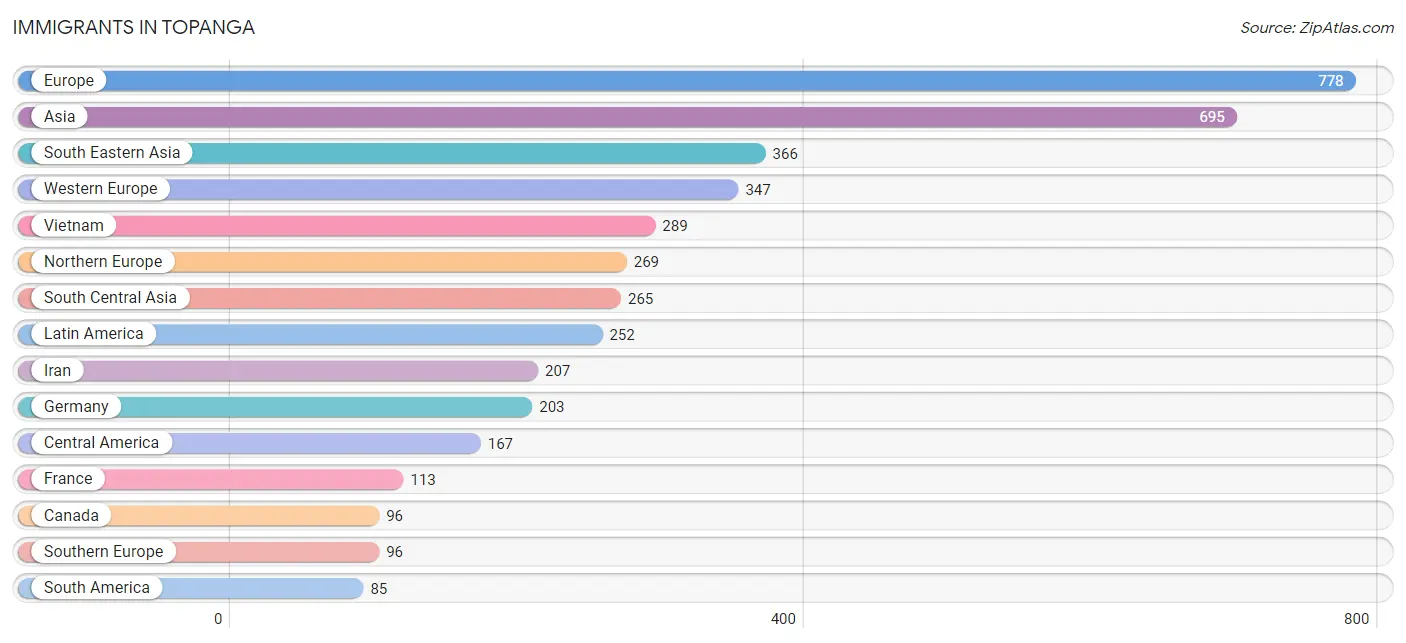
Immigrants in Topanga
The most numerous immigrant groups reported in Topanga came from Europe (778 | 9.5%), Asia (695 | 8.5%), South Eastern Asia (366 | 4.5%), Western Europe (347 | 4.2%), and Vietnam (289 | 3.5%), together accounting for 30.2% of all Topanga residents.
| Immigration Origin | # Population | % Population |
| Asia | 695 | 8.5% |
| Austria | 17 | 0.2% |
| Belarus | 12 | 0.2% |
| Brazil | 35 | 0.4% |
| Canada | 96 | 1.2% |
| Central America | 167 | 2.0% |
| Chile | 33 | 0.4% |
| China | 14 | 0.2% |
| Colombia | 17 | 0.2% |
| Costa Rica | 64 | 0.8% |
| Czechoslovakia | 14 | 0.2% |
| Denmark | 19 | 0.2% |
| Eastern Asia | 46 | 0.6% |
| Eastern Europe | 66 | 0.8% |
| El Salvador | 14 | 0.2% |
| England | 61 | 0.7% |
| Europe | 778 | 9.5% |
| France | 113 | 1.4% |
| Germany | 203 | 2.5% |
| Greece | 29 | 0.4% |
| India | 58 | 0.7% |
| Iran | 207 | 2.5% |
| Italy | 18 | 0.2% |
| Japan | 20 | 0.2% |
| Korea | 12 | 0.2% |
| Latin America | 252 | 3.1% |
| Mexico | 80 | 1.0% |
| Netherlands | 14 | 0.2% |
| Nicaragua | 9 | 0.1% |
| Northern Europe | 269 | 3.3% |
| Norway | 50 | 0.6% |
| Philippines | 77 | 0.9% |
| Romania | 11 | 0.1% |
| Russia | 19 | 0.2% |
| South America | 85 | 1.0% |
| South Central Asia | 265 | 3.2% |
| South Eastern Asia | 366 | 4.5% |
| Southern Europe | 96 | 1.2% |
| Spain | 49 | 0.6% |
| Sweden | 16 | 0.2% |
| Turkey | 18 | 0.2% |
| Ukraine | 10 | 0.1% |
| Vietnam | 289 | 3.5% |
| Western Asia | 18 | 0.2% |
| Western Europe | 347 | 4.2% | View All 45 Rows |
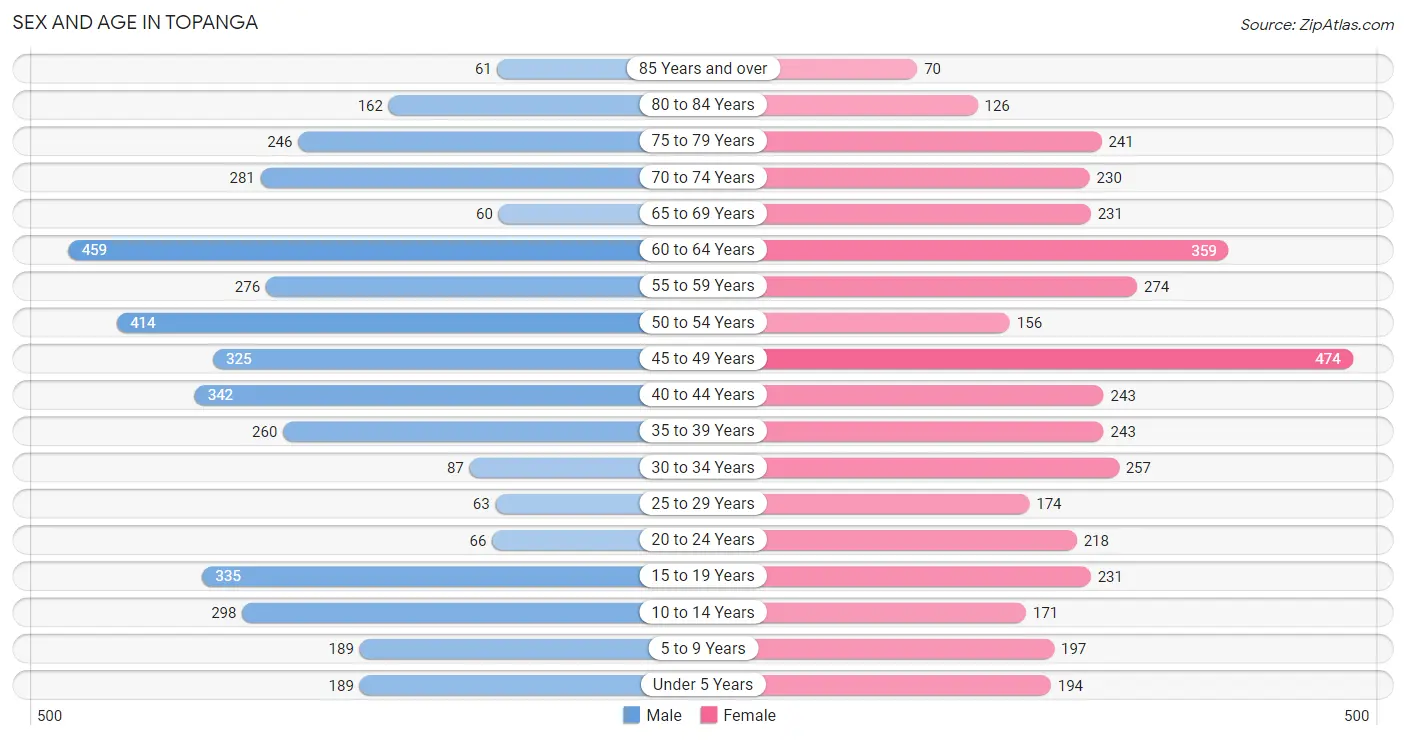
Sex and Age in Topanga
Sex and Age in Topanga
The most populous age groups in Topanga are 60 to 64 Years (459 | 11.2%) for men and 45 to 49 Years (474 | 11.6%) for women.
| Age Bracket | Male | Female |
| Under 5 Years | 189 (4.6%) | 194 (4.7%) |
| 5 to 9 Years | 189 (4.6%) | 197 (4.8%) |
| 10 to 14 Years | 298 (7.2%) | 171 (4.2%) |
| 15 to 19 Years | 335 (8.1%) | 231 (5.7%) |
| 20 to 24 Years | 66 (1.6%) | 218 (5.3%) |
| 25 to 29 Years | 63 (1.5%) | 174 (4.3%) |
| 30 to 34 Years | 87 (2.1%) | 257 (6.3%) |
| 35 to 39 Years | 260 (6.3%) | 243 (5.9%) |
| 40 to 44 Years | 342 (8.3%) | 243 (5.9%) |
| 45 to 49 Years | 325 (7.9%) | 474 (11.6%) |
| 50 to 54 Years | 414 (10.1%) | 156 (3.8%) |
| 55 to 59 Years | 276 (6.7%) | 274 (6.7%) |
| 60 to 64 Years | 459 (11.2%) | 359 (8.8%) |
| 65 to 69 Years | 60 (1.5%) | 231 (5.7%) |
| 70 to 74 Years | 281 (6.8%) | 230 (5.6%) |
| 75 to 79 Years | 246 (6.0%) | 241 (5.9%) |
| 80 to 84 Years | 162 (3.9%) | 126 (3.1%) |
| 85 Years and over | 61 (1.5%) | 70 (1.7%) |
| Total | 4,113 (100.0%) | 4,089 (100.0%) |
Families and Households in Topanga
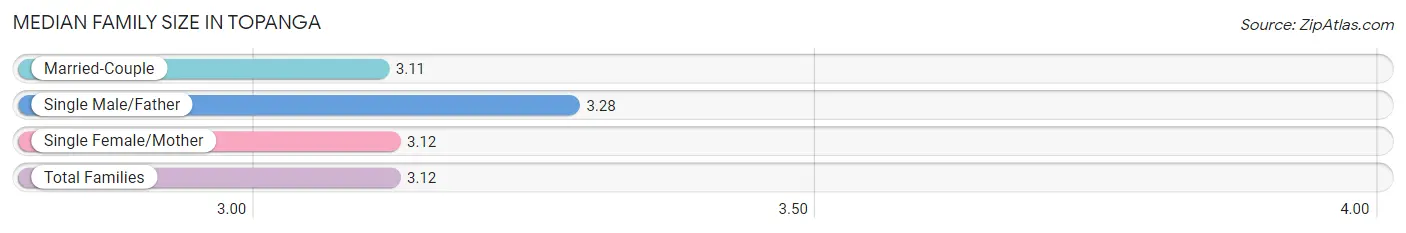
Median Family Size in Topanga
The median family size in Topanga is 3.12 persons per family, with single male/father families (128 | 6.2%) accounting for the largest median family size of 3.28 persons per family. On the other hand, married-couple families (1,684 | 81.6%) represent the smallest median family size with 3.11 persons per family.
| Family Type | # Families | Family Size |
| Married-Couple | 1,684 (81.6%) | 3.11 |
| Single Male/Father | 128 (6.2%) | 3.28 |
| Single Female/Mother | 253 (12.2%) | 3.12 |
| Total Families | 2,065 (100.0%) | 3.12 |
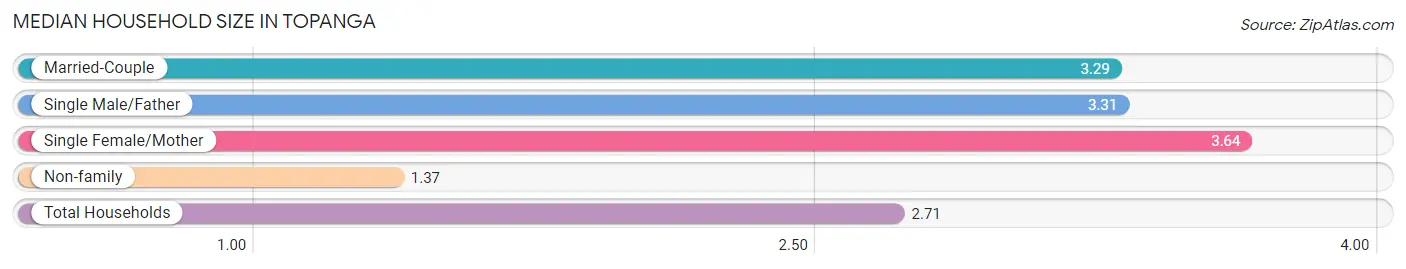
Median Household Size in Topanga
The median household size in Topanga is 2.71 persons per household, with single female/mother households (253 | 8.4%) accounting for the largest median household size of 3.64 persons per household. non-family households (964 | 31.8%) represent the smallest median household size with 1.37 persons per household.
| Household Type | # Households | Household Size |
| Married-Couple | 1,684 (55.6%) | 3.29 |
| Single Male/Father | 128 (4.2%) | 3.31 |
| Single Female/Mother | 253 (8.4%) | 3.64 |
| Non-family | 964 (31.8%) | 1.37 |
| Total Households | 3,029 (100.0%) | 2.71 |
Household Size by Marriage Status in Topanga
Out of a total of 3,029 households in Topanga, 2,065 (68.2%) are family households, while 964 (31.8%) are nonfamily households. The most numerous type of family households are 2-person households, comprising 967, and the most common type of nonfamily households are 1-person households, comprising 720.
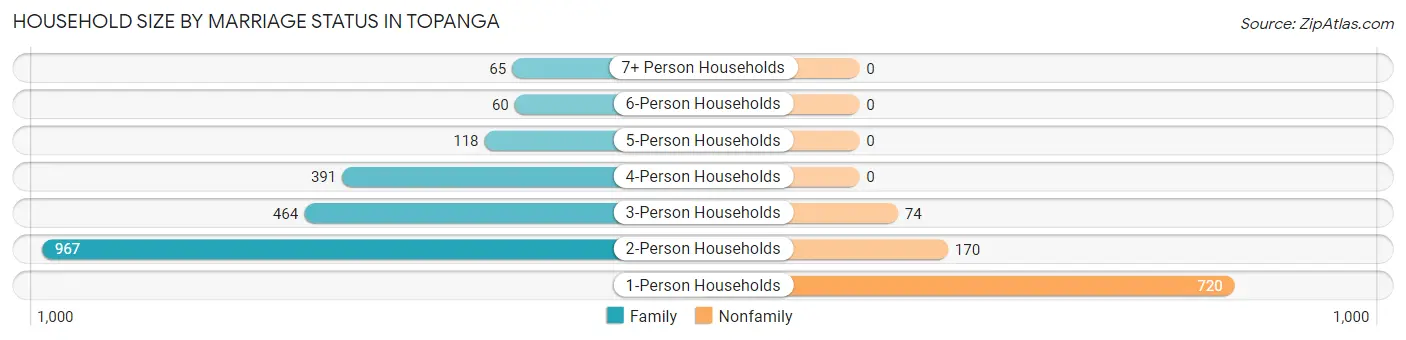
| Household Size | Family Households | Nonfamily Households |
| 1-Person Households | - | 720 (23.8%) |
| 2-Person Households | 967 (31.9%) | 170 (5.6%) |
| 3-Person Households | 464 (15.3%) | 74 (2.4%) |
| 4-Person Households | 391 (12.9%) | 0 (0.0%) |
| 5-Person Households | 118 (3.9%) | 0 (0.0%) |
| 6-Person Households | 60 (2.0%) | 0 (0.0%) |
| 7+ Person Households | 65 (2.1%) | 0 (0.0%) |
| Total | 2,065 (68.2%) | 964 (31.8%) |
Female Fertility in Topanga
Fertility by Age in Topanga
Average fertility rate in Topanga is 34.0 births per 1,000 women. Women in the age bracket of 20 to 34 years have the highest fertility rate with 76.0 births per 1,000 women. Women in the age bracket of 20 to 34 years acount for 77.8% of all women with births.
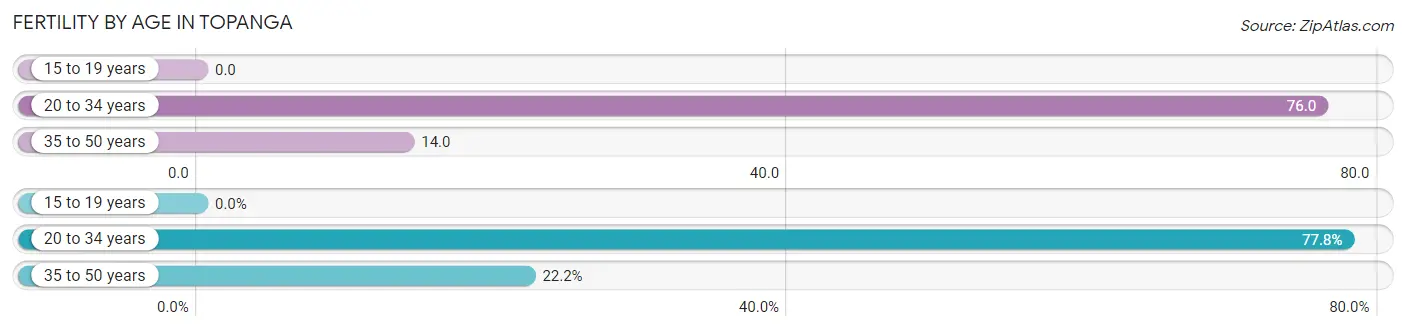
| Age Bracket | Women with Births | Births / 1,000 Women |
| 15 to 19 years | 0 (0.0%) | 0.0 |
| 20 to 34 years | 49 (77.8%) | 76.0 |
| 35 to 50 years | 14 (22.2%) | 14.0 |
| Total | 63 (100.0%) | 34.0 |
Fertility by Age by Marriage Status in Topanga
34.9% of women with births (63) in Topanga are married. The highest percentage of unmarried women with births falls into 20 to 34 years age bracket with 83.7% of them unmarried at the time of birth, while the lowest percentage of unmarried women with births belong to 35 to 50 years age bracket with 0.0% of them unmarried.
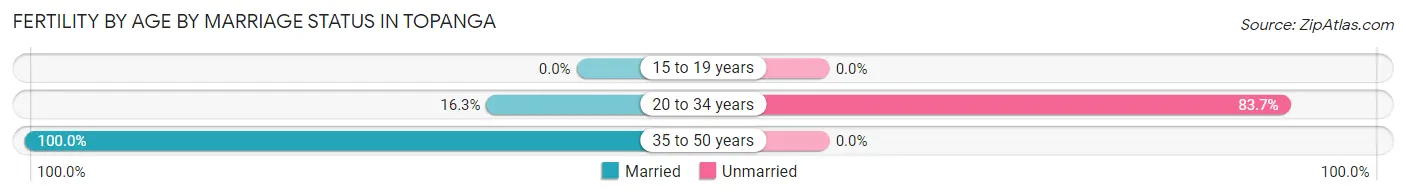
| Age Bracket | Married | Unmarried |
| 15 to 19 years | 0 (0.0%) | 0 (0.0%) |
| 20 to 34 years | 8 (16.3%) | 41 (83.7%) |
| 35 to 50 years | 14 (100.0%) | 0 (0.0%) |
| Total | 22 (34.9%) | 41 (65.1%) |
Fertility by Education in Topanga
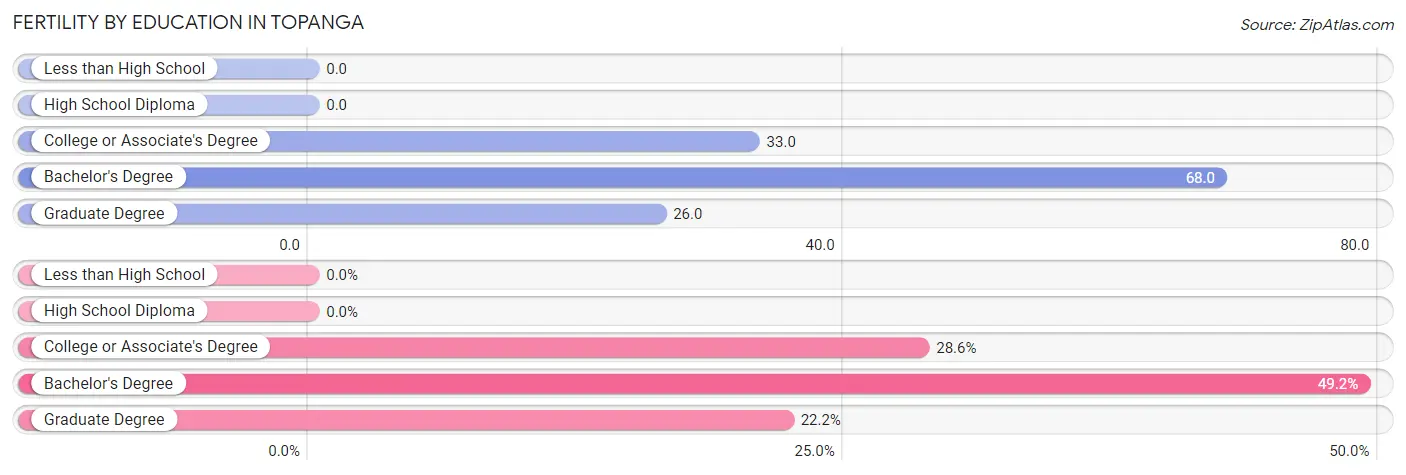
| Educational Attainment | Women with Births | Births / 1,000 Women |
| Less than High School | 0 (0.0%) | 0.0 |
| High School Diploma | 0 (0.0%) | 0.0 |
| College or Associate's Degree | 18 (28.6%) | 33.0 |
| Bachelor's Degree | 31 (49.2%) | 68.0 |
| Graduate Degree | 14 (22.2%) | 26.0 |
| Total | 63 (100.0%) | 34.0 |
Fertility by Education by Marriage Status in Topanga
65.1% of women with births in Topanga are unmarried. Women with the educational attainment of graduate degree are most likely to be married with 100.0% of them married at childbirth, while women with the educational attainment of college or associate's degree are least likely to be married with 100.0% of them unmarried at childbirth.
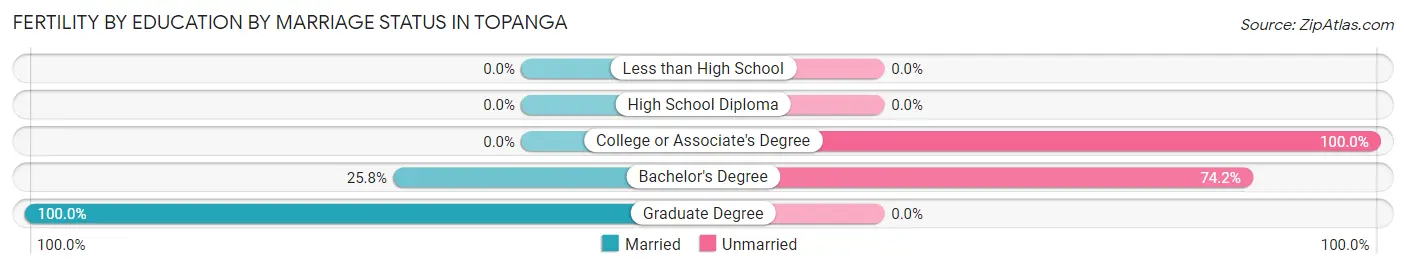
| Educational Attainment | Married | Unmarried |
| Less than High School | 0 (0.0%) | 0 (0.0%) |
| High School Diploma | 0 (0.0%) | 0 (0.0%) |
| College or Associate's Degree | 0 (0.0%) | 18 (100.0%) |
| Bachelor's Degree | 8 (25.8%) | 23 (74.2%) |
| Graduate Degree | 14 (100.0%) | 0 (0.0%) |
| Total | 22 (34.9%) | 41 (65.1%) |
Employment Characteristics in Topanga
Employment by Class of Employer in Topanga
Among the 3,958 employed individuals in Topanga, private company employees (1,919 | 48.5%), self-employed (not incorporated) (793 | 20.0%), and self-employed (incorporated) (523 | 13.2%) make up the most common classes of employment.
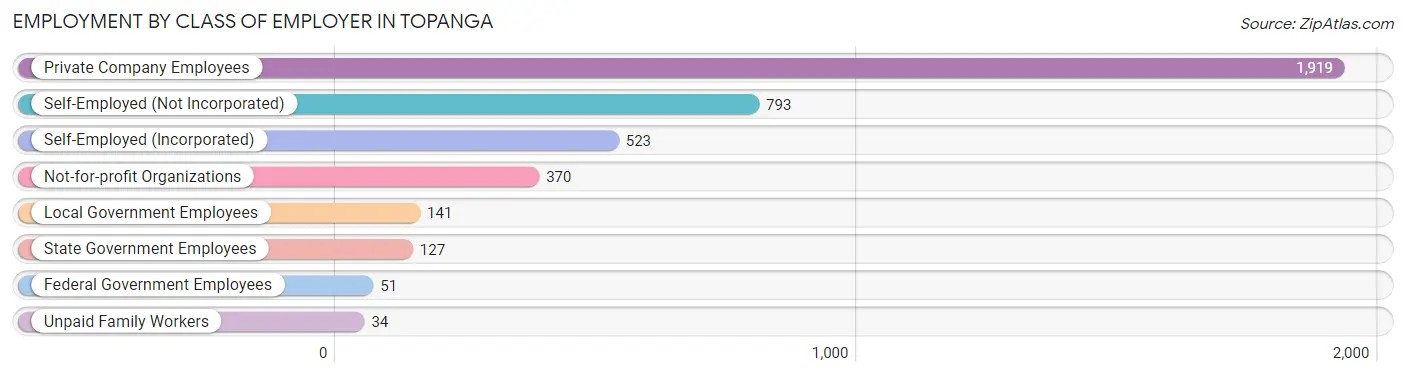
| Employer Class | # Employees | % Employees |
| Private Company Employees | 1,919 | 48.5% |
| Self-Employed (Incorporated) | 523 | 13.2% |
| Self-Employed (Not Incorporated) | 793 | 20.0% |
| Not-for-profit Organizations | 370 | 9.3% |
| Local Government Employees | 141 | 3.6% |
| State Government Employees | 127 | 3.2% |
| Federal Government Employees | 51 | 1.3% |
| Unpaid Family Workers | 34 | 0.9% |
| Total | 3,958 | 100.0% |
Employment Status by Age in Topanga
According to the labor force statistics for Topanga, out of the total population over 16 years of age (6,785), 64.5% or 4,376 individuals are in the labor force, with 7.2% or 315 of them unemployed. The age group with the highest labor force participation rate is 55 to 59 years, with 85.8% or 472 individuals in the labor force. Within the labor force, the 20 to 24 years age range has the highest percentage of unemployed individuals, with 21.3% or 49 of them being unemployed.
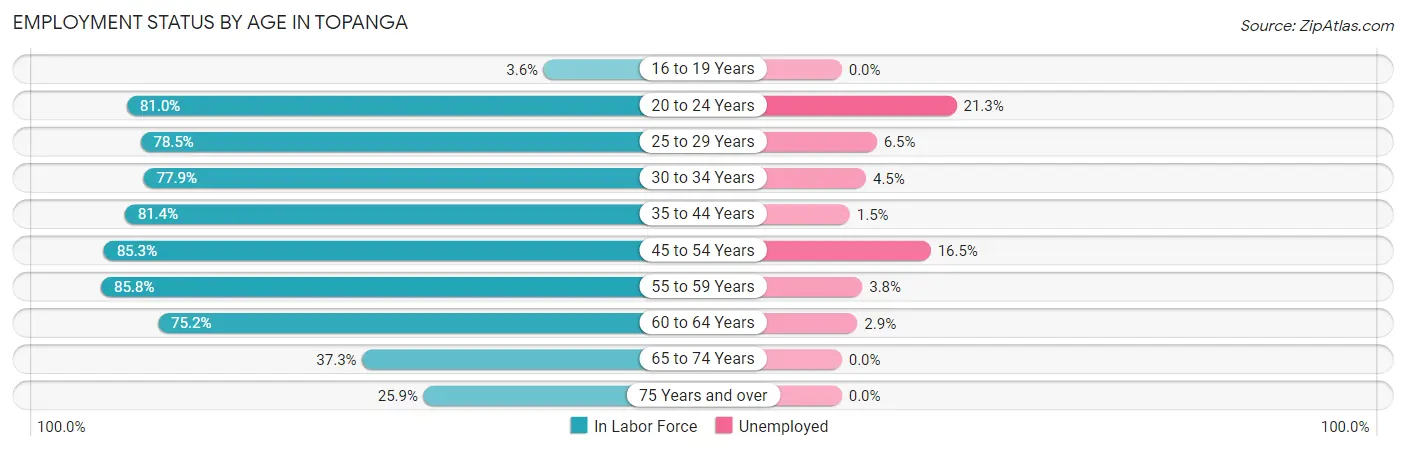
| Age Bracket | In Labor Force | Unemployed |
| 16 to 19 Years | 14 (3.6%) | 0 (0.0%) |
| 20 to 24 Years | 230 (81.0%) | 49 (21.3%) |
| 25 to 29 Years | 186 (78.5%) | 12 (6.5%) |
| 30 to 34 Years | 268 (77.9%) | 12 (4.5%) |
| 35 to 44 Years | 886 (81.4%) | 13 (1.5%) |
| 45 to 54 Years | 1,168 (85.3%) | 193 (16.5%) |
| 55 to 59 Years | 472 (85.8%) | 18 (3.8%) |
| 60 to 64 Years | 615 (75.2%) | 18 (2.9%) |
| 65 to 74 Years | 299 (37.3%) | 0 (0.0%) |
| 75 Years and over | 235 (25.9%) | 0 (0.0%) |
| Total | 4,376 (64.5%) | 315 (7.2%) |
Employment Status by Educational Attainment in Topanga
According to labor force statistics for Topanga, 81.6% of individuals (3,595) out of the total population between 25 and 64 years of age (4,406) are in the labor force, with 7.4% or 266 of them being unemployed. The group with the highest labor force participation rate are those with the educational attainment of less than high school, with 98.5% or 194 individuals in the labor force. Within the labor force, individuals with less than high school education have the highest percentage of unemployment, with 37.6% or 73 of them being unemployed.
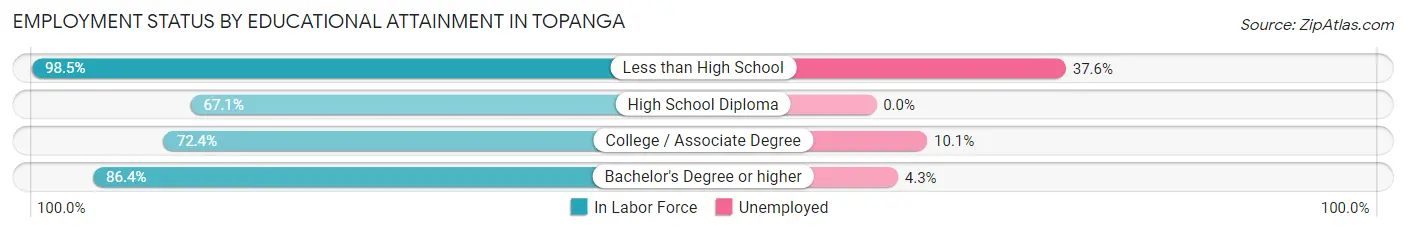
| Educational Attainment | In Labor Force | Unemployed |
| Less than High School | 194 (98.5%) | 74 (37.6%) |
| High School Diploma | 190 (67.1%) | 0 (0.0%) |
| College / Associate Degree | 935 (72.4%) | 130 (10.1%) |
| Bachelor's Degree or higher | 2,277 (86.4%) | 113 (4.3%) |
| Total | 3,595 (81.6%) | 326 (7.4%) |
Employment Occupations by Sex in Topanga
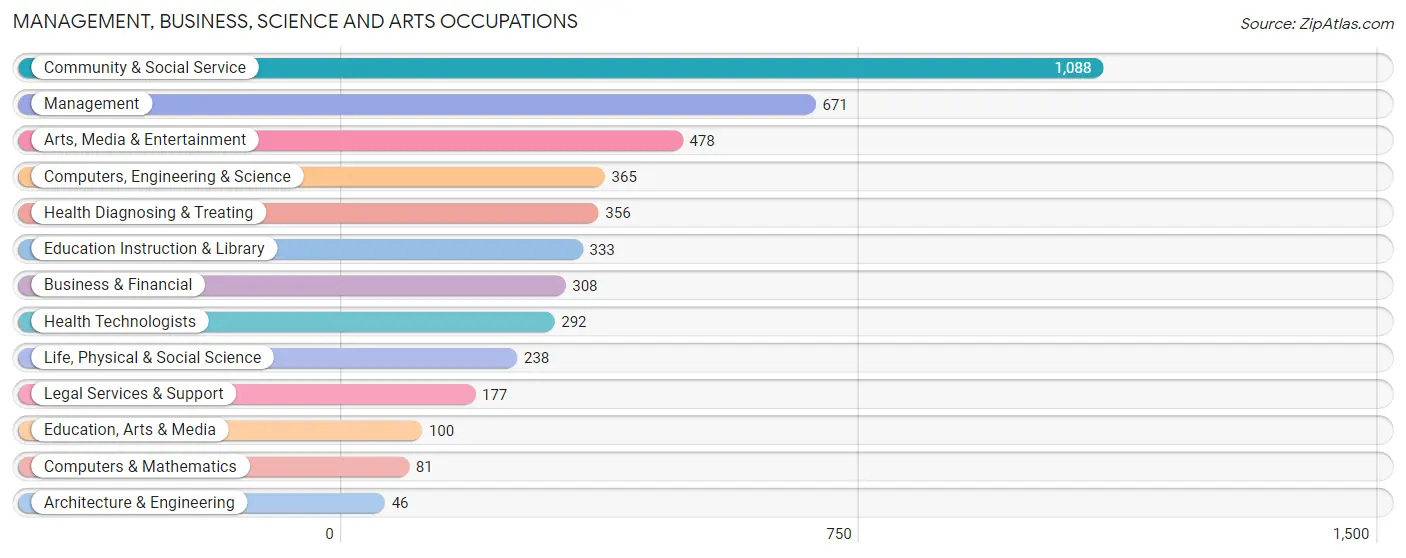
Management, Business, Science and Arts Occupations
The most common Management, Business, Science and Arts occupations in Topanga are Community & Social Service (1,088 | 26.8%), Management (671 | 16.5%), Arts, Media & Entertainment (478 | 11.8%), Computers, Engineering & Science (365 | 9.0%), and Health Diagnosing & Treating (356 | 8.8%).
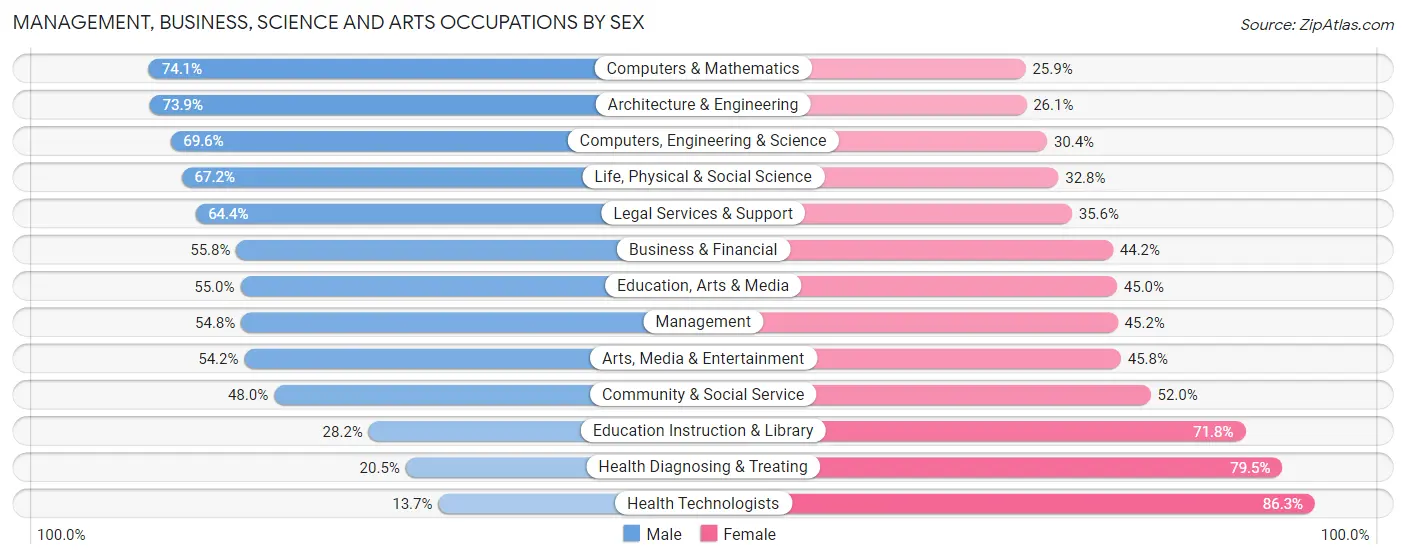
Management, Business, Science and Arts Occupations by Sex
Within the Management, Business, Science and Arts occupations in Topanga, the most male-oriented occupations are Computers & Mathematics (74.1%), Architecture & Engineering (73.9%), and Computers, Engineering & Science (69.6%), while the most female-oriented occupations are Health Technologists (86.3%), Health Diagnosing & Treating (79.5%), and Education Instruction & Library (71.8%).
| Occupation | Male | Female |
| Management | 368 (54.8%) | 303 (45.2%) |
| Business & Financial | 172 (55.8%) | 136 (44.2%) |
| Computers, Engineering & Science | 254 (69.6%) | 111 (30.4%) |
| Computers & Mathematics | 60 (74.1%) | 21 (25.9%) |
| Architecture & Engineering | 34 (73.9%) | 12 (26.1%) |
| Life, Physical & Social Science | 160 (67.2%) | 78 (32.8%) |
| Community & Social Service | 522 (48.0%) | 566 (52.0%) |
| Education, Arts & Media | 55 (55.0%) | 45 (45.0%) |
| Legal Services & Support | 114 (64.4%) | 63 (35.6%) |
| Education Instruction & Library | 94 (28.2%) | 239 (71.8%) |
| Arts, Media & Entertainment | 259 (54.2%) | 219 (45.8%) |
| Health Diagnosing & Treating | 73 (20.5%) | 283 (79.5%) |
| Health Technologists | 40 (13.7%) | 252 (86.3%) |
| Total (Category) | 1,389 (49.8%) | 1,399 (50.2%) |
| Total (Overall) | 2,135 (52.6%) | 1,923 (47.4%) |
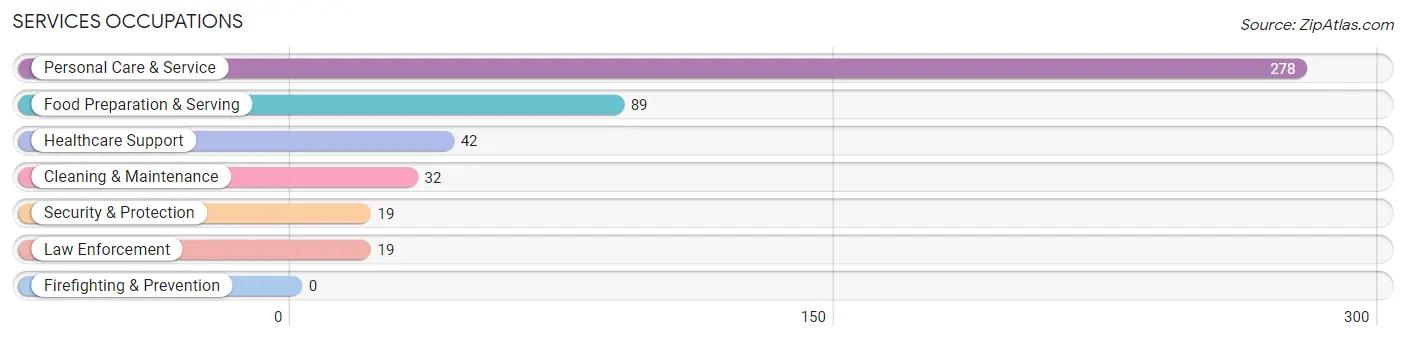
Services Occupations
The most common Services occupations in Topanga are Personal Care & Service (278 | 6.9%), Food Preparation & Serving (89 | 2.2%), Healthcare Support (42 | 1.0%), Cleaning & Maintenance (32 | 0.8%), and Security & Protection (19 | 0.5%).
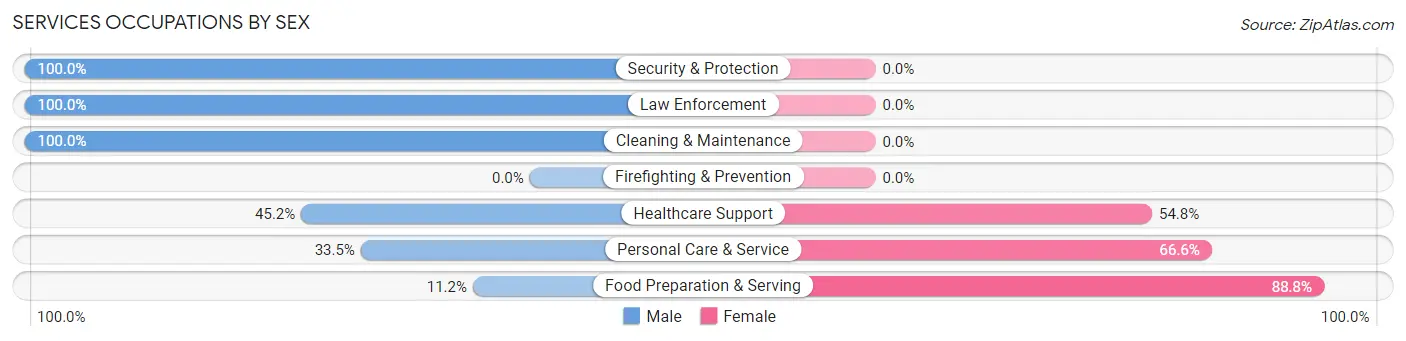
Services Occupations by Sex
Within the Services occupations in Topanga, the most male-oriented occupations are Security & Protection (100.0%), Law Enforcement (100.0%), and Cleaning & Maintenance (100.0%), while the most female-oriented occupations are Food Preparation & Serving (88.8%), Personal Care & Service (66.5%), and Healthcare Support (54.8%).
| Occupation | Male | Female |
| Healthcare Support | 19 (45.2%) | 23 (54.8%) |
| Security & Protection | 19 (100.0%) | 0 (0.0%) |
| Firefighting & Prevention | 0 (0.0%) | 0 (0.0%) |
| Law Enforcement | 19 (100.0%) | 0 (0.0%) |
| Food Preparation & Serving | 10 (11.2%) | 79 (88.8%) |
| Cleaning & Maintenance | 32 (100.0%) | 0 (0.0%) |
| Personal Care & Service | 93 (33.5%) | 185 (66.5%) |
| Total (Category) | 173 (37.6%) | 287 (62.4%) |
| Total (Overall) | 2,135 (52.6%) | 1,923 (47.4%) |
Sales and Office Occupations
The most common Sales and Office occupations in Topanga are Sales & Related (235 | 5.8%), and Office & Administration (226 | 5.6%).
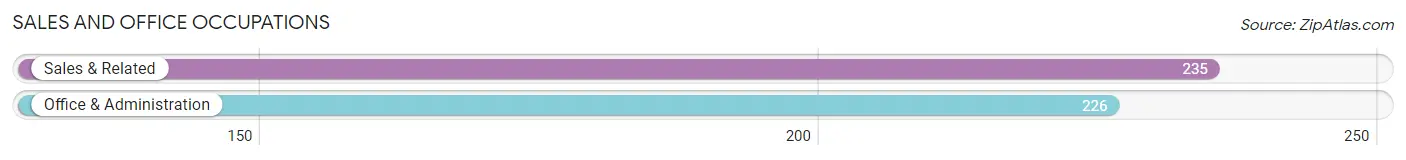
Sales and Office Occupations by Sex
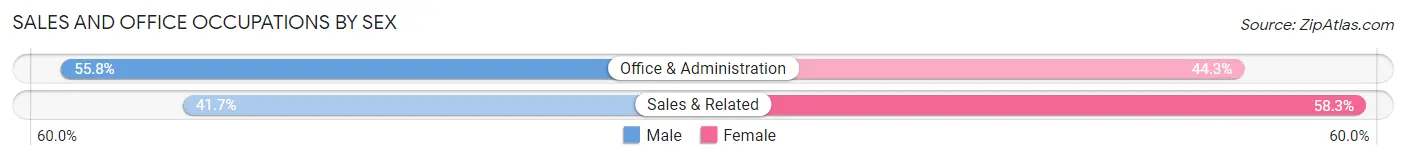
| Occupation | Male | Female |
| Sales & Related | 98 (41.7%) | 137 (58.3%) |
| Office & Administration | 126 (55.7%) | 100 (44.3%) |
| Total (Category) | 224 (48.6%) | 237 (51.4%) |
| Total (Overall) | 2,135 (52.6%) | 1,923 (47.4%) |
Natural Resources, Construction and Maintenance Occupations
The most common Natural Resources, Construction and Maintenance occupations in Topanga are Installation, Maintenance & Repair (147 | 3.6%), and Construction & Extraction (76 | 1.9%).
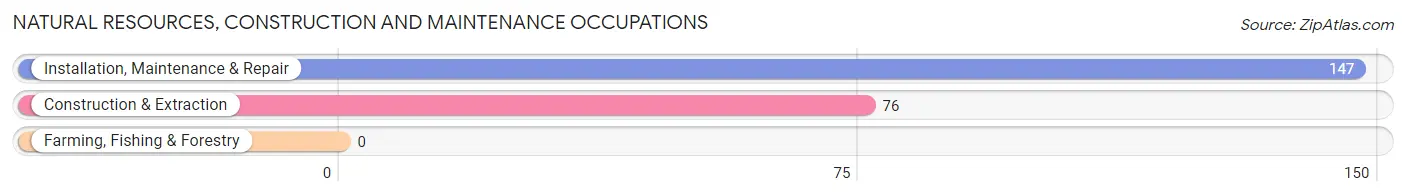
Natural Resources, Construction and Maintenance Occupations by Sex
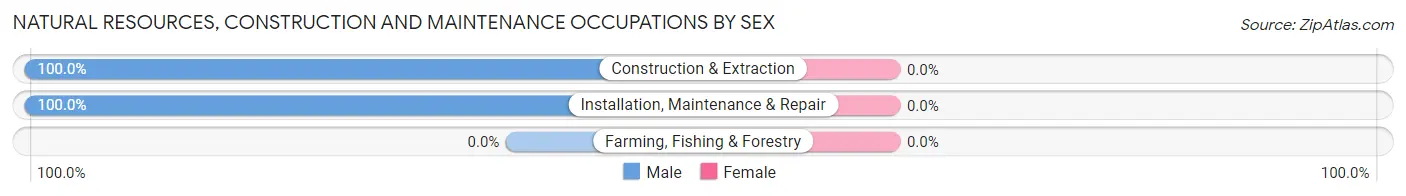
| Occupation | Male | Female |
| Farming, Fishing & Forestry | 0 (0.0%) | 0 (0.0%) |
| Construction & Extraction | 76 (100.0%) | 0 (0.0%) |
| Installation, Maintenance & Repair | 147 (100.0%) | 0 (0.0%) |
| Total (Category) | 223 (100.0%) | 0 (0.0%) |
| Total (Overall) | 2,135 (52.6%) | 1,923 (47.4%) |
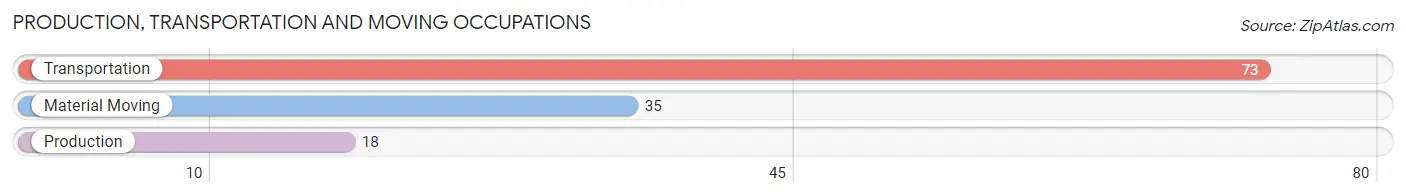
Production, Transportation and Moving Occupations
The most common Production, Transportation and Moving occupations in Topanga are Transportation (73 | 1.8%), Material Moving (35 | 0.9%), and Production (18 | 0.4%).
Production, Transportation and Moving Occupations by Sex
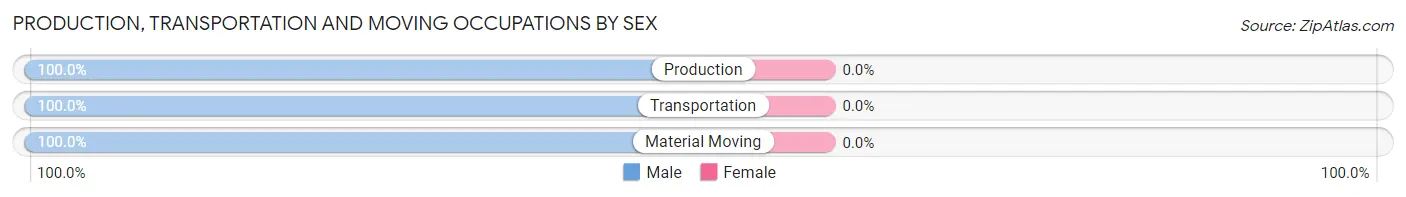
| Occupation | Male | Female |
| Production | 18 (100.0%) | 0 (0.0%) |
| Transportation | 73 (100.0%) | 0 (0.0%) |
| Material Moving | 35 (100.0%) | 0 (0.0%) |
| Total (Category) | 126 (100.0%) | 0 (0.0%) |
| Total (Overall) | 2,135 (52.6%) | 1,923 (47.4%) |
Employment Industries by Sex in Topanga
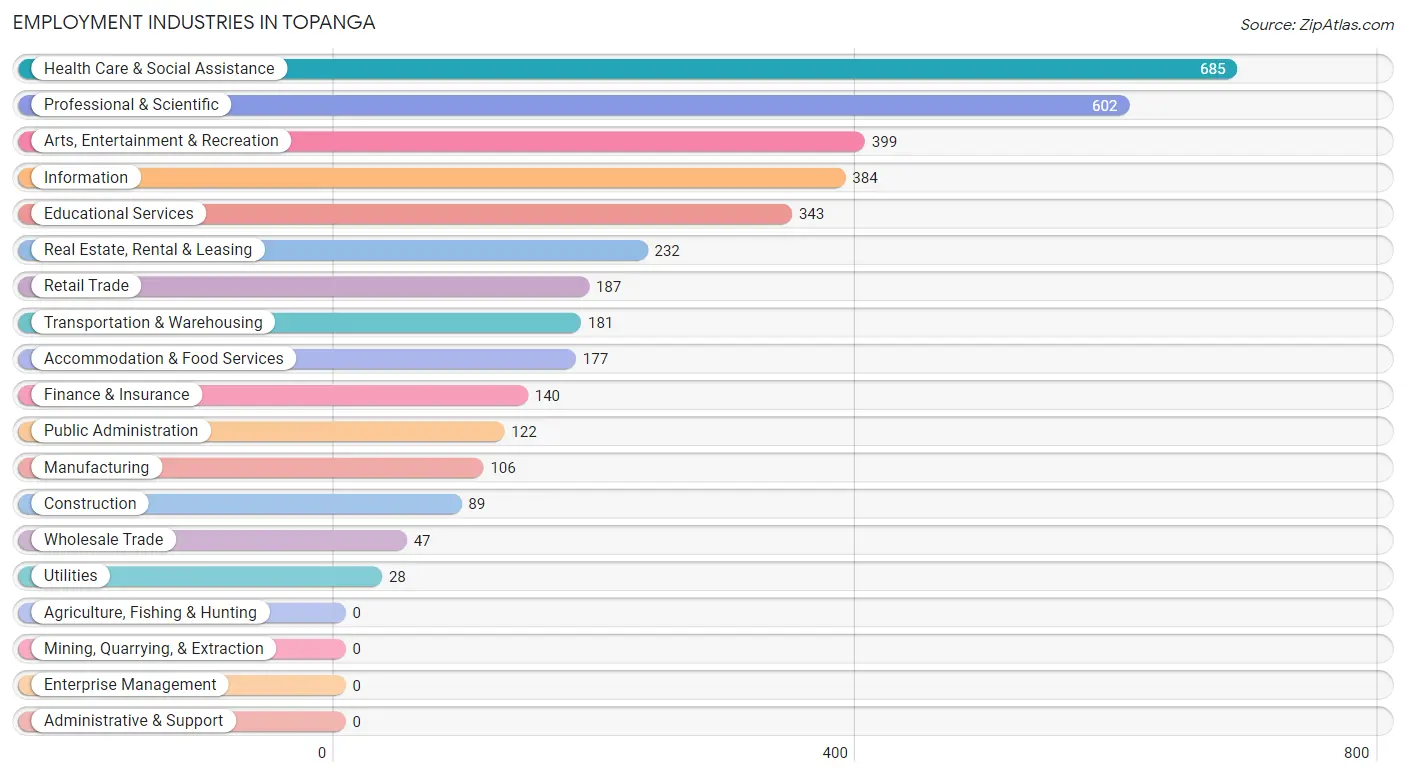
Employment Industries in Topanga
The major employment industries in Topanga include Health Care & Social Assistance (685 | 16.9%), Professional & Scientific (602 | 14.8%), Arts, Entertainment & Recreation (399 | 9.8%), Information (384 | 9.5%), and Educational Services (343 | 8.5%).
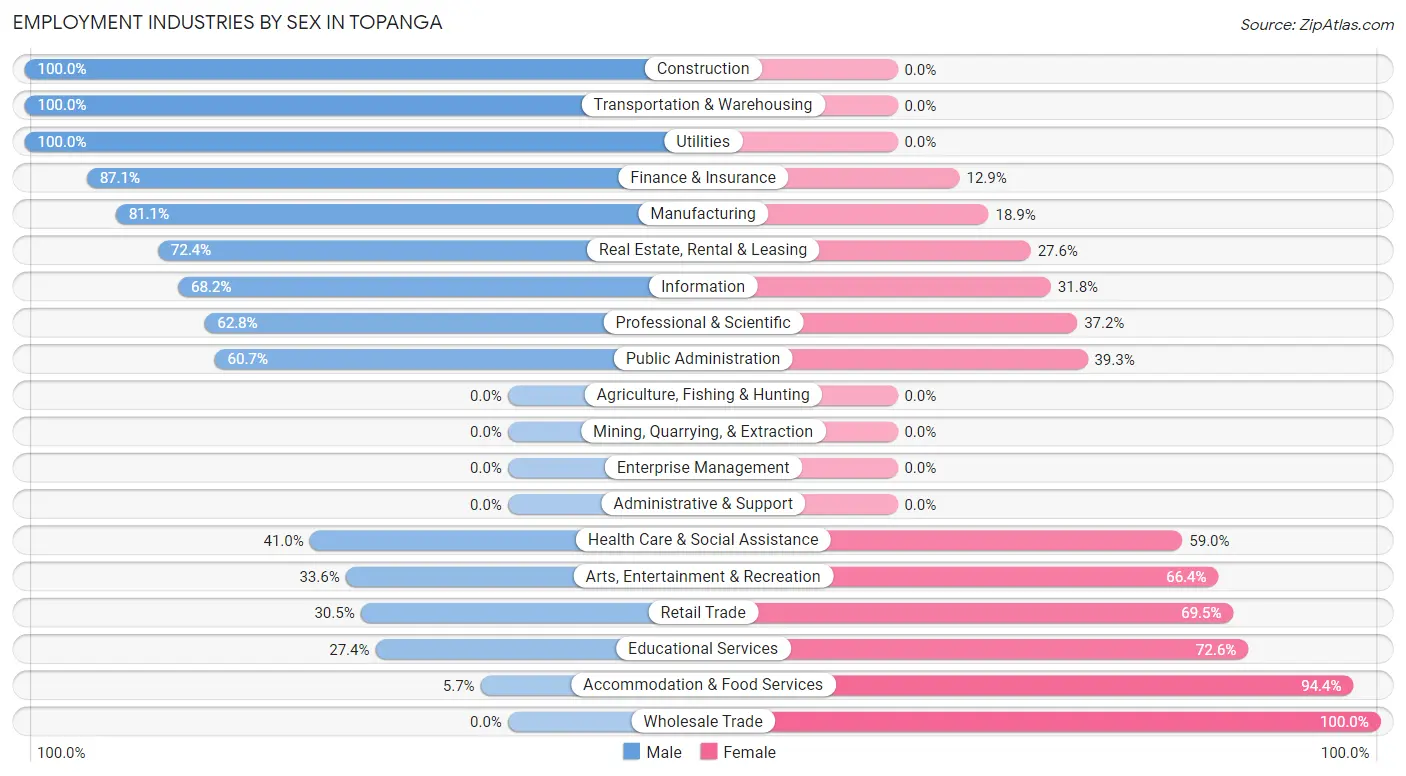
Employment Industries by Sex in Topanga
The Topanga industries that see more men than women are Construction (100.0%), Transportation & Warehousing (100.0%), and Utilities (100.0%), whereas the industries that tend to have a higher number of women are Wholesale Trade (100.0%), Accommodation & Food Services (94.4%), and Educational Services (72.6%).
| Industry | Male | Female |
| Agriculture, Fishing & Hunting | 0 (0.0%) | 0 (0.0%) |
| Mining, Quarrying, & Extraction | 0 (0.0%) | 0 (0.0%) |
| Construction | 89 (100.0%) | 0 (0.0%) |
| Manufacturing | 86 (81.1%) | 20 (18.9%) |
| Wholesale Trade | 0 (0.0%) | 47 (100.0%) |
| Retail Trade | 57 (30.5%) | 130 (69.5%) |
| Transportation & Warehousing | 181 (100.0%) | 0 (0.0%) |
| Utilities | 28 (100.0%) | 0 (0.0%) |
| Information | 262 (68.2%) | 122 (31.8%) |
| Finance & Insurance | 122 (87.1%) | 18 (12.9%) |
| Real Estate, Rental & Leasing | 168 (72.4%) | 64 (27.6%) |
| Professional & Scientific | 378 (62.8%) | 224 (37.2%) |
| Enterprise Management | 0 (0.0%) | 0 (0.0%) |
| Administrative & Support | 0 (0.0%) | 0 (0.0%) |
| Educational Services | 94 (27.4%) | 249 (72.6%) |
| Health Care & Social Assistance | 281 (41.0%) | 404 (59.0%) |
| Arts, Entertainment & Recreation | 134 (33.6%) | 265 (66.4%) |
| Accommodation & Food Services | 10 (5.7%) | 167 (94.4%) |
| Public Administration | 74 (60.7%) | 48 (39.3%) |
| Total | 2,135 (52.6%) | 1,923 (47.4%) |
Education in Topanga
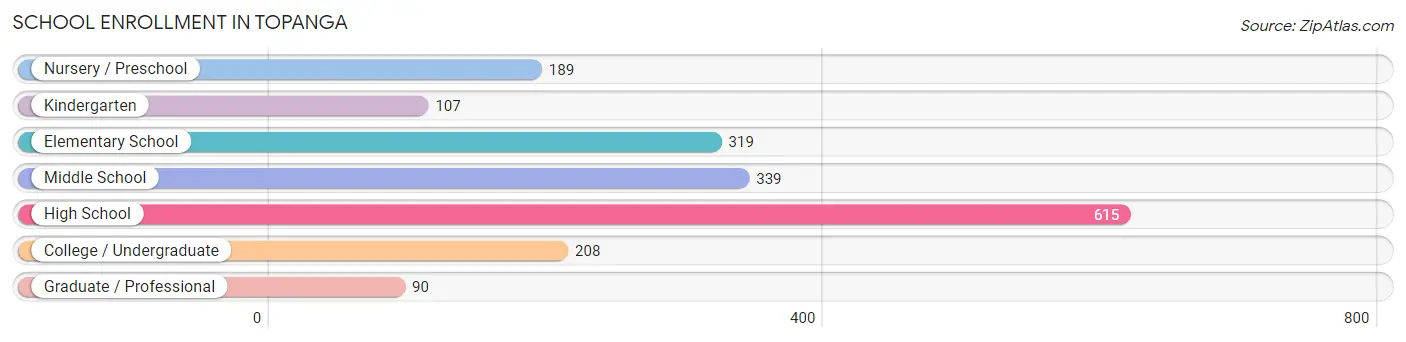
School Enrollment in Topanga
The most common levels of schooling among the 1,867 students in Topanga are high school (615 | 32.9%), middle school (339 | 18.2%), and elementary school (319 | 17.1%).
| School Level | # Students | % Students |
| Nursery / Preschool | 189 | 10.1% |
| Kindergarten | 107 | 5.7% |
| Elementary School | 319 | 17.1% |
| Middle School | 339 | 18.2% |
| High School | 615 | 32.9% |
| College / Undergraduate | 208 | 11.1% |
| Graduate / Professional | 90 | 4.8% |
| Total | 1,867 | 100.0% |
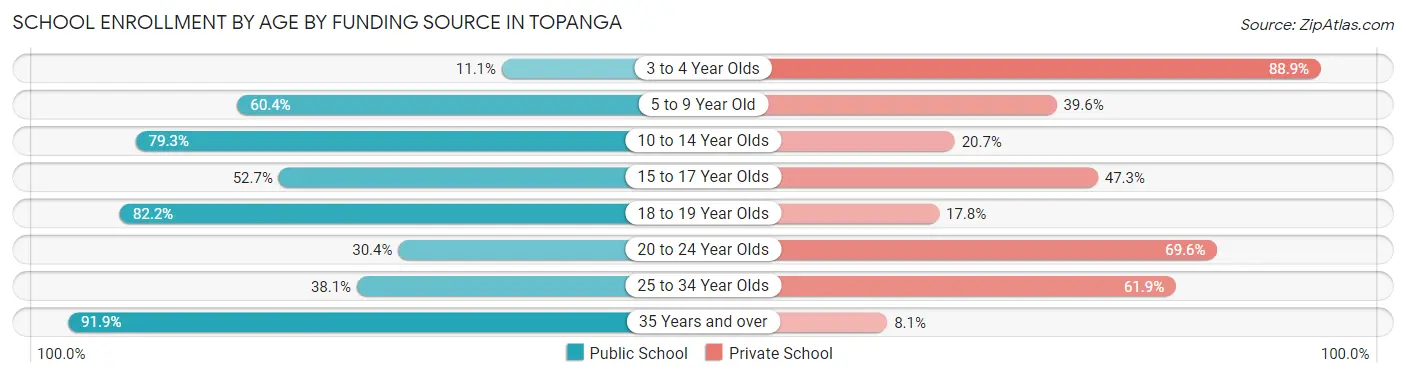
School Enrollment by Age by Funding Source in Topanga
Out of a total of 1,867 students who are enrolled in schools in Topanga, 751 (40.2%) attend a private institution, while the remaining 1,116 (59.8%) are enrolled in public schools. The age group of 3 to 4 year olds has the highest likelihood of being enrolled in private schools, with 168 (88.9% in the age bracket) enrolled. Conversely, the age group of 35 years and over has the lowest likelihood of being enrolled in a private school, with 102 (91.9% in the age bracket) attending a public institution.
| Age Bracket | Public School | Private School |
| 3 to 4 Year Olds | 21 (11.1%) | 168 (88.9%) |
| 5 to 9 Year Old | 233 (60.4%) | 153 (39.6%) |
| 10 to 14 Year Olds | 372 (79.3%) | 97 (20.7%) |
| 15 to 17 Year Olds | 218 (52.7%) | 196 (47.3%) |
| 18 to 19 Year Olds | 125 (82.2%) | 27 (17.8%) |
| 20 to 24 Year Olds | 38 (30.4%) | 87 (69.6%) |
| 25 to 34 Year Olds | 8 (38.1%) | 13 (61.9%) |
| 35 Years and over | 102 (91.9%) | 9 (8.1%) |
| Total | 1,116 (59.8%) | 751 (40.2%) |
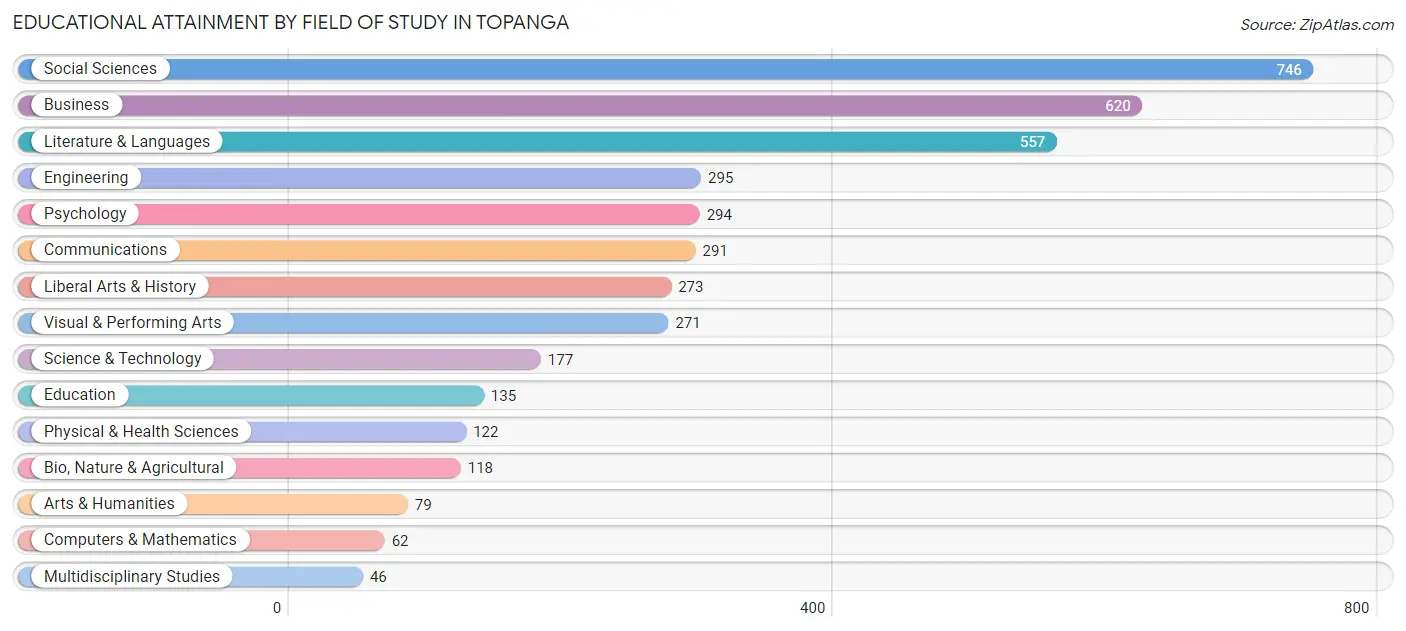
Educational Attainment by Field of Study in Topanga
Social sciences (746 | 18.3%), business (620 | 15.2%), literature & languages (557 | 13.6%), engineering (295 | 7.2%), and psychology (294 | 7.2%) are the most common fields of study among 4,086 individuals in Topanga who have obtained a bachelor's degree or higher.
| Field of Study | # Graduates | % Graduates |
| Computers & Mathematics | 62 | 1.5% |
| Bio, Nature & Agricultural | 118 | 2.9% |
| Physical & Health Sciences | 122 | 3.0% |
| Psychology | 294 | 7.2% |
| Social Sciences | 746 | 18.3% |
| Engineering | 295 | 7.2% |
| Multidisciplinary Studies | 46 | 1.1% |
| Science & Technology | 177 | 4.3% |
| Business | 620 | 15.2% |
| Education | 135 | 3.3% |
| Literature & Languages | 557 | 13.6% |
| Liberal Arts & History | 273 | 6.7% |
| Visual & Performing Arts | 271 | 6.6% |
| Communications | 291 | 7.1% |
| Arts & Humanities | 79 | 1.9% |
| Total | 4,086 | 100.0% |
Transportation & Commute in Topanga
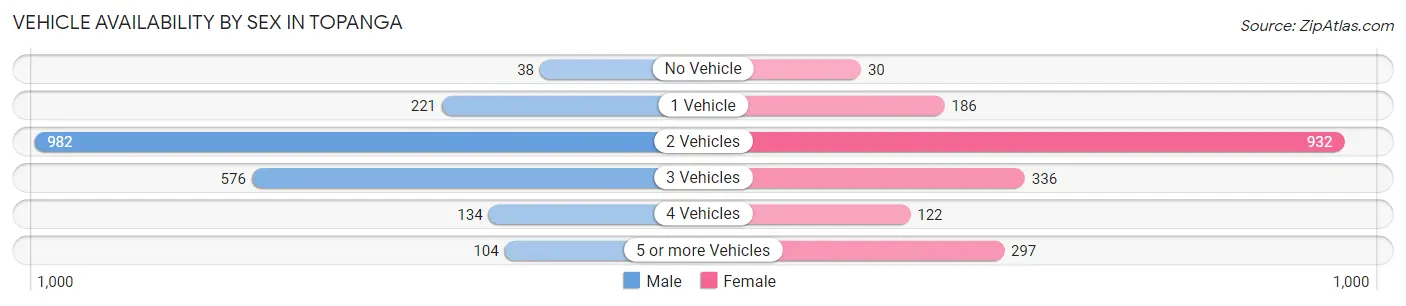
Vehicle Availability by Sex in Topanga
The most prevalent vehicle ownership categories in Topanga are males with 2 vehicles (982, accounting for 47.8%) and females with 2 vehicles (932, making up 51.6%).
| Vehicles Available | Male | Female |
| No Vehicle | 38 (1.8%) | 30 (1.6%) |
| 1 Vehicle | 221 (10.7%) | 186 (9.8%) |
| 2 Vehicles | 982 (47.8%) | 932 (49.0%) |
| 3 Vehicles | 576 (28.0%) | 336 (17.7%) |
| 4 Vehicles | 134 (6.5%) | 122 (6.4%) |
| 5 or more Vehicles | 104 (5.1%) | 297 (15.6%) |
| Total | 2,055 (100.0%) | 1,903 (100.0%) |
Commute Time in Topanga
The most frequently occuring commute durations in Topanga are 30 to 34 minutes (520 commuters, 18.5%), 60 to 89 minutes (379 commuters, 13.5%), and 45 to 59 minutes (350 commuters, 12.5%).
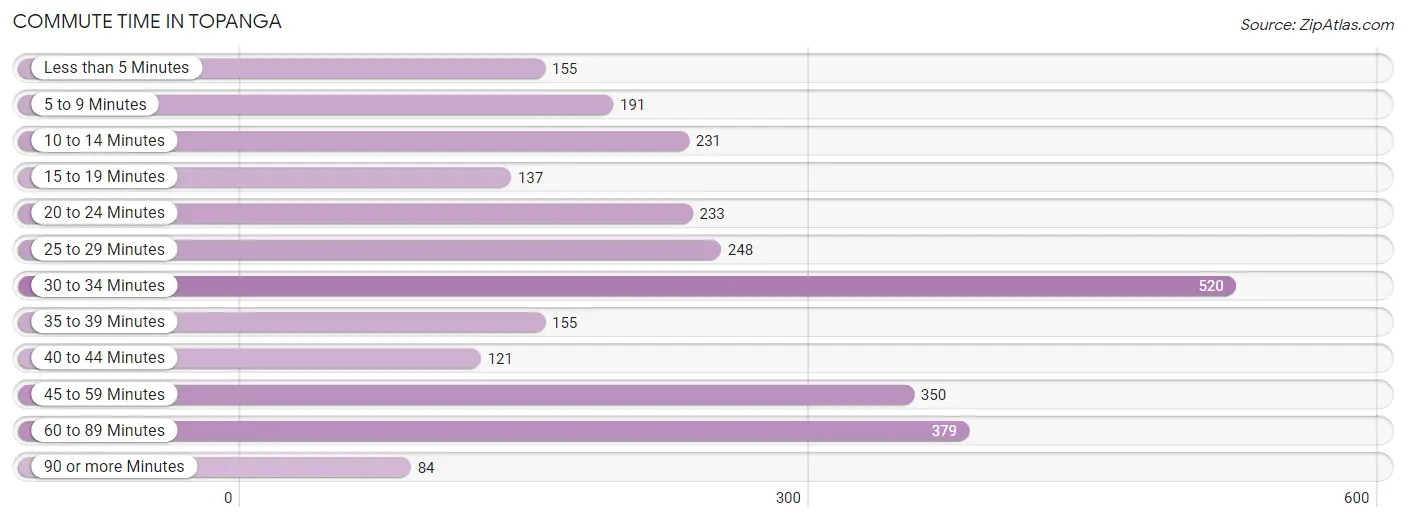
| Commute Time | # Commuters | % Commuters |
| Less than 5 Minutes | 155 | 5.5% |
| 5 to 9 Minutes | 191 | 6.8% |
| 10 to 14 Minutes | 231 | 8.2% |
| 15 to 19 Minutes | 137 | 4.9% |
| 20 to 24 Minutes | 233 | 8.3% |
| 25 to 29 Minutes | 248 | 8.8% |
| 30 to 34 Minutes | 520 | 18.5% |
| 35 to 39 Minutes | 155 | 5.5% |
| 40 to 44 Minutes | 121 | 4.3% |
| 45 to 59 Minutes | 350 | 12.5% |
| 60 to 89 Minutes | 379 | 13.5% |
| 90 or more Minutes | 84 | 3.0% |
Commute Time by Sex in Topanga
The most common commute times in Topanga are 30 to 34 minutes (260 commuters, 19.0%) for males and 30 to 34 minutes (260 commuters, 18.1%) for females.
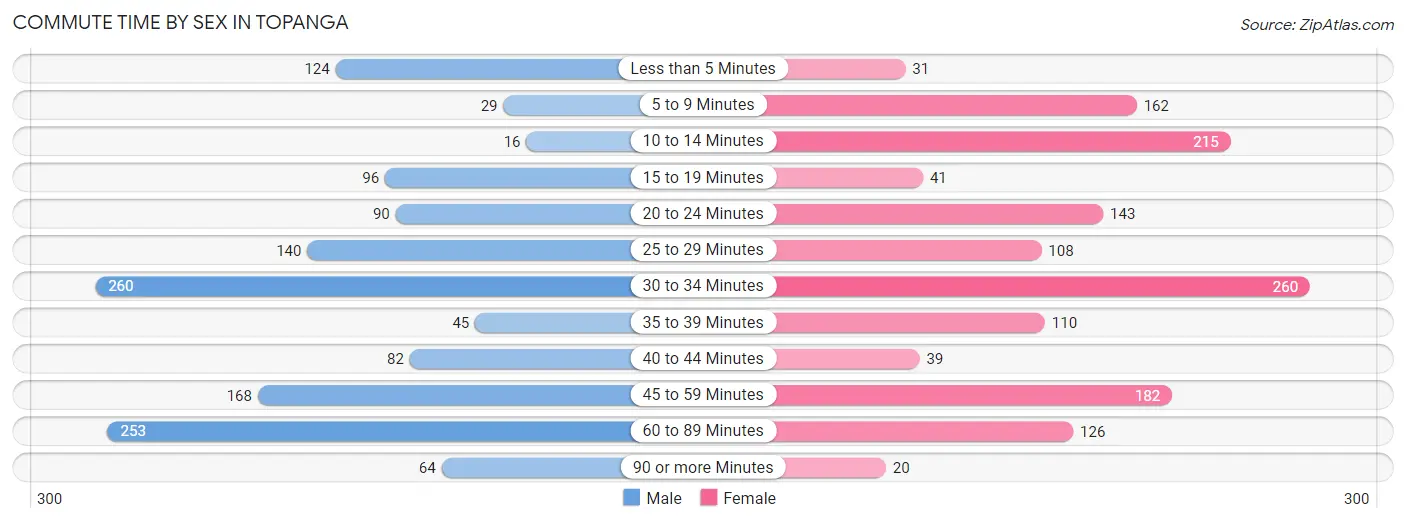
| Commute Time | Male | Female |
| Less than 5 Minutes | 124 (9.1%) | 31 (2.2%) |
| 5 to 9 Minutes | 29 (2.1%) | 162 (11.3%) |
| 10 to 14 Minutes | 16 (1.2%) | 215 (15.0%) |
| 15 to 19 Minutes | 96 (7.0%) | 41 (2.9%) |
| 20 to 24 Minutes | 90 (6.6%) | 143 (10.0%) |
| 25 to 29 Minutes | 140 (10.2%) | 108 (7.5%) |
| 30 to 34 Minutes | 260 (19.0%) | 260 (18.1%) |
| 35 to 39 Minutes | 45 (3.3%) | 110 (7.6%) |
| 40 to 44 Minutes | 82 (6.0%) | 39 (2.7%) |
| 45 to 59 Minutes | 168 (12.3%) | 182 (12.7%) |
| 60 to 89 Minutes | 253 (18.5%) | 126 (8.8%) |
| 90 or more Minutes | 64 (4.7%) | 20 (1.4%) |
Time of Departure to Work by Sex in Topanga
The most frequent times of departure to work in Topanga are 8:00 AM to 8:29 AM (296, 21.6%) for males and 9:00 AM to 9:59 AM (317, 22.1%) for females.
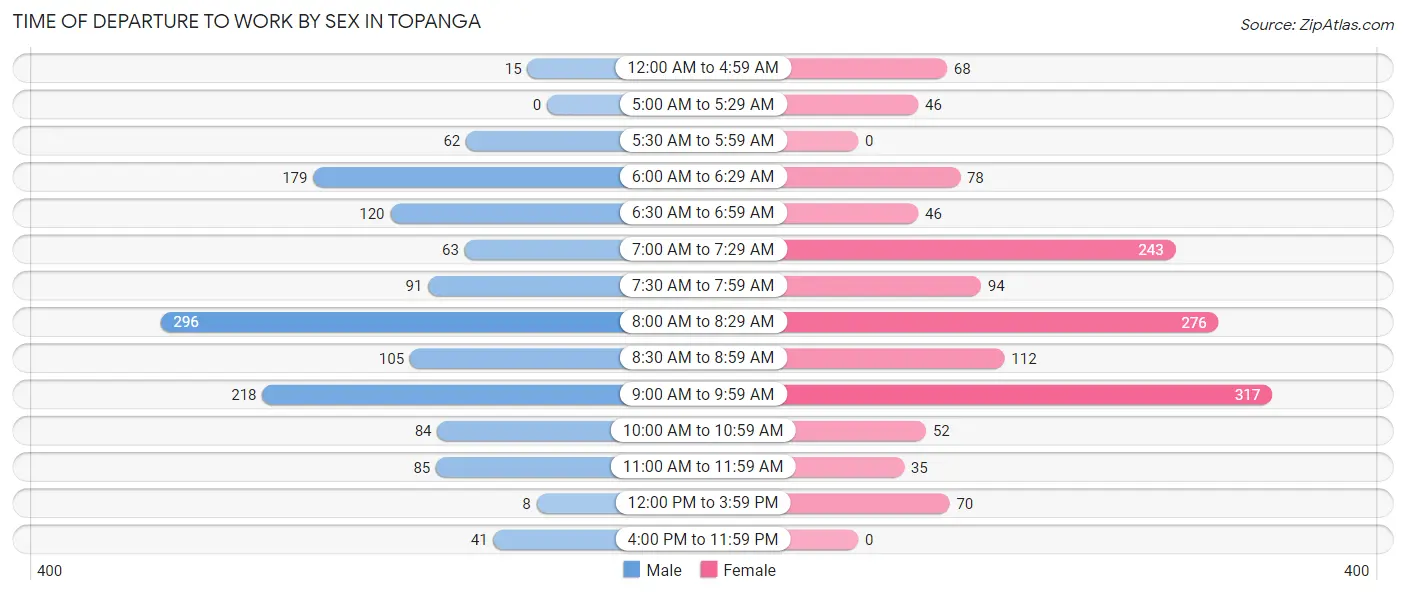
| Time of Departure | Male | Female |
| 12:00 AM to 4:59 AM | 15 (1.1%) | 68 (4.7%) |
| 5:00 AM to 5:29 AM | 0 (0.0%) | 46 (3.2%) |
| 5:30 AM to 5:59 AM | 62 (4.5%) | 0 (0.0%) |
| 6:00 AM to 6:29 AM | 179 (13.1%) | 78 (5.4%) |
| 6:30 AM to 6:59 AM | 120 (8.8%) | 46 (3.2%) |
| 7:00 AM to 7:29 AM | 63 (4.6%) | 243 (16.9%) |
| 7:30 AM to 7:59 AM | 91 (6.7%) | 94 (6.5%) |
| 8:00 AM to 8:29 AM | 296 (21.6%) | 276 (19.2%) |
| 8:30 AM to 8:59 AM | 105 (7.7%) | 112 (7.8%) |
| 9:00 AM to 9:59 AM | 218 (16.0%) | 317 (22.1%) |
| 10:00 AM to 10:59 AM | 84 (6.1%) | 52 (3.6%) |
| 11:00 AM to 11:59 AM | 85 (6.2%) | 35 (2.4%) |
| 12:00 PM to 3:59 PM | 8 (0.6%) | 70 (4.9%) |
| 4:00 PM to 11:59 PM | 41 (3.0%) | 0 (0.0%) |
| Total | 1,367 (100.0%) | 1,437 (100.0%) |
Housing Occupancy in Topanga
Occupancy by Ownership in Topanga
Of the total 3,029 dwellings in Topanga, owner-occupied units account for 2,310 (76.3%), while renter-occupied units make up 719 (23.7%).
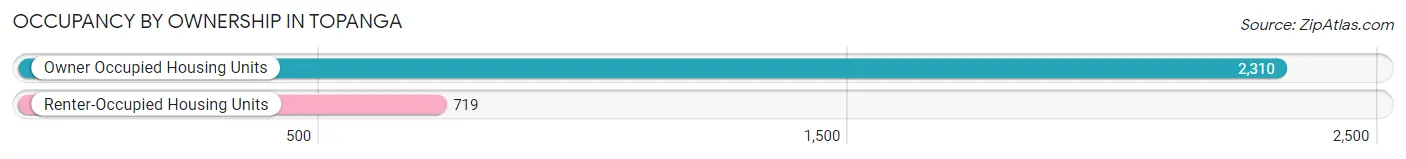
| Occupancy | # Housing Units | % Housing Units |
| Owner Occupied Housing Units | 2,310 | 76.3% |
| Renter-Occupied Housing Units | 719 | 23.7% |
| Total Occupied Housing Units | 3,029 | 100.0% |
Occupancy by Household Size in Topanga
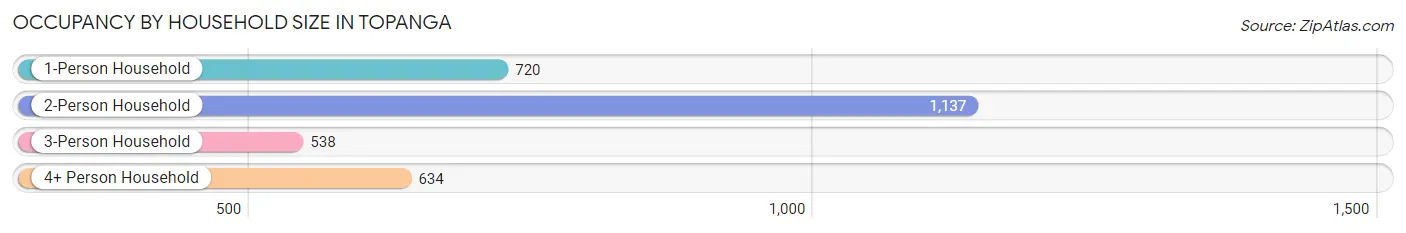
| Household Size | # Housing Units | % Housing Units |
| 1-Person Household | 720 | 23.8% |
| 2-Person Household | 1,137 | 37.5% |
| 3-Person Household | 538 | 17.8% |
| 4+ Person Household | 634 | 20.9% |
| Total Housing Units | 3,029 | 100.0% |
Occupancy by Ownership by Household Size in Topanga
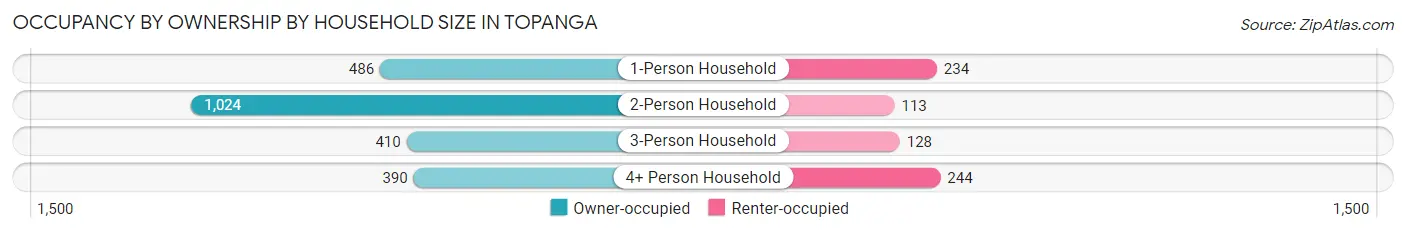
| Household Size | Owner-occupied | Renter-occupied |
| 1-Person Household | 486 (67.5%) | 234 (32.5%) |
| 2-Person Household | 1,024 (90.1%) | 113 (9.9%) |
| 3-Person Household | 410 (76.2%) | 128 (23.8%) |
| 4+ Person Household | 390 (61.5%) | 244 (38.5%) |
| Total Housing Units | 2,310 (76.3%) | 719 (23.7%) |
Occupancy by Educational Attainment in Topanga
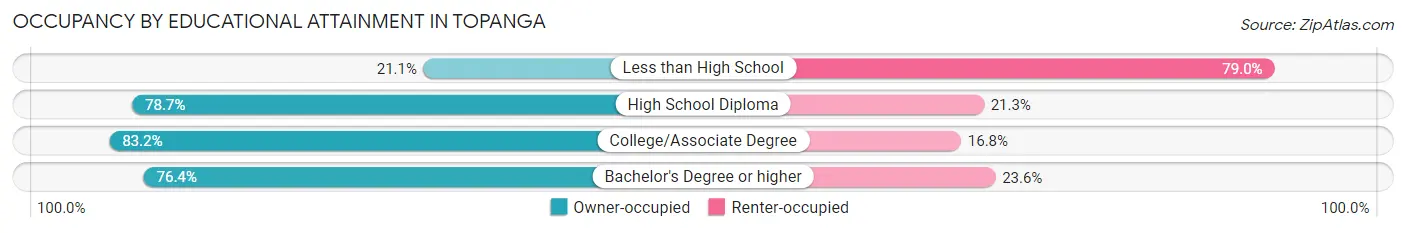
| Household Size | Owner-occupied | Renter-occupied |
| Less than High School | 20 (21.0%) | 75 (78.9%) |
| High School Diploma | 107 (78.7%) | 29 (21.3%) |
| College/Associate Degree | 555 (83.2%) | 112 (16.8%) |
| Bachelor's Degree or higher | 1,628 (76.4%) | 503 (23.6%) |
Occupancy by Age of Householder in Topanga
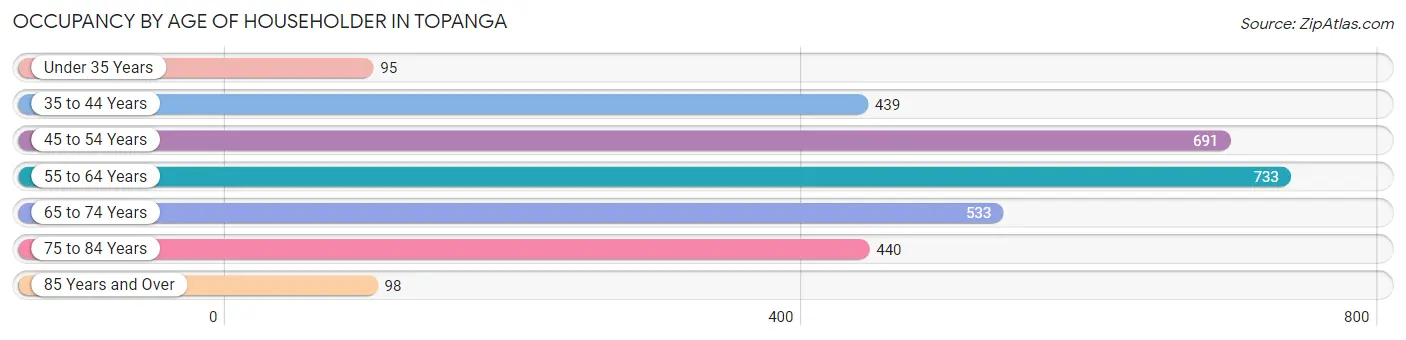
| Age Bracket | # Households | % Households |
| Under 35 Years | 95 | 3.1% |
| 35 to 44 Years | 439 | 14.5% |
| 45 to 54 Years | 691 | 22.8% |
| 55 to 64 Years | 733 | 24.2% |
| 65 to 74 Years | 533 | 17.6% |
| 75 to 84 Years | 440 | 14.5% |
| 85 Years and Over | 98 | 3.2% |
| Total | 3,029 | 100.0% |
Housing Finances in Topanga
Median Income by Occupancy in Topanga
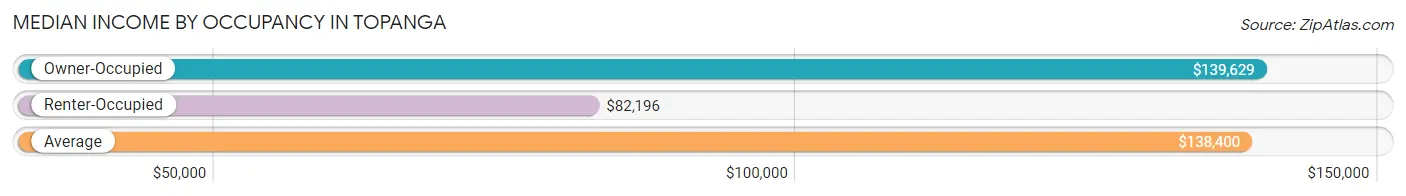
| Occupancy Type | # Households | Median Income |
| Owner-Occupied | 2,310 (76.3%) | $139,629 |
| Renter-Occupied | 719 (23.7%) | $82,196 |
| Average | 3,029 (100.0%) | $138,400 |
Occupancy by Householder Income Bracket in Topanga
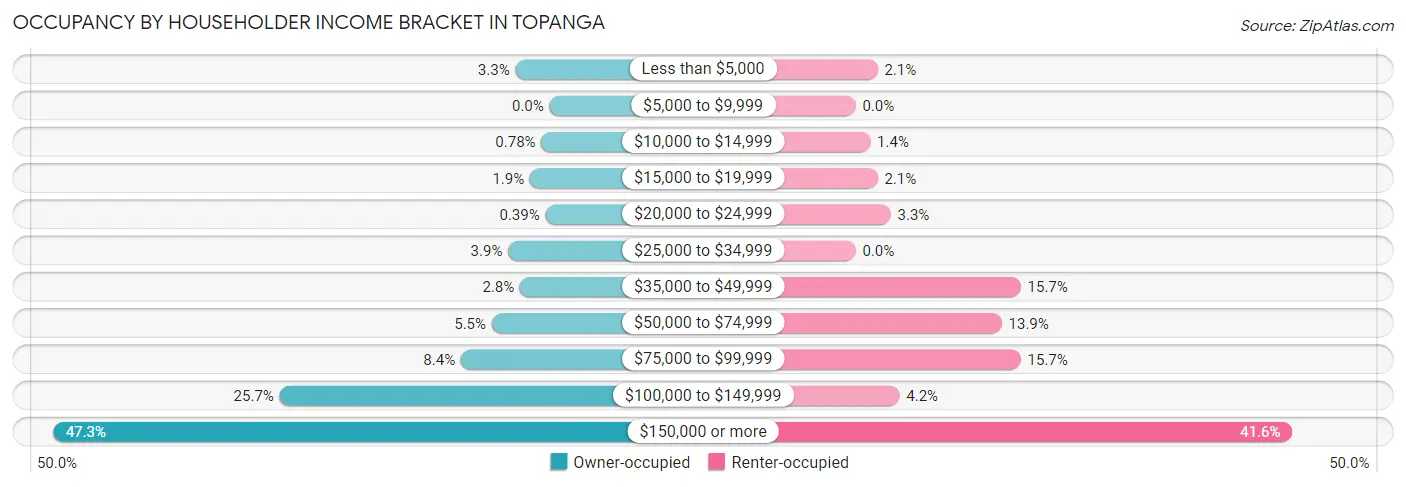
| Income Bracket | Owner-occupied | Renter-occupied |
| Less than $5,000 | 75 (3.3%) | 15 (2.1%) |
| $5,000 to $9,999 | 0 (0.0%) | 0 (0.0%) |
| $10,000 to $14,999 | 18 (0.8%) | 10 (1.4%) |
| $15,000 to $19,999 | 43 (1.9%) | 15 (2.1%) |
| $20,000 to $24,999 | 9 (0.4%) | 24 (3.3%) |
| $25,000 to $34,999 | 91 (3.9%) | 0 (0.0%) |
| $35,000 to $49,999 | 65 (2.8%) | 113 (15.7%) |
| $50,000 to $74,999 | 127 (5.5%) | 100 (13.9%) |
| $75,000 to $99,999 | 195 (8.4%) | 113 (15.7%) |
| $100,000 to $149,999 | 594 (25.7%) | 30 (4.2%) |
| $150,000 or more | 1,093 (47.3%) | 299 (41.6%) |
| Total | 2,310 (100.0%) | 719 (100.0%) |
Monthly Housing Cost Tiers in Topanga
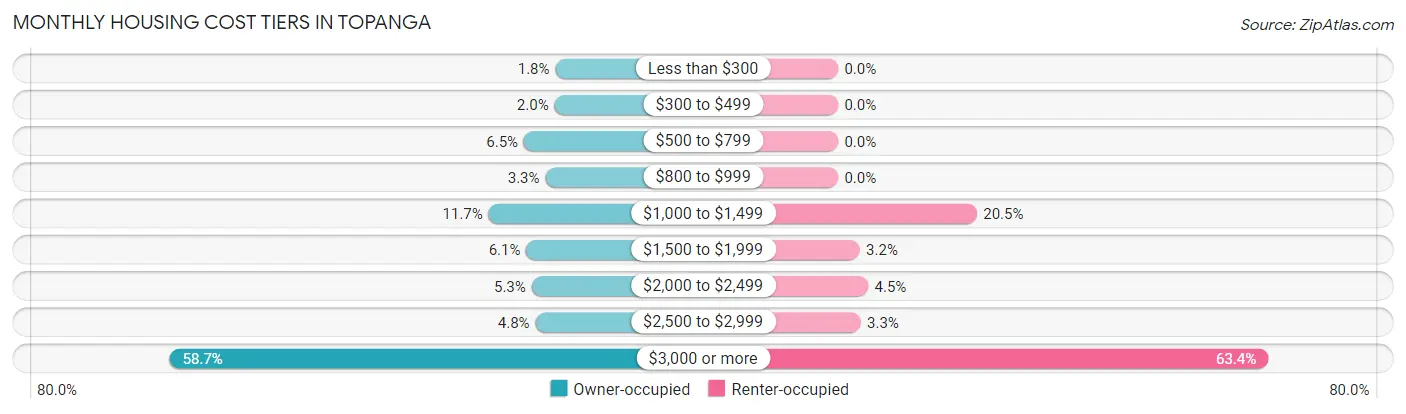
| Monthly Cost | Owner-occupied | Renter-occupied |
| Less than $300 | 42 (1.8%) | 0 (0.0%) |
| $300 to $499 | 45 (1.9%) | 0 (0.0%) |
| $500 to $799 | 149 (6.5%) | 0 (0.0%) |
| $800 to $999 | 76 (3.3%) | 0 (0.0%) |
| $1,000 to $1,499 | 269 (11.7%) | 147 (20.4%) |
| $1,500 to $1,999 | 141 (6.1%) | 23 (3.2%) |
| $2,000 to $2,499 | 123 (5.3%) | 32 (4.4%) |
| $2,500 to $2,999 | 110 (4.8%) | 24 (3.3%) |
| $3,000 or more | 1,355 (58.7%) | 456 (63.4%) |
| Total | 2,310 (100.0%) | 719 (100.0%) |
Physical Housing Characteristics in Topanga
Housing Structures in Topanga
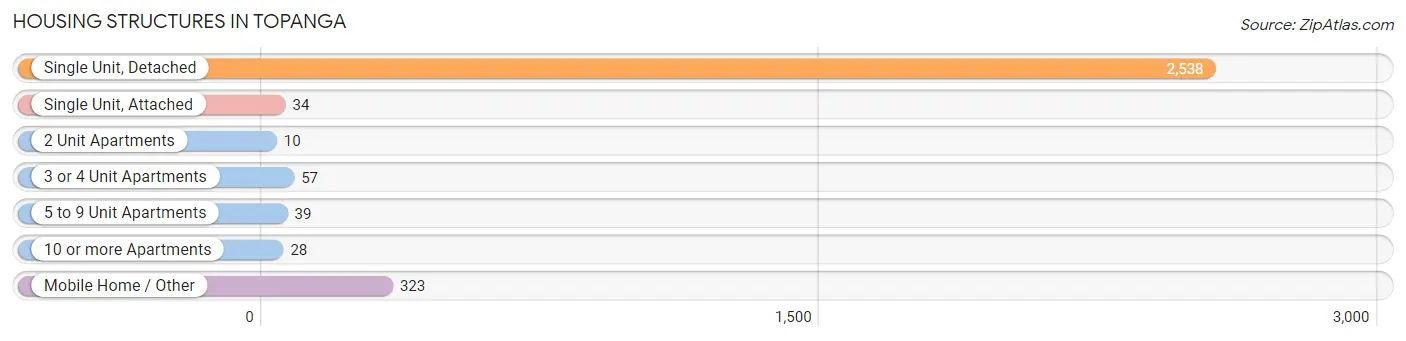
| Structure Type | # Housing Units | % Housing Units |
| Single Unit, Detached | 2,538 | 83.8% |
| Single Unit, Attached | 34 | 1.1% |
| 2 Unit Apartments | 10 | 0.3% |
| 3 or 4 Unit Apartments | 57 | 1.9% |
| 5 to 9 Unit Apartments | 39 | 1.3% |
| 10 or more Apartments | 28 | 0.9% |
| Mobile Home / Other | 323 | 10.7% |
| Total | 3,029 | 100.0% |
Housing Structures by Occupancy in Topanga
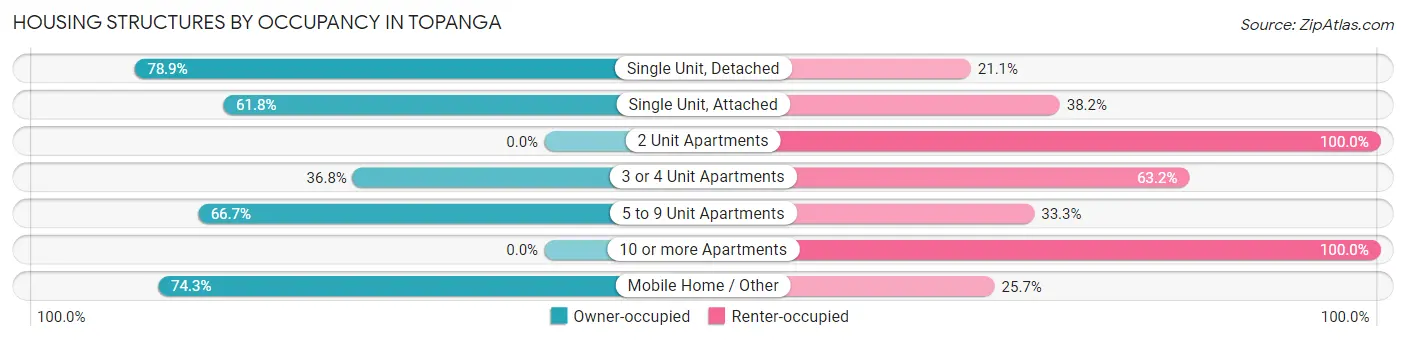
| Structure Type | Owner-occupied | Renter-occupied |
| Single Unit, Detached | 2,002 (78.9%) | 536 (21.1%) |
| Single Unit, Attached | 21 (61.8%) | 13 (38.2%) |
| 2 Unit Apartments | 0 (0.0%) | 10 (100.0%) |
| 3 or 4 Unit Apartments | 21 (36.8%) | 36 (63.2%) |
| 5 to 9 Unit Apartments | 26 (66.7%) | 13 (33.3%) |
| 10 or more Apartments | 0 (0.0%) | 28 (100.0%) |
| Mobile Home / Other | 240 (74.3%) | 83 (25.7%) |
| Total | 2,310 (76.3%) | 719 (23.7%) |
Housing Structures by Number of Rooms in Topanga
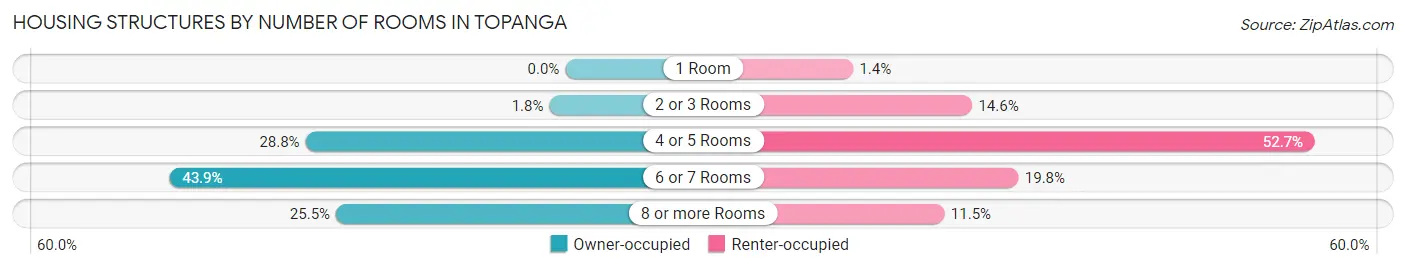
| Number of Rooms | Owner-occupied | Renter-occupied |
| 1 Room | 0 (0.0%) | 10 (1.4%) |
| 2 or 3 Rooms | 41 (1.8%) | 105 (14.6%) |
| 4 or 5 Rooms | 666 (28.8%) | 379 (52.7%) |
| 6 or 7 Rooms | 1,015 (43.9%) | 142 (19.8%) |
| 8 or more Rooms | 588 (25.5%) | 83 (11.5%) |
| Total | 2,310 (100.0%) | 719 (100.0%) |
Housing Structure by Heating Type in Topanga
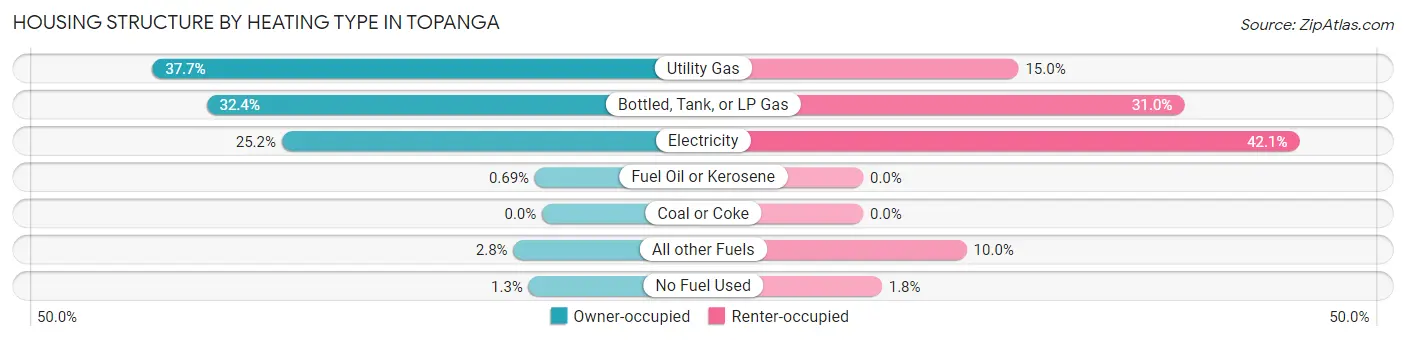
| Heating Type | Owner-occupied | Renter-occupied |
| Utility Gas | 870 (37.7%) | 108 (15.0%) |
| Bottled, Tank, or LP Gas | 749 (32.4%) | 223 (31.0%) |
| Electricity | 581 (25.2%) | 303 (42.1%) |
| Fuel Oil or Kerosene | 16 (0.7%) | 0 (0.0%) |
| Coal or Coke | 0 (0.0%) | 0 (0.0%) |
| All other Fuels | 64 (2.8%) | 72 (10.0%) |
| No Fuel Used | 30 (1.3%) | 13 (1.8%) |
| Total | 2,310 (100.0%) | 719 (100.0%) |
Household Vehicle Usage in Topanga
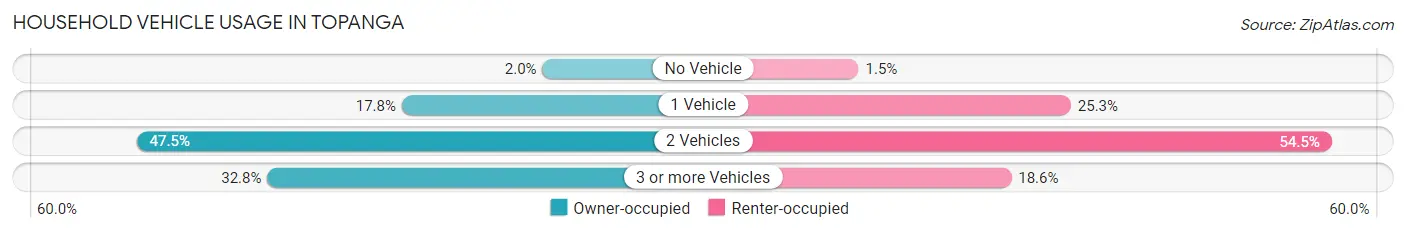
| Vehicles per Household | Owner-occupied | Renter-occupied |
| No Vehicle | 46 (2.0%) | 11 (1.5%) |
| 1 Vehicle | 410 (17.7%) | 182 (25.3%) |
| 2 Vehicles | 1,096 (47.4%) | 392 (54.5%) |
| 3 or more Vehicles | 758 (32.8%) | 134 (18.6%) |
| Total | 2,310 (100.0%) | 719 (100.0%) |
Real Estate & Mortgages in Topanga
Real Estate and Mortgage Overview in Topanga
| Characteristic | Without Mortgage | With Mortgage |
| Housing Units | 639 | 1,671 |
| Median Property Value | $1,851,600 | $1,469,600 |
| Median Household Income | $110,766 | $899 |
| Monthly Housing Costs | $1,202 | $1,347 |
| Real Estate Taxes | $4,851 | $6 |
Property Value by Mortgage Status in Topanga
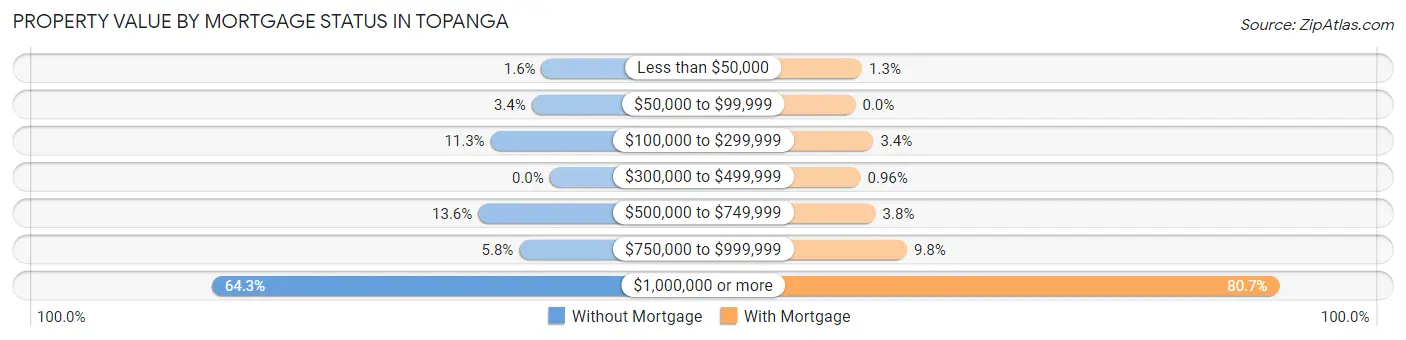
| Property Value | Without Mortgage | With Mortgage |
| Less than $50,000 | 10 (1.6%) | 21 (1.3%) |
| $50,000 to $99,999 | 22 (3.4%) | 0 (0.0%) |
| $100,000 to $299,999 | 72 (11.3%) | 57 (3.4%) |
| $300,000 to $499,999 | 0 (0.0%) | 16 (1.0%) |
| $500,000 to $749,999 | 87 (13.6%) | 64 (3.8%) |
| $750,000 to $999,999 | 37 (5.8%) | 164 (9.8%) |
| $1,000,000 or more | 411 (64.3%) | 1,349 (80.7%) |
| Total | 639 (100.0%) | 1,671 (100.0%) |
Household Income by Mortgage Status in Topanga
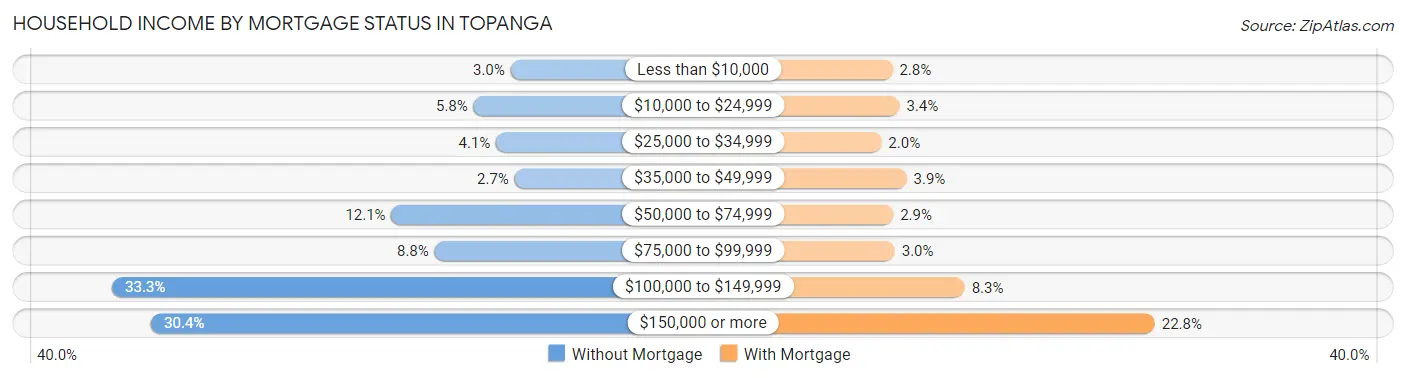
| Household Income | Without Mortgage | With Mortgage |
| Less than $10,000 | 19 (3.0%) | 47 (2.8%) |
| $10,000 to $24,999 | 37 (5.8%) | 56 (3.4%) |
| $25,000 to $34,999 | 26 (4.1%) | 33 (2.0%) |
| $35,000 to $49,999 | 17 (2.7%) | 65 (3.9%) |
| $50,000 to $74,999 | 77 (12.0%) | 48 (2.9%) |
| $75,000 to $99,999 | 56 (8.8%) | 50 (3.0%) |
| $100,000 to $149,999 | 213 (33.3%) | 139 (8.3%) |
| $150,000 or more | 194 (30.4%) | 381 (22.8%) |
| Total | 639 (100.0%) | 1,671 (100.0%) |
Property Value to Household Income Ratio in Topanga
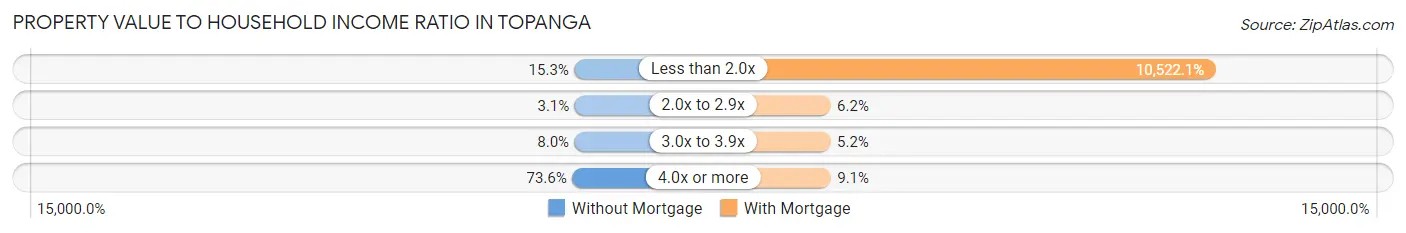
| Value-to-Income Ratio | Without Mortgage | With Mortgage |
| Less than 2.0x | 98 (15.3%) | 175,824 (10,522.1%) |
| 2.0x to 2.9x | 20 (3.1%) | 104 (6.2%) |
| 3.0x to 3.9x | 51 (8.0%) | 87 (5.2%) |
| 4.0x or more | 470 (73.6%) | 152 (9.1%) |
| Total | 639 (100.0%) | 1,671 (100.0%) |
Real Estate Taxes by Mortgage Status in Topanga
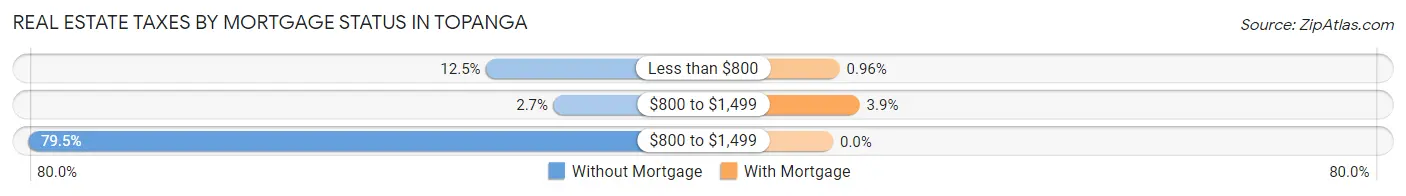
| Property Taxes | Without Mortgage | With Mortgage |
| Less than $800 | 80 (12.5%) | 16 (1.0%) |
| $800 to $1,499 | 17 (2.7%) | 65 (3.9%) |
| $800 to $1,499 | 508 (79.5%) | 0 (0.0%) |
| Total | 639 (100.0%) | 1,671 (100.0%) |
Health & Disability in Topanga
Health Insurance Coverage by Age in Topanga
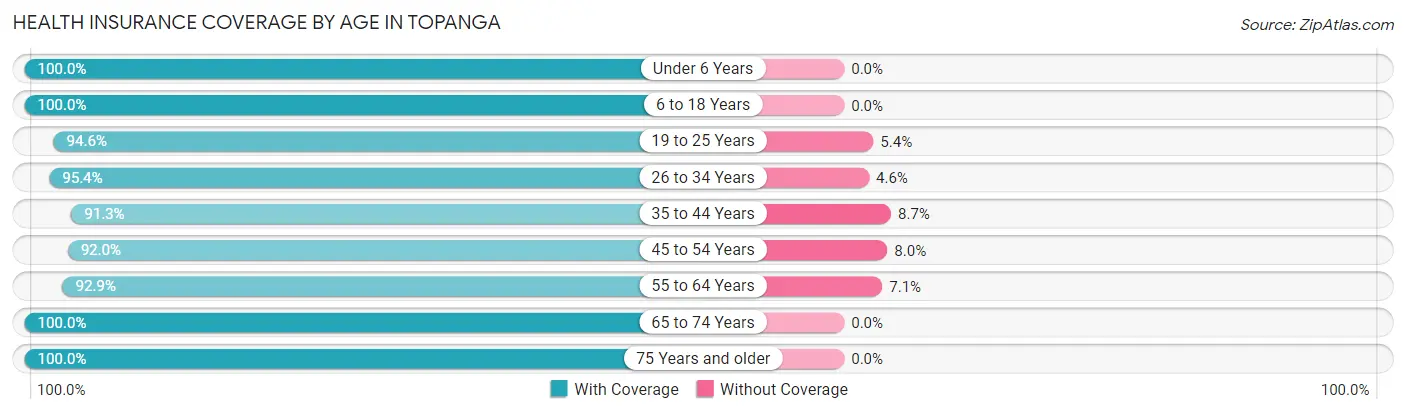
| Age Bracket | With Coverage | Without Coverage |
| Under 6 Years | 440 (100.0%) | 0 (0.0%) |
| 6 to 18 Years | 1,338 (100.0%) | 0 (0.0%) |
| 19 to 25 Years | 331 (94.6%) | 19 (5.4%) |
| 26 to 34 Years | 516 (95.4%) | 25 (4.6%) |
| 35 to 44 Years | 993 (91.3%) | 95 (8.7%) |
| 45 to 54 Years | 1,259 (92.0%) | 110 (8.0%) |
| 55 to 64 Years | 1,271 (92.9%) | 97 (7.1%) |
| 65 to 74 Years | 802 (100.0%) | 0 (0.0%) |
| 75 Years and older | 906 (100.0%) | 0 (0.0%) |
| Total | 7,856 (95.8%) | 346 (4.2%) |
Health Insurance Coverage by Citizenship Status in Topanga
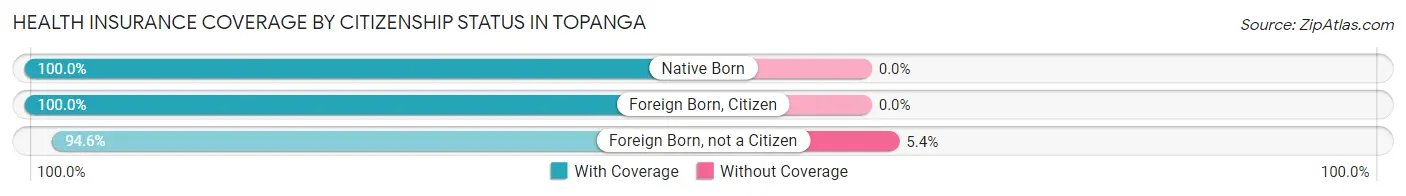
| Citizenship Status | With Coverage | Without Coverage |
| Native Born | 440 (100.0%) | 0 (0.0%) |
| Foreign Born, Citizen | 1,338 (100.0%) | 0 (0.0%) |
| Foreign Born, not a Citizen | 331 (94.6%) | 19 (5.4%) |
Health Insurance Coverage by Household Income in Topanga
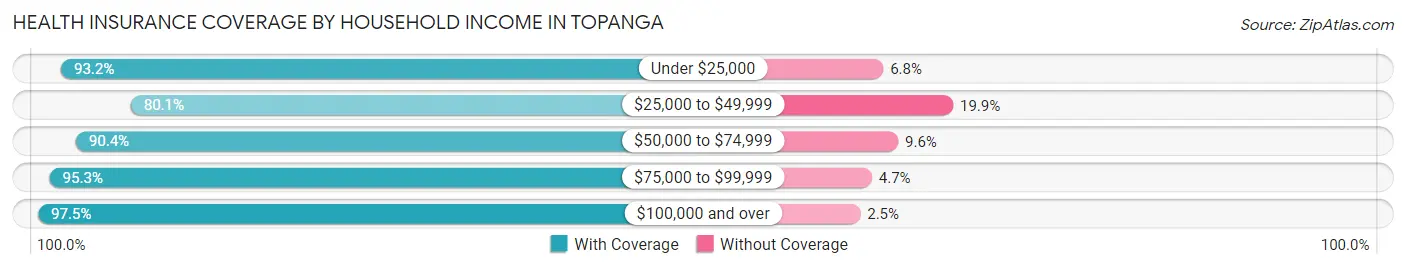
| Household Income | With Coverage | Without Coverage |
| Under $25,000 | 259 (93.2%) | 19 (6.8%) |
| $25,000 to $49,999 | 330 (80.1%) | 82 (19.9%) |
| $50,000 to $74,999 | 470 (90.4%) | 50 (9.6%) |
| $75,000 to $99,999 | 811 (95.3%) | 40 (4.7%) |
| $100,000 and over | 5,983 (97.5%) | 155 (2.5%) |
Public vs Private Health Insurance Coverage by Age in Topanga
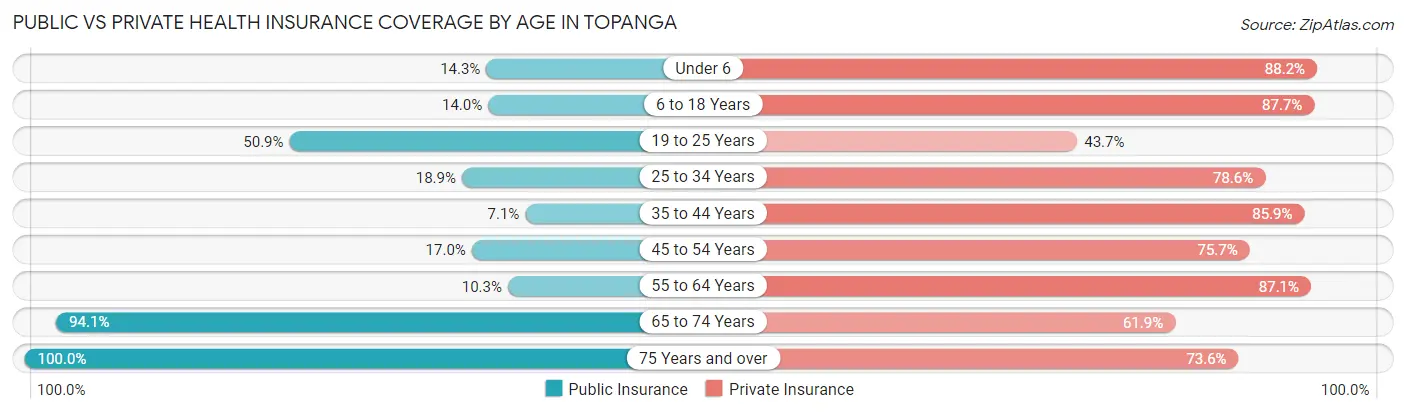
| Age Bracket | Public Insurance | Private Insurance |
| Under 6 | 63 (14.3%) | 388 (88.2%) |
| 6 to 18 Years | 187 (14.0%) | 1,173 (87.7%) |
| 19 to 25 Years | 178 (50.9%) | 153 (43.7%) |
| 25 to 34 Years | 102 (18.9%) | 425 (78.6%) |
| 35 to 44 Years | 77 (7.1%) | 934 (85.9%) |
| 45 to 54 Years | 233 (17.0%) | 1,036 (75.7%) |
| 55 to 64 Years | 141 (10.3%) | 1,191 (87.1%) |
| 65 to 74 Years | 755 (94.1%) | 496 (61.9%) |
| 75 Years and over | 906 (100.0%) | 667 (73.6%) |
| Total | 2,642 (32.2%) | 6,463 (78.8%) |
Disability Status by Sex by Age in Topanga
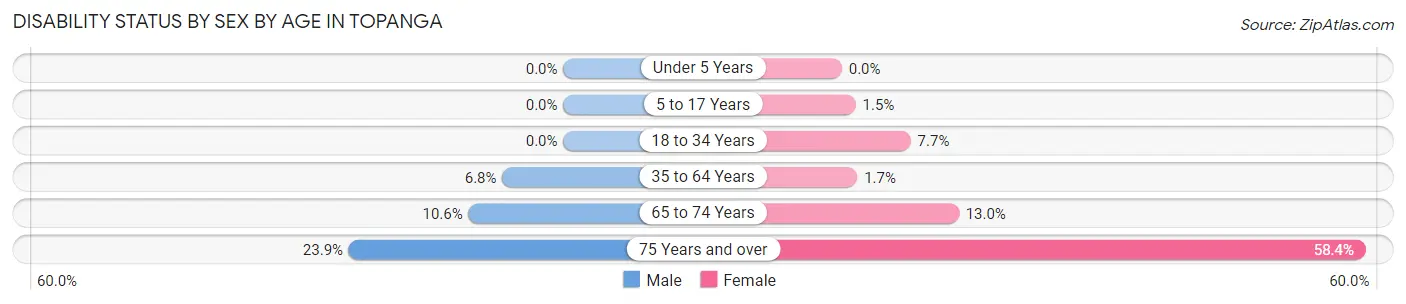
| Age Bracket | Male | Female |
| Under 5 Years | 0 (0.0%) | 0 (0.0%) |
| 5 to 17 Years | 0 (0.0%) | 8 (1.5%) |
| 18 to 34 Years | 0 (0.0%) | 56 (7.7%) |
| 35 to 64 Years | 141 (6.8%) | 30 (1.7%) |
| 65 to 74 Years | 36 (10.6%) | 60 (13.0%) |
| 75 Years and over | 112 (23.9%) | 255 (58.4%) |
Disability Class by Sex by Age in Topanga
Disability Class: Hearing Difficulty
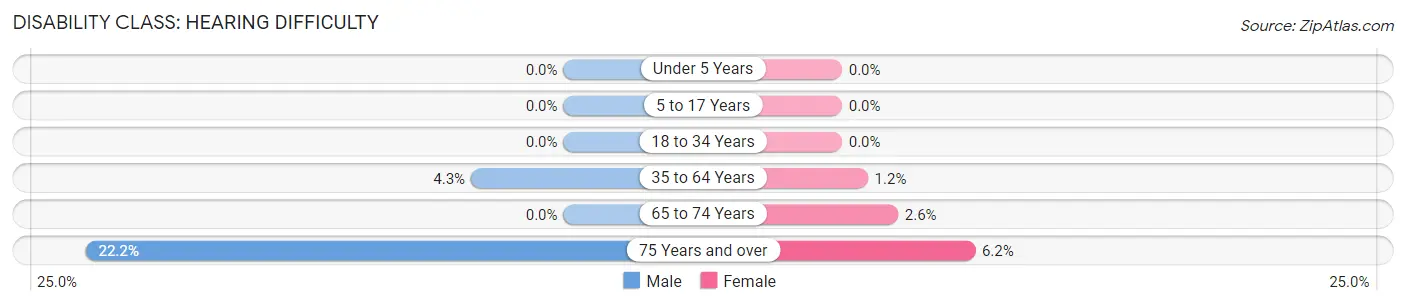
| Age Bracket | Male | Female |
| Under 5 Years | 0 (0.0%) | 0 (0.0%) |
| 5 to 17 Years | 0 (0.0%) | 0 (0.0%) |
| 18 to 34 Years | 0 (0.0%) | 0 (0.0%) |
| 35 to 64 Years | 89 (4.3%) | 21 (1.2%) |
| 65 to 74 Years | 0 (0.0%) | 12 (2.6%) |
| 75 Years and over | 104 (22.2%) | 27 (6.2%) |
Disability Class: Vision Difficulty
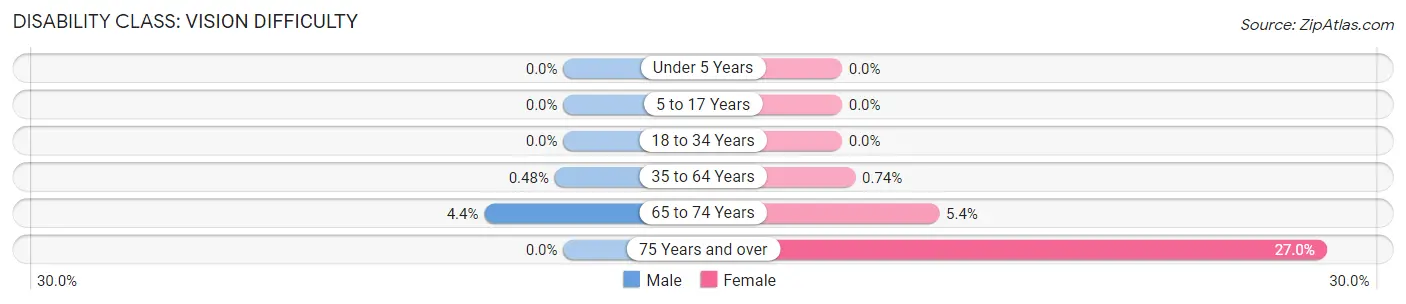
| Age Bracket | Male | Female |
| Under 5 Years | 0 (0.0%) | 0 (0.0%) |
| 5 to 17 Years | 0 (0.0%) | 0 (0.0%) |
| 18 to 34 Years | 0 (0.0%) | 0 (0.0%) |
| 35 to 64 Years | 10 (0.5%) | 13 (0.7%) |
| 65 to 74 Years | 15 (4.4%) | 25 (5.4%) |
| 75 Years and over | 0 (0.0%) | 118 (27.0%) |
Disability Class: Cognitive Difficulty
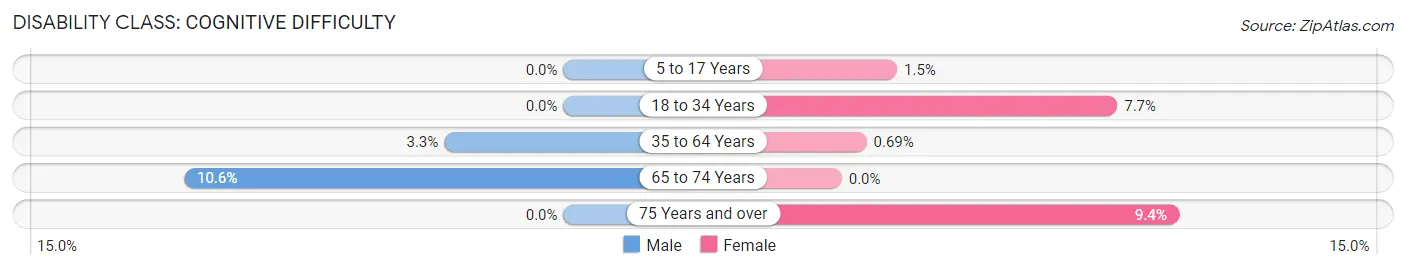
| Age Bracket | Male | Female |
| 5 to 17 Years | 0 (0.0%) | 8 (1.5%) |
| 18 to 34 Years | 0 (0.0%) | 56 (7.7%) |
| 35 to 64 Years | 69 (3.3%) | 12 (0.7%) |
| 65 to 74 Years | 36 (10.6%) | 0 (0.0%) |
| 75 Years and over | 0 (0.0%) | 41 (9.4%) |
Disability Class: Ambulatory Difficulty
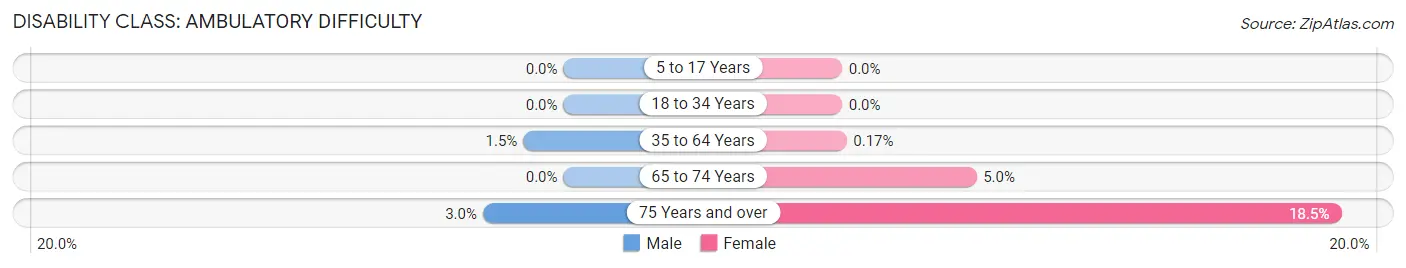
| Age Bracket | Male | Female |
| 5 to 17 Years | 0 (0.0%) | 0 (0.0%) |
| 18 to 34 Years | 0 (0.0%) | 0 (0.0%) |
| 35 to 64 Years | 31 (1.5%) | 3 (0.2%) |
| 65 to 74 Years | 0 (0.0%) | 23 (5.0%) |
| 75 Years and over | 14 (3.0%) | 81 (18.5%) |
Disability Class: Self-Care Difficulty
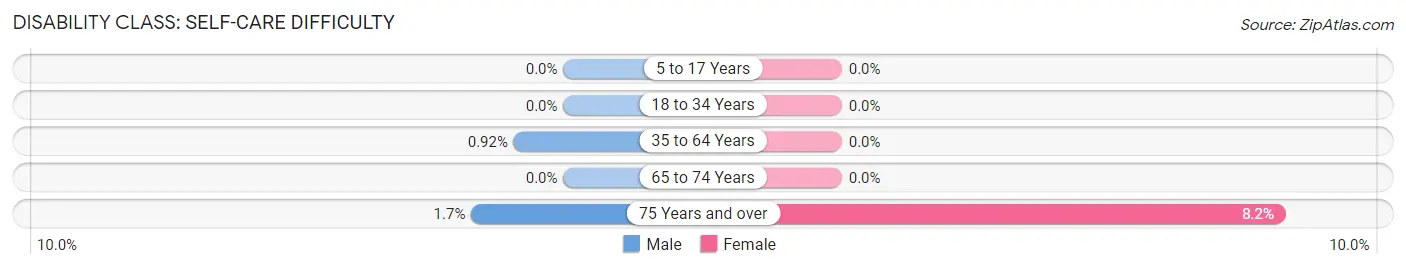
| Age Bracket | Male | Female |
| 5 to 17 Years | 0 (0.0%) | 0 (0.0%) |
| 18 to 34 Years | 0 (0.0%) | 0 (0.0%) |
| 35 to 64 Years | 19 (0.9%) | 0 (0.0%) |
| 65 to 74 Years | 0 (0.0%) | 0 (0.0%) |
| 75 Years and over | 8 (1.7%) | 36 (8.2%) |
Technology Access in Topanga
Computing Device Access in Topanga
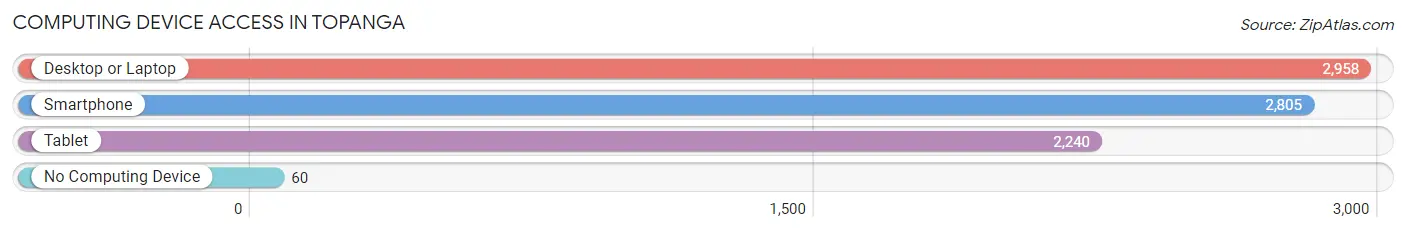
| Device Type | # Households | % Households |
| Desktop or Laptop | 2,958 | 97.7% |
| Smartphone | 2,805 | 92.6% |
| Tablet | 2,240 | 74.0% |
| No Computing Device | 60 | 2.0% |
| Total | 3,029 | 100.0% |
Internet Access in Topanga
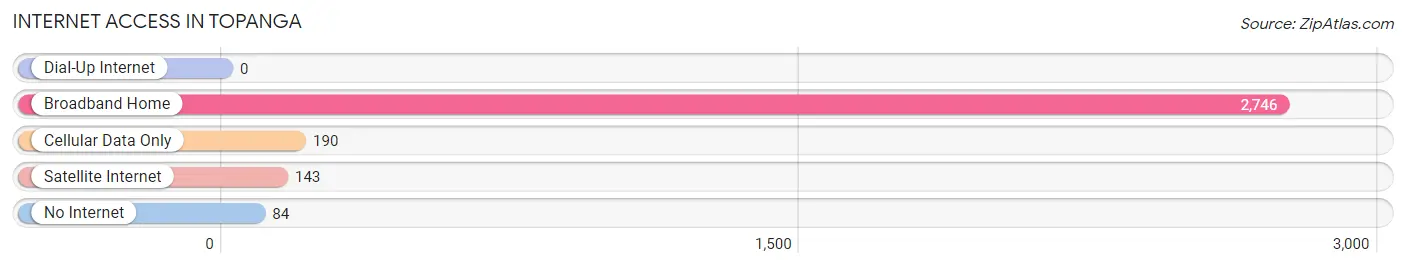
| Internet Type | # Households | % Households |
| Dial-Up Internet | 0 | 0.0% |
| Broadband Home | 2,746 | 90.7% |
| Cellular Data Only | 190 | 6.3% |
| Satellite Internet | 143 | 4.7% |
| No Internet | 84 | 2.8% |
| Total | 3,029 | 100.0% |
Topanga Summary
History
Topanga is a small unincorporated community located in the Santa Monica Mountains of Los Angeles County, California. It is situated in the Topanga Canyon, a large canyon that runs through the Santa Monica Mountains. The area was originally inhabited by the Tongva people, who were the original inhabitants of the Los Angeles Basin. The first Europeans to settle in the area were Spanish missionaries, who established a mission in the area in 1786.
The area was later settled by ranchers and farmers in the late 19th century. The area was named after the Topanga Creek, which runs through the canyon. The name is derived from the Chumash word for “above” or “above the place.”
In the early 20th century, the area became a popular destination for Hollywood celebrities, who built homes in the canyon. The area was also home to a number of artists, writers, and musicians, who were drawn to the area’s natural beauty and seclusion.
In the 1950s, the area began to experience rapid development, as the city of Los Angeles began to expand into the area. The area was eventually annexed by the city of Los Angeles in the 1960s.
Geography
Topanga is located in the Santa Monica Mountains of Los Angeles County, California. It is situated in the Topanga Canyon, a large canyon that runs through the Santa Monica Mountains. The area is characterized by steep, rugged terrain, with elevations ranging from sea level to over 2,000 feet.
The area is home to a variety of wildlife, including mountain lions, bobcats, coyotes, deer, and a variety of birds. The area is also home to a variety of plant life, including oaks, sycamores, and chaparral.
Economy
The economy of Topanga is largely based on tourism and the entertainment industry. The area is home to a number of popular tourist attractions, including the Topanga State Park, the Topanga Beach, and the Topanga Canyon. The area is also home to a number of popular restaurants, bars, and shops.
The area is also home to a number of film and television studios, including Paramount Pictures, Warner Bros., and Universal Studios. The area is also home to a number of music recording studios, including the famous Sunset Sound.
Demographics
As of the 2010 census, the population of Topanga was 8,289. The racial makeup of the area was 79.3% White, 8.2% African American, 0.3% Native American, 5.2% Asian, 0.1% Pacific Islander, 4.2% from other races, and 2.9% from two or more races. Hispanic or Latino of any race were 11.3% of the population.
The median income for a household in the area was $75,837, and the median income for a family was $90,945. The per capita income for the area was $41,945. About 5.2% of families and 7.3% of the population were below the poverty line, including 8.3% of those under age 18 and 4.2% of those age 65 or over.
Common Questions
What is Per Capita Income in Topanga?
Per Capita income in Topanga is $81,015.
What is the Median Family Income in Topanga?
Median Family Income in Topanga is $170,179.
What is the Median Household income in Topanga?
Median Household Income in Topanga is $138,400.
What is Income or Wage Gap in Topanga?
Income or Wage Gap in Topanga is 13.5%.
Women in Topanga earn 86.5 cents for every dollar earned by a man.
What is Inequality or Gini Index in Topanga?
Inequality or Gini Index in Topanga is 0.48.
What is the Total Population of Topanga?
Total Population of Topanga is 8,202.
What is the Total Male Population of Topanga?
Total Male Population of Topanga is 4,113.
What is the Total Female Population of Topanga?
Total Female Population of Topanga is 4,089.
What is the Ratio of Males per 100 Females in Topanga?
There are 100.59 Males per 100 Females in Topanga.
What is the Ratio of Females per 100 Males in Topanga?
There are 99.42 Females per 100 Males in Topanga.
What is the Median Population Age in Topanga?
Median Population Age in Topanga is 46.3 Years.
What is the Average Family Size in Topanga
Average Family Size in Topanga is 3.1 People.
What is the Average Household Size in Topanga
Average Household Size in Topanga is 2.7 People.
How Large is the Labor Force in Topanga?
There are 4,376 People in the Labor Forcein in Topanga.
What is the Percentage of People in the Labor Force in Topanga?
64.5% of People are in the Labor Force in Topanga.
What is the Unemployment Rate in Topanga?
Unemployment Rate in Topanga is 7.2%.