Reliez Valley, CA Map & Demographics
Reliez Valley Map
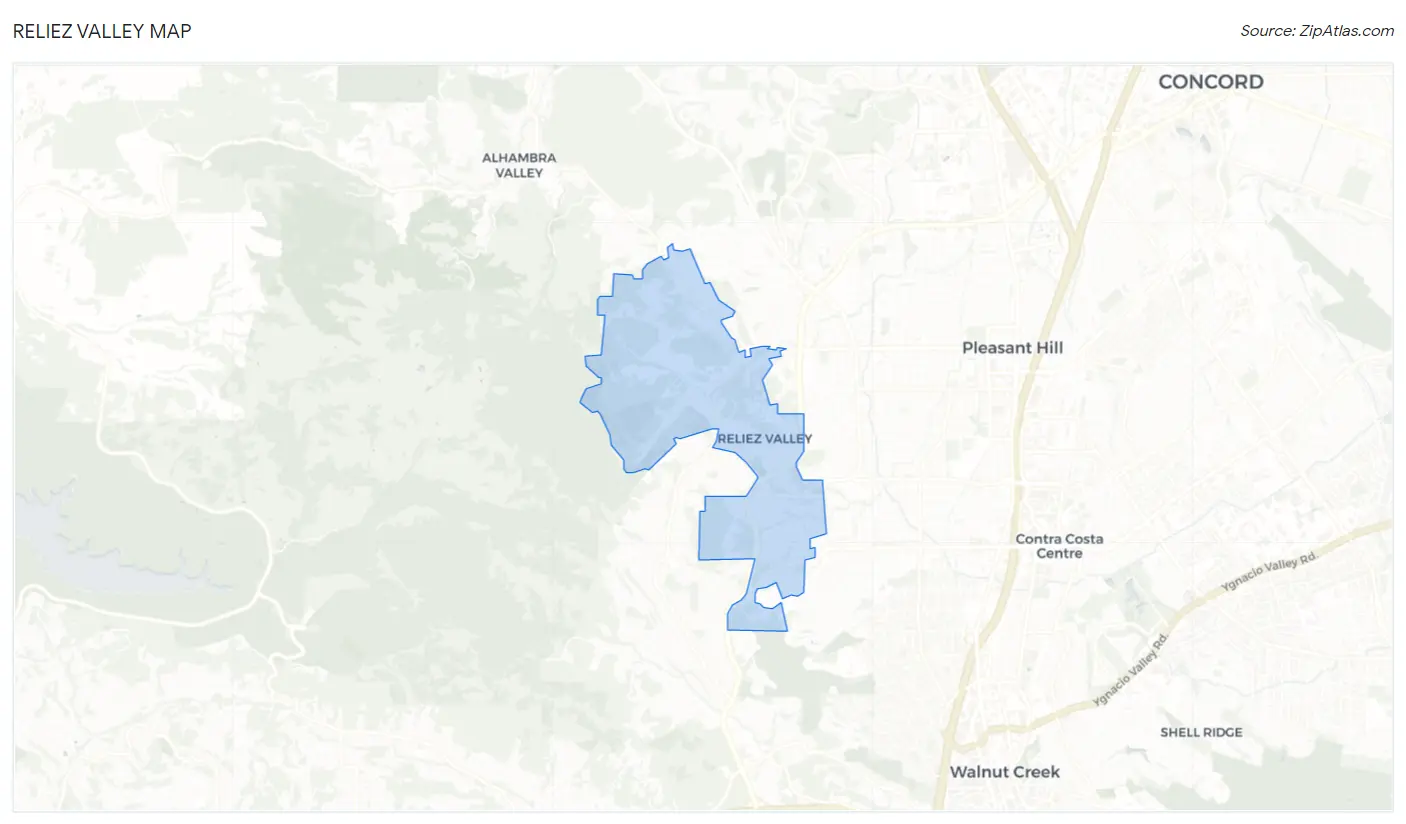
Reliez Valley Overview
$105,254
PER CAPITA INCOME
$234,779
AVG FAMILY INCOME
$249,063
AVG HOUSEHOLD INCOME
50.8%
WAGE / INCOME GAP [ % ]
49.2¢/ $1
WAGE / INCOME GAP [ $ ]
0.43
INEQUALITY / GINI INDEX
3,190
TOTAL POPULATION
1,719
MALE POPULATION
1,471
FEMALE POPULATION
116.86
MALES / 100 FEMALES
85.57
FEMALES / 100 MALES
48.6
MEDIAN AGE
3.0
AVG FAMILY SIZE
2.8
AVG HOUSEHOLD SIZE
1,512
LABOR FORCE [ PEOPLE ]
58.8%
PERCENT IN LABOR FORCE
6.7%
UNEMPLOYMENT RATE
Income in Reliez Valley
Income Overview in Reliez Valley
Per Capita Income in Reliez Valley is $105,254, while median incomes of families and households are $234,779 and $249,063 respectively.
| Characteristic | Number | Measure |
| Per Capita Income | 3,190 | $105,254 |
| Median Family Income | 901 | $234,779 |
| Mean Family Income | 901 | $279,435 |
| Median Household Income | 1,135 | $249,063 |
| Mean Household Income | 1,135 | $292,817 |
| Income Deficit | 901 | $0 |
| Wage / Income Gap (%) | 3,190 | 50.78% |
| Wage / Income Gap ($) | 3,190 | 49.22¢ per $1 |
| Gini / Inequality Index | 3,190 | 0.43 |
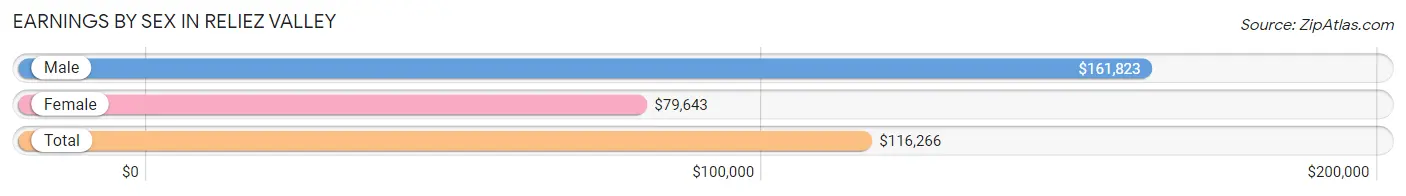
Earnings by Sex in Reliez Valley
Average Earnings in Reliez Valley are $116,266, $161,823 for men and $79,643 for women, a difference of 50.8%.
| Sex | Number | Average Earnings |
| Male | 905 (59.0%) | $161,823 |
| Female | 630 (41.0%) | $79,643 |
| Total | 1,535 (100.0%) | $116,266 |
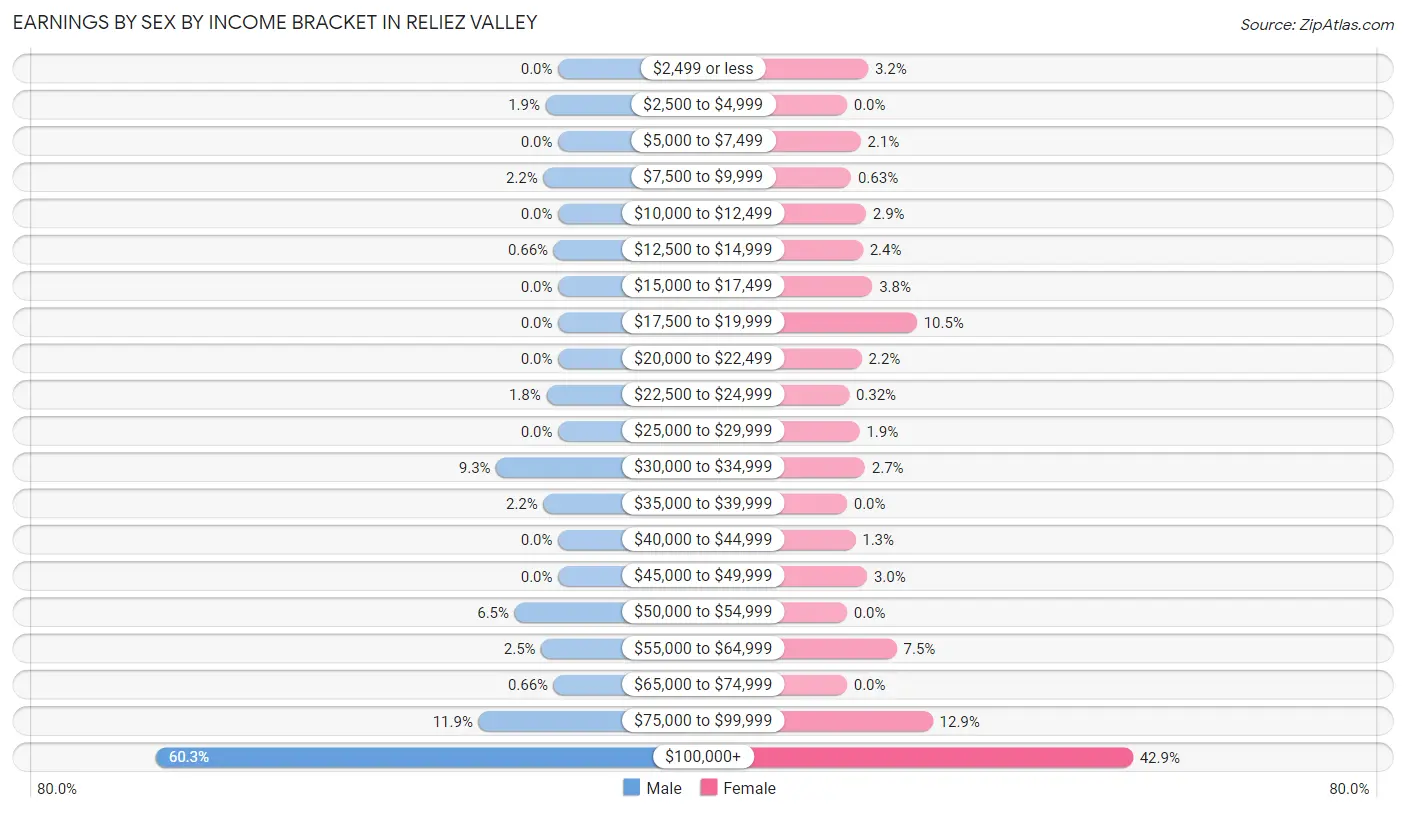
Earnings by Sex by Income Bracket in Reliez Valley
The most common earnings brackets in Reliez Valley are $100,000+ for men (546 | 60.3%) and $100,000+ for women (270 | 42.9%).
| Income | Male | Female |
| $2,499 or less | 0 (0.0%) | 20 (3.2%) |
| $2,500 to $4,999 | 17 (1.9%) | 0 (0.0%) |
| $5,000 to $7,499 | 0 (0.0%) | 13 (2.1%) |
| $7,500 to $9,999 | 20 (2.2%) | 4 (0.6%) |
| $10,000 to $12,499 | 0 (0.0%) | 18 (2.9%) |
| $12,500 to $14,999 | 6 (0.7%) | 15 (2.4%) |
| $15,000 to $17,499 | 0 (0.0%) | 24 (3.8%) |
| $17,500 to $19,999 | 0 (0.0%) | 66 (10.5%) |
| $20,000 to $22,499 | 0 (0.0%) | 14 (2.2%) |
| $22,500 to $24,999 | 16 (1.8%) | 2 (0.3%) |
| $25,000 to $29,999 | 0 (0.0%) | 12 (1.9%) |
| $30,000 to $34,999 | 84 (9.3%) | 17 (2.7%) |
| $35,000 to $39,999 | 20 (2.2%) | 0 (0.0%) |
| $40,000 to $44,999 | 0 (0.0%) | 8 (1.3%) |
| $45,000 to $49,999 | 0 (0.0%) | 19 (3.0%) |
| $50,000 to $54,999 | 59 (6.5%) | 0 (0.0%) |
| $55,000 to $64,999 | 23 (2.5%) | 47 (7.5%) |
| $65,000 to $74,999 | 6 (0.7%) | 0 (0.0%) |
| $75,000 to $99,999 | 108 (11.9%) | 81 (12.9%) |
| $100,000+ | 546 (60.3%) | 270 (42.9%) |
| Total | 905 (100.0%) | 630 (100.0%) |
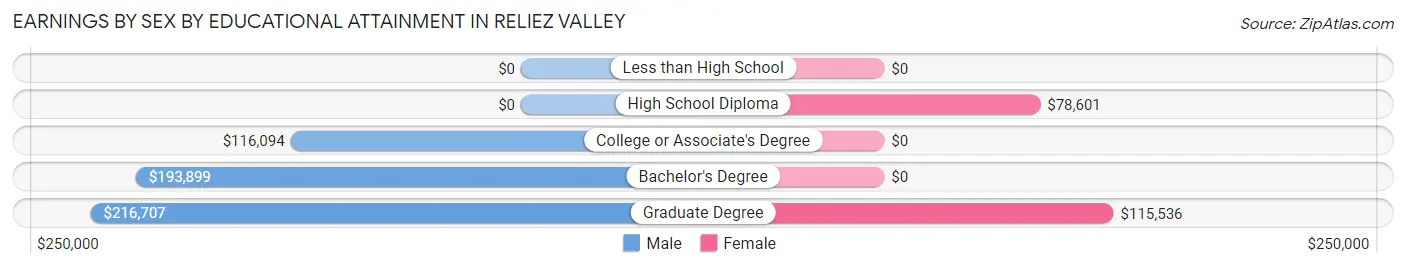
Earnings by Sex by Educational Attainment in Reliez Valley
Average earnings in Reliez Valley are $192,917 for men and $88,500 for women, a difference of 54.1%. Men with an educational attainment of graduate degree enjoy the highest average annual earnings of $216,707, while those with college or associate's degree education earn the least with $116,094. Women with an educational attainment of graduate degree earn the most with the average annual earnings of $115,536, while those with high school diploma education have the smallest earnings of $78,601.
| Educational Attainment | Male Income | Female Income |
| Less than High School | - | - |
| High School Diploma | - | - |
| College or Associate's Degree | $116,094 | $0 |
| Bachelor's Degree | $193,899 | $0 |
| Graduate Degree | $216,707 | $115,536 |
| Total | $192,917 | $88,500 |
Family Income in Reliez Valley
Family Income Brackets in Reliez Valley
According to the Reliez Valley family income data, there are 526 families falling into the $200,000+ income range, which is the most common income bracket and makes up 58.4% of all families.
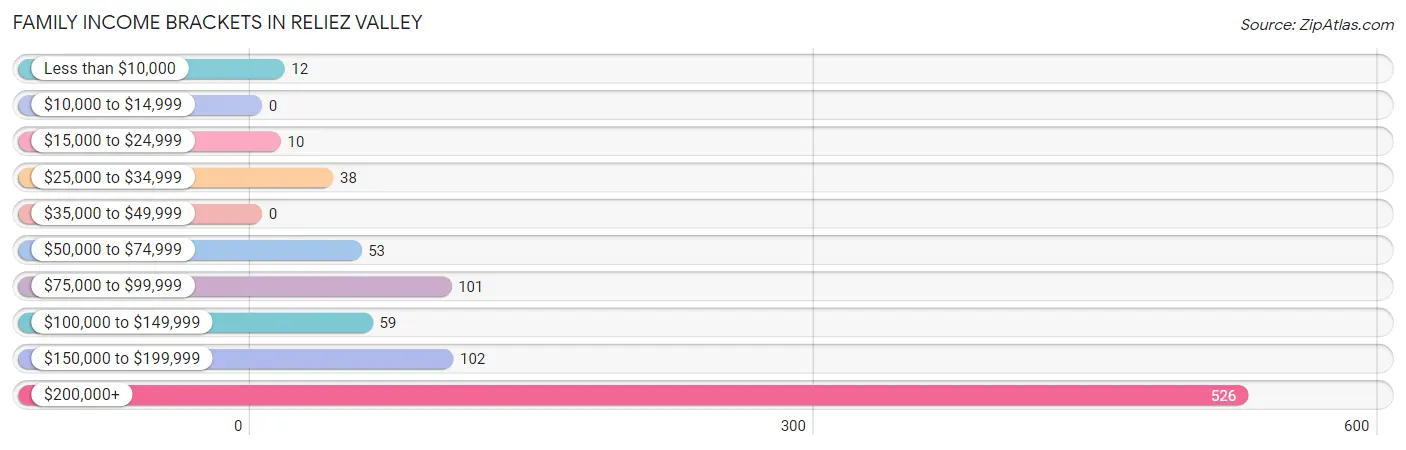
| Income Bracket | # Families | % Families |
| Less than $10,000 | 12 | 1.3% |
| $10,000 to $14,999 | 0 | 0.0% |
| $15,000 to $24,999 | 10 | 1.1% |
| $25,000 to $34,999 | 38 | 4.2% |
| $35,000 to $49,999 | 0 | 0.0% |
| $50,000 to $74,999 | 53 | 5.9% |
| $75,000 to $99,999 | 101 | 11.2% |
| $100,000 to $149,999 | 59 | 6.5% |
| $150,000 to $199,999 | 102 | 11.3% |
| $200,000+ | 526 | 58.4% |
Family Income by Famaliy Size in Reliez Valley
3-person families (108 | 12.0%) account for the highest median family income in Reliez Valley with $250,001 per family, while 3-person families (108 | 12.0%) have the highest median income of $83,334 per family member.
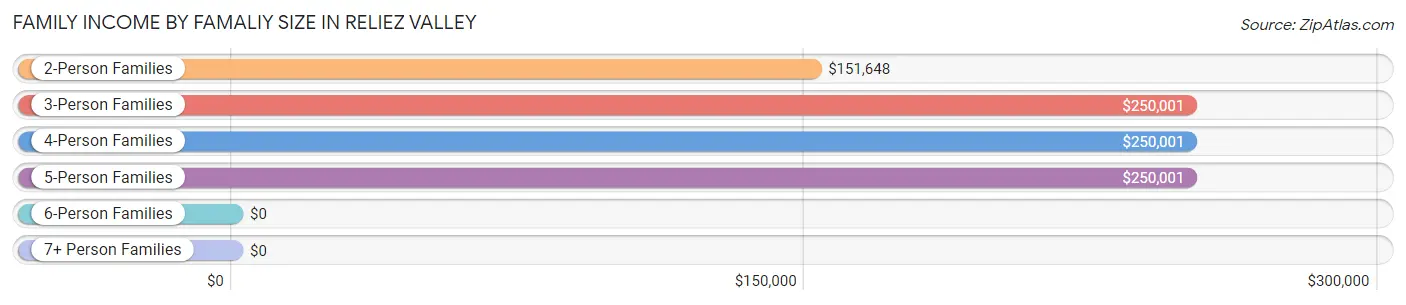
| Income Bracket | # Families | Median Income |
| 2-Person Families | 511 (56.7%) | $151,648 |
| 3-Person Families | 108 (12.0%) | $250,001 |
| 4-Person Families | 148 (16.4%) | $250,001 |
| 5-Person Families | 114 (12.7%) | $250,001 |
| 6-Person Families | 20 (2.2%) | $0 |
| 7+ Person Families | 0 (0.0%) | $0 |
| Total | 901 (100.0%) | $234,779 |
Family Income by Number of Earners in Reliez Valley
The median family income in Reliez Valley is $234,779, with families comprising 2 earners (224) having the highest median family income of $250,001, while families with no earners (161) have the lowest median family income of $135,625, accounting for 24.9% and 17.9% of families, respectively.
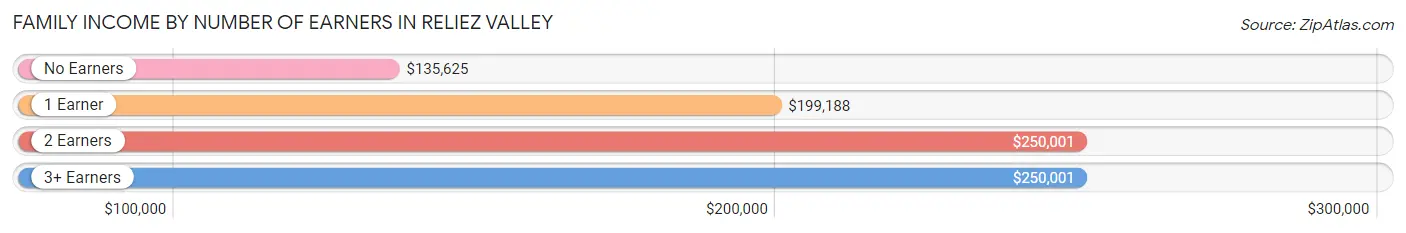
| Number of Earners | # Families | Median Income |
| No Earners | 161 (17.9%) | $135,625 |
| 1 Earner | 411 (45.6%) | $199,188 |
| 2 Earners | 224 (24.9%) | $250,001 |
| 3+ Earners | 105 (11.7%) | $250,001 |
| Total | 901 (100.0%) | $234,779 |
Household Income in Reliez Valley
Household Income Brackets in Reliez Valley
With 686 households falling in the category, the $200,000+ income range is the most frequent in Reliez Valley, accounting for 60.4% of all households. In contrast, only 12 households (1.1%) fall into the less than $10,000 income bracket, making it the least populous group.
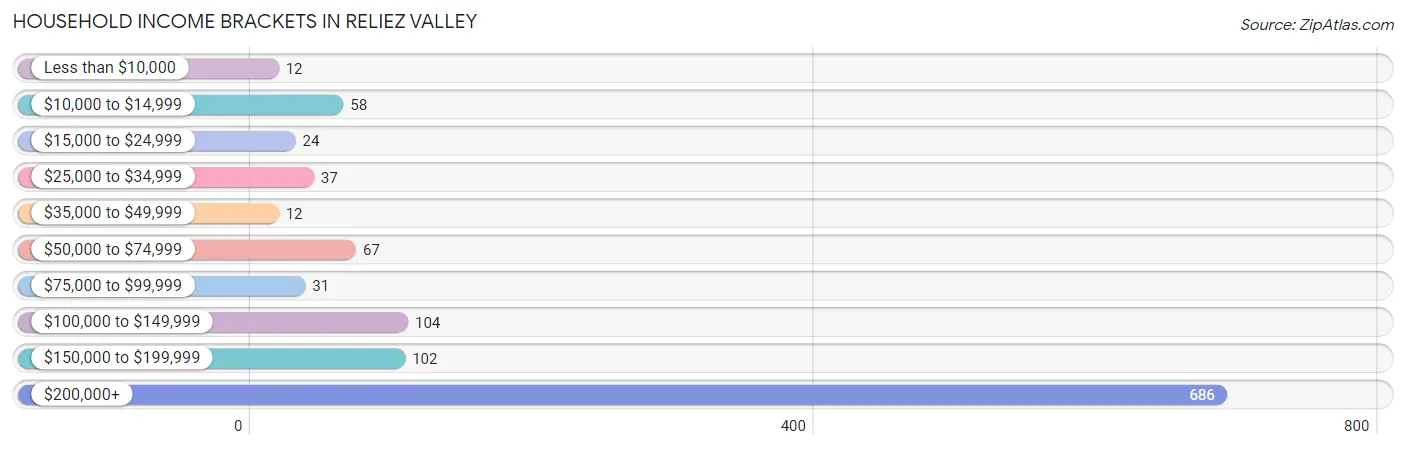
| Income Bracket | # Households | % Households |
| Less than $10,000 | 12 | 1.1% |
| $10,000 to $14,999 | 58 | 5.1% |
| $15,000 to $24,999 | 24 | 2.1% |
| $25,000 to $34,999 | 37 | 3.3% |
| $35,000 to $49,999 | 12 | 1.1% |
| $50,000 to $74,999 | 67 | 5.9% |
| $75,000 to $99,999 | 31 | 2.7% |
| $100,000 to $149,999 | 104 | 9.2% |
| $150,000 to $199,999 | 102 | 9.0% |
| $200,000+ | 686 | 60.4% |
Household Income by Householder Age in Reliez Valley
The median household income in Reliez Valley is $249,063, with the highest median household income of $250,001 found in the 25 to 44 years age bracket for the primary householder. A total of 155 households (13.7%) fall into this category.
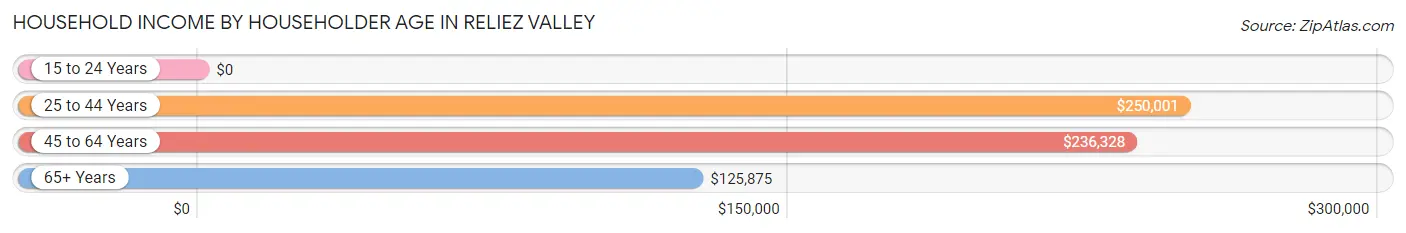
| Income Bracket | # Households | Median Income |
| 15 to 24 Years | 0 (0.0%) | $0 |
| 25 to 44 Years | 155 (13.7%) | $250,001 |
| 45 to 64 Years | 647 (57.0%) | $236,328 |
| 65+ Years | 333 (29.3%) | $125,875 |
| Total | 1,135 (100.0%) | $249,063 |
Poverty in Reliez Valley
Income Below Poverty by Sex and Age in Reliez Valley
With 2.1% poverty level for males and 8.6% for females among the residents of Reliez Valley, 65 to 74 year old males and 65 to 74 year old females are the most vulnerable to poverty, with 7 males (6.1%) and 31 females (20.3%) in their respective age groups living below the poverty level.
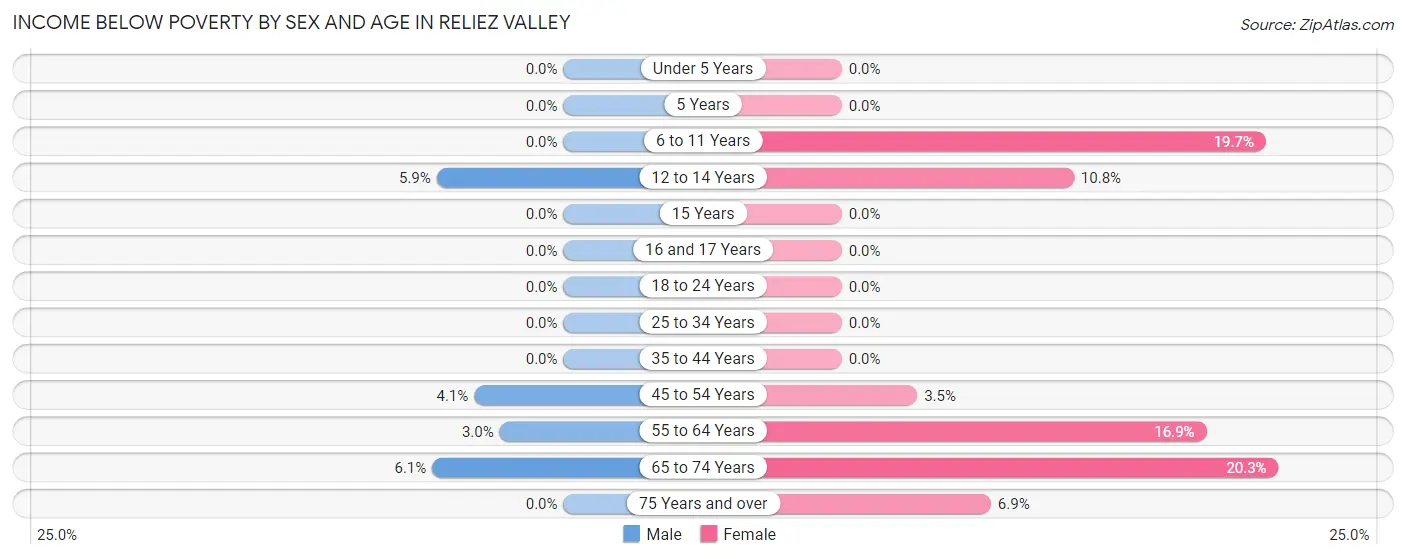
| Age Bracket | Male | Female |
| Under 5 Years | 0 (0.0%) | 0 (0.0%) |
| 5 Years | 0 (0.0%) | 0 (0.0%) |
| 6 to 11 Years | 0 (0.0%) | 12 (19.7%) |
| 12 to 14 Years | 7 (5.9%) | 14 (10.8%) |
| 15 Years | 0 (0.0%) | 0 (0.0%) |
| 16 and 17 Years | 0 (0.0%) | 0 (0.0%) |
| 18 to 24 Years | 0 (0.0%) | 0 (0.0%) |
| 25 to 34 Years | 0 (0.0%) | 0 (0.0%) |
| 35 to 44 Years | 0 (0.0%) | 0 (0.0%) |
| 45 to 54 Years | 12 (4.1%) | 12 (3.5%) |
| 55 to 64 Years | 10 (3.0%) | 45 (16.9%) |
| 65 to 74 Years | 7 (6.1%) | 31 (20.3%) |
| 75 Years and over | 0 (0.0%) | 11 (6.9%) |
| Total | 36 (2.1%) | 125 (8.6%) |
Income Above Poverty by Sex and Age in Reliez Valley
According to the poverty statistics in Reliez Valley, males aged under 5 years and females aged under 5 years are the age groups that are most secure financially, with 100.0% of males and 100.0% of females in these age groups living above the poverty line.
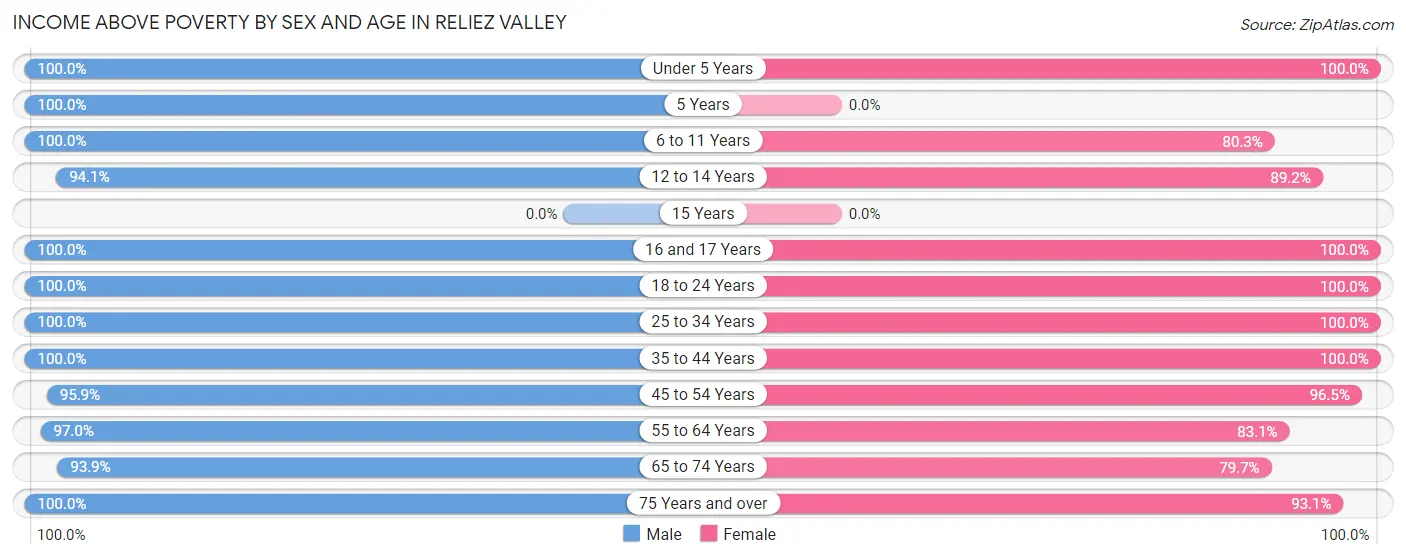
| Age Bracket | Male | Female |
| Under 5 Years | 29 (100.0%) | 27 (100.0%) |
| 5 Years | 21 (100.0%) | 0 (0.0%) |
| 6 to 11 Years | 232 (100.0%) | 49 (80.3%) |
| 12 to 14 Years | 112 (94.1%) | 116 (89.2%) |
| 15 Years | 0 (0.0%) | 0 (0.0%) |
| 16 and 17 Years | 46 (100.0%) | 20 (100.0%) |
| 18 to 24 Years | 136 (100.0%) | 100 (100.0%) |
| 25 to 34 Years | 16 (100.0%) | 98 (100.0%) |
| 35 to 44 Years | 159 (100.0%) | 91 (100.0%) |
| 45 to 54 Years | 278 (95.9%) | 331 (96.5%) |
| 55 to 64 Years | 328 (97.0%) | 221 (83.1%) |
| 65 to 74 Years | 108 (93.9%) | 122 (79.7%) |
| 75 Years and over | 209 (100.0%) | 148 (93.1%) |
| Total | 1,674 (97.9%) | 1,323 (91.4%) |
Income Below Poverty Among Married-Couple Families in Reliez Valley
The poverty statistics for married-couple families in Reliez Valley show that 3.0% or 22 of the total 723 families live below the poverty line. Families with 1 or 2 children have the highest poverty rate of 12.3%, comprising of 22 families. On the other hand, families with no children have the lowest poverty rate of 0.0%, which includes 0 families.
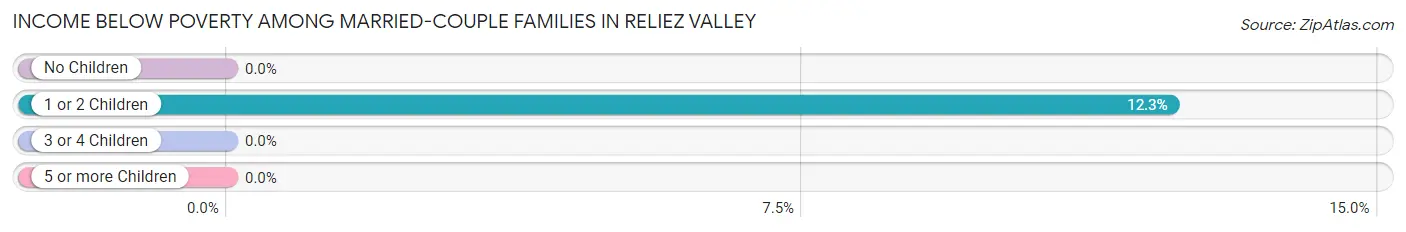
| Children | Above Poverty | Below Poverty |
| No Children | 473 (100.0%) | 0 (0.0%) |
| 1 or 2 Children | 157 (87.7%) | 22 (12.3%) |
| 3 or 4 Children | 71 (100.0%) | 0 (0.0%) |
| 5 or more Children | 0 (0.0%) | 0 (0.0%) |
| Total | 701 (97.0%) | 22 (3.0%) |
Income Below Poverty Among Single-Parent Households in Reliez Valley
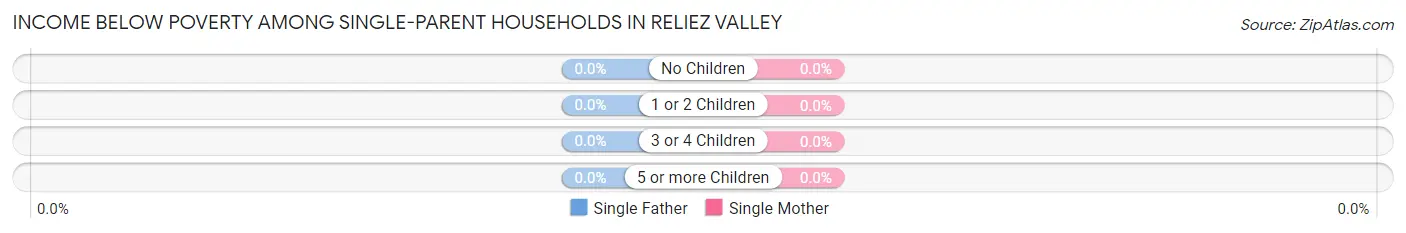
| Children | Single Father | Single Mother |
| No Children | 0 (0.0%) | 0 (0.0%) |
| 1 or 2 Children | 0 (0.0%) | 0 (0.0%) |
| 3 or 4 Children | 0 (0.0%) | 0 (0.0%) |
| 5 or more Children | 0 (0.0%) | 0 (0.0%) |
| Total | 0 (0.0%) | 0 (0.0%) |
Income Below Poverty Among Married-Couple vs Single-Parent Households in Reliez Valley
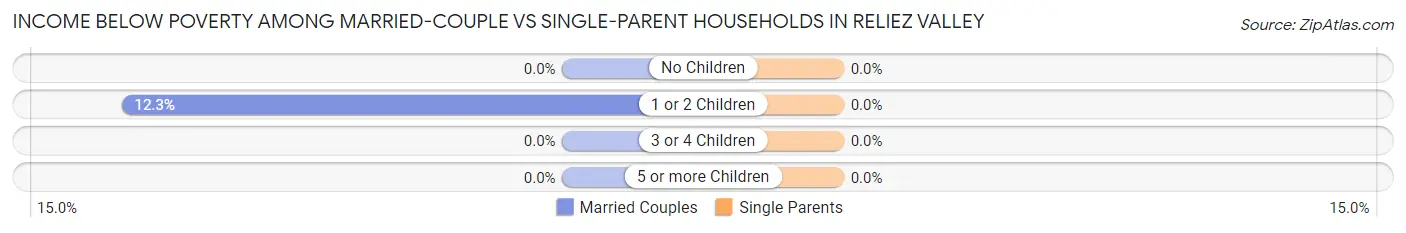
| Children | Married-Couple Families | Single-Parent Households |
| No Children | 0 (0.0%) | 0 (0.0%) |
| 1 or 2 Children | 22 (12.3%) | 0 (0.0%) |
| 3 or 4 Children | 0 (0.0%) | 0 (0.0%) |
| 5 or more Children | 0 (0.0%) | 0 (0.0%) |
| Total | 22 (3.0%) | 0 (0.0%) |
Race in Reliez Valley
The most populous races in Reliez Valley are White / Caucasian (2,225 | 69.8%), Asian (631 | 19.8%), and Hispanic or Latino (247 | 7.7%).
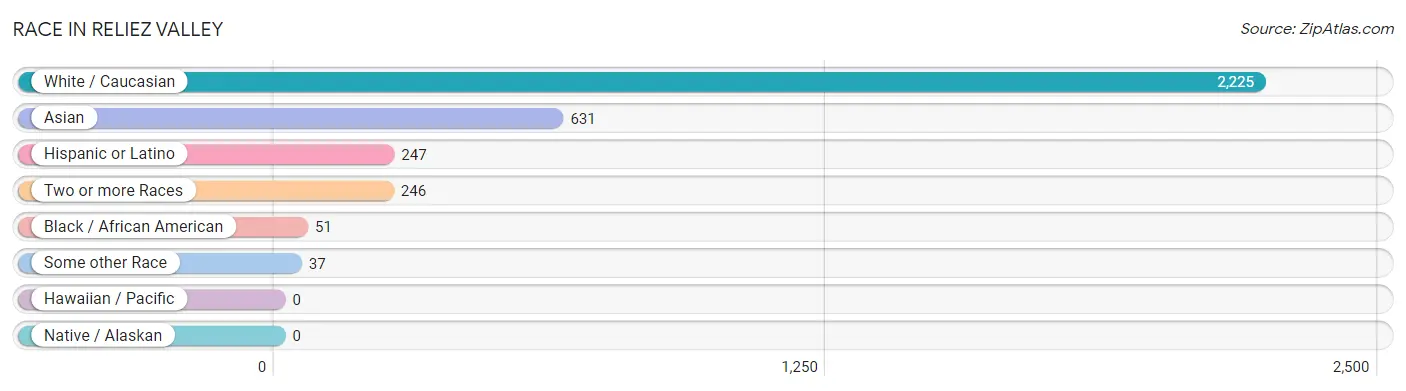
| Race | # Population | % Population |
| Asian | 631 | 19.8% |
| Black / African American | 51 | 1.6% |
| Hawaiian / Pacific | 0 | 0.0% |
| Hispanic or Latino | 247 | 7.7% |
| Native / Alaskan | 0 | 0.0% |
| White / Caucasian | 2,225 | 69.8% |
| Two or more Races | 246 | 7.7% |
| Some other Race | 37 | 1.2% |
| Total | 3,190 | 100.0% |
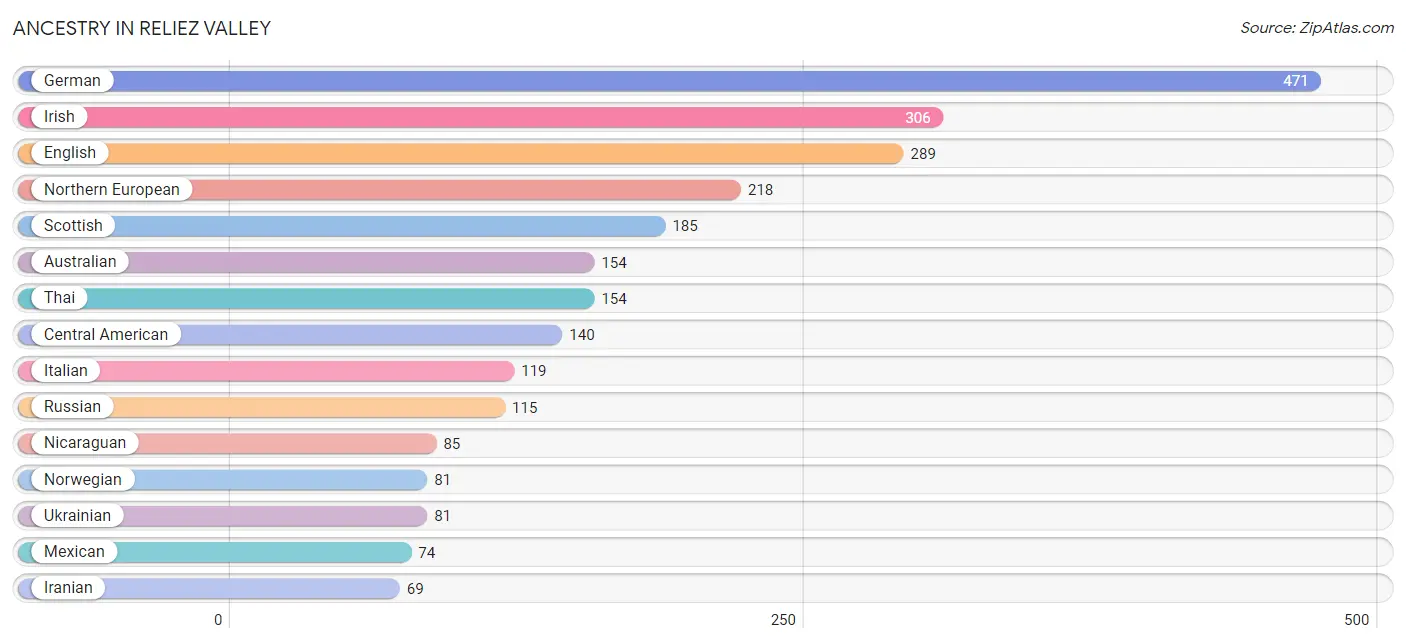
Ancestry in Reliez Valley
The most populous ancestries reported in Reliez Valley are German (471 | 14.8%), Irish (306 | 9.6%), English (289 | 9.1%), Northern European (218 | 6.8%), and Scottish (185 | 5.8%), together accounting for 46.0% of all Reliez Valley residents.
| Ancestry | # Population | % Population |
| African | 1 | 0.0% |
| American | 65 | 2.0% |
| Arab | 10 | 0.3% |
| Armenian | 12 | 0.4% |
| Australian | 154 | 4.8% |
| Belgian | 17 | 0.5% |
| Bhutanese | 42 | 1.3% |
| British | 11 | 0.3% |
| Canadian | 37 | 1.2% |
| Central American | 140 | 4.4% |
| Central American Indian | 14 | 0.4% |
| Croatian | 6 | 0.2% |
| Czech | 17 | 0.5% |
| Danish | 38 | 1.2% |
| Dutch | 18 | 0.6% |
| English | 289 | 9.1% |
| European | 19 | 0.6% |
| Filipino | 68 | 2.1% |
| Finnish | 7 | 0.2% |
| French | 31 | 1.0% |
| French Canadian | 7 | 0.2% |
| German | 471 | 14.8% |
| Greek | 40 | 1.3% |
| Guatemalan | 55 | 1.7% |
| Indian (Asian) | 17 | 0.5% |
| Iranian | 69 | 2.2% |
| Irish | 306 | 9.6% |
| Italian | 119 | 3.7% |
| Korean | 41 | 1.3% |
| Laotian | 43 | 1.3% |
| Mexican | 74 | 2.3% |
| Nicaraguan | 85 | 2.7% |
| Nigerian | 20 | 0.6% |
| Northern European | 218 | 6.8% |
| Norwegian | 81 | 2.5% |
| Polish | 57 | 1.8% |
| Portuguese | 15 | 0.5% |
| Puerto Rican | 8 | 0.3% |
| Russian | 115 | 3.6% |
| Scandinavian | 43 | 1.3% |
| Scotch-Irish | 12 | 0.4% |
| Scottish | 185 | 5.8% |
| Subsaharan African | 21 | 0.7% |
| Swedish | 19 | 0.6% |
| Thai | 154 | 4.8% |
| Ukrainian | 81 | 2.5% |
| Welsh | 11 | 0.3% | View All 47 Rows |
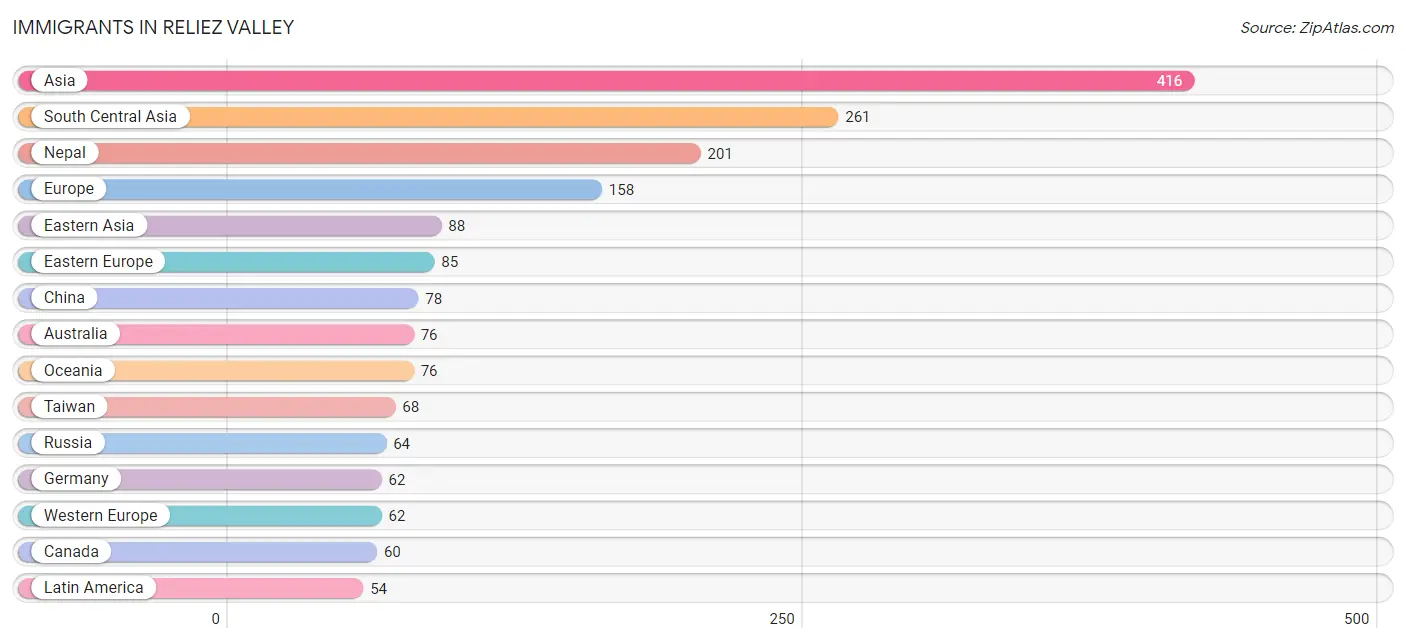
Immigrants in Reliez Valley
The most numerous immigrant groups reported in Reliez Valley came from Asia (416 | 13.0%), South Central Asia (261 | 8.2%), Nepal (201 | 6.3%), Europe (158 | 5.0%), and Eastern Asia (88 | 2.8%), together accounting for 35.2% of all Reliez Valley residents.
| Immigration Origin | # Population | % Population |
| Africa | 4 | 0.1% |
| Asia | 416 | 13.0% |
| Australia | 76 | 2.4% |
| Canada | 60 | 1.9% |
| Central America | 51 | 1.6% |
| China | 78 | 2.5% |
| Costa Rica | 25 | 0.8% |
| Eastern Asia | 88 | 2.8% |
| Eastern Europe | 85 | 2.7% |
| Europe | 158 | 5.0% |
| Germany | 62 | 1.9% |
| Guatemala | 26 | 0.8% |
| India | 13 | 0.4% |
| Indonesia | 22 | 0.7% |
| Iran | 47 | 1.5% |
| Israel | 28 | 0.9% |
| Italy | 11 | 0.3% |
| Japan | 10 | 0.3% |
| Latin America | 54 | 1.7% |
| Moldova | 21 | 0.7% |
| Nepal | 201 | 6.3% |
| Oceania | 76 | 2.4% |
| Peru | 3 | 0.1% |
| Philippines | 17 | 0.5% |
| Russia | 64 | 2.0% |
| South Africa | 4 | 0.1% |
| South America | 3 | 0.1% |
| South Central Asia | 261 | 8.2% |
| South Eastern Asia | 39 | 1.2% |
| Southern Europe | 11 | 0.3% |
| Taiwan | 68 | 2.1% |
| Western Asia | 28 | 0.9% |
| Western Europe | 62 | 1.9% | View All 33 Rows |
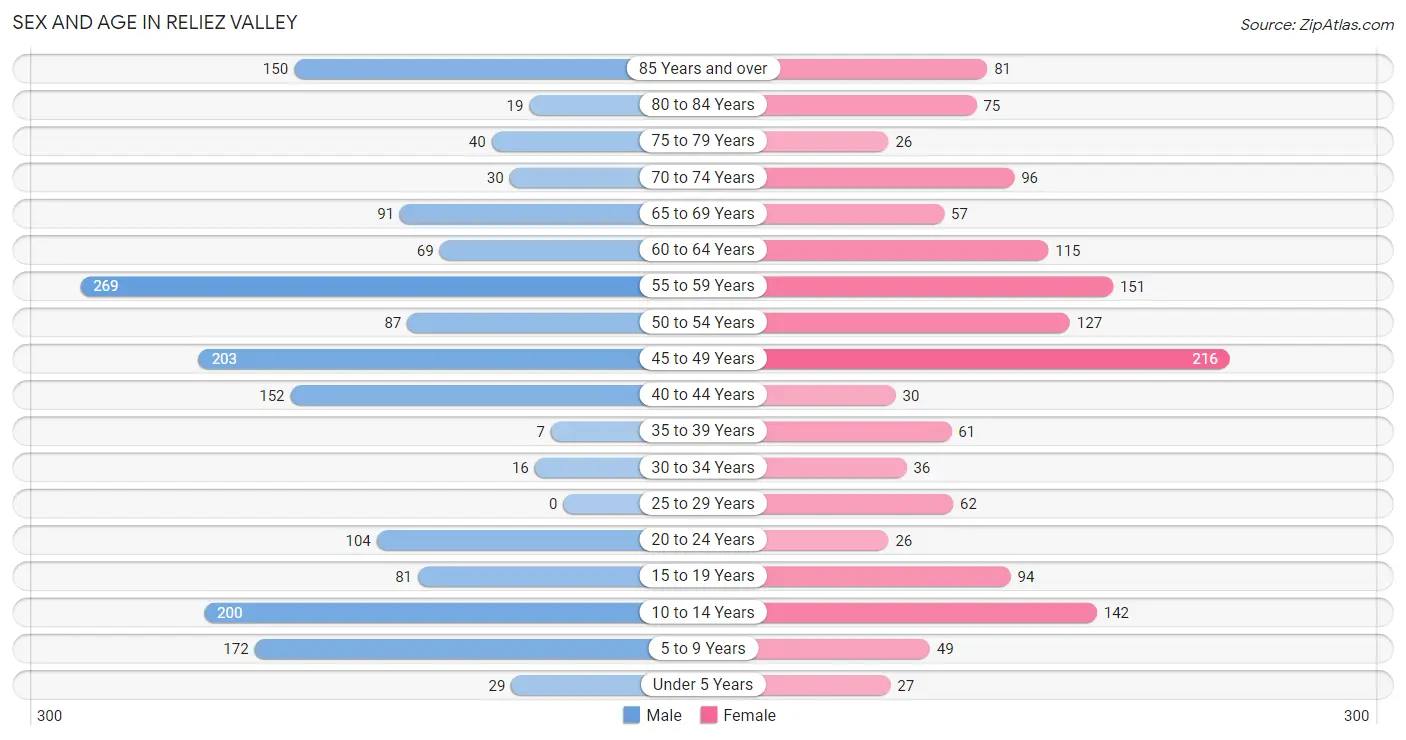
Sex and Age in Reliez Valley
Sex and Age in Reliez Valley
The most populous age groups in Reliez Valley are 55 to 59 Years (269 | 15.7%) for men and 45 to 49 Years (216 | 14.7%) for women.
| Age Bracket | Male | Female |
| Under 5 Years | 29 (1.7%) | 27 (1.8%) |
| 5 to 9 Years | 172 (10.0%) | 49 (3.3%) |
| 10 to 14 Years | 200 (11.6%) | 142 (9.7%) |
| 15 to 19 Years | 81 (4.7%) | 94 (6.4%) |
| 20 to 24 Years | 104 (6.0%) | 26 (1.8%) |
| 25 to 29 Years | 0 (0.0%) | 62 (4.2%) |
| 30 to 34 Years | 16 (0.9%) | 36 (2.5%) |
| 35 to 39 Years | 7 (0.4%) | 61 (4.2%) |
| 40 to 44 Years | 152 (8.8%) | 30 (2.0%) |
| 45 to 49 Years | 203 (11.8%) | 216 (14.7%) |
| 50 to 54 Years | 87 (5.1%) | 127 (8.6%) |
| 55 to 59 Years | 269 (15.7%) | 151 (10.3%) |
| 60 to 64 Years | 69 (4.0%) | 115 (7.8%) |
| 65 to 69 Years | 91 (5.3%) | 57 (3.9%) |
| 70 to 74 Years | 30 (1.8%) | 96 (6.5%) |
| 75 to 79 Years | 40 (2.3%) | 26 (1.8%) |
| 80 to 84 Years | 19 (1.1%) | 75 (5.1%) |
| 85 Years and over | 150 (8.7%) | 81 (5.5%) |
| Total | 1,719 (100.0%) | 1,471 (100.0%) |
Families and Households in Reliez Valley
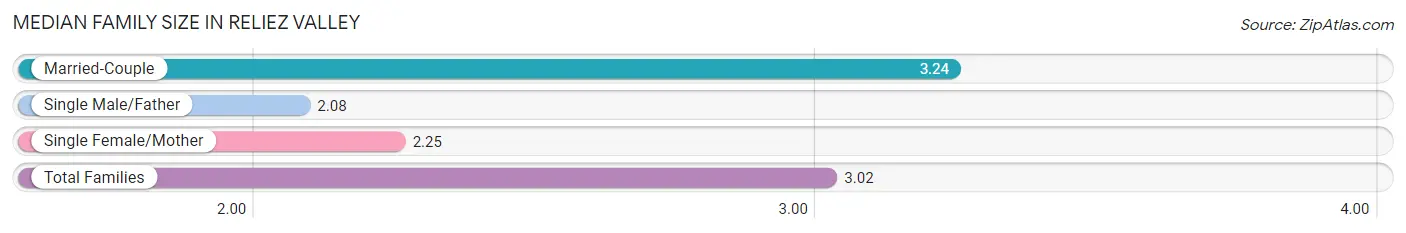
Median Family Size in Reliez Valley
The median family size in Reliez Valley is 3.02 persons per family, with married-couple families (723 | 80.2%) accounting for the largest median family size of 3.24 persons per family. On the other hand, single male/father families (146 | 16.2%) represent the smallest median family size with 2.08 persons per family.
| Family Type | # Families | Family Size |
| Married-Couple | 723 (80.2%) | 3.24 |
| Single Male/Father | 146 (16.2%) | 2.08 |
| Single Female/Mother | 32 (3.5%) | 2.25 |
| Total Families | 901 (100.0%) | 3.02 |
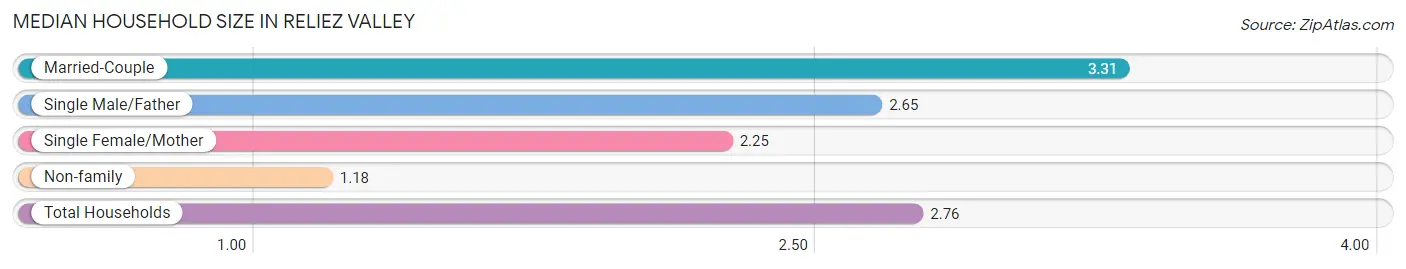
Median Household Size in Reliez Valley
The median household size in Reliez Valley is 2.76 persons per household, with married-couple households (723 | 63.7%) accounting for the largest median household size of 3.31 persons per household. non-family households (234 | 20.6%) represent the smallest median household size with 1.18 persons per household.
| Household Type | # Households | Household Size |
| Married-Couple | 723 (63.7%) | 3.31 |
| Single Male/Father | 146 (12.9%) | 2.65 |
| Single Female/Mother | 32 (2.8%) | 2.25 |
| Non-family | 234 (20.6%) | 1.18 |
| Total Households | 1,135 (100.0%) | 2.76 |
Household Size by Marriage Status in Reliez Valley
Out of a total of 1,135 households in Reliez Valley, 901 (79.4%) are family households, while 234 (20.6%) are nonfamily households. The most numerous type of family households are 2-person households, comprising 421, and the most common type of nonfamily households are 1-person households, comprising 194.
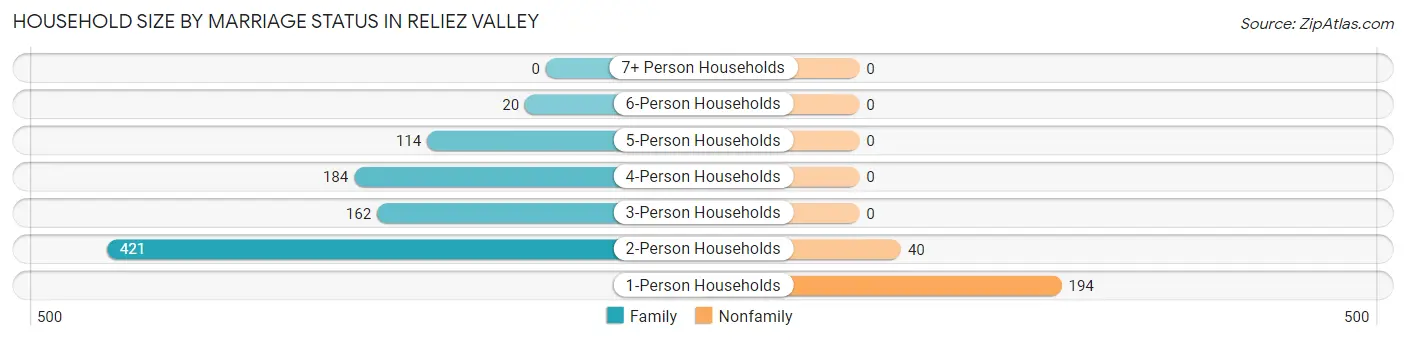
| Household Size | Family Households | Nonfamily Households |
| 1-Person Households | - | 194 (17.1%) |
| 2-Person Households | 421 (37.1%) | 40 (3.5%) |
| 3-Person Households | 162 (14.3%) | 0 (0.0%) |
| 4-Person Households | 184 (16.2%) | 0 (0.0%) |
| 5-Person Households | 114 (10.0%) | 0 (0.0%) |
| 6-Person Households | 20 (1.8%) | 0 (0.0%) |
| 7+ Person Households | 0 (0.0%) | 0 (0.0%) |
| Total | 901 (79.4%) | 234 (20.6%) |
Female Fertility in Reliez Valley
Fertility by Age in Reliez Valley
Average fertility rate in Reliez Valley is 15.0 births per 1,000 women. Women in the age bracket of 20 to 34 years have the highest fertility rate with 73.0 births per 1,000 women. Women in the age bracket of 20 to 34 years acount for 100.0% of all women with births.
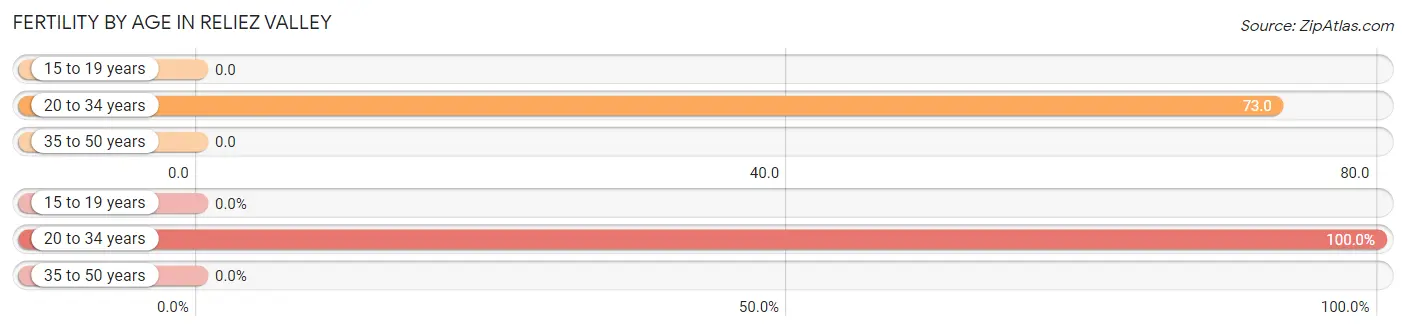
| Age Bracket | Women with Births | Births / 1,000 Women |
| 15 to 19 years | 0 (0.0%) | 0.0 |
| 20 to 34 years | 9 (100.0%) | 73.0 |
| 35 to 50 years | 0 (0.0%) | 0.0 |
| Total | 9 (100.0%) | 15.0 |
Fertility by Age by Marriage Status in Reliez Valley
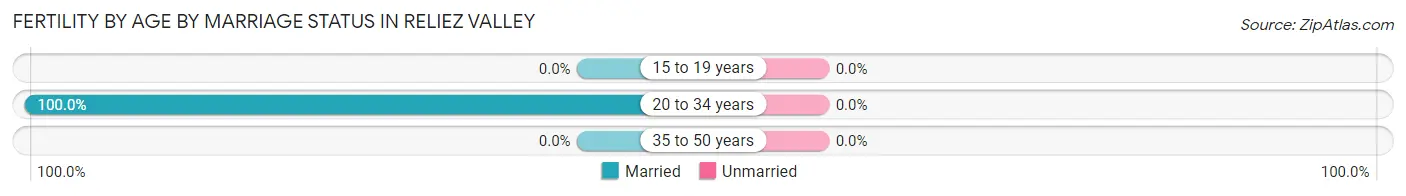
| Age Bracket | Married | Unmarried |
| 15 to 19 years | 0 (0.0%) | 0 (0.0%) |
| 20 to 34 years | 9 (100.0%) | 0 (0.0%) |
| 35 to 50 years | 0 (0.0%) | 0 (0.0%) |
| Total | 9 (100.0%) | 0 (0.0%) |
Fertility by Education in Reliez Valley
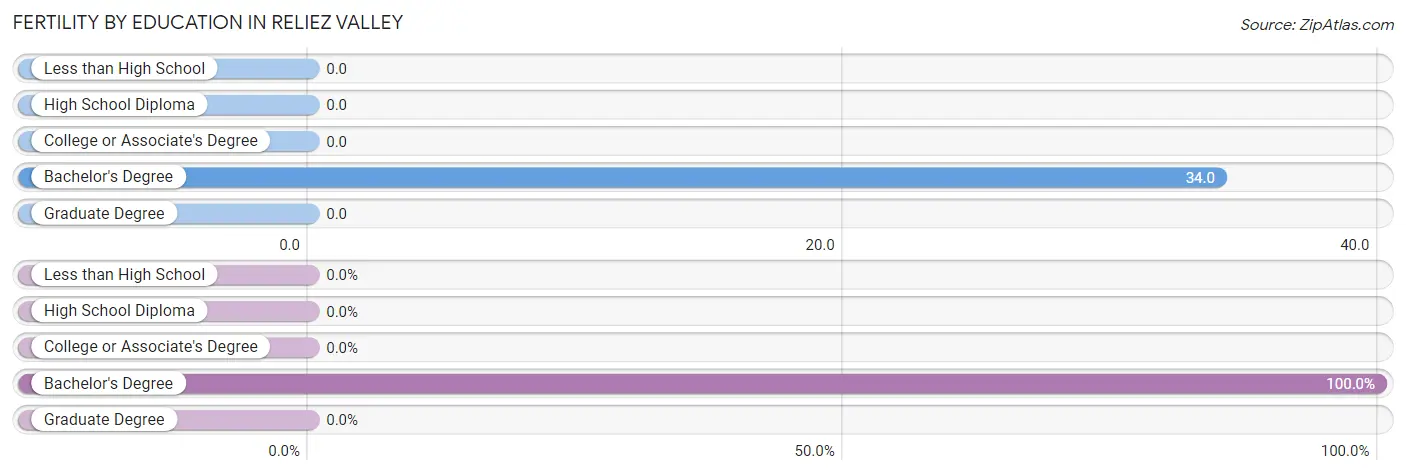
| Educational Attainment | Women with Births | Births / 1,000 Women |
| Less than High School | 0 (0.0%) | 0.0 |
| High School Diploma | 0 (0.0%) | 0.0 |
| College or Associate's Degree | 0 (0.0%) | 0.0 |
| Bachelor's Degree | 9 (100.0%) | 34.0 |
| Graduate Degree | 0 (0.0%) | 0.0 |
| Total | 9 (100.0%) | 15.0 |
Fertility by Education by Marriage Status in Reliez Valley
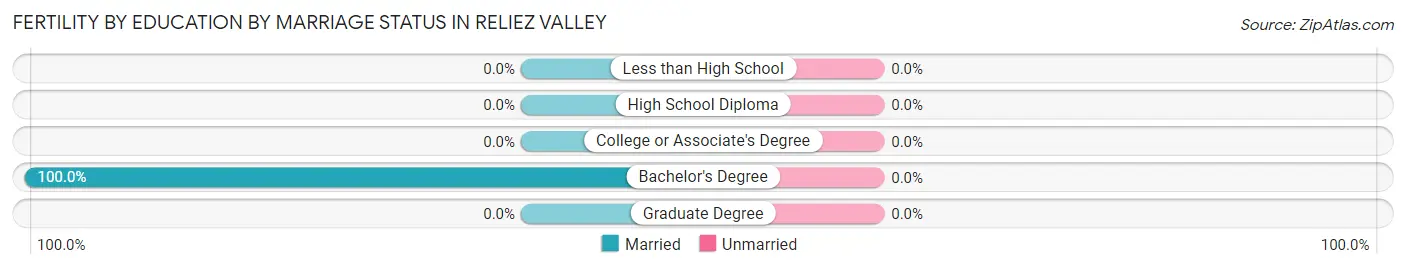
| Educational Attainment | Married | Unmarried |
| Less than High School | 0 (0.0%) | 0 (0.0%) |
| High School Diploma | 0 (0.0%) | 0 (0.0%) |
| College or Associate's Degree | 0 (0.0%) | 0 (0.0%) |
| Bachelor's Degree | 9 (100.0%) | 0 (0.0%) |
| Graduate Degree | 0 (0.0%) | 0 (0.0%) |
| Total | 9 (100.0%) | 0 (0.0%) |
Employment Characteristics in Reliez Valley
Employment by Class of Employer in Reliez Valley
Among the 1,392 employed individuals in Reliez Valley, private company employees (998 | 71.7%), self-employed (incorporated) (115 | 8.3%), and not-for-profit organizations (97 | 7.0%) make up the most common classes of employment.
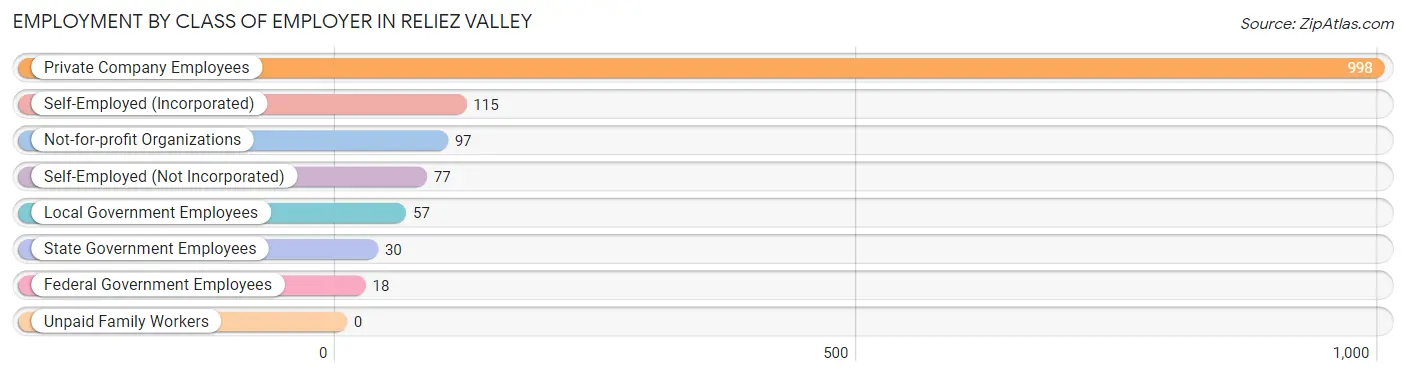
| Employer Class | # Employees | % Employees |
| Private Company Employees | 998 | 71.7% |
| Self-Employed (Incorporated) | 115 | 8.3% |
| Self-Employed (Not Incorporated) | 77 | 5.5% |
| Not-for-profit Organizations | 97 | 7.0% |
| Local Government Employees | 57 | 4.1% |
| State Government Employees | 30 | 2.2% |
| Federal Government Employees | 18 | 1.3% |
| Unpaid Family Workers | 0 | 0.0% |
| Total | 1,392 | 100.0% |
Employment Status by Age in Reliez Valley
According to the labor force statistics for Reliez Valley, out of the total population over 16 years of age (2,571), 58.8% or 1,512 individuals are in the labor force, with 6.7% or 101 of them unemployed. The age group with the highest labor force participation rate is 30 to 34 years, with 100.0% or 52 individuals in the labor force. Within the labor force, the 16 to 19 years age range has the highest percentage of unemployed individuals, with 100.0% or 89 of them being unemployed.
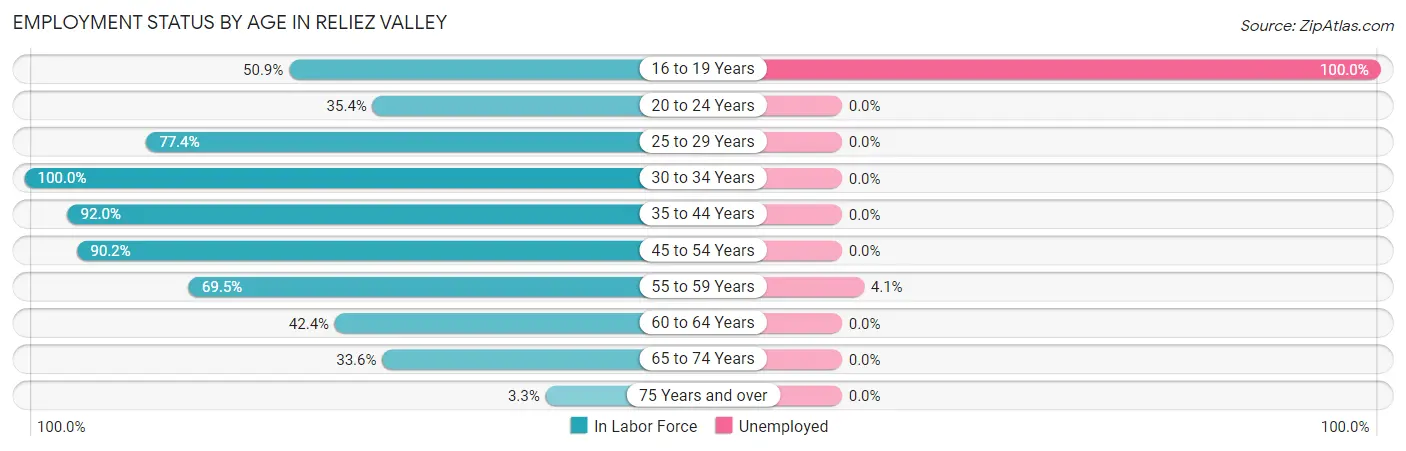
| Age Bracket | In Labor Force | Unemployed |
| 16 to 19 Years | 89 (50.9%) | 89 (100.0%) |
| 20 to 24 Years | 46 (35.4%) | 0 (0.0%) |
| 25 to 29 Years | 48 (77.4%) | 0 (0.0%) |
| 30 to 34 Years | 52 (100.0%) | 0 (0.0%) |
| 35 to 44 Years | 230 (92.0%) | 0 (0.0%) |
| 45 to 54 Years | 571 (90.2%) | 0 (0.0%) |
| 55 to 59 Years | 292 (69.5%) | 12 (4.1%) |
| 60 to 64 Years | 78 (42.4%) | 0 (0.0%) |
| 65 to 74 Years | 92 (33.6%) | 0 (0.0%) |
| 75 Years and over | 13 (3.3%) | 0 (0.0%) |
| Total | 1,512 (58.8%) | 101 (6.7%) |
Employment Status by Educational Attainment in Reliez Valley
According to labor force statistics for Reliez Valley, 79.4% of individuals (1,271) out of the total population between 25 and 64 years of age (1,601) are in the labor force, with 0.9% or 11 of them being unemployed. The group with the highest labor force participation rate are those with the educational attainment of high school diploma, with 91.7% or 66 individuals in the labor force. Within the labor force, individuals with bachelor's degree or higher education have the highest percentage of unemployment, with 1.1% or 12 of them being unemployed.
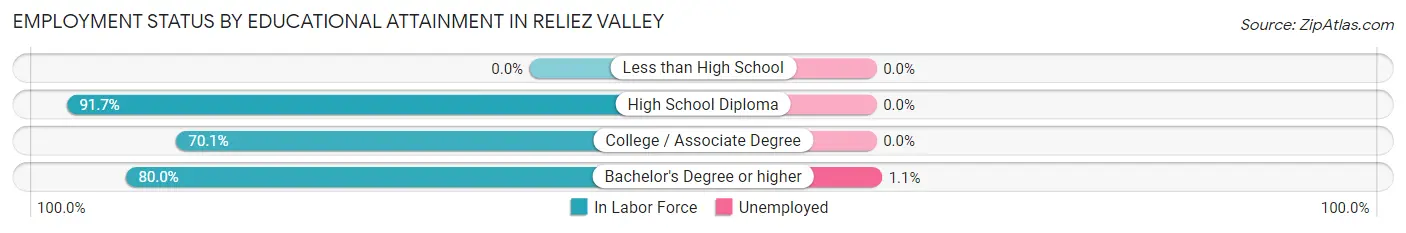
| Educational Attainment | In Labor Force | Unemployed |
| Less than High School | 0 (0.0%) | 0 (0.0%) |
| High School Diploma | 66 (91.7%) | 0 (0.0%) |
| College / Associate Degree | 131 (70.1%) | 0 (0.0%) |
| Bachelor's Degree or higher | 1,074 (80.0%) | 15 (1.1%) |
| Total | 1,271 (79.4%) | 14 (0.9%) |
Employment Occupations by Sex in Reliez Valley
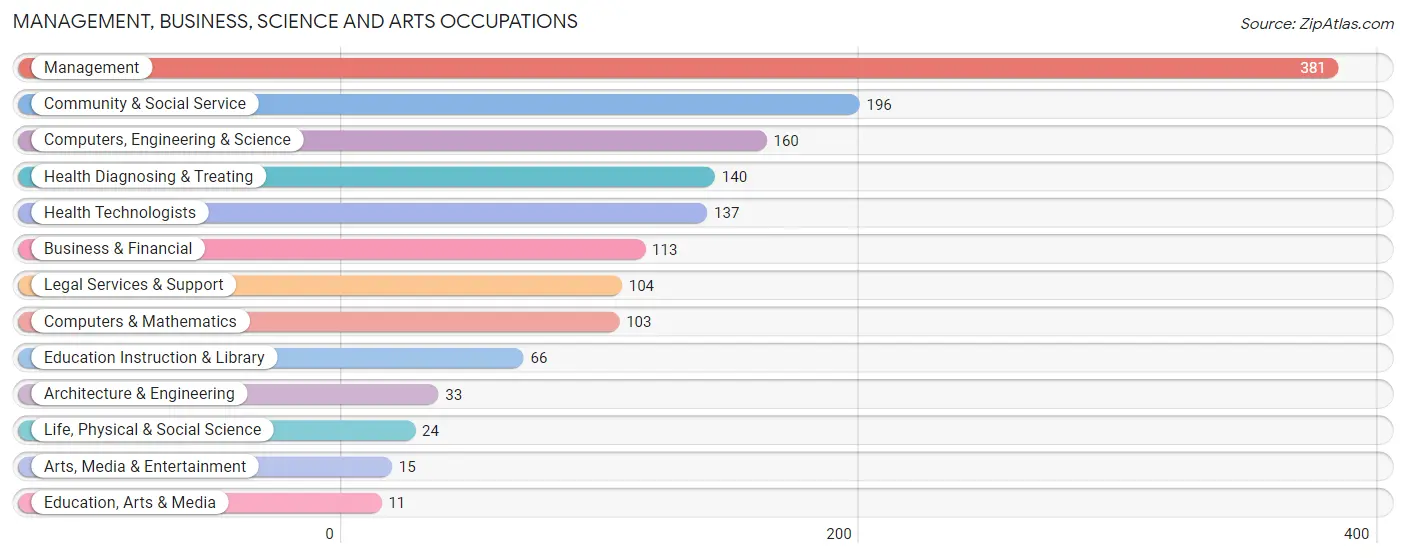
Management, Business, Science and Arts Occupations
The most common Management, Business, Science and Arts occupations in Reliez Valley are Management (381 | 27.0%), Community & Social Service (196 | 13.9%), Computers, Engineering & Science (160 | 11.4%), Health Diagnosing & Treating (140 | 9.9%), and Health Technologists (137 | 9.7%).
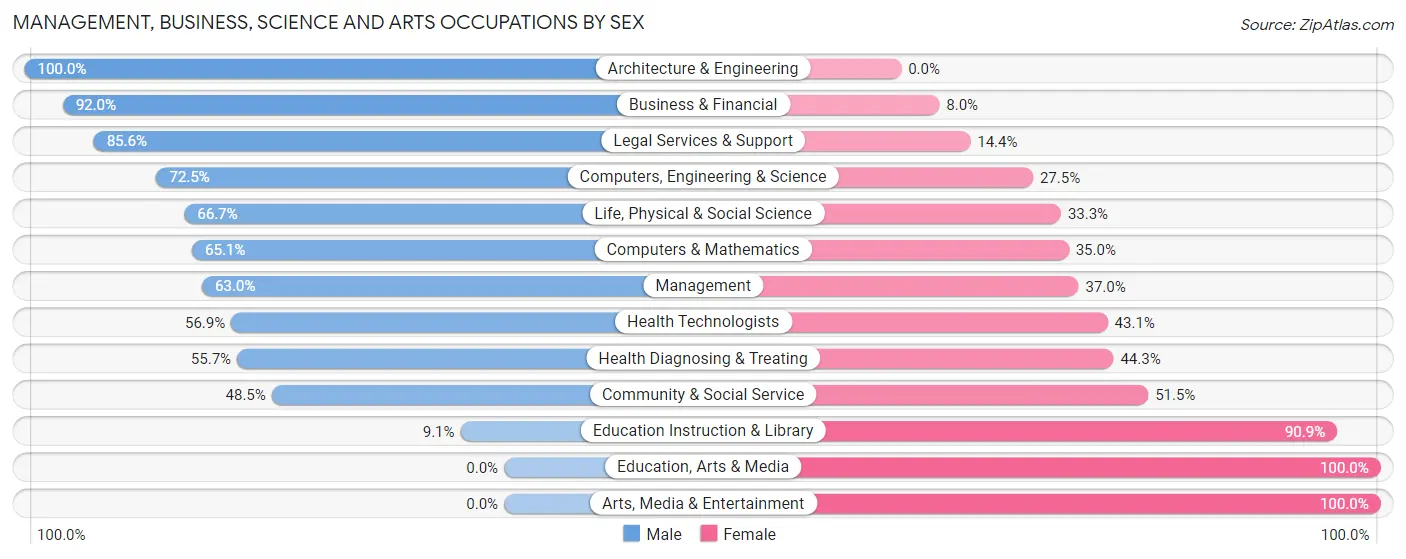
Management, Business, Science and Arts Occupations by Sex
Within the Management, Business, Science and Arts occupations in Reliez Valley, the most male-oriented occupations are Architecture & Engineering (100.0%), Business & Financial (92.0%), and Legal Services & Support (85.6%), while the most female-oriented occupations are Education, Arts & Media (100.0%), Arts, Media & Entertainment (100.0%), and Education Instruction & Library (90.9%).
| Occupation | Male | Female |
| Management | 240 (63.0%) | 141 (37.0%) |
| Business & Financial | 104 (92.0%) | 9 (8.0%) |
| Computers, Engineering & Science | 116 (72.5%) | 44 (27.5%) |
| Computers & Mathematics | 67 (65.0%) | 36 (34.9%) |
| Architecture & Engineering | 33 (100.0%) | 0 (0.0%) |
| Life, Physical & Social Science | 16 (66.7%) | 8 (33.3%) |
| Community & Social Service | 95 (48.5%) | 101 (51.5%) |
| Education, Arts & Media | 0 (0.0%) | 11 (100.0%) |
| Legal Services & Support | 89 (85.6%) | 15 (14.4%) |
| Education Instruction & Library | 6 (9.1%) | 60 (90.9%) |
| Arts, Media & Entertainment | 0 (0.0%) | 15 (100.0%) |
| Health Diagnosing & Treating | 78 (55.7%) | 62 (44.3%) |
| Health Technologists | 78 (56.9%) | 59 (43.1%) |
| Total (Category) | 633 (63.9%) | 357 (36.1%) |
| Total (Overall) | 804 (57.0%) | 606 (43.0%) |
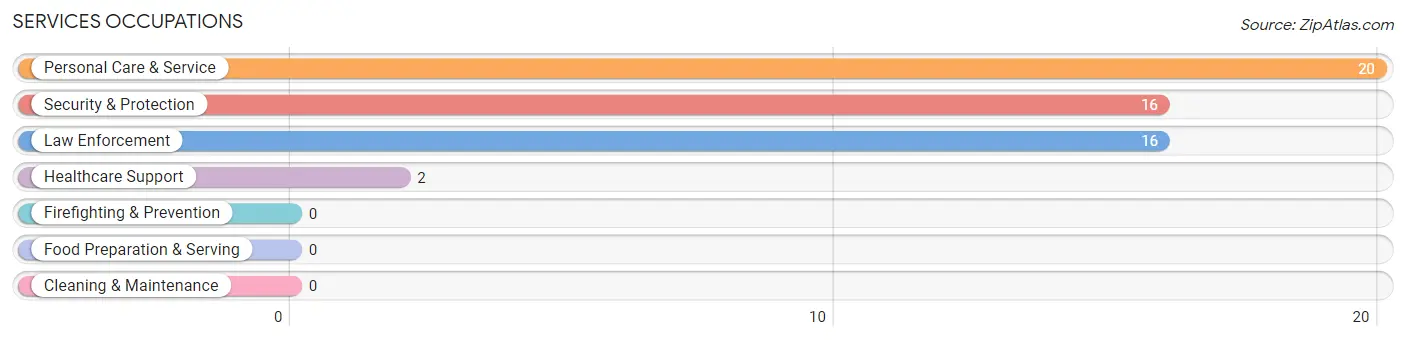
Services Occupations
The most common Services occupations in Reliez Valley are Personal Care & Service (20 | 1.4%), Security & Protection (16 | 1.1%), Law Enforcement (16 | 1.1%), and Healthcare Support (2 | 0.1%).
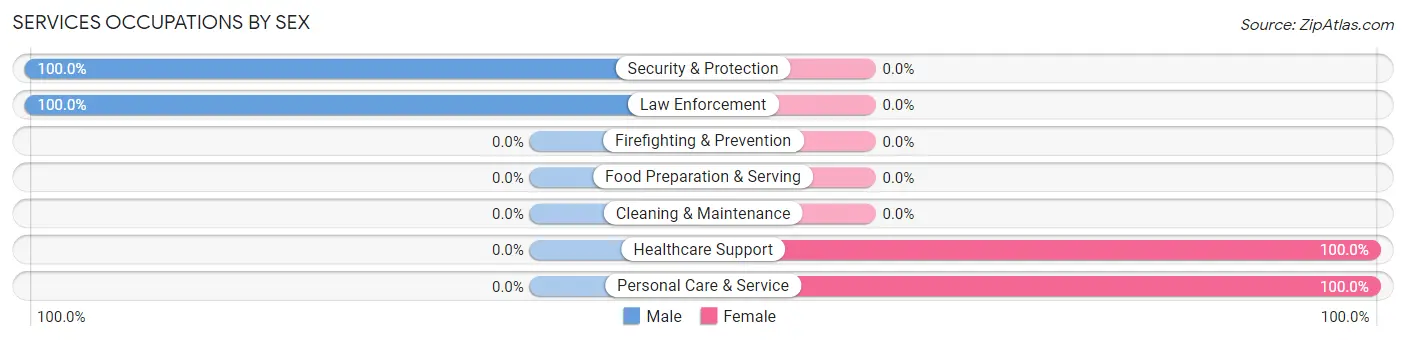
Services Occupations by Sex
Within the Services occupations in Reliez Valley, the most male-oriented occupations are Security & Protection (100.0%), and Law Enforcement (100.0%), while the most female-oriented occupations are Healthcare Support (100.0%), and Personal Care & Service (100.0%).
| Occupation | Male | Female |
| Healthcare Support | 0 (0.0%) | 2 (100.0%) |
| Security & Protection | 16 (100.0%) | 0 (0.0%) |
| Firefighting & Prevention | 0 (0.0%) | 0 (0.0%) |
| Law Enforcement | 16 (100.0%) | 0 (0.0%) |
| Food Preparation & Serving | 0 (0.0%) | 0 (0.0%) |
| Cleaning & Maintenance | 0 (0.0%) | 0 (0.0%) |
| Personal Care & Service | 0 (0.0%) | 20 (100.0%) |
| Total (Category) | 16 (42.1%) | 22 (57.9%) |
| Total (Overall) | 804 (57.0%) | 606 (43.0%) |
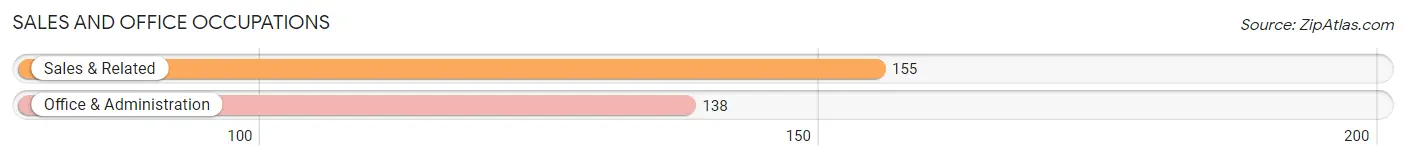
Sales and Office Occupations
The most common Sales and Office occupations in Reliez Valley are Sales & Related (155 | 11.0%), and Office & Administration (138 | 9.8%).
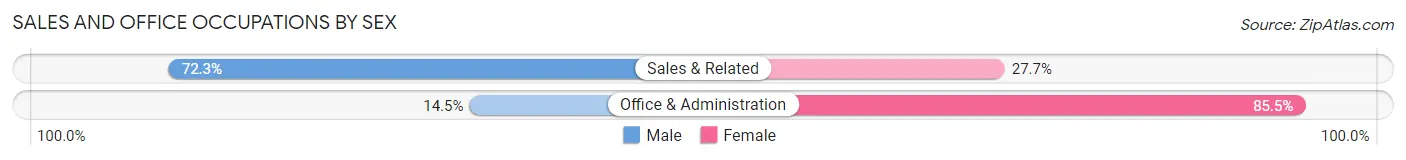
Sales and Office Occupations by Sex
| Occupation | Male | Female |
| Sales & Related | 112 (72.3%) | 43 (27.7%) |
| Office & Administration | 20 (14.5%) | 118 (85.5%) |
| Total (Category) | 132 (45.1%) | 161 (54.9%) |
| Total (Overall) | 804 (57.0%) | 606 (43.0%) |
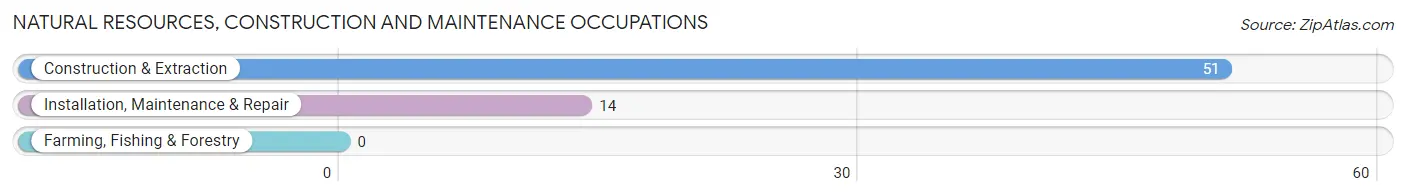
Natural Resources, Construction and Maintenance Occupations
The most common Natural Resources, Construction and Maintenance occupations in Reliez Valley are Construction & Extraction (51 | 3.6%), and Installation, Maintenance & Repair (14 | 1.0%).
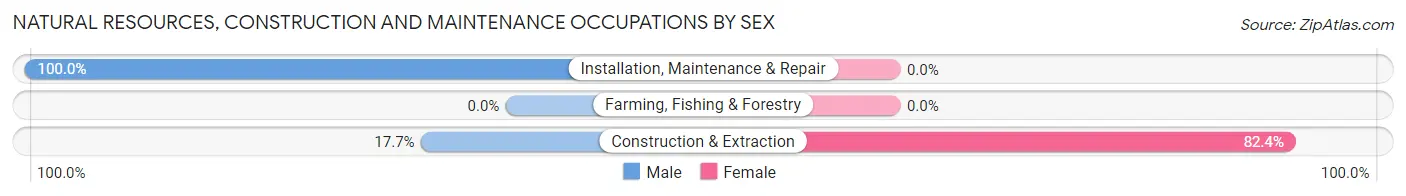
Natural Resources, Construction and Maintenance Occupations by Sex
| Occupation | Male | Female |
| Farming, Fishing & Forestry | 0 (0.0%) | 0 (0.0%) |
| Construction & Extraction | 9 (17.6%) | 42 (82.4%) |
| Installation, Maintenance & Repair | 14 (100.0%) | 0 (0.0%) |
| Total (Category) | 23 (35.4%) | 42 (64.6%) |
| Total (Overall) | 804 (57.0%) | 606 (43.0%) |
Production, Transportation and Moving Occupations
The most common Production, Transportation and Moving occupations in Reliez Valley are , and Material Moving (24 | 1.7%).
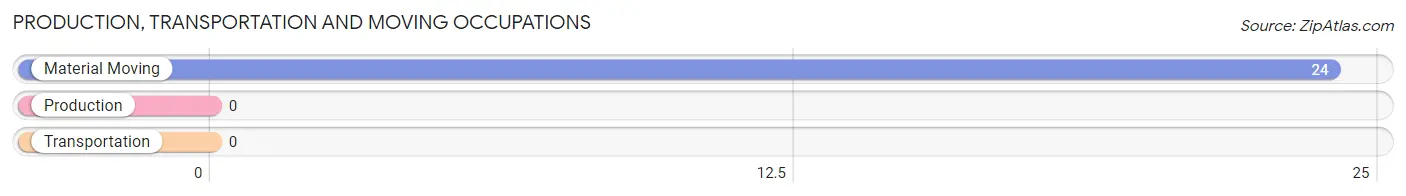
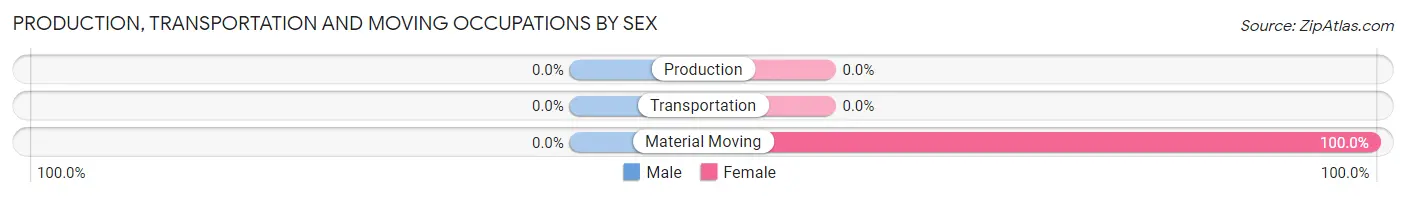
Production, Transportation and Moving Occupations by Sex
| Occupation | Male | Female |
| Production | 0 (0.0%) | 0 (0.0%) |
| Transportation | 0 (0.0%) | 0 (0.0%) |
| Material Moving | 0 (0.0%) | 24 (100.0%) |
| Total (Category) | 0 (0.0%) | 24 (100.0%) |
| Total (Overall) | 804 (57.0%) | 606 (43.0%) |
Employment Industries by Sex in Reliez Valley
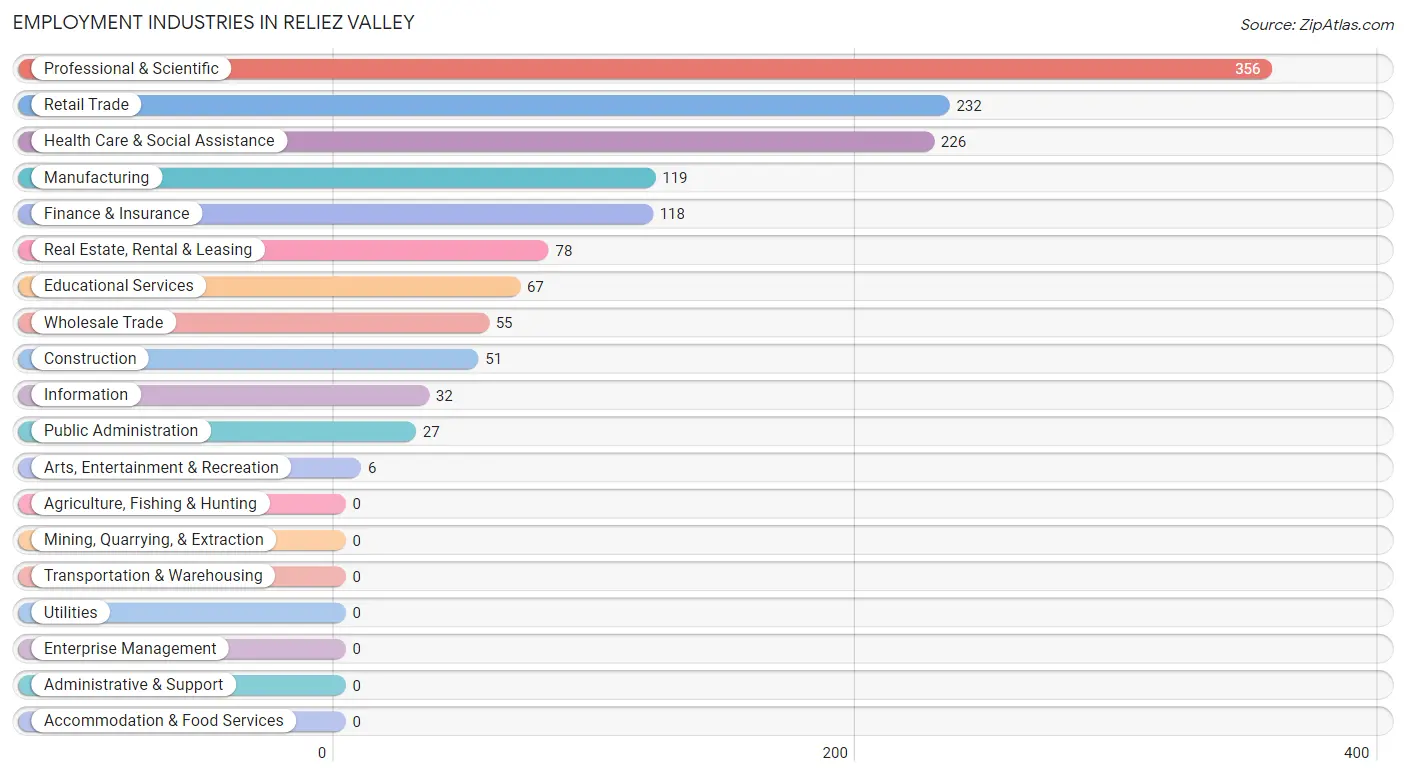
Employment Industries in Reliez Valley
The major employment industries in Reliez Valley include Professional & Scientific (356 | 25.3%), Retail Trade (232 | 16.5%), Health Care & Social Assistance (226 | 16.0%), Manufacturing (119 | 8.4%), and Finance & Insurance (118 | 8.4%).
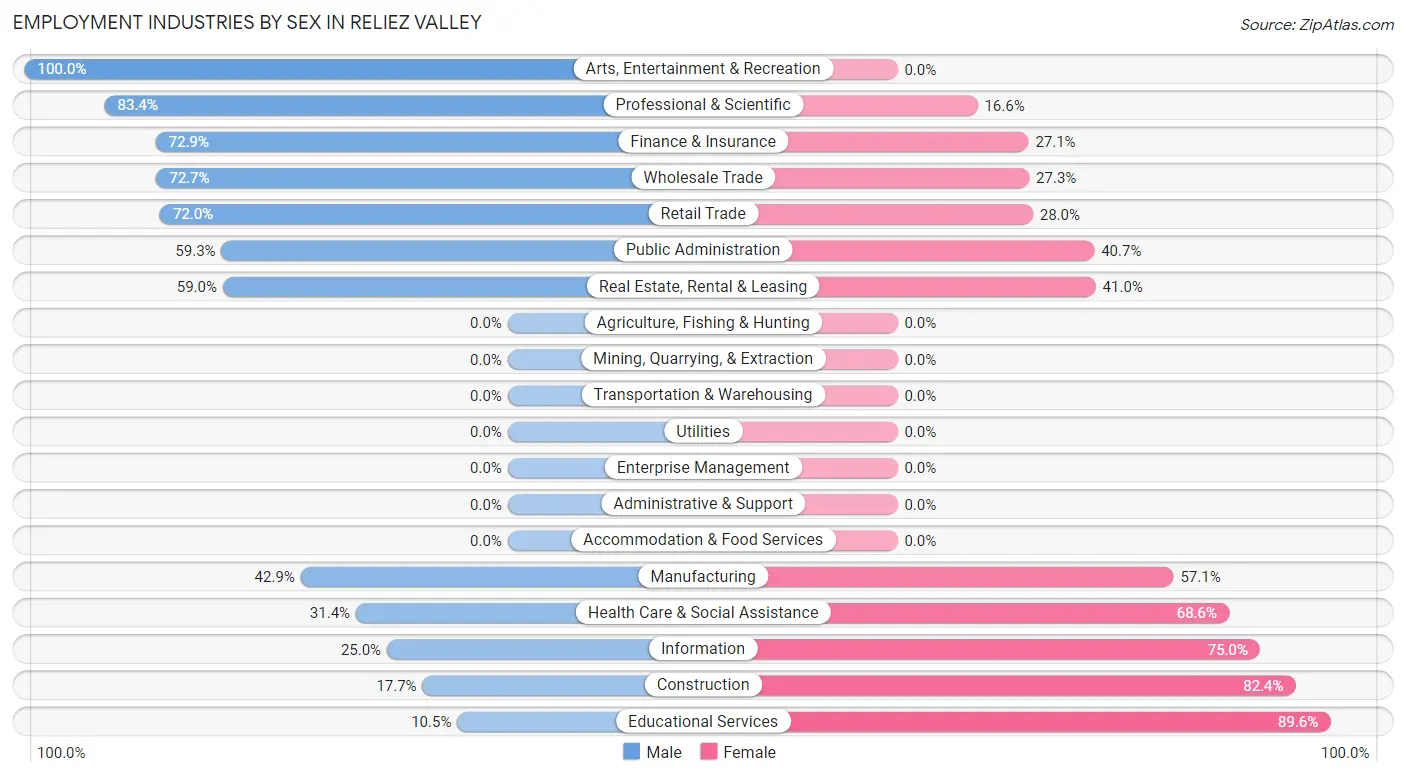
Employment Industries by Sex in Reliez Valley
The Reliez Valley industries that see more men than women are Arts, Entertainment & Recreation (100.0%), Professional & Scientific (83.4%), and Finance & Insurance (72.9%), whereas the industries that tend to have a higher number of women are Educational Services (89.5%), Construction (82.4%), and Information (75.0%).
| Industry | Male | Female |
| Agriculture, Fishing & Hunting | 0 (0.0%) | 0 (0.0%) |
| Mining, Quarrying, & Extraction | 0 (0.0%) | 0 (0.0%) |
| Construction | 9 (17.6%) | 42 (82.4%) |
| Manufacturing | 51 (42.9%) | 68 (57.1%) |
| Wholesale Trade | 40 (72.7%) | 15 (27.3%) |
| Retail Trade | 167 (72.0%) | 65 (28.0%) |
| Transportation & Warehousing | 0 (0.0%) | 0 (0.0%) |
| Utilities | 0 (0.0%) | 0 (0.0%) |
| Information | 8 (25.0%) | 24 (75.0%) |
| Finance & Insurance | 86 (72.9%) | 32 (27.1%) |
| Real Estate, Rental & Leasing | 46 (59.0%) | 32 (41.0%) |
| Professional & Scientific | 297 (83.4%) | 59 (16.6%) |
| Enterprise Management | 0 (0.0%) | 0 (0.0%) |
| Administrative & Support | 0 (0.0%) | 0 (0.0%) |
| Educational Services | 7 (10.4%) | 60 (89.5%) |
| Health Care & Social Assistance | 71 (31.4%) | 155 (68.6%) |
| Arts, Entertainment & Recreation | 6 (100.0%) | 0 (0.0%) |
| Accommodation & Food Services | 0 (0.0%) | 0 (0.0%) |
| Public Administration | 16 (59.3%) | 11 (40.7%) |
| Total | 804 (57.0%) | 606 (43.0%) |
Education in Reliez Valley
School Enrollment in Reliez Valley
The most common levels of schooling among the 1,026 students in Reliez Valley are college / undergraduate (277 | 27.0%), elementary school (234 | 22.8%), and middle school (220 | 21.4%).
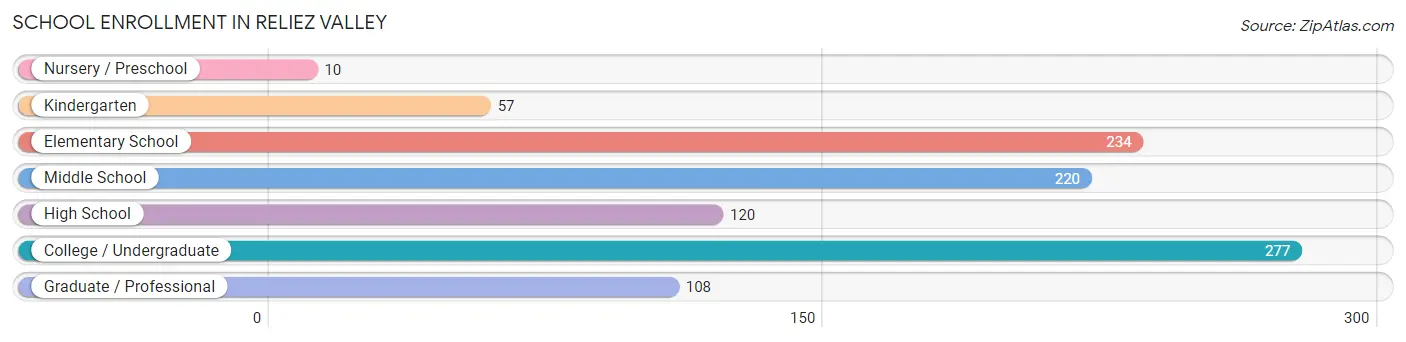
| School Level | # Students | % Students |
| Nursery / Preschool | 10 | 1.0% |
| Kindergarten | 57 | 5.6% |
| Elementary School | 234 | 22.8% |
| Middle School | 220 | 21.4% |
| High School | 120 | 11.7% |
| College / Undergraduate | 277 | 27.0% |
| Graduate / Professional | 108 | 10.5% |
| Total | 1,026 | 100.0% |
School Enrollment by Age by Funding Source in Reliez Valley
Out of a total of 1,026 students who are enrolled in schools in Reliez Valley, 338 (32.9%) attend a private institution, while the remaining 688 (67.1%) are enrolled in public schools. The age group of 3 to 4 year olds has the highest likelihood of being enrolled in private schools, with 10 (100.0% in the age bracket) enrolled. Conversely, the age group of 18 to 19 year olds has the lowest likelihood of being enrolled in a private school, with 106 (100.0% in the age bracket) attending a public institution.
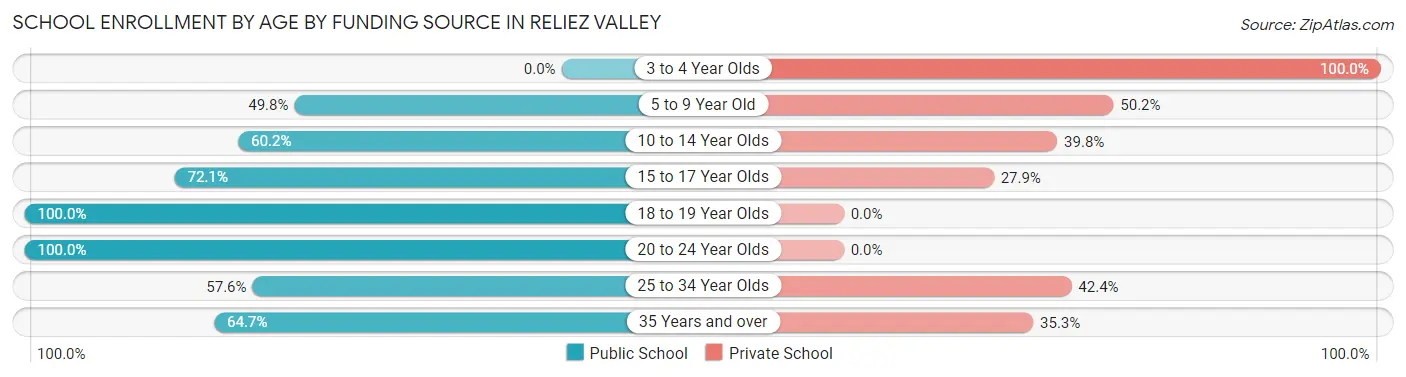
| Age Bracket | Public School | Private School |
| 3 to 4 Year Olds | 0 (0.0%) | 10 (100.0%) |
| 5 to 9 Year Old | 110 (49.8%) | 111 (50.2%) |
| 10 to 14 Year Olds | 206 (60.2%) | 136 (39.8%) |
| 15 to 17 Year Olds | 49 (72.1%) | 19 (27.9%) |
| 18 to 19 Year Olds | 106 (100.0%) | 0 (0.0%) |
| 20 to 24 Year Olds | 110 (100.0%) | 0 (0.0%) |
| 25 to 34 Year Olds | 19 (57.6%) | 14 (42.4%) |
| 35 Years and over | 88 (64.7%) | 48 (35.3%) |
| Total | 688 (67.1%) | 338 (32.9%) |
Educational Attainment by Field of Study in Reliez Valley
Business (365 | 19.6%), engineering (324 | 17.3%), social sciences (298 | 16.0%), bio, nature & agricultural (207 | 11.1%), and education (98 | 5.2%) are the most common fields of study among 1,867 individuals in Reliez Valley who have obtained a bachelor's degree or higher.
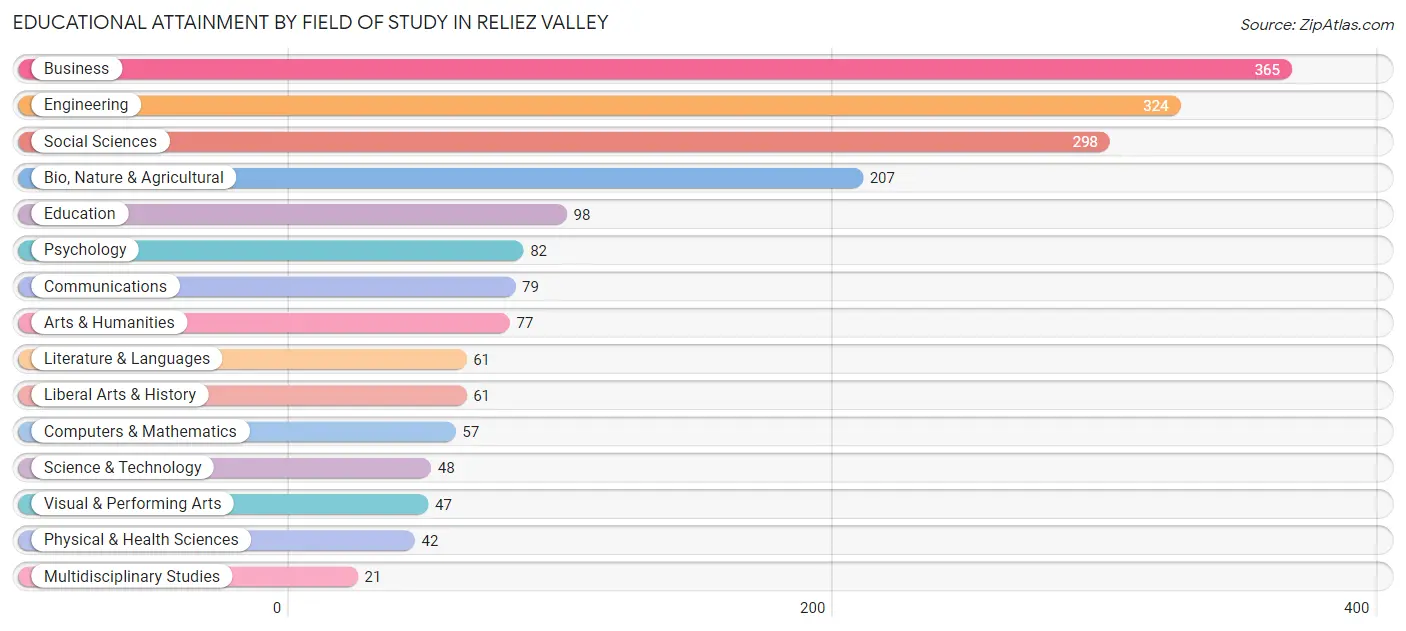
| Field of Study | # Graduates | % Graduates |
| Computers & Mathematics | 57 | 3.0% |
| Bio, Nature & Agricultural | 207 | 11.1% |
| Physical & Health Sciences | 42 | 2.2% |
| Psychology | 82 | 4.4% |
| Social Sciences | 298 | 16.0% |
| Engineering | 324 | 17.3% |
| Multidisciplinary Studies | 21 | 1.1% |
| Science & Technology | 48 | 2.6% |
| Business | 365 | 19.6% |
| Education | 98 | 5.2% |
| Literature & Languages | 61 | 3.3% |
| Liberal Arts & History | 61 | 3.3% |
| Visual & Performing Arts | 47 | 2.5% |
| Communications | 79 | 4.2% |
| Arts & Humanities | 77 | 4.1% |
| Total | 1,867 | 100.0% |
Transportation & Commute in Reliez Valley
Vehicle Availability by Sex in Reliez Valley
The most prevalent vehicle ownership categories in Reliez Valley are males with 3 vehicles (276, accounting for 34.7%) and females with 3 vehicles (211, making up 46.9%).
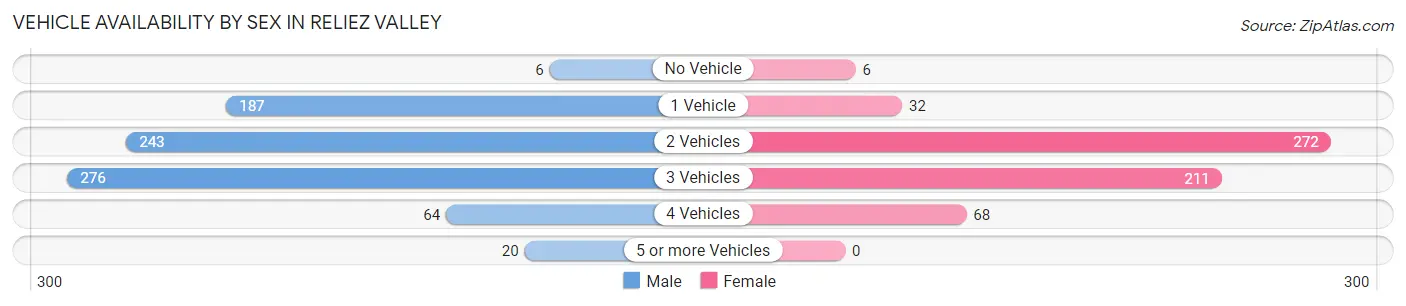
| Vehicles Available | Male | Female |
| No Vehicle | 6 (0.7%) | 6 (1.0%) |
| 1 Vehicle | 187 (23.5%) | 32 (5.4%) |
| 2 Vehicles | 243 (30.5%) | 272 (46.2%) |
| 3 Vehicles | 276 (34.7%) | 211 (35.8%) |
| 4 Vehicles | 64 (8.0%) | 68 (11.5%) |
| 5 or more Vehicles | 20 (2.5%) | 0 (0.0%) |
| Total | 796 (100.0%) | 589 (100.0%) |
Commute Time in Reliez Valley
The most frequently occuring commute durations in Reliez Valley are 20 to 24 minutes (180 commuters, 20.1%), 45 to 59 minutes (137 commuters, 15.3%), and 30 to 34 minutes (134 commuters, 15.0%).
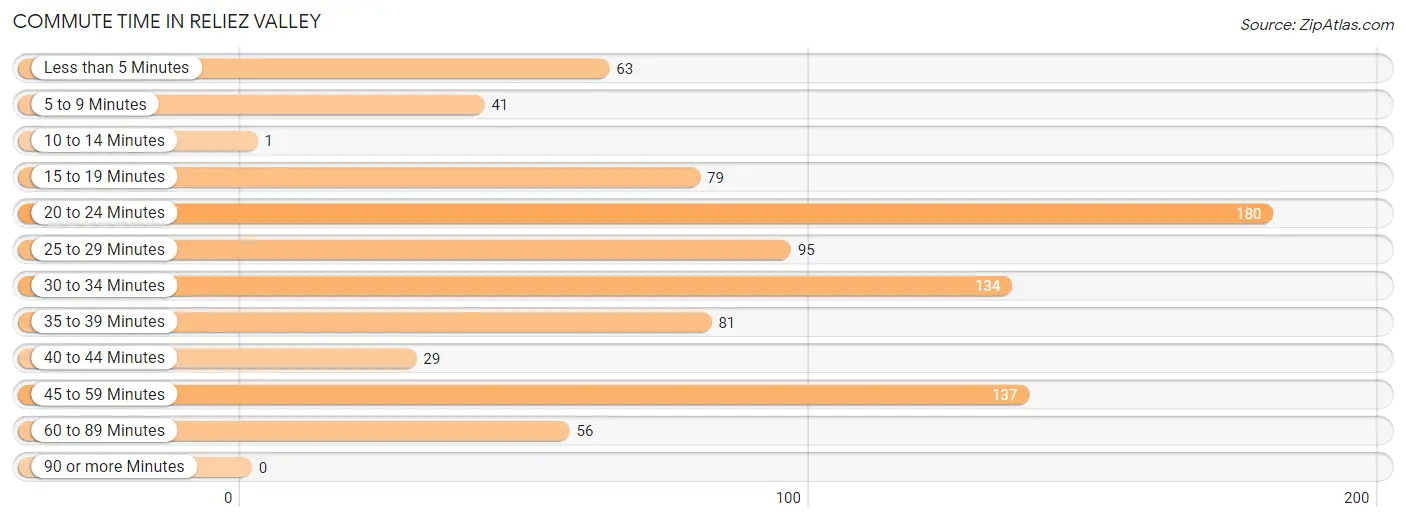
| Commute Time | # Commuters | % Commuters |
| Less than 5 Minutes | 63 | 7.0% |
| 5 to 9 Minutes | 41 | 4.6% |
| 10 to 14 Minutes | 1 | 0.1% |
| 15 to 19 Minutes | 79 | 8.8% |
| 20 to 24 Minutes | 180 | 20.1% |
| 25 to 29 Minutes | 95 | 10.6% |
| 30 to 34 Minutes | 134 | 15.0% |
| 35 to 39 Minutes | 81 | 9.0% |
| 40 to 44 Minutes | 29 | 3.2% |
| 45 to 59 Minutes | 137 | 15.3% |
| 60 to 89 Minutes | 56 | 6.2% |
| 90 or more Minutes | 0 | 0.0% |
Commute Time by Sex in Reliez Valley
The most common commute times in Reliez Valley are 45 to 59 minutes (118 commuters, 19.9%) for males and 20 to 24 minutes (64 commuters, 21.1%) for females.
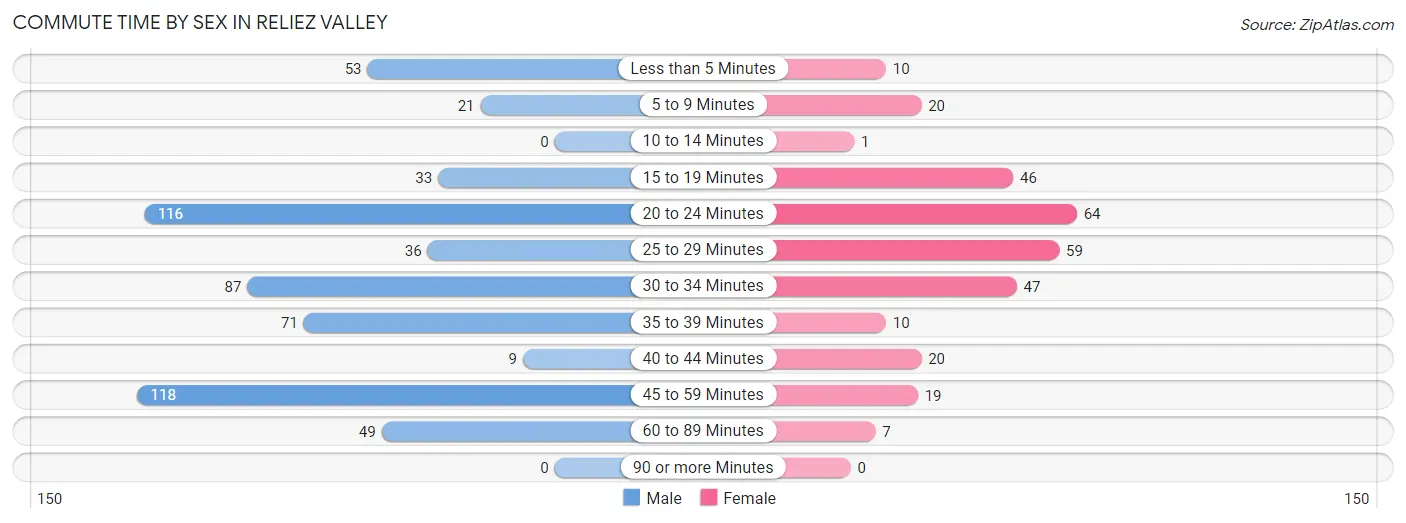
| Commute Time | Male | Female |
| Less than 5 Minutes | 53 (8.9%) | 10 (3.3%) |
| 5 to 9 Minutes | 21 (3.5%) | 20 (6.6%) |
| 10 to 14 Minutes | 0 (0.0%) | 1 (0.3%) |
| 15 to 19 Minutes | 33 (5.6%) | 46 (15.2%) |
| 20 to 24 Minutes | 116 (19.6%) | 64 (21.1%) |
| 25 to 29 Minutes | 36 (6.1%) | 59 (19.5%) |
| 30 to 34 Minutes | 87 (14.7%) | 47 (15.5%) |
| 35 to 39 Minutes | 71 (12.0%) | 10 (3.3%) |
| 40 to 44 Minutes | 9 (1.5%) | 20 (6.6%) |
| 45 to 59 Minutes | 118 (19.9%) | 19 (6.3%) |
| 60 to 89 Minutes | 49 (8.3%) | 7 (2.3%) |
| 90 or more Minutes | 0 (0.0%) | 0 (0.0%) |
Time of Departure to Work by Sex in Reliez Valley
The most frequent times of departure to work in Reliez Valley are 7:00 AM to 7:29 AM (137, 23.1%) for males and 8:00 AM to 8:29 AM (86, 28.4%) for females.
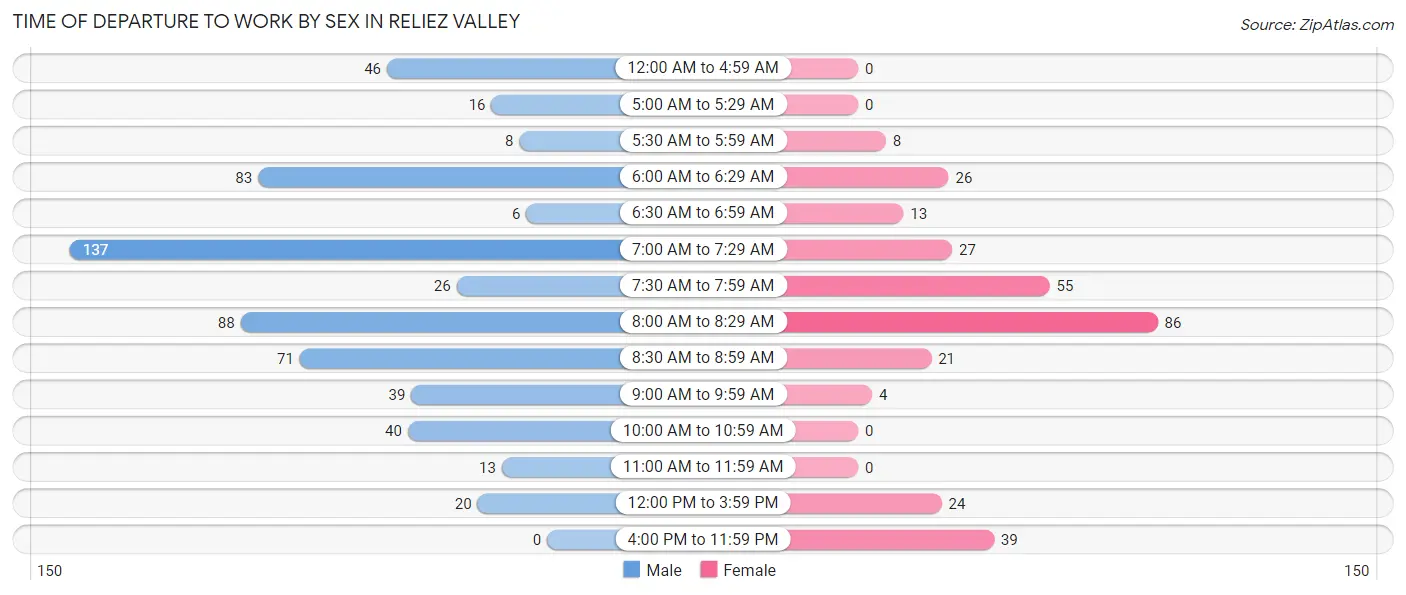
| Time of Departure | Male | Female |
| 12:00 AM to 4:59 AM | 46 (7.8%) | 0 (0.0%) |
| 5:00 AM to 5:29 AM | 16 (2.7%) | 0 (0.0%) |
| 5:30 AM to 5:59 AM | 8 (1.3%) | 8 (2.6%) |
| 6:00 AM to 6:29 AM | 83 (14.0%) | 26 (8.6%) |
| 6:30 AM to 6:59 AM | 6 (1.0%) | 13 (4.3%) |
| 7:00 AM to 7:29 AM | 137 (23.1%) | 27 (8.9%) |
| 7:30 AM to 7:59 AM | 26 (4.4%) | 55 (18.1%) |
| 8:00 AM to 8:29 AM | 88 (14.8%) | 86 (28.4%) |
| 8:30 AM to 8:59 AM | 71 (12.0%) | 21 (6.9%) |
| 9:00 AM to 9:59 AM | 39 (6.6%) | 4 (1.3%) |
| 10:00 AM to 10:59 AM | 40 (6.8%) | 0 (0.0%) |
| 11:00 AM to 11:59 AM | 13 (2.2%) | 0 (0.0%) |
| 12:00 PM to 3:59 PM | 20 (3.4%) | 24 (7.9%) |
| 4:00 PM to 11:59 PM | 0 (0.0%) | 39 (12.9%) |
| Total | 593 (100.0%) | 303 (100.0%) |
Housing Occupancy in Reliez Valley
Occupancy by Ownership in Reliez Valley
Of the total 1,135 dwellings in Reliez Valley, owner-occupied units account for 998 (87.9%), while renter-occupied units make up 137 (12.1%).
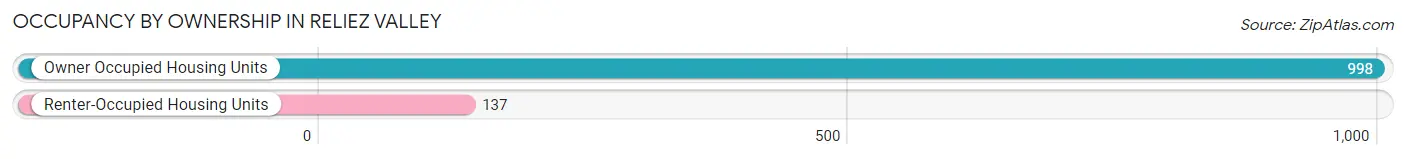
| Occupancy | # Housing Units | % Housing Units |
| Owner Occupied Housing Units | 998 | 87.9% |
| Renter-Occupied Housing Units | 137 | 12.1% |
| Total Occupied Housing Units | 1,135 | 100.0% |
Occupancy by Household Size in Reliez Valley
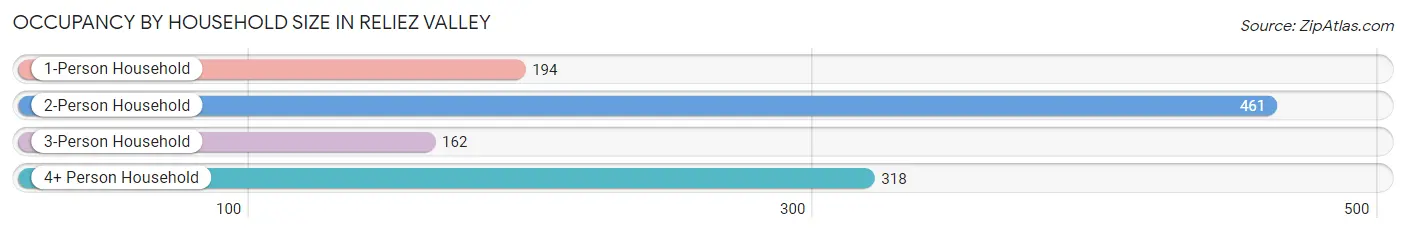
| Household Size | # Housing Units | % Housing Units |
| 1-Person Household | 194 | 17.1% |
| 2-Person Household | 461 | 40.6% |
| 3-Person Household | 162 | 14.3% |
| 4+ Person Household | 318 | 28.0% |
| Total Housing Units | 1,135 | 100.0% |
Occupancy by Ownership by Household Size in Reliez Valley
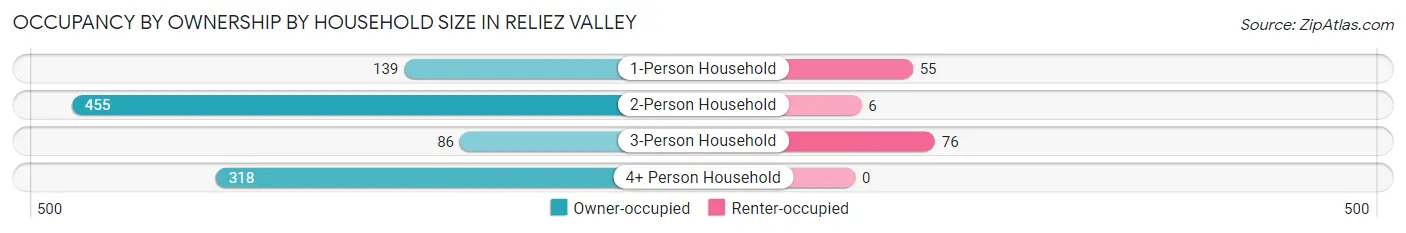
| Household Size | Owner-occupied | Renter-occupied |
| 1-Person Household | 139 (71.7%) | 55 (28.3%) |
| 2-Person Household | 455 (98.7%) | 6 (1.3%) |
| 3-Person Household | 86 (53.1%) | 76 (46.9%) |
| 4+ Person Household | 318 (100.0%) | 0 (0.0%) |
| Total Housing Units | 998 (87.9%) | 137 (12.1%) |
Occupancy by Educational Attainment in Reliez Valley
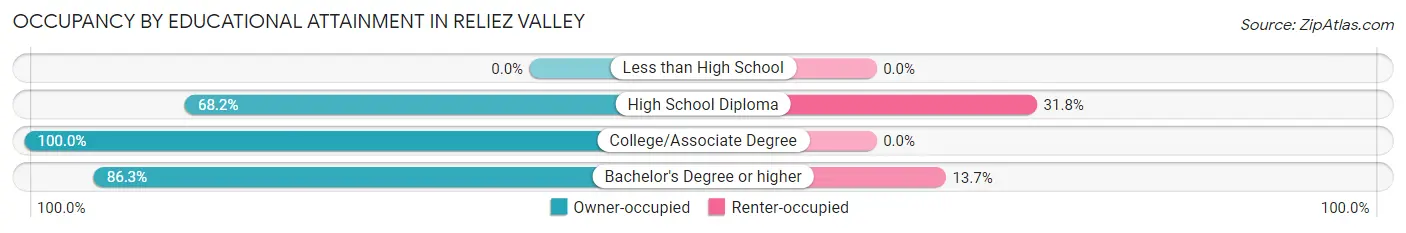
| Household Size | Owner-occupied | Renter-occupied |
| Less than High School | 0 (0.0%) | 0 (0.0%) |
| High School Diploma | 30 (68.2%) | 14 (31.8%) |
| College/Associate Degree | 196 (100.0%) | 0 (0.0%) |
| Bachelor's Degree or higher | 772 (86.3%) | 123 (13.7%) |
Occupancy by Age of Householder in Reliez Valley
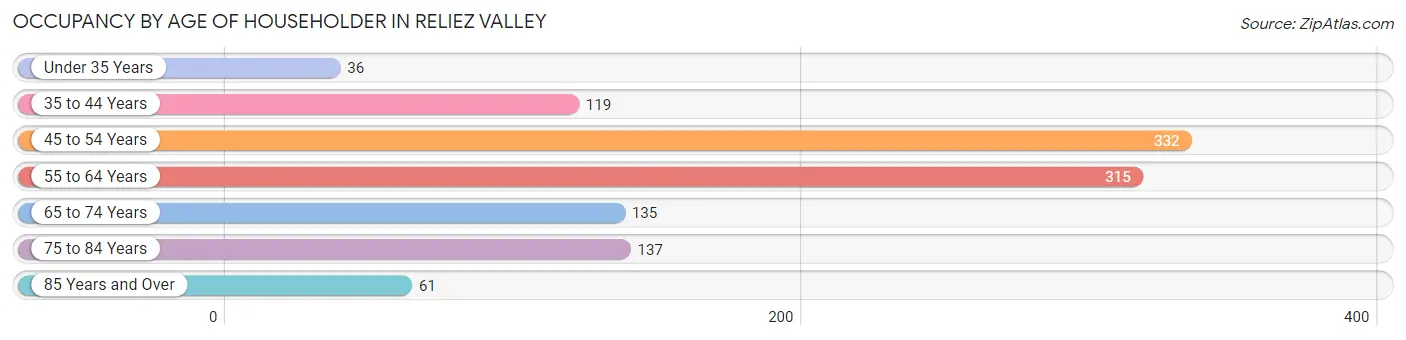
| Age Bracket | # Households | % Households |
| Under 35 Years | 36 | 3.2% |
| 35 to 44 Years | 119 | 10.5% |
| 45 to 54 Years | 332 | 29.2% |
| 55 to 64 Years | 315 | 27.8% |
| 65 to 74 Years | 135 | 11.9% |
| 75 to 84 Years | 137 | 12.1% |
| 85 Years and Over | 61 | 5.4% |
| Total | 1,135 | 100.0% |
Housing Finances in Reliez Valley
Median Income by Occupancy in Reliez Valley
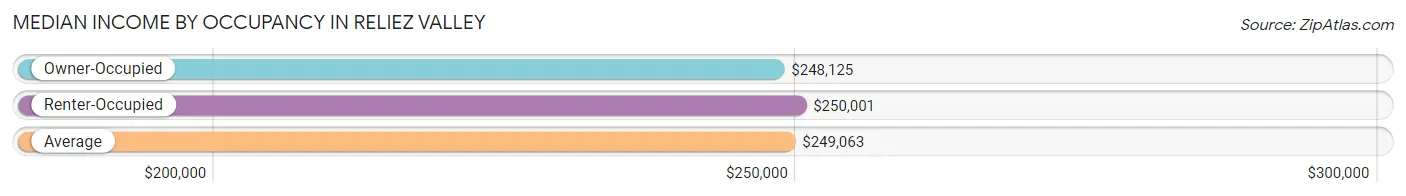
| Occupancy Type | # Households | Median Income |
| Owner-Occupied | 998 (87.9%) | $248,125 |
| Renter-Occupied | 137 (12.1%) | $250,001 |
| Average | 1,135 (100.0%) | $249,063 |
Occupancy by Householder Income Bracket in Reliez Valley
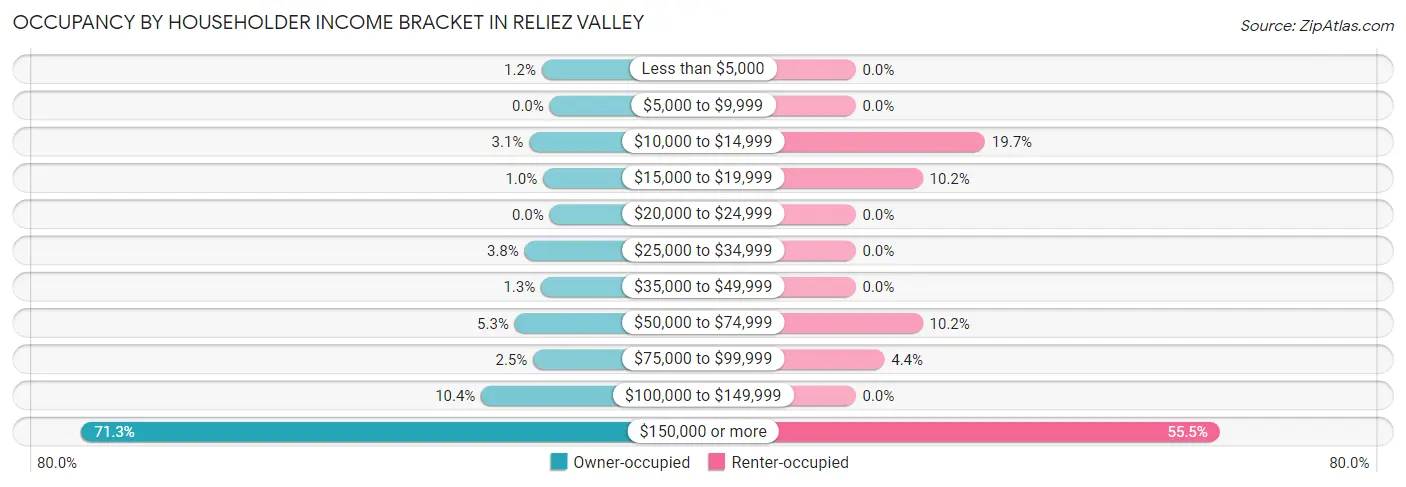
| Income Bracket | Owner-occupied | Renter-occupied |
| Less than $5,000 | 12 (1.2%) | 0 (0.0%) |
| $5,000 to $9,999 | 0 (0.0%) | 0 (0.0%) |
| $10,000 to $14,999 | 31 (3.1%) | 27 (19.7%) |
| $15,000 to $19,999 | 10 (1.0%) | 14 (10.2%) |
| $20,000 to $24,999 | 0 (0.0%) | 0 (0.0%) |
| $25,000 to $34,999 | 38 (3.8%) | 0 (0.0%) |
| $35,000 to $49,999 | 13 (1.3%) | 0 (0.0%) |
| $50,000 to $74,999 | 53 (5.3%) | 14 (10.2%) |
| $75,000 to $99,999 | 25 (2.5%) | 6 (4.4%) |
| $100,000 to $149,999 | 104 (10.4%) | 0 (0.0%) |
| $150,000 or more | 712 (71.3%) | 76 (55.5%) |
| Total | 998 (100.0%) | 137 (100.0%) |
Monthly Housing Cost Tiers in Reliez Valley
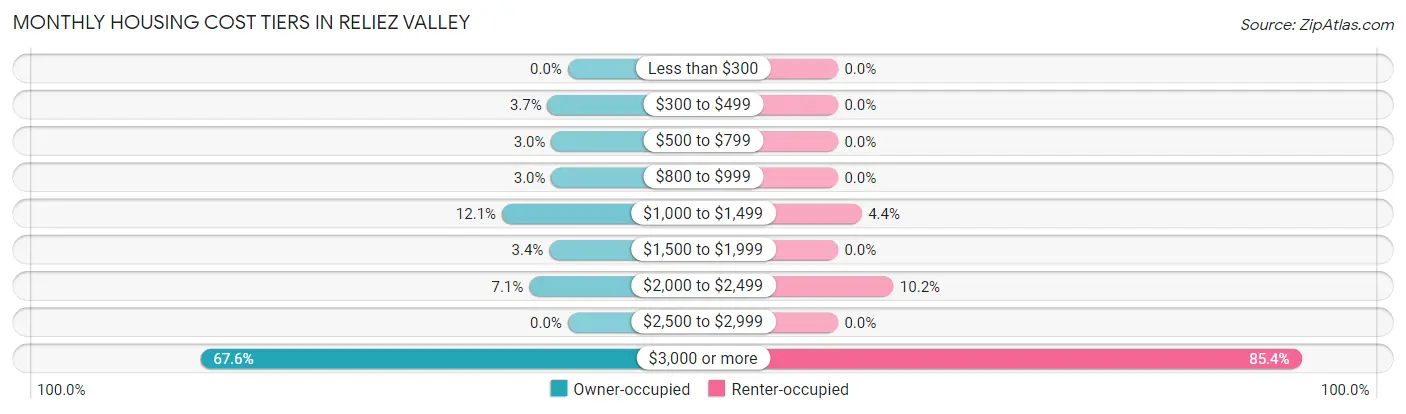
| Monthly Cost | Owner-occupied | Renter-occupied |
| Less than $300 | 0 (0.0%) | 0 (0.0%) |
| $300 to $499 | 37 (3.7%) | 0 (0.0%) |
| $500 to $799 | 30 (3.0%) | 0 (0.0%) |
| $800 to $999 | 30 (3.0%) | 0 (0.0%) |
| $1,000 to $1,499 | 121 (12.1%) | 6 (4.4%) |
| $1,500 to $1,999 | 34 (3.4%) | 0 (0.0%) |
| $2,000 to $2,499 | 71 (7.1%) | 14 (10.2%) |
| $2,500 to $2,999 | 0 (0.0%) | 0 (0.0%) |
| $3,000 or more | 675 (67.6%) | 117 (85.4%) |
| Total | 998 (100.0%) | 137 (100.0%) |
Physical Housing Characteristics in Reliez Valley
Housing Structures in Reliez Valley
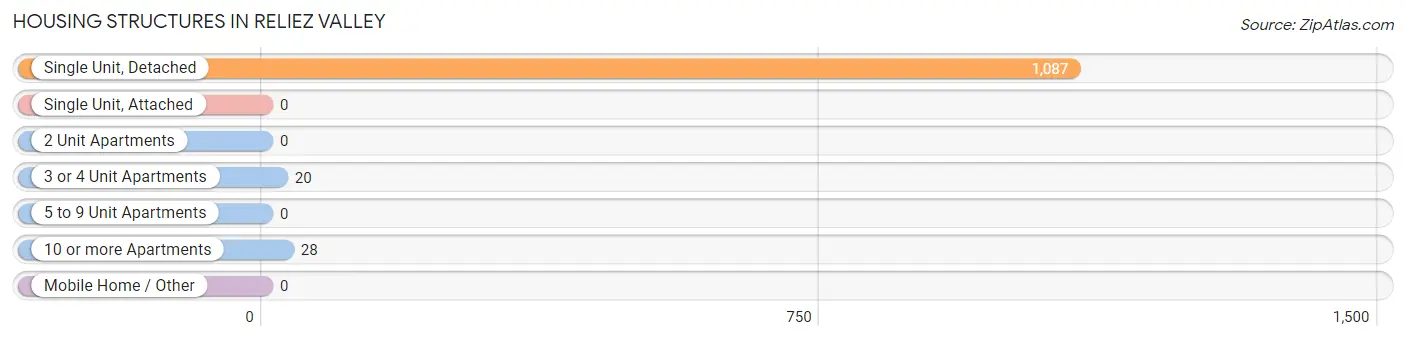
| Structure Type | # Housing Units | % Housing Units |
| Single Unit, Detached | 1,087 | 95.8% |
| Single Unit, Attached | 0 | 0.0% |
| 2 Unit Apartments | 0 | 0.0% |
| 3 or 4 Unit Apartments | 20 | 1.8% |
| 5 to 9 Unit Apartments | 0 | 0.0% |
| 10 or more Apartments | 28 | 2.5% |
| Mobile Home / Other | 0 | 0.0% |
| Total | 1,135 | 100.0% |
Housing Structures by Occupancy in Reliez Valley
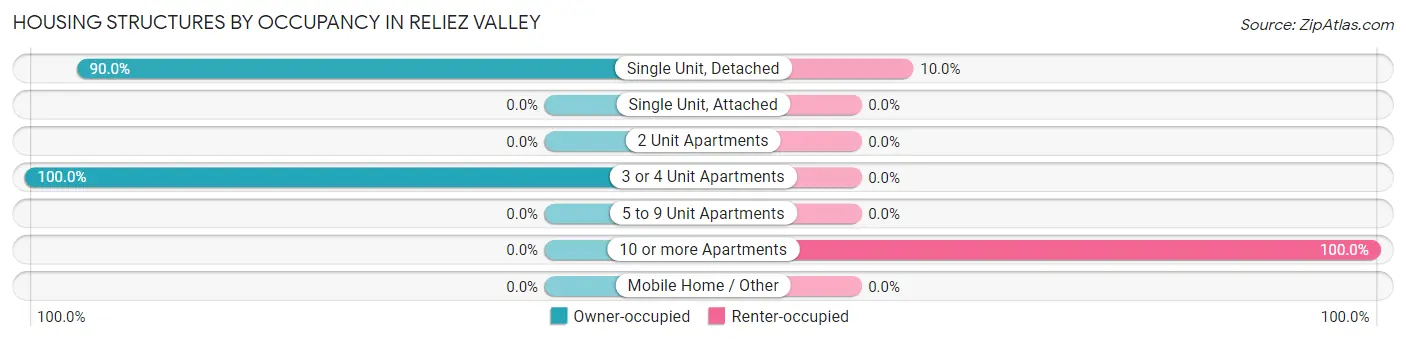
| Structure Type | Owner-occupied | Renter-occupied |
| Single Unit, Detached | 978 (90.0%) | 109 (10.0%) |
| Single Unit, Attached | 0 (0.0%) | 0 (0.0%) |
| 2 Unit Apartments | 0 (0.0%) | 0 (0.0%) |
| 3 or 4 Unit Apartments | 20 (100.0%) | 0 (0.0%) |
| 5 to 9 Unit Apartments | 0 (0.0%) | 0 (0.0%) |
| 10 or more Apartments | 0 (0.0%) | 28 (100.0%) |
| Mobile Home / Other | 0 (0.0%) | 0 (0.0%) |
| Total | 998 (87.9%) | 137 (12.1%) |
Housing Structures by Number of Rooms in Reliez Valley
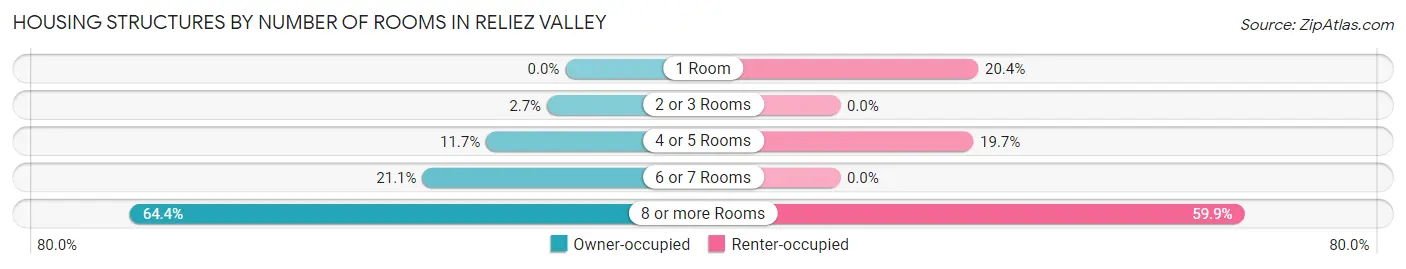
| Number of Rooms | Owner-occupied | Renter-occupied |
| 1 Room | 0 (0.0%) | 28 (20.4%) |
| 2 or 3 Rooms | 27 (2.7%) | 0 (0.0%) |
| 4 or 5 Rooms | 117 (11.7%) | 27 (19.7%) |
| 6 or 7 Rooms | 211 (21.1%) | 0 (0.0%) |
| 8 or more Rooms | 643 (64.4%) | 82 (59.9%) |
| Total | 998 (100.0%) | 137 (100.0%) |
Housing Structure by Heating Type in Reliez Valley
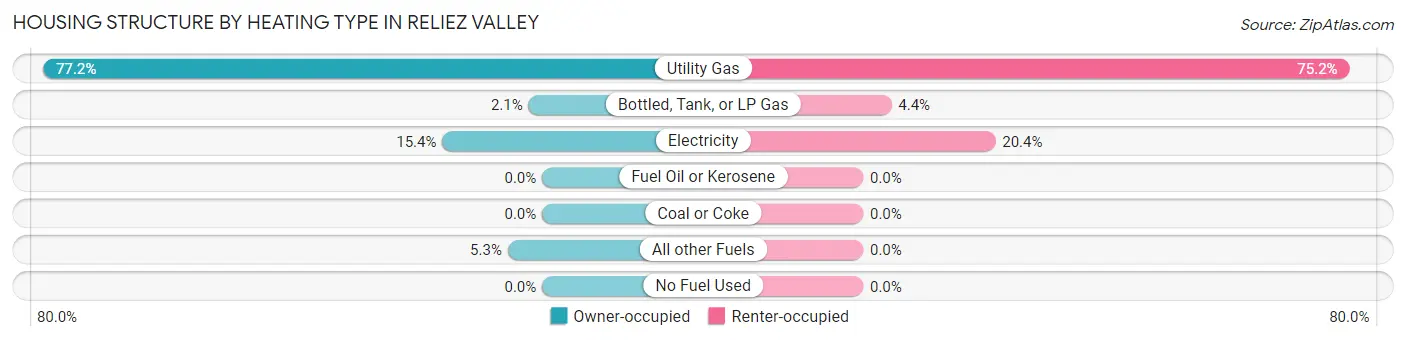
| Heating Type | Owner-occupied | Renter-occupied |
| Utility Gas | 770 (77.1%) | 103 (75.2%) |
| Bottled, Tank, or LP Gas | 21 (2.1%) | 6 (4.4%) |
| Electricity | 154 (15.4%) | 28 (20.4%) |
| Fuel Oil or Kerosene | 0 (0.0%) | 0 (0.0%) |
| Coal or Coke | 0 (0.0%) | 0 (0.0%) |
| All other Fuels | 53 (5.3%) | 0 (0.0%) |
| No Fuel Used | 0 (0.0%) | 0 (0.0%) |
| Total | 998 (100.0%) | 137 (100.0%) |
Household Vehicle Usage in Reliez Valley
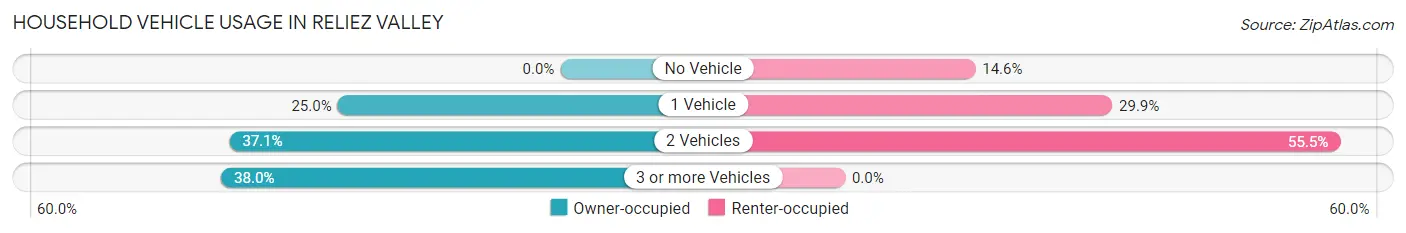
| Vehicles per Household | Owner-occupied | Renter-occupied |
| No Vehicle | 0 (0.0%) | 20 (14.6%) |
| 1 Vehicle | 249 (24.9%) | 41 (29.9%) |
| 2 Vehicles | 370 (37.1%) | 76 (55.5%) |
| 3 or more Vehicles | 379 (38.0%) | 0 (0.0%) |
| Total | 998 (100.0%) | 137 (100.0%) |
Real Estate & Mortgages in Reliez Valley
Real Estate and Mortgage Overview in Reliez Valley
| Characteristic | Without Mortgage | With Mortgage |
| Housing Units | 282 | 716 |
| Median Property Value | $1,489,600 | $1,417,400 |
| Median Household Income | $151,250 | $571 |
| Monthly Housing Costs | $1,270 | $650 |
| Real Estate Taxes | $8,140 | $0 |
Property Value by Mortgage Status in Reliez Valley
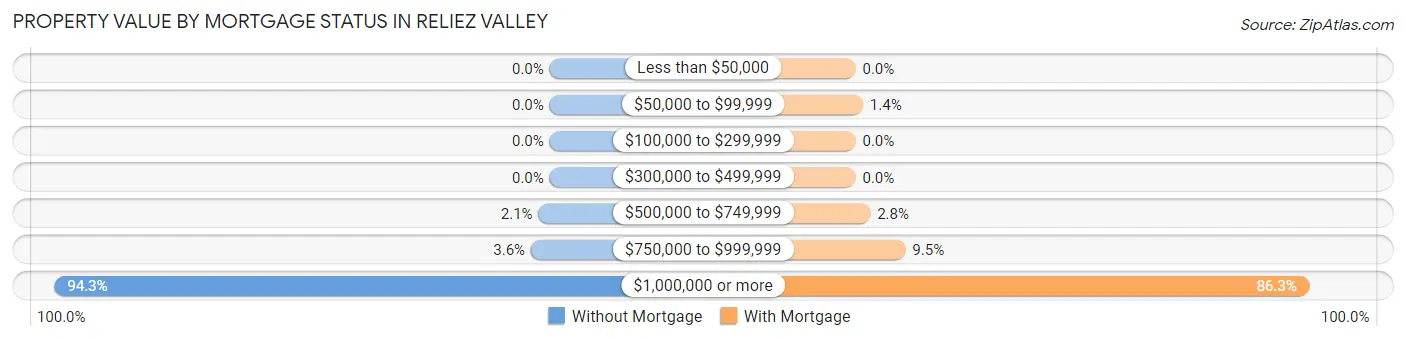
| Property Value | Without Mortgage | With Mortgage |
| Less than $50,000 | 0 (0.0%) | 0 (0.0%) |
| $50,000 to $99,999 | 0 (0.0%) | 10 (1.4%) |
| $100,000 to $299,999 | 0 (0.0%) | 0 (0.0%) |
| $300,000 to $499,999 | 0 (0.0%) | 0 (0.0%) |
| $500,000 to $749,999 | 6 (2.1%) | 20 (2.8%) |
| $750,000 to $999,999 | 10 (3.5%) | 68 (9.5%) |
| $1,000,000 or more | 266 (94.3%) | 618 (86.3%) |
| Total | 282 (100.0%) | 716 (100.0%) |
Household Income by Mortgage Status in Reliez Valley
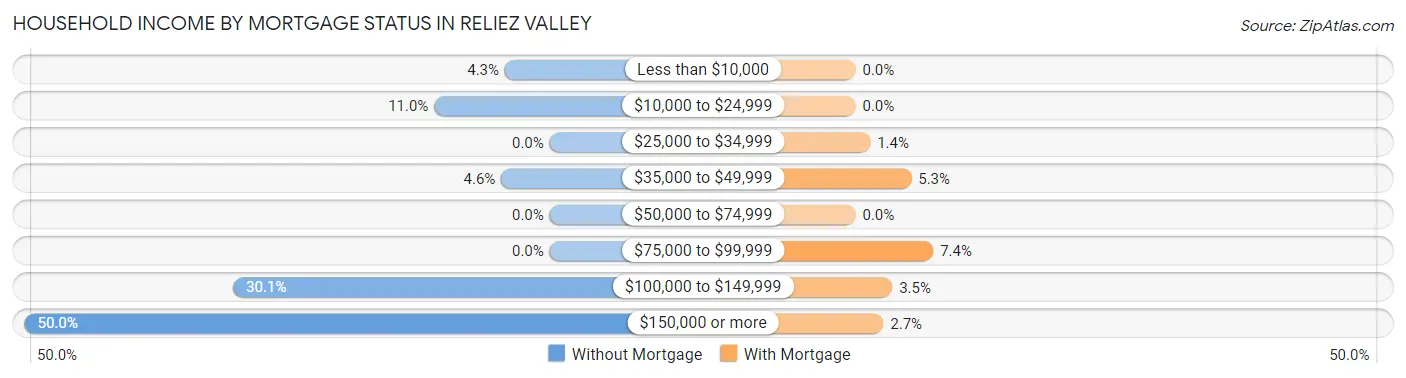
| Household Income | Without Mortgage | With Mortgage |
| Less than $10,000 | 12 (4.3%) | 0 (0.0%) |
| $10,000 to $24,999 | 31 (11.0%) | 0 (0.0%) |
| $25,000 to $34,999 | 0 (0.0%) | 10 (1.4%) |
| $35,000 to $49,999 | 13 (4.6%) | 38 (5.3%) |
| $50,000 to $74,999 | 0 (0.0%) | 0 (0.0%) |
| $75,000 to $99,999 | 0 (0.0%) | 53 (7.4%) |
| $100,000 to $149,999 | 85 (30.1%) | 25 (3.5%) |
| $150,000 or more | 141 (50.0%) | 19 (2.6%) |
| Total | 282 (100.0%) | 716 (100.0%) |
Property Value to Household Income Ratio in Reliez Valley
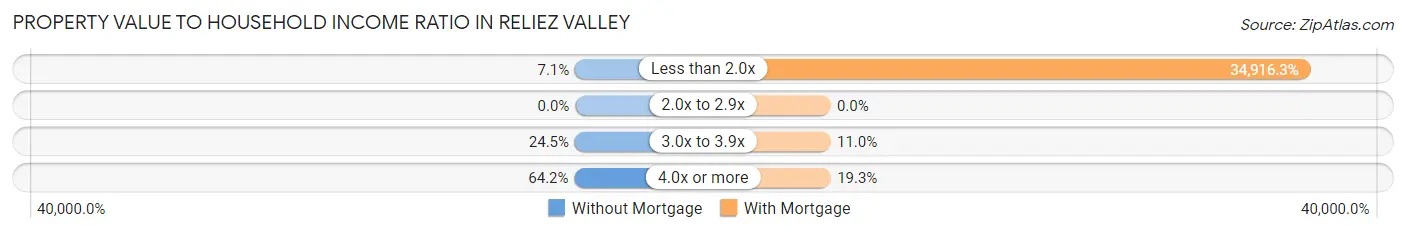
| Value-to-Income Ratio | Without Mortgage | With Mortgage |
| Less than 2.0x | 20 (7.1%) | 250,001 (34,916.3%) |
| 2.0x to 2.9x | 0 (0.0%) | 0 (0.0%) |
| 3.0x to 3.9x | 69 (24.5%) | 79 (11.0%) |
| 4.0x or more | 181 (64.2%) | 138 (19.3%) |
| Total | 282 (100.0%) | 716 (100.0%) |
Real Estate Taxes by Mortgage Status in Reliez Valley
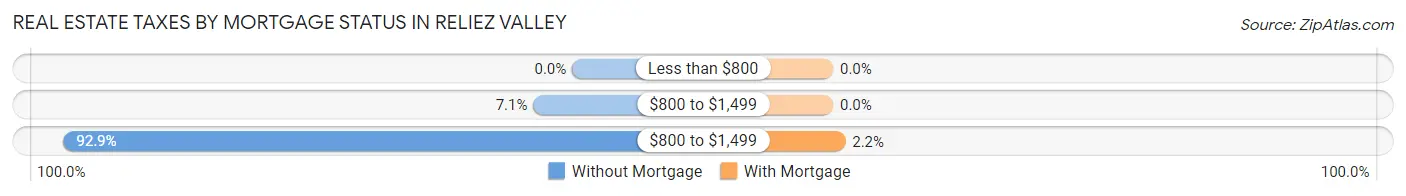
| Property Taxes | Without Mortgage | With Mortgage |
| Less than $800 | 0 (0.0%) | 0 (0.0%) |
| $800 to $1,499 | 20 (7.1%) | 0 (0.0%) |
| $800 to $1,499 | 262 (92.9%) | 16 (2.2%) |
| Total | 282 (100.0%) | 716 (100.0%) |
Health & Disability in Reliez Valley
Health Insurance Coverage by Age in Reliez Valley
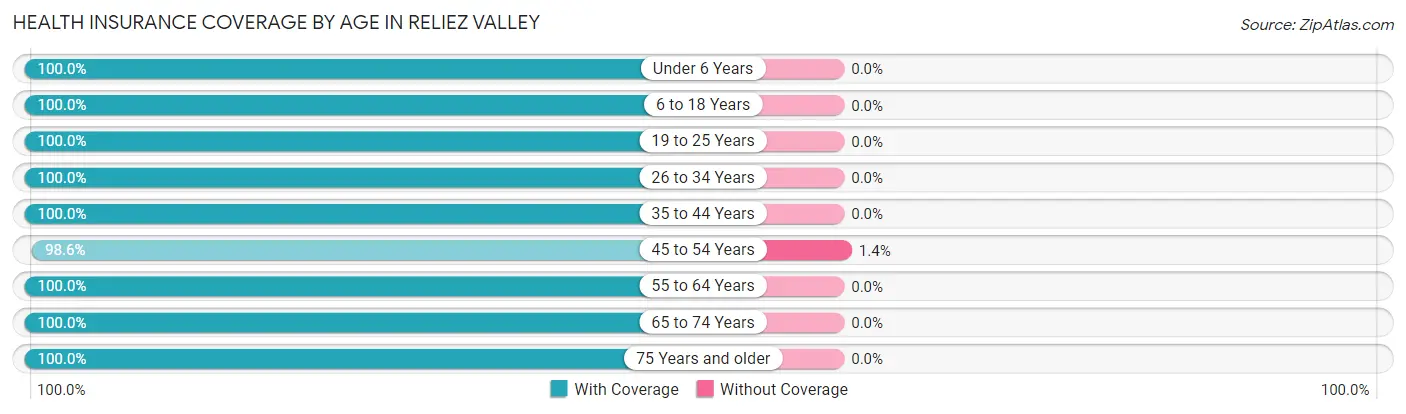
| Age Bracket | With Coverage | Without Coverage |
| Under 6 Years | 77 (100.0%) | 0 (0.0%) |
| 6 to 18 Years | 699 (100.0%) | 0 (0.0%) |
| 19 to 25 Years | 145 (100.0%) | 0 (0.0%) |
| 26 to 34 Years | 114 (100.0%) | 0 (0.0%) |
| 35 to 44 Years | 250 (100.0%) | 0 (0.0%) |
| 45 to 54 Years | 624 (98.6%) | 9 (1.4%) |
| 55 to 64 Years | 604 (100.0%) | 0 (0.0%) |
| 65 to 74 Years | 268 (100.0%) | 0 (0.0%) |
| 75 Years and older | 368 (100.0%) | 0 (0.0%) |
| Total | 3,149 (99.7%) | 9 (0.3%) |
Health Insurance Coverage by Citizenship Status in Reliez Valley
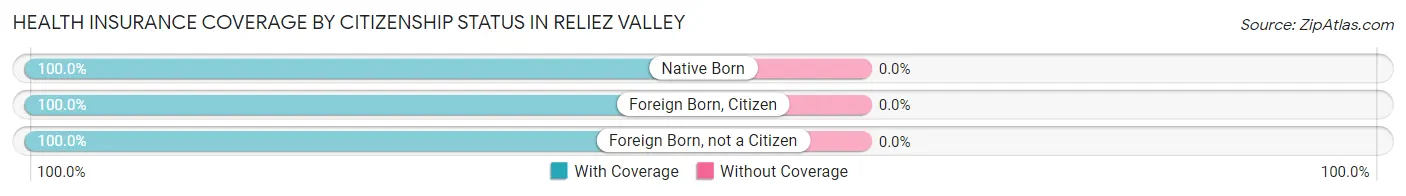
| Citizenship Status | With Coverage | Without Coverage |
| Native Born | 77 (100.0%) | 0 (0.0%) |
| Foreign Born, Citizen | 699 (100.0%) | 0 (0.0%) |
| Foreign Born, not a Citizen | 145 (100.0%) | 0 (0.0%) |
Health Insurance Coverage by Household Income in Reliez Valley
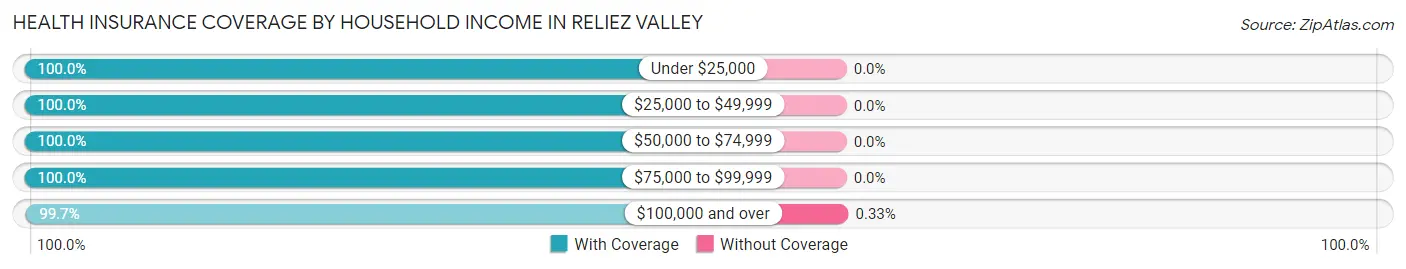
| Household Income | With Coverage | Without Coverage |
| Under $25,000 | 148 (100.0%) | 0 (0.0%) |
| $25,000 to $49,999 | 89 (100.0%) | 0 (0.0%) |
| $50,000 to $74,999 | 126 (100.0%) | 0 (0.0%) |
| $75,000 to $99,999 | 57 (100.0%) | 0 (0.0%) |
| $100,000 and over | 2,699 (99.7%) | 9 (0.3%) |
Public vs Private Health Insurance Coverage by Age in Reliez Valley
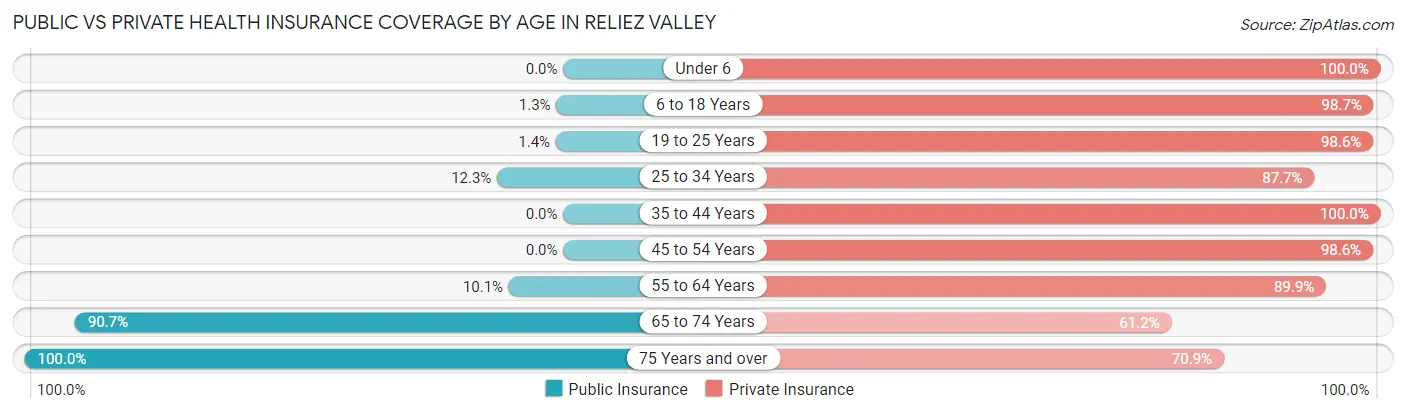
| Age Bracket | Public Insurance | Private Insurance |
| Under 6 | 0 (0.0%) | 77 (100.0%) |
| 6 to 18 Years | 9 (1.3%) | 690 (98.7%) |
| 19 to 25 Years | 2 (1.4%) | 143 (98.6%) |
| 25 to 34 Years | 14 (12.3%) | 100 (87.7%) |
| 35 to 44 Years | 0 (0.0%) | 250 (100.0%) |
| 45 to 54 Years | 0 (0.0%) | 624 (98.6%) |
| 55 to 64 Years | 61 (10.1%) | 543 (89.9%) |
| 65 to 74 Years | 243 (90.7%) | 164 (61.2%) |
| 75 Years and over | 368 (100.0%) | 261 (70.9%) |
| Total | 697 (22.1%) | 2,852 (90.3%) |
Disability Status by Sex by Age in Reliez Valley
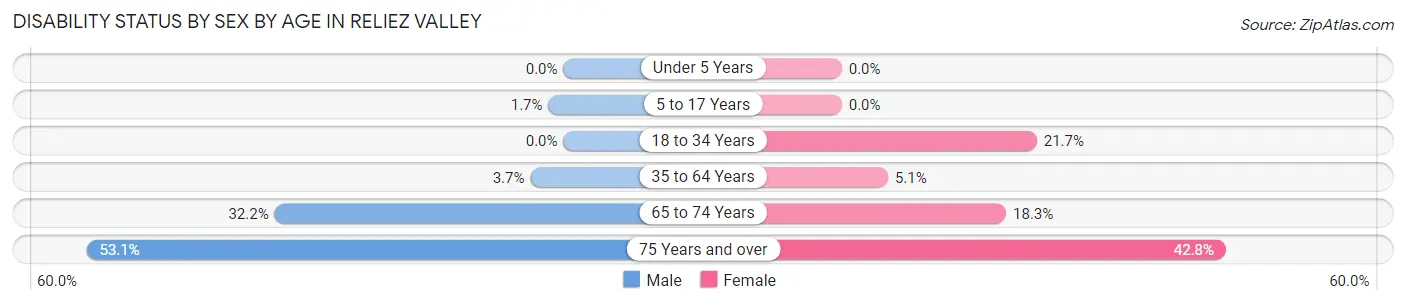
| Age Bracket | Male | Female |
| Under 5 Years | 0 (0.0%) | 0 (0.0%) |
| 5 to 17 Years | 7 (1.7%) | 0 (0.0%) |
| 18 to 34 Years | 0 (0.0%) | 43 (21.7%) |
| 35 to 64 Years | 29 (3.7%) | 36 (5.1%) |
| 65 to 74 Years | 37 (32.2%) | 28 (18.3%) |
| 75 Years and over | 111 (53.1%) | 68 (42.8%) |
Disability Class by Sex by Age in Reliez Valley
Disability Class: Hearing Difficulty
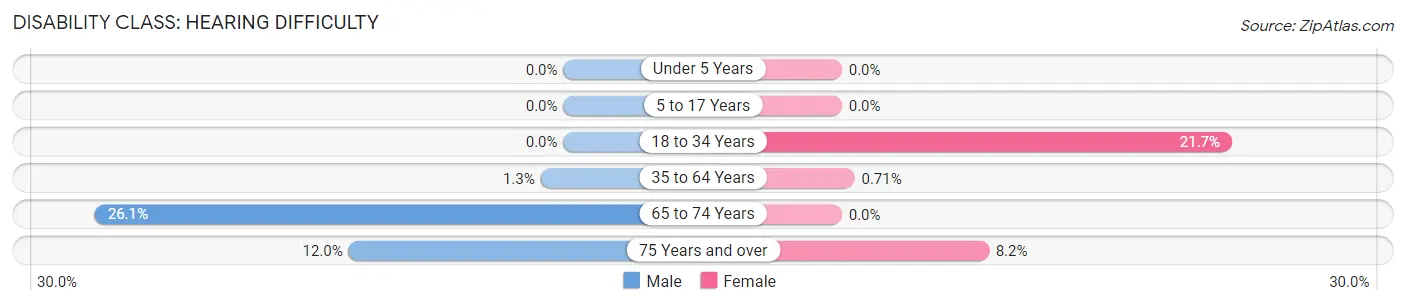
| Age Bracket | Male | Female |
| Under 5 Years | 0 (0.0%) | 0 (0.0%) |
| 5 to 17 Years | 0 (0.0%) | 0 (0.0%) |
| 18 to 34 Years | 0 (0.0%) | 43 (21.7%) |
| 35 to 64 Years | 10 (1.3%) | 5 (0.7%) |
| 65 to 74 Years | 30 (26.1%) | 0 (0.0%) |
| 75 Years and over | 25 (12.0%) | 13 (8.2%) |
Disability Class: Vision Difficulty
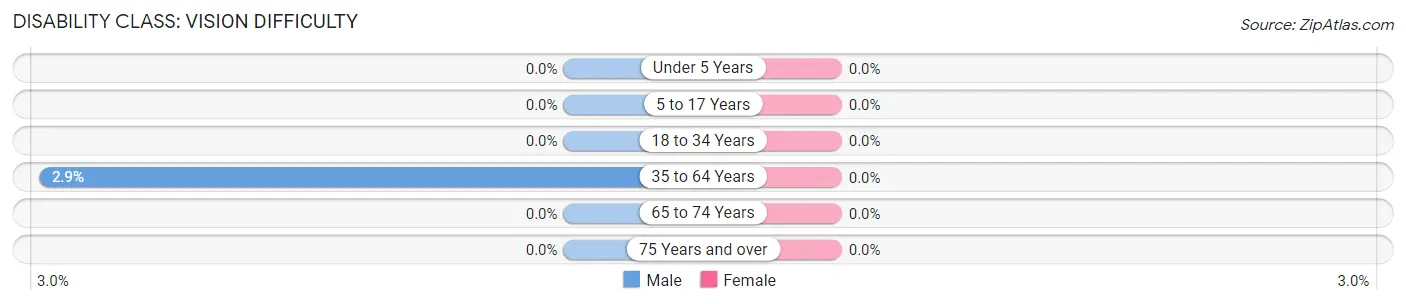
| Age Bracket | Male | Female |
| Under 5 Years | 0 (0.0%) | 0 (0.0%) |
| 5 to 17 Years | 0 (0.0%) | 0 (0.0%) |
| 18 to 34 Years | 0 (0.0%) | 0 (0.0%) |
| 35 to 64 Years | 23 (2.9%) | 0 (0.0%) |
| 65 to 74 Years | 0 (0.0%) | 0 (0.0%) |
| 75 Years and over | 0 (0.0%) | 0 (0.0%) |
Disability Class: Cognitive Difficulty
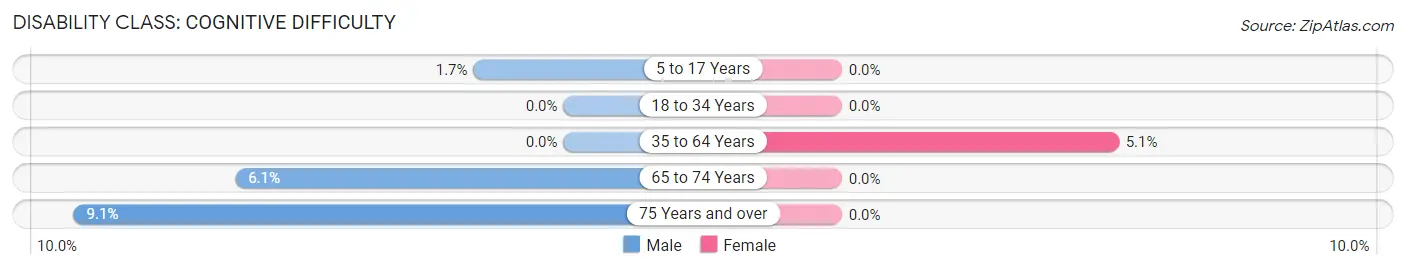
| Age Bracket | Male | Female |
| 5 to 17 Years | 7 (1.7%) | 0 (0.0%) |
| 18 to 34 Years | 0 (0.0%) | 0 (0.0%) |
| 35 to 64 Years | 0 (0.0%) | 36 (5.1%) |
| 65 to 74 Years | 7 (6.1%) | 0 (0.0%) |
| 75 Years and over | 19 (9.1%) | 0 (0.0%) |
Disability Class: Ambulatory Difficulty
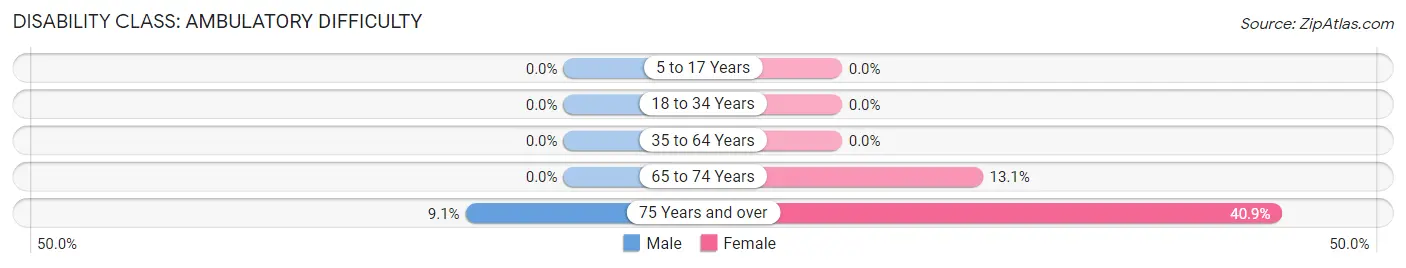
| Age Bracket | Male | Female |
| 5 to 17 Years | 0 (0.0%) | 0 (0.0%) |
| 18 to 34 Years | 0 (0.0%) | 0 (0.0%) |
| 35 to 64 Years | 0 (0.0%) | 0 (0.0%) |
| 65 to 74 Years | 0 (0.0%) | 20 (13.1%) |
| 75 Years and over | 19 (9.1%) | 65 (40.9%) |
Disability Class: Self-Care Difficulty
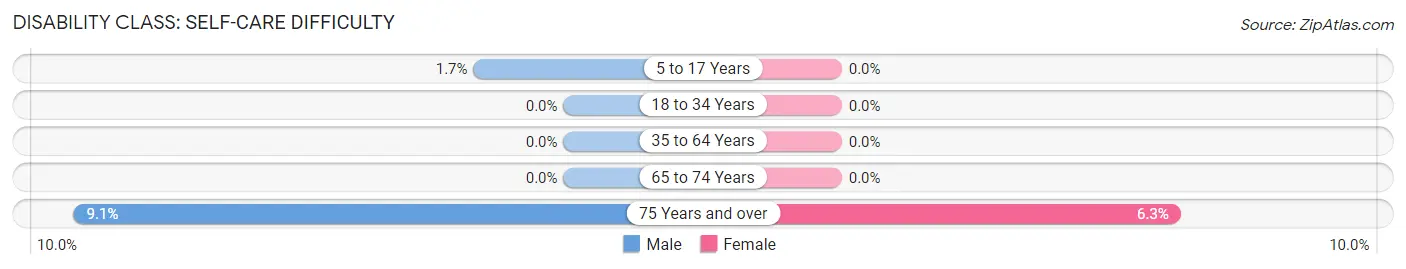
| Age Bracket | Male | Female |
| 5 to 17 Years | 7 (1.7%) | 0 (0.0%) |
| 18 to 34 Years | 0 (0.0%) | 0 (0.0%) |
| 35 to 64 Years | 0 (0.0%) | 0 (0.0%) |
| 65 to 74 Years | 0 (0.0%) | 0 (0.0%) |
| 75 Years and over | 19 (9.1%) | 10 (6.3%) |
Technology Access in Reliez Valley
Computing Device Access in Reliez Valley
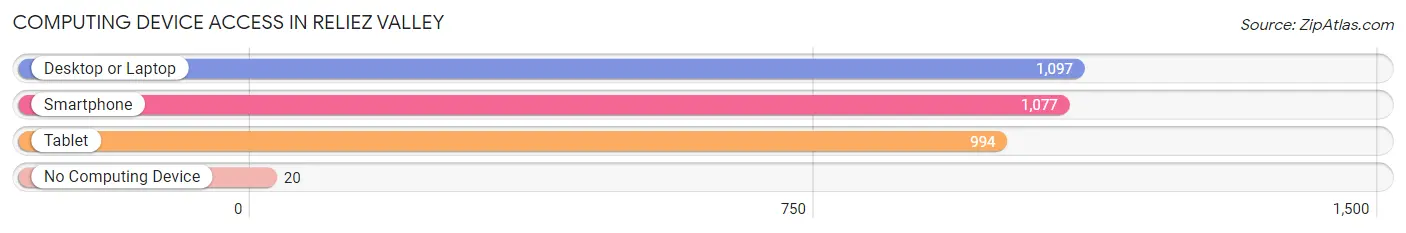
| Device Type | # Households | % Households |
| Desktop or Laptop | 1,097 | 96.7% |
| Smartphone | 1,077 | 94.9% |
| Tablet | 994 | 87.6% |
| No Computing Device | 20 | 1.8% |
| Total | 1,135 | 100.0% |
Internet Access in Reliez Valley
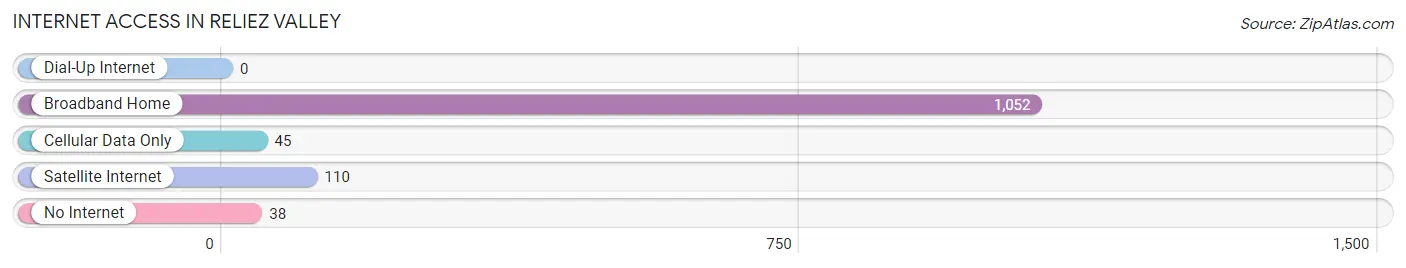
| Internet Type | # Households | % Households |
| Dial-Up Internet | 0 | 0.0% |
| Broadband Home | 1,052 | 92.7% |
| Cellular Data Only | 45 | 4.0% |
| Satellite Internet | 110 | 9.7% |
| No Internet | 38 | 3.4% |
| Total | 1,135 | 100.0% |
Reliez Valley Summary
Valley, CA is a small city located in the San Joaquin Valley of California. It is situated in the southern part of the state, about halfway between Los Angeles and San Francisco. The city has a population of approximately 8,000 people and is known for its agricultural production, as well as its proximity to the Sierra Nevada Mountains.
Valley, CA has a rich history that dates back to the mid-1800s. The city was founded in 1852 by a group of settlers who were looking for a place to settle and farm. The city was originally called “Valley Station” and was the first stop on the Central Pacific Railroad. The city was later renamed Valley, CA in 1872.
Valley, CA is located in the San Joaquin Valley, which is a large agricultural region in California. The city is surrounded by a number of small towns and cities, including Fresno, Bakersfield, and Visalia. The city is also close to the Sierra Nevada Mountains, which provide a beautiful backdrop for the city.
Valley, CA has a diverse economy that is largely based on agriculture. The city is home to a number of large farms and ranches, as well as a number of smaller farms and ranches. The city is also home to a number of food processing plants, as well as a number of other businesses. The city is also home to a number of wineries, which produce some of the finest wines in the state.
The demographics of Valley, CA are largely made up of Hispanic and Latino residents. According to the 2010 census, the city had a population of 8,000 people, with a median age of 33. The city is also home to a large number of immigrants, with the majority of them coming from Mexico. The city also has a large number of African American residents, as well as a small number of Asian Americans.
Valley, CA is a small city with a rich history and a diverse economy. The city is home to a number of farms and ranches, as well as a number of food processing plants and wineries. The city is also home to a large number of Hispanic and Latino residents, as well as a small number of African American and Asian American residents. The city is also close to the Sierra Nevada Mountains, which provide a beautiful backdrop for the city.
Common Questions
What is Per Capita Income in Reliez Valley?
Per Capita income in Reliez Valley is $105,254.
What is the Median Family Income in Reliez Valley?
Median Family Income in Reliez Valley is $234,779.
What is the Median Household income in Reliez Valley?
Median Household Income in Reliez Valley is $249,063.
What is Income or Wage Gap in Reliez Valley?
Income or Wage Gap in Reliez Valley is 50.8%.
Women in Reliez Valley earn 49.2 cents for every dollar earned by a man.
What is Inequality or Gini Index in Reliez Valley?
Inequality or Gini Index in Reliez Valley is 0.43.
What is the Total Population of Reliez Valley?
Total Population of Reliez Valley is 3,190.
What is the Total Male Population of Reliez Valley?
Total Male Population of Reliez Valley is 1,719.
What is the Total Female Population of Reliez Valley?
Total Female Population of Reliez Valley is 1,471.
What is the Ratio of Males per 100 Females in Reliez Valley?
There are 116.86 Males per 100 Females in Reliez Valley.
What is the Ratio of Females per 100 Males in Reliez Valley?
There are 85.57 Females per 100 Males in Reliez Valley.
What is the Median Population Age in Reliez Valley?
Median Population Age in Reliez Valley is 48.6 Years.
What is the Average Family Size in Reliez Valley
Average Family Size in Reliez Valley is 3.0 People.
What is the Average Household Size in Reliez Valley
Average Household Size in Reliez Valley is 2.8 People.
How Large is the Labor Force in Reliez Valley?
There are 1,512 People in the Labor Forcein in Reliez Valley.
What is the Percentage of People in the Labor Force in Reliez Valley?
58.8% of People are in the Labor Force in Reliez Valley.
What is the Unemployment Rate in Reliez Valley?
Unemployment Rate in Reliez Valley is 6.7%.