Manhattan Beach, CA Map & Demographics
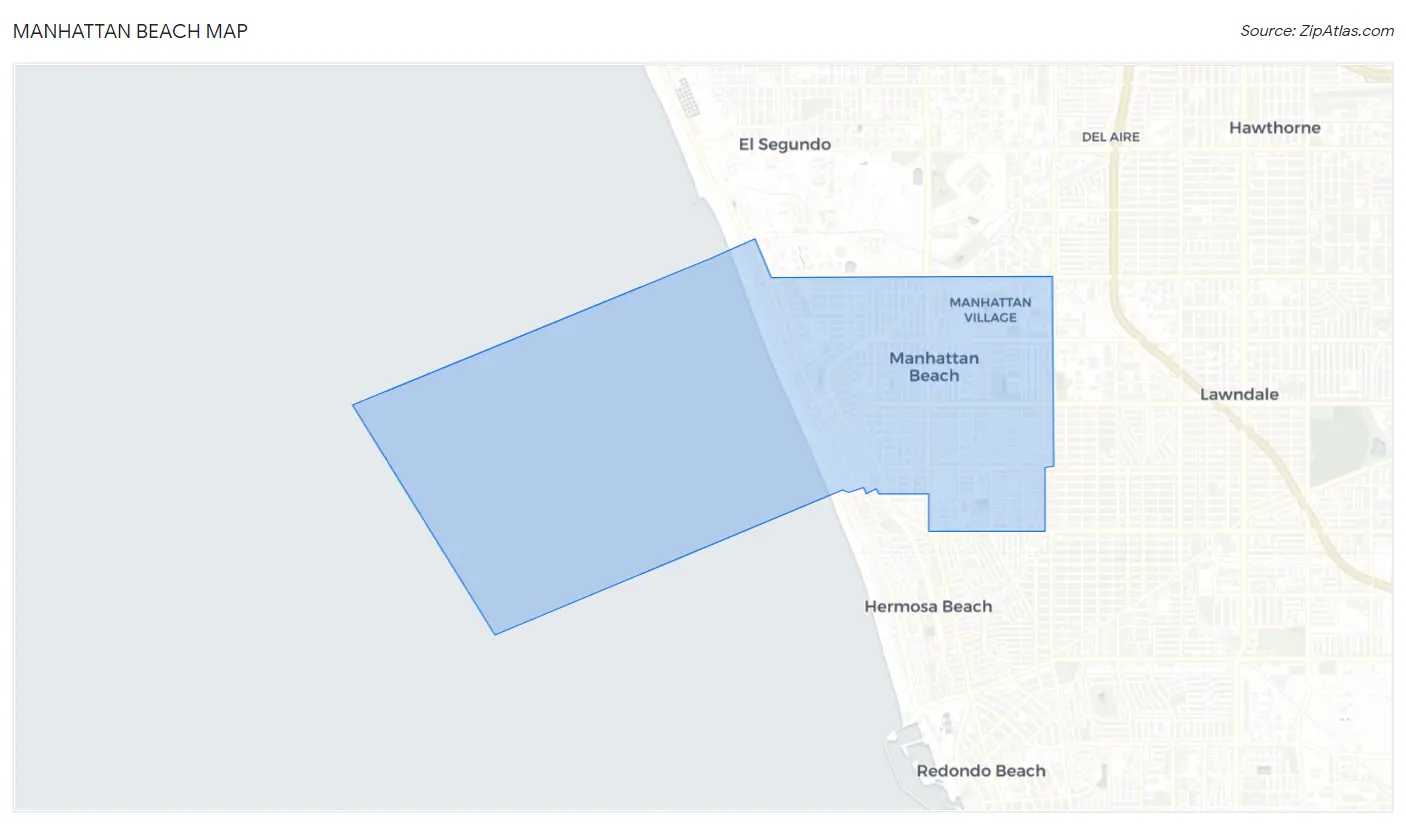
Manhattan Beach Map
Manhattan Beach Overview
$108,762
PER CAPITA INCOME
$236,009
AVG FAMILY INCOME
$187,217
AVG HOUSEHOLD INCOME
38.8%
WAGE / INCOME GAP [ % ]
61.2¢/ $1
WAGE / INCOME GAP [ $ ]
$10,959
FAMILY INCOME DEFICIT
0.47
INEQUALITY / GINI INDEX
35,123
TOTAL POPULATION
17,536
MALE POPULATION
17,587
FEMALE POPULATION
99.71
MALES / 100 FEMALES
100.29
FEMALES / 100 MALES
43.4
MEDIAN AGE
3.1
AVG FAMILY SIZE
2.6
AVG HOUSEHOLD SIZE
16,672
LABOR FORCE [ PEOPLE ]
61.3%
PERCENT IN LABOR FORCE
3.8%
UNEMPLOYMENT RATE
Manhattan Beach Zip Codes
Manhattan Beach Area Codes
Income in Manhattan Beach
Income Overview in Manhattan Beach
Per Capita Income in Manhattan Beach is $108,762, while median incomes of families and households are $236,009 and $187,217 respectively.
| Characteristic | Number | Measure |
| Per Capita Income | 35,123 | $108,762 |
| Median Family Income | 9,335 | $236,009 |
| Mean Family Income | 9,335 | $334,610 |
| Median Household Income | 13,400 | $187,217 |
| Mean Household Income | 13,400 | $280,470 |
| Income Deficit | 9,335 | $10,959 |
| Wage / Income Gap (%) | 35,123 | 38.80% |
| Wage / Income Gap ($) | 35,123 | 61.20¢ per $1 |
| Gini / Inequality Index | 35,123 | 0.47 |
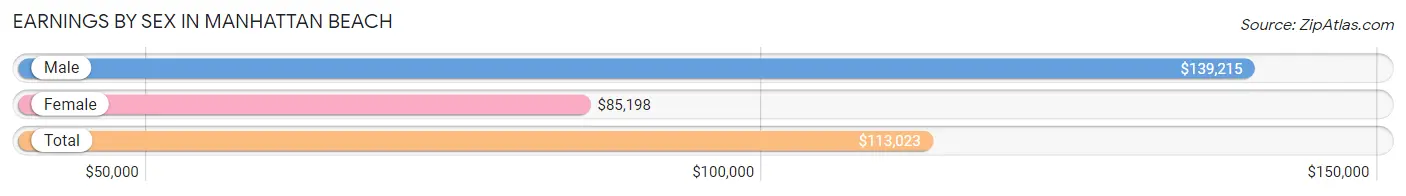
Earnings by Sex in Manhattan Beach
Average Earnings in Manhattan Beach are $113,023, $139,215 for men and $85,198 for women, a difference of 38.8%.
| Sex | Number | Average Earnings |
| Male | 10,075 (57.7%) | $139,215 |
| Female | 7,374 (42.3%) | $85,198 |
| Total | 17,449 (100.0%) | $113,023 |
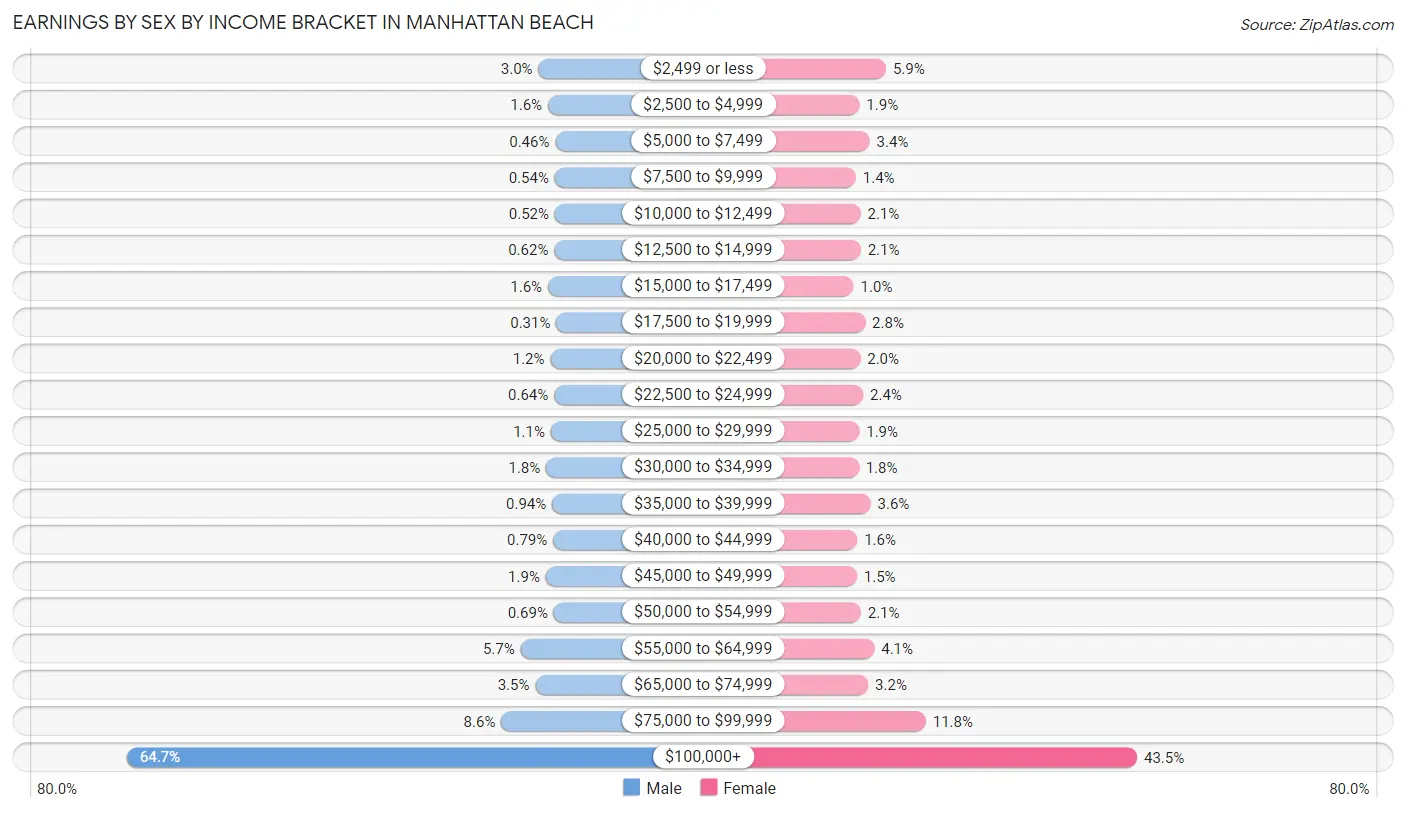
Earnings by Sex by Income Bracket in Manhattan Beach
The most common earnings brackets in Manhattan Beach are $100,000+ for men (6,515 | 64.7%) and $100,000+ for women (3,208 | 43.5%).
| Income | Male | Female |
| $2,499 or less | 301 (3.0%) | 433 (5.9%) |
| $2,500 to $4,999 | 157 (1.6%) | 139 (1.9%) |
| $5,000 to $7,499 | 46 (0.5%) | 253 (3.4%) |
| $7,500 to $9,999 | 54 (0.5%) | 100 (1.4%) |
| $10,000 to $12,499 | 52 (0.5%) | 152 (2.1%) |
| $12,500 to $14,999 | 62 (0.6%) | 154 (2.1%) |
| $15,000 to $17,499 | 157 (1.6%) | 76 (1.0%) |
| $17,500 to $19,999 | 31 (0.3%) | 203 (2.8%) |
| $20,000 to $22,499 | 121 (1.2%) | 149 (2.0%) |
| $22,500 to $24,999 | 64 (0.6%) | 180 (2.4%) |
| $25,000 to $29,999 | 114 (1.1%) | 138 (1.9%) |
| $30,000 to $34,999 | 184 (1.8%) | 132 (1.8%) |
| $35,000 to $39,999 | 95 (0.9%) | 263 (3.6%) |
| $40,000 to $44,999 | 80 (0.8%) | 115 (1.6%) |
| $45,000 to $49,999 | 190 (1.9%) | 111 (1.5%) |
| $50,000 to $54,999 | 70 (0.7%) | 155 (2.1%) |
| $55,000 to $64,999 | 571 (5.7%) | 304 (4.1%) |
| $65,000 to $74,999 | 349 (3.5%) | 236 (3.2%) |
| $75,000 to $99,999 | 862 (8.6%) | 873 (11.8%) |
| $100,000+ | 6,515 (64.7%) | 3,208 (43.5%) |
| Total | 10,075 (100.0%) | 7,374 (100.0%) |
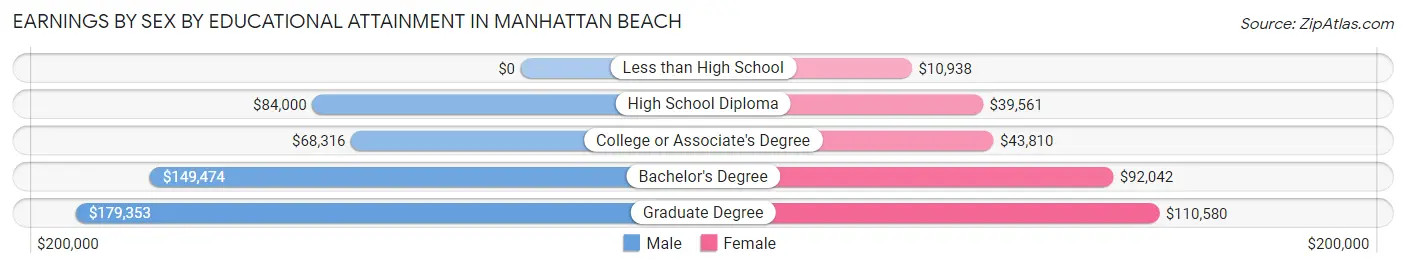
Earnings by Sex by Educational Attainment in Manhattan Beach
Average earnings in Manhattan Beach are $148,246 for men and $91,063 for women, a difference of 38.6%. Men with an educational attainment of graduate degree enjoy the highest average annual earnings of $179,353, while those with college or associate's degree education earn the least with $68,316. Women with an educational attainment of graduate degree earn the most with the average annual earnings of $110,580, while those with less than high school education have the smallest earnings of $10,938.
| Educational Attainment | Male Income | Female Income |
| Less than High School | - | - |
| High School Diploma | $84,000 | $39,561 |
| College or Associate's Degree | $68,316 | $43,810 |
| Bachelor's Degree | $149,474 | $92,042 |
| Graduate Degree | $179,353 | $110,580 |
| Total | $148,246 | $91,063 |
Family Income in Manhattan Beach
Family Income Brackets in Manhattan Beach
According to the Manhattan Beach family income data, there are 5,265 families falling into the $200,000+ income range, which is the most common income bracket and makes up 56.4% of all families. Conversely, the $10,000 to $14,999 income bracket is the least frequent group with only 28 families (0.3%) belonging to this category.
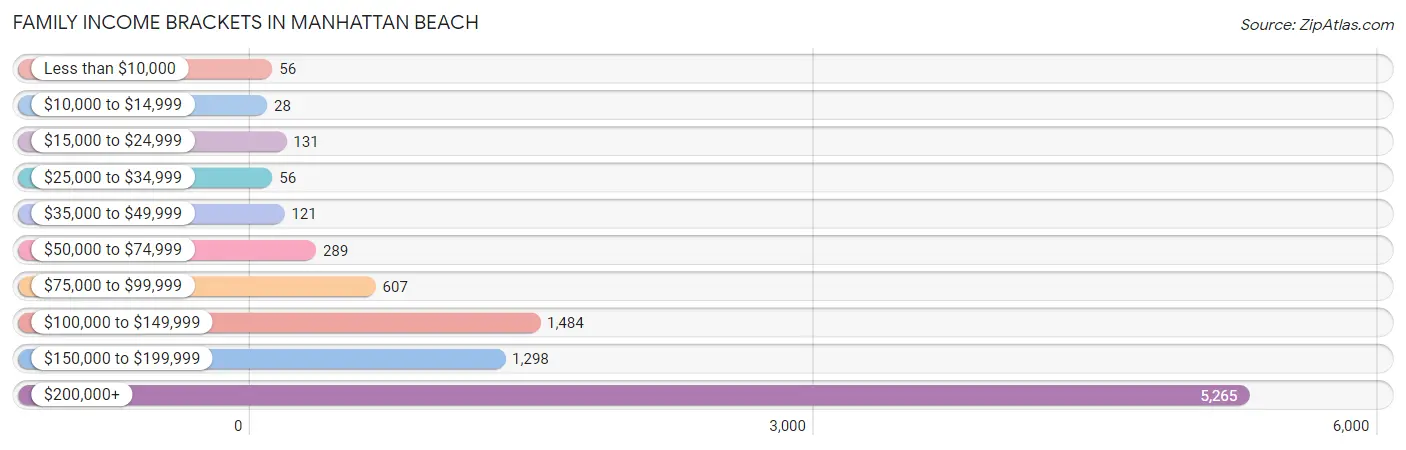
| Income Bracket | # Families | % Families |
| Less than $10,000 | 56 | 0.6% |
| $10,000 to $14,999 | 28 | 0.3% |
| $15,000 to $24,999 | 131 | 1.4% |
| $25,000 to $34,999 | 56 | 0.6% |
| $35,000 to $49,999 | 121 | 1.3% |
| $50,000 to $74,999 | 289 | 3.1% |
| $75,000 to $99,999 | 607 | 6.5% |
| $100,000 to $149,999 | 1,484 | 15.9% |
| $150,000 to $199,999 | 1,298 | 13.9% |
| $200,000+ | 5,265 | 56.4% |
Family Income by Famaliy Size in Manhattan Beach
3-person families (1,938 | 20.8%) account for the highest median family income in Manhattan Beach with $250,001 per family, while 2-person families (4,087 | 43.8%) have the highest median income of $87,334 per family member.
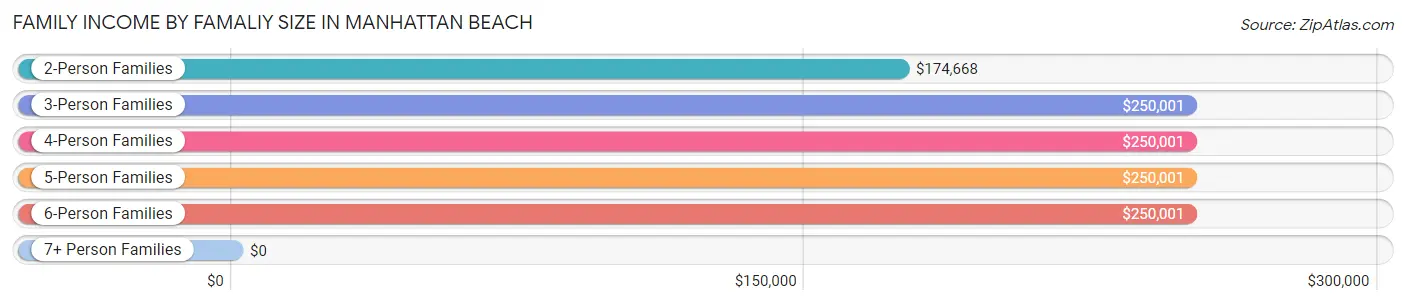
| Income Bracket | # Families | Median Income |
| 2-Person Families | 4,087 (43.8%) | $174,668 |
| 3-Person Families | 1,938 (20.8%) | $250,001 |
| 4-Person Families | 2,493 (26.7%) | $250,001 |
| 5-Person Families | 752 (8.1%) | $250,001 |
| 6-Person Families | 57 (0.6%) | $250,001 |
| 7+ Person Families | 8 (0.1%) | $0 |
| Total | 9,335 (100.0%) | $236,009 |
Family Income by Number of Earners in Manhattan Beach
The median family income in Manhattan Beach is $236,009, with families comprising 2 earners (4,117) having the highest median family income of $250,001, while families with no earners (1,264) have the lowest median family income of $107,361, accounting for 44.1% and 13.5% of families, respectively.
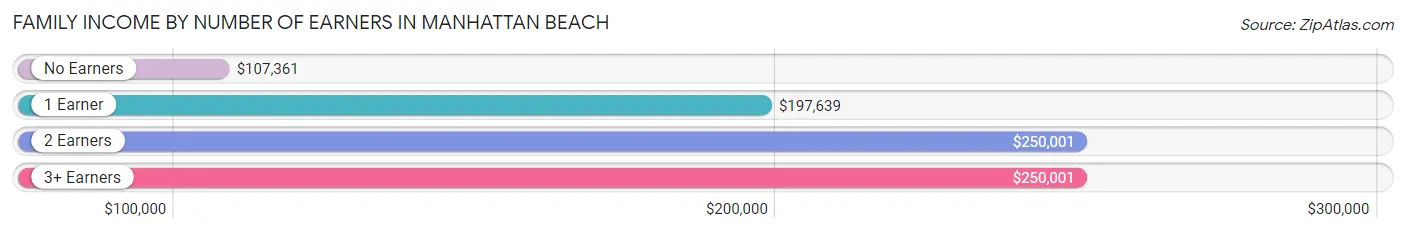
| Number of Earners | # Families | Median Income |
| No Earners | 1,264 (13.5%) | $107,361 |
| 1 Earner | 3,488 (37.4%) | $197,639 |
| 2 Earners | 4,117 (44.1%) | $250,001 |
| 3+ Earners | 466 (5.0%) | $250,001 |
| Total | 9,335 (100.0%) | $236,009 |
Household Income in Manhattan Beach
Household Income Brackets in Manhattan Beach
With 6,311 households falling in the category, the $200,000+ income range is the most frequent in Manhattan Beach, accounting for 47.1% of all households. In contrast, only 54 households (0.4%) fall into the $10,000 to $14,999 income bracket, making it the least populous group.
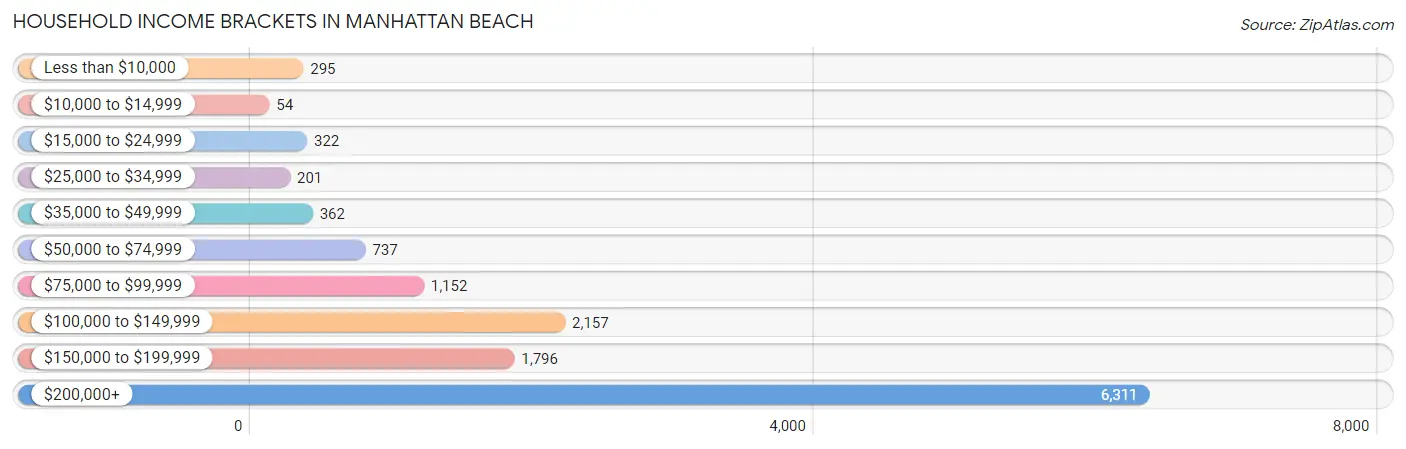
| Income Bracket | # Households | % Households |
| Less than $10,000 | 295 | 2.2% |
| $10,000 to $14,999 | 54 | 0.4% |
| $15,000 to $24,999 | 322 | 2.4% |
| $25,000 to $34,999 | 201 | 1.5% |
| $35,000 to $49,999 | 362 | 2.7% |
| $50,000 to $74,999 | 737 | 5.5% |
| $75,000 to $99,999 | 1,152 | 8.6% |
| $100,000 to $149,999 | 2,157 | 16.1% |
| $150,000 to $199,999 | 1,796 | 13.4% |
| $200,000+ | 6,311 | 47.1% |
Household Income by Householder Age in Manhattan Beach
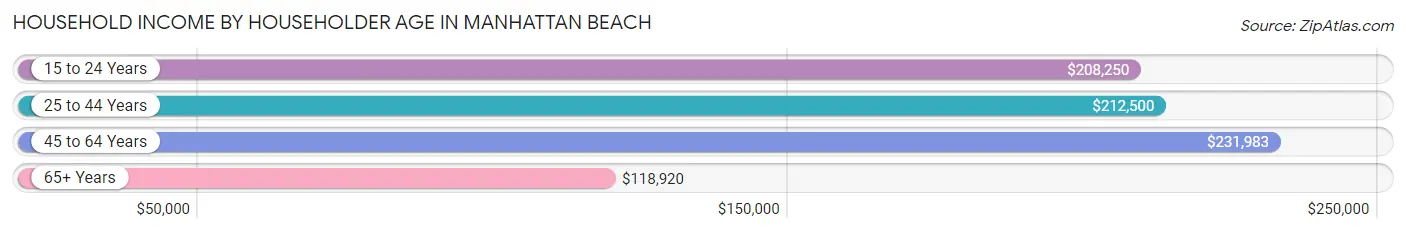
The median household income in Manhattan Beach is $187,217, with the highest median household income of $231,983 found in the 45 to 64 years age bracket for the primary householder. A total of 6,020 households (44.9%) fall into this category. Meanwhile, the 65+ years age bracket for the primary householder has the lowest median household income of $118,920, with 3,566 households (26.6%) in this group.
| Income Bracket | # Households | Median Income |
| 15 to 24 Years | 78 (0.6%) | $208,250 |
| 25 to 44 Years | 3,736 (27.9%) | $212,500 |
| 45 to 64 Years | 6,020 (44.9%) | $231,983 |
| 65+ Years | 3,566 (26.6%) | $118,920 |
| Total | 13,400 (100.0%) | $187,217 |
Poverty in Manhattan Beach
Income Below Poverty by Sex and Age in Manhattan Beach
With 2.4% poverty level for males and 4.0% for females among the residents of Manhattan Beach, 5 year old males and 18 to 24 year old females are the most vulnerable to poverty, with 18 males (7.0%) and 89 females (13.0%) in their respective age groups living below the poverty level.
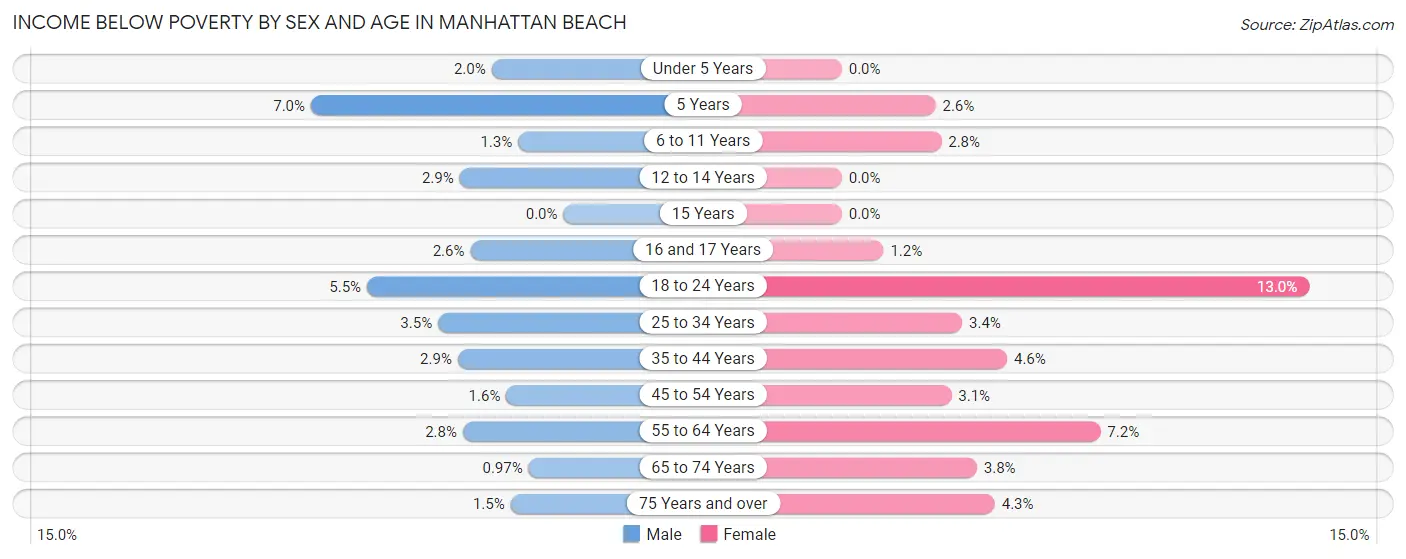
| Age Bracket | Male | Female |
| Under 5 Years | 19 (2.0%) | 0 (0.0%) |
| 5 Years | 18 (7.0%) | 7 (2.6%) |
| 6 to 11 Years | 21 (1.3%) | 48 (2.8%) |
| 12 to 14 Years | 25 (2.9%) | 0 (0.0%) |
| 15 Years | 0 (0.0%) | 0 (0.0%) |
| 16 and 17 Years | 16 (2.6%) | 10 (1.2%) |
| 18 to 24 Years | 45 (5.5%) | 89 (13.0%) |
| 25 to 34 Years | 54 (3.5%) | 43 (3.4%) |
| 35 to 44 Years | 63 (2.9%) | 119 (4.6%) |
| 45 to 54 Years | 48 (1.6%) | 82 (3.0%) |
| 55 to 64 Years | 73 (2.8%) | 180 (7.2%) |
| 65 to 74 Years | 15 (1.0%) | 64 (3.8%) |
| 75 Years and over | 17 (1.5%) | 61 (4.3%) |
| Total | 414 (2.4%) | 703 (4.0%) |
Income Above Poverty by Sex and Age in Manhattan Beach
According to the poverty statistics in Manhattan Beach, males aged 15 years and females aged under 5 years are the age groups that are most secure financially, with 100.0% of males and 100.0% of females in these age groups living above the poverty line.
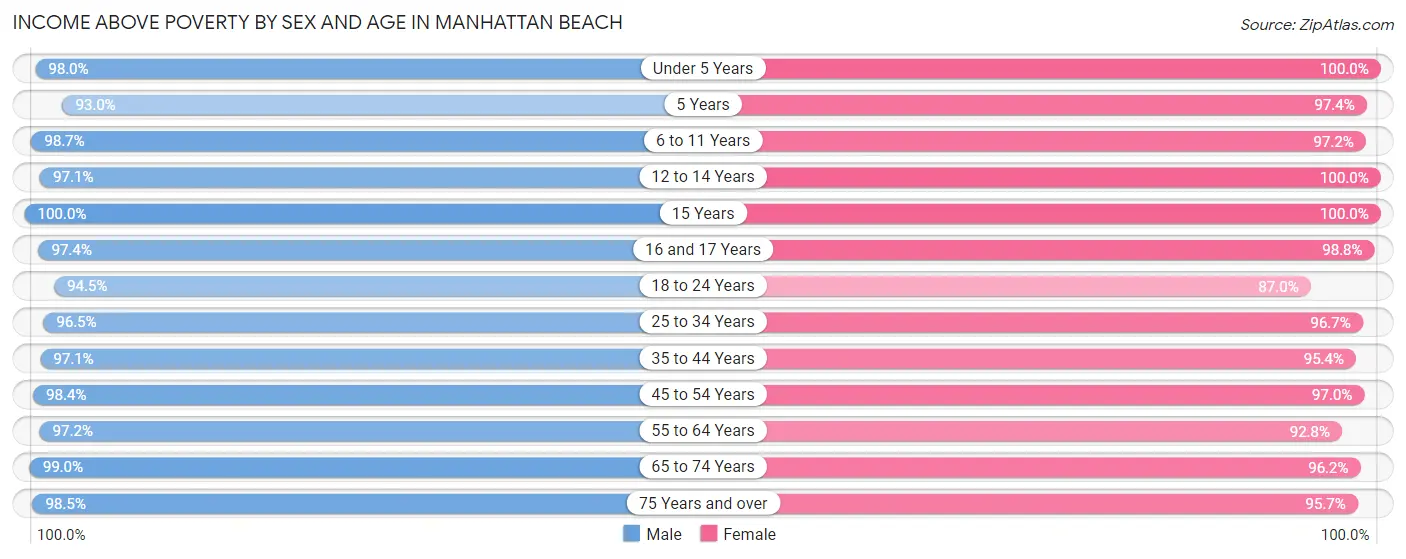
| Age Bracket | Male | Female |
| Under 5 Years | 933 (98.0%) | 808 (100.0%) |
| 5 Years | 238 (93.0%) | 261 (97.4%) |
| 6 to 11 Years | 1,646 (98.7%) | 1,686 (97.2%) |
| 12 to 14 Years | 839 (97.1%) | 770 (100.0%) |
| 15 Years | 306 (100.0%) | 195 (100.0%) |
| 16 and 17 Years | 601 (97.4%) | 855 (98.8%) |
| 18 to 24 Years | 778 (94.5%) | 595 (87.0%) |
| 25 to 34 Years | 1,494 (96.5%) | 1,239 (96.7%) |
| 35 to 44 Years | 2,078 (97.1%) | 2,468 (95.4%) |
| 45 to 54 Years | 2,973 (98.4%) | 2,604 (97.0%) |
| 55 to 64 Years | 2,536 (97.2%) | 2,321 (92.8%) |
| 65 to 74 Years | 1,532 (99.0%) | 1,636 (96.2%) |
| 75 Years and over | 1,137 (98.5%) | 1,371 (95.7%) |
| Total | 17,091 (97.6%) | 16,809 (96.0%) |
Income Below Poverty Among Married-Couple Families in Manhattan Beach
The poverty statistics for married-couple families in Manhattan Beach show that 1.9% or 151 of the total 8,090 families live below the poverty line. Families with 3 or 4 children have the highest poverty rate of 3.8%, comprising of 20 families. On the other hand, families with 1 or 2 children have the lowest poverty rate of 1.5%, which includes 51 families.
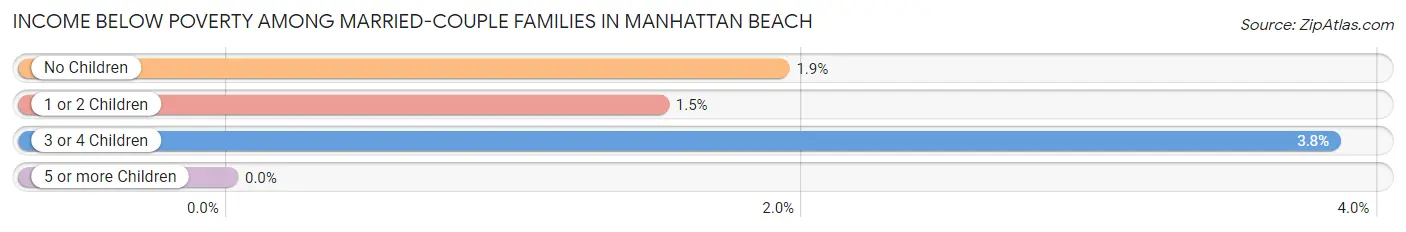
| Children | Above Poverty | Below Poverty |
| No Children | 4,078 (98.1%) | 80 (1.9%) |
| 1 or 2 Children | 3,360 (98.5%) | 51 (1.5%) |
| 3 or 4 Children | 501 (96.2%) | 20 (3.8%) |
| 5 or more Children | 0 (0.0%) | 0 (0.0%) |
| Total | 7,939 (98.1%) | 151 (1.9%) |
Income Below Poverty Among Single-Parent Households in Manhattan Beach
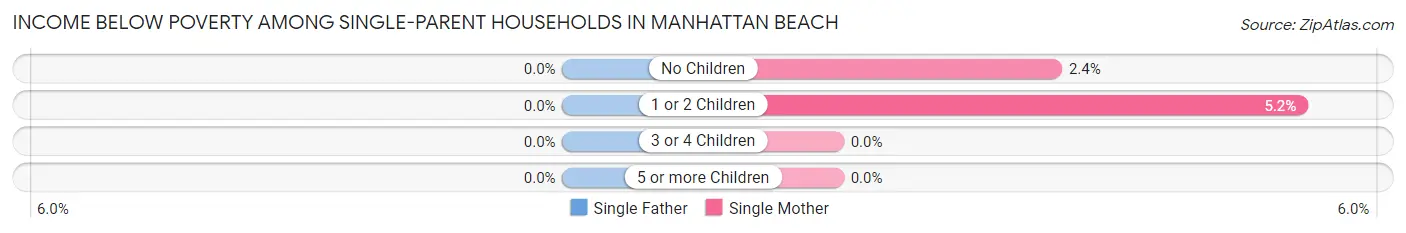
| Children | Single Father | Single Mother |
| No Children | 0 (0.0%) | 7 (2.4%) |
| 1 or 2 Children | 0 (0.0%) | 21 (5.2%) |
| 3 or 4 Children | 0 (0.0%) | 0 (0.0%) |
| 5 or more Children | 0 (0.0%) | 0 (0.0%) |
| Total | 0 (0.0%) | 28 (4.0%) |
Income Below Poverty Among Married-Couple vs Single-Parent Households in Manhattan Beach
The poverty data for Manhattan Beach shows that 151 of the married-couple family households (1.9%) and 28 of the single-parent households (2.2%) are living below the poverty level. Within the married-couple family households, those with 3 or 4 children have the highest poverty rate, with 20 households (3.8%) falling below the poverty line. Among the single-parent households, those with 1 or 2 children have the highest poverty rate, with 21 household (2.8%) living below poverty.
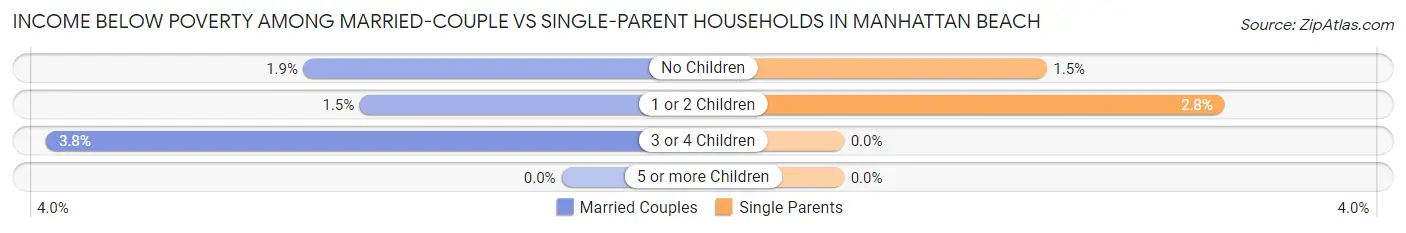
| Children | Married-Couple Families | Single-Parent Households |
| No Children | 80 (1.9%) | 7 (1.5%) |
| 1 or 2 Children | 51 (1.5%) | 21 (2.8%) |
| 3 or 4 Children | 20 (3.8%) | 0 (0.0%) |
| 5 or more Children | 0 (0.0%) | 0 (0.0%) |
| Total | 151 (1.9%) | 28 (2.2%) |
Race in Manhattan Beach
The most populous races in Manhattan Beach are White / Caucasian (26,129 | 74.4%), Asian (5,325 | 15.2%), and Two or more Races (2,963 | 8.4%).
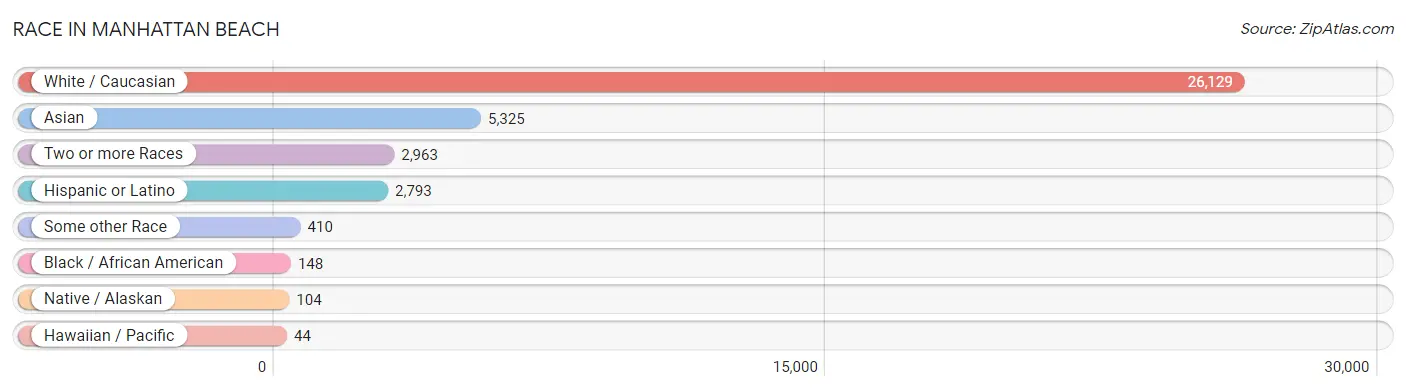
| Race | # Population | % Population |
| Asian | 5,325 | 15.2% |
| Black / African American | 148 | 0.4% |
| Hawaiian / Pacific | 44 | 0.1% |
| Hispanic or Latino | 2,793 | 8.0% |
| Native / Alaskan | 104 | 0.3% |
| White / Caucasian | 26,129 | 74.4% |
| Two or more Races | 2,963 | 8.4% |
| Some other Race | 410 | 1.2% |
| Total | 35,123 | 100.0% |
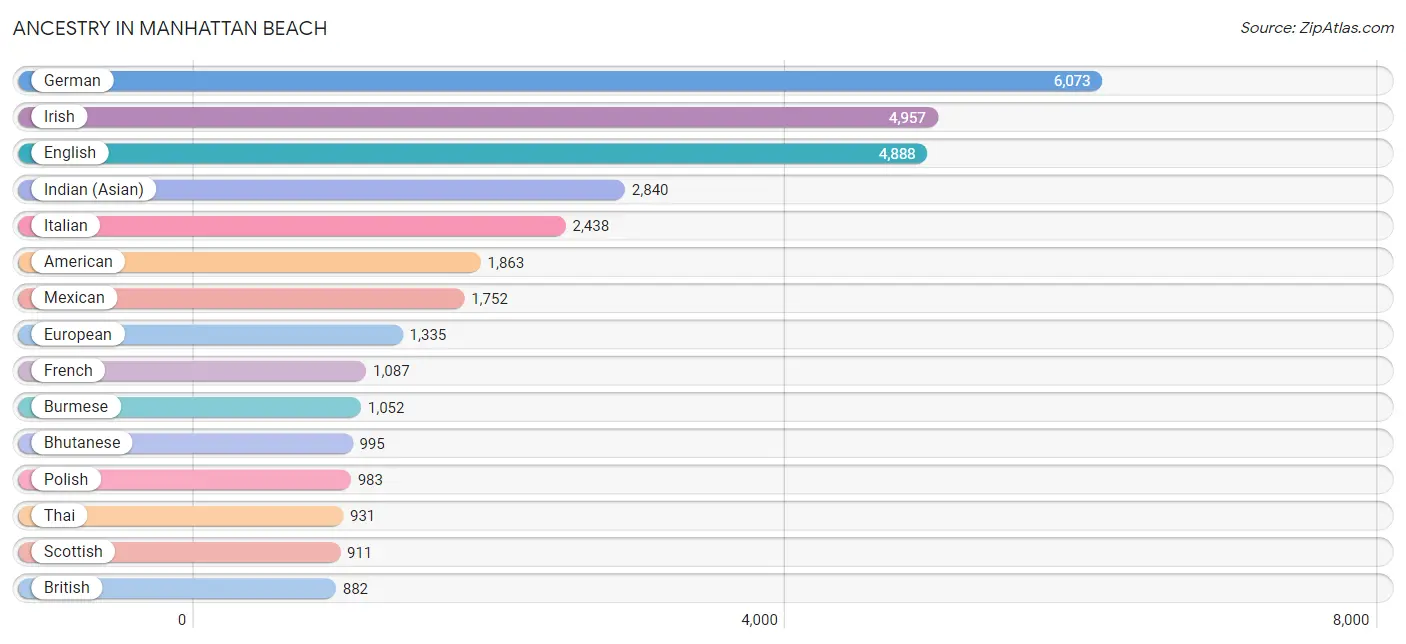
Ancestry in Manhattan Beach
The most populous ancestries reported in Manhattan Beach are German (6,073 | 17.3%), Irish (4,957 | 14.1%), English (4,888 | 13.9%), Indian (Asian) (2,840 | 8.1%), and Italian (2,438 | 6.9%), together accounting for 60.4% of all Manhattan Beach residents.
| Ancestry | # Population | % Population |
| African | 13 | 0.0% |
| American | 1,863 | 5.3% |
| Arab | 228 | 0.6% |
| Argentinean | 122 | 0.4% |
| Armenian | 105 | 0.3% |
| Assyrian / Chaldean / Syriac | 5 | 0.0% |
| Australian | 18 | 0.1% |
| Austrian | 67 | 0.2% |
| Belgian | 30 | 0.1% |
| Bhutanese | 995 | 2.8% |
| Bolivian | 62 | 0.2% |
| Brazilian | 62 | 0.2% |
| British | 882 | 2.5% |
| Bulgarian | 10 | 0.0% |
| Burmese | 1,052 | 3.0% |
| Canadian | 52 | 0.2% |
| Carpatho Rusyn | 10 | 0.0% |
| Central American | 125 | 0.4% |
| Central American Indian | 4 | 0.0% |
| Cherokee | 53 | 0.2% |
| Chilean | 11 | 0.0% |
| Chippewa | 39 | 0.1% |
| Colombian | 69 | 0.2% |
| Cree | 5 | 0.0% |
| Croatian | 15 | 0.0% |
| Cuban | 168 | 0.5% |
| Czech | 159 | 0.4% |
| Czechoslovakian | 38 | 0.1% |
| Danish | 441 | 1.3% |
| Dutch | 555 | 1.6% |
| Eastern European | 440 | 1.3% |
| Ecuadorian | 122 | 0.4% |
| Egyptian | 122 | 0.4% |
| English | 4,888 | 13.9% |
| Estonian | 10 | 0.0% |
| Ethiopian | 7 | 0.0% |
| European | 1,335 | 3.8% |
| Filipino | 377 | 1.1% |
| Finnish | 141 | 0.4% |
| French | 1,087 | 3.1% |
| French Canadian | 64 | 0.2% |
| German | 6,073 | 17.3% |
| Greek | 324 | 0.9% |
| Guatemalan | 64 | 0.2% |
| Honduran | 24 | 0.1% |
| Hungarian | 95 | 0.3% |
| Indian (Asian) | 2,840 | 8.1% |
| Iranian | 320 | 0.9% |
| Irish | 4,957 | 14.1% |
| Israeli | 70 | 0.2% |
| Italian | 2,438 | 6.9% |
| Japanese | 43 | 0.1% |
| Korean | 369 | 1.1% |
| Laotian | 28 | 0.1% |
| Latvian | 8 | 0.0% |
| Lebanese | 23 | 0.1% |
| Lithuanian | 140 | 0.4% |
| Mexican | 1,752 | 5.0% |
| Mexican American Indian | 34 | 0.1% |
| Moroccan | 23 | 0.1% |
| Native Hawaiian | 178 | 0.5% |
| Northern European | 125 | 0.4% |
| Norwegian | 510 | 1.5% |
| Paiute | 54 | 0.2% |
| Pakistani | 86 | 0.2% |
| Palestinian | 41 | 0.1% |
| Peruvian | 198 | 0.6% |
| Polish | 983 | 2.8% |
| Portuguese | 200 | 0.6% |
| Pueblo | 7 | 0.0% |
| Puerto Rican | 8 | 0.0% |
| Romanian | 101 | 0.3% |
| Russian | 819 | 2.3% |
| Salvadoran | 37 | 0.1% |
| Scandinavian | 264 | 0.7% |
| Scotch-Irish | 397 | 1.1% |
| Scottish | 911 | 2.6% |
| Serbian | 64 | 0.2% |
| Sioux | 9 | 0.0% |
| Slovak | 212 | 0.6% |
| Slovene | 85 | 0.2% |
| South African | 107 | 0.3% |
| South American | 584 | 1.7% |
| South American Indian | 45 | 0.1% |
| Spaniard | 82 | 0.2% |
| Spanish | 71 | 0.2% |
| Sri Lankan | 375 | 1.1% |
| Subsaharan African | 127 | 0.4% |
| Swedish | 575 | 1.6% |
| Swiss | 253 | 0.7% |
| Syrian | 44 | 0.1% |
| Thai | 931 | 2.6% |
| Turkish | 168 | 0.5% |
| Ukrainian | 367 | 1.0% |
| Welsh | 138 | 0.4% |
| Yugoslavian | 61 | 0.2% | View All 96 Rows |
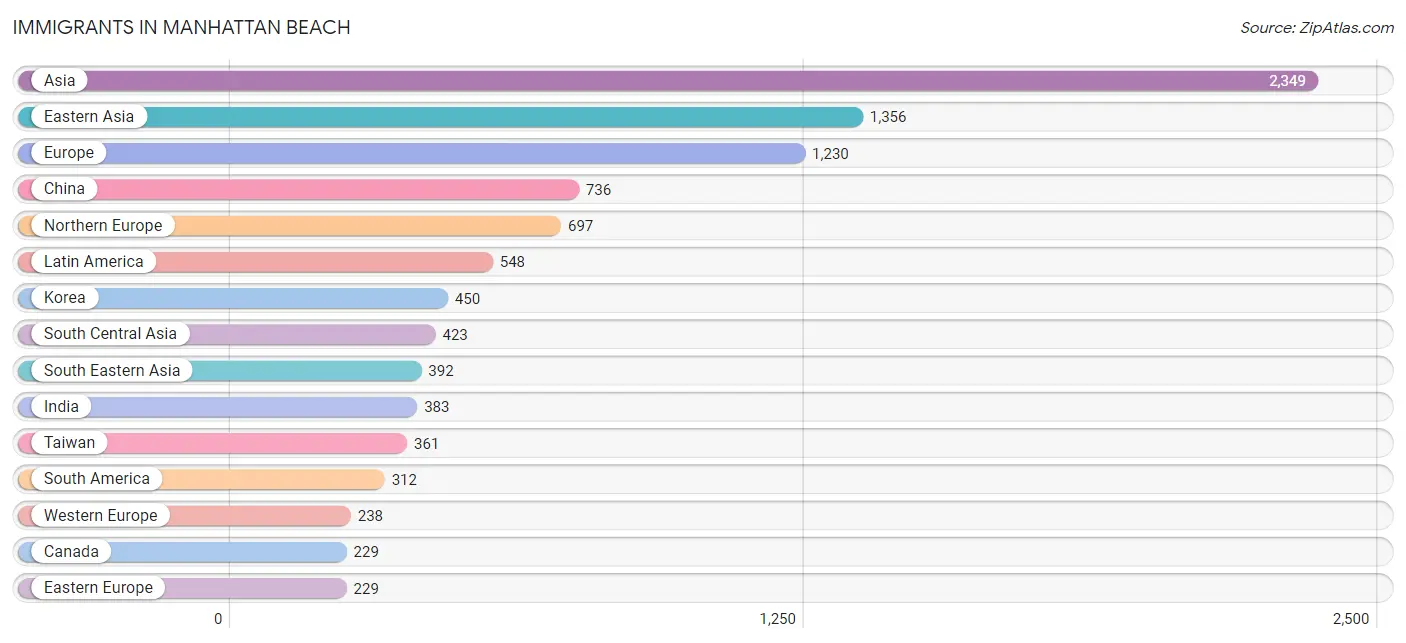
Immigrants in Manhattan Beach
The most numerous immigrant groups reported in Manhattan Beach came from Asia (2,349 | 6.7%), Eastern Asia (1,356 | 3.9%), Europe (1,230 | 3.5%), China (736 | 2.1%), and Northern Europe (697 | 2.0%), together accounting for 18.1% of all Manhattan Beach residents.
| Immigration Origin | # Population | % Population |
| Africa | 153 | 0.4% |
| Argentina | 39 | 0.1% |
| Asia | 2,349 | 6.7% |
| Australia | 48 | 0.1% |
| Austria | 10 | 0.0% |
| Bolivia | 50 | 0.1% |
| Brazil | 127 | 0.4% |
| Canada | 229 | 0.6% |
| Caribbean | 41 | 0.1% |
| Central America | 195 | 0.6% |
| Chile | 11 | 0.0% |
| China | 736 | 2.1% |
| Cuba | 38 | 0.1% |
| Czechoslovakia | 3 | 0.0% |
| Denmark | 91 | 0.3% |
| Eastern Asia | 1,356 | 3.9% |
| Eastern Europe | 229 | 0.6% |
| Ecuador | 46 | 0.1% |
| Egypt | 63 | 0.2% |
| El Salvador | 15 | 0.0% |
| England | 91 | 0.3% |
| Europe | 1,230 | 3.5% |
| France | 60 | 0.2% |
| Germany | 118 | 0.3% |
| Greece | 13 | 0.0% |
| Grenada | 3 | 0.0% |
| Guatemala | 8 | 0.0% |
| Honduras | 24 | 0.1% |
| Hong Kong | 9 | 0.0% |
| Hungary | 12 | 0.0% |
| India | 383 | 1.1% |
| Indonesia | 41 | 0.1% |
| Iran | 40 | 0.1% |
| Iraq | 11 | 0.0% |
| Ireland | 31 | 0.1% |
| Israel | 45 | 0.1% |
| Italy | 33 | 0.1% |
| Japan | 170 | 0.5% |
| Korea | 450 | 1.3% |
| Latin America | 548 | 1.6% |
| Lithuania | 45 | 0.1% |
| Mexico | 148 | 0.4% |
| Netherlands | 44 | 0.1% |
| Nigeria | 22 | 0.1% |
| Northern Africa | 63 | 0.2% |
| Northern Europe | 697 | 2.0% |
| Oceania | 77 | 0.2% |
| Peru | 39 | 0.1% |
| Philippines | 112 | 0.3% |
| Poland | 18 | 0.1% |
| Portugal | 20 | 0.1% |
| Romania | 8 | 0.0% |
| Russia | 5 | 0.0% |
| Scotland | 13 | 0.0% |
| Serbia | 68 | 0.2% |
| Singapore | 44 | 0.1% |
| South Africa | 68 | 0.2% |
| South America | 312 | 0.9% |
| South Central Asia | 423 | 1.2% |
| South Eastern Asia | 392 | 1.1% |
| Southern Europe | 66 | 0.2% |
| Sweden | 23 | 0.1% |
| Switzerland | 6 | 0.0% |
| Taiwan | 361 | 1.0% |
| Thailand | 33 | 0.1% |
| Turkey | 81 | 0.2% |
| Ukraine | 10 | 0.0% |
| Vietnam | 162 | 0.5% |
| Western Africa | 22 | 0.1% |
| Western Asia | 137 | 0.4% |
| Western Europe | 238 | 0.7% | View All 71 Rows |
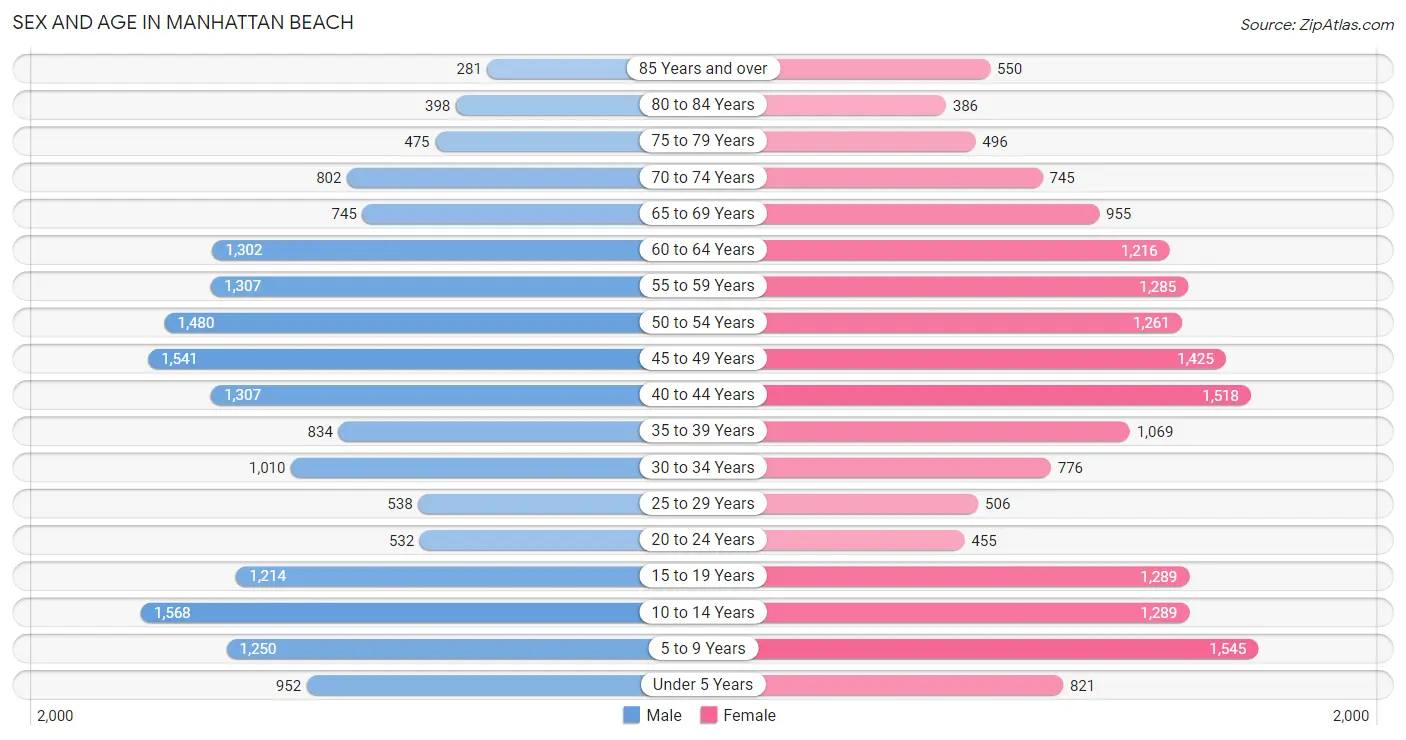
Sex and Age in Manhattan Beach
Sex and Age in Manhattan Beach
The most populous age groups in Manhattan Beach are 10 to 14 Years (1,568 | 8.9%) for men and 5 to 9 Years (1,545 | 8.8%) for women.
| Age Bracket | Male | Female |
| Under 5 Years | 952 (5.4%) | 821 (4.7%) |
| 5 to 9 Years | 1,250 (7.1%) | 1,545 (8.8%) |
| 10 to 14 Years | 1,568 (8.9%) | 1,289 (7.3%) |
| 15 to 19 Years | 1,214 (6.9%) | 1,289 (7.3%) |
| 20 to 24 Years | 532 (3.0%) | 455 (2.6%) |
| 25 to 29 Years | 538 (3.1%) | 506 (2.9%) |
| 30 to 34 Years | 1,010 (5.8%) | 776 (4.4%) |
| 35 to 39 Years | 834 (4.8%) | 1,069 (6.1%) |
| 40 to 44 Years | 1,307 (7.4%) | 1,518 (8.6%) |
| 45 to 49 Years | 1,541 (8.8%) | 1,425 (8.1%) |
| 50 to 54 Years | 1,480 (8.4%) | 1,261 (7.2%) |
| 55 to 59 Years | 1,307 (7.4%) | 1,285 (7.3%) |
| 60 to 64 Years | 1,302 (7.4%) | 1,216 (6.9%) |
| 65 to 69 Years | 745 (4.3%) | 955 (5.4%) |
| 70 to 74 Years | 802 (4.6%) | 745 (4.2%) |
| 75 to 79 Years | 475 (2.7%) | 496 (2.8%) |
| 80 to 84 Years | 398 (2.3%) | 386 (2.2%) |
| 85 Years and over | 281 (1.6%) | 550 (3.1%) |
| Total | 17,536 (100.0%) | 17,587 (100.0%) |
Families and Households in Manhattan Beach
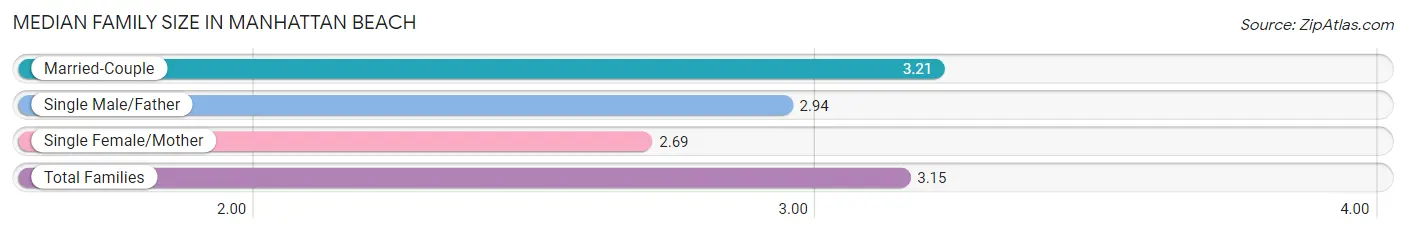
Median Family Size in Manhattan Beach
The median family size in Manhattan Beach is 3.15 persons per family, with married-couple families (8,090 | 86.7%) accounting for the largest median family size of 3.21 persons per family. On the other hand, single female/mother families (699 | 7.5%) represent the smallest median family size with 2.69 persons per family.
| Family Type | # Families | Family Size |
| Married-Couple | 8,090 (86.7%) | 3.21 |
| Single Male/Father | 546 (5.9%) | 2.94 |
| Single Female/Mother | 699 (7.5%) | 2.69 |
| Total Families | 9,335 (100.0%) | 3.15 |
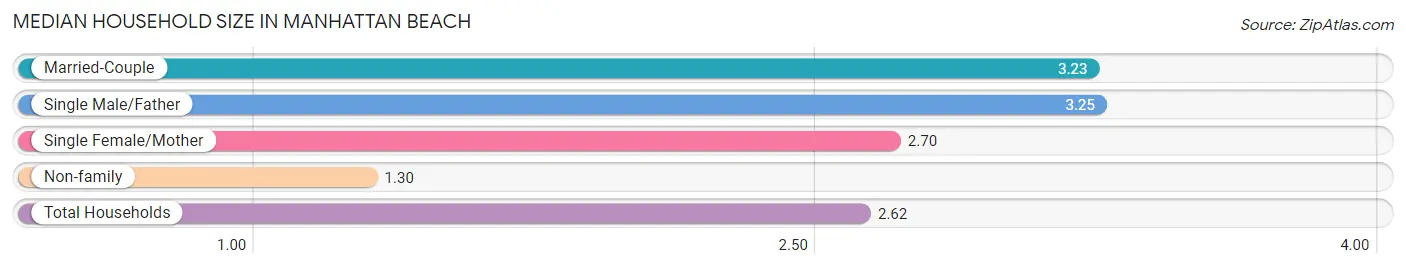
Median Household Size in Manhattan Beach
The median household size in Manhattan Beach is 2.62 persons per household, with single male/father households (546 | 4.1%) accounting for the largest median household size of 3.25 persons per household. non-family households (4,065 | 30.3%) represent the smallest median household size with 1.30 persons per household.
| Household Type | # Households | Household Size |
| Married-Couple | 8,090 (60.4%) | 3.23 |
| Single Male/Father | 546 (4.1%) | 3.25 |
| Single Female/Mother | 699 (5.2%) | 2.70 |
| Non-family | 4,065 (30.3%) | 1.30 |
| Total Households | 13,400 (100.0%) | 2.62 |
Household Size by Marriage Status in Manhattan Beach
Out of a total of 13,400 households in Manhattan Beach, 9,335 (69.7%) are family households, while 4,065 (30.3%) are nonfamily households. The most numerous type of family households are 2-person households, comprising 4,015, and the most common type of nonfamily households are 1-person households, comprising 3,031.
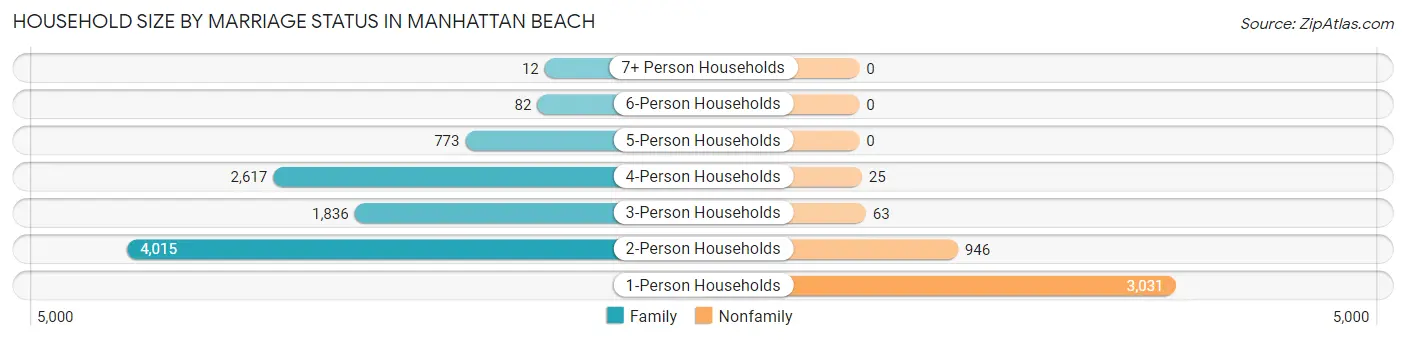
| Household Size | Family Households | Nonfamily Households |
| 1-Person Households | - | 3,031 (22.6%) |
| 2-Person Households | 4,015 (30.0%) | 946 (7.1%) |
| 3-Person Households | 1,836 (13.7%) | 63 (0.5%) |
| 4-Person Households | 2,617 (19.5%) | 25 (0.2%) |
| 5-Person Households | 773 (5.8%) | 0 (0.0%) |
| 6-Person Households | 82 (0.6%) | 0 (0.0%) |
| 7+ Person Households | 12 (0.1%) | 0 (0.0%) |
| Total | 9,335 (69.7%) | 4,065 (30.3%) |
Female Fertility in Manhattan Beach
Fertility by Age in Manhattan Beach
Average fertility rate in Manhattan Beach is 38.0 births per 1,000 women. Women in the age bracket of 20 to 34 years have the highest fertility rate with 78.0 births per 1,000 women. Women in the age bracket of 35 to 50 years acount for 51.1% of all women with births.
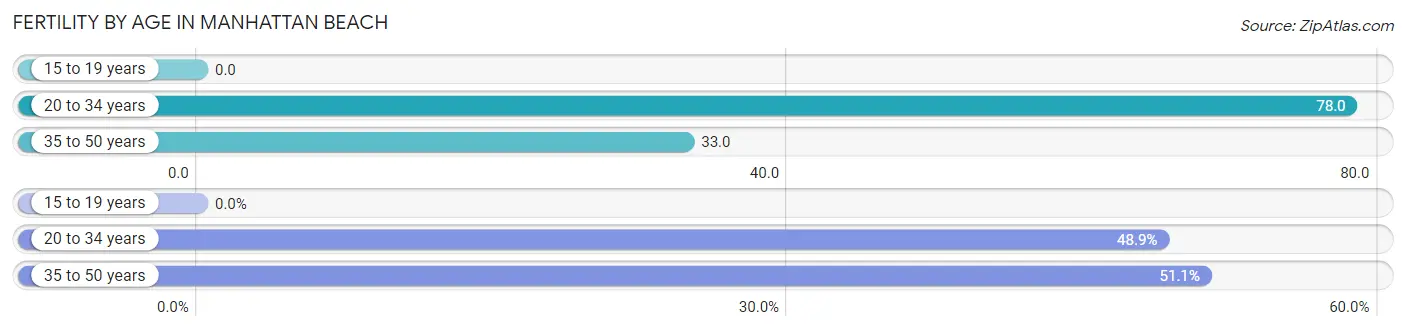
| Age Bracket | Women with Births | Births / 1,000 Women |
| 15 to 19 years | 0 (0.0%) | 0.0 |
| 20 to 34 years | 136 (48.9%) | 78.0 |
| 35 to 50 years | 142 (51.1%) | 33.0 |
| Total | 278 (100.0%) | 38.0 |
Fertility by Age by Marriage Status in Manhattan Beach
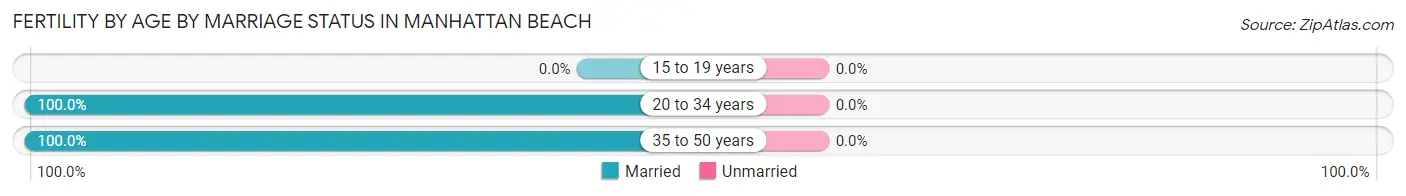
| Age Bracket | Married | Unmarried |
| 15 to 19 years | 0 (0.0%) | 0 (0.0%) |
| 20 to 34 years | 136 (100.0%) | 0 (0.0%) |
| 35 to 50 years | 142 (100.0%) | 0 (0.0%) |
| Total | 278 (100.0%) | 0 (0.0%) |
Fertility by Education in Manhattan Beach
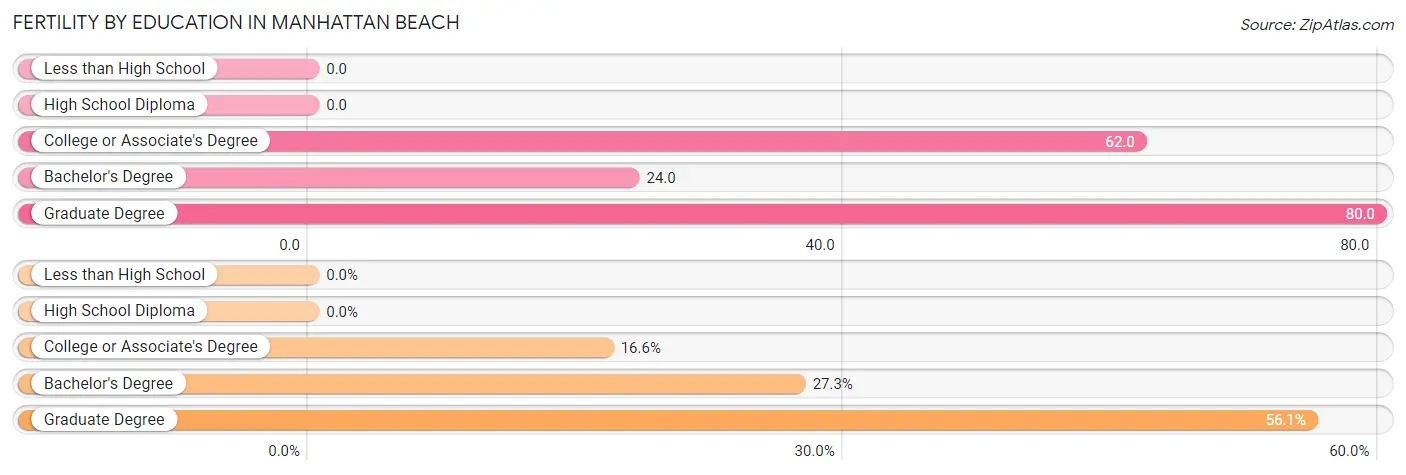
| Educational Attainment | Women with Births | Births / 1,000 Women |
| Less than High School | 0 (0.0%) | 0.0 |
| High School Diploma | 0 (0.0%) | 0.0 |
| College or Associate's Degree | 46 (16.6%) | 62.0 |
| Bachelor's Degree | 76 (27.3%) | 24.0 |
| Graduate Degree | 156 (56.1%) | 80.0 |
| Total | 278 (100.0%) | 38.0 |
Fertility by Education by Marriage Status in Manhattan Beach
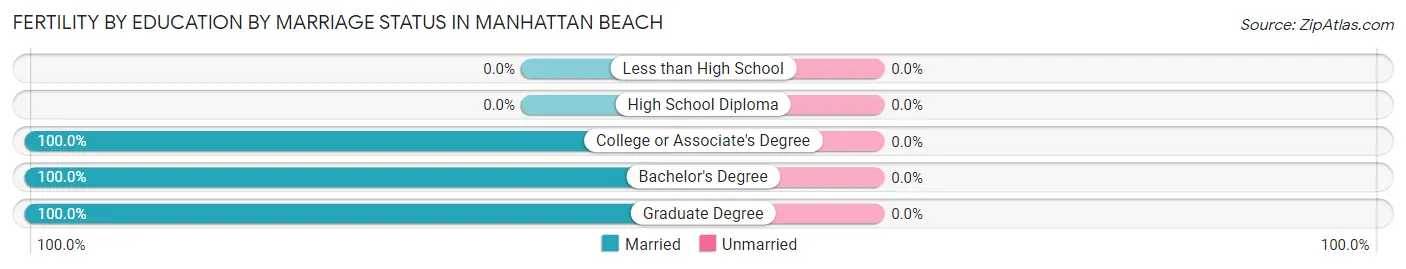
| Educational Attainment | Married | Unmarried |
| Less than High School | 0 (0.0%) | 0 (0.0%) |
| High School Diploma | 0 (0.0%) | 0 (0.0%) |
| College or Associate's Degree | 46 (100.0%) | 0 (0.0%) |
| Bachelor's Degree | 76 (100.0%) | 0 (0.0%) |
| Graduate Degree | 156 (100.0%) | 0 (0.0%) |
| Total | 278 (100.0%) | 0 (0.0%) |
Employment Characteristics in Manhattan Beach
Employment by Class of Employer in Manhattan Beach
Among the 15,571 employed individuals in Manhattan Beach, private company employees (9,603 | 61.7%), self-employed (incorporated) (1,984 | 12.7%), and self-employed (not incorporated) (1,361 | 8.7%) make up the most common classes of employment.
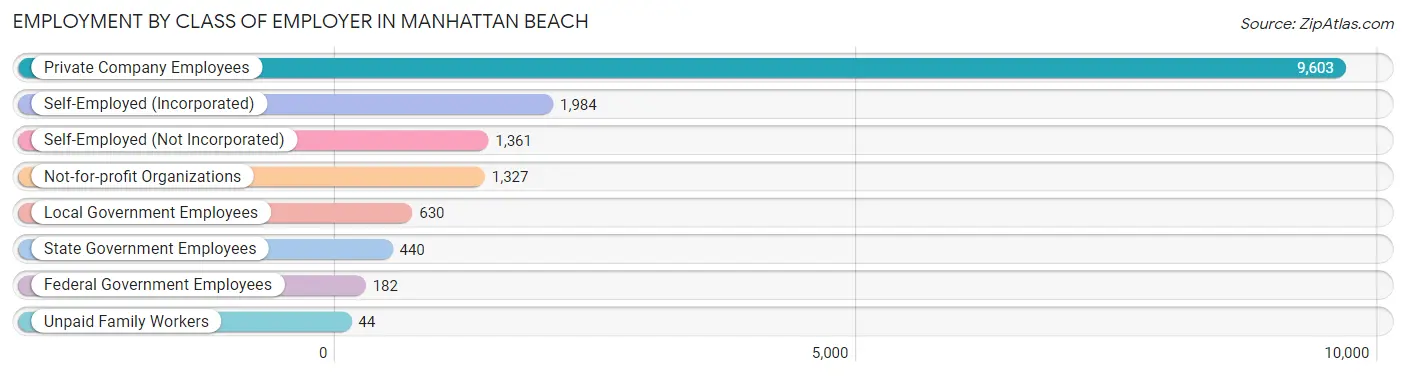
| Employer Class | # Employees | % Employees |
| Private Company Employees | 9,603 | 61.7% |
| Self-Employed (Incorporated) | 1,984 | 12.7% |
| Self-Employed (Not Incorporated) | 1,361 | 8.7% |
| Not-for-profit Organizations | 1,327 | 8.5% |
| Local Government Employees | 630 | 4.1% |
| State Government Employees | 440 | 2.8% |
| Federal Government Employees | 182 | 1.2% |
| Unpaid Family Workers | 44 | 0.3% |
| Total | 15,571 | 100.0% |
Employment Status by Age in Manhattan Beach
According to the labor force statistics for Manhattan Beach, out of the total population over 16 years of age (27,197), 61.3% or 16,672 individuals are in the labor force, with 3.8% or 634 of them unemployed. The age group with the highest labor force participation rate is 25 to 29 years, with 92.2% or 963 individuals in the labor force. Within the labor force, the 16 to 19 years age range has the highest percentage of unemployed individuals, with 23.3% or 50 of them being unemployed.
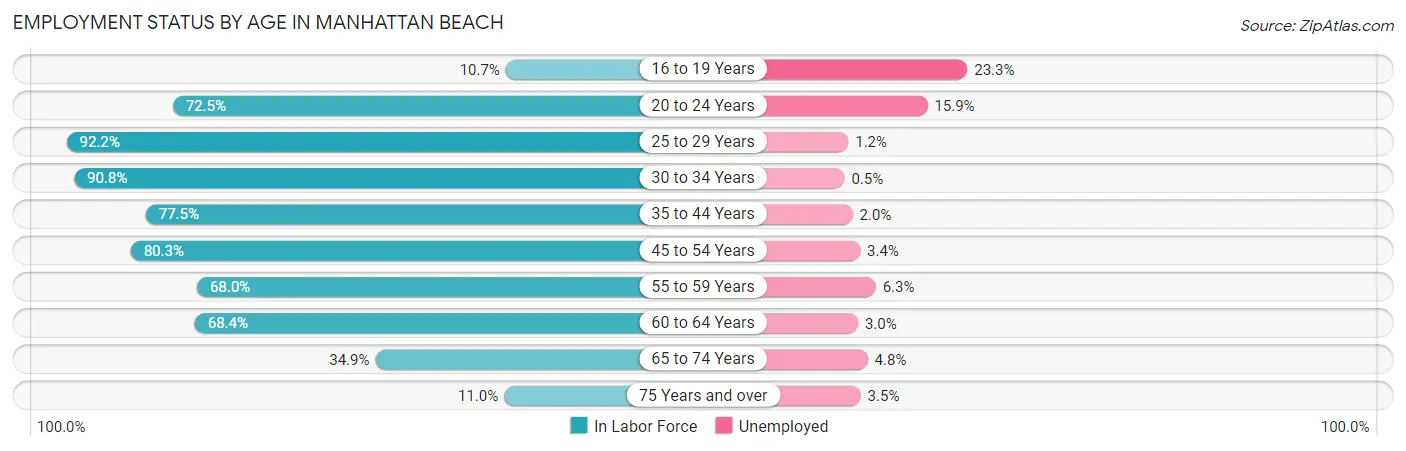
| Age Bracket | In Labor Force | Unemployed |
| 16 to 19 Years | 214 (10.7%) | 50 (23.3%) |
| 20 to 24 Years | 716 (72.5%) | 114 (15.9%) |
| 25 to 29 Years | 963 (92.2%) | 12 (1.2%) |
| 30 to 34 Years | 1,622 (90.8%) | 8 (0.5%) |
| 35 to 44 Years | 3,664 (77.5%) | 73 (2.0%) |
| 45 to 54 Years | 4,583 (80.3%) | 156 (3.4%) |
| 55 to 59 Years | 1,763 (68.0%) | 111 (6.3%) |
| 60 to 64 Years | 1,722 (68.4%) | 52 (3.0%) |
| 65 to 74 Years | 1,133 (34.9%) | 54 (4.8%) |
| 75 Years and over | 284 (11.0%) | 10 (3.5%) |
| Total | 16,672 (61.3%) | 634 (3.8%) |
Employment Status by Educational Attainment in Manhattan Beach
According to labor force statistics for Manhattan Beach, 77.9% of individuals (14,314) out of the total population between 25 and 64 years of age (18,375) are in the labor force, with 2.9% or 415 of them being unemployed. The group with the highest labor force participation rate are those with the educational attainment of bachelor's degree or higher, with 79.7% or 12,144 individuals in the labor force. Within the labor force, individuals with less than high school education have the highest percentage of unemployment, with 13.2% or 12 of them being unemployed.
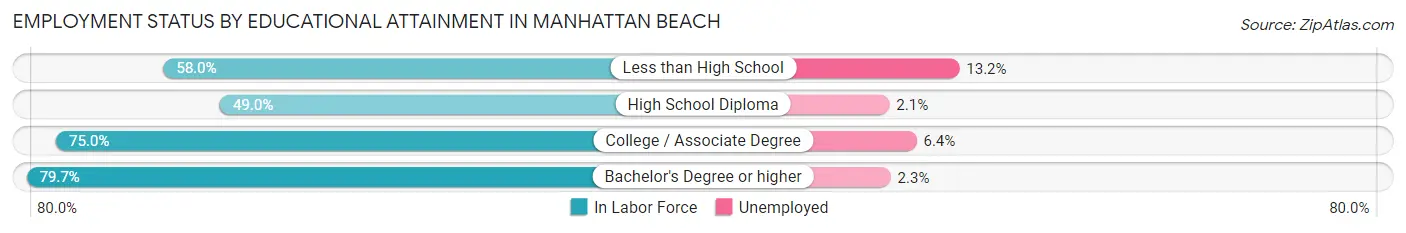
| Educational Attainment | In Labor Force | Unemployed |
| Less than High School | 91 (58.0%) | 21 (13.2%) |
| High School Diploma | 283 (49.0%) | 12 (2.1%) |
| College / Associate Degree | 1,803 (75.0%) | 154 (6.4%) |
| Bachelor's Degree or higher | 12,144 (79.7%) | 350 (2.3%) |
| Total | 14,314 (77.9%) | 533 (2.9%) |
Employment Occupations by Sex in Manhattan Beach
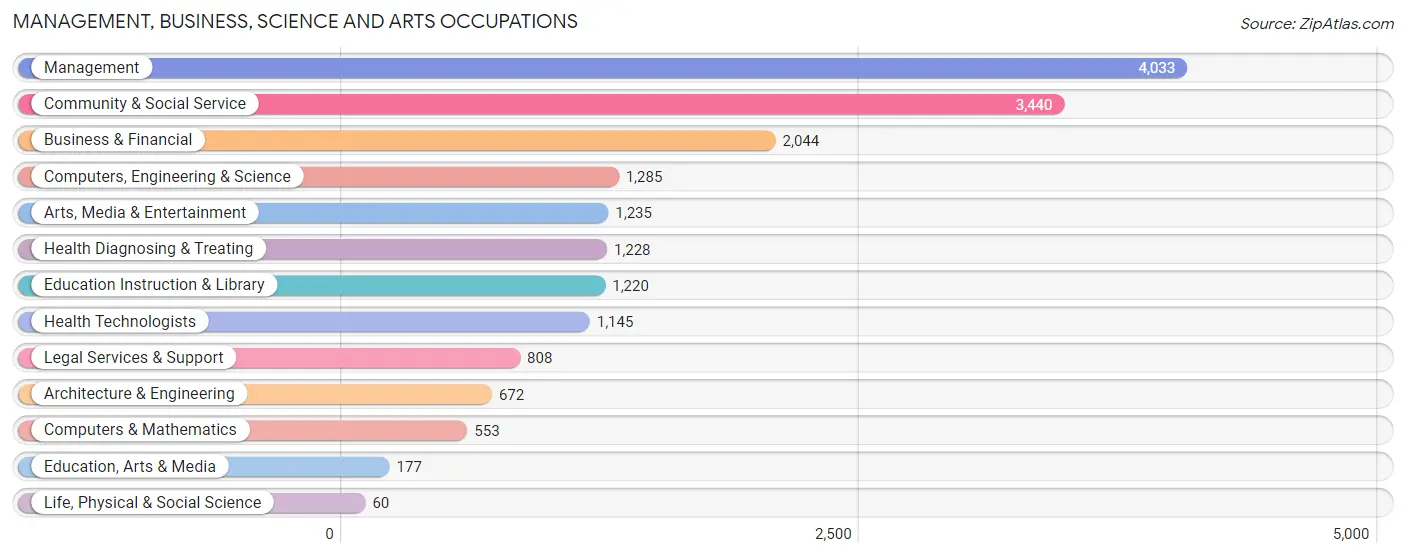
Management, Business, Science and Arts Occupations
The most common Management, Business, Science and Arts occupations in Manhattan Beach are Management (4,033 | 25.2%), Community & Social Service (3,440 | 21.5%), Business & Financial (2,044 | 12.8%), Computers, Engineering & Science (1,285 | 8.0%), and Arts, Media & Entertainment (1,235 | 7.7%).
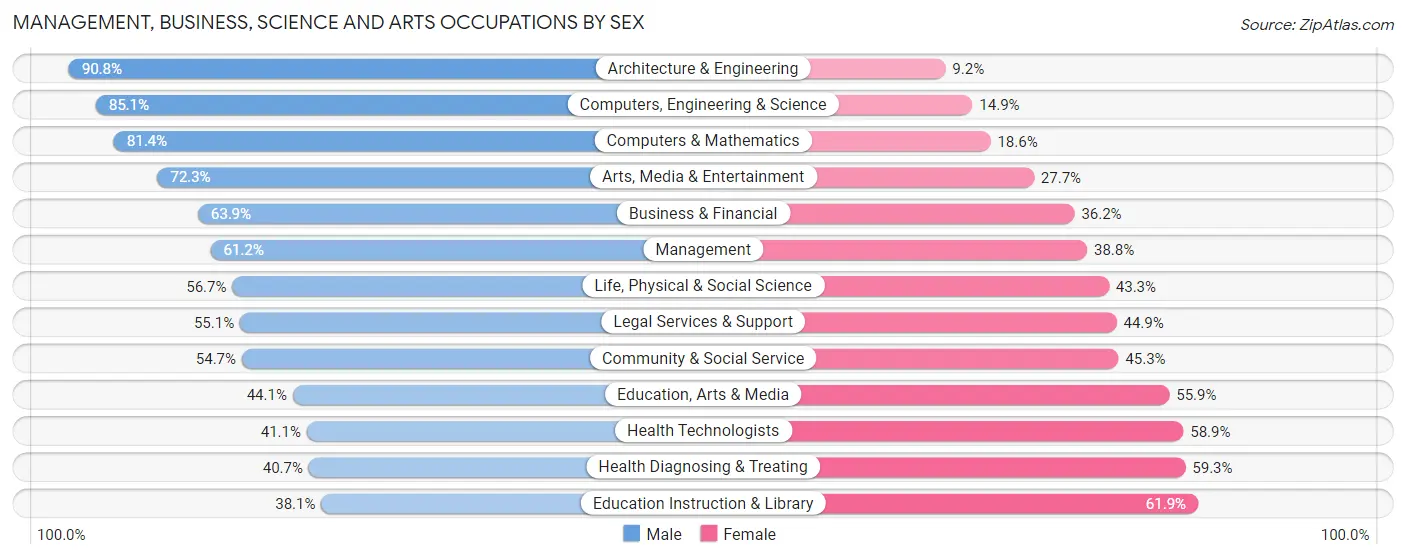
Management, Business, Science and Arts Occupations by Sex
Within the Management, Business, Science and Arts occupations in Manhattan Beach, the most male-oriented occupations are Architecture & Engineering (90.8%), Computers, Engineering & Science (85.1%), and Computers & Mathematics (81.4%), while the most female-oriented occupations are Education Instruction & Library (61.9%), Health Diagnosing & Treating (59.3%), and Health Technologists (58.9%).
| Occupation | Male | Female |
| Management | 2,469 (61.2%) | 1,564 (38.8%) |
| Business & Financial | 1,305 (63.8%) | 739 (36.1%) |
| Computers, Engineering & Science | 1,094 (85.1%) | 191 (14.9%) |
| Computers & Mathematics | 450 (81.4%) | 103 (18.6%) |
| Architecture & Engineering | 610 (90.8%) | 62 (9.2%) |
| Life, Physical & Social Science | 34 (56.7%) | 26 (43.3%) |
| Community & Social Service | 1,881 (54.7%) | 1,559 (45.3%) |
| Education, Arts & Media | 78 (44.1%) | 99 (55.9%) |
| Legal Services & Support | 445 (55.1%) | 363 (44.9%) |
| Education Instruction & Library | 465 (38.1%) | 755 (61.9%) |
| Arts, Media & Entertainment | 893 (72.3%) | 342 (27.7%) |
| Health Diagnosing & Treating | 500 (40.7%) | 728 (59.3%) |
| Health Technologists | 471 (41.1%) | 674 (58.9%) |
| Total (Category) | 7,249 (60.3%) | 4,781 (39.7%) |
| Total (Overall) | 9,352 (58.5%) | 6,624 (41.5%) |
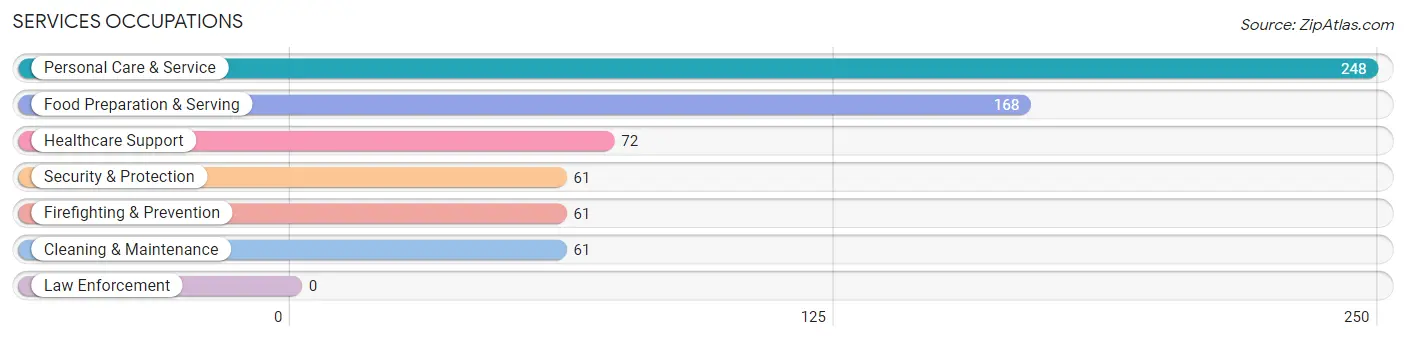
Services Occupations
The most common Services occupations in Manhattan Beach are Personal Care & Service (248 | 1.5%), Food Preparation & Serving (168 | 1.1%), Healthcare Support (72 | 0.4%), Security & Protection (61 | 0.4%), and Firefighting & Prevention (61 | 0.4%).
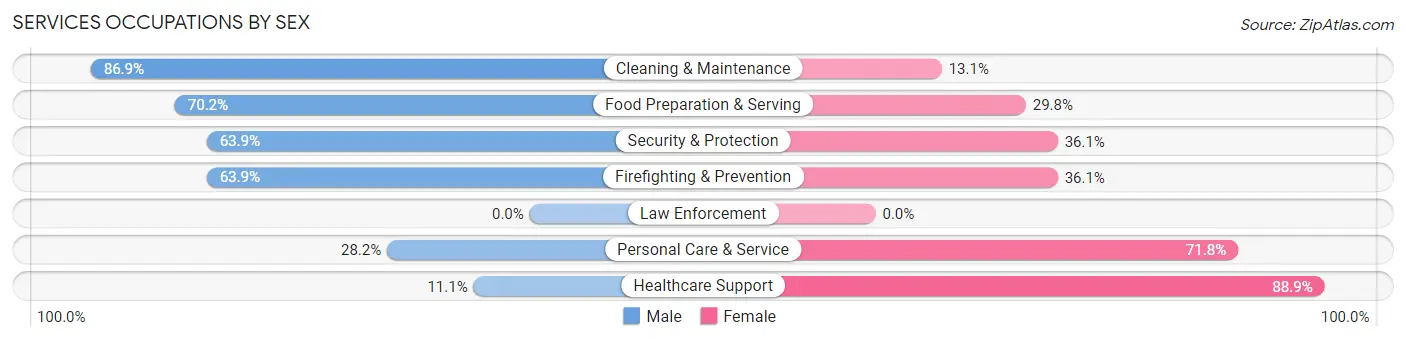
Services Occupations by Sex
Within the Services occupations in Manhattan Beach, the most male-oriented occupations are Cleaning & Maintenance (86.9%), Food Preparation & Serving (70.2%), and Security & Protection (63.9%), while the most female-oriented occupations are Healthcare Support (88.9%), Personal Care & Service (71.8%), and Security & Protection (36.1%).
| Occupation | Male | Female |
| Healthcare Support | 8 (11.1%) | 64 (88.9%) |
| Security & Protection | 39 (63.9%) | 22 (36.1%) |
| Firefighting & Prevention | 39 (63.9%) | 22 (36.1%) |
| Law Enforcement | 0 (0.0%) | 0 (0.0%) |
| Food Preparation & Serving | 118 (70.2%) | 50 (29.8%) |
| Cleaning & Maintenance | 53 (86.9%) | 8 (13.1%) |
| Personal Care & Service | 70 (28.2%) | 178 (71.8%) |
| Total (Category) | 288 (47.2%) | 322 (52.8%) |
| Total (Overall) | 9,352 (58.5%) | 6,624 (41.5%) |
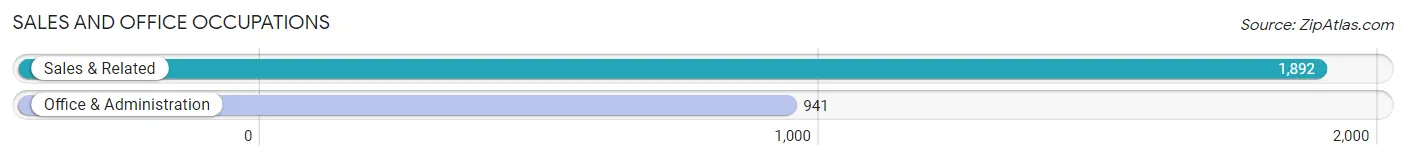
Sales and Office Occupations
The most common Sales and Office occupations in Manhattan Beach are Sales & Related (1,892 | 11.8%), and Office & Administration (941 | 5.9%).
Sales and Office Occupations by Sex
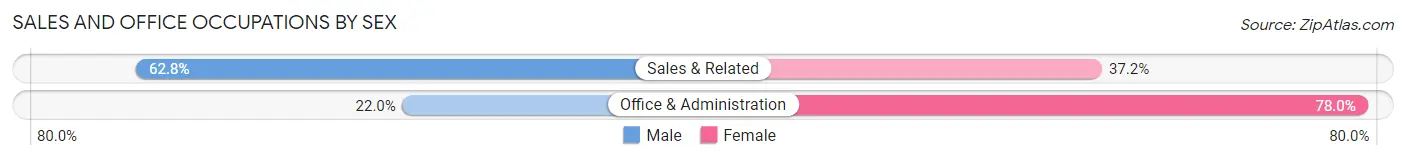
| Occupation | Male | Female |
| Sales & Related | 1,189 (62.8%) | 703 (37.2%) |
| Office & Administration | 207 (22.0%) | 734 (78.0%) |
| Total (Category) | 1,396 (49.3%) | 1,437 (50.7%) |
| Total (Overall) | 9,352 (58.5%) | 6,624 (41.5%) |
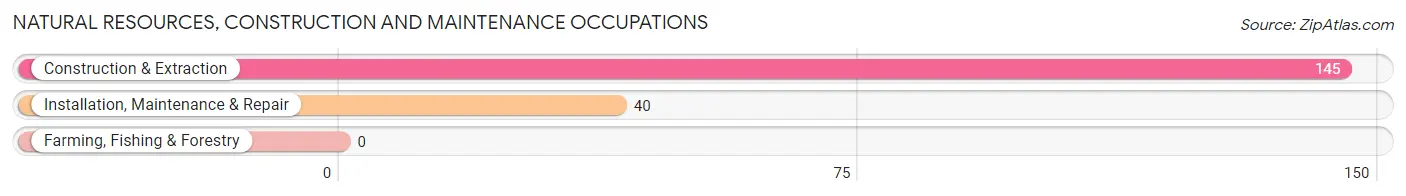
Natural Resources, Construction and Maintenance Occupations
The most common Natural Resources, Construction and Maintenance occupations in Manhattan Beach are Construction & Extraction (145 | 0.9%), and Installation, Maintenance & Repair (40 | 0.3%).
Natural Resources, Construction and Maintenance Occupations by Sex
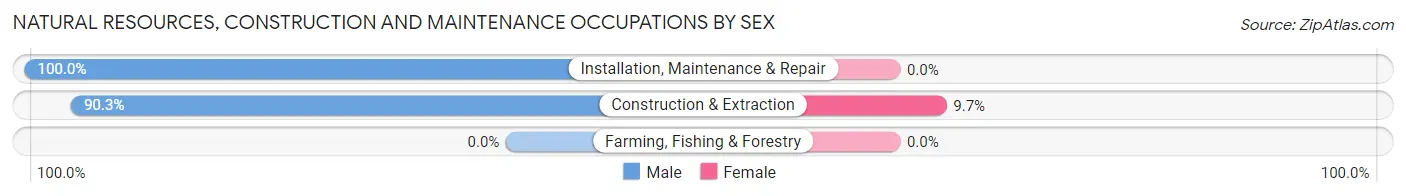
| Occupation | Male | Female |
| Farming, Fishing & Forestry | 0 (0.0%) | 0 (0.0%) |
| Construction & Extraction | 131 (90.3%) | 14 (9.7%) |
| Installation, Maintenance & Repair | 40 (100.0%) | 0 (0.0%) |
| Total (Category) | 171 (92.4%) | 14 (7.6%) |
| Total (Overall) | 9,352 (58.5%) | 6,624 (41.5%) |
Production, Transportation and Moving Occupations
The most common Production, Transportation and Moving occupations in Manhattan Beach are Transportation (134 | 0.8%), Production (127 | 0.8%), and Material Moving (57 | 0.4%).
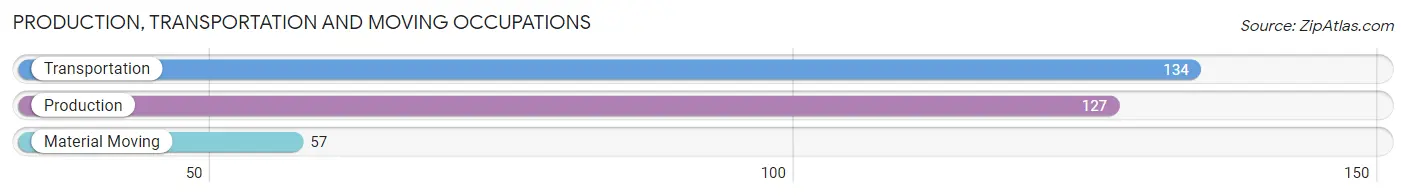
Production, Transportation and Moving Occupations by Sex
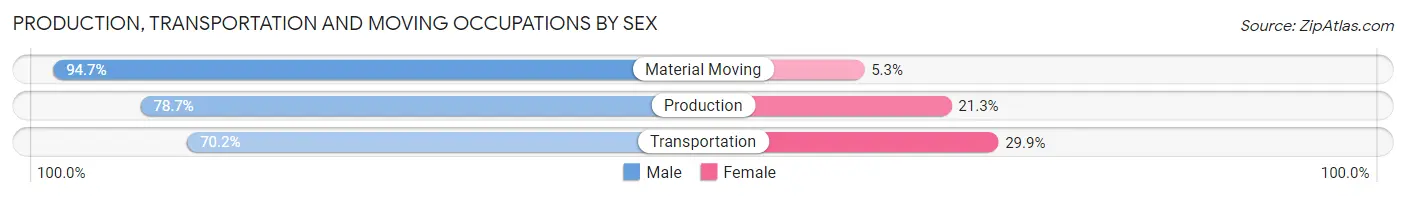
| Occupation | Male | Female |
| Production | 100 (78.7%) | 27 (21.3%) |
| Transportation | 94 (70.2%) | 40 (29.8%) |
| Material Moving | 54 (94.7%) | 3 (5.3%) |
| Total (Category) | 248 (78.0%) | 70 (22.0%) |
| Total (Overall) | 9,352 (58.5%) | 6,624 (41.5%) |
Employment Industries by Sex in Manhattan Beach
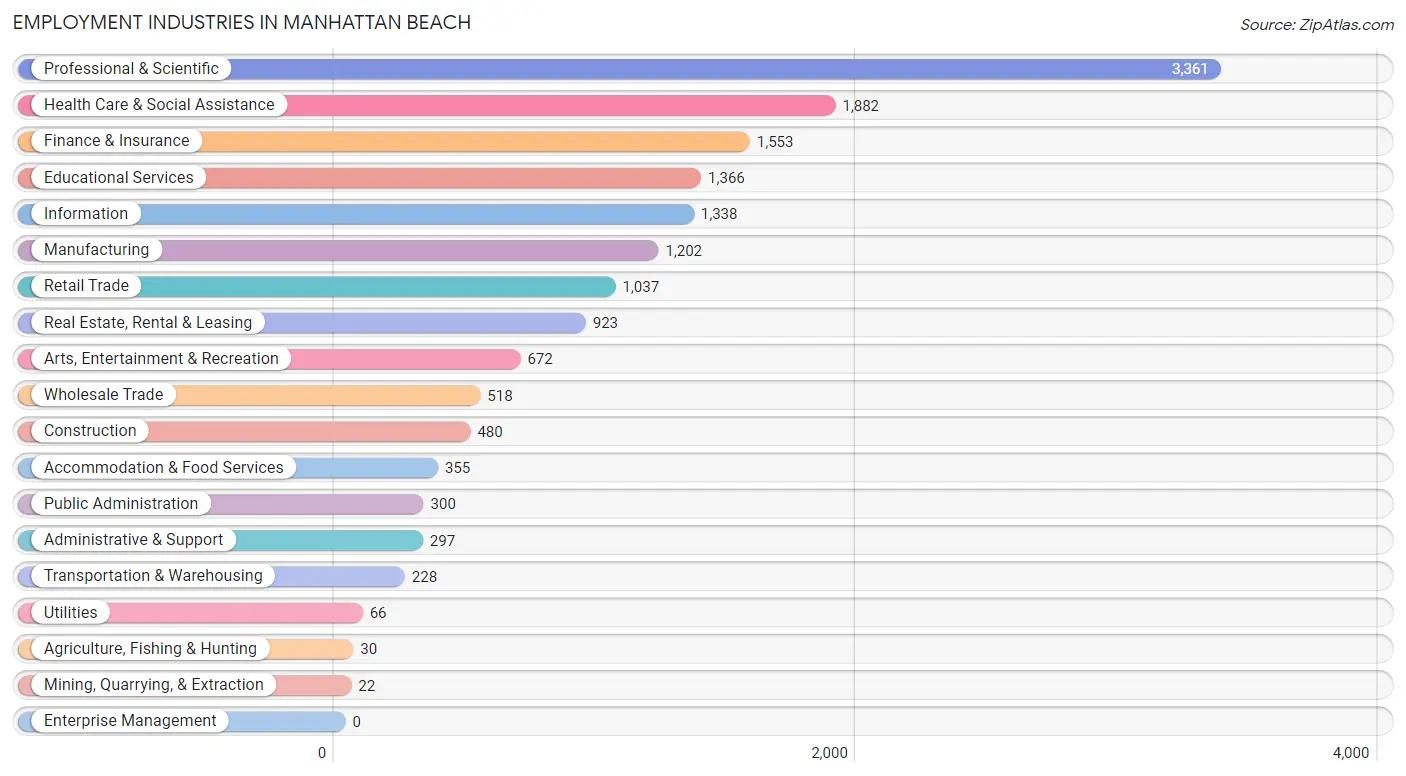
Employment Industries in Manhattan Beach
The major employment industries in Manhattan Beach include Professional & Scientific (3,361 | 21.0%), Health Care & Social Assistance (1,882 | 11.8%), Finance & Insurance (1,553 | 9.7%), Educational Services (1,366 | 8.6%), and Information (1,338 | 8.4%).
Employment Industries by Sex in Manhattan Beach
The Manhattan Beach industries that see more men than women are Agriculture, Fishing & Hunting (100.0%), Utilities (93.9%), and Construction (86.0%), whereas the industries that tend to have a higher number of women are Public Administration (66.0%), Health Care & Social Assistance (65.8%), and Retail Trade (65.1%).
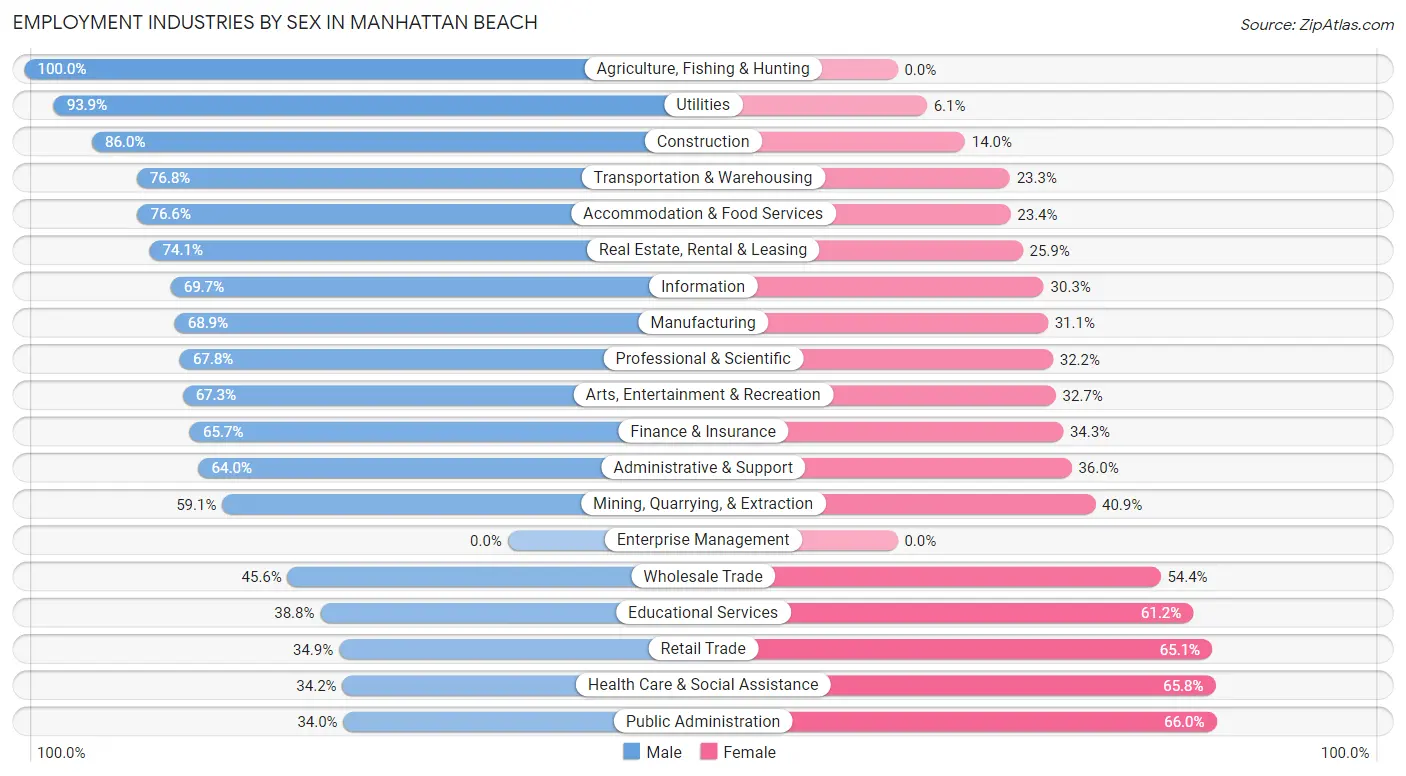
| Industry | Male | Female |
| Agriculture, Fishing & Hunting | 30 (100.0%) | 0 (0.0%) |
| Mining, Quarrying, & Extraction | 13 (59.1%) | 9 (40.9%) |
| Construction | 413 (86.0%) | 67 (14.0%) |
| Manufacturing | 828 (68.9%) | 374 (31.1%) |
| Wholesale Trade | 236 (45.6%) | 282 (54.4%) |
| Retail Trade | 362 (34.9%) | 675 (65.1%) |
| Transportation & Warehousing | 175 (76.7%) | 53 (23.3%) |
| Utilities | 62 (93.9%) | 4 (6.1%) |
| Information | 933 (69.7%) | 405 (30.3%) |
| Finance & Insurance | 1,021 (65.7%) | 532 (34.3%) |
| Real Estate, Rental & Leasing | 684 (74.1%) | 239 (25.9%) |
| Professional & Scientific | 2,280 (67.8%) | 1,081 (32.2%) |
| Enterprise Management | 0 (0.0%) | 0 (0.0%) |
| Administrative & Support | 190 (64.0%) | 107 (36.0%) |
| Educational Services | 530 (38.8%) | 836 (61.2%) |
| Health Care & Social Assistance | 644 (34.2%) | 1,238 (65.8%) |
| Arts, Entertainment & Recreation | 452 (67.3%) | 220 (32.7%) |
| Accommodation & Food Services | 272 (76.6%) | 83 (23.4%) |
| Public Administration | 102 (34.0%) | 198 (66.0%) |
| Total | 9,352 (58.5%) | 6,624 (41.5%) |
Education in Manhattan Beach
School Enrollment in Manhattan Beach
The most common levels of schooling among the 9,314 students in Manhattan Beach are high school (2,542 | 27.3%), elementary school (2,301 | 24.7%), and middle school (2,058 | 22.1%).
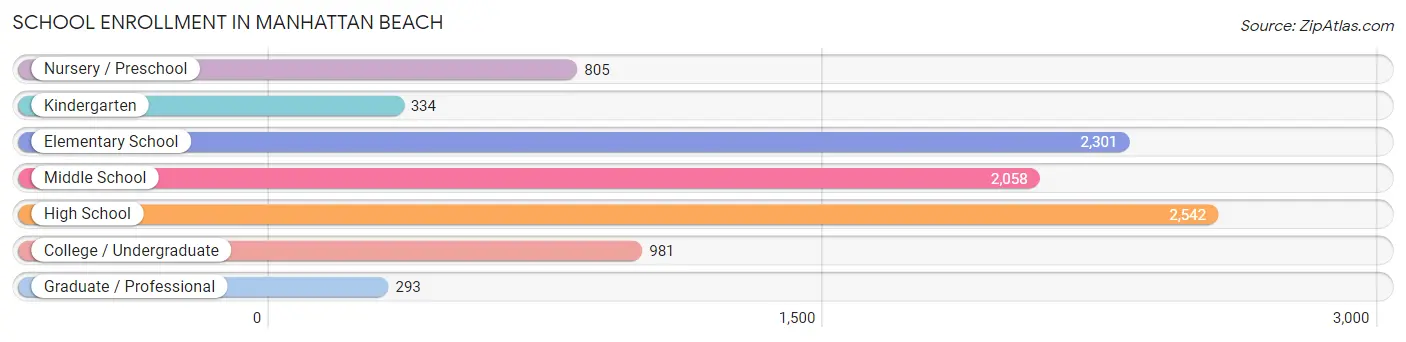
| School Level | # Students | % Students |
| Nursery / Preschool | 805 | 8.6% |
| Kindergarten | 334 | 3.6% |
| Elementary School | 2,301 | 24.7% |
| Middle School | 2,058 | 22.1% |
| High School | 2,542 | 27.3% |
| College / Undergraduate | 981 | 10.5% |
| Graduate / Professional | 293 | 3.2% |
| Total | 9,314 | 100.0% |
School Enrollment by Age by Funding Source in Manhattan Beach
Out of a total of 9,314 students who are enrolled in schools in Manhattan Beach, 2,394 (25.7%) attend a private institution, while the remaining 6,920 (74.3%) are enrolled in public schools. The age group of 3 to 4 year olds has the highest likelihood of being enrolled in private schools, with 392 (74.1% in the age bracket) enrolled. Conversely, the age group of 25 to 34 year olds has the lowest likelihood of being enrolled in a private school, with 116 (100.0% in the age bracket) attending a public institution.
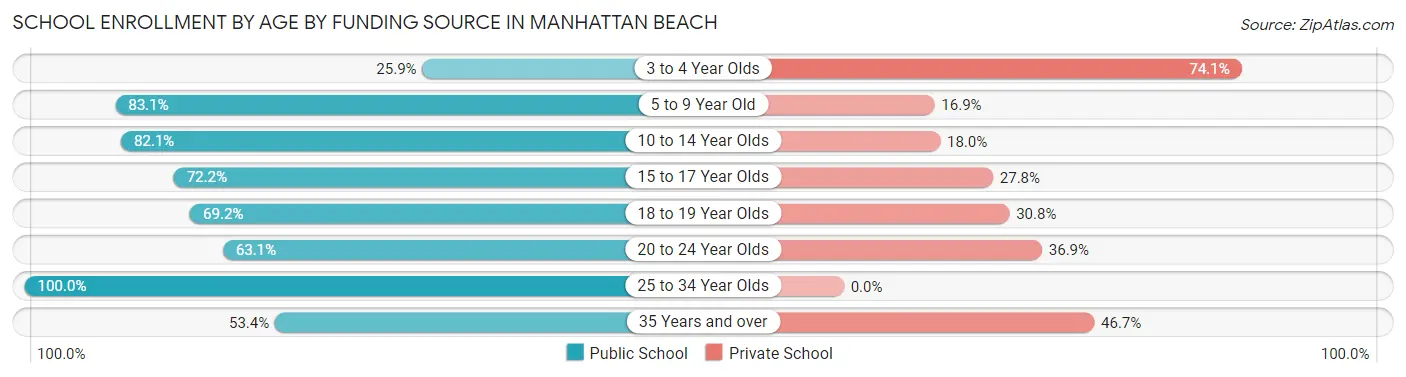
| Age Bracket | Public School | Private School |
| 3 to 4 Year Olds | 137 (25.9%) | 392 (74.1%) |
| 5 to 9 Year Old | 2,183 (83.1%) | 444 (16.9%) |
| 10 to 14 Year Olds | 2,194 (82.1%) | 480 (17.9%) |
| 15 to 17 Year Olds | 1,432 (72.2%) | 551 (27.8%) |
| 18 to 19 Year Olds | 296 (69.2%) | 132 (30.8%) |
| 20 to 24 Year Olds | 340 (63.1%) | 199 (36.9%) |
| 25 to 34 Year Olds | 116 (100.0%) | 0 (0.0%) |
| 35 Years and over | 223 (53.3%) | 195 (46.7%) |
| Total | 6,920 (74.3%) | 2,394 (25.7%) |
Educational Attainment by Field of Study in Manhattan Beach
Business (3,971 | 19.6%), social sciences (3,328 | 16.4%), engineering (1,843 | 9.1%), science & technology (1,514 | 7.5%), and communications (1,499 | 7.4%) are the most common fields of study among 20,261 individuals in Manhattan Beach who have obtained a bachelor's degree or higher.
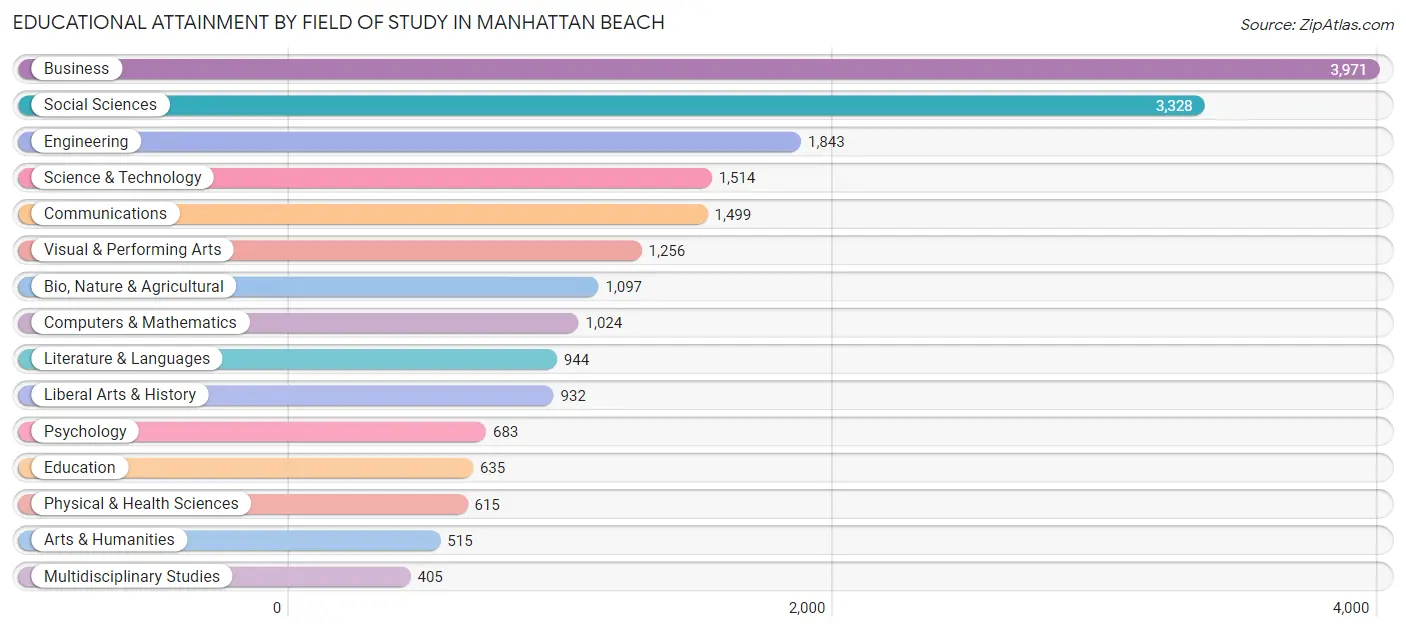
| Field of Study | # Graduates | % Graduates |
| Computers & Mathematics | 1,024 | 5.1% |
| Bio, Nature & Agricultural | 1,097 | 5.4% |
| Physical & Health Sciences | 615 | 3.0% |
| Psychology | 683 | 3.4% |
| Social Sciences | 3,328 | 16.4% |
| Engineering | 1,843 | 9.1% |
| Multidisciplinary Studies | 405 | 2.0% |
| Science & Technology | 1,514 | 7.5% |
| Business | 3,971 | 19.6% |
| Education | 635 | 3.1% |
| Literature & Languages | 944 | 4.7% |
| Liberal Arts & History | 932 | 4.6% |
| Visual & Performing Arts | 1,256 | 6.2% |
| Communications | 1,499 | 7.4% |
| Arts & Humanities | 515 | 2.5% |
| Total | 20,261 | 100.0% |
Transportation & Commute in Manhattan Beach
Vehicle Availability by Sex in Manhattan Beach
The most prevalent vehicle ownership categories in Manhattan Beach are males with 2 vehicles (5,003, accounting for 54.5%) and females with 2 vehicles (3,484, making up 78.4%).
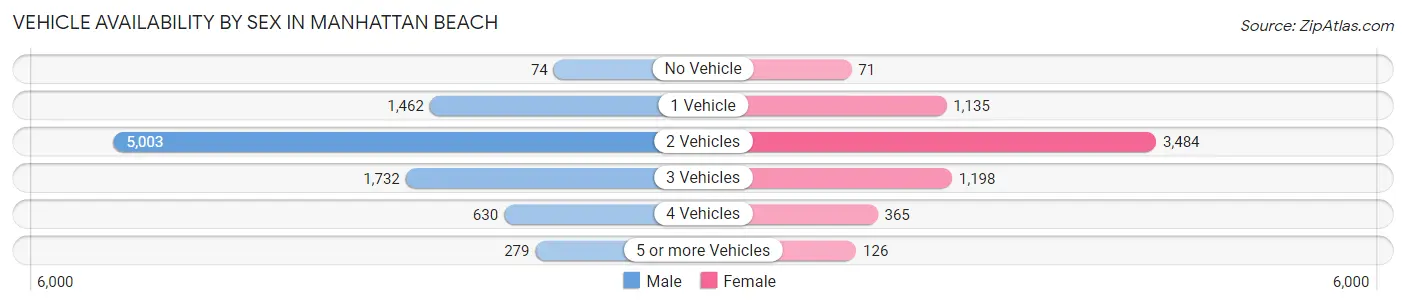
| Vehicles Available | Male | Female |
| No Vehicle | 74 (0.8%) | 71 (1.1%) |
| 1 Vehicle | 1,462 (15.9%) | 1,135 (17.8%) |
| 2 Vehicles | 5,003 (54.5%) | 3,484 (54.6%) |
| 3 Vehicles | 1,732 (18.9%) | 1,198 (18.8%) |
| 4 Vehicles | 630 (6.9%) | 365 (5.7%) |
| 5 or more Vehicles | 279 (3.0%) | 126 (2.0%) |
| Total | 9,180 (100.0%) | 6,379 (100.0%) |
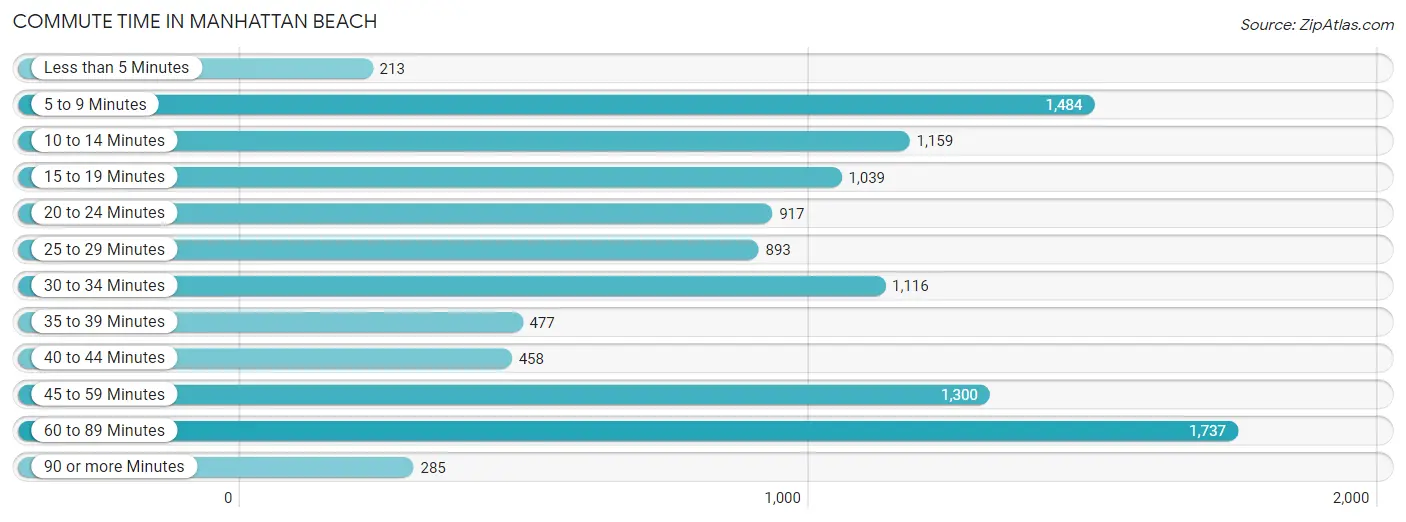
Commute Time in Manhattan Beach
The most frequently occuring commute durations in Manhattan Beach are 60 to 89 minutes (1,737 commuters, 15.7%), 5 to 9 minutes (1,484 commuters, 13.4%), and 45 to 59 minutes (1,300 commuters, 11.7%).
| Commute Time | # Commuters | % Commuters |
| Less than 5 Minutes | 213 | 1.9% |
| 5 to 9 Minutes | 1,484 | 13.4% |
| 10 to 14 Minutes | 1,159 | 10.5% |
| 15 to 19 Minutes | 1,039 | 9.4% |
| 20 to 24 Minutes | 917 | 8.3% |
| 25 to 29 Minutes | 893 | 8.1% |
| 30 to 34 Minutes | 1,116 | 10.1% |
| 35 to 39 Minutes | 477 | 4.3% |
| 40 to 44 Minutes | 458 | 4.1% |
| 45 to 59 Minutes | 1,300 | 11.7% |
| 60 to 89 Minutes | 1,737 | 15.7% |
| 90 or more Minutes | 285 | 2.6% |
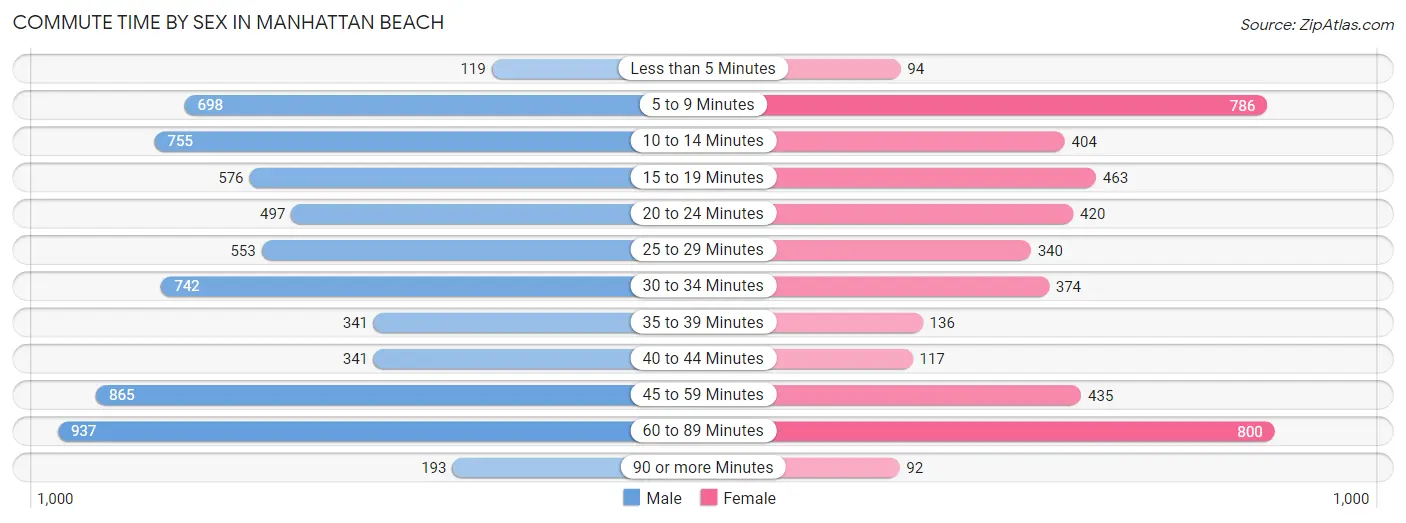
Commute Time by Sex in Manhattan Beach
The most common commute times in Manhattan Beach are 60 to 89 minutes (937 commuters, 14.2%) for males and 60 to 89 minutes (800 commuters, 17.9%) for females.
| Commute Time | Male | Female |
| Less than 5 Minutes | 119 (1.8%) | 94 (2.1%) |
| 5 to 9 Minutes | 698 (10.5%) | 786 (17.6%) |
| 10 to 14 Minutes | 755 (11.4%) | 404 (9.1%) |
| 15 to 19 Minutes | 576 (8.7%) | 463 (10.4%) |
| 20 to 24 Minutes | 497 (7.5%) | 420 (9.4%) |
| 25 to 29 Minutes | 553 (8.4%) | 340 (7.6%) |
| 30 to 34 Minutes | 742 (11.2%) | 374 (8.4%) |
| 35 to 39 Minutes | 341 (5.1%) | 136 (3.0%) |
| 40 to 44 Minutes | 341 (5.1%) | 117 (2.6%) |
| 45 to 59 Minutes | 865 (13.1%) | 435 (9.8%) |
| 60 to 89 Minutes | 937 (14.2%) | 800 (17.9%) |
| 90 or more Minutes | 193 (2.9%) | 92 (2.1%) |
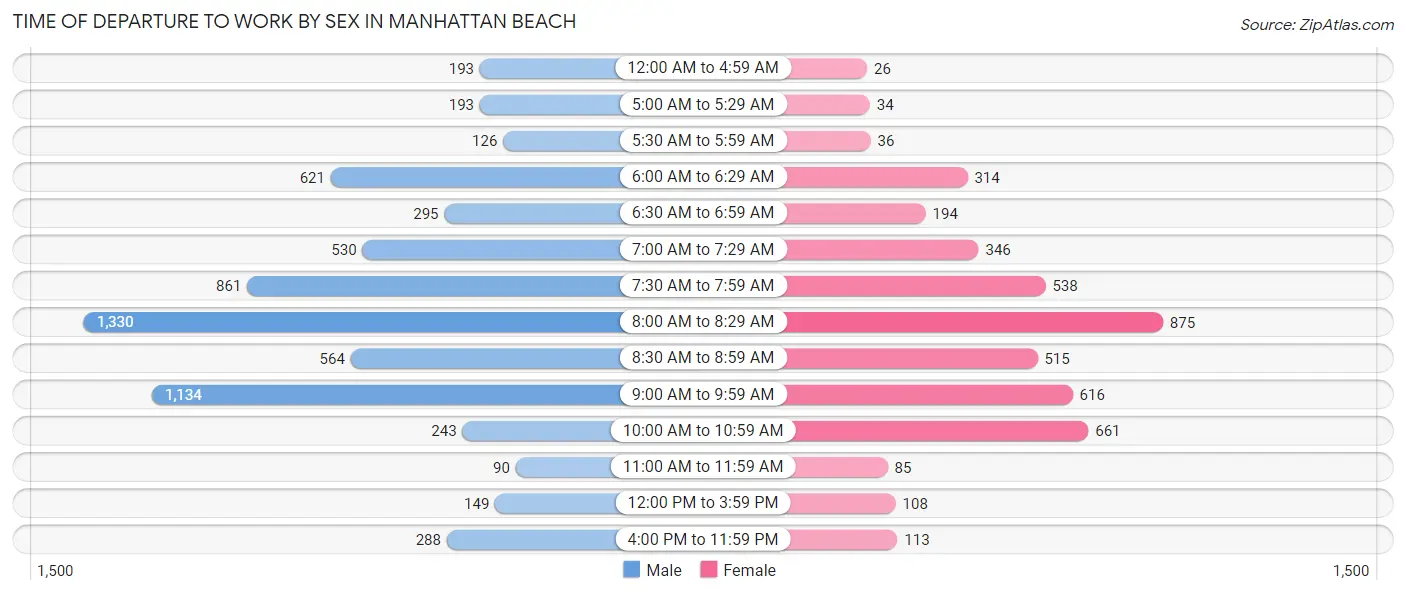
Time of Departure to Work by Sex in Manhattan Beach
The most frequent times of departure to work in Manhattan Beach are 8:00 AM to 8:29 AM (1,330, 20.1%) for males and 8:00 AM to 8:29 AM (875, 19.6%) for females.
| Time of Departure | Male | Female |
| 12:00 AM to 4:59 AM | 193 (2.9%) | 26 (0.6%) |
| 5:00 AM to 5:29 AM | 193 (2.9%) | 34 (0.8%) |
| 5:30 AM to 5:59 AM | 126 (1.9%) | 36 (0.8%) |
| 6:00 AM to 6:29 AM | 621 (9.4%) | 314 (7.0%) |
| 6:30 AM to 6:59 AM | 295 (4.5%) | 194 (4.3%) |
| 7:00 AM to 7:29 AM | 530 (8.0%) | 346 (7.8%) |
| 7:30 AM to 7:59 AM | 861 (13.0%) | 538 (12.1%) |
| 8:00 AM to 8:29 AM | 1,330 (20.1%) | 875 (19.6%) |
| 8:30 AM to 8:59 AM | 564 (8.5%) | 515 (11.5%) |
| 9:00 AM to 9:59 AM | 1,134 (17.1%) | 616 (13.8%) |
| 10:00 AM to 10:59 AM | 243 (3.7%) | 661 (14.8%) |
| 11:00 AM to 11:59 AM | 90 (1.4%) | 85 (1.9%) |
| 12:00 PM to 3:59 PM | 149 (2.2%) | 108 (2.4%) |
| 4:00 PM to 11:59 PM | 288 (4.3%) | 113 (2.5%) |
| Total | 6,617 (100.0%) | 4,461 (100.0%) |
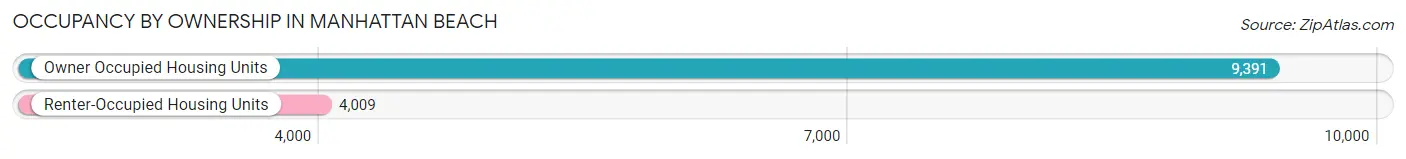
Housing Occupancy in Manhattan Beach
Occupancy by Ownership in Manhattan Beach
Of the total 13,400 dwellings in Manhattan Beach, owner-occupied units account for 9,391 (70.1%), while renter-occupied units make up 4,009 (29.9%).
| Occupancy | # Housing Units | % Housing Units |
| Owner Occupied Housing Units | 9,391 | 70.1% |
| Renter-Occupied Housing Units | 4,009 | 29.9% |
| Total Occupied Housing Units | 13,400 | 100.0% |
Occupancy by Household Size in Manhattan Beach
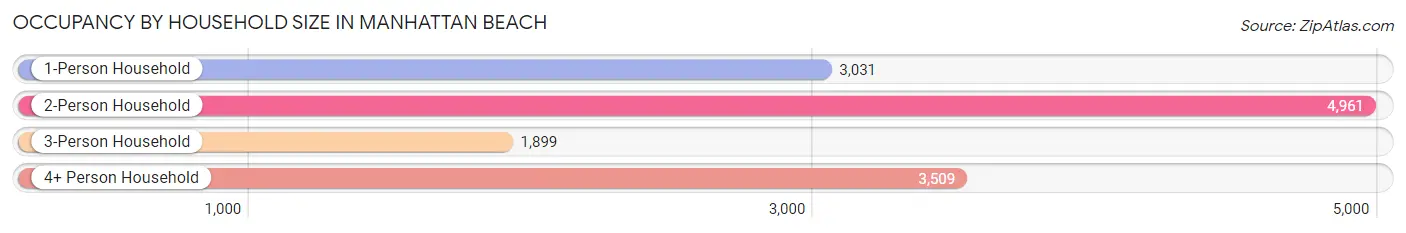
| Household Size | # Housing Units | % Housing Units |
| 1-Person Household | 3,031 | 22.6% |
| 2-Person Household | 4,961 | 37.0% |
| 3-Person Household | 1,899 | 14.2% |
| 4+ Person Household | 3,509 | 26.2% |
| Total Housing Units | 13,400 | 100.0% |
Occupancy by Ownership by Household Size in Manhattan Beach
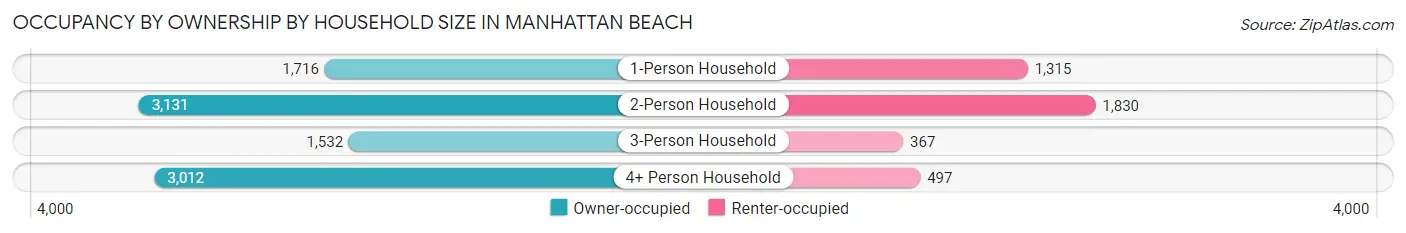
| Household Size | Owner-occupied | Renter-occupied |
| 1-Person Household | 1,716 (56.6%) | 1,315 (43.4%) |
| 2-Person Household | 3,131 (63.1%) | 1,830 (36.9%) |
| 3-Person Household | 1,532 (80.7%) | 367 (19.3%) |
| 4+ Person Household | 3,012 (85.8%) | 497 (14.2%) |
| Total Housing Units | 9,391 (70.1%) | 4,009 (29.9%) |
Occupancy by Educational Attainment in Manhattan Beach
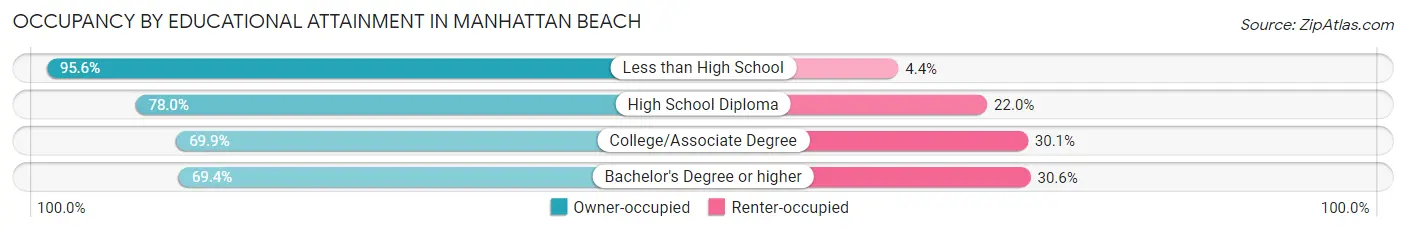
| Household Size | Owner-occupied | Renter-occupied |
| Less than High School | 152 (95.6%) | 7 (4.4%) |
| High School Diploma | 351 (78.0%) | 99 (22.0%) |
| College/Associate Degree | 1,409 (69.9%) | 606 (30.1%) |
| Bachelor's Degree or higher | 7,479 (69.4%) | 3,297 (30.6%) |
Occupancy by Age of Householder in Manhattan Beach
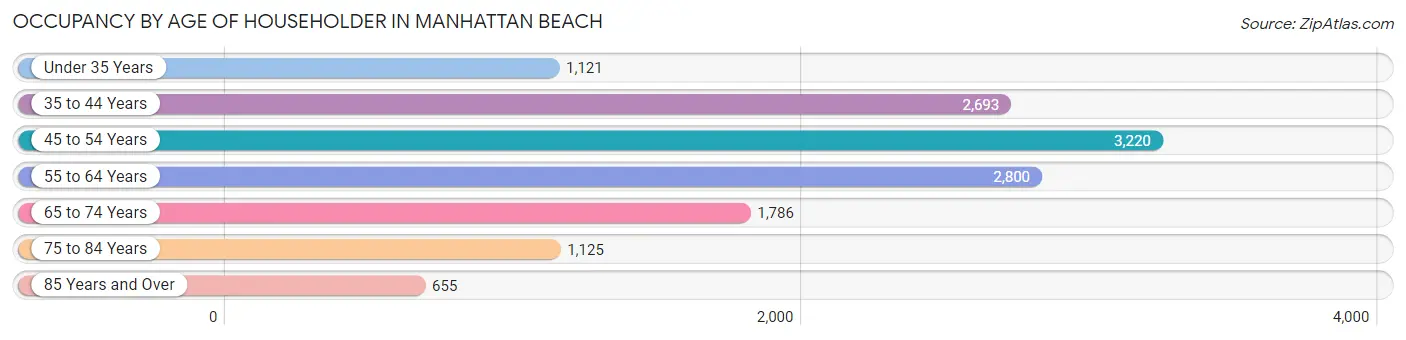
| Age Bracket | # Households | % Households |
| Under 35 Years | 1,121 | 8.4% |
| 35 to 44 Years | 2,693 | 20.1% |
| 45 to 54 Years | 3,220 | 24.0% |
| 55 to 64 Years | 2,800 | 20.9% |
| 65 to 74 Years | 1,786 | 13.3% |
| 75 to 84 Years | 1,125 | 8.4% |
| 85 Years and Over | 655 | 4.9% |
| Total | 13,400 | 100.0% |
Housing Finances in Manhattan Beach
Median Income by Occupancy in Manhattan Beach
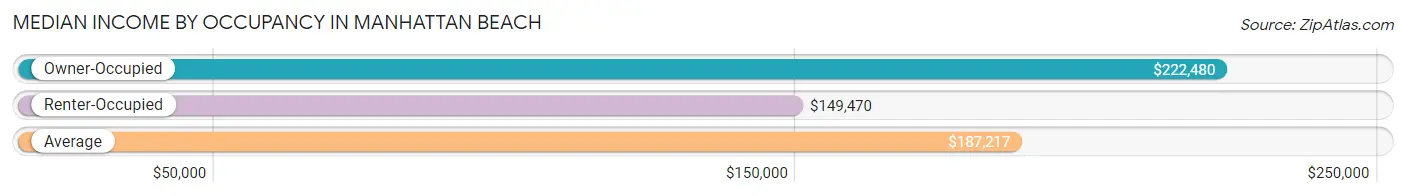
| Occupancy Type | # Households | Median Income |
| Owner-Occupied | 9,391 (70.1%) | $222,480 |
| Renter-Occupied | 4,009 (29.9%) | $149,470 |
| Average | 13,400 (100.0%) | $187,217 |
Occupancy by Householder Income Bracket in Manhattan Beach
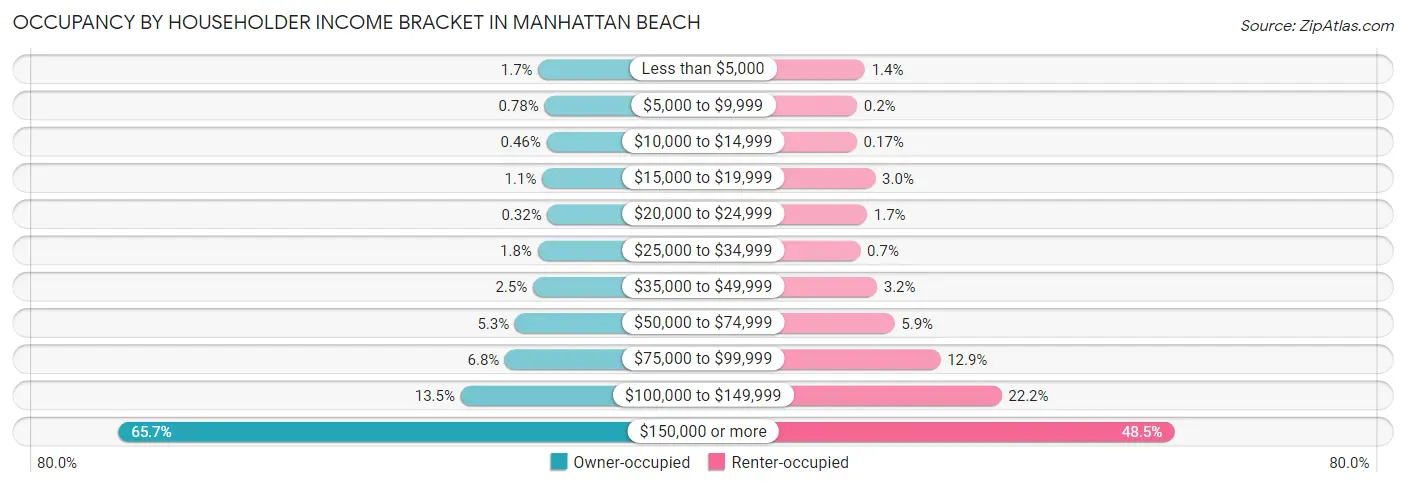
| Income Bracket | Owner-occupied | Renter-occupied |
| Less than $5,000 | 160 (1.7%) | 56 (1.4%) |
| $5,000 to $9,999 | 73 (0.8%) | 8 (0.2%) |
| $10,000 to $14,999 | 43 (0.5%) | 7 (0.2%) |
| $15,000 to $19,999 | 105 (1.1%) | 120 (3.0%) |
| $20,000 to $24,999 | 30 (0.3%) | 69 (1.7%) |
| $25,000 to $34,999 | 170 (1.8%) | 28 (0.7%) |
| $35,000 to $49,999 | 237 (2.5%) | 130 (3.2%) |
| $50,000 to $74,999 | 494 (5.3%) | 237 (5.9%) |
| $75,000 to $99,999 | 636 (6.8%) | 517 (12.9%) |
| $100,000 to $149,999 | 1,271 (13.5%) | 891 (22.2%) |
| $150,000 or more | 6,172 (65.7%) | 1,946 (48.5%) |
| Total | 9,391 (100.0%) | 4,009 (100.0%) |
Monthly Housing Cost Tiers in Manhattan Beach
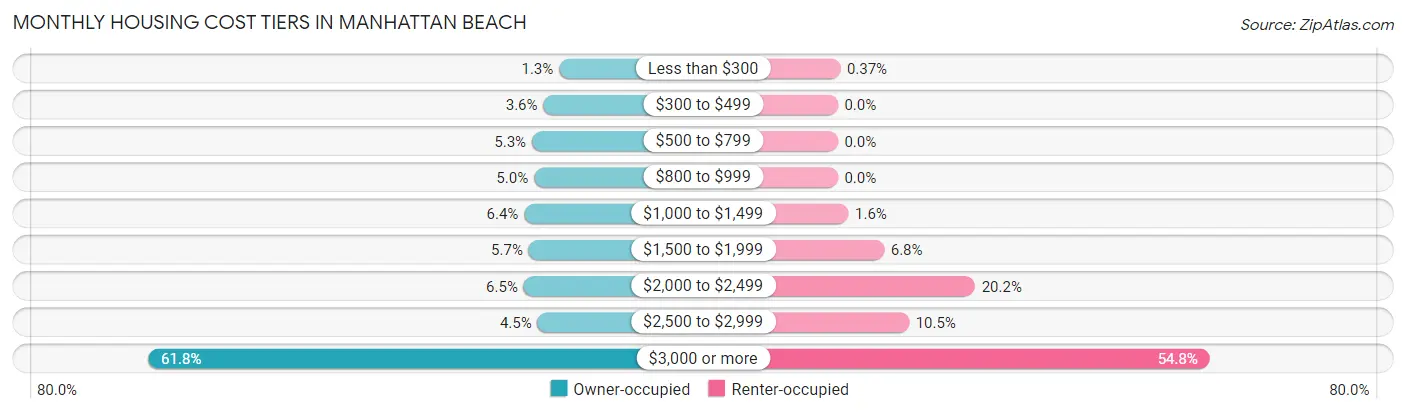
| Monthly Cost | Owner-occupied | Renter-occupied |
| Less than $300 | 119 (1.3%) | 15 (0.4%) |
| $300 to $499 | 337 (3.6%) | 0 (0.0%) |
| $500 to $799 | 495 (5.3%) | 0 (0.0%) |
| $800 to $999 | 467 (5.0%) | 0 (0.0%) |
| $1,000 to $1,499 | 602 (6.4%) | 63 (1.6%) |
| $1,500 to $1,999 | 539 (5.7%) | 274 (6.8%) |
| $2,000 to $2,499 | 609 (6.5%) | 811 (20.2%) |
| $2,500 to $2,999 | 418 (4.4%) | 421 (10.5%) |
| $3,000 or more | 5,805 (61.8%) | 2,198 (54.8%) |
| Total | 9,391 (100.0%) | 4,009 (100.0%) |
Physical Housing Characteristics in Manhattan Beach
Housing Structures in Manhattan Beach
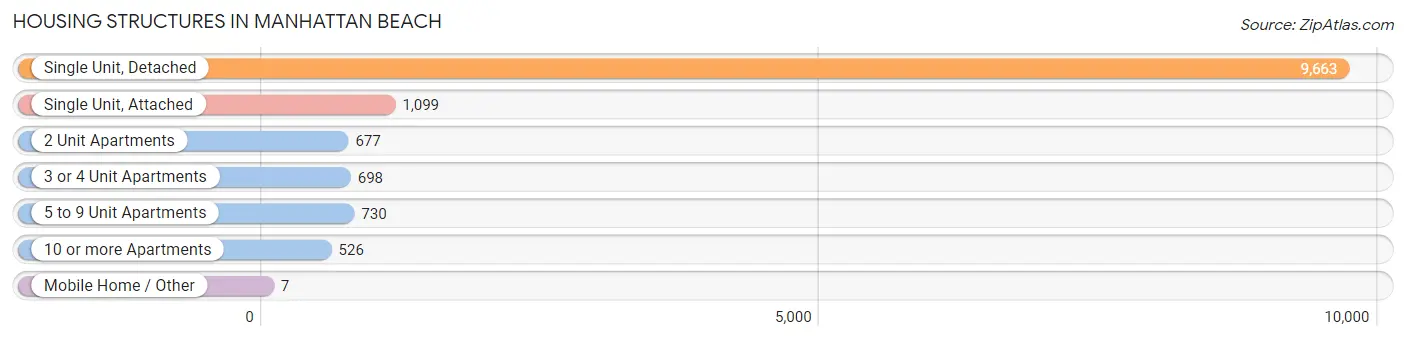
| Structure Type | # Housing Units | % Housing Units |
| Single Unit, Detached | 9,663 | 72.1% |
| Single Unit, Attached | 1,099 | 8.2% |
| 2 Unit Apartments | 677 | 5.1% |
| 3 or 4 Unit Apartments | 698 | 5.2% |
| 5 to 9 Unit Apartments | 730 | 5.4% |
| 10 or more Apartments | 526 | 3.9% |
| Mobile Home / Other | 7 | 0.1% |
| Total | 13,400 | 100.0% |
Housing Structures by Occupancy in Manhattan Beach
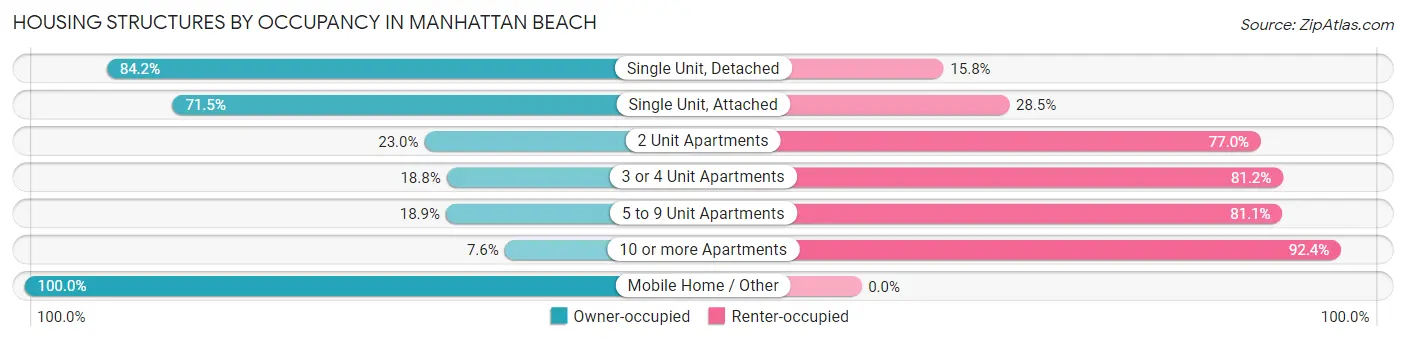
| Structure Type | Owner-occupied | Renter-occupied |
| Single Unit, Detached | 8,133 (84.2%) | 1,530 (15.8%) |
| Single Unit, Attached | 786 (71.5%) | 313 (28.5%) |
| 2 Unit Apartments | 156 (23.0%) | 521 (77.0%) |
| 3 or 4 Unit Apartments | 131 (18.8%) | 567 (81.2%) |
| 5 to 9 Unit Apartments | 138 (18.9%) | 592 (81.1%) |
| 10 or more Apartments | 40 (7.6%) | 486 (92.4%) |
| Mobile Home / Other | 7 (100.0%) | 0 (0.0%) |
| Total | 9,391 (70.1%) | 4,009 (29.9%) |
Housing Structures by Number of Rooms in Manhattan Beach
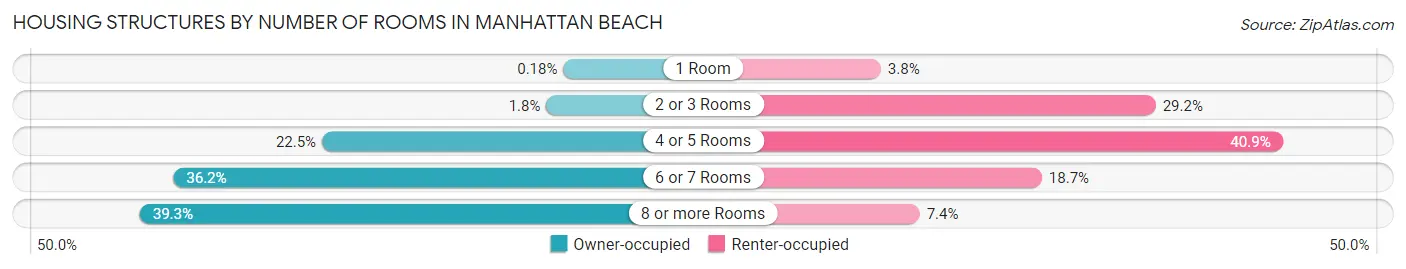
| Number of Rooms | Owner-occupied | Renter-occupied |
| 1 Room | 17 (0.2%) | 152 (3.8%) |
| 2 or 3 Rooms | 164 (1.8%) | 1,171 (29.2%) |
| 4 or 5 Rooms | 2,113 (22.5%) | 1,641 (40.9%) |
| 6 or 7 Rooms | 3,403 (36.2%) | 749 (18.7%) |
| 8 or more Rooms | 3,694 (39.3%) | 296 (7.4%) |
| Total | 9,391 (100.0%) | 4,009 (100.0%) |
Housing Structure by Heating Type in Manhattan Beach
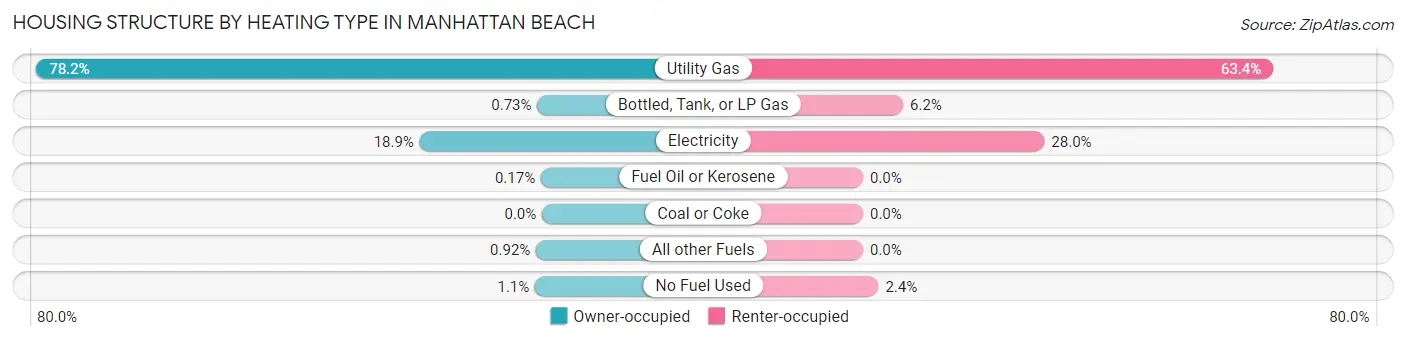
| Heating Type | Owner-occupied | Renter-occupied |
| Utility Gas | 7,342 (78.2%) | 2,541 (63.4%) |
| Bottled, Tank, or LP Gas | 69 (0.7%) | 248 (6.2%) |
| Electricity | 1,777 (18.9%) | 1,124 (28.0%) |
| Fuel Oil or Kerosene | 16 (0.2%) | 0 (0.0%) |
| Coal or Coke | 0 (0.0%) | 0 (0.0%) |
| All other Fuels | 86 (0.9%) | 0 (0.0%) |
| No Fuel Used | 101 (1.1%) | 96 (2.4%) |
| Total | 9,391 (100.0%) | 4,009 (100.0%) |
Household Vehicle Usage in Manhattan Beach
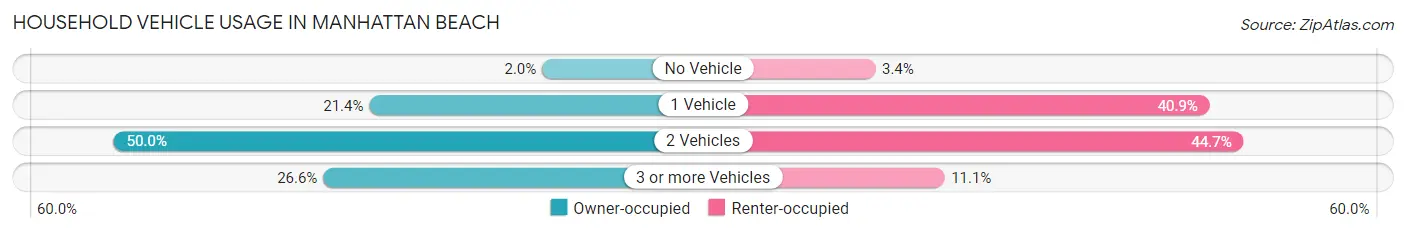
| Vehicles per Household | Owner-occupied | Renter-occupied |
| No Vehicle | 191 (2.0%) | 135 (3.4%) |
| 1 Vehicle | 2,009 (21.4%) | 1,638 (40.9%) |
| 2 Vehicles | 4,698 (50.0%) | 1,790 (44.7%) |
| 3 or more Vehicles | 2,493 (26.6%) | 446 (11.1%) |
| Total | 9,391 (100.0%) | 4,009 (100.0%) |
Real Estate & Mortgages in Manhattan Beach
Real Estate and Mortgage Overview in Manhattan Beach
| Characteristic | Without Mortgage | With Mortgage |
| Housing Units | 2,885 | 6,506 |
| Median Property Value | $2,000,001 | $2,000,001 |
| Median Household Income | $140,893 | $4,776 |
| Monthly Housing Costs | $1,088 | $5,631 |
| Real Estate Taxes | $7,923 | $66 |
Property Value by Mortgage Status in Manhattan Beach
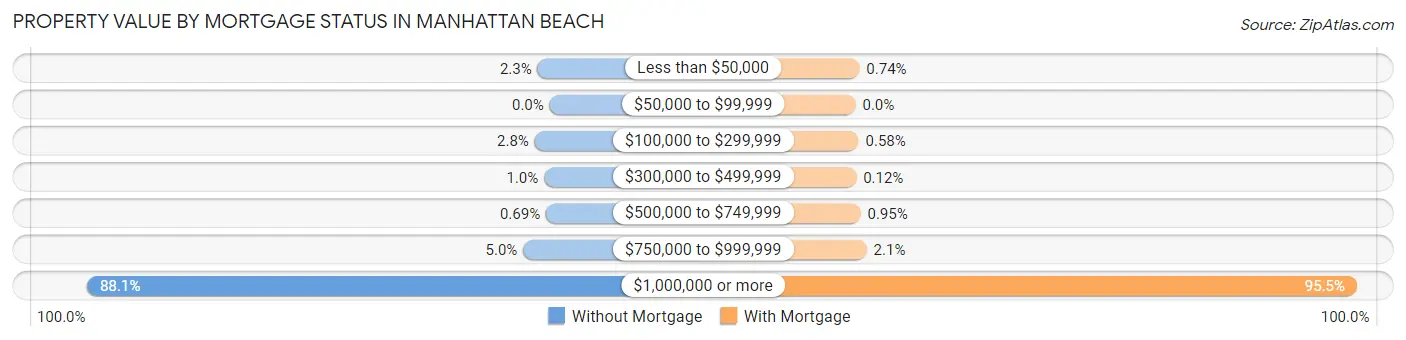
| Property Value | Without Mortgage | With Mortgage |
| Less than $50,000 | 66 (2.3%) | 48 (0.7%) |
| $50,000 to $99,999 | 0 (0.0%) | 0 (0.0%) |
| $100,000 to $299,999 | 82 (2.8%) | 38 (0.6%) |
| $300,000 to $499,999 | 30 (1.0%) | 8 (0.1%) |
| $500,000 to $749,999 | 20 (0.7%) | 62 (0.9%) |
| $750,000 to $999,999 | 145 (5.0%) | 138 (2.1%) |
| $1,000,000 or more | 2,542 (88.1%) | 6,212 (95.5%) |
| Total | 2,885 (100.0%) | 6,506 (100.0%) |
Household Income by Mortgage Status in Manhattan Beach
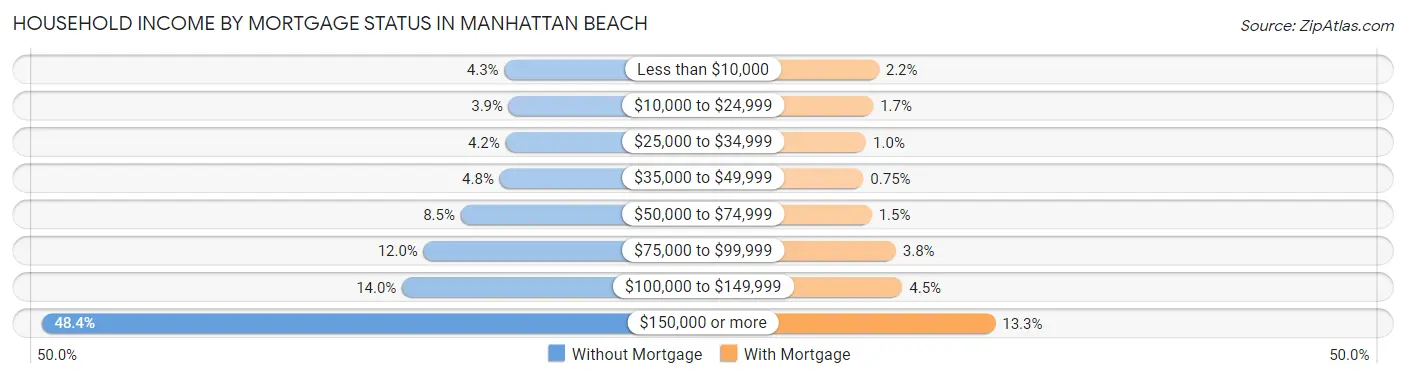
| Household Income | Without Mortgage | With Mortgage |
| Less than $10,000 | 124 (4.3%) | 144 (2.2%) |
| $10,000 to $24,999 | 112 (3.9%) | 109 (1.7%) |
| $25,000 to $34,999 | 121 (4.2%) | 66 (1.0%) |
| $35,000 to $49,999 | 137 (4.8%) | 49 (0.7%) |
| $50,000 to $74,999 | 244 (8.5%) | 100 (1.5%) |
| $75,000 to $99,999 | 346 (12.0%) | 250 (3.8%) |
| $100,000 to $149,999 | 405 (14.0%) | 290 (4.5%) |
| $150,000 or more | 1,396 (48.4%) | 866 (13.3%) |
| Total | 2,885 (100.0%) | 6,506 (100.0%) |
Property Value to Household Income Ratio in Manhattan Beach
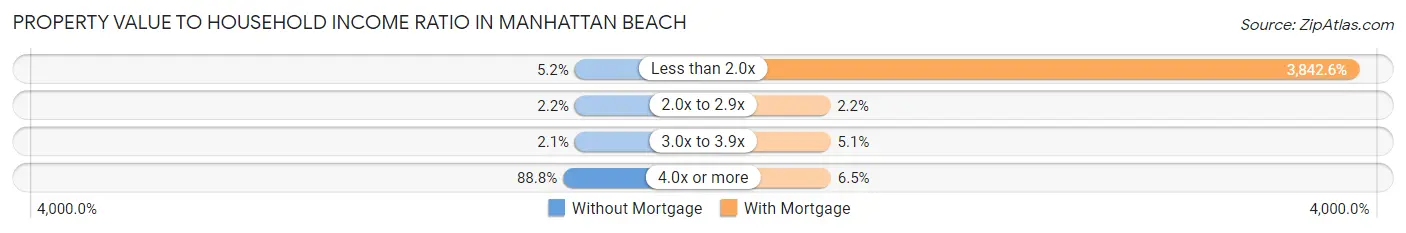
| Value-to-Income Ratio | Without Mortgage | With Mortgage |
| Less than 2.0x | 151 (5.2%) | 250,001 (3,842.6%) |
| 2.0x to 2.9x | 62 (2.1%) | 140 (2.1%) |
| 3.0x to 3.9x | 61 (2.1%) | 332 (5.1%) |
| 4.0x or more | 2,563 (88.8%) | 425 (6.5%) |
| Total | 2,885 (100.0%) | 6,506 (100.0%) |
Real Estate Taxes by Mortgage Status in Manhattan Beach
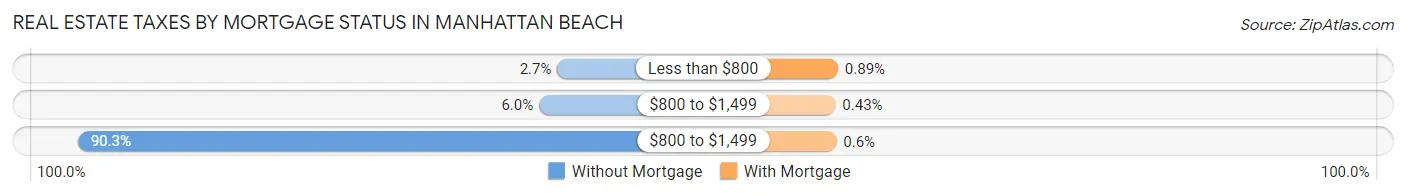
| Property Taxes | Without Mortgage | With Mortgage |
| Less than $800 | 78 (2.7%) | 58 (0.9%) |
| $800 to $1,499 | 174 (6.0%) | 28 (0.4%) |
| $800 to $1,499 | 2,605 (90.3%) | 39 (0.6%) |
| Total | 2,885 (100.0%) | 6,506 (100.0%) |
Health & Disability in Manhattan Beach
Health Insurance Coverage by Age in Manhattan Beach
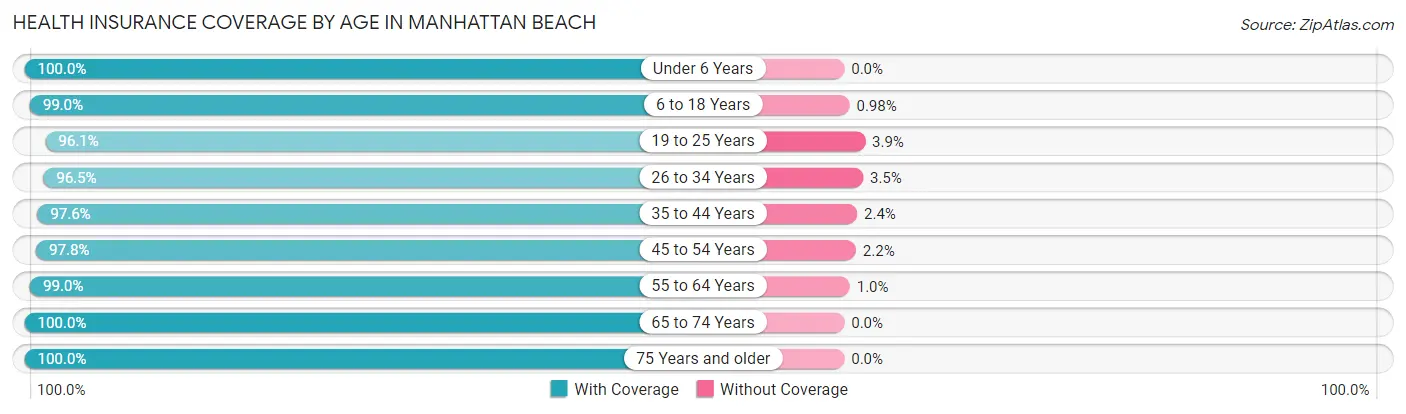
| Age Bracket | With Coverage | Without Coverage |
| Under 6 Years | 2,326 (100.0%) | 0 (0.0%) |
| 6 to 18 Years | 7,378 (99.0%) | 73 (1.0%) |
| 19 to 25 Years | 1,188 (96.1%) | 48 (3.9%) |
| 26 to 34 Years | 2,595 (96.5%) | 94 (3.5%) |
| 35 to 44 Years | 4,607 (97.6%) | 113 (2.4%) |
| 45 to 54 Years | 5,584 (97.8%) | 123 (2.2%) |
| 55 to 64 Years | 5,058 (99.0%) | 52 (1.0%) |
| 65 to 74 Years | 3,247 (100.0%) | 0 (0.0%) |
| 75 Years and older | 2,586 (100.0%) | 0 (0.0%) |
| Total | 34,569 (98.6%) | 503 (1.4%) |
Health Insurance Coverage by Citizenship Status in Manhattan Beach
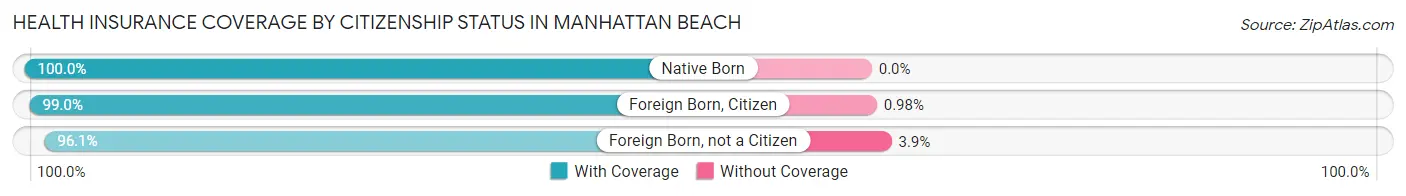
| Citizenship Status | With Coverage | Without Coverage |
| Native Born | 2,326 (100.0%) | 0 (0.0%) |
| Foreign Born, Citizen | 7,378 (99.0%) | 73 (1.0%) |
| Foreign Born, not a Citizen | 1,188 (96.1%) | 48 (3.9%) |
Health Insurance Coverage by Household Income in Manhattan Beach
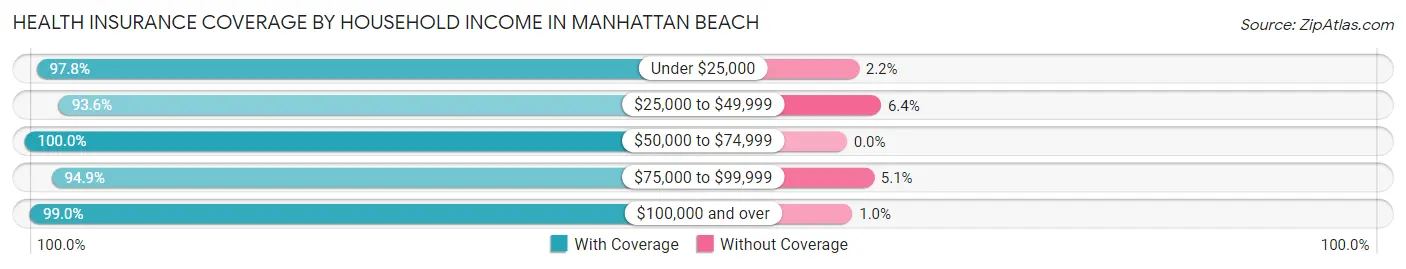
| Household Income | With Coverage | Without Coverage |
| Under $25,000 | 1,049 (97.8%) | 24 (2.2%) |
| $25,000 to $49,999 | 862 (93.6%) | 59 (6.4%) |
| $50,000 to $74,999 | 1,281 (100.0%) | 0 (0.0%) |
| $75,000 to $99,999 | 2,095 (94.9%) | 112 (5.1%) |
| $100,000 and over | 29,246 (99.0%) | 304 (1.0%) |
Public vs Private Health Insurance Coverage by Age in Manhattan Beach
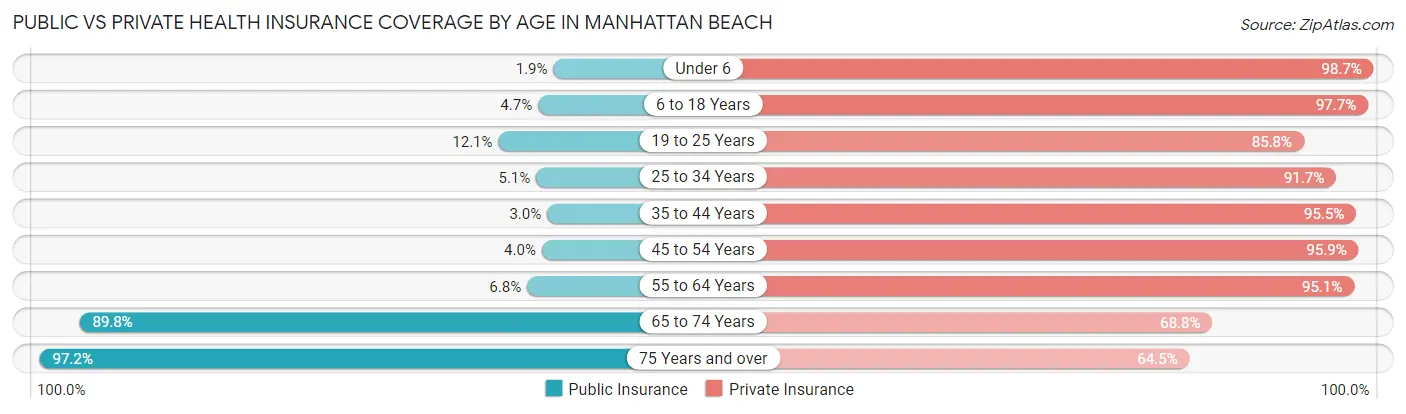
| Age Bracket | Public Insurance | Private Insurance |
| Under 6 | 43 (1.8%) | 2,296 (98.7%) |
| 6 to 18 Years | 351 (4.7%) | 7,277 (97.7%) |
| 19 to 25 Years | 149 (12.1%) | 1,060 (85.8%) |
| 25 to 34 Years | 136 (5.1%) | 2,467 (91.7%) |
| 35 to 44 Years | 143 (3.0%) | 4,506 (95.5%) |
| 45 to 54 Years | 229 (4.0%) | 5,474 (95.9%) |
| 55 to 64 Years | 345 (6.8%) | 4,858 (95.1%) |
| 65 to 74 Years | 2,916 (89.8%) | 2,233 (68.8%) |
| 75 Years and over | 2,514 (97.2%) | 1,669 (64.5%) |
| Total | 6,826 (19.5%) | 31,840 (90.8%) |
Disability Status by Sex by Age in Manhattan Beach
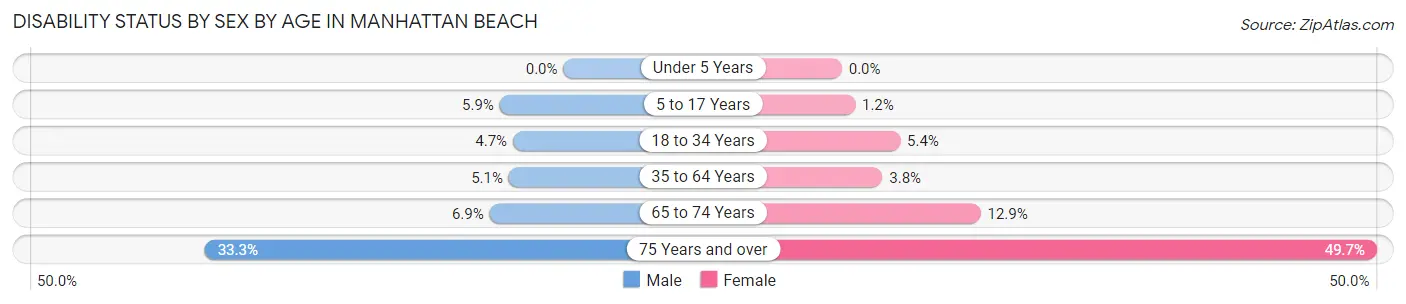
| Age Bracket | Male | Female |
| Under 5 Years | 0 (0.0%) | 0 (0.0%) |
| 5 to 17 Years | 221 (5.9%) | 48 (1.2%) |
| 18 to 34 Years | 111 (4.7%) | 104 (5.4%) |
| 35 to 64 Years | 393 (5.1%) | 292 (3.8%) |
| 65 to 74 Years | 106 (6.9%) | 219 (12.9%) |
| 75 Years and over | 384 (33.3%) | 711 (49.6%) |
Disability Class by Sex by Age in Manhattan Beach
Disability Class: Hearing Difficulty
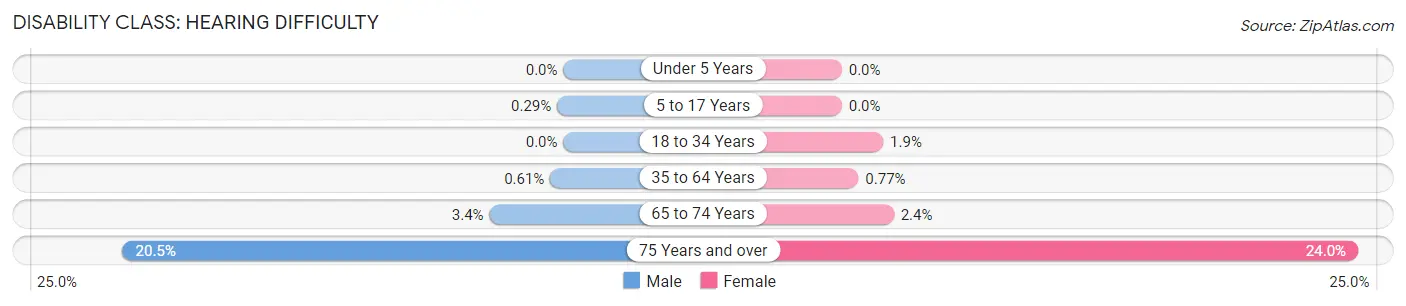
| Age Bracket | Male | Female |
| Under 5 Years | 0 (0.0%) | 0 (0.0%) |
| 5 to 17 Years | 11 (0.3%) | 0 (0.0%) |
| 18 to 34 Years | 0 (0.0%) | 37 (1.9%) |
| 35 to 64 Years | 47 (0.6%) | 60 (0.8%) |
| 65 to 74 Years | 53 (3.4%) | 41 (2.4%) |
| 75 Years and over | 236 (20.4%) | 343 (23.9%) |
Disability Class: Vision Difficulty
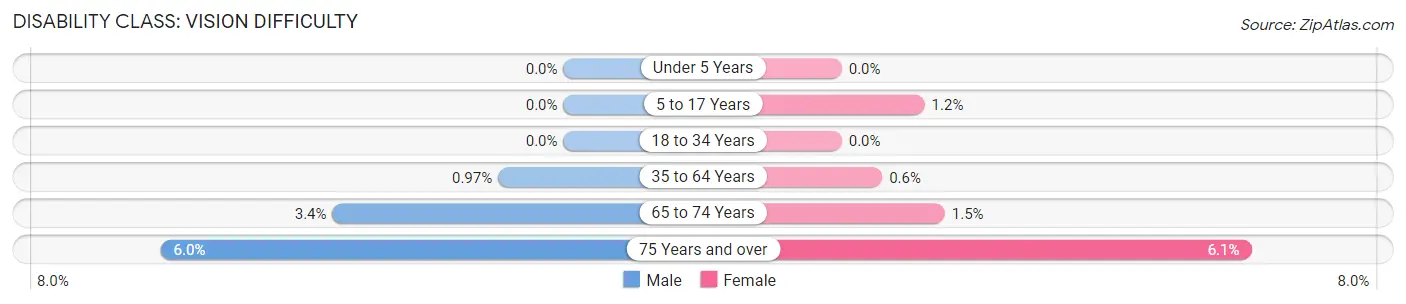
| Age Bracket | Male | Female |
| Under 5 Years | 0 (0.0%) | 0 (0.0%) |
| 5 to 17 Years | 0 (0.0%) | 48 (1.2%) |
| 18 to 34 Years | 0 (0.0%) | 0 (0.0%) |
| 35 to 64 Years | 75 (1.0%) | 47 (0.6%) |
| 65 to 74 Years | 53 (3.4%) | 26 (1.5%) |
| 75 Years and over | 69 (6.0%) | 87 (6.1%) |
Disability Class: Cognitive Difficulty
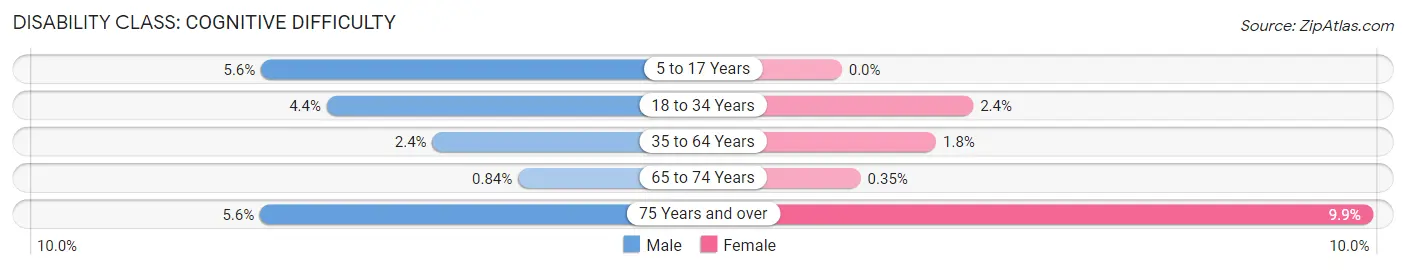
| Age Bracket | Male | Female |
| 5 to 17 Years | 210 (5.6%) | 0 (0.0%) |
| 18 to 34 Years | 104 (4.4%) | 47 (2.4%) |
| 35 to 64 Years | 189 (2.4%) | 136 (1.8%) |
| 65 to 74 Years | 13 (0.8%) | 6 (0.4%) |
| 75 Years and over | 65 (5.6%) | 141 (9.9%) |
Disability Class: Ambulatory Difficulty
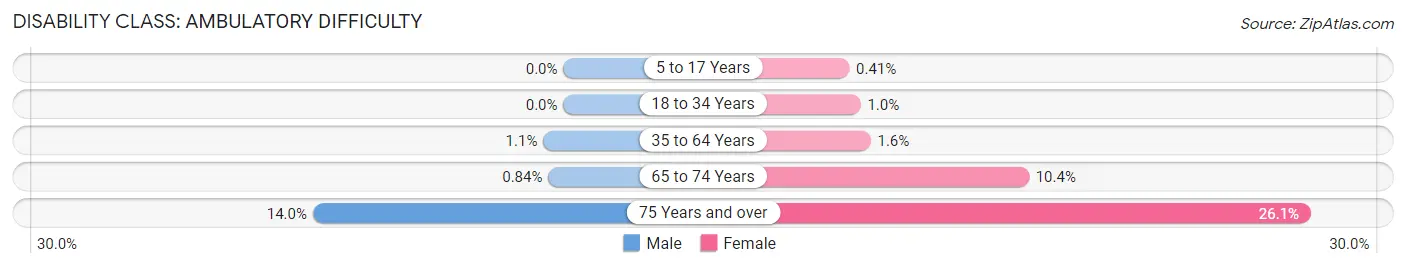
| Age Bracket | Male | Female |
| 5 to 17 Years | 0 (0.0%) | 16 (0.4%) |
| 18 to 34 Years | 0 (0.0%) | 20 (1.0%) |
| 35 to 64 Years | 87 (1.1%) | 124 (1.6%) |
| 65 to 74 Years | 13 (0.8%) | 177 (10.4%) |
| 75 Years and over | 161 (14.0%) | 374 (26.1%) |
Disability Class: Self-Care Difficulty
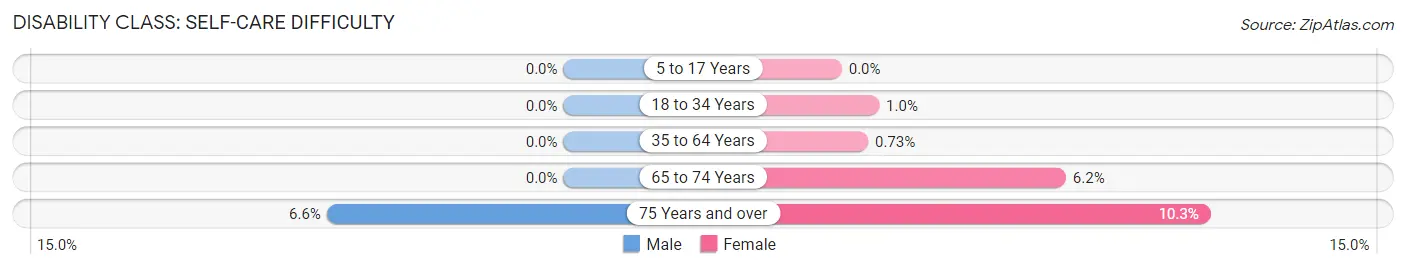
| Age Bracket | Male | Female |
| 5 to 17 Years | 0 (0.0%) | 0 (0.0%) |
| 18 to 34 Years | 0 (0.0%) | 20 (1.0%) |
| 35 to 64 Years | 0 (0.0%) | 57 (0.7%) |
| 65 to 74 Years | 0 (0.0%) | 106 (6.2%) |
| 75 Years and over | 76 (6.6%) | 147 (10.3%) |
Technology Access in Manhattan Beach
Computing Device Access in Manhattan Beach
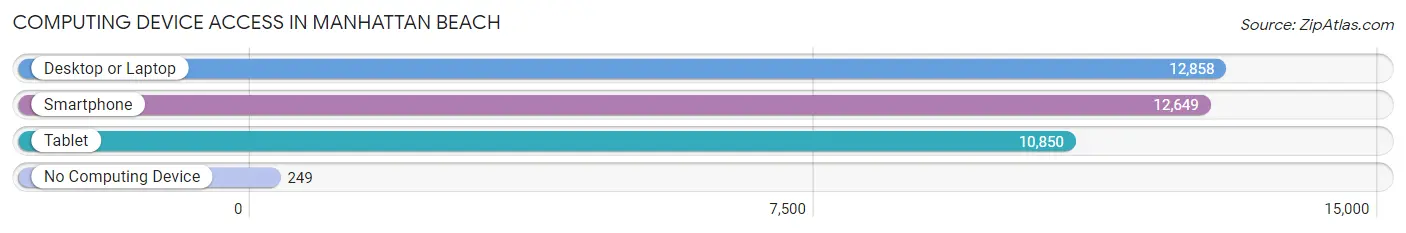
| Device Type | # Households | % Households |
| Desktop or Laptop | 12,858 | 96.0% |
| Smartphone | 12,649 | 94.4% |
| Tablet | 10,850 | 81.0% |
| No Computing Device | 249 | 1.9% |
| Total | 13,400 | 100.0% |
Internet Access in Manhattan Beach
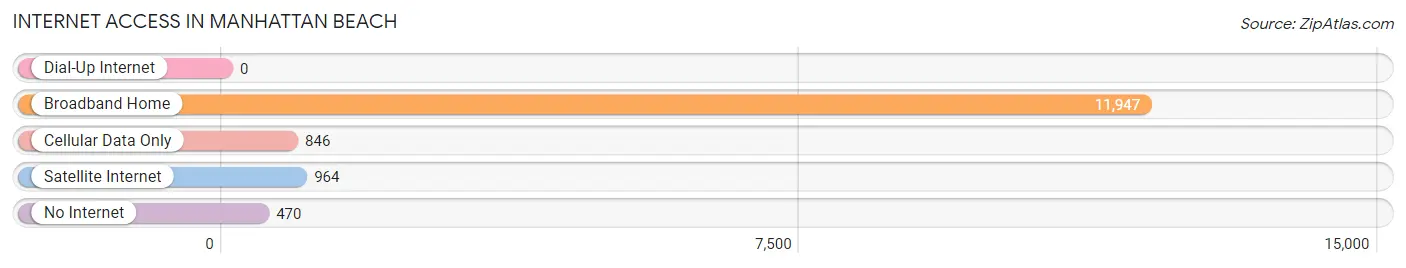
| Internet Type | # Households | % Households |
| Dial-Up Internet | 0 | 0.0% |
| Broadband Home | 11,947 | 89.2% |
| Cellular Data Only | 846 | 6.3% |
| Satellite Internet | 964 | 7.2% |
| No Internet | 470 | 3.5% |
| Total | 13,400 | 100.0% |
Manhattan Beach Summary
Manhattan Beach is a city located in the South Bay region of Los Angeles County, California. It is bordered by the cities of Hermosa Beach to the north, Redondo Beach to the south, and El Segundo to the east. The city is known for its beautiful beaches, excellent surfing, and laid-back atmosphere.
History
The area that is now Manhattan Beach was originally inhabited by the Tongva Native American tribe. The first Europeans to explore the area were Spanish explorers in the late 1700s. The area was later developed by the Dominguez family, who were granted the land in 1822. The city was officially founded in 1912 and was named after the New York City borough of Manhattan.
Geography
Manhattan Beach is located in the South Bay region of Los Angeles County, California. It is bordered by the cities of Hermosa Beach to the north, Redondo Beach to the south, and El Segundo to the east. The city is situated on the Pacific Ocean and is home to several popular beaches, including Manhattan Beach, El Porto, and Dockweiler Beach. The city covers an area of 5.5 square miles and has a population of 35,135 as of the 2010 census.
Economy
Manhattan Beach is a popular tourist destination and is home to a variety of businesses, including restaurants, retail stores, and hotels. The city is also home to several corporate headquarters, including Skechers USA, Inc., and the Northrop Grumman Corporation. The city’s economy is largely driven by tourism, with visitors coming to enjoy the city’s beaches, surfing, and laid-back atmosphere.
Demographics
As of the 2010 census, Manhattan Beach had a population of 35,135. The racial makeup of the city was 79.2% White, 8.2% Asian, 6.2% Hispanic or Latino, and 4.3% African American. The median household income was $118,844, and the median age was 42.7 years. The city is home to a variety of religious denominations, including Catholic, Protestant, Jewish, and Muslim.
Manhattan Beach is a popular tourist destination and is known for its beautiful beaches, excellent surfing, and laid-back atmosphere. The city is home to a variety of businesses, corporate headquarters, and religious denominations. The city’s economy is largely driven by tourism, and the population is diverse and well-educated. Manhattan Beach is a great place to live, work, and play.
Common Questions
What is Per Capita Income in Manhattan Beach?
Per Capita income in Manhattan Beach is $108,762.
What is the Median Family Income in Manhattan Beach?
Median Family Income in Manhattan Beach is $236,009.
What is the Median Household income in Manhattan Beach?
Median Household Income in Manhattan Beach is $187,217.
What is Income or Wage Gap in Manhattan Beach?
Income or Wage Gap in Manhattan Beach is 38.8%.
Women in Manhattan Beach earn 61.2 cents for every dollar earned by a man.
What is Family Income Deficit in Manhattan Beach?
Family Income Deficit in Manhattan Beach is $10,959.
Families that are below poverty line in Manhattan Beach earn $10,959 less on average than the poverty threshold level.
What is Inequality or Gini Index in Manhattan Beach?
Inequality or Gini Index in Manhattan Beach is 0.47.
What is the Total Population of Manhattan Beach?
Total Population of Manhattan Beach is 35,123.
What is the Total Male Population of Manhattan Beach?
Total Male Population of Manhattan Beach is 17,536.
What is the Total Female Population of Manhattan Beach?
Total Female Population of Manhattan Beach is 17,587.
What is the Ratio of Males per 100 Females in Manhattan Beach?
There are 99.71 Males per 100 Females in Manhattan Beach.
What is the Ratio of Females per 100 Males in Manhattan Beach?
There are 100.29 Females per 100 Males in Manhattan Beach.
What is the Median Population Age in Manhattan Beach?
Median Population Age in Manhattan Beach is 43.4 Years.
What is the Average Family Size in Manhattan Beach
Average Family Size in Manhattan Beach is 3.1 People.
What is the Average Household Size in Manhattan Beach
Average Household Size in Manhattan Beach is 2.6 People.
How Large is the Labor Force in Manhattan Beach?
There are 16,672 People in the Labor Forcein in Manhattan Beach.
What is the Percentage of People in the Labor Force in Manhattan Beach?
61.3% of People are in the Labor Force in Manhattan Beach.
What is the Unemployment Rate in Manhattan Beach?
Unemployment Rate in Manhattan Beach is 3.8%.