Callender, CA Map & Demographics
Callender Map
Callender Overview
$56,540
PER CAPITA INCOME
$156,909
AVG FAMILY INCOME
$155,677
AVG HOUSEHOLD INCOME
46.2%
WAGE / INCOME GAP [ % ]
53.8¢/ $1
WAGE / INCOME GAP [ $ ]
0.34
INEQUALITY / GINI INDEX
2,444
TOTAL POPULATION
1,270
MALE POPULATION
1,174
FEMALE POPULATION
108.18
MALES / 100 FEMALES
92.44
FEMALES / 100 MALES
38.3
MEDIAN AGE
3.1
AVG FAMILY SIZE
2.8
AVG HOUSEHOLD SIZE
1,401
LABOR FORCE [ PEOPLE ]
74.9%
PERCENT IN LABOR FORCE
Income in Callender
Income Overview in Callender
Per Capita Income in Callender is $56,540, while median incomes of families and households are $156,909 and $155,677 respectively.
| Characteristic | Number | Measure |
| Per Capita Income | 2,444 | $56,540 |
| Median Family Income | 688 | $156,909 |
| Mean Family Income | 688 | $198,491 |
| Median Household Income | 863 | $155,677 |
| Mean Household Income | 863 | $178,612 |
| Income Deficit | 688 | $0 |
| Wage / Income Gap (%) | 2,444 | 46.17% |
| Wage / Income Gap ($) | 2,444 | 53.83¢ per $1 |
| Gini / Inequality Index | 2,444 | 0.34 |
Earnings by Sex in Callender
Average Earnings in Callender are $68,000, $80,296 for men and $43,225 for women, a difference of 46.2%.
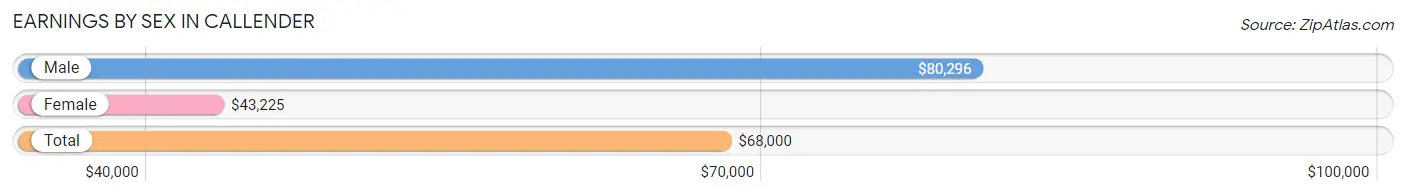
| Sex | Number | Average Earnings |
| Male | 829 (59.1%) | $80,296 |
| Female | 573 (40.9%) | $43,225 |
| Total | 1,402 (100.0%) | $68,000 |
Earnings by Sex by Income Bracket in Callender
The most common earnings brackets in Callender are $100,000+ for men (250 | 30.2%) and $100,000+ for women (144 | 25.1%).
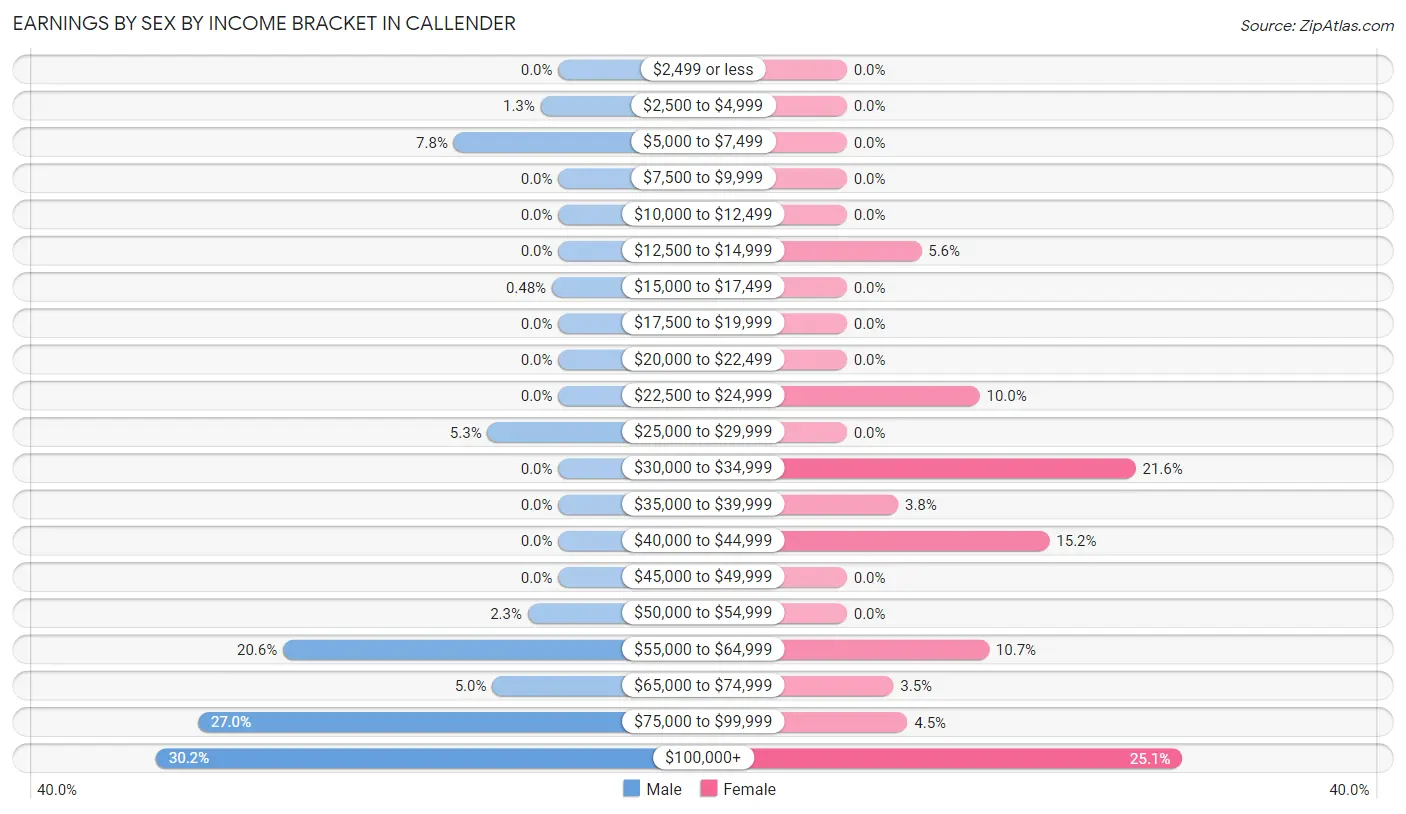
| Income | Male | Female |
| $2,499 or less | 0 (0.0%) | 0 (0.0%) |
| $2,500 to $4,999 | 11 (1.3%) | 0 (0.0%) |
| $5,000 to $7,499 | 65 (7.8%) | 0 (0.0%) |
| $7,500 to $9,999 | 0 (0.0%) | 0 (0.0%) |
| $10,000 to $12,499 | 0 (0.0%) | 0 (0.0%) |
| $12,500 to $14,999 | 0 (0.0%) | 32 (5.6%) |
| $15,000 to $17,499 | 4 (0.5%) | 0 (0.0%) |
| $17,500 to $19,999 | 0 (0.0%) | 0 (0.0%) |
| $20,000 to $22,499 | 0 (0.0%) | 0 (0.0%) |
| $22,500 to $24,999 | 0 (0.0%) | 57 (10.0%) |
| $25,000 to $29,999 | 44 (5.3%) | 0 (0.0%) |
| $30,000 to $34,999 | 0 (0.0%) | 124 (21.6%) |
| $35,000 to $39,999 | 0 (0.0%) | 22 (3.8%) |
| $40,000 to $44,999 | 0 (0.0%) | 87 (15.2%) |
| $45,000 to $49,999 | 0 (0.0%) | 0 (0.0%) |
| $50,000 to $54,999 | 19 (2.3%) | 0 (0.0%) |
| $55,000 to $64,999 | 171 (20.6%) | 61 (10.6%) |
| $65,000 to $74,999 | 41 (5.0%) | 20 (3.5%) |
| $75,000 to $99,999 | 224 (27.0%) | 26 (4.5%) |
| $100,000+ | 250 (30.2%) | 144 (25.1%) |
| Total | 829 (100.0%) | 573 (100.0%) |
Earnings by Sex by Educational Attainment in Callender
Average earnings in Callender are $81,491 for men and $44,100 for women, a difference of 45.9%. Men with an educational attainment of bachelor's degree enjoy the highest average annual earnings of $113,768, while those with high school diploma education earn the least with $57,518. Women with an educational attainment of college or associate's degree earn the most with the average annual earnings of $41,486, while those with college or associate's degree education have the smallest earnings of $41,486.
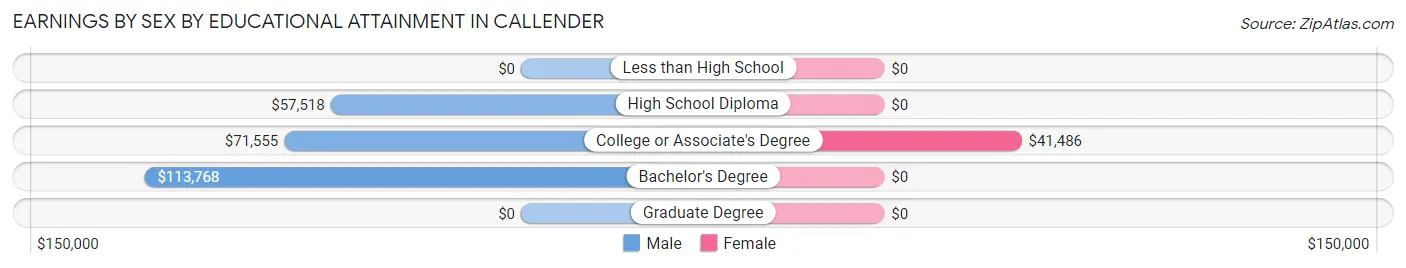
| Educational Attainment | Male Income | Female Income |
| Less than High School | - | - |
| High School Diploma | $57,518 | $0 |
| College or Associate's Degree | $71,555 | $41,486 |
| Bachelor's Degree | $113,768 | $0 |
| Graduate Degree | - | - |
| Total | $81,491 | $44,100 |
Family Income in Callender
Family Income Brackets in Callender
According to the Callender family income data, there are 293 families falling into the $200,000+ income range, which is the most common income bracket and makes up 42.6% of all families.
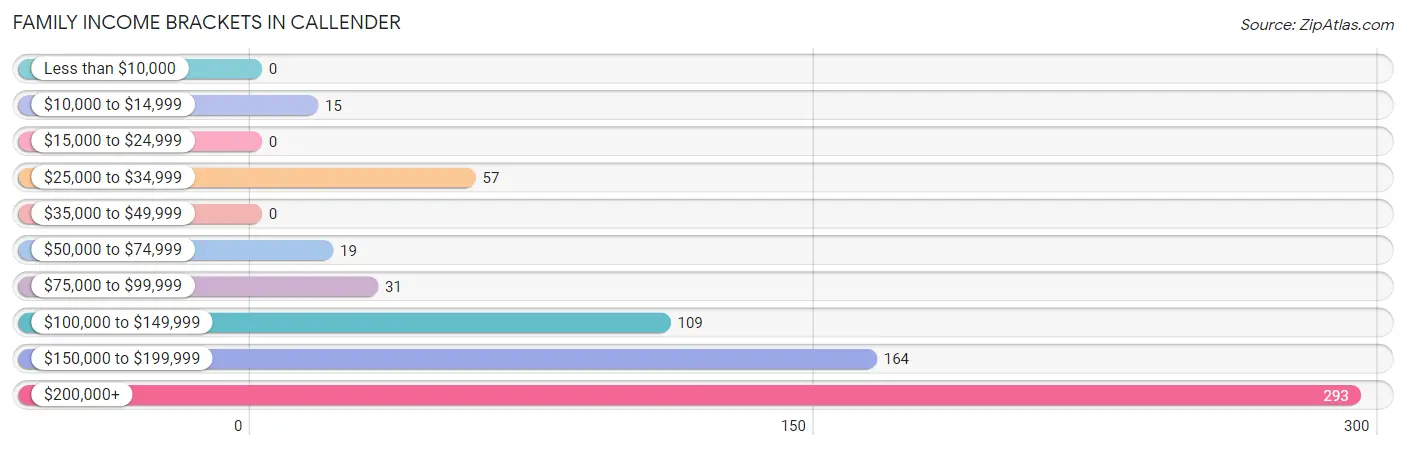
| Income Bracket | # Families | % Families |
| Less than $10,000 | 0 | 0.0% |
| $10,000 to $14,999 | 15 | 2.2% |
| $15,000 to $24,999 | 0 | 0.0% |
| $25,000 to $34,999 | 57 | 8.3% |
| $35,000 to $49,999 | 0 | 0.0% |
| $50,000 to $74,999 | 19 | 2.8% |
| $75,000 to $99,999 | 31 | 4.5% |
| $100,000 to $149,999 | 109 | 15.8% |
| $150,000 to $199,999 | 164 | 23.8% |
| $200,000+ | 293 | 42.6% |
Family Income by Famaliy Size in Callender
3-person families (351 | 51.0%) account for the highest median family income in Callender with $156,049 per family, while 3-person families (351 | 51.0%) have the highest median income of $52,016 per family member.
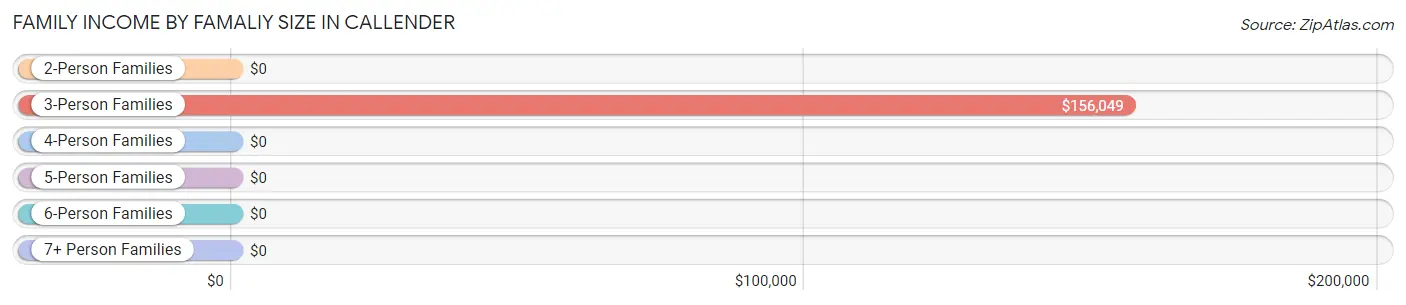
| Income Bracket | # Families | Median Income |
| 2-Person Families | 140 (20.3%) | $0 |
| 3-Person Families | 351 (51.0%) | $156,049 |
| 4-Person Families | 62 (9.0%) | $0 |
| 5-Person Families | 103 (15.0%) | $0 |
| 6-Person Families | 32 (4.6%) | $0 |
| 7+ Person Families | 0 (0.0%) | $0 |
| Total | 688 (100.0%) | $156,909 |
Family Income by Number of Earners in Callender
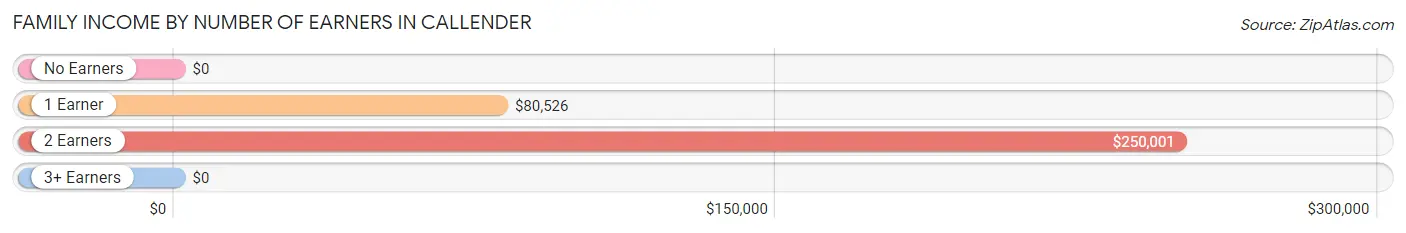
| Number of Earners | # Families | Median Income |
| No Earners | 99 (14.4%) | $0 |
| 1 Earner | 70 (10.2%) | $80,526 |
| 2 Earners | 394 (57.3%) | $250,001 |
| 3+ Earners | 125 (18.2%) | $0 |
| Total | 688 (100.0%) | $156,909 |
Household Income in Callender
Household Income Brackets in Callender
With 293 households falling in the category, the $200,000+ income range is the most frequent in Callender, accounting for 34.0% of all households.
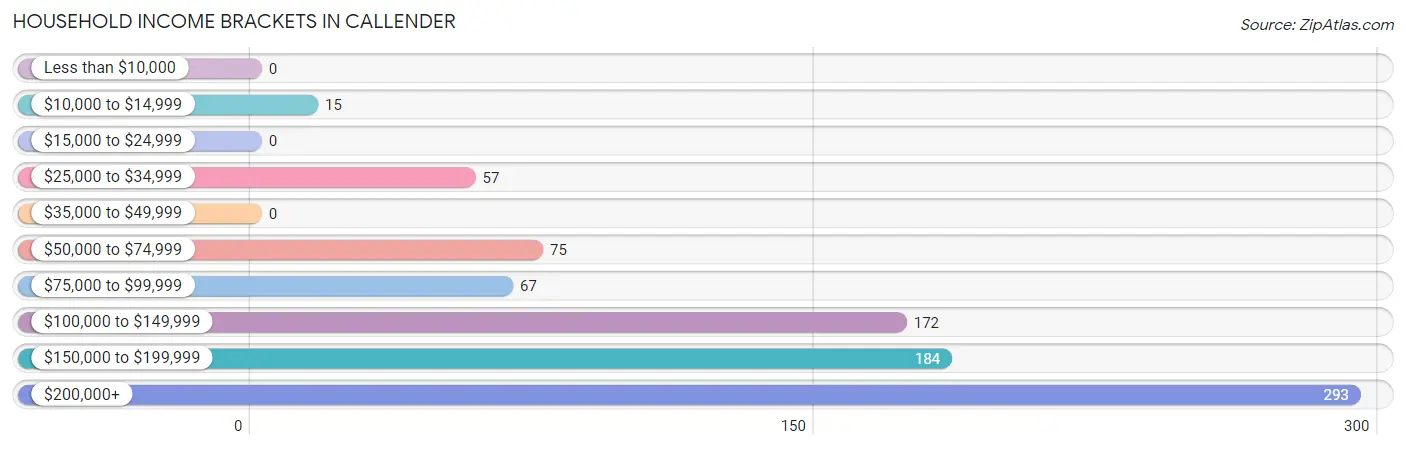
| Income Bracket | # Households | % Households |
| Less than $10,000 | 0 | 0.0% |
| $10,000 to $14,999 | 15 | 1.7% |
| $15,000 to $24,999 | 0 | 0.0% |
| $25,000 to $34,999 | 57 | 6.6% |
| $35,000 to $49,999 | 0 | 0.0% |
| $50,000 to $74,999 | 75 | 8.7% |
| $75,000 to $99,999 | 67 | 7.8% |
| $100,000 to $149,999 | 172 | 19.9% |
| $150,000 to $199,999 | 184 | 21.3% |
| $200,000+ | 293 | 34.0% |
Household Income by Householder Age in Callender
The median household income in Callender is $155,677, with the highest median household income of $126,930 found in the 45 to 64 years age bracket for the primary householder. A total of 341 households (39.5%) fall into this category.
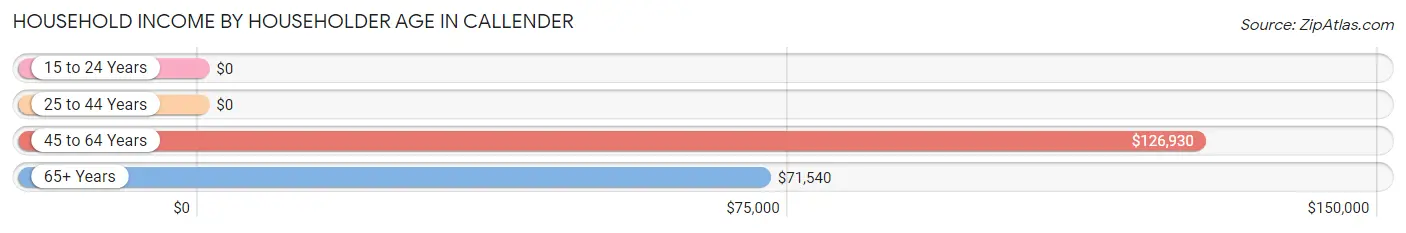
| Income Bracket | # Households | Median Income |
| 15 to 24 Years | 0 (0.0%) | $0 |
| 25 to 44 Years | 309 (35.8%) | $0 |
| 45 to 64 Years | 341 (39.5%) | $126,930 |
| 65+ Years | 213 (24.7%) | $71,540 |
| Total | 863 (100.0%) | $155,677 |
Poverty in Callender
Income Below Poverty by Sex and Age in Callender
With 0.9% poverty level for males and 1.3% for females among the residents of Callender, 65 to 74 year old males and 65 to 74 year old females are the most vulnerable to poverty, with 12 males (11.7%) and 15 females (26.3%) in their respective age groups living below the poverty level.
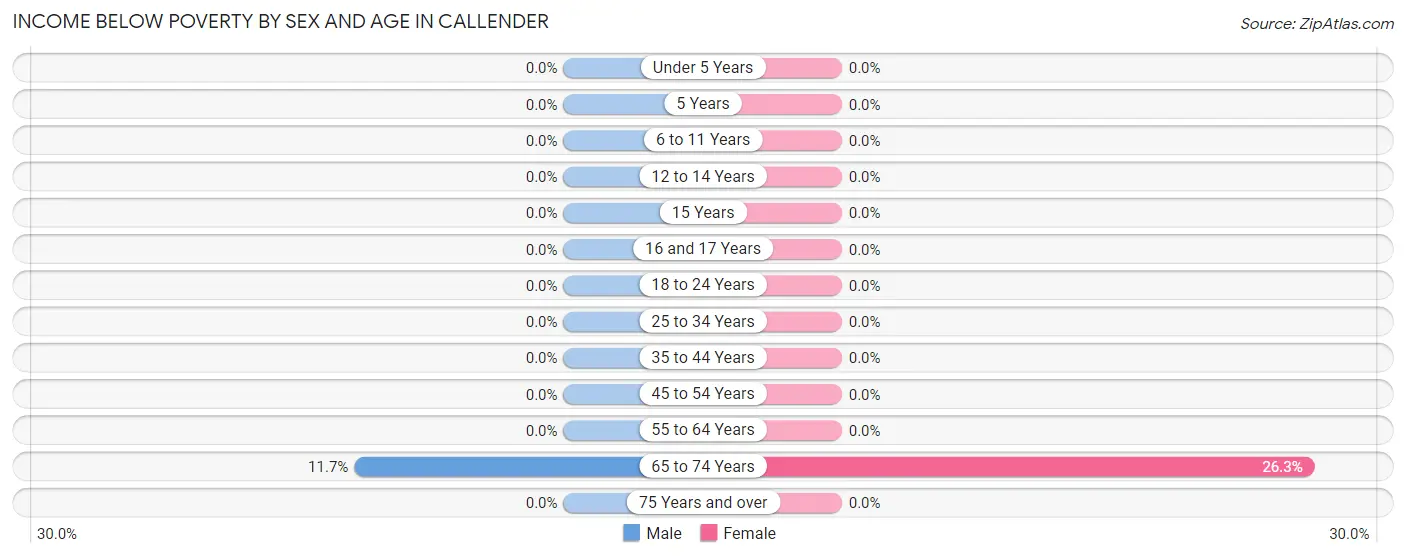
| Age Bracket | Male | Female |
| Under 5 Years | 0 (0.0%) | 0 (0.0%) |
| 5 Years | 0 (0.0%) | 0 (0.0%) |
| 6 to 11 Years | 0 (0.0%) | 0 (0.0%) |
| 12 to 14 Years | 0 (0.0%) | 0 (0.0%) |
| 15 Years | 0 (0.0%) | 0 (0.0%) |
| 16 and 17 Years | 0 (0.0%) | 0 (0.0%) |
| 18 to 24 Years | 0 (0.0%) | 0 (0.0%) |
| 25 to 34 Years | 0 (0.0%) | 0 (0.0%) |
| 35 to 44 Years | 0 (0.0%) | 0 (0.0%) |
| 45 to 54 Years | 0 (0.0%) | 0 (0.0%) |
| 55 to 64 Years | 0 (0.0%) | 0 (0.0%) |
| 65 to 74 Years | 12 (11.7%) | 15 (26.3%) |
| 75 Years and over | 0 (0.0%) | 0 (0.0%) |
| Total | 12 (0.9%) | 15 (1.3%) |
Income Above Poverty by Sex and Age in Callender
According to the poverty statistics in Callender, males aged under 5 years and females aged under 5 years are the age groups that are most secure financially, with 100.0% of males and 100.0% of females in these age groups living above the poverty line.
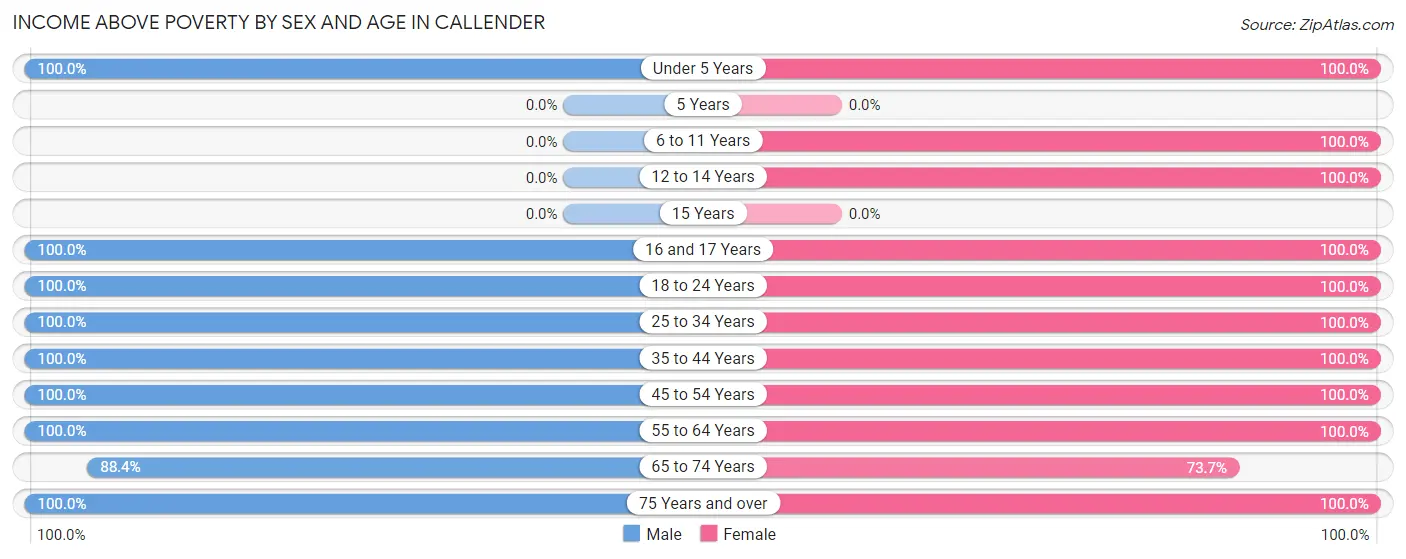
| Age Bracket | Male | Female |
| Under 5 Years | 178 (100.0%) | 150 (100.0%) |
| 5 Years | 0 (0.0%) | 0 (0.0%) |
| 6 to 11 Years | 0 (0.0%) | 211 (100.0%) |
| 12 to 14 Years | 0 (0.0%) | 34 (100.0%) |
| 15 Years | 0 (0.0%) | 0 (0.0%) |
| 16 and 17 Years | 38 (100.0%) | 15 (100.0%) |
| 18 to 24 Years | 109 (100.0%) | 81 (100.0%) |
| 25 to 34 Years | 39 (100.0%) | 42 (100.0%) |
| 35 to 44 Years | 357 (100.0%) | 264 (100.0%) |
| 45 to 54 Years | 230 (100.0%) | 155 (100.0%) |
| 55 to 64 Years | 84 (100.0%) | 105 (100.0%) |
| 65 to 74 Years | 91 (88.3%) | 42 (73.7%) |
| 75 Years and over | 132 (100.0%) | 60 (100.0%) |
| Total | 1,258 (99.1%) | 1,159 (98.7%) |
Income Below Poverty Among Married-Couple Families in Callender
The poverty statistics for married-couple families in Callender show that 2.2% or 15 of the total 688 families live below the poverty line. Families with no children have the highest poverty rate of 4.6%, comprising of 15 families. On the other hand, families with 1 or 2 children have the lowest poverty rate of 0.0%, which includes 0 families.
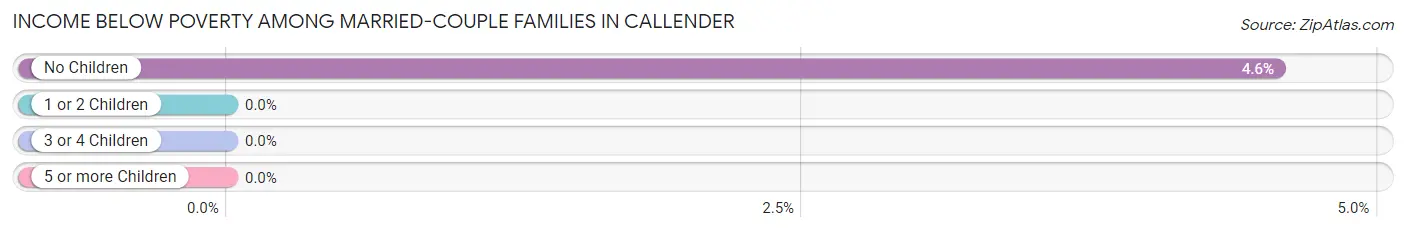
| Children | Above Poverty | Below Poverty |
| No Children | 314 (95.4%) | 15 (4.6%) |
| 1 or 2 Children | 256 (100.0%) | 0 (0.0%) |
| 3 or 4 Children | 103 (100.0%) | 0 (0.0%) |
| 5 or more Children | 0 (0.0%) | 0 (0.0%) |
| Total | 673 (97.8%) | 15 (2.2%) |
Income Below Poverty Among Single-Parent Households in Callender
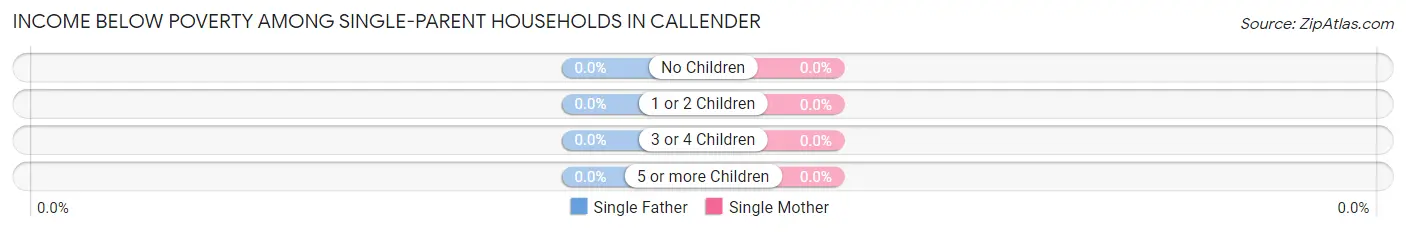
| Children | Single Father | Single Mother |
| No Children | 0 (0.0%) | 0 (0.0%) |
| 1 or 2 Children | 0 (0.0%) | 0 (0.0%) |
| 3 or 4 Children | 0 (0.0%) | 0 (0.0%) |
| 5 or more Children | 0 (0.0%) | 0 (0.0%) |
| Total | 0 (0.0%) | 0 (0.0%) |
Income Below Poverty Among Married-Couple vs Single-Parent Households in Callender
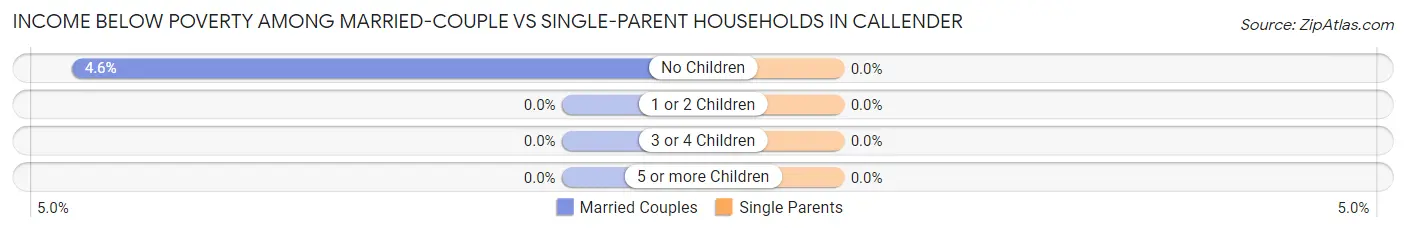
| Children | Married-Couple Families | Single-Parent Households |
| No Children | 15 (4.6%) | 0 (0.0%) |
| 1 or 2 Children | 0 (0.0%) | 0 (0.0%) |
| 3 or 4 Children | 0 (0.0%) | 0 (0.0%) |
| 5 or more Children | 0 (0.0%) | 0 (0.0%) |
| Total | 15 (2.2%) | 0 (0.0%) |
Race in Callender
The most populous races in Callender are White / Caucasian (1,625 | 66.5%), Hispanic or Latino (364 | 14.9%), and Two or more Races (357 | 14.6%).
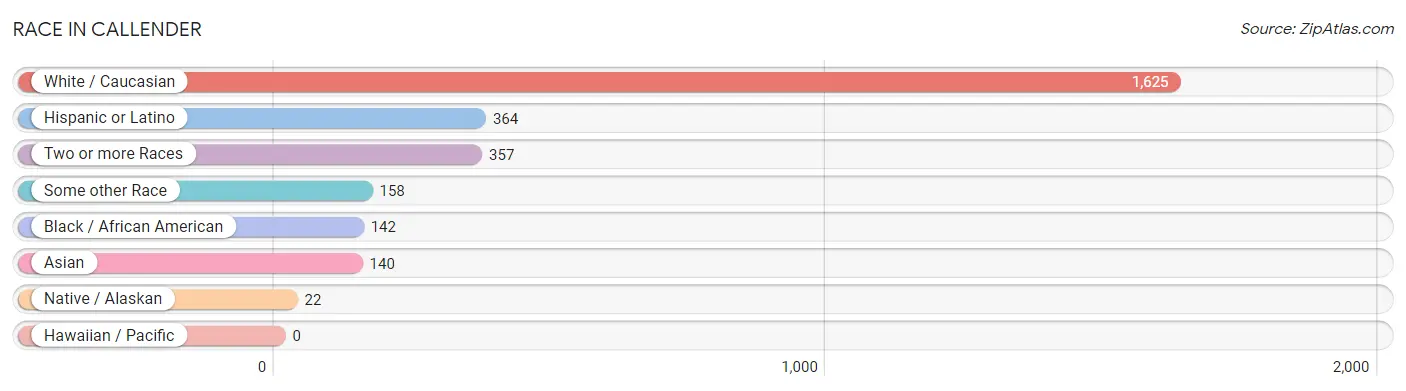
| Race | # Population | % Population |
| Asian | 140 | 5.7% |
| Black / African American | 142 | 5.8% |
| Hawaiian / Pacific | 0 | 0.0% |
| Hispanic or Latino | 364 | 14.9% |
| Native / Alaskan | 22 | 0.9% |
| White / Caucasian | 1,625 | 66.5% |
| Two or more Races | 357 | 14.6% |
| Some other Race | 158 | 6.5% |
| Total | 2,444 | 100.0% |
Ancestry in Callender
The most populous ancestries reported in Callender are German (530 | 21.7%), European (518 | 21.2%), Mexican (327 | 13.4%), English (273 | 11.2%), and Polish (251 | 10.3%), together accounting for 77.7% of all Callender residents.
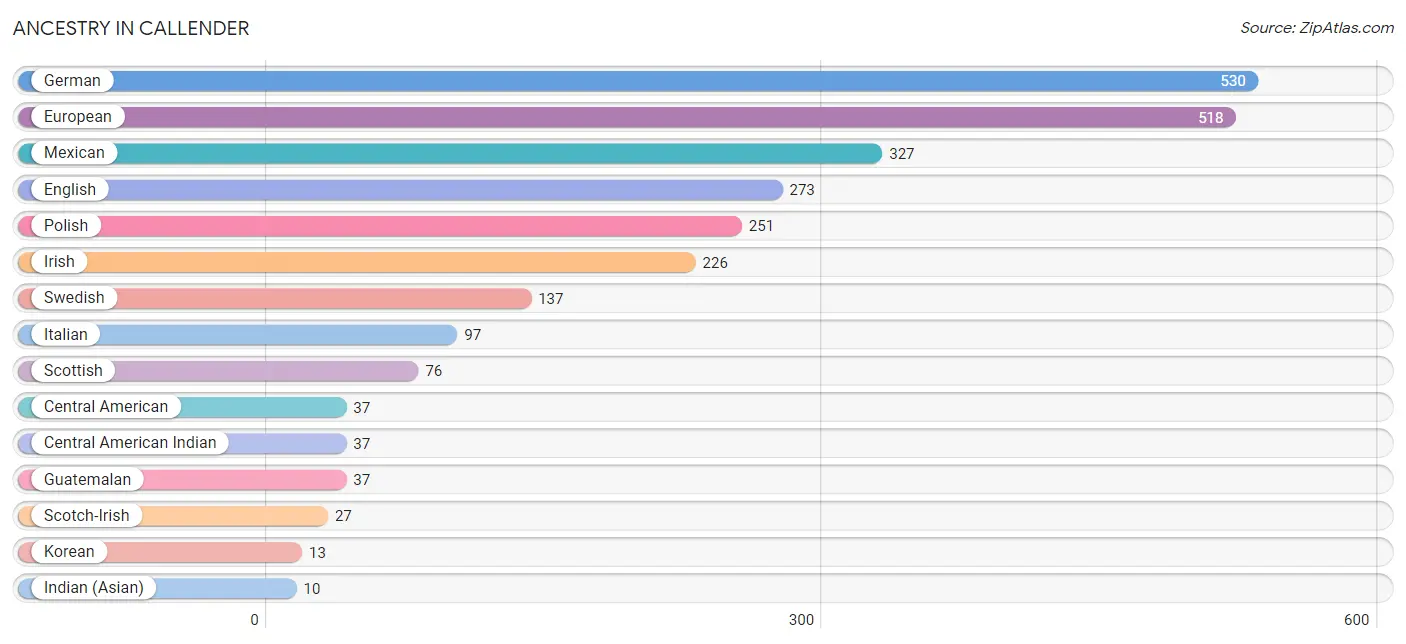
| Ancestry | # Population | % Population |
| American | 3 | 0.1% |
| Central American | 37 | 1.5% |
| Central American Indian | 37 | 1.5% |
| English | 273 | 11.2% |
| European | 518 | 21.2% |
| German | 530 | 21.7% |
| Guatemalan | 37 | 1.5% |
| Indian (Asian) | 10 | 0.4% |
| Irish | 226 | 9.2% |
| Italian | 97 | 4.0% |
| Korean | 13 | 0.5% |
| Mexican | 327 | 13.4% |
| Polish | 251 | 10.3% |
| Scotch-Irish | 27 | 1.1% |
| Scottish | 76 | 3.1% |
| Swedish | 137 | 5.6% | View All 16 Rows |
Immigrants in Callender
The most numerous immigrant groups reported in Callender came from Central America (144 | 5.9%), Latin America (144 | 5.9%), Mexico (122 | 5.0%), Croatia (33 | 1.3%), and Eastern Europe (33 | 1.3%), together accounting for 19.5% of all Callender residents.
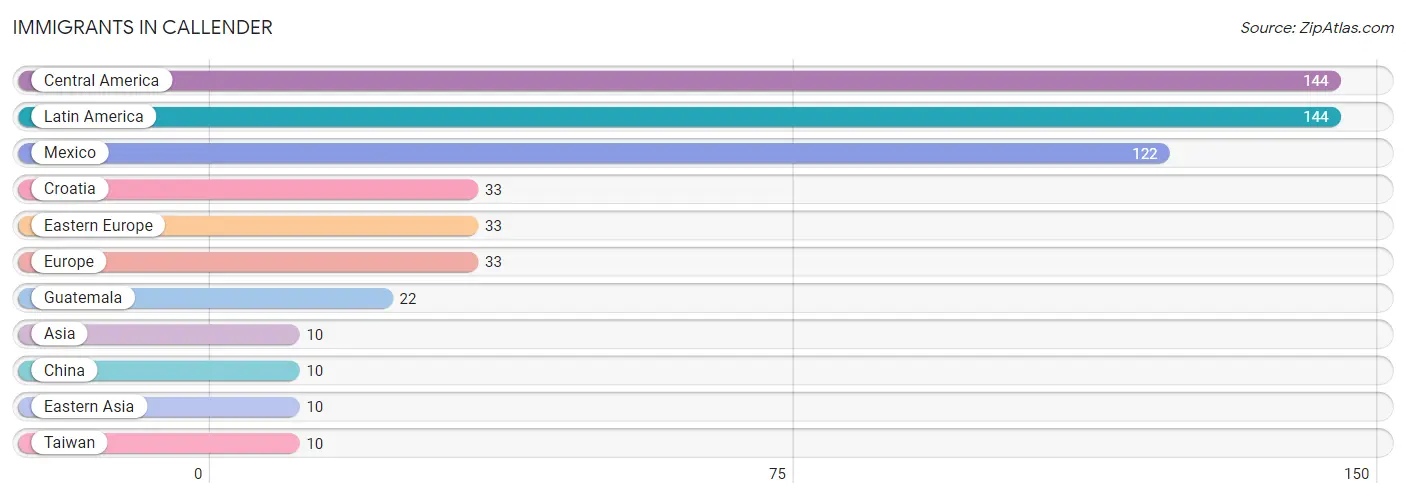
| Immigration Origin | # Population | % Population |
| Asia | 10 | 0.4% |
| Central America | 144 | 5.9% |
| China | 10 | 0.4% |
| Croatia | 33 | 1.3% |
| Eastern Asia | 10 | 0.4% |
| Eastern Europe | 33 | 1.3% |
| Europe | 33 | 1.3% |
| Guatemala | 22 | 0.9% |
| Latin America | 144 | 5.9% |
| Mexico | 122 | 5.0% |
| Taiwan | 10 | 0.4% | View All 11 Rows |
Sex and Age in Callender
Sex and Age in Callender
The most populous age groups in Callender are 35 to 39 Years (320 | 25.2%) for men and 35 to 39 Years (264 | 22.5%) for women.
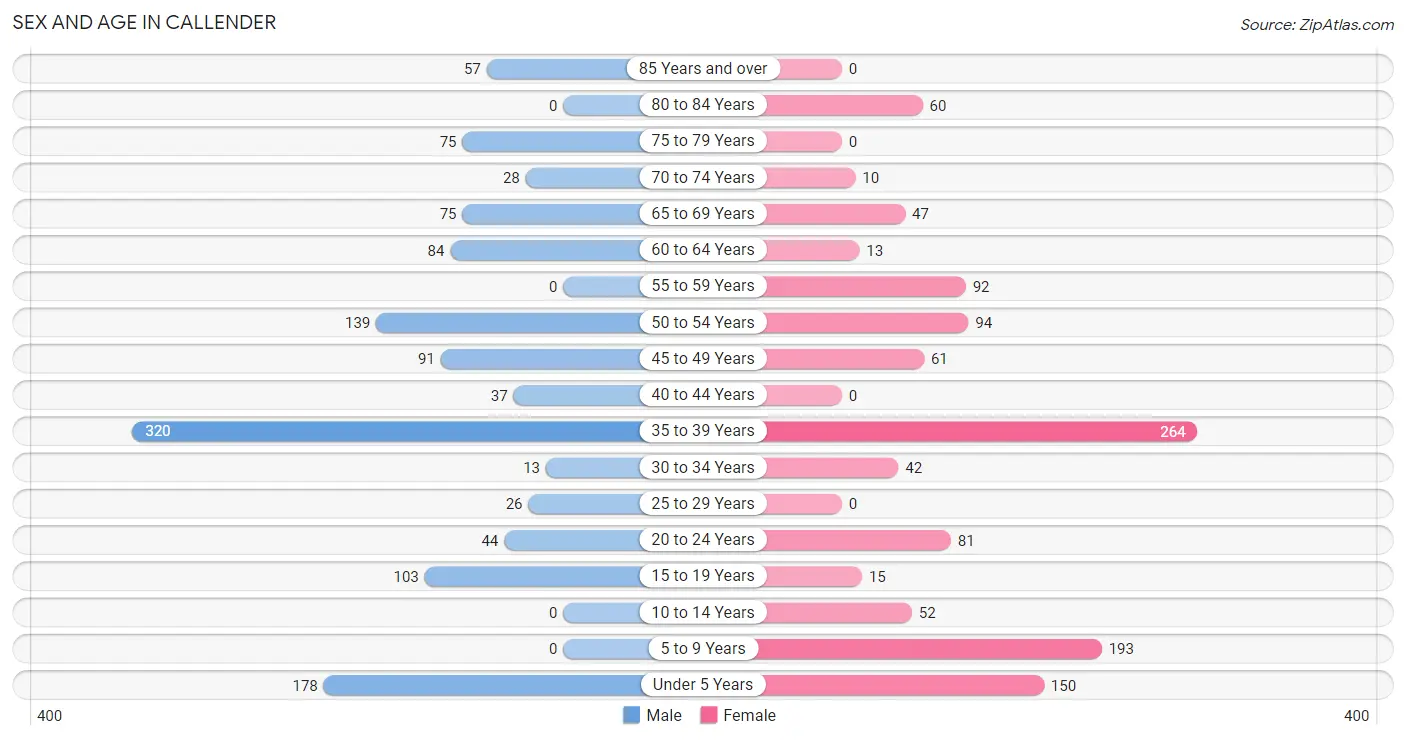
| Age Bracket | Male | Female |
| Under 5 Years | 178 (14.0%) | 150 (12.8%) |
| 5 to 9 Years | 0 (0.0%) | 193 (16.4%) |
| 10 to 14 Years | 0 (0.0%) | 52 (4.4%) |
| 15 to 19 Years | 103 (8.1%) | 15 (1.3%) |
| 20 to 24 Years | 44 (3.5%) | 81 (6.9%) |
| 25 to 29 Years | 26 (2.1%) | 0 (0.0%) |
| 30 to 34 Years | 13 (1.0%) | 42 (3.6%) |
| 35 to 39 Years | 320 (25.2%) | 264 (22.5%) |
| 40 to 44 Years | 37 (2.9%) | 0 (0.0%) |
| 45 to 49 Years | 91 (7.2%) | 61 (5.2%) |
| 50 to 54 Years | 139 (10.9%) | 94 (8.0%) |
| 55 to 59 Years | 0 (0.0%) | 92 (7.8%) |
| 60 to 64 Years | 84 (6.6%) | 13 (1.1%) |
| 65 to 69 Years | 75 (5.9%) | 47 (4.0%) |
| 70 to 74 Years | 28 (2.2%) | 10 (0.9%) |
| 75 to 79 Years | 75 (5.9%) | 0 (0.0%) |
| 80 to 84 Years | 0 (0.0%) | 60 (5.1%) |
| 85 Years and over | 57 (4.5%) | 0 (0.0%) |
| Total | 1,270 (100.0%) | 1,174 (100.0%) |
Families and Households in Callender
Median Family Size in Callender
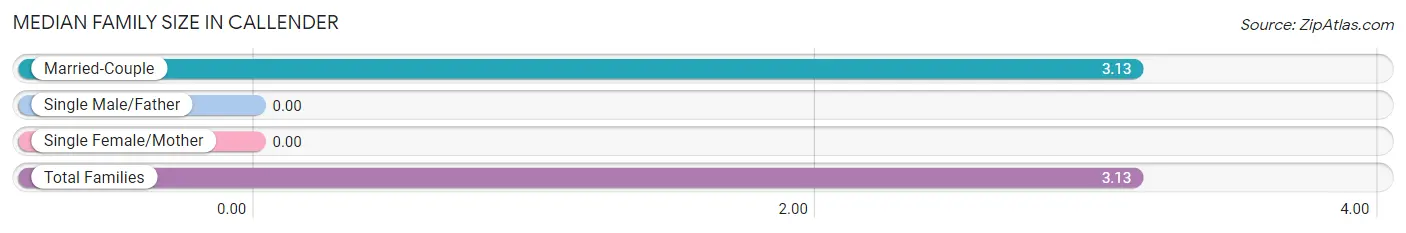
| Family Type | # Families | Family Size |
| Married-Couple | 688 (100.0%) | 3.13 |
| Single Male/Father | 0 (0.0%) | - |
| Single Female/Mother | 0 (0.0%) | - |
| Total Families | 688 (100.0%) | 3.13 |
Median Household Size in Callender
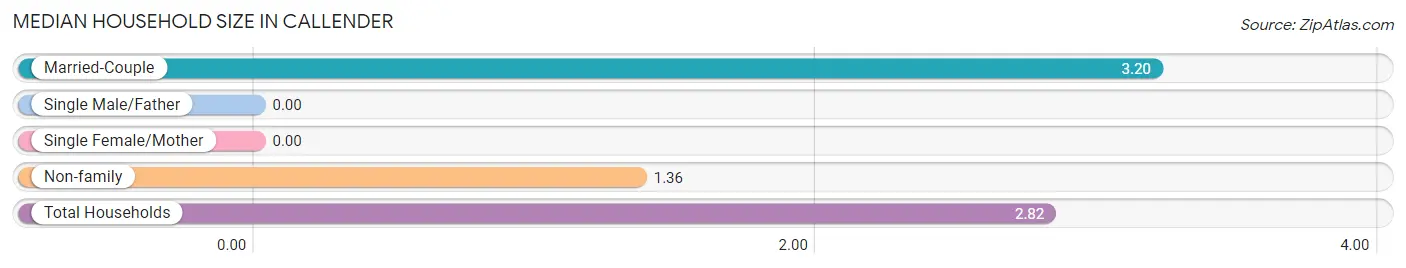
| Household Type | # Households | Household Size |
| Married-Couple | 688 (79.7%) | 3.20 |
| Single Male/Father | 0 (0.0%) | - |
| Single Female/Mother | 0 (0.0%) | - |
| Non-family | 175 (20.3%) | 1.36 |
| Total Households | 863 (100.0%) | 2.82 |
Household Size by Marriage Status in Callender
Out of a total of 863 households in Callender, 688 (79.7%) are family households, while 175 (20.3%) are nonfamily households. The most numerous type of family households are 3-person households, comprising 351, and the most common type of nonfamily households are 1-person households, comprising 92.
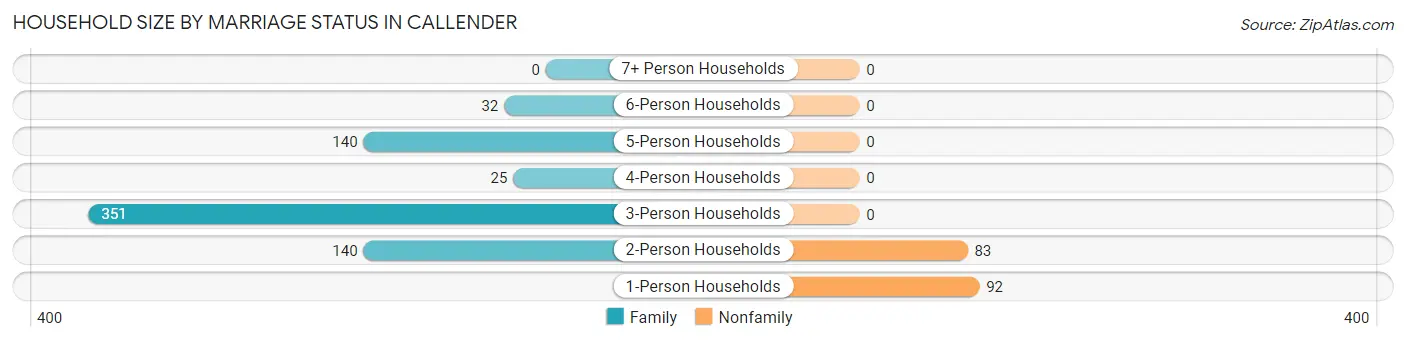
| Household Size | Family Households | Nonfamily Households |
| 1-Person Households | - | 92 (10.7%) |
| 2-Person Households | 140 (16.2%) | 83 (9.6%) |
| 3-Person Households | 351 (40.7%) | 0 (0.0%) |
| 4-Person Households | 25 (2.9%) | 0 (0.0%) |
| 5-Person Households | 140 (16.2%) | 0 (0.0%) |
| 6-Person Households | 32 (3.7%) | 0 (0.0%) |
| 7+ Person Households | 0 (0.0%) | 0 (0.0%) |
| Total | 688 (79.7%) | 175 (20.3%) |
Female Fertility in Callender
Fertility by Age in Callender
Average fertility rate in Callender is 240.0 births per 1,000 women. Women in the age bracket of 35 to 50 years have the highest fertility rate with 327.0 births per 1,000 women. Women in the age bracket of 35 to 50 years acount for 100.0% of all women with births.
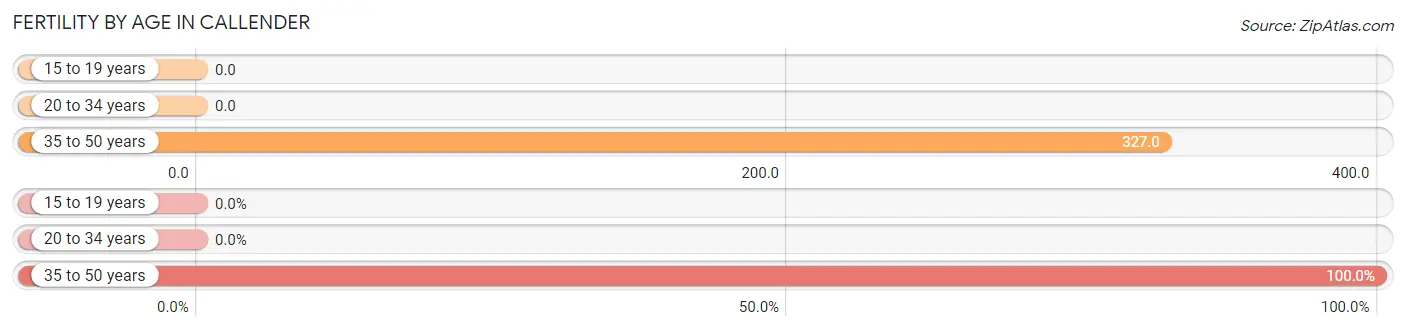
| Age Bracket | Women with Births | Births / 1,000 Women |
| 15 to 19 years | 0 (0.0%) | 0.0 |
| 20 to 34 years | 0 (0.0%) | 0.0 |
| 35 to 50 years | 124 (100.0%) | 327.0 |
| Total | 124 (100.0%) | 240.0 |
Fertility by Age by Marriage Status in Callender
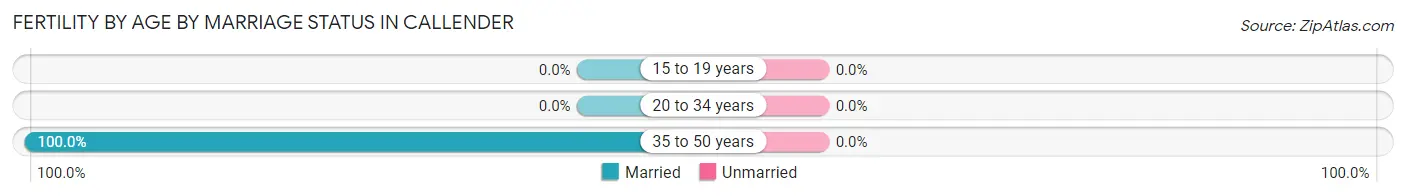
| Age Bracket | Married | Unmarried |
| 15 to 19 years | 0 (0.0%) | 0 (0.0%) |
| 20 to 34 years | 0 (0.0%) | 0 (0.0%) |
| 35 to 50 years | 124 (100.0%) | 0 (0.0%) |
| Total | 124 (100.0%) | 0 (0.0%) |
Fertility by Education in Callender
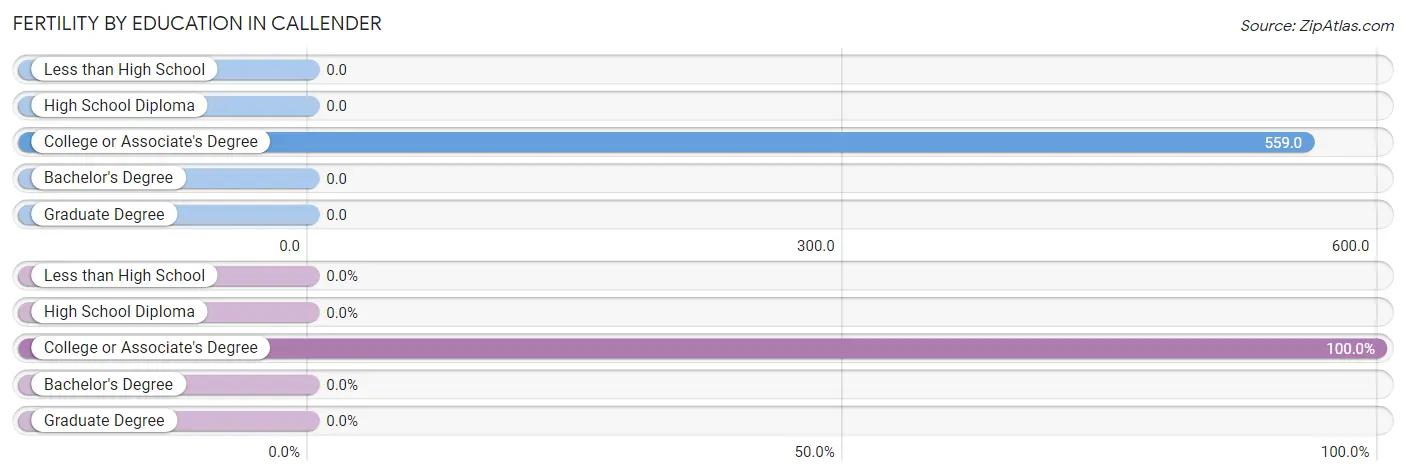
| Educational Attainment | Women with Births | Births / 1,000 Women |
| Less than High School | 0 (0.0%) | 0.0 |
| High School Diploma | 0 (0.0%) | 0.0 |
| College or Associate's Degree | 124 (100.0%) | 559.0 |
| Bachelor's Degree | 0 (0.0%) | 0.0 |
| Graduate Degree | 0 (0.0%) | 0.0 |
| Total | 124 (100.0%) | 240.0 |
Fertility by Education by Marriage Status in Callender
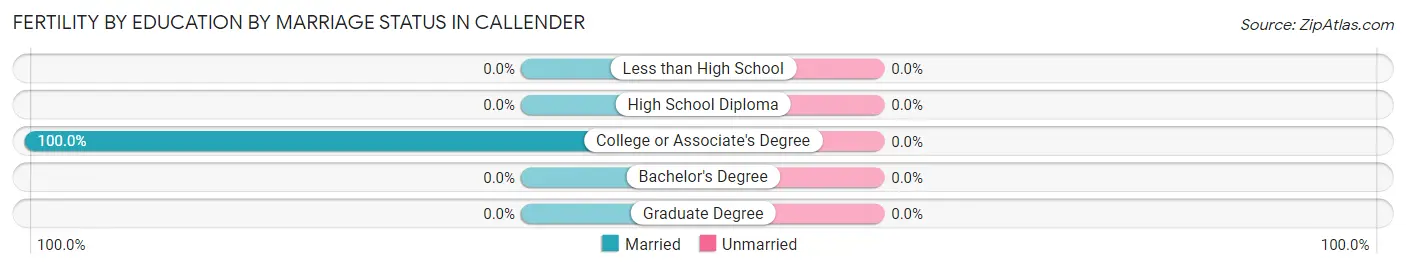
| Educational Attainment | Married | Unmarried |
| Less than High School | 0 (0.0%) | 0 (0.0%) |
| High School Diploma | 0 (0.0%) | 0 (0.0%) |
| College or Associate's Degree | 124 (100.0%) | 0 (0.0%) |
| Bachelor's Degree | 0 (0.0%) | 0 (0.0%) |
| Graduate Degree | 0 (0.0%) | 0 (0.0%) |
| Total | 124 (100.0%) | 0 (0.0%) |
Employment Characteristics in Callender
Employment by Class of Employer in Callender
Among the 1,276 employed individuals in Callender, private company employees (979 | 76.7%), federal government employees (108 | 8.5%), and self-employed (not incorporated) (106 | 8.3%) make up the most common classes of employment.
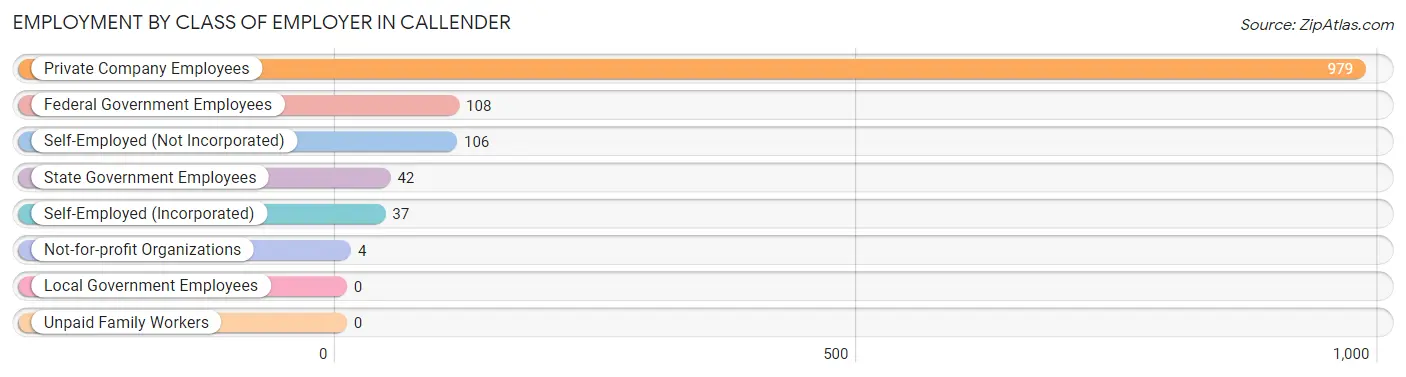
| Employer Class | # Employees | % Employees |
| Private Company Employees | 979 | 76.7% |
| Self-Employed (Incorporated) | 37 | 2.9% |
| Self-Employed (Not Incorporated) | 106 | 8.3% |
| Not-for-profit Organizations | 4 | 0.3% |
| Local Government Employees | 0 | 0.0% |
| State Government Employees | 42 | 3.3% |
| Federal Government Employees | 108 | 8.5% |
| Unpaid Family Workers | 0 | 0.0% |
| Total | 1,276 | 100.0% |
Employment Status by Age in Callender
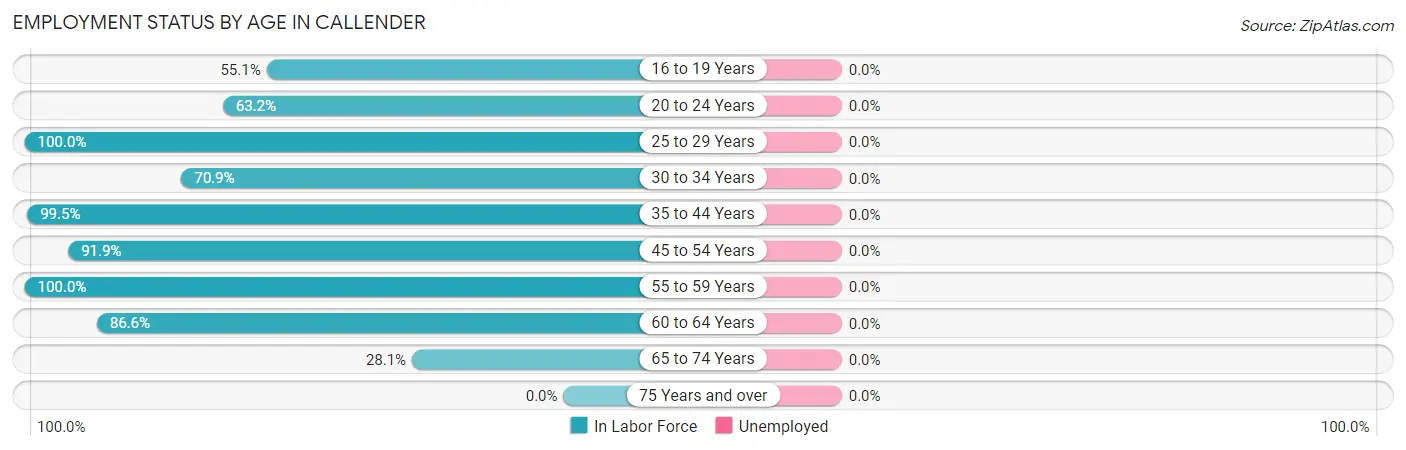
| Age Bracket | In Labor Force | Unemployed |
| 16 to 19 Years | 65 (55.1%) | 0 (0.0%) |
| 20 to 24 Years | 79 (63.2%) | 0 (0.0%) |
| 25 to 29 Years | 26 (100.0%) | 0 (0.0%) |
| 30 to 34 Years | 39 (70.9%) | 0 (0.0%) |
| 35 to 44 Years | 618 (99.5%) | 0 (0.0%) |
| 45 to 54 Years | 354 (91.9%) | 0 (0.0%) |
| 55 to 59 Years | 92 (100.0%) | 0 (0.0%) |
| 60 to 64 Years | 84 (86.6%) | 0 (0.0%) |
| 65 to 74 Years | 45 (28.1%) | 0 (0.0%) |
| 75 Years and over | 0 (0.0%) | 0 (0.0%) |
| Total | 1,401 (74.9%) | 0 (0.0%) |
Employment Status by Educational Attainment in Callender
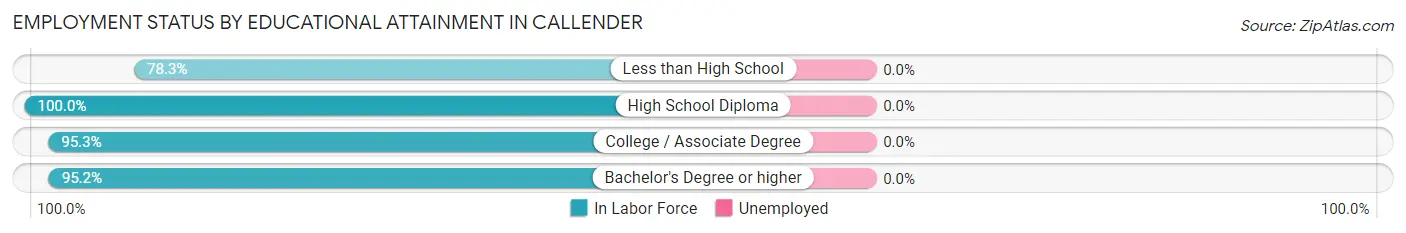
| Educational Attainment | In Labor Force | Unemployed |
| Less than High School | 47 (78.3%) | 0 (0.0%) |
| High School Diploma | 157 (100.0%) | 0 (0.0%) |
| College / Associate Degree | 470 (95.3%) | 0 (0.0%) |
| Bachelor's Degree or higher | 539 (95.2%) | 0 (0.0%) |
| Total | 1,213 (95.1%) | 0 (0.0%) |
Employment Occupations by Sex in Callender
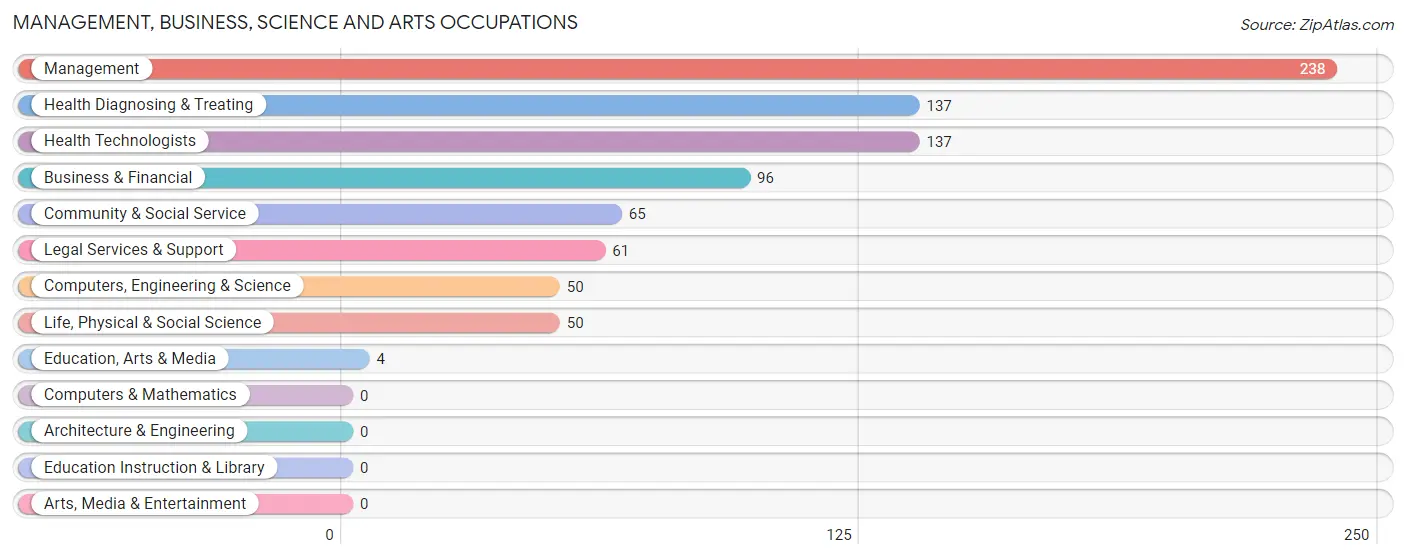
Management, Business, Science and Arts Occupations
The most common Management, Business, Science and Arts occupations in Callender are Management (238 | 17.0%), Health Diagnosing & Treating (137 | 9.8%), Health Technologists (137 | 9.8%), Business & Financial (96 | 6.9%), and Community & Social Service (65 | 4.6%).
Management, Business, Science and Arts Occupations by Sex
Within the Management, Business, Science and Arts occupations in Callender, the most male-oriented occupations are Business & Financial (100.0%), Education, Arts & Media (100.0%), and Management (82.8%), while the most female-oriented occupations are Computers, Engineering & Science (100.0%), Life, Physical & Social Science (100.0%), and Legal Services & Support (100.0%).
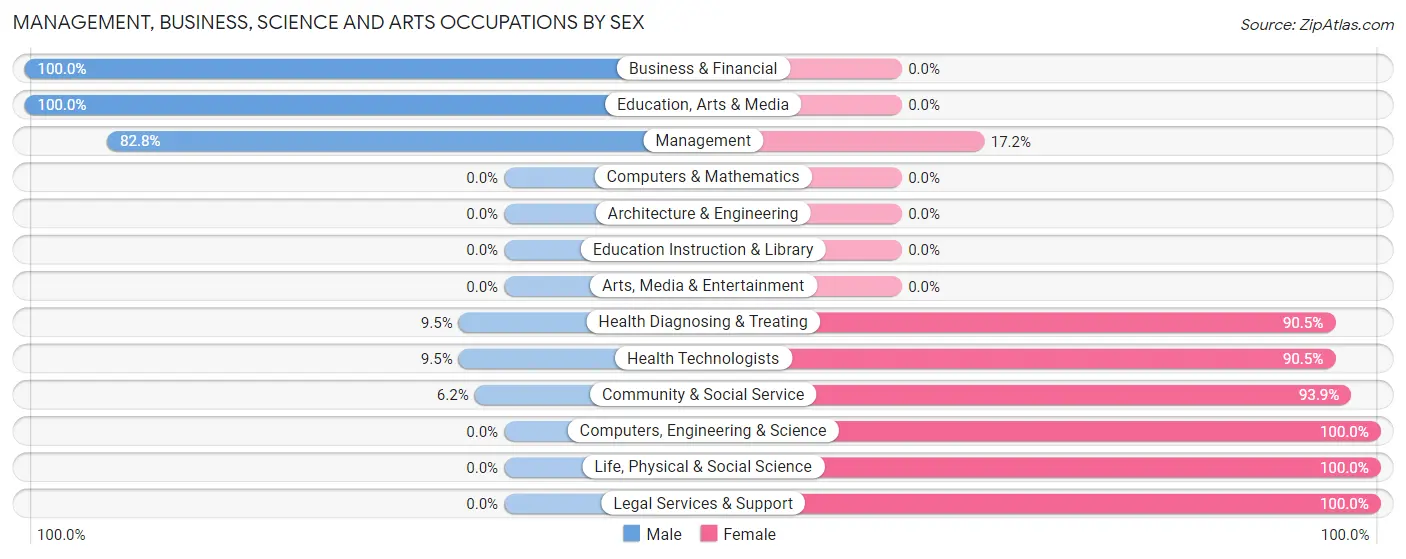
| Occupation | Male | Female |
| Management | 197 (82.8%) | 41 (17.2%) |
| Business & Financial | 96 (100.0%) | 0 (0.0%) |
| Computers, Engineering & Science | 0 (0.0%) | 50 (100.0%) |
| Computers & Mathematics | 0 (0.0%) | 0 (0.0%) |
| Architecture & Engineering | 0 (0.0%) | 0 (0.0%) |
| Life, Physical & Social Science | 0 (0.0%) | 50 (100.0%) |
| Community & Social Service | 4 (6.1%) | 61 (93.9%) |
| Education, Arts & Media | 4 (100.0%) | 0 (0.0%) |
| Legal Services & Support | 0 (0.0%) | 61 (100.0%) |
| Education Instruction & Library | 0 (0.0%) | 0 (0.0%) |
| Arts, Media & Entertainment | 0 (0.0%) | 0 (0.0%) |
| Health Diagnosing & Treating | 13 (9.5%) | 124 (90.5%) |
| Health Technologists | 13 (9.5%) | 124 (90.5%) |
| Total (Category) | 310 (52.9%) | 276 (47.1%) |
| Total (Overall) | 829 (59.1%) | 573 (40.9%) |
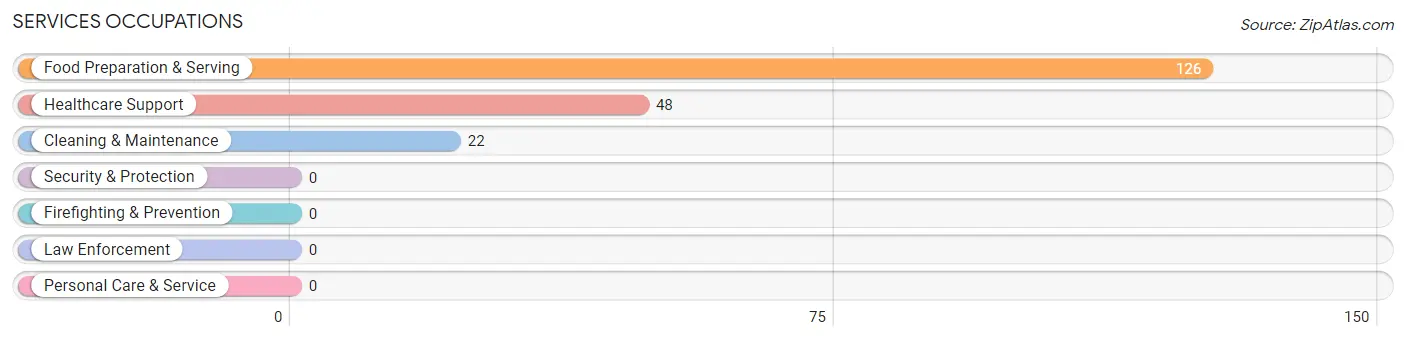
Services Occupations
The most common Services occupations in Callender are Food Preparation & Serving (126 | 9.0%), Healthcare Support (48 | 3.4%), and Cleaning & Maintenance (22 | 1.6%).
Services Occupations by Sex
Within the Services occupations in Callender, the most male-oriented occupations are Healthcare Support (54.2%), and Food Preparation & Serving (51.6%), while the most female-oriented occupations are Cleaning & Maintenance (100.0%), Food Preparation & Serving (48.4%), and Healthcare Support (45.8%).
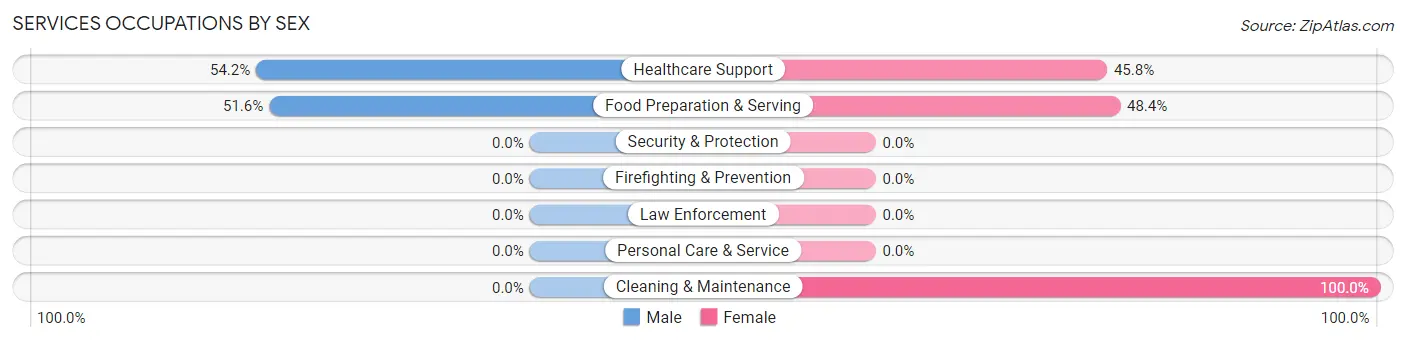
| Occupation | Male | Female |
| Healthcare Support | 26 (54.2%) | 22 (45.8%) |
| Security & Protection | 0 (0.0%) | 0 (0.0%) |
| Firefighting & Prevention | 0 (0.0%) | 0 (0.0%) |
| Law Enforcement | 0 (0.0%) | 0 (0.0%) |
| Food Preparation & Serving | 65 (51.6%) | 61 (48.4%) |
| Cleaning & Maintenance | 0 (0.0%) | 22 (100.0%) |
| Personal Care & Service | 0 (0.0%) | 0 (0.0%) |
| Total (Category) | 91 (46.4%) | 105 (53.6%) |
| Total (Overall) | 829 (59.1%) | 573 (40.9%) |
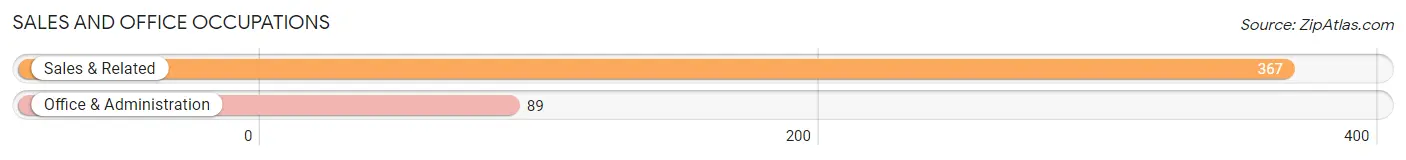
Sales and Office Occupations
The most common Sales and Office occupations in Callender are Sales & Related (367 | 26.2%), and Office & Administration (89 | 6.4%).
Sales and Office Occupations by Sex
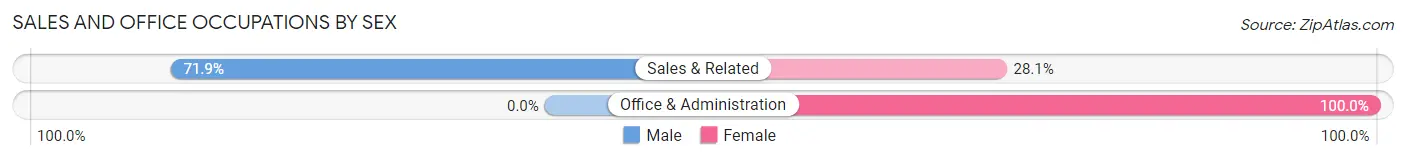
| Occupation | Male | Female |
| Sales & Related | 264 (71.9%) | 103 (28.1%) |
| Office & Administration | 0 (0.0%) | 89 (100.0%) |
| Total (Category) | 264 (57.9%) | 192 (42.1%) |
| Total (Overall) | 829 (59.1%) | 573 (40.9%) |
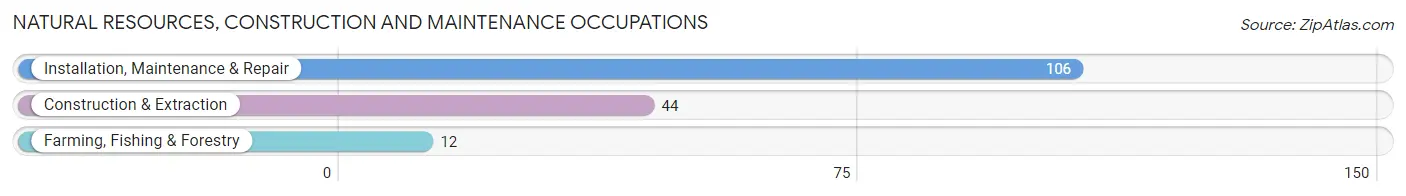
Natural Resources, Construction and Maintenance Occupations
The most common Natural Resources, Construction and Maintenance occupations in Callender are Installation, Maintenance & Repair (106 | 7.6%), Construction & Extraction (44 | 3.1%), and Farming, Fishing & Forestry (12 | 0.9%).
Natural Resources, Construction and Maintenance Occupations by Sex
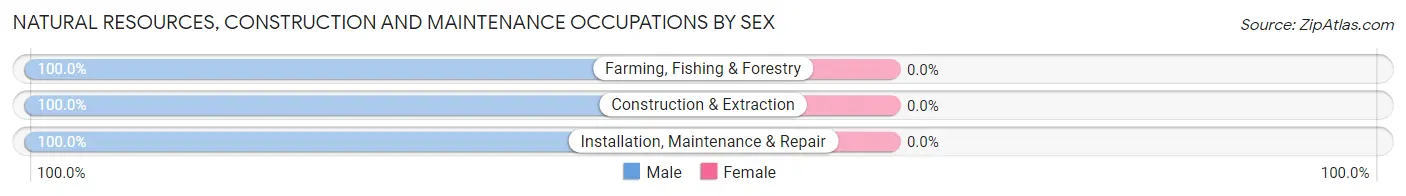
| Occupation | Male | Female |
| Farming, Fishing & Forestry | 12 (100.0%) | 0 (0.0%) |
| Construction & Extraction | 44 (100.0%) | 0 (0.0%) |
| Installation, Maintenance & Repair | 106 (100.0%) | 0 (0.0%) |
| Total (Category) | 162 (100.0%) | 0 (0.0%) |
| Total (Overall) | 829 (59.1%) | 573 (40.9%) |
Production, Transportation and Moving Occupations
The most common Production, Transportation and Moving occupations in Callender are , and Production (2 | 0.1%).
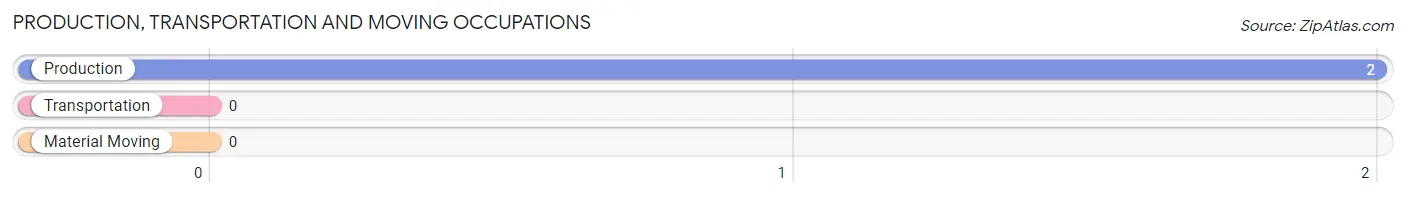
Production, Transportation and Moving Occupations by Sex
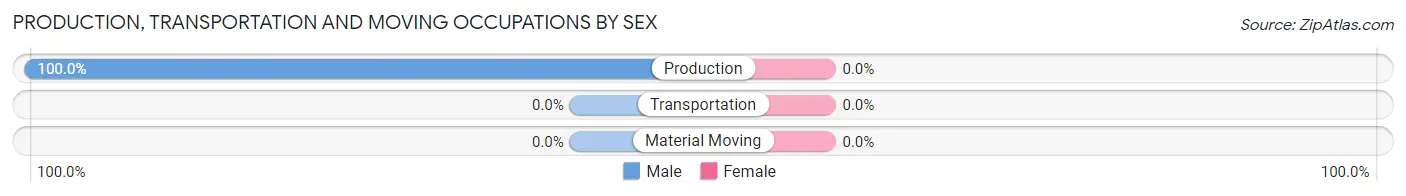
| Occupation | Male | Female |
| Production | 2 (100.0%) | 0 (0.0%) |
| Transportation | 0 (0.0%) | 0 (0.0%) |
| Material Moving | 0 (0.0%) | 0 (0.0%) |
| Total (Category) | 2 (100.0%) | 0 (0.0%) |
| Total (Overall) | 829 (59.1%) | 573 (40.9%) |
Employment Industries by Sex in Callender
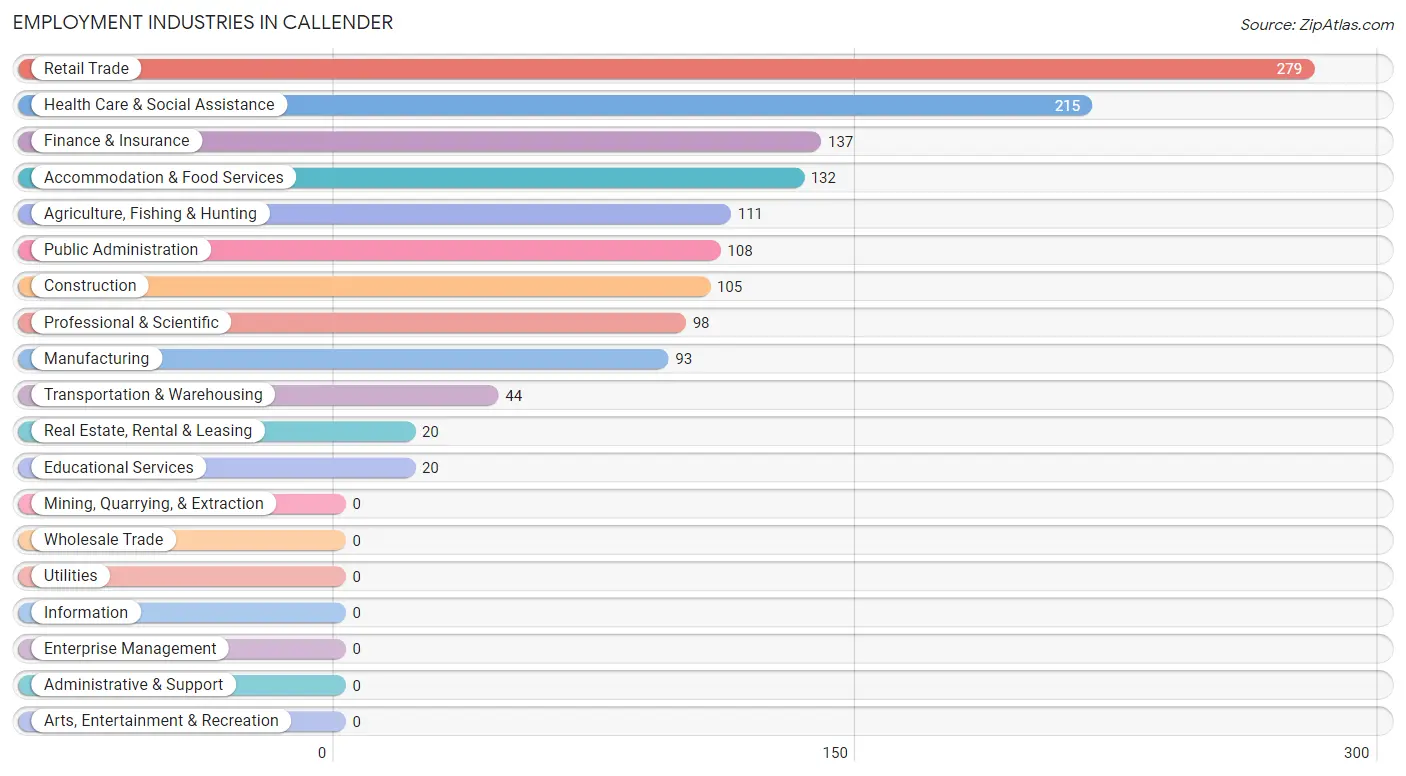
Employment Industries in Callender
The major employment industries in Callender include Retail Trade (279 | 19.9%), Health Care & Social Assistance (215 | 15.3%), Finance & Insurance (137 | 9.8%), Accommodation & Food Services (132 | 9.4%), and Agriculture, Fishing & Hunting (111 | 7.9%).
Employment Industries by Sex in Callender
The Callender industries that see more men than women are Agriculture, Fishing & Hunting (100.0%), Construction (100.0%), and Transportation & Warehousing (100.0%), whereas the industries that tend to have a higher number of women are Professional & Scientific (100.0%), Educational Services (100.0%), and Manufacturing (97.9%).
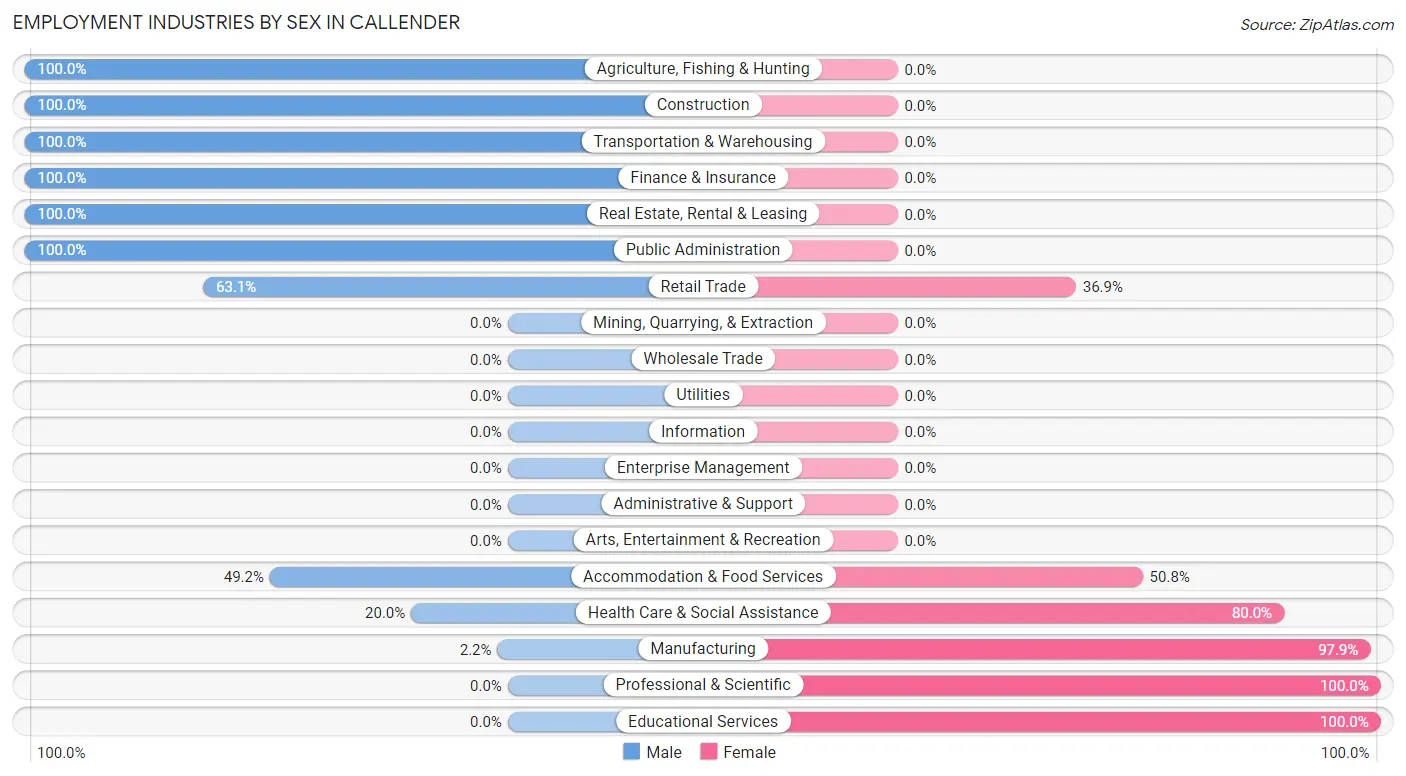
| Industry | Male | Female |
| Agriculture, Fishing & Hunting | 111 (100.0%) | 0 (0.0%) |
| Mining, Quarrying, & Extraction | 0 (0.0%) | 0 (0.0%) |
| Construction | 105 (100.0%) | 0 (0.0%) |
| Manufacturing | 2 (2.1%) | 91 (97.9%) |
| Wholesale Trade | 0 (0.0%) | 0 (0.0%) |
| Retail Trade | 176 (63.1%) | 103 (36.9%) |
| Transportation & Warehousing | 44 (100.0%) | 0 (0.0%) |
| Utilities | 0 (0.0%) | 0 (0.0%) |
| Information | 0 (0.0%) | 0 (0.0%) |
| Finance & Insurance | 137 (100.0%) | 0 (0.0%) |
| Real Estate, Rental & Leasing | 20 (100.0%) | 0 (0.0%) |
| Professional & Scientific | 0 (0.0%) | 98 (100.0%) |
| Enterprise Management | 0 (0.0%) | 0 (0.0%) |
| Administrative & Support | 0 (0.0%) | 0 (0.0%) |
| Educational Services | 0 (0.0%) | 20 (100.0%) |
| Health Care & Social Assistance | 43 (20.0%) | 172 (80.0%) |
| Arts, Entertainment & Recreation | 0 (0.0%) | 0 (0.0%) |
| Accommodation & Food Services | 65 (49.2%) | 67 (50.8%) |
| Public Administration | 108 (100.0%) | 0 (0.0%) |
| Total | 829 (59.1%) | 573 (40.9%) |
Education in Callender
School Enrollment in Callender
The most common levels of schooling among the 546 students in Callender are elementary school (193 | 35.3%), high school (118 | 21.6%), and nursery / preschool (111 | 20.3%).
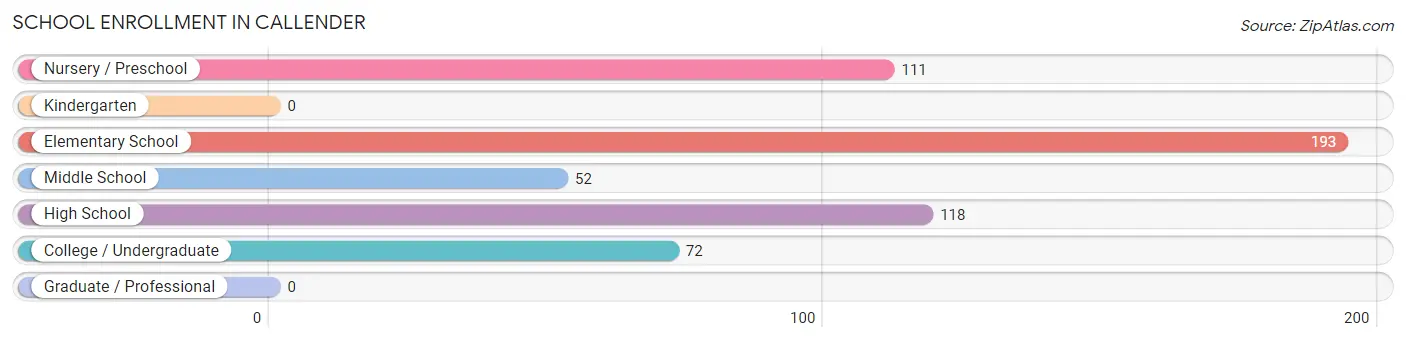
| School Level | # Students | % Students |
| Nursery / Preschool | 111 | 20.3% |
| Kindergarten | 0 | 0.0% |
| Elementary School | 193 | 35.3% |
| Middle School | 52 | 9.5% |
| High School | 118 | 21.6% |
| College / Undergraduate | 72 | 13.2% |
| Graduate / Professional | 0 | 0.0% |
| Total | 546 | 100.0% |
School Enrollment by Age by Funding Source in Callender
Out of a total of 546 students who are enrolled in schools in Callender, 304 (55.7%) attend a private institution, while the remaining 242 (44.3%) are enrolled in public schools. The age group of 3 to 4 year olds has the highest likelihood of being enrolled in private schools, with 111 (100.0% in the age bracket) enrolled. Conversely, the age group of 10 to 14 year olds has the lowest likelihood of being enrolled in a private school, with 52 (100.0% in the age bracket) attending a public institution.
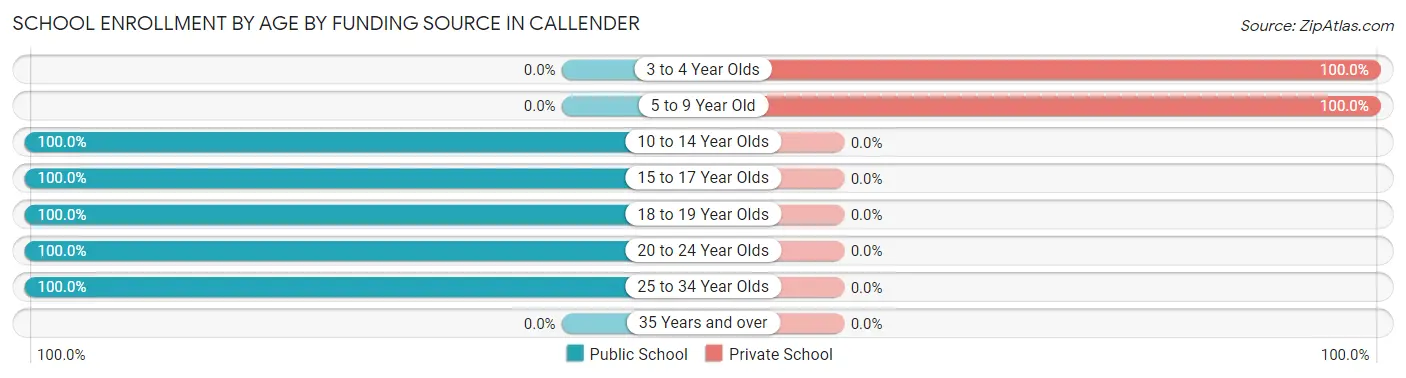
| Age Bracket | Public School | Private School |
| 3 to 4 Year Olds | 0 (0.0%) | 111 (100.0%) |
| 5 to 9 Year Old | 0 (0.0%) | 193 (100.0%) |
| 10 to 14 Year Olds | 52 (100.0%) | 0 (0.0%) |
| 15 to 17 Year Olds | 53 (100.0%) | 0 (0.0%) |
| 18 to 19 Year Olds | 65 (100.0%) | 0 (0.0%) |
| 20 to 24 Year Olds | 46 (100.0%) | 0 (0.0%) |
| 25 to 34 Year Olds | 26 (100.0%) | 0 (0.0%) |
| 35 Years and over | 0 (0.0%) | 0 (0.0%) |
| Total | 242 (44.3%) | 304 (55.7%) |
Educational Attainment by Field of Study in Callender
Social sciences (199 | 27.0%), psychology (137 | 18.6%), business (137 | 18.6%), bio, nature & agricultural (134 | 18.2%), and communications (119 | 16.1%) are the most common fields of study among 738 individuals in Callender who have obtained a bachelor's degree or higher.
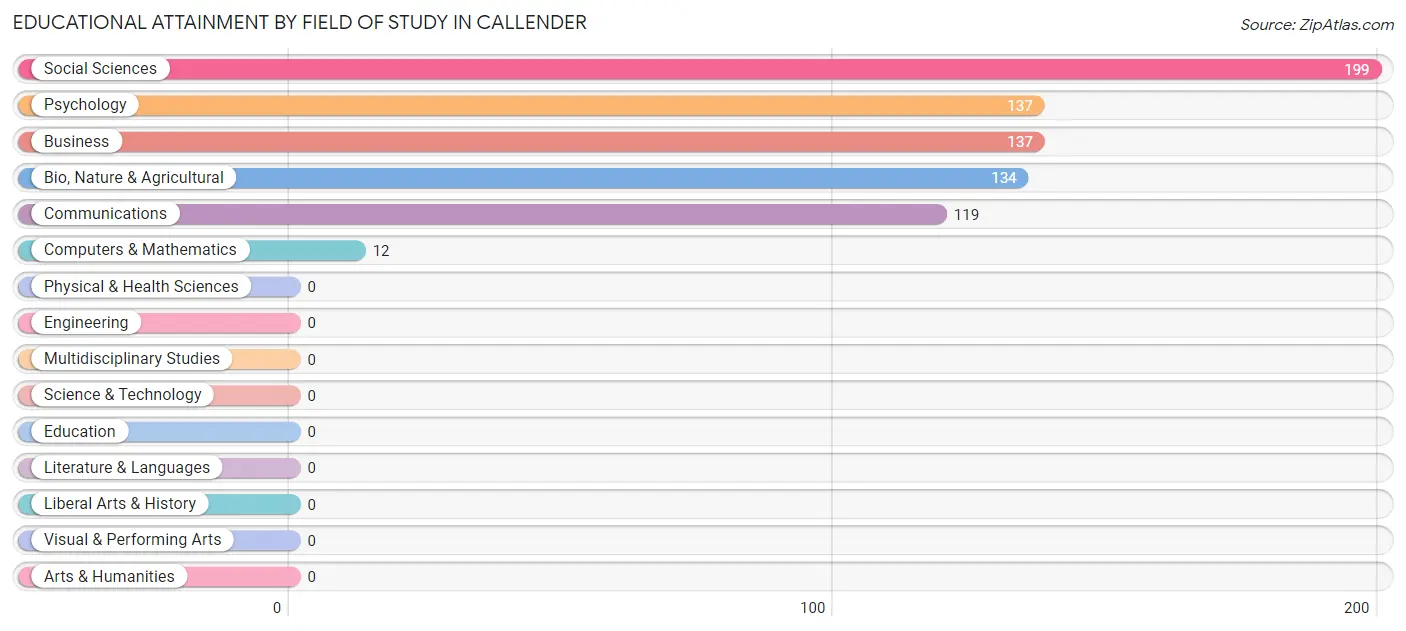
| Field of Study | # Graduates | % Graduates |
| Computers & Mathematics | 12 | 1.6% |
| Bio, Nature & Agricultural | 134 | 18.2% |
| Physical & Health Sciences | 0 | 0.0% |
| Psychology | 137 | 18.6% |
| Social Sciences | 199 | 27.0% |
| Engineering | 0 | 0.0% |
| Multidisciplinary Studies | 0 | 0.0% |
| Science & Technology | 0 | 0.0% |
| Business | 137 | 18.6% |
| Education | 0 | 0.0% |
| Literature & Languages | 0 | 0.0% |
| Liberal Arts & History | 0 | 0.0% |
| Visual & Performing Arts | 0 | 0.0% |
| Communications | 119 | 16.1% |
| Arts & Humanities | 0 | 0.0% |
| Total | 738 | 100.0% |
Transportation & Commute in Callender
Vehicle Availability by Sex in Callender
The most prevalent vehicle ownership categories in Callender are males with 3 vehicles (324, accounting for 39.4%) and females with 3 vehicles (181, making up 72.2%).
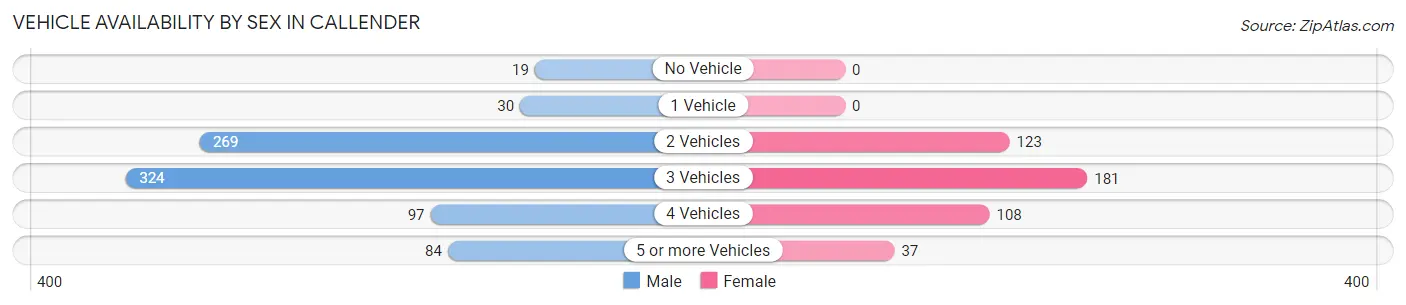
| Vehicles Available | Male | Female |
| No Vehicle | 19 (2.3%) | 0 (0.0%) |
| 1 Vehicle | 30 (3.6%) | 0 (0.0%) |
| 2 Vehicles | 269 (32.7%) | 123 (27.4%) |
| 3 Vehicles | 324 (39.4%) | 181 (40.3%) |
| 4 Vehicles | 97 (11.8%) | 108 (24.0%) |
| 5 or more Vehicles | 84 (10.2%) | 37 (8.2%) |
| Total | 823 (100.0%) | 449 (100.0%) |
Commute Time in Callender
The most frequently occuring commute durations in Callender are 20 to 24 minutes (346 commuters, 28.5%), 15 to 19 minutes (228 commuters, 18.8%), and 30 to 34 minutes (175 commuters, 14.4%).
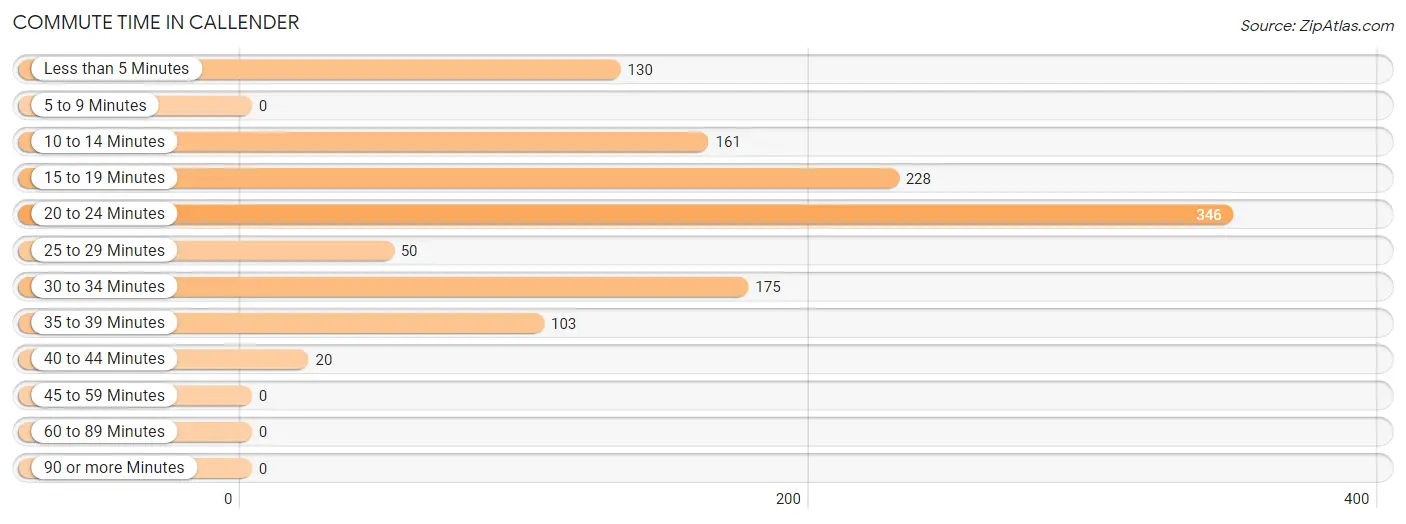
| Commute Time | # Commuters | % Commuters |
| Less than 5 Minutes | 130 | 10.7% |
| 5 to 9 Minutes | 0 | 0.0% |
| 10 to 14 Minutes | 161 | 13.3% |
| 15 to 19 Minutes | 228 | 18.8% |
| 20 to 24 Minutes | 346 | 28.5% |
| 25 to 29 Minutes | 50 | 4.1% |
| 30 to 34 Minutes | 175 | 14.4% |
| 35 to 39 Minutes | 103 | 8.5% |
| 40 to 44 Minutes | 20 | 1.7% |
| 45 to 59 Minutes | 0 | 0.0% |
| 60 to 89 Minutes | 0 | 0.0% |
| 90 or more Minutes | 0 | 0.0% |
Commute Time by Sex in Callender
The most common commute times in Callender are 20 to 24 minutes (288 commuters, 37.7%) for males and 35 to 39 minutes (103 commuters, 22.9%) for females.
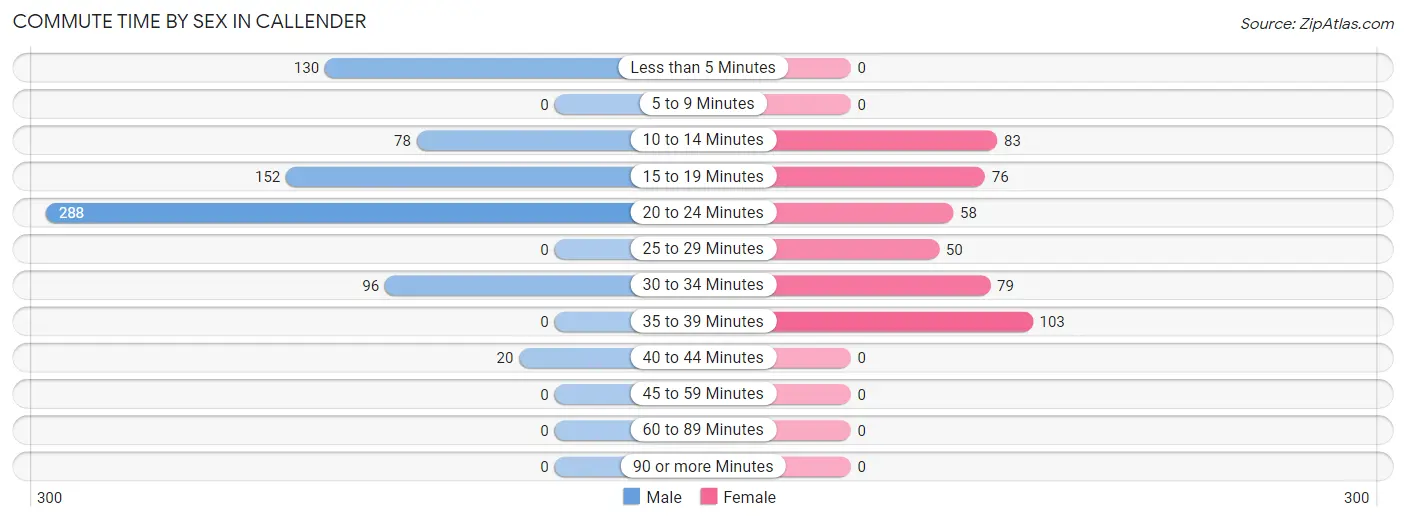
| Commute Time | Male | Female |
| Less than 5 Minutes | 130 (17.0%) | 0 (0.0%) |
| 5 to 9 Minutes | 0 (0.0%) | 0 (0.0%) |
| 10 to 14 Minutes | 78 (10.2%) | 83 (18.5%) |
| 15 to 19 Minutes | 152 (19.9%) | 76 (16.9%) |
| 20 to 24 Minutes | 288 (37.7%) | 58 (12.9%) |
| 25 to 29 Minutes | 0 (0.0%) | 50 (11.1%) |
| 30 to 34 Minutes | 96 (12.6%) | 79 (17.6%) |
| 35 to 39 Minutes | 0 (0.0%) | 103 (22.9%) |
| 40 to 44 Minutes | 20 (2.6%) | 0 (0.0%) |
| 45 to 59 Minutes | 0 (0.0%) | 0 (0.0%) |
| 60 to 89 Minutes | 0 (0.0%) | 0 (0.0%) |
| 90 or more Minutes | 0 (0.0%) | 0 (0.0%) |
Time of Departure to Work by Sex in Callender
The most frequent times of departure to work in Callender are 7:30 AM to 7:59 AM (167, 21.9%) for males and 9:00 AM to 9:59 AM (103, 22.9%) for females.
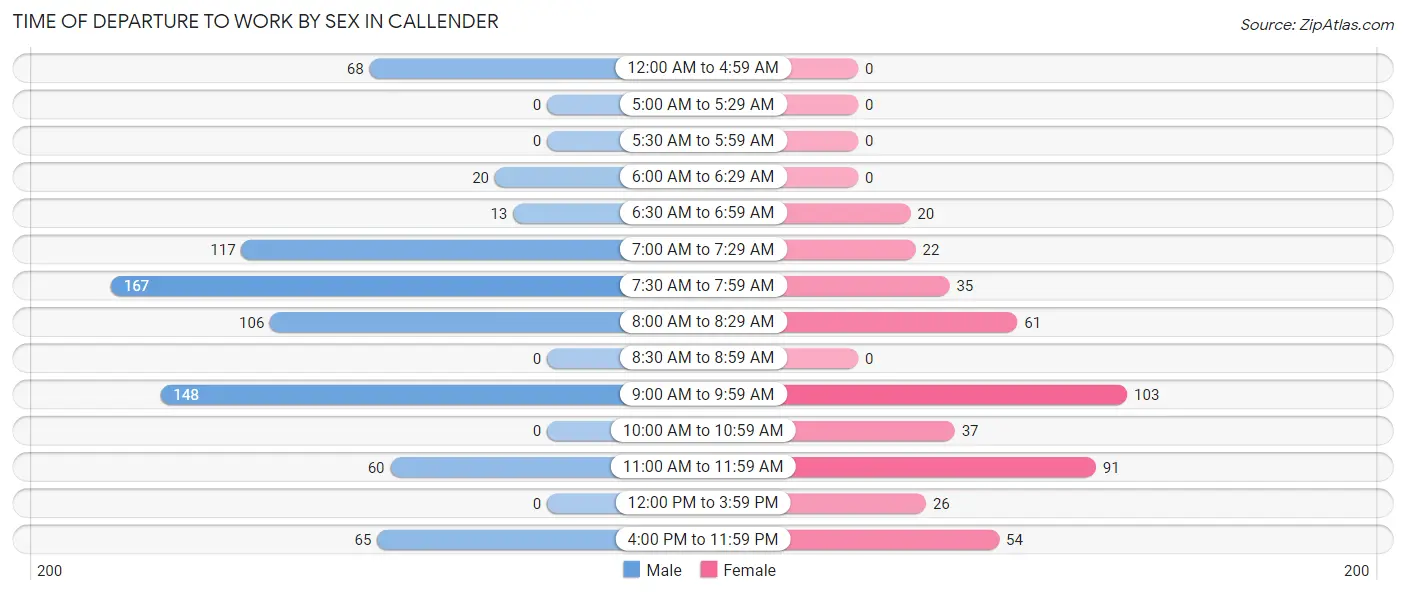
| Time of Departure | Male | Female |
| 12:00 AM to 4:59 AM | 68 (8.9%) | 0 (0.0%) |
| 5:00 AM to 5:29 AM | 0 (0.0%) | 0 (0.0%) |
| 5:30 AM to 5:59 AM | 0 (0.0%) | 0 (0.0%) |
| 6:00 AM to 6:29 AM | 20 (2.6%) | 0 (0.0%) |
| 6:30 AM to 6:59 AM | 13 (1.7%) | 20 (4.4%) |
| 7:00 AM to 7:29 AM | 117 (15.3%) | 22 (4.9%) |
| 7:30 AM to 7:59 AM | 167 (21.9%) | 35 (7.8%) |
| 8:00 AM to 8:29 AM | 106 (13.9%) | 61 (13.6%) |
| 8:30 AM to 8:59 AM | 0 (0.0%) | 0 (0.0%) |
| 9:00 AM to 9:59 AM | 148 (19.4%) | 103 (22.9%) |
| 10:00 AM to 10:59 AM | 0 (0.0%) | 37 (8.2%) |
| 11:00 AM to 11:59 AM | 60 (7.9%) | 91 (20.3%) |
| 12:00 PM to 3:59 PM | 0 (0.0%) | 26 (5.8%) |
| 4:00 PM to 11:59 PM | 65 (8.5%) | 54 (12.0%) |
| Total | 764 (100.0%) | 449 (100.0%) |
Housing Occupancy in Callender
Occupancy by Ownership in Callender
Of the total 863 dwellings in Callender, owner-occupied units account for 545 (63.1%), while renter-occupied units make up 318 (36.8%).
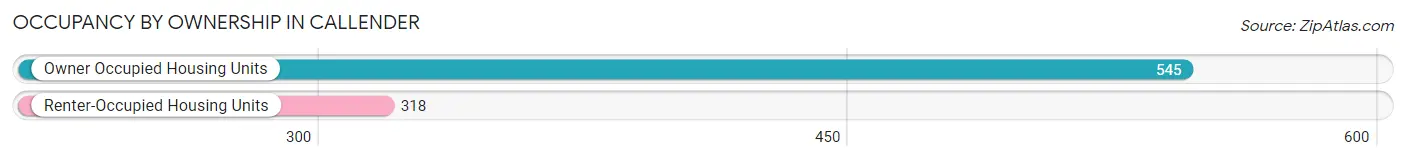
| Occupancy | # Housing Units | % Housing Units |
| Owner Occupied Housing Units | 545 | 63.1% |
| Renter-Occupied Housing Units | 318 | 36.8% |
| Total Occupied Housing Units | 863 | 100.0% |
Occupancy by Household Size in Callender
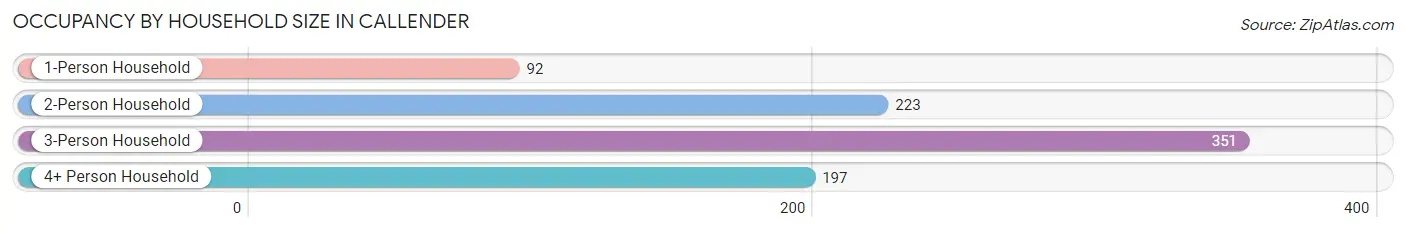
| Household Size | # Housing Units | % Housing Units |
| 1-Person Household | 92 | 10.7% |
| 2-Person Household | 223 | 25.8% |
| 3-Person Household | 351 | 40.7% |
| 4+ Person Household | 197 | 22.8% |
| Total Housing Units | 863 | 100.0% |
Occupancy by Ownership by Household Size in Callender
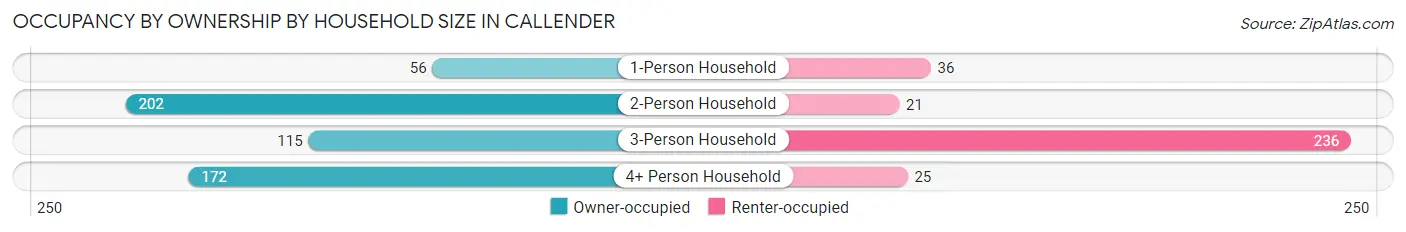
| Household Size | Owner-occupied | Renter-occupied |
| 1-Person Household | 56 (60.9%) | 36 (39.1%) |
| 2-Person Household | 202 (90.6%) | 21 (9.4%) |
| 3-Person Household | 115 (32.8%) | 236 (67.2%) |
| 4+ Person Household | 172 (87.3%) | 25 (12.7%) |
| Total Housing Units | 545 (63.1%) | 318 (36.8%) |
Occupancy by Educational Attainment in Callender
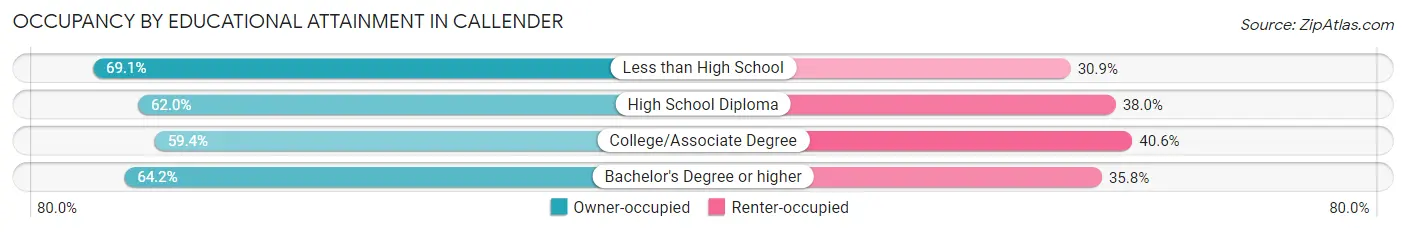
| Household Size | Owner-occupied | Renter-occupied |
| Less than High School | 56 (69.1%) | 25 (30.9%) |
| High School Diploma | 111 (62.0%) | 68 (38.0%) |
| College/Associate Degree | 111 (59.4%) | 76 (40.6%) |
| Bachelor's Degree or higher | 267 (64.2%) | 149 (35.8%) |
Occupancy by Age of Householder in Callender
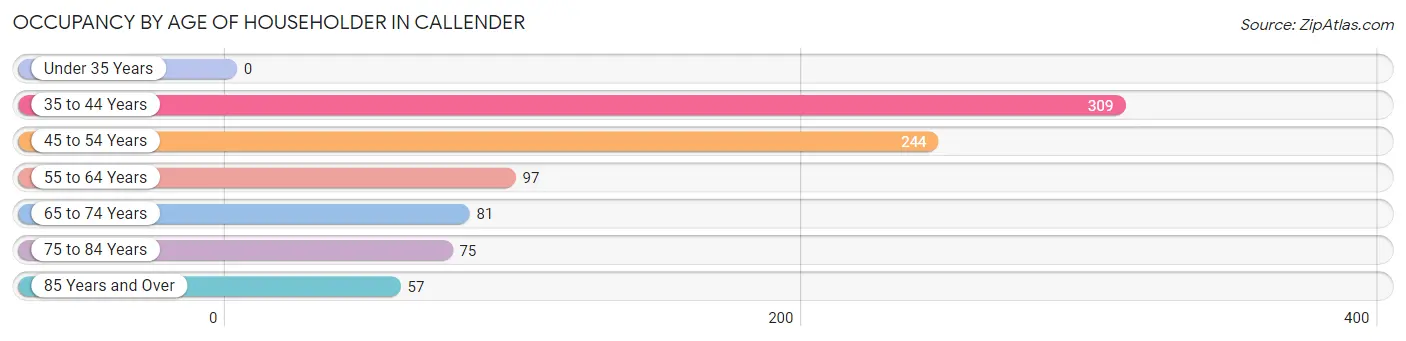
| Age Bracket | # Households | % Households |
| Under 35 Years | 0 | 0.0% |
| 35 to 44 Years | 309 | 35.8% |
| 45 to 54 Years | 244 | 28.3% |
| 55 to 64 Years | 97 | 11.2% |
| 65 to 74 Years | 81 | 9.4% |
| 75 to 84 Years | 75 | 8.7% |
| 85 Years and Over | 57 | 6.6% |
| Total | 863 | 100.0% |
Housing Finances in Callender
Median Income by Occupancy in Callender
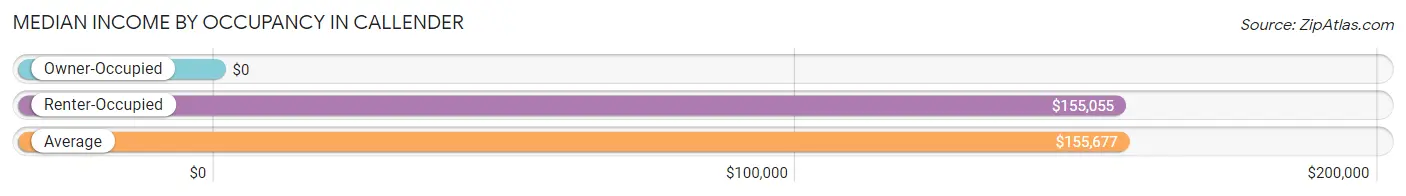
| Occupancy Type | # Households | Median Income |
| Owner-Occupied | 545 (63.1%) | $0 |
| Renter-Occupied | 318 (36.8%) | $155,055 |
| Average | 863 (100.0%) | $155,677 |
Occupancy by Householder Income Bracket in Callender
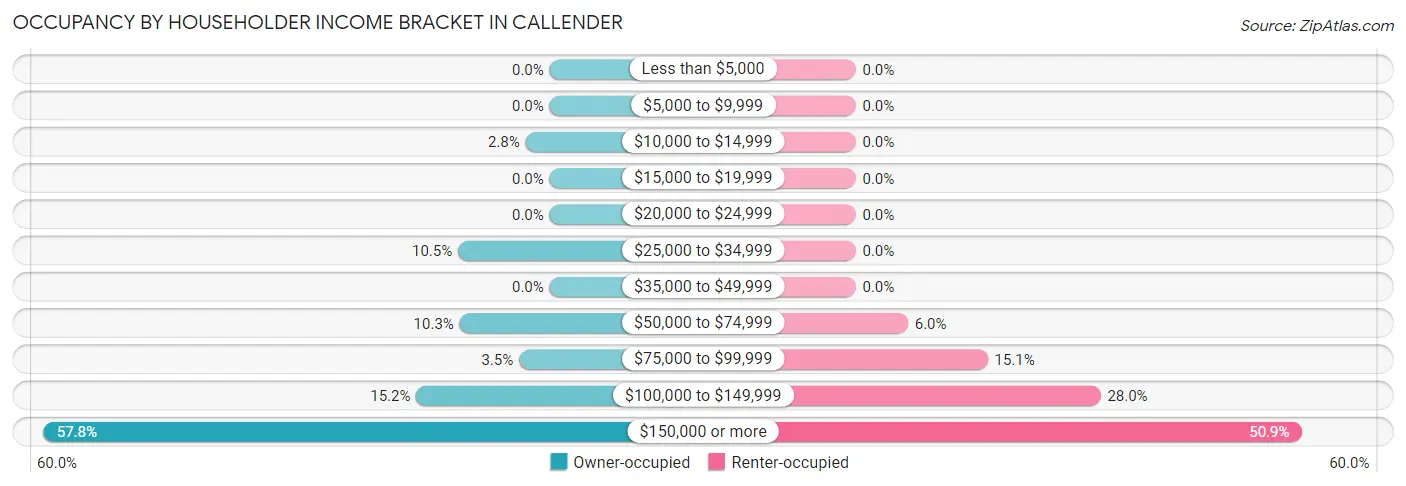
| Income Bracket | Owner-occupied | Renter-occupied |
| Less than $5,000 | 0 (0.0%) | 0 (0.0%) |
| $5,000 to $9,999 | 0 (0.0%) | 0 (0.0%) |
| $10,000 to $14,999 | 15 (2.8%) | 0 (0.0%) |
| $15,000 to $19,999 | 0 (0.0%) | 0 (0.0%) |
| $20,000 to $24,999 | 0 (0.0%) | 0 (0.0%) |
| $25,000 to $34,999 | 57 (10.5%) | 0 (0.0%) |
| $35,000 to $49,999 | 0 (0.0%) | 0 (0.0%) |
| $50,000 to $74,999 | 56 (10.3%) | 19 (6.0%) |
| $75,000 to $99,999 | 19 (3.5%) | 48 (15.1%) |
| $100,000 to $149,999 | 83 (15.2%) | 89 (28.0%) |
| $150,000 or more | 315 (57.8%) | 162 (50.9%) |
| Total | 545 (100.0%) | 318 (100.0%) |
Monthly Housing Cost Tiers in Callender
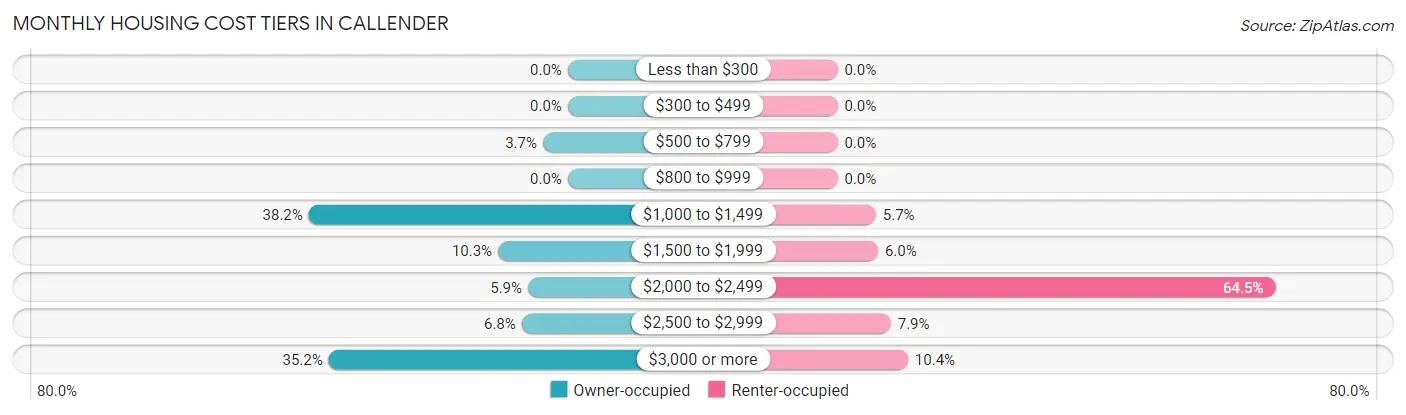
| Monthly Cost | Owner-occupied | Renter-occupied |
| Less than $300 | 0 (0.0%) | 0 (0.0%) |
| $300 to $499 | 0 (0.0%) | 0 (0.0%) |
| $500 to $799 | 20 (3.7%) | 0 (0.0%) |
| $800 to $999 | 0 (0.0%) | 0 (0.0%) |
| $1,000 to $1,499 | 208 (38.2%) | 18 (5.7%) |
| $1,500 to $1,999 | 56 (10.3%) | 19 (6.0%) |
| $2,000 to $2,499 | 32 (5.9%) | 205 (64.5%) |
| $2,500 to $2,999 | 37 (6.8%) | 25 (7.9%) |
| $3,000 or more | 192 (35.2%) | 33 (10.4%) |
| Total | 545 (100.0%) | 318 (100.0%) |
Physical Housing Characteristics in Callender
Housing Structures in Callender
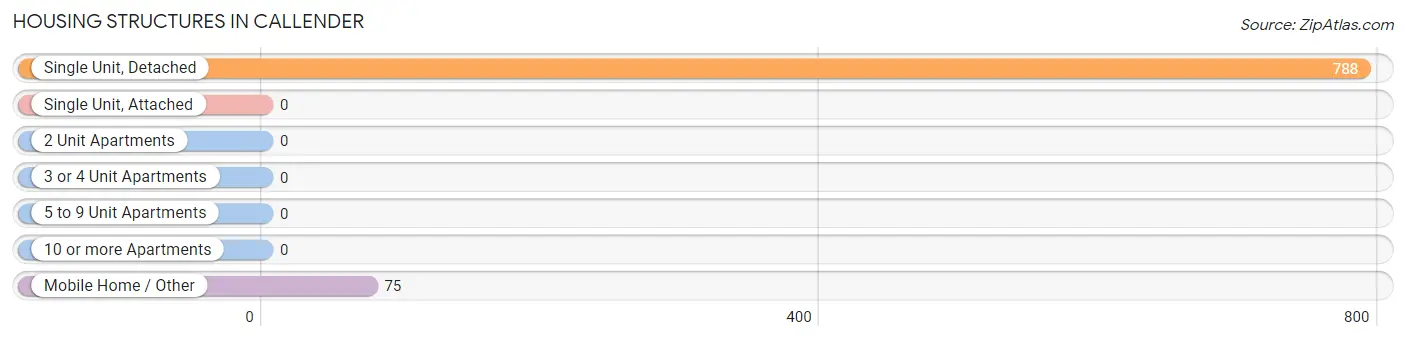
| Structure Type | # Housing Units | % Housing Units |
| Single Unit, Detached | 788 | 91.3% |
| Single Unit, Attached | 0 | 0.0% |
| 2 Unit Apartments | 0 | 0.0% |
| 3 or 4 Unit Apartments | 0 | 0.0% |
| 5 to 9 Unit Apartments | 0 | 0.0% |
| 10 or more Apartments | 0 | 0.0% |
| Mobile Home / Other | 75 | 8.7% |
| Total | 863 | 100.0% |
Housing Structures by Occupancy in Callender
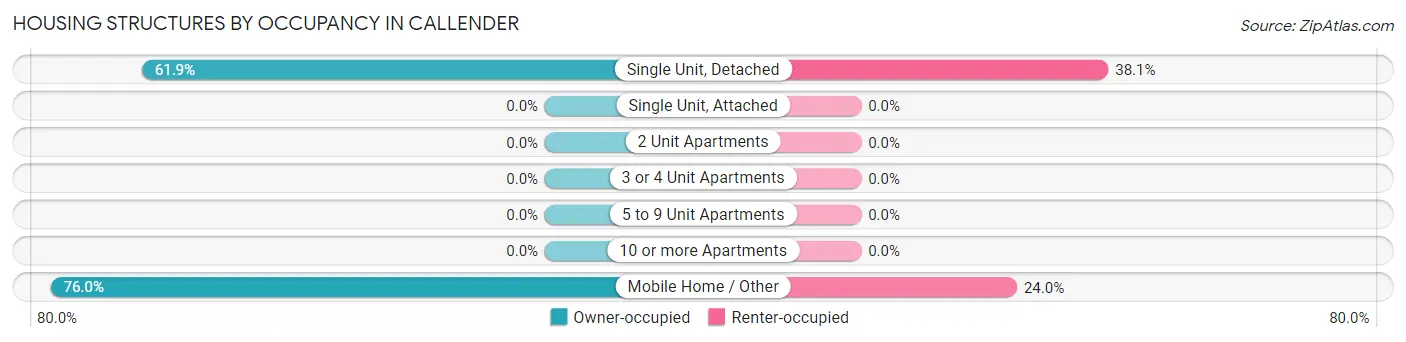
| Structure Type | Owner-occupied | Renter-occupied |
| Single Unit, Detached | 488 (61.9%) | 300 (38.1%) |
| Single Unit, Attached | 0 (0.0%) | 0 (0.0%) |
| 2 Unit Apartments | 0 (0.0%) | 0 (0.0%) |
| 3 or 4 Unit Apartments | 0 (0.0%) | 0 (0.0%) |
| 5 to 9 Unit Apartments | 0 (0.0%) | 0 (0.0%) |
| 10 or more Apartments | 0 (0.0%) | 0 (0.0%) |
| Mobile Home / Other | 57 (76.0%) | 18 (24.0%) |
| Total | 545 (63.1%) | 318 (36.8%) |
Housing Structures by Number of Rooms in Callender
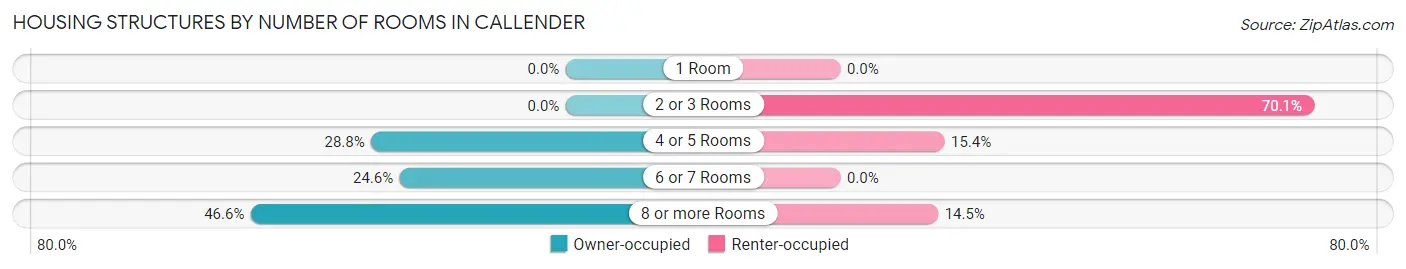
| Number of Rooms | Owner-occupied | Renter-occupied |
| 1 Room | 0 (0.0%) | 0 (0.0%) |
| 2 or 3 Rooms | 0 (0.0%) | 223 (70.1%) |
| 4 or 5 Rooms | 157 (28.8%) | 49 (15.4%) |
| 6 or 7 Rooms | 134 (24.6%) | 0 (0.0%) |
| 8 or more Rooms | 254 (46.6%) | 46 (14.5%) |
| Total | 545 (100.0%) | 318 (100.0%) |
Housing Structure by Heating Type in Callender
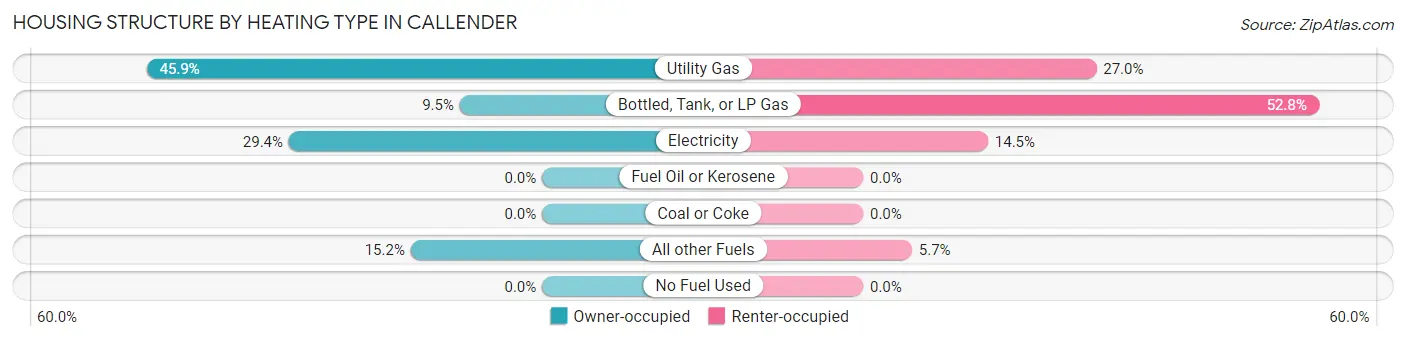
| Heating Type | Owner-occupied | Renter-occupied |
| Utility Gas | 250 (45.9%) | 86 (27.0%) |
| Bottled, Tank, or LP Gas | 52 (9.5%) | 168 (52.8%) |
| Electricity | 160 (29.4%) | 46 (14.5%) |
| Fuel Oil or Kerosene | 0 (0.0%) | 0 (0.0%) |
| Coal or Coke | 0 (0.0%) | 0 (0.0%) |
| All other Fuels | 83 (15.2%) | 18 (5.7%) |
| No Fuel Used | 0 (0.0%) | 0 (0.0%) |
| Total | 545 (100.0%) | 318 (100.0%) |
Household Vehicle Usage in Callender
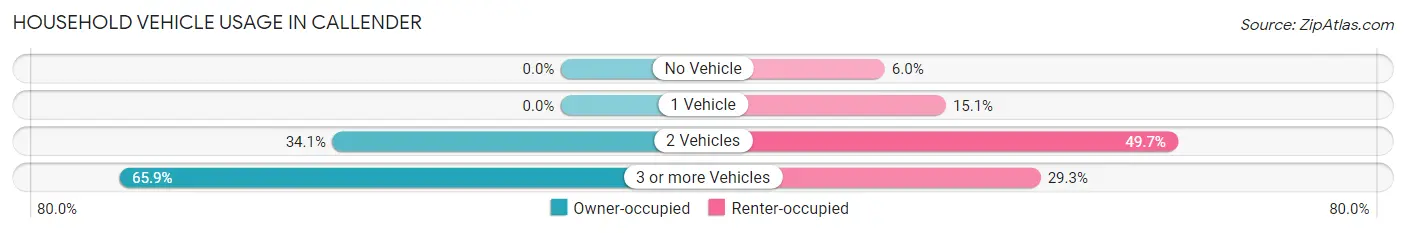
| Vehicles per Household | Owner-occupied | Renter-occupied |
| No Vehicle | 0 (0.0%) | 19 (6.0%) |
| 1 Vehicle | 0 (0.0%) | 48 (15.1%) |
| 2 Vehicles | 186 (34.1%) | 158 (49.7%) |
| 3 or more Vehicles | 359 (65.9%) | 93 (29.2%) |
| Total | 545 (100.0%) | 318 (100.0%) |
Real Estate & Mortgages in Callender
Real Estate and Mortgage Overview in Callender
| Characteristic | Without Mortgage | With Mortgage |
| Housing Units | 228 | 317 |
| Median Property Value | - | - |
| Median Household Income | - | - |
| Monthly Housing Costs | $1,179 | $192 |
| Real Estate Taxes | $10,001 | $0 |
Property Value by Mortgage Status in Callender
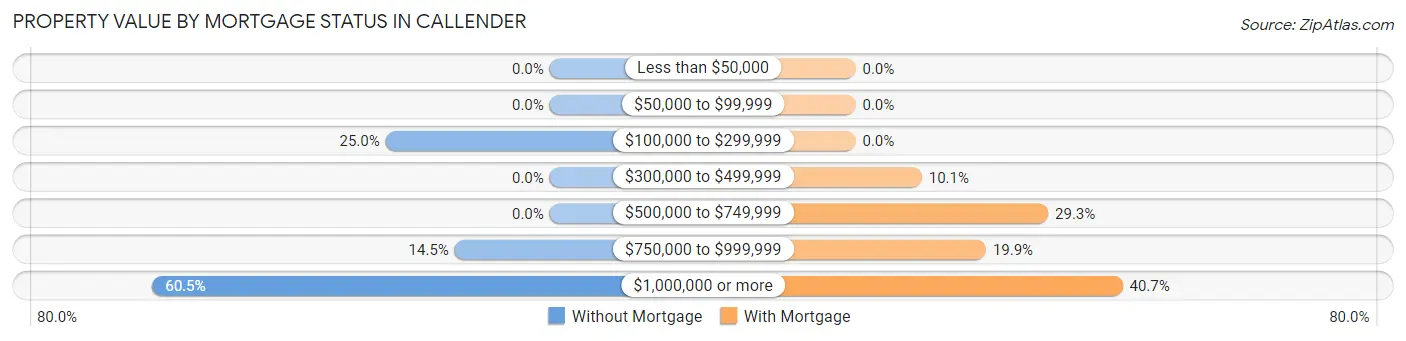
| Property Value | Without Mortgage | With Mortgage |
| Less than $50,000 | 0 (0.0%) | 0 (0.0%) |
| $50,000 to $99,999 | 0 (0.0%) | 0 (0.0%) |
| $100,000 to $299,999 | 57 (25.0%) | 0 (0.0%) |
| $300,000 to $499,999 | 0 (0.0%) | 32 (10.1%) |
| $500,000 to $749,999 | 0 (0.0%) | 93 (29.3%) |
| $750,000 to $999,999 | 33 (14.5%) | 63 (19.9%) |
| $1,000,000 or more | 138 (60.5%) | 129 (40.7%) |
| Total | 228 (100.0%) | 317 (100.0%) |
Household Income by Mortgage Status in Callender
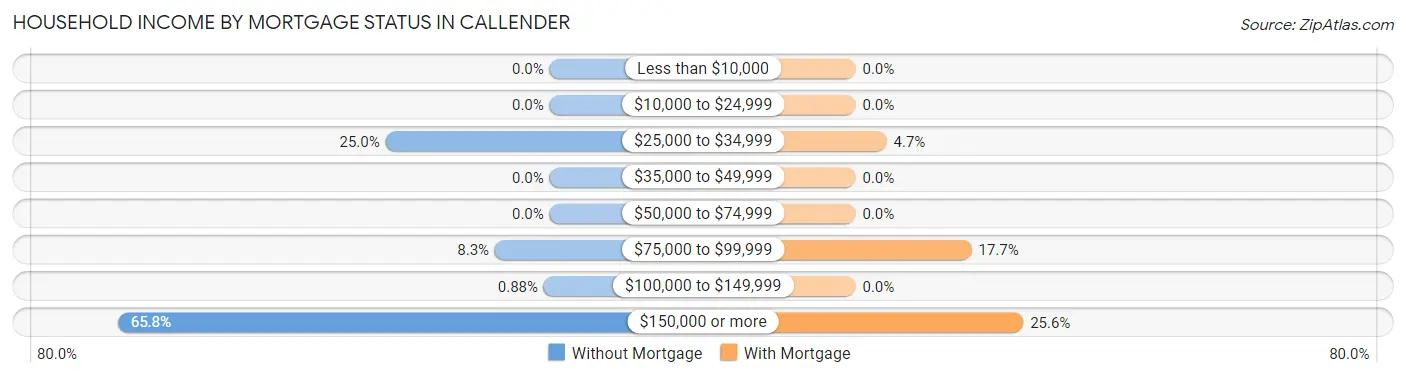
| Household Income | Without Mortgage | With Mortgage |
| Less than $10,000 | 0 (0.0%) | 0 (0.0%) |
| $10,000 to $24,999 | 0 (0.0%) | 0 (0.0%) |
| $25,000 to $34,999 | 57 (25.0%) | 15 (4.7%) |
| $35,000 to $49,999 | 0 (0.0%) | 0 (0.0%) |
| $50,000 to $74,999 | 0 (0.0%) | 0 (0.0%) |
| $75,000 to $99,999 | 19 (8.3%) | 56 (17.7%) |
| $100,000 to $149,999 | 2 (0.9%) | 0 (0.0%) |
| $150,000 or more | 150 (65.8%) | 81 (25.6%) |
| Total | 228 (100.0%) | 317 (100.0%) |
Property Value to Household Income Ratio in Callender
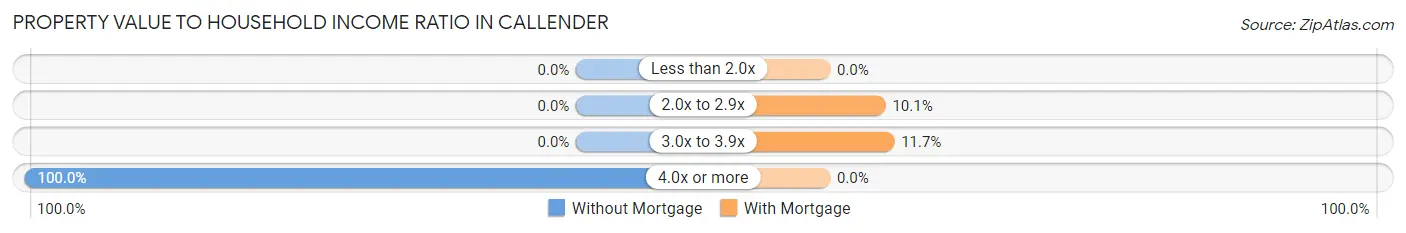
| Value-to-Income Ratio | Without Mortgage | With Mortgage |
| Less than 2.0x | 0 (0.0%) | 0 (0.0%) |
| 2.0x to 2.9x | 0 (0.0%) | 32 (10.1%) |
| 3.0x to 3.9x | 0 (0.0%) | 37 (11.7%) |
| 4.0x or more | 228 (100.0%) | 0 (0.0%) |
| Total | 228 (100.0%) | 317 (100.0%) |
Real Estate Taxes by Mortgage Status in Callender
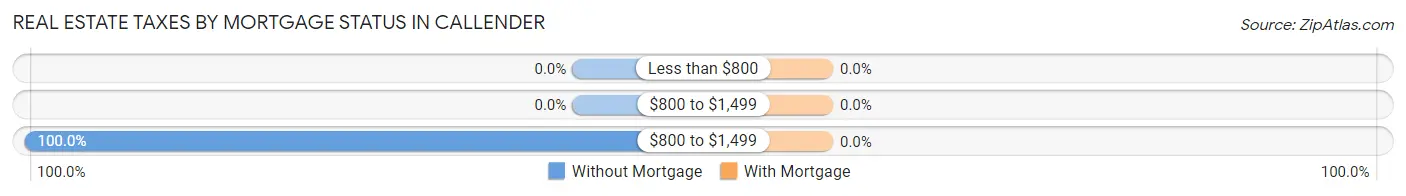
| Property Taxes | Without Mortgage | With Mortgage |
| Less than $800 | 0 (0.0%) | 0 (0.0%) |
| $800 to $1,499 | 0 (0.0%) | 0 (0.0%) |
| $800 to $1,499 | 228 (100.0%) | 0 (0.0%) |
| Total | 228 (100.0%) | 317 (100.0%) |
Health & Disability in Callender
Health Insurance Coverage by Age in Callender
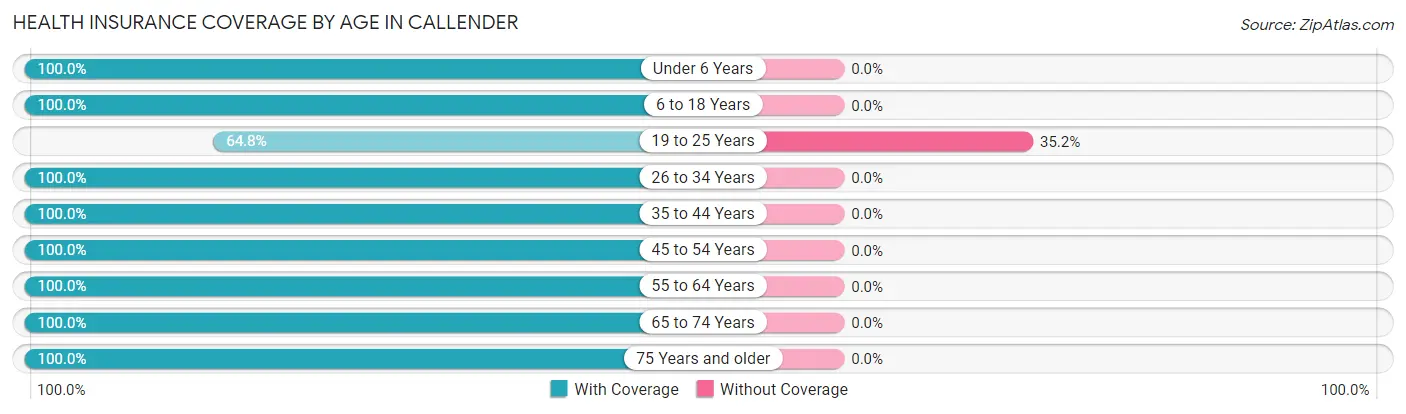
| Age Bracket | With Coverage | Without Coverage |
| Under 6 Years | 328 (100.0%) | 0 (0.0%) |
| 6 to 18 Years | 363 (100.0%) | 0 (0.0%) |
| 19 to 25 Years | 81 (64.8%) | 44 (35.2%) |
| 26 to 34 Years | 81 (100.0%) | 0 (0.0%) |
| 35 to 44 Years | 621 (100.0%) | 0 (0.0%) |
| 45 to 54 Years | 385 (100.0%) | 0 (0.0%) |
| 55 to 64 Years | 189 (100.0%) | 0 (0.0%) |
| 65 to 74 Years | 160 (100.0%) | 0 (0.0%) |
| 75 Years and older | 192 (100.0%) | 0 (0.0%) |
| Total | 2,400 (98.2%) | 44 (1.8%) |
Health Insurance Coverage by Citizenship Status in Callender
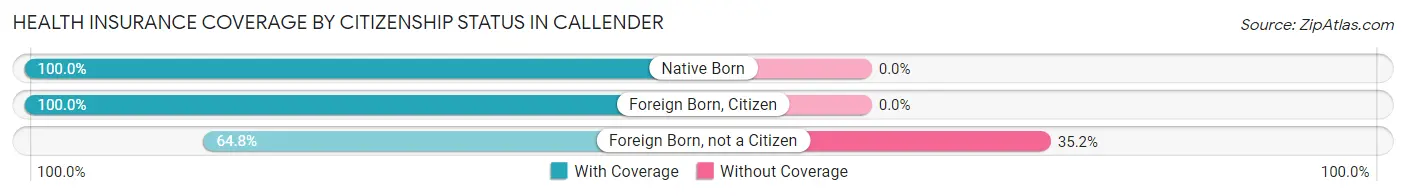
| Citizenship Status | With Coverage | Without Coverage |
| Native Born | 328 (100.0%) | 0 (0.0%) |
| Foreign Born, Citizen | 363 (100.0%) | 0 (0.0%) |
| Foreign Born, not a Citizen | 81 (64.8%) | 44 (35.2%) |
Health Insurance Coverage by Household Income in Callender
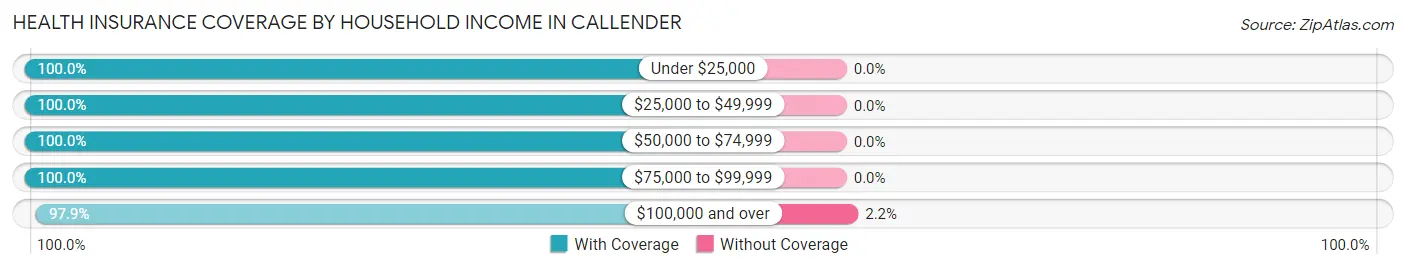
| Household Income | With Coverage | Without Coverage |
| Under $25,000 | 27 (100.0%) | 0 (0.0%) |
| $25,000 to $49,999 | 117 (100.0%) | 0 (0.0%) |
| $50,000 to $74,999 | 106 (100.0%) | 0 (0.0%) |
| $75,000 to $99,999 | 138 (100.0%) | 0 (0.0%) |
| $100,000 and over | 2,005 (97.9%) | 44 (2.1%) |
Public vs Private Health Insurance Coverage by Age in Callender
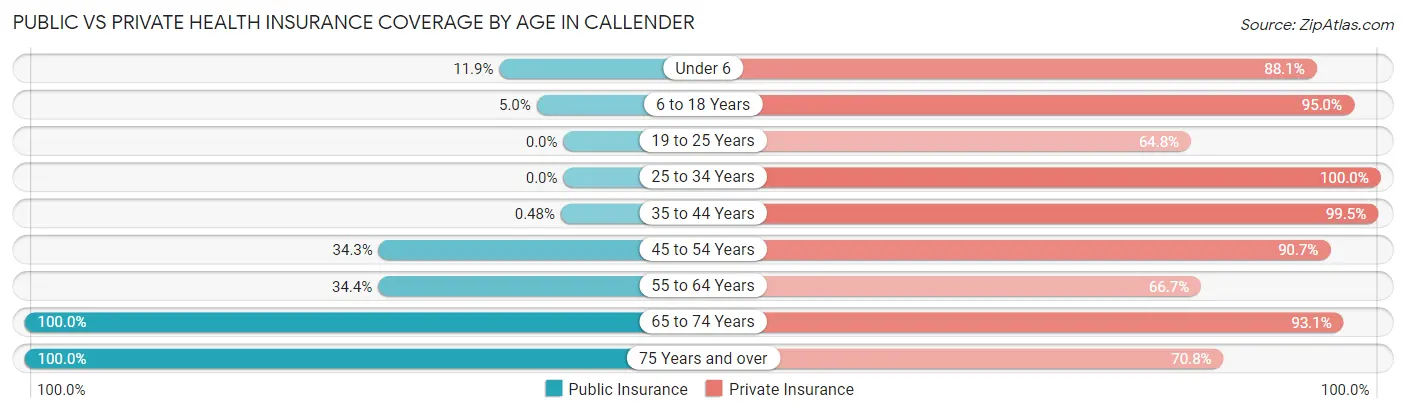
| Age Bracket | Public Insurance | Private Insurance |
| Under 6 | 39 (11.9%) | 289 (88.1%) |
| 6 to 18 Years | 18 (5.0%) | 345 (95.0%) |
| 19 to 25 Years | 0 (0.0%) | 81 (64.8%) |
| 25 to 34 Years | 0 (0.0%) | 81 (100.0%) |
| 35 to 44 Years | 3 (0.5%) | 618 (99.5%) |
| 45 to 54 Years | 132 (34.3%) | 349 (90.6%) |
| 55 to 64 Years | 65 (34.4%) | 126 (66.7%) |
| 65 to 74 Years | 160 (100.0%) | 149 (93.1%) |
| 75 Years and over | 192 (100.0%) | 136 (70.8%) |
| Total | 609 (24.9%) | 2,174 (88.9%) |
Disability Status by Sex by Age in Callender
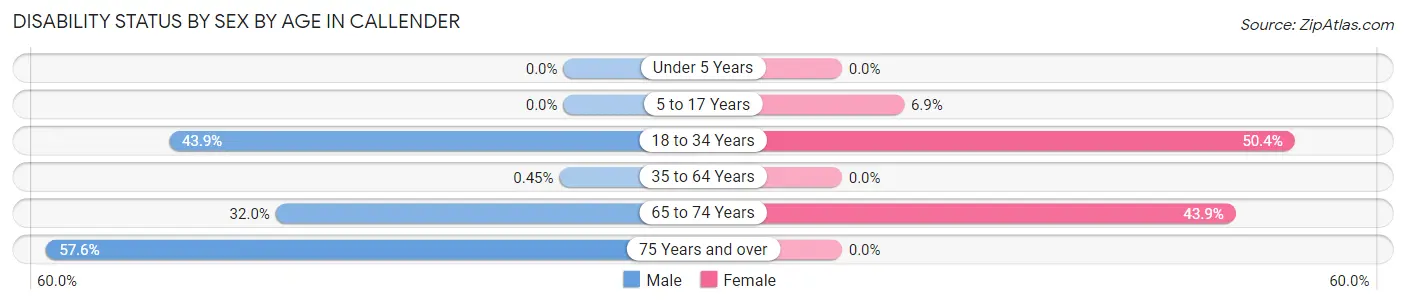
| Age Bracket | Male | Female |
| Under 5 Years | 0 (0.0%) | 0 (0.0%) |
| 5 to 17 Years | 0 (0.0%) | 18 (6.9%) |
| 18 to 34 Years | 65 (43.9%) | 62 (50.4%) |
| 35 to 64 Years | 3 (0.4%) | 0 (0.0%) |
| 65 to 74 Years | 33 (32.0%) | 25 (43.9%) |
| 75 Years and over | 76 (57.6%) | 0 (0.0%) |
Disability Class by Sex by Age in Callender
Disability Class: Hearing Difficulty
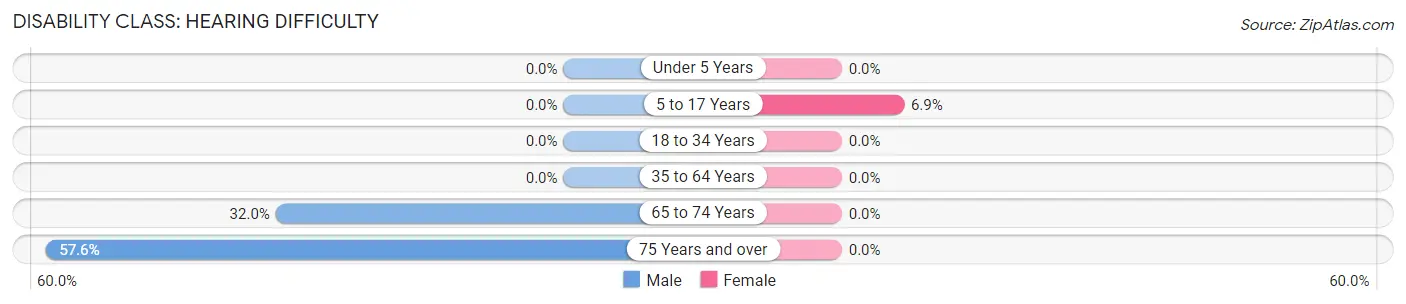
| Age Bracket | Male | Female |
| Under 5 Years | 0 (0.0%) | 0 (0.0%) |
| 5 to 17 Years | 0 (0.0%) | 18 (6.9%) |
| 18 to 34 Years | 0 (0.0%) | 0 (0.0%) |
| 35 to 64 Years | 0 (0.0%) | 0 (0.0%) |
| 65 to 74 Years | 33 (32.0%) | 0 (0.0%) |
| 75 Years and over | 76 (57.6%) | 0 (0.0%) |
Disability Class: Vision Difficulty
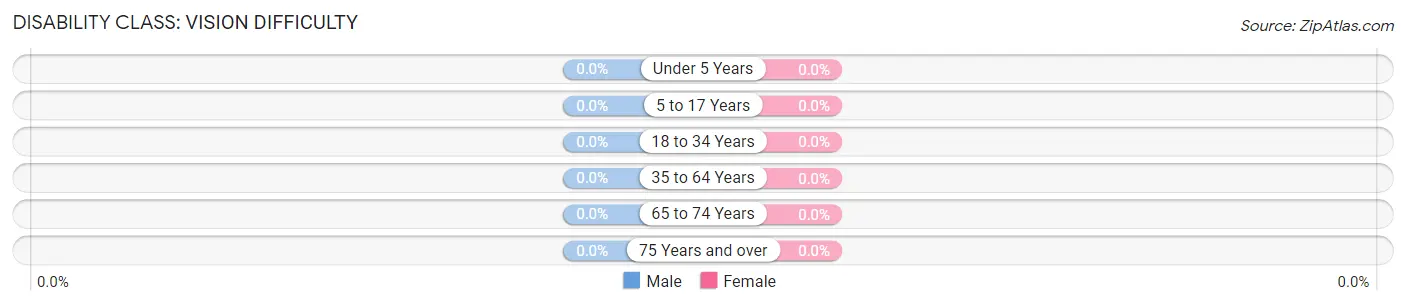
| Age Bracket | Male | Female |
| Under 5 Years | 0 (0.0%) | 0 (0.0%) |
| 5 to 17 Years | 0 (0.0%) | 0 (0.0%) |
| 18 to 34 Years | 0 (0.0%) | 0 (0.0%) |
| 35 to 64 Years | 0 (0.0%) | 0 (0.0%) |
| 65 to 74 Years | 0 (0.0%) | 0 (0.0%) |
| 75 Years and over | 0 (0.0%) | 0 (0.0%) |
Disability Class: Cognitive Difficulty
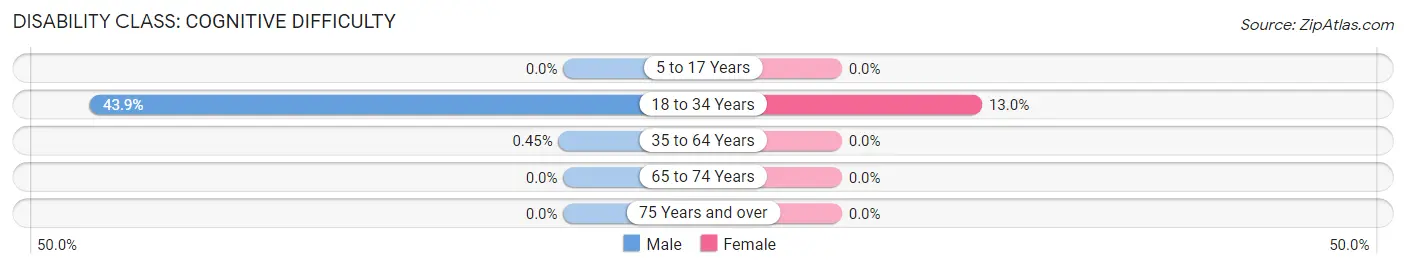
| Age Bracket | Male | Female |
| 5 to 17 Years | 0 (0.0%) | 0 (0.0%) |
| 18 to 34 Years | 65 (43.9%) | 16 (13.0%) |
| 35 to 64 Years | 3 (0.4%) | 0 (0.0%) |
| 65 to 74 Years | 0 (0.0%) | 0 (0.0%) |
| 75 Years and over | 0 (0.0%) | 0 (0.0%) |
Disability Class: Ambulatory Difficulty
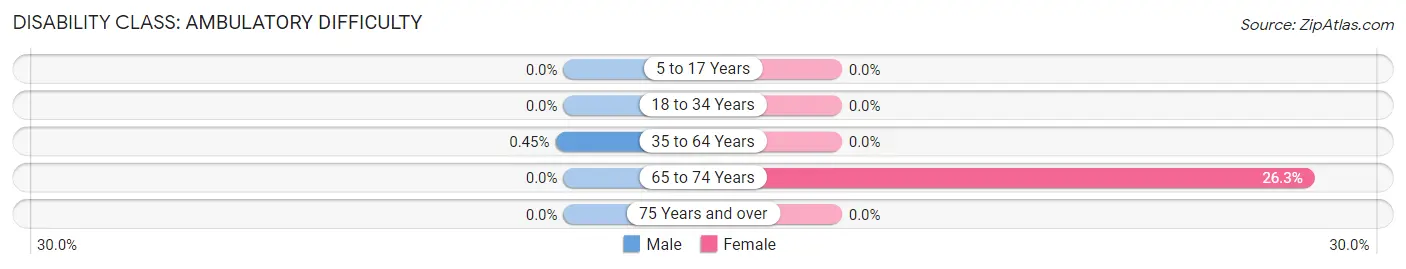
| Age Bracket | Male | Female |
| 5 to 17 Years | 0 (0.0%) | 0 (0.0%) |
| 18 to 34 Years | 0 (0.0%) | 0 (0.0%) |
| 35 to 64 Years | 3 (0.4%) | 0 (0.0%) |
| 65 to 74 Years | 0 (0.0%) | 15 (26.3%) |
| 75 Years and over | 0 (0.0%) | 0 (0.0%) |
Disability Class: Self-Care Difficulty
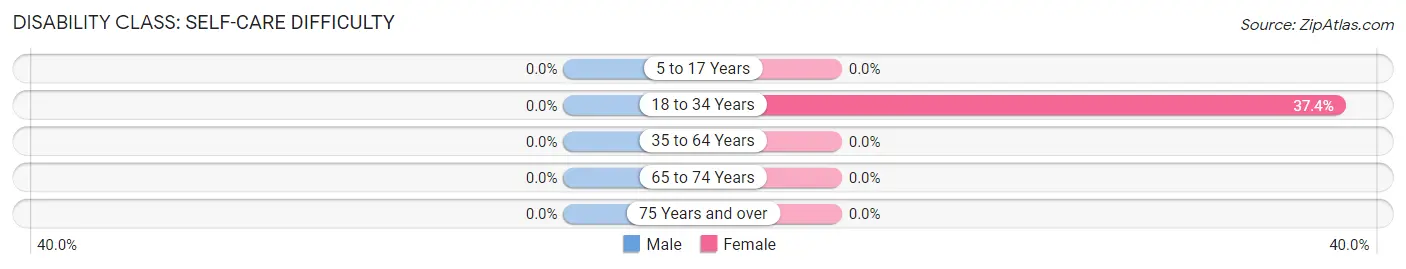
| Age Bracket | Male | Female |
| 5 to 17 Years | 0 (0.0%) | 0 (0.0%) |
| 18 to 34 Years | 0 (0.0%) | 46 (37.4%) |
| 35 to 64 Years | 0 (0.0%) | 0 (0.0%) |
| 65 to 74 Years | 0 (0.0%) | 0 (0.0%) |
| 75 Years and over | 0 (0.0%) | 0 (0.0%) |
Technology Access in Callender
Computing Device Access in Callender
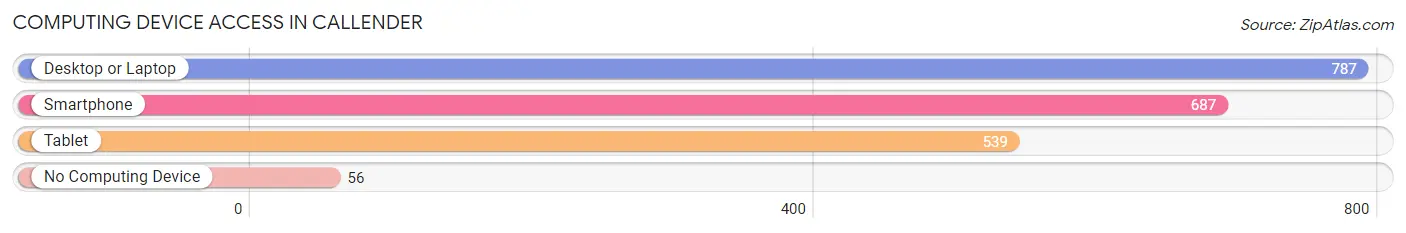
| Device Type | # Households | % Households |
| Desktop or Laptop | 787 | 91.2% |
| Smartphone | 687 | 79.6% |
| Tablet | 539 | 62.5% |
| No Computing Device | 56 | 6.5% |
| Total | 863 | 100.0% |
Internet Access in Callender
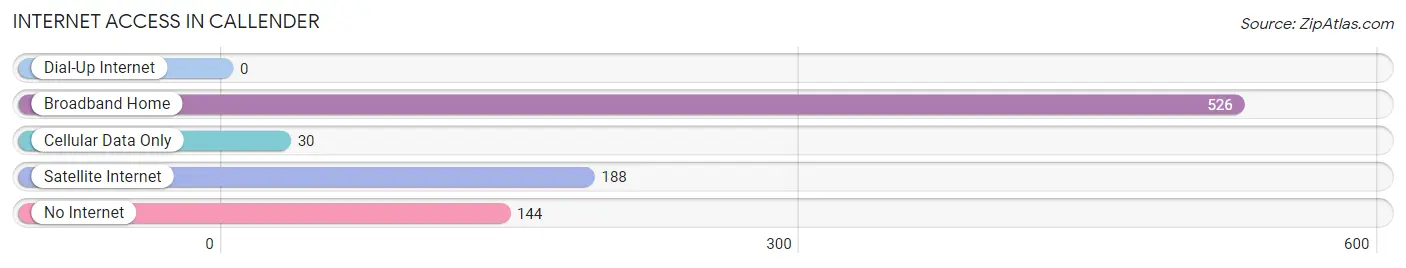
| Internet Type | # Households | % Households |
| Dial-Up Internet | 0 | 0.0% |
| Broadband Home | 526 | 61.0% |
| Cellular Data Only | 30 | 3.5% |
| Satellite Internet | 188 | 21.8% |
| No Internet | 144 | 16.7% |
| Total | 863 | 100.0% |
Callender Summary
Callender, California is a small town located in the northern part of the state, in the Sierra Nevada foothills. It is situated in the Sierra Valley, which is a large agricultural valley that stretches from the Sierra Nevada Mountains to the Sacramento Valley. The town is located in Sierra County, which is one of the most rural counties in California. The population of Callender was estimated to be 1,845 in 2020.
Geography
Callender is located in the Sierra Valley, which is a large agricultural valley that stretches from the Sierra Nevada Mountains to the Sacramento Valley. The town is situated at an elevation of 2,845 feet and is surrounded by rolling hills and mountains. The town is located in Sierra County, which is one of the most rural counties in California. The county is home to a variety of wildlife, including deer, elk, bear, and mountain lions. The town is located near the Feather River, which is a major tributary of the Sacramento River.
Economy
The economy of Callender is largely based on agriculture. The town is home to a variety of farms, including cattle, sheep, and alfalfa. The town is also home to a number of small businesses, including restaurants, stores, and a gas station. The town is also home to a number of small manufacturing businesses, including a furniture factory and a woodworking shop.
Demographics
The population of Callender was estimated to be 1,845 in 2020. The town is predominantly white, with a population that is approximately 90% white. The town also has a small Hispanic population, which makes up about 5% of the population. The median household income in Callender is $45,000, which is slightly lower than the state average.
Conclusion
Callender, California is a small town located in the northern part of the state, in the Sierra Nevada foothills. The town is situated in the Sierra Valley, which is a large agricultural valley that stretches from the Sierra Nevada Mountains to the Sacramento Valley. The economy of Callender is largely based on agriculture, with a variety of farms and small businesses located in the town. The population of Callender was estimated to be 1,845 in 2020, and the town is predominantly white, with a small Hispanic population.
Common Questions
What is Per Capita Income in Callender?
Per Capita income in Callender is $56,540.
What is the Median Family Income in Callender?
Median Family Income in Callender is $156,909.
What is the Median Household income in Callender?
Median Household Income in Callender is $155,677.
What is Income or Wage Gap in Callender?
Income or Wage Gap in Callender is 46.2%.
Women in Callender earn 53.8 cents for every dollar earned by a man.
What is Inequality or Gini Index in Callender?
Inequality or Gini Index in Callender is 0.34.
What is the Total Population of Callender?
Total Population of Callender is 2,444.
What is the Total Male Population of Callender?
Total Male Population of Callender is 1,270.
What is the Total Female Population of Callender?
Total Female Population of Callender is 1,174.
What is the Ratio of Males per 100 Females in Callender?
There are 108.18 Males per 100 Females in Callender.
What is the Ratio of Females per 100 Males in Callender?
There are 92.44 Females per 100 Males in Callender.
What is the Median Population Age in Callender?
Median Population Age in Callender is 38.3 Years.
What is the Average Family Size in Callender
Average Family Size in Callender is 3.1 People.
What is the Average Household Size in Callender
Average Household Size in Callender is 2.8 People.
How Large is the Labor Force in Callender?
There are 1,401 People in the Labor Forcein in Callender.
What is the Percentage of People in the Labor Force in Callender?
74.9% of People are in the Labor Force in Callender.