San Marino, CA Map & Demographics
San Marino Map
San Marino Overview
$88,297
PER CAPITA INCOME
$199,931
AVG FAMILY INCOME
$174,253
AVG HOUSEHOLD INCOME
55.6%
WAGE / INCOME GAP [ % ]
44.4¢/ $1
WAGE / INCOME GAP [ $ ]
0.51
INEQUALITY / GINI INDEX
12,442
TOTAL POPULATION
6,345
MALE POPULATION
6,097
FEMALE POPULATION
104.07
MALES / 100 FEMALES
96.09
FEMALES / 100 MALES
45.5
MEDIAN AGE
3.3
AVG FAMILY SIZE
3.1
AVG HOUSEHOLD SIZE
5,737
LABOR FORCE [ PEOPLE ]
57.1%
PERCENT IN LABOR FORCE
4.4%
UNEMPLOYMENT RATE
San Marino Zip Codes
San Marino Area Codes
Income in San Marino
Income Overview in San Marino
Per Capita Income in San Marino is $88,297, while median incomes of families and households are $199,931 and $174,253 respectively.
| Characteristic | Number | Measure |
| Per Capita Income | 12,442 | $88,297 |
| Median Family Income | 3,369 | $199,931 |
| Mean Family Income | 3,369 | $295,372 |
| Median Household Income | 3,916 | $174,253 |
| Mean Household Income | 3,916 | $271,401 |
| Income Deficit | 3,369 | $0 |
| Wage / Income Gap (%) | 12,442 | 55.55% |
| Wage / Income Gap ($) | 12,442 | 44.45¢ per $1 |
| Gini / Inequality Index | 12,442 | 0.51 |
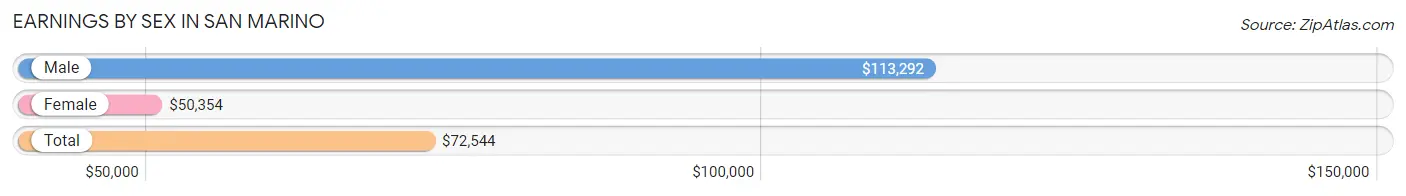
Earnings by Sex in San Marino
Average Earnings in San Marino are $72,544, $113,292 for men and $50,354 for women, a difference of 55.5%.
| Sex | Number | Average Earnings |
| Male | 3,441 (58.0%) | $113,292 |
| Female | 2,497 (42.0%) | $50,354 |
| Total | 5,938 (100.0%) | $72,544 |
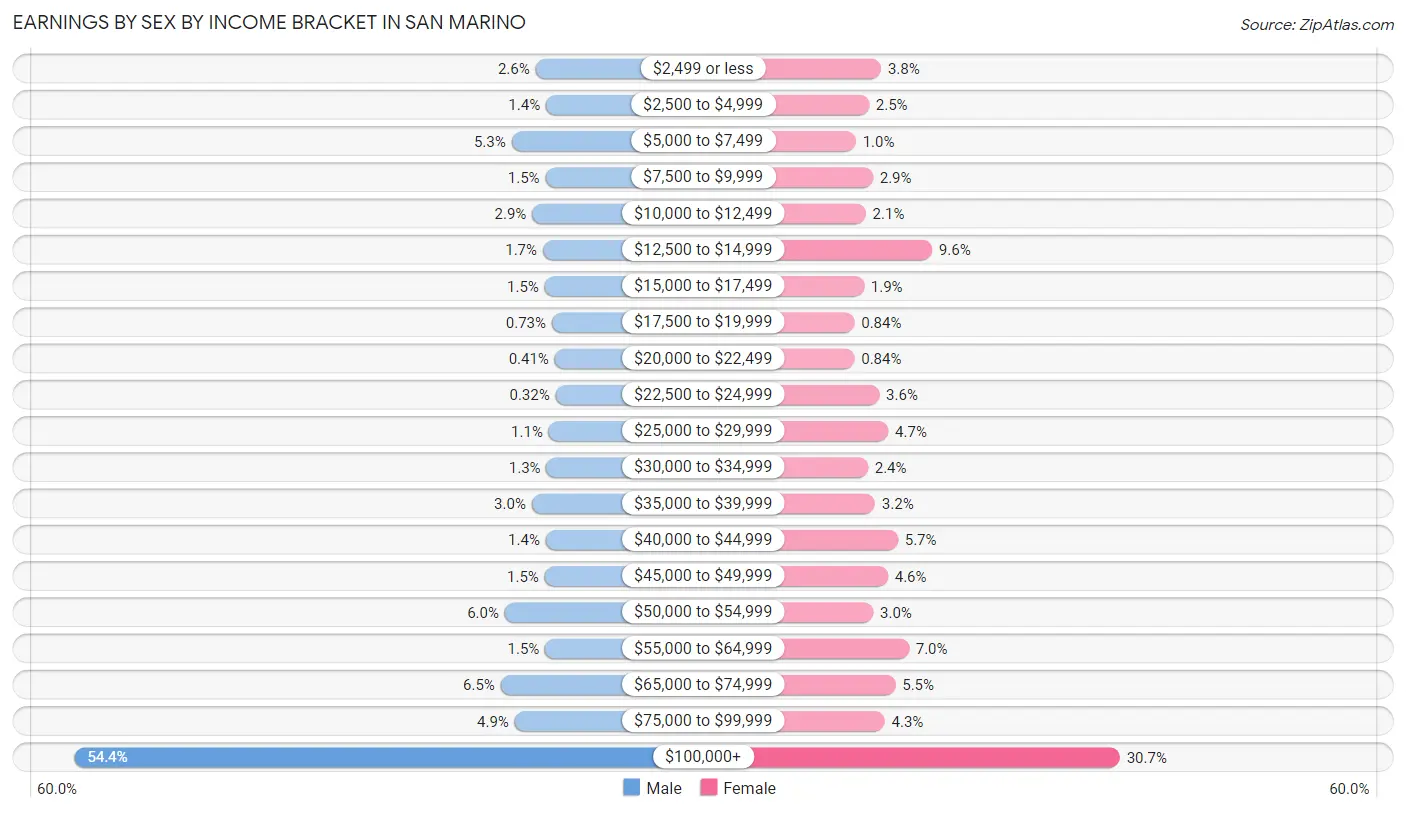
Earnings by Sex by Income Bracket in San Marino
The most common earnings brackets in San Marino are $100,000+ for men (1,872 | 54.4%) and $100,000+ for women (766 | 30.7%).
| Income | Male | Female |
| $2,499 or less | 88 (2.6%) | 96 (3.8%) |
| $2,500 to $4,999 | 48 (1.4%) | 62 (2.5%) |
| $5,000 to $7,499 | 181 (5.3%) | 25 (1.0%) |
| $7,500 to $9,999 | 50 (1.5%) | 73 (2.9%) |
| $10,000 to $12,499 | 101 (2.9%) | 53 (2.1%) |
| $12,500 to $14,999 | 60 (1.7%) | 239 (9.6%) |
| $15,000 to $17,499 | 53 (1.5%) | 48 (1.9%) |
| $17,500 to $19,999 | 25 (0.7%) | 21 (0.8%) |
| $20,000 to $22,499 | 14 (0.4%) | 21 (0.8%) |
| $22,500 to $24,999 | 11 (0.3%) | 91 (3.6%) |
| $25,000 to $29,999 | 37 (1.1%) | 116 (4.6%) |
| $30,000 to $34,999 | 46 (1.3%) | 59 (2.4%) |
| $35,000 to $39,999 | 103 (3.0%) | 79 (3.2%) |
| $40,000 to $44,999 | 49 (1.4%) | 143 (5.7%) |
| $45,000 to $49,999 | 53 (1.5%) | 115 (4.6%) |
| $50,000 to $54,999 | 207 (6.0%) | 74 (3.0%) |
| $55,000 to $64,999 | 51 (1.5%) | 174 (7.0%) |
| $65,000 to $74,999 | 223 (6.5%) | 136 (5.4%) |
| $75,000 to $99,999 | 169 (4.9%) | 106 (4.3%) |
| $100,000+ | 1,872 (54.4%) | 766 (30.7%) |
| Total | 3,441 (100.0%) | 2,497 (100.0%) |
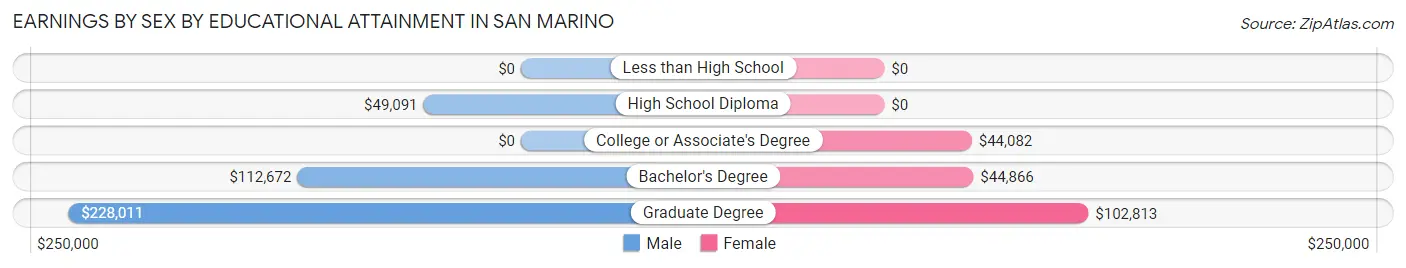
Earnings by Sex by Educational Attainment in San Marino
Average earnings in San Marino are $117,593 for men and $52,798 for women, a difference of 55.1%. Men with an educational attainment of graduate degree enjoy the highest average annual earnings of $228,011, while those with high school diploma education earn the least with $49,091. Women with an educational attainment of graduate degree earn the most with the average annual earnings of $102,813, while those with college or associate's degree education have the smallest earnings of $44,082.
| Educational Attainment | Male Income | Female Income |
| Less than High School | - | - |
| High School Diploma | $49,091 | $0 |
| College or Associate's Degree | - | - |
| Bachelor's Degree | $112,672 | $44,866 |
| Graduate Degree | $228,011 | $102,813 |
| Total | $117,593 | $52,798 |
Family Income in San Marino
Family Income Brackets in San Marino
According to the San Marino family income data, there are 1,684 families falling into the $200,000+ income range, which is the most common income bracket and makes up 50.0% of all families. Conversely, the $25,000 to $34,999 income bracket is the least frequent group with only 20 families (0.6%) belonging to this category.
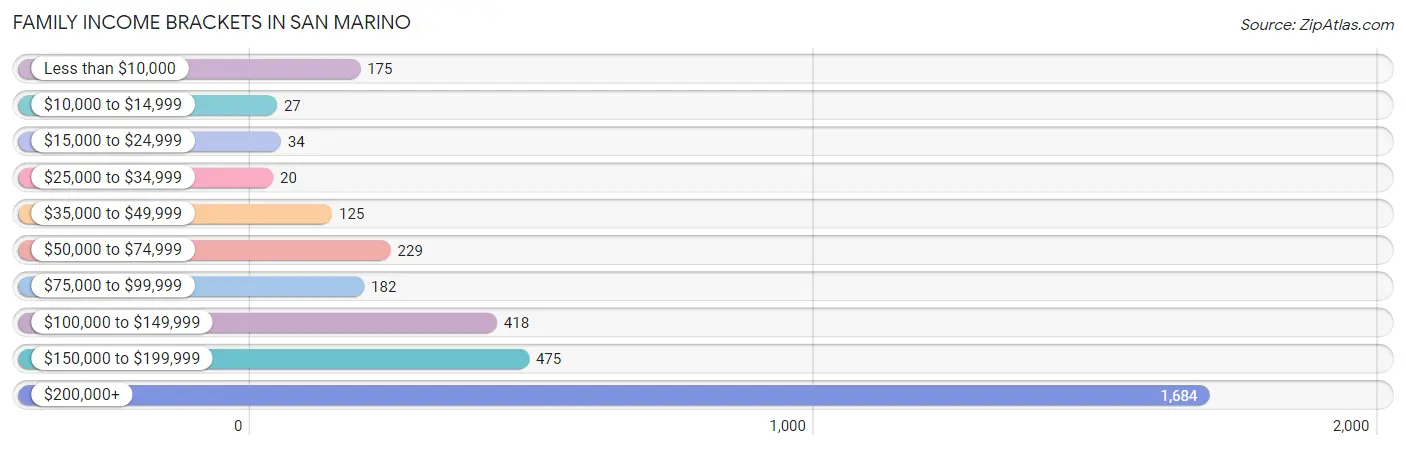
| Income Bracket | # Families | % Families |
| Less than $10,000 | 175 | 5.2% |
| $10,000 to $14,999 | 27 | 0.8% |
| $15,000 to $24,999 | 34 | 1.0% |
| $25,000 to $34,999 | 20 | 0.6% |
| $35,000 to $49,999 | 125 | 3.7% |
| $50,000 to $74,999 | 229 | 6.8% |
| $75,000 to $99,999 | 182 | 5.4% |
| $100,000 to $149,999 | 418 | 12.4% |
| $150,000 to $199,999 | 475 | 14.1% |
| $200,000+ | 1,684 | 50.0% |
Family Income by Famaliy Size in San Marino
4-person families (713 | 21.2%) account for the highest median family income in San Marino with $250,001 per family, while 2-person families (1,492 | 44.3%) have the highest median income of $84,762 per family member.
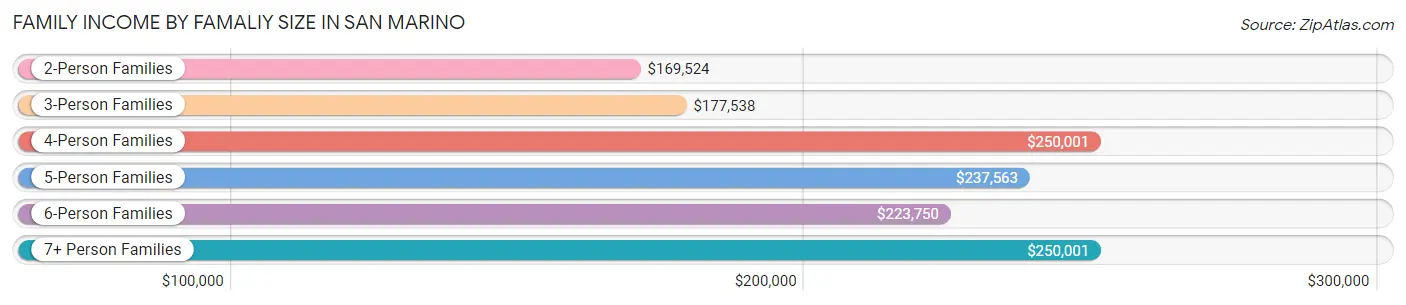
| Income Bracket | # Families | Median Income |
| 2-Person Families | 1,492 (44.3%) | $169,524 |
| 3-Person Families | 739 (21.9%) | $177,538 |
| 4-Person Families | 713 (21.2%) | $250,001 |
| 5-Person Families | 270 (8.0%) | $237,563 |
| 6-Person Families | 79 (2.3%) | $223,750 |
| 7+ Person Families | 76 (2.3%) | $250,001 |
| Total | 3,369 (100.0%) | $199,931 |
Family Income by Number of Earners in San Marino
The median family income in San Marino is $199,931, with families comprising 2 earners (1,322) having the highest median family income of $250,001, while families with no earners (660) have the lowest median family income of $91,103, accounting for 39.2% and 19.6% of families, respectively.
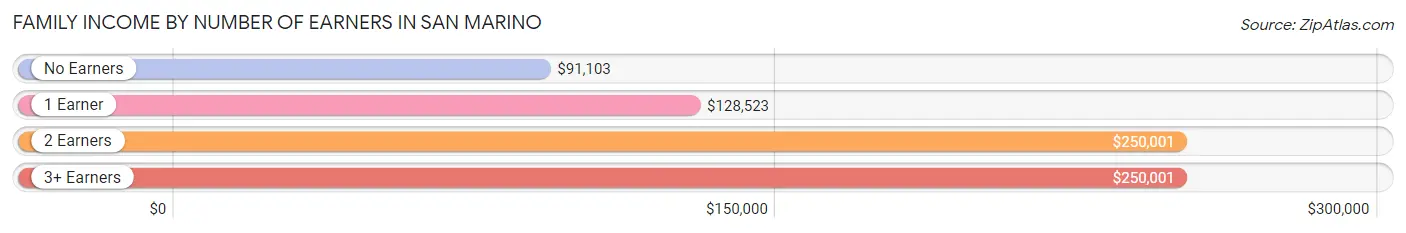
| Number of Earners | # Families | Median Income |
| No Earners | 660 (19.6%) | $91,103 |
| 1 Earner | 1,019 (30.2%) | $128,523 |
| 2 Earners | 1,322 (39.2%) | $250,001 |
| 3+ Earners | 368 (10.9%) | $250,001 |
| Total | 3,369 (100.0%) | $199,931 |
Household Income in San Marino
Household Income Brackets in San Marino
With 1,727 households falling in the category, the $200,000+ income range is the most frequent in San Marino, accounting for 44.1% of all households. In contrast, only 35 households (0.9%) fall into the $10,000 to $14,999 income bracket, making it the least populous group.
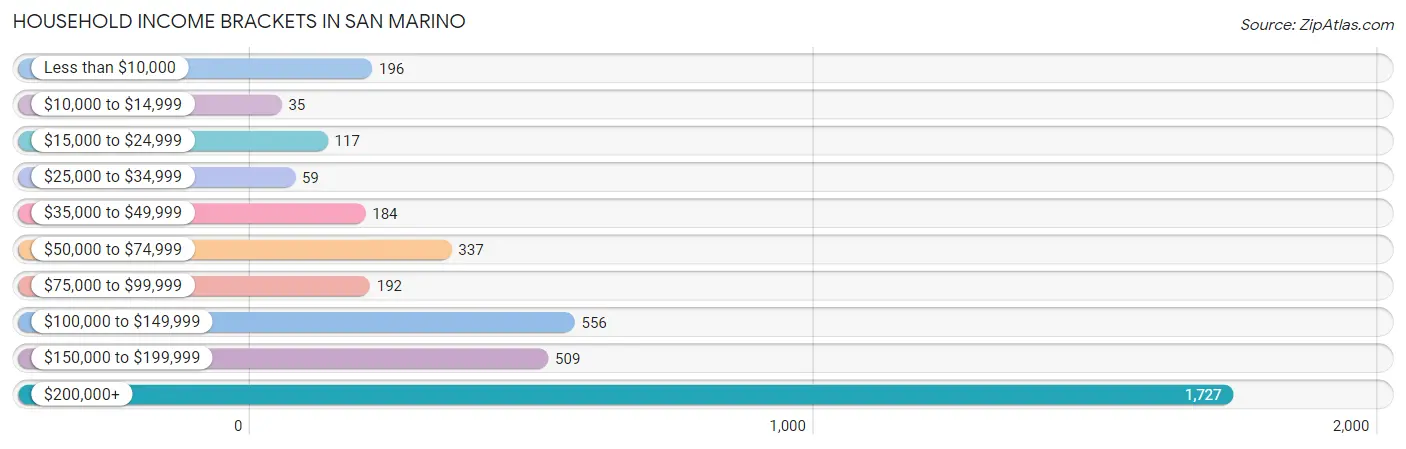
| Income Bracket | # Households | % Households |
| Less than $10,000 | 196 | 5.0% |
| $10,000 to $14,999 | 35 | 0.9% |
| $15,000 to $24,999 | 117 | 3.0% |
| $25,000 to $34,999 | 59 | 1.5% |
| $35,000 to $49,999 | 184 | 4.7% |
| $50,000 to $74,999 | 337 | 8.6% |
| $75,000 to $99,999 | 192 | 4.9% |
| $100,000 to $149,999 | 556 | 14.2% |
| $150,000 to $199,999 | 509 | 13.0% |
| $200,000+ | 1,727 | 44.1% |
Household Income by Householder Age in San Marino
The median household income in San Marino is $174,253, with the highest median household income of $235,625 found in the 45 to 64 years age bracket for the primary householder. A total of 1,659 households (42.4%) fall into this category. Meanwhile, the 15 to 24 years age bracket for the primary householder has the lowest median household income of $2,499, with 45 households (1.1%) in this group.
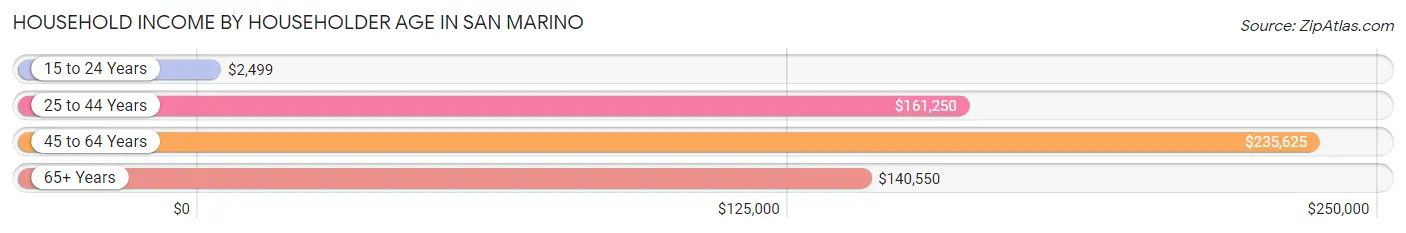
| Income Bracket | # Households | Median Income |
| 15 to 24 Years | 45 (1.1%) | $2,499 |
| 25 to 44 Years | 724 (18.5%) | $161,250 |
| 45 to 64 Years | 1,659 (42.4%) | $235,625 |
| 65+ Years | 1,488 (38.0%) | $140,550 |
| Total | 3,916 (100.0%) | $174,253 |
Poverty in San Marino
Income Below Poverty by Sex and Age in San Marino
With 8.2% poverty level for males and 9.9% for females among the residents of San Marino, 25 to 34 year old males and 25 to 34 year old females are the most vulnerable to poverty, with 170 males (22.3%) and 137 females (25.0%) in their respective age groups living below the poverty level.
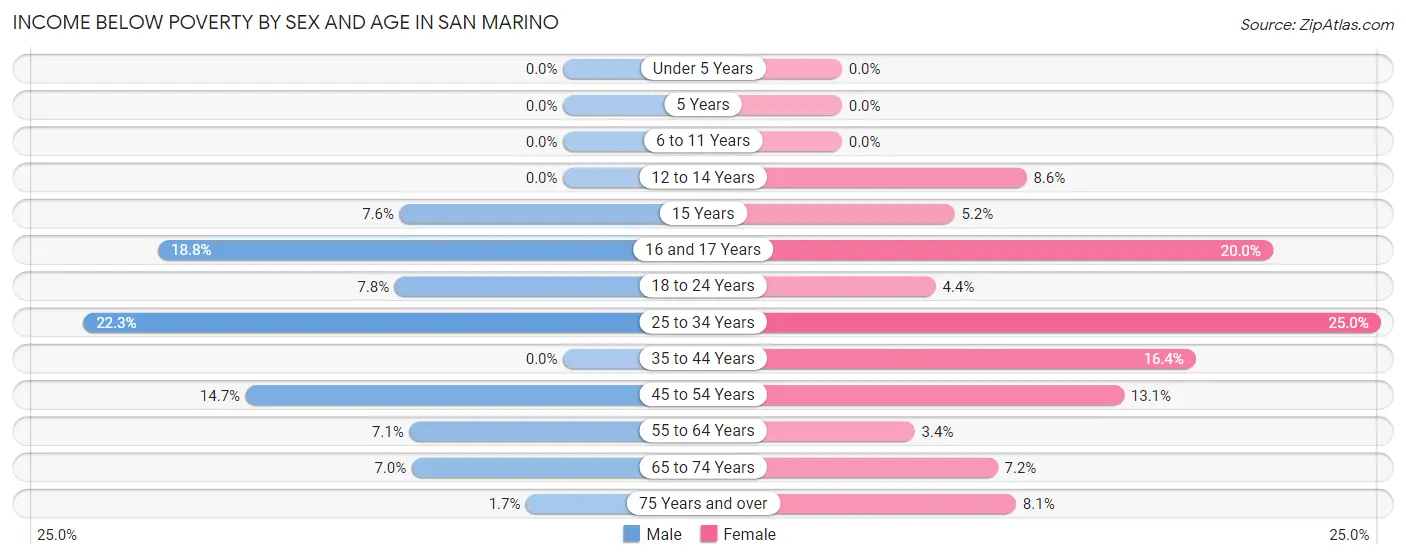
| Age Bracket | Male | Female |
| Under 5 Years | 0 (0.0%) | 0 (0.0%) |
| 5 Years | 0 (0.0%) | 0 (0.0%) |
| 6 to 11 Years | 0 (0.0%) | 0 (0.0%) |
| 12 to 14 Years | 0 (0.0%) | 18 (8.6%) |
| 15 Years | 11 (7.6%) | 9 (5.2%) |
| 16 and 17 Years | 47 (18.8%) | 50 (20.0%) |
| 18 to 24 Years | 30 (7.8%) | 9 (4.3%) |
| 25 to 34 Years | 170 (22.3%) | 137 (25.0%) |
| 35 to 44 Years | 0 (0.0%) | 113 (16.4%) |
| 45 to 54 Years | 142 (14.7%) | 127 (13.1%) |
| 55 to 64 Years | 60 (7.1%) | 31 (3.4%) |
| 65 to 74 Years | 52 (7.0%) | 60 (7.2%) |
| 75 Years and over | 8 (1.7%) | 50 (8.1%) |
| Total | 520 (8.2%) | 604 (9.9%) |
Income Above Poverty by Sex and Age in San Marino
According to the poverty statistics in San Marino, males aged under 5 years and females aged under 5 years are the age groups that are most secure financially, with 100.0% of males and 100.0% of females in these age groups living above the poverty line.
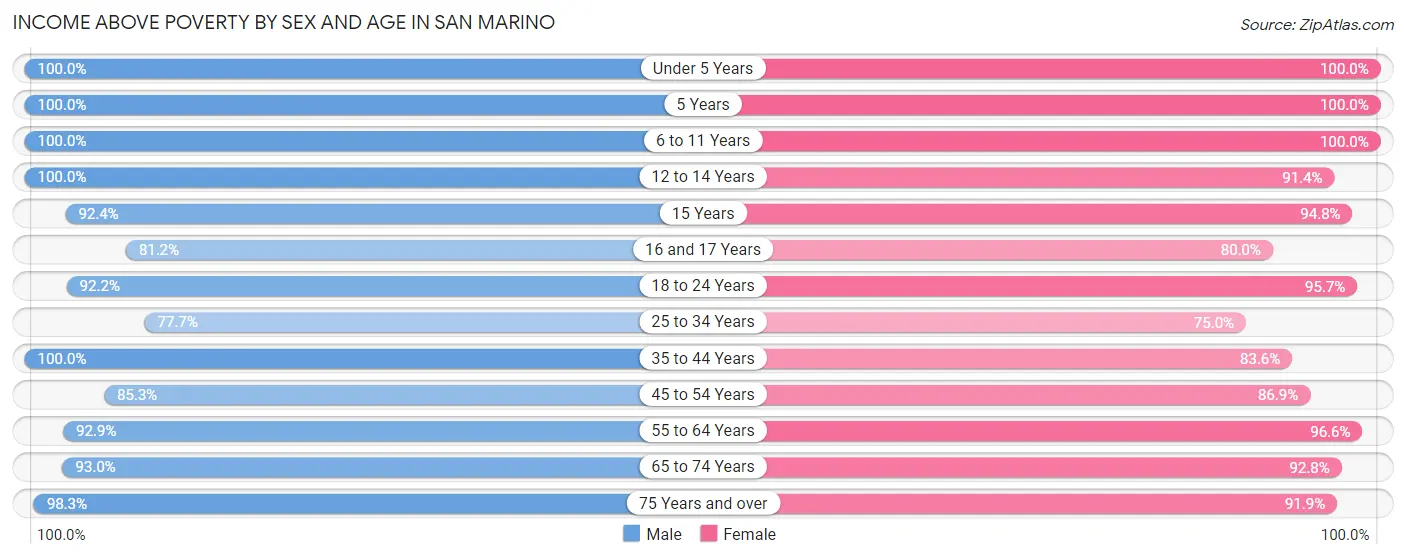
| Age Bracket | Male | Female |
| Under 5 Years | 203 (100.0%) | 384 (100.0%) |
| 5 Years | 214 (100.0%) | 56 (100.0%) |
| 6 to 11 Years | 529 (100.0%) | 246 (100.0%) |
| 12 to 14 Years | 235 (100.0%) | 192 (91.4%) |
| 15 Years | 134 (92.4%) | 163 (94.8%) |
| 16 and 17 Years | 203 (81.2%) | 200 (80.0%) |
| 18 to 24 Years | 354 (92.2%) | 198 (95.7%) |
| 25 to 34 Years | 593 (77.7%) | 411 (75.0%) |
| 35 to 44 Years | 613 (100.0%) | 575 (83.6%) |
| 45 to 54 Years | 822 (85.3%) | 843 (86.9%) |
| 55 to 64 Years | 780 (92.9%) | 886 (96.6%) |
| 65 to 74 Years | 689 (93.0%) | 770 (92.8%) |
| 75 Years and over | 456 (98.3%) | 569 (91.9%) |
| Total | 5,825 (91.8%) | 5,493 (90.1%) |
Income Below Poverty Among Married-Couple Families in San Marino
The poverty statistics for married-couple families in San Marino show that 3.0% or 80 of the total 2,702 families live below the poverty line. Families with 1 or 2 children have the highest poverty rate of 3.6%, comprising of 35 families. On the other hand, families with 3 or 4 children have the lowest poverty rate of 0.0%, which includes 0 families.
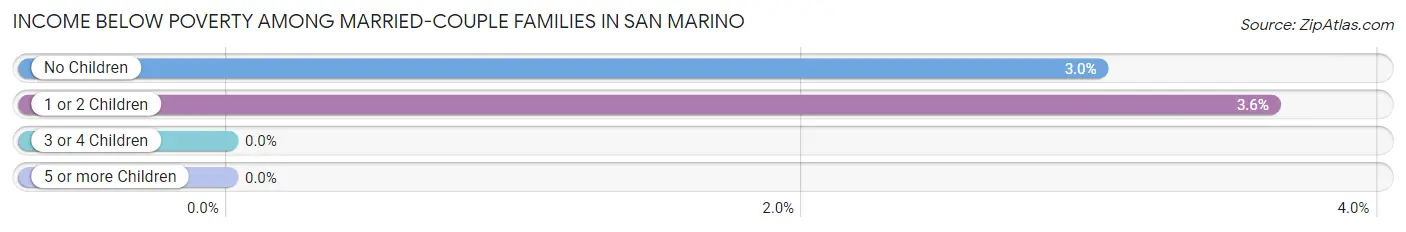
| Children | Above Poverty | Below Poverty |
| No Children | 1,439 (97.0%) | 45 (3.0%) |
| 1 or 2 Children | 928 (96.4%) | 35 (3.6%) |
| 3 or 4 Children | 255 (100.0%) | 0 (0.0%) |
| 5 or more Children | 0 (0.0%) | 0 (0.0%) |
| Total | 2,622 (97.0%) | 80 (3.0%) |
Income Below Poverty Among Single-Parent Households in San Marino
According to the poverty data in San Marino, 20.6% or 51 single-father households and 20.1% or 84 single-mother households are living below the poverty line. Among single-father households, those with 1 or 2 children have the highest poverty rate, with 51 households (56.7%) experiencing poverty. Likewise, among single-mother households, those with no children have the highest poverty rate, with 68 households (22.4%) falling below the poverty line.
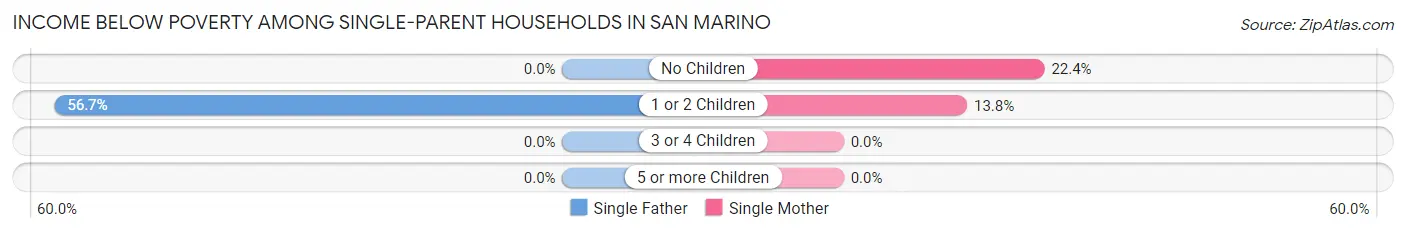
| Children | Single Father | Single Mother |
| No Children | 0 (0.0%) | 68 (22.4%) |
| 1 or 2 Children | 51 (56.7%) | 16 (13.8%) |
| 3 or 4 Children | 0 (0.0%) | 0 (0.0%) |
| 5 or more Children | 0 (0.0%) | 0 (0.0%) |
| Total | 51 (20.6%) | 84 (20.1%) |
Income Below Poverty Among Married-Couple vs Single-Parent Households in San Marino
The poverty data for San Marino shows that 80 of the married-couple family households (3.0%) and 135 of the single-parent households (20.2%) are living below the poverty level. Within the married-couple family households, those with 1 or 2 children have the highest poverty rate, with 35 households (3.6%) falling below the poverty line. Among the single-parent households, those with 1 or 2 children have the highest poverty rate, with 67 household (32.5%) living below poverty.
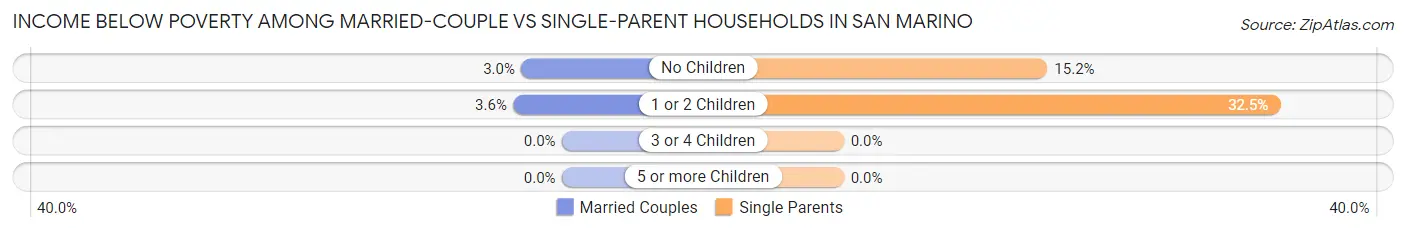
| Children | Married-Couple Families | Single-Parent Households |
| No Children | 45 (3.0%) | 68 (15.2%) |
| 1 or 2 Children | 35 (3.6%) | 67 (32.5%) |
| 3 or 4 Children | 0 (0.0%) | 0 (0.0%) |
| 5 or more Children | 0 (0.0%) | 0 (0.0%) |
| Total | 80 (3.0%) | 135 (20.2%) |
Race in San Marino
The most populous races in San Marino are Asian (8,517 | 68.4%), White / Caucasian (3,115 | 25.0%), and Hispanic or Latino (791 | 6.4%).
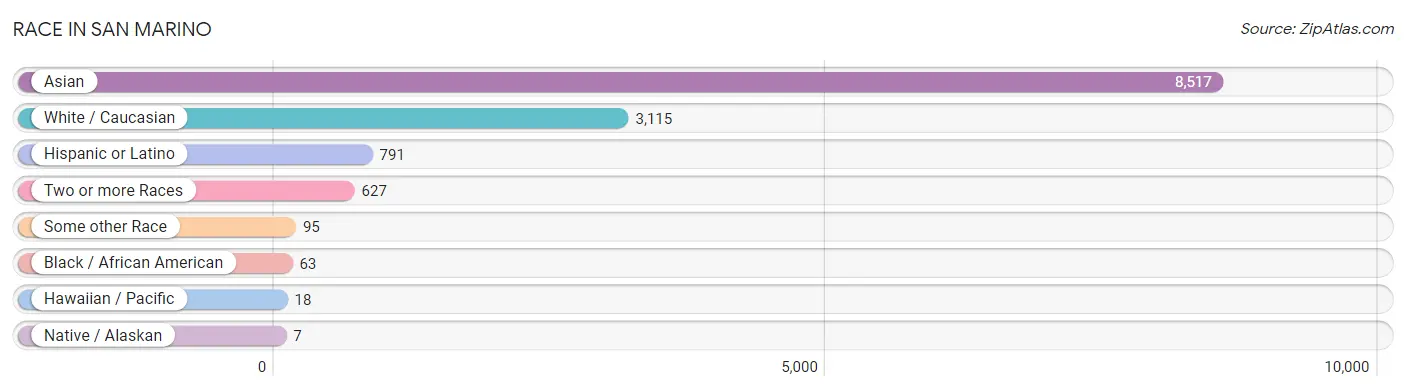
| Race | # Population | % Population |
| Asian | 8,517 | 68.4% |
| Black / African American | 63 | 0.5% |
| Hawaiian / Pacific | 18 | 0.1% |
| Hispanic or Latino | 791 | 6.4% |
| Native / Alaskan | 7 | 0.1% |
| White / Caucasian | 3,115 | 25.0% |
| Two or more Races | 627 | 5.0% |
| Some other Race | 95 | 0.8% |
| Total | 12,442 | 100.0% |
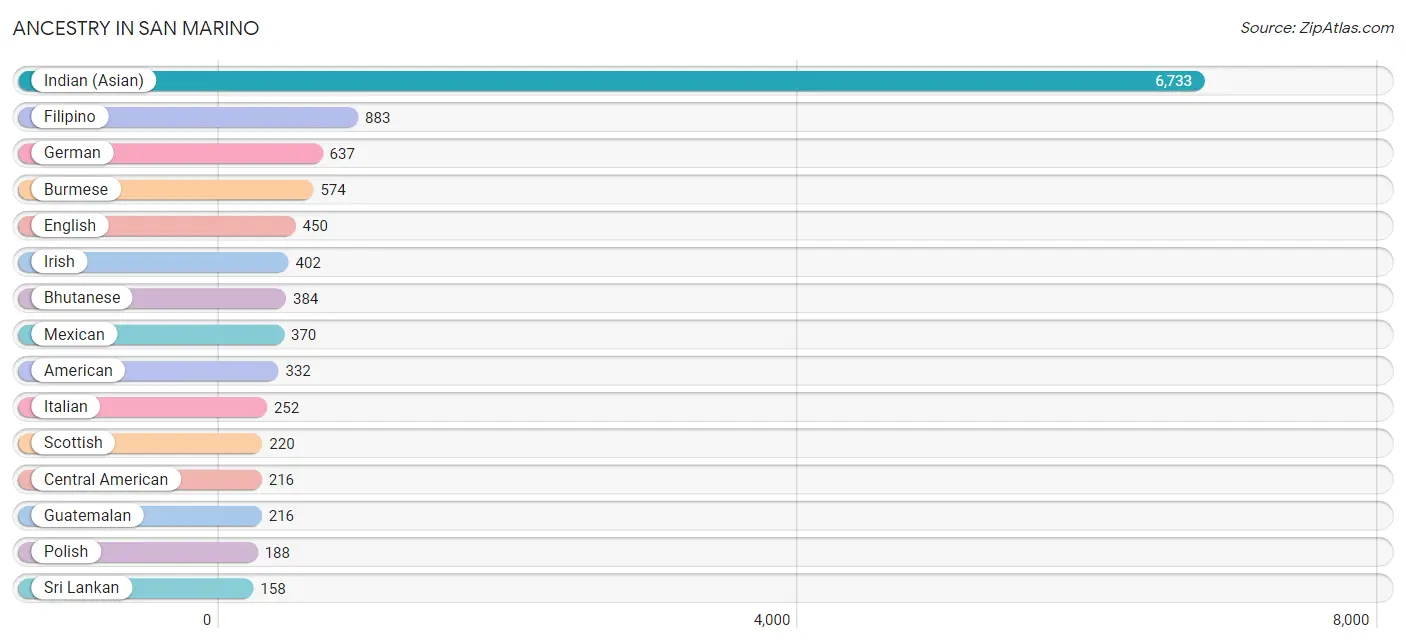
Ancestry in San Marino
The most populous ancestries reported in San Marino are Indian (Asian) (6,733 | 54.1%), Filipino (883 | 7.1%), German (637 | 5.1%), Burmese (574 | 4.6%), and English (450 | 3.6%), together accounting for 74.6% of all San Marino residents.
| Ancestry | # Population | % Population |
| American | 332 | 2.7% |
| Arab | 44 | 0.4% |
| Argentinean | 38 | 0.3% |
| Armenian | 73 | 0.6% |
| Bhutanese | 384 | 3.1% |
| British | 24 | 0.2% |
| Burmese | 574 | 4.6% |
| Canadian | 21 | 0.2% |
| Central American | 216 | 1.7% |
| Colombian | 99 | 0.8% |
| Cuban | 15 | 0.1% |
| Czech | 7 | 0.1% |
| Danish | 40 | 0.3% |
| Eastern European | 112 | 0.9% |
| English | 450 | 3.6% |
| European | 144 | 1.2% |
| Filipino | 883 | 7.1% |
| Finnish | 57 | 0.5% |
| French | 151 | 1.2% |
| French Canadian | 21 | 0.2% |
| German | 637 | 5.1% |
| Greek | 52 | 0.4% |
| Guamanian / Chamorro | 18 | 0.1% |
| Guatemalan | 216 | 1.7% |
| Hungarian | 9 | 0.1% |
| Icelander | 9 | 0.1% |
| Indian (Asian) | 6,733 | 54.1% |
| Indonesian | 54 | 0.4% |
| Irish | 402 | 3.2% |
| Italian | 252 | 2.0% |
| Jordanian | 18 | 0.1% |
| Korean | 111 | 0.9% |
| Laotian | 39 | 0.3% |
| Lebanese | 9 | 0.1% |
| Lithuanian | 43 | 0.4% |
| Mexican | 370 | 3.0% |
| Mexican American Indian | 55 | 0.4% |
| Native Hawaiian | 11 | 0.1% |
| Pakistani | 33 | 0.3% |
| Pima | 7 | 0.1% |
| Polish | 188 | 1.5% |
| Russian | 24 | 0.2% |
| Scotch-Irish | 28 | 0.2% |
| Scottish | 220 | 1.8% |
| South American | 151 | 1.2% |
| Spaniard | 39 | 0.3% |
| Sri Lankan | 158 | 1.3% |
| Swedish | 31 | 0.3% |
| Swiss | 29 | 0.2% |
| Thai | 103 | 0.8% |
| Ukrainian | 8 | 0.1% |
| Venezuelan | 14 | 0.1% | View All 52 Rows |
Immigrants in San Marino
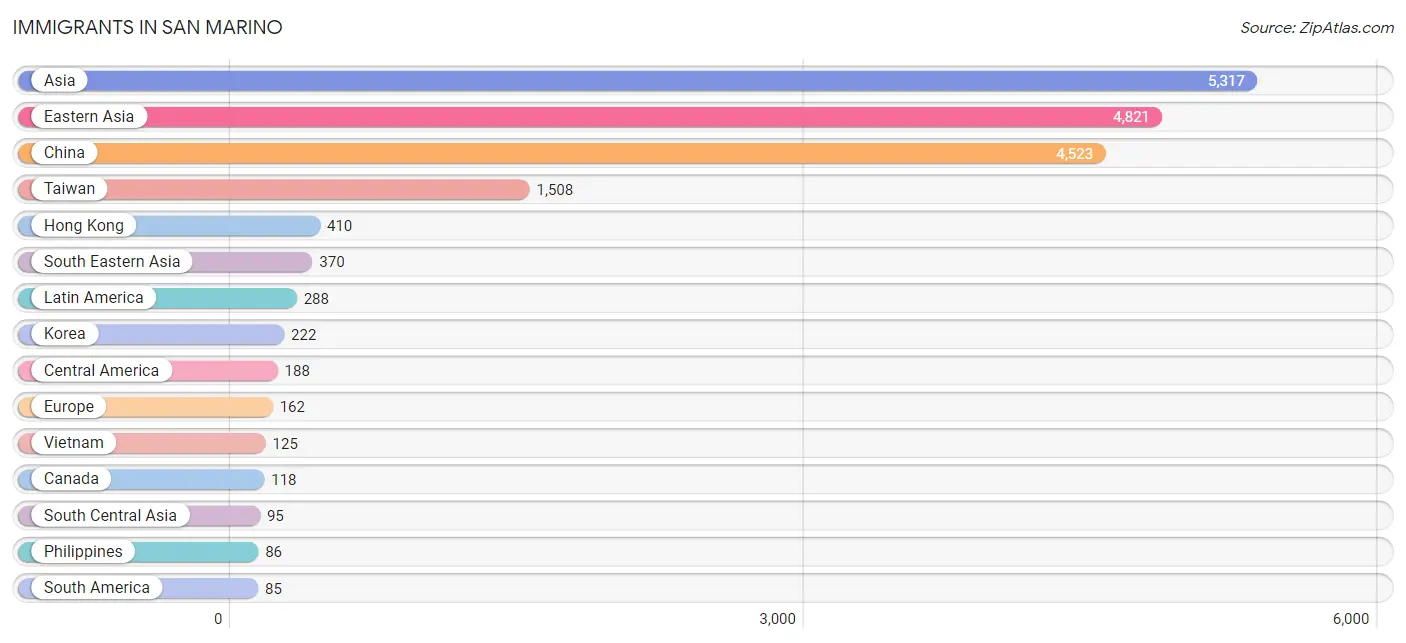
The most numerous immigrant groups reported in San Marino came from Asia (5,317 | 42.7%), Eastern Asia (4,821 | 38.8%), China (4,523 | 36.3%), Taiwan (1,508 | 12.1%), and Hong Kong (410 | 3.3%), together accounting for 133.2% of all San Marino residents.
| Immigration Origin | # Population | % Population |
| Argentina | 18 | 0.1% |
| Armenia | 13 | 0.1% |
| Asia | 5,317 | 42.7% |
| Canada | 118 | 0.9% |
| Caribbean | 15 | 0.1% |
| Central America | 188 | 1.5% |
| China | 4,523 | 36.3% |
| Colombia | 53 | 0.4% |
| Cuba | 15 | 0.1% |
| Eastern Asia | 4,821 | 38.8% |
| Eastern Europe | 39 | 0.3% |
| El Salvador | 61 | 0.5% |
| Europe | 162 | 1.3% |
| France | 9 | 0.1% |
| Germany | 44 | 0.4% |
| Greece | 21 | 0.2% |
| Guatemala | 64 | 0.5% |
| Hong Kong | 410 | 3.3% |
| Hungary | 9 | 0.1% |
| India | 81 | 0.6% |
| Indonesia | 54 | 0.4% |
| Iran | 14 | 0.1% |
| Japan | 76 | 0.6% |
| Jordan | 18 | 0.1% |
| Korea | 222 | 1.8% |
| Latin America | 288 | 2.3% |
| Malaysia | 24 | 0.2% |
| Mexico | 51 | 0.4% |
| Nicaragua | 12 | 0.1% |
| Northern Europe | 49 | 0.4% |
| Philippines | 86 | 0.7% |
| Poland | 10 | 0.1% |
| Romania | 20 | 0.2% |
| South America | 85 | 0.7% |
| South Central Asia | 95 | 0.8% |
| South Eastern Asia | 370 | 3.0% |
| Southern Europe | 21 | 0.2% |
| Taiwan | 1,508 | 12.1% |
| Thailand | 25 | 0.2% |
| Venezuela | 14 | 0.1% |
| Vietnam | 125 | 1.0% |
| Western Asia | 31 | 0.3% |
| Western Europe | 53 | 0.4% | View All 43 Rows |
Sex and Age in San Marino
Sex and Age in San Marino
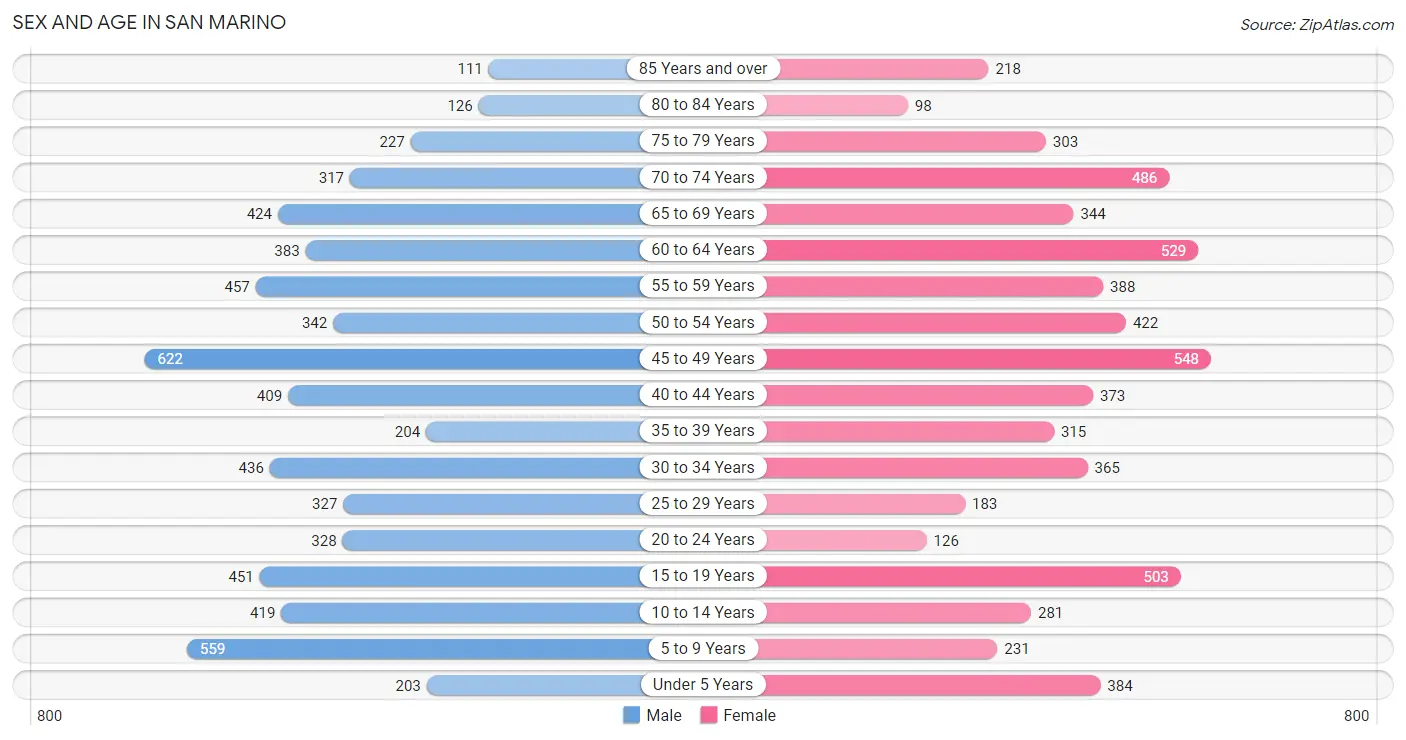
The most populous age groups in San Marino are 45 to 49 Years (622 | 9.8%) for men and 45 to 49 Years (548 | 9.0%) for women.
| Age Bracket | Male | Female |
| Under 5 Years | 203 (3.2%) | 384 (6.3%) |
| 5 to 9 Years | 559 (8.8%) | 231 (3.8%) |
| 10 to 14 Years | 419 (6.6%) | 281 (4.6%) |
| 15 to 19 Years | 451 (7.1%) | 503 (8.3%) |
| 20 to 24 Years | 328 (5.2%) | 126 (2.1%) |
| 25 to 29 Years | 327 (5.1%) | 183 (3.0%) |
| 30 to 34 Years | 436 (6.9%) | 365 (6.0%) |
| 35 to 39 Years | 204 (3.2%) | 315 (5.2%) |
| 40 to 44 Years | 409 (6.5%) | 373 (6.1%) |
| 45 to 49 Years | 622 (9.8%) | 548 (9.0%) |
| 50 to 54 Years | 342 (5.4%) | 422 (6.9%) |
| 55 to 59 Years | 457 (7.2%) | 388 (6.4%) |
| 60 to 64 Years | 383 (6.0%) | 529 (8.7%) |
| 65 to 69 Years | 424 (6.7%) | 344 (5.6%) |
| 70 to 74 Years | 317 (5.0%) | 486 (8.0%) |
| 75 to 79 Years | 227 (3.6%) | 303 (5.0%) |
| 80 to 84 Years | 126 (2.0%) | 98 (1.6%) |
| 85 Years and over | 111 (1.8%) | 218 (3.6%) |
| Total | 6,345 (100.0%) | 6,097 (100.0%) |
Families and Households in San Marino
Median Family Size in San Marino
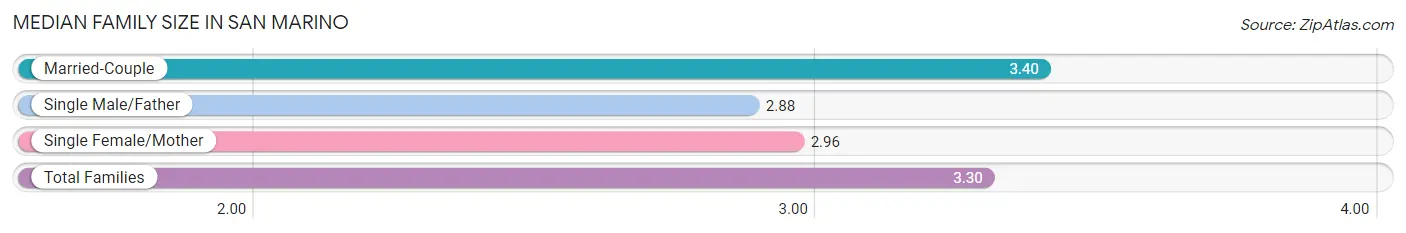
The median family size in San Marino is 3.30 persons per family, with married-couple families (2,702 | 80.2%) accounting for the largest median family size of 3.4 persons per family. On the other hand, single male/father families (248 | 7.4%) represent the smallest median family size with 2.88 persons per family.
| Family Type | # Families | Family Size |
| Married-Couple | 2,702 (80.2%) | 3.40 |
| Single Male/Father | 248 (7.4%) | 2.88 |
| Single Female/Mother | 419 (12.4%) | 2.96 |
| Total Families | 3,369 (100.0%) | 3.30 |
Median Household Size in San Marino
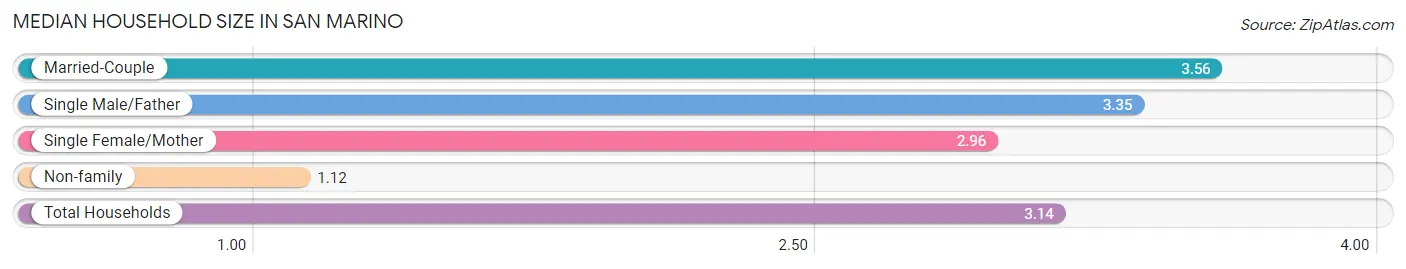
The median household size in San Marino is 3.14 persons per household, with married-couple households (2,702 | 69.0%) accounting for the largest median household size of 3.56 persons per household. non-family households (547 | 14.0%) represent the smallest median household size with 1.12 persons per household.
| Household Type | # Households | Household Size |
| Married-Couple | 2,702 (69.0%) | 3.56 |
| Single Male/Father | 248 (6.3%) | 3.35 |
| Single Female/Mother | 419 (10.7%) | 2.96 |
| Non-family | 547 (14.0%) | 1.12 |
| Total Households | 3,916 (100.0%) | 3.14 |
Household Size by Marriage Status in San Marino
Out of a total of 3,916 households in San Marino, 3,369 (86.0%) are family households, while 547 (14.0%) are nonfamily households. The most numerous type of family households are 2-person households, comprising 1,412, and the most common type of nonfamily households are 1-person households, comprising 482.
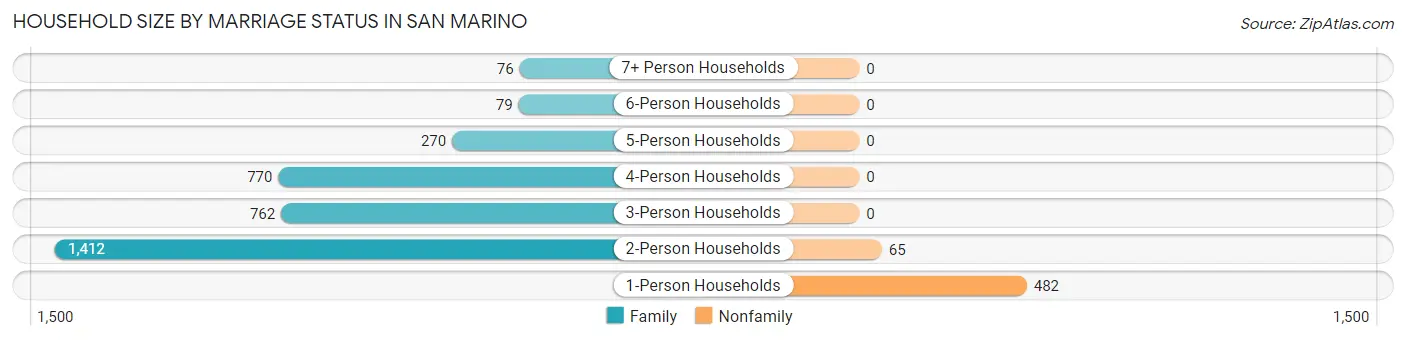
| Household Size | Family Households | Nonfamily Households |
| 1-Person Households | - | 482 (12.3%) |
| 2-Person Households | 1,412 (36.1%) | 65 (1.7%) |
| 3-Person Households | 762 (19.5%) | 0 (0.0%) |
| 4-Person Households | 770 (19.7%) | 0 (0.0%) |
| 5-Person Households | 270 (6.9%) | 0 (0.0%) |
| 6-Person Households | 79 (2.0%) | 0 (0.0%) |
| 7+ Person Households | 76 (1.9%) | 0 (0.0%) |
| Total | 3,369 (86.0%) | 547 (14.0%) |
Female Fertility in San Marino
Fertility by Age in San Marino
Average fertility rate in San Marino is 16.0 births per 1,000 women. Women in the age bracket of 20 to 34 years have the highest fertility rate with 45.0 births per 1,000 women. Women in the age bracket of 20 to 34 years acount for 76.9% of all women with births.
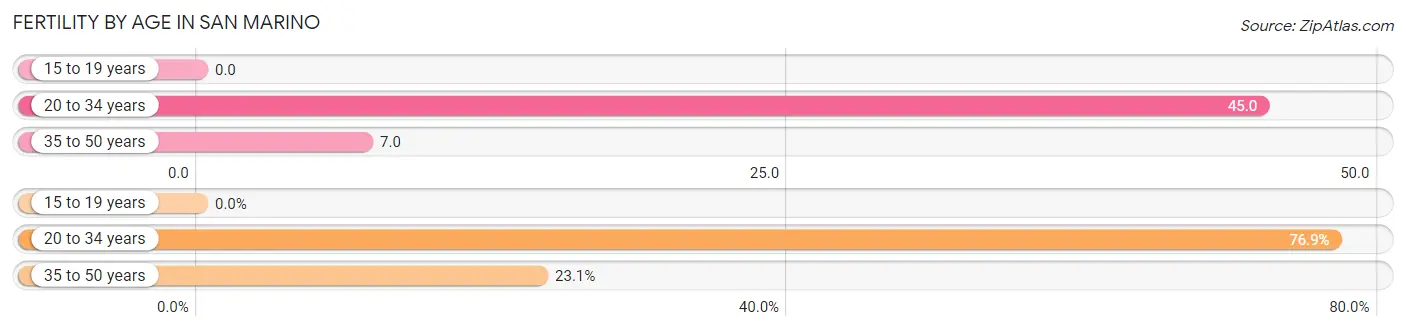
| Age Bracket | Women with Births | Births / 1,000 Women |
| 15 to 19 years | 0 (0.0%) | 0.0 |
| 20 to 34 years | 30 (76.9%) | 45.0 |
| 35 to 50 years | 9 (23.1%) | 7.0 |
| Total | 39 (100.0%) | 16.0 |
Fertility by Age by Marriage Status in San Marino
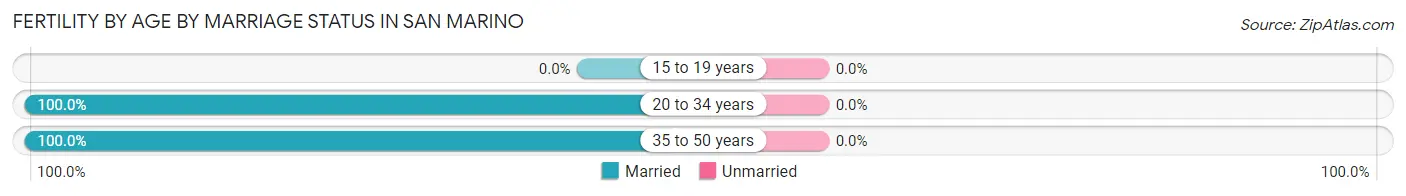
| Age Bracket | Married | Unmarried |
| 15 to 19 years | 0 (0.0%) | 0 (0.0%) |
| 20 to 34 years | 30 (100.0%) | 0 (0.0%) |
| 35 to 50 years | 9 (100.0%) | 0 (0.0%) |
| Total | 39 (100.0%) | 0 (0.0%) |
Fertility by Education in San Marino
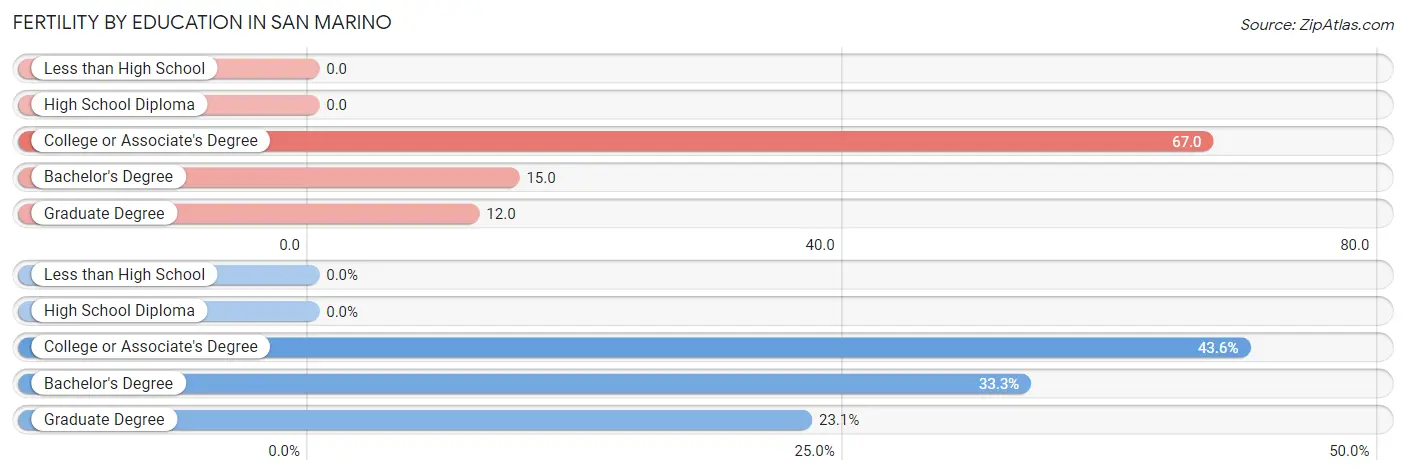
| Educational Attainment | Women with Births | Births / 1,000 Women |
| Less than High School | 0 (0.0%) | 0.0 |
| High School Diploma | 0 (0.0%) | 0.0 |
| College or Associate's Degree | 17 (43.6%) | 67.0 |
| Bachelor's Degree | 13 (33.3%) | 15.0 |
| Graduate Degree | 9 (23.1%) | 12.0 |
| Total | 39 (100.0%) | 16.0 |
Fertility by Education by Marriage Status in San Marino
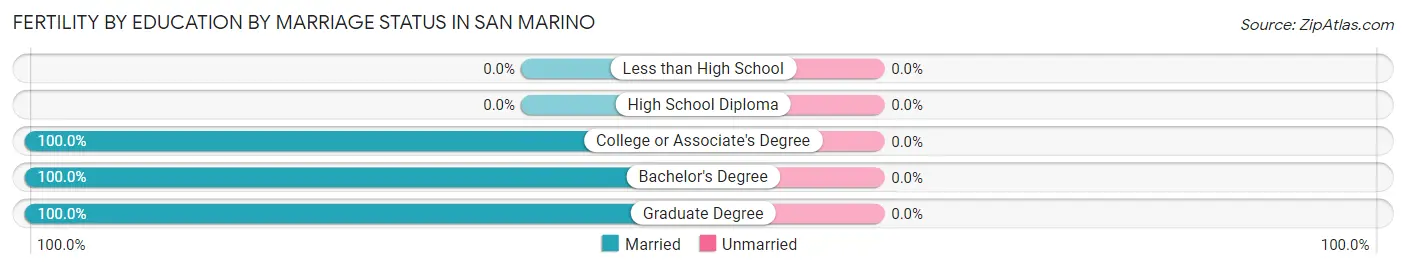
| Educational Attainment | Married | Unmarried |
| Less than High School | 0 (0.0%) | 0 (0.0%) |
| High School Diploma | 0 (0.0%) | 0 (0.0%) |
| College or Associate's Degree | 17 (100.0%) | 0 (0.0%) |
| Bachelor's Degree | 13 (100.0%) | 0 (0.0%) |
| Graduate Degree | 9 (100.0%) | 0 (0.0%) |
| Total | 39 (100.0%) | 0 (0.0%) |
Employment Characteristics in San Marino
Employment by Class of Employer in San Marino
Among the 5,218 employed individuals in San Marino, private company employees (3,099 | 59.4%), self-employed (incorporated) (807 | 15.5%), and self-employed (not incorporated) (593 | 11.4%) make up the most common classes of employment.
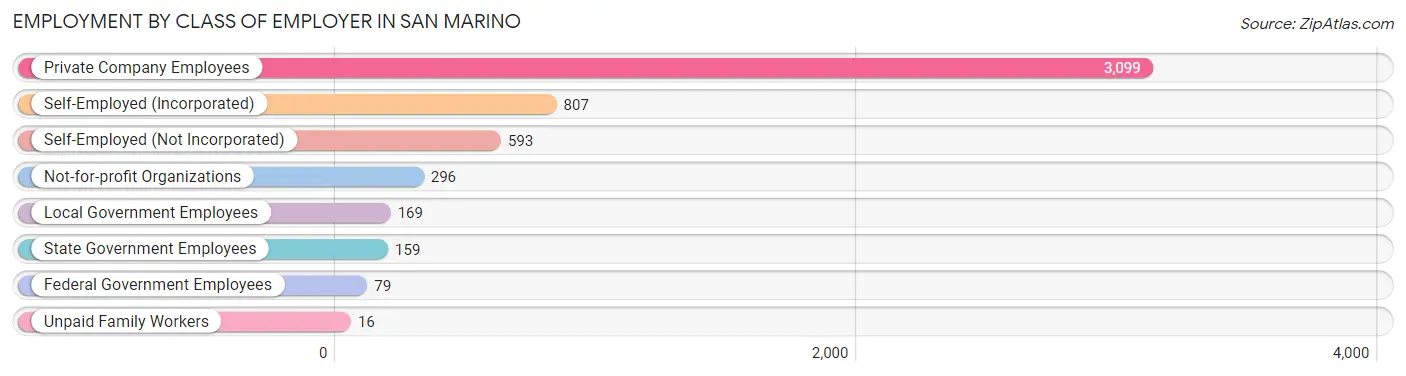
| Employer Class | # Employees | % Employees |
| Private Company Employees | 3,099 | 59.4% |
| Self-Employed (Incorporated) | 807 | 15.5% |
| Self-Employed (Not Incorporated) | 593 | 11.4% |
| Not-for-profit Organizations | 296 | 5.7% |
| Local Government Employees | 169 | 3.2% |
| State Government Employees | 159 | 3.0% |
| Federal Government Employees | 79 | 1.5% |
| Unpaid Family Workers | 16 | 0.3% |
| Total | 5,218 | 100.0% |
Employment Status by Age in San Marino
According to the labor force statistics for San Marino, out of the total population over 16 years of age (10,048), 57.1% or 5,737 individuals are in the labor force, with 4.4% or 252 of them unemployed. The age group with the highest labor force participation rate is 25 to 29 years, with 91.4% or 466 individuals in the labor force. Within the labor force, the 45 to 54 years age range has the highest percentage of unemployed individuals, with 9.0% or 128 of them being unemployed.
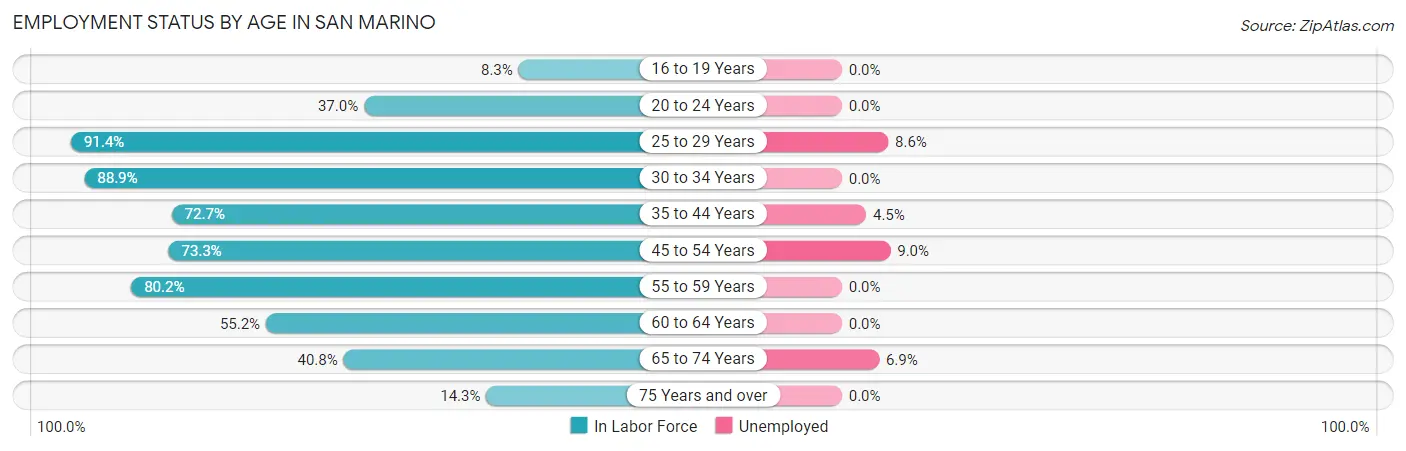
| Age Bracket | In Labor Force | Unemployed |
| 16 to 19 Years | 53 (8.3%) | 0 (0.0%) |
| 20 to 24 Years | 168 (37.0%) | 0 (0.0%) |
| 25 to 29 Years | 466 (91.4%) | 40 (8.6%) |
| 30 to 34 Years | 712 (88.9%) | 0 (0.0%) |
| 35 to 44 Years | 946 (72.7%) | 43 (4.5%) |
| 45 to 54 Years | 1,418 (73.3%) | 128 (9.0%) |
| 55 to 59 Years | 678 (80.2%) | 0 (0.0%) |
| 60 to 64 Years | 503 (55.2%) | 0 (0.0%) |
| 65 to 74 Years | 641 (40.8%) | 44 (6.9%) |
| 75 Years and over | 155 (14.3%) | 0 (0.0%) |
| Total | 5,737 (57.1%) | 252 (4.4%) |
Employment Status by Educational Attainment in San Marino
According to labor force statistics for San Marino, 74.9% of individuals (4,721) out of the total population between 25 and 64 years of age (6,303) are in the labor force, with 4.5% or 212 of them being unemployed. The group with the highest labor force participation rate are those with the educational attainment of less than high school, with 91.1% or 184 individuals in the labor force. Within the labor force, individuals with high school diploma education have the highest percentage of unemployment, with 9.3% or 17 of them being unemployed.
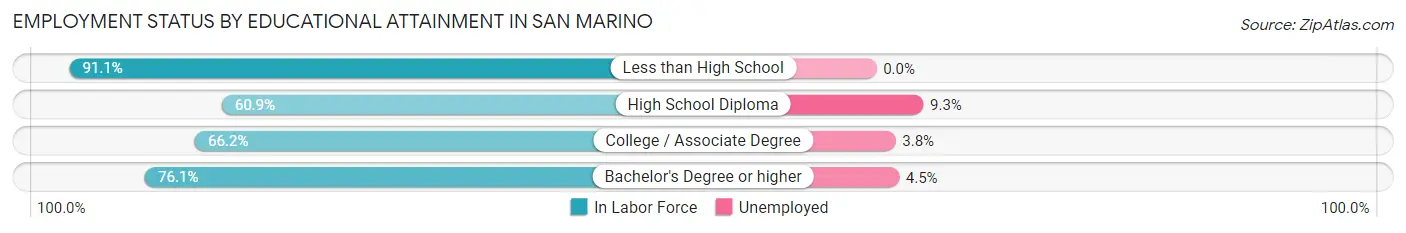
| Educational Attainment | In Labor Force | Unemployed |
| Less than High School | 184 (91.1%) | 0 (0.0%) |
| High School Diploma | 182 (60.9%) | 28 (9.3%) |
| College / Associate Degree | 394 (66.2%) | 23 (3.8%) |
| Bachelor's Degree or higher | 3,963 (76.1%) | 234 (4.5%) |
| Total | 4,721 (74.9%) | 284 (4.5%) |
Employment Occupations by Sex in San Marino
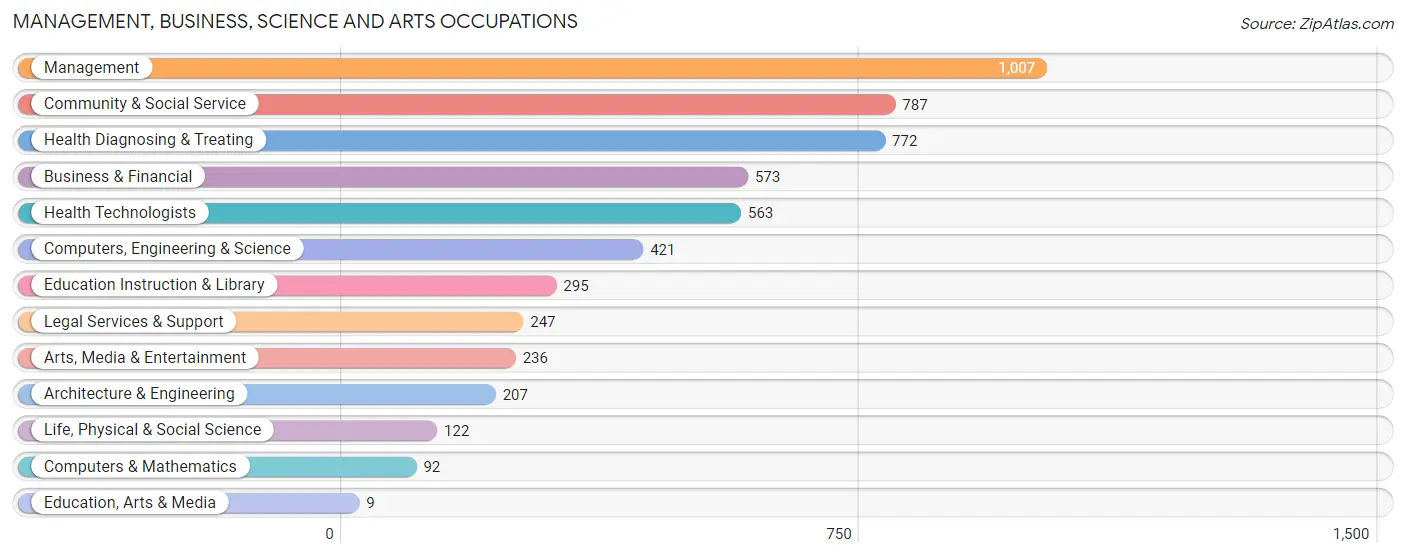
Management, Business, Science and Arts Occupations
The most common Management, Business, Science and Arts occupations in San Marino are Management (1,007 | 18.4%), Community & Social Service (787 | 14.3%), Health Diagnosing & Treating (772 | 14.1%), Business & Financial (573 | 10.4%), and Health Technologists (563 | 10.3%).
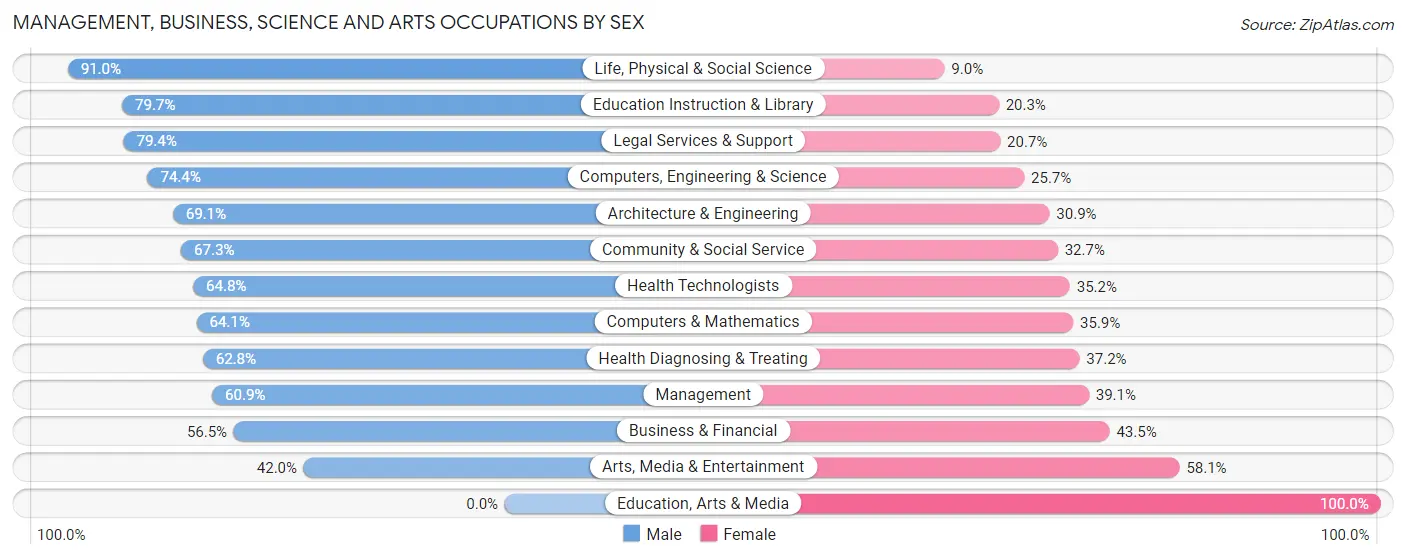
Management, Business, Science and Arts Occupations by Sex
Within the Management, Business, Science and Arts occupations in San Marino, the most male-oriented occupations are Life, Physical & Social Science (91.0%), Education Instruction & Library (79.7%), and Legal Services & Support (79.3%), while the most female-oriented occupations are Education, Arts & Media (100.0%), Arts, Media & Entertainment (58.1%), and Business & Financial (43.5%).
| Occupation | Male | Female |
| Management | 613 (60.9%) | 394 (39.1%) |
| Business & Financial | 324 (56.5%) | 249 (43.5%) |
| Computers, Engineering & Science | 313 (74.4%) | 108 (25.7%) |
| Computers & Mathematics | 59 (64.1%) | 33 (35.9%) |
| Architecture & Engineering | 143 (69.1%) | 64 (30.9%) |
| Life, Physical & Social Science | 111 (91.0%) | 11 (9.0%) |
| Community & Social Service | 530 (67.3%) | 257 (32.7%) |
| Education, Arts & Media | 0 (0.0%) | 9 (100.0%) |
| Legal Services & Support | 196 (79.3%) | 51 (20.6%) |
| Education Instruction & Library | 235 (79.7%) | 60 (20.3%) |
| Arts, Media & Entertainment | 99 (41.9%) | 137 (58.1%) |
| Health Diagnosing & Treating | 485 (62.8%) | 287 (37.2%) |
| Health Technologists | 365 (64.8%) | 198 (35.2%) |
| Total (Category) | 2,265 (63.6%) | 1,295 (36.4%) |
| Total (Overall) | 3,302 (60.2%) | 2,182 (39.8%) |
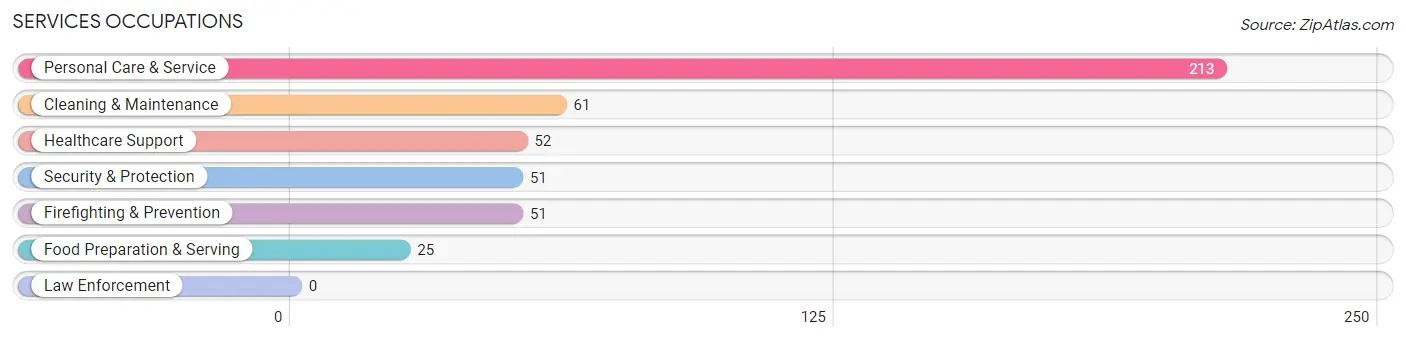
Services Occupations
The most common Services occupations in San Marino are Personal Care & Service (213 | 3.9%), Cleaning & Maintenance (61 | 1.1%), Healthcare Support (52 | 0.9%), Security & Protection (51 | 0.9%), and Firefighting & Prevention (51 | 0.9%).
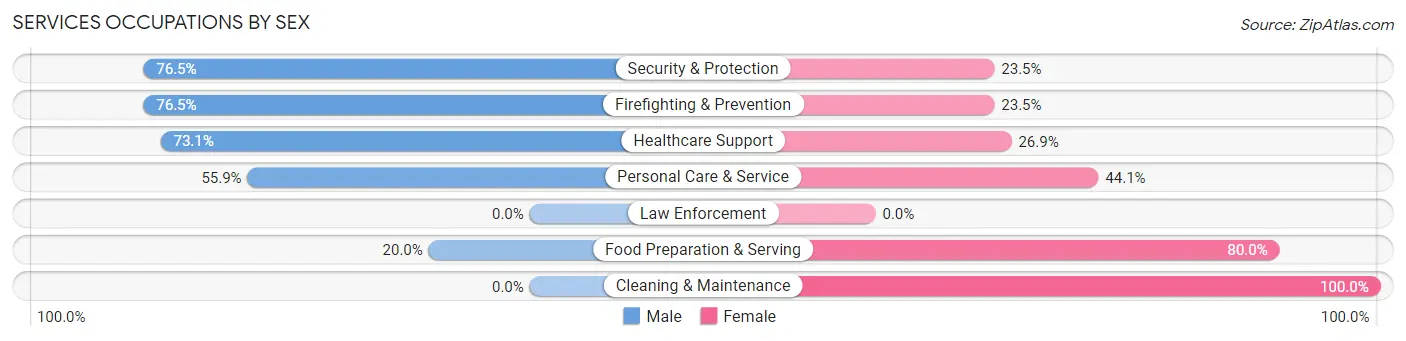
Services Occupations by Sex
Within the Services occupations in San Marino, the most male-oriented occupations are Security & Protection (76.5%), Firefighting & Prevention (76.5%), and Healthcare Support (73.1%), while the most female-oriented occupations are Cleaning & Maintenance (100.0%), Food Preparation & Serving (80.0%), and Personal Care & Service (44.1%).
| Occupation | Male | Female |
| Healthcare Support | 38 (73.1%) | 14 (26.9%) |
| Security & Protection | 39 (76.5%) | 12 (23.5%) |
| Firefighting & Prevention | 39 (76.5%) | 12 (23.5%) |
| Law Enforcement | 0 (0.0%) | 0 (0.0%) |
| Food Preparation & Serving | 5 (20.0%) | 20 (80.0%) |
| Cleaning & Maintenance | 0 (0.0%) | 61 (100.0%) |
| Personal Care & Service | 119 (55.9%) | 94 (44.1%) |
| Total (Category) | 201 (50.0%) | 201 (50.0%) |
| Total (Overall) | 3,302 (60.2%) | 2,182 (39.8%) |
Sales and Office Occupations
The most common Sales and Office occupations in San Marino are Sales & Related (676 | 12.3%), and Office & Administration (412 | 7.5%).
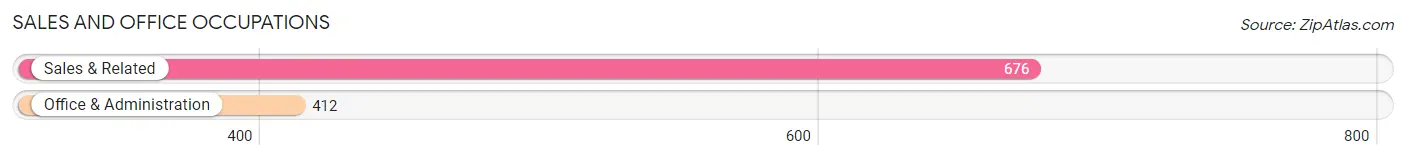
Sales and Office Occupations by Sex
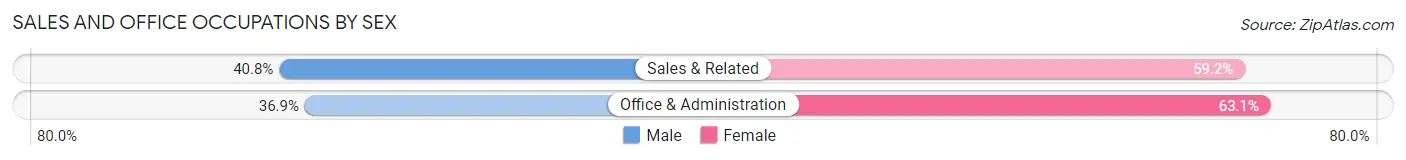
| Occupation | Male | Female |
| Sales & Related | 276 (40.8%) | 400 (59.2%) |
| Office & Administration | 152 (36.9%) | 260 (63.1%) |
| Total (Category) | 428 (39.3%) | 660 (60.7%) |
| Total (Overall) | 3,302 (60.2%) | 2,182 (39.8%) |
Natural Resources, Construction and Maintenance Occupations
The most common Natural Resources, Construction and Maintenance occupations in San Marino are Construction & Extraction (74 | 1.3%), and Installation, Maintenance & Repair (68 | 1.2%).
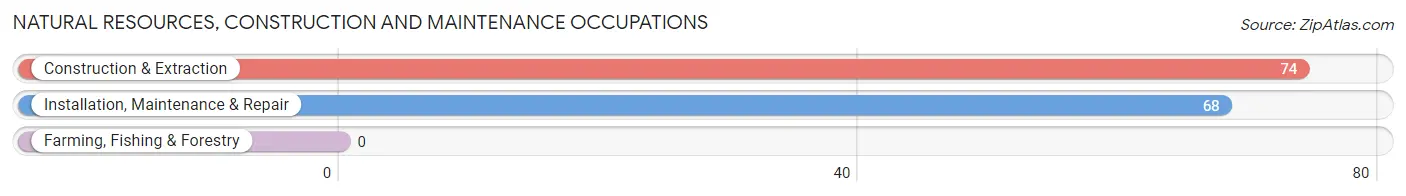
Natural Resources, Construction and Maintenance Occupations by Sex
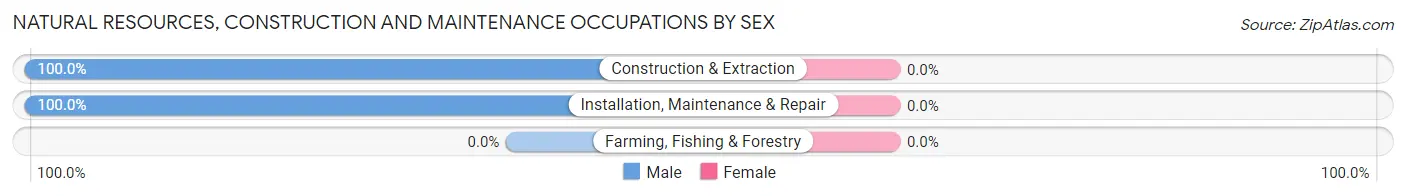
| Occupation | Male | Female |
| Farming, Fishing & Forestry | 0 (0.0%) | 0 (0.0%) |
| Construction & Extraction | 74 (100.0%) | 0 (0.0%) |
| Installation, Maintenance & Repair | 68 (100.0%) | 0 (0.0%) |
| Total (Category) | 142 (100.0%) | 0 (0.0%) |
| Total (Overall) | 3,302 (60.2%) | 2,182 (39.8%) |
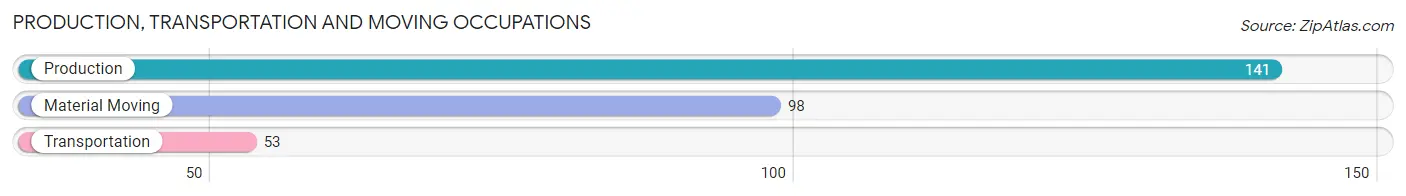
Production, Transportation and Moving Occupations
The most common Production, Transportation and Moving occupations in San Marino are Production (141 | 2.6%), Material Moving (98 | 1.8%), and Transportation (53 | 1.0%).
Production, Transportation and Moving Occupations by Sex
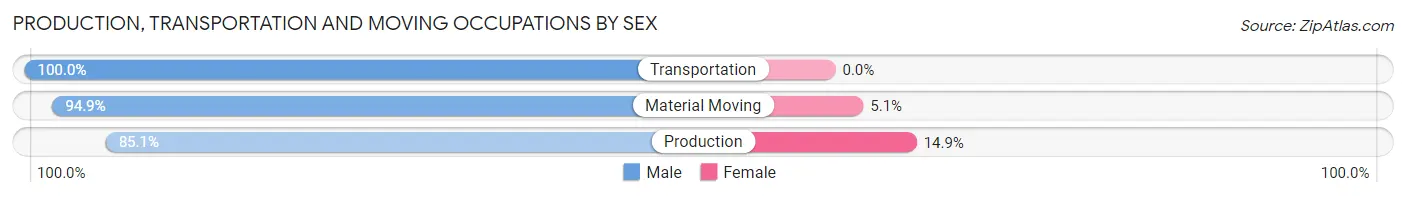
| Occupation | Male | Female |
| Production | 120 (85.1%) | 21 (14.9%) |
| Transportation | 53 (100.0%) | 0 (0.0%) |
| Material Moving | 93 (94.9%) | 5 (5.1%) |
| Total (Category) | 266 (91.1%) | 26 (8.9%) |
| Total (Overall) | 3,302 (60.2%) | 2,182 (39.8%) |
Employment Industries by Sex in San Marino
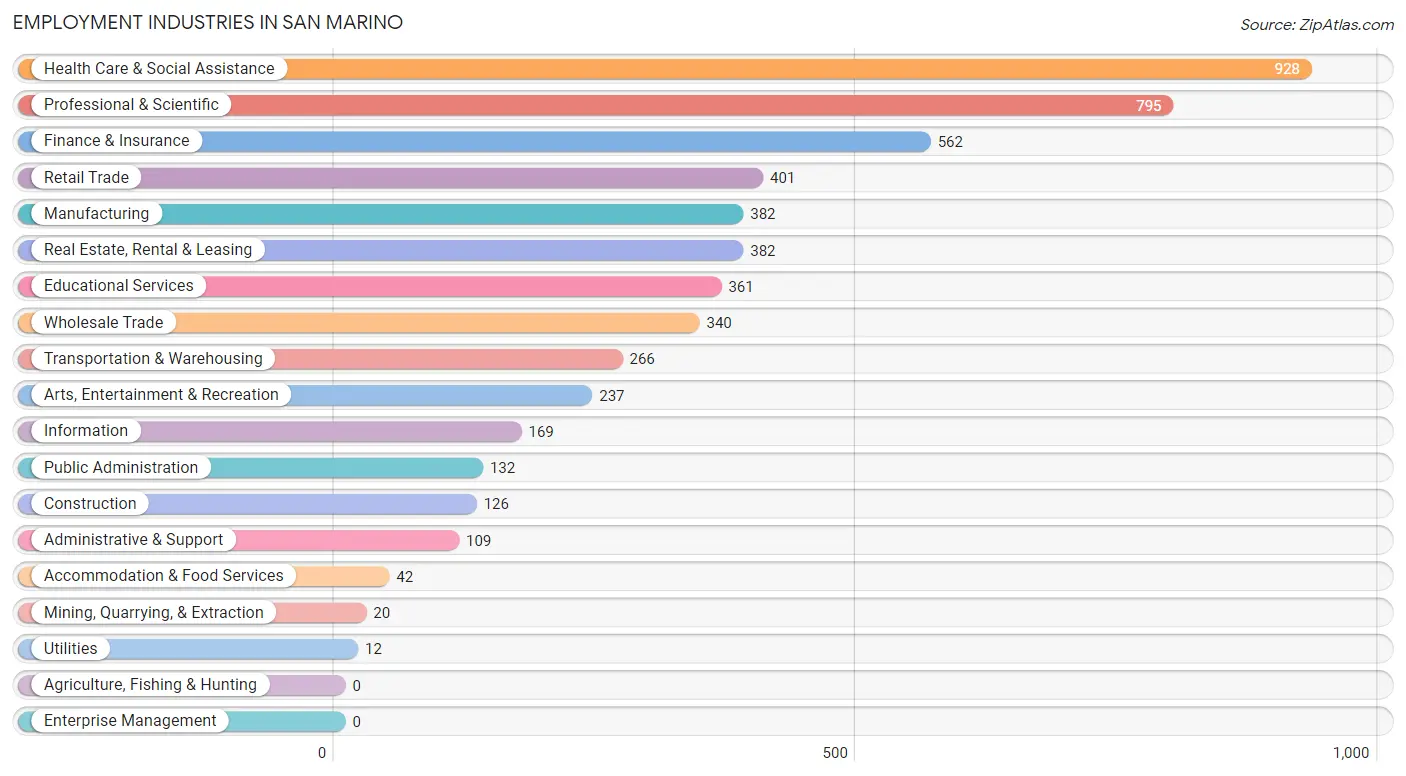
Employment Industries in San Marino
The major employment industries in San Marino include Health Care & Social Assistance (928 | 16.9%), Professional & Scientific (795 | 14.5%), Finance & Insurance (562 | 10.2%), Retail Trade (401 | 7.3%), and Manufacturing (382 | 7.0%).
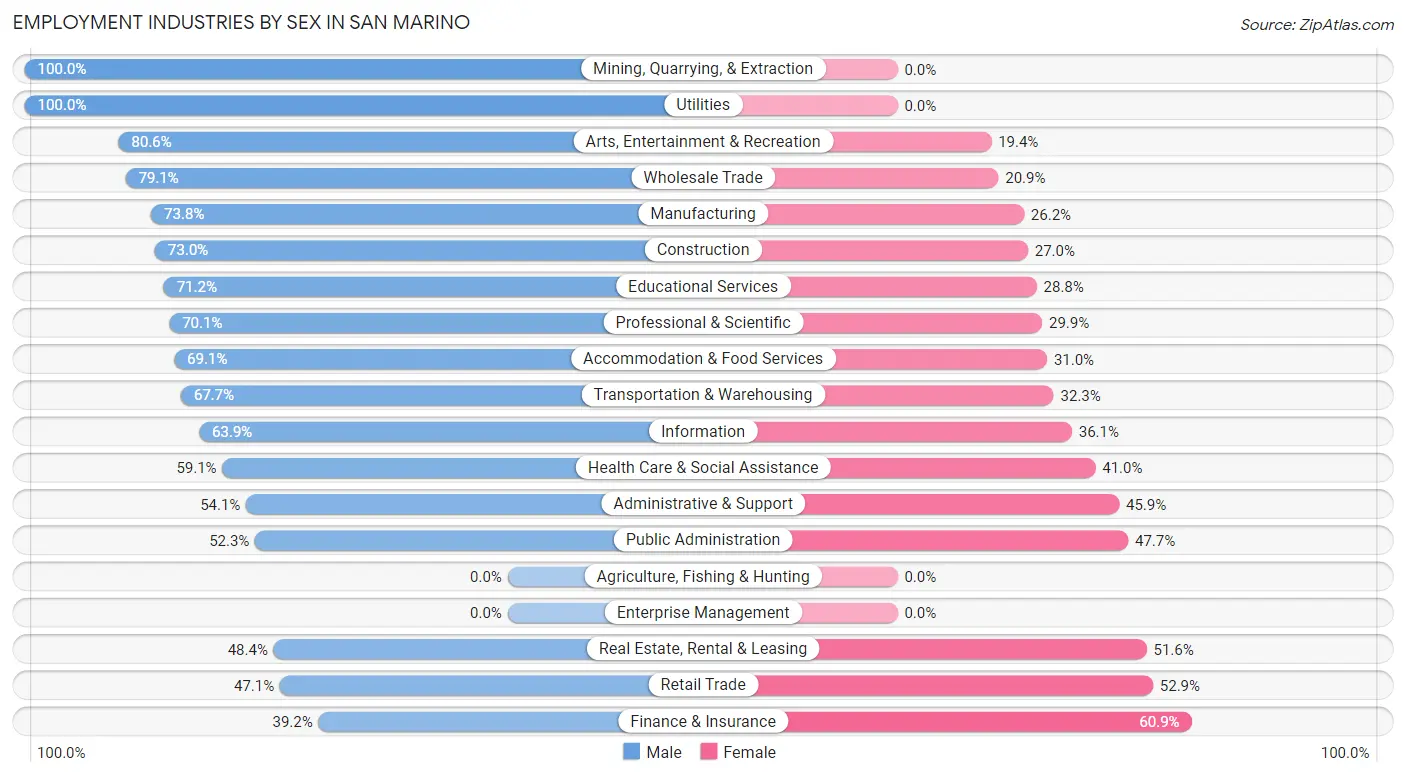
Employment Industries by Sex in San Marino
The San Marino industries that see more men than women are Mining, Quarrying, & Extraction (100.0%), Utilities (100.0%), and Arts, Entertainment & Recreation (80.6%), whereas the industries that tend to have a higher number of women are Finance & Insurance (60.9%), Retail Trade (52.9%), and Real Estate, Rental & Leasing (51.6%).
| Industry | Male | Female |
| Agriculture, Fishing & Hunting | 0 (0.0%) | 0 (0.0%) |
| Mining, Quarrying, & Extraction | 20 (100.0%) | 0 (0.0%) |
| Construction | 92 (73.0%) | 34 (27.0%) |
| Manufacturing | 282 (73.8%) | 100 (26.2%) |
| Wholesale Trade | 269 (79.1%) | 71 (20.9%) |
| Retail Trade | 189 (47.1%) | 212 (52.9%) |
| Transportation & Warehousing | 180 (67.7%) | 86 (32.3%) |
| Utilities | 12 (100.0%) | 0 (0.0%) |
| Information | 108 (63.9%) | 61 (36.1%) |
| Finance & Insurance | 220 (39.2%) | 342 (60.9%) |
| Real Estate, Rental & Leasing | 185 (48.4%) | 197 (51.6%) |
| Professional & Scientific | 557 (70.1%) | 238 (29.9%) |
| Enterprise Management | 0 (0.0%) | 0 (0.0%) |
| Administrative & Support | 59 (54.1%) | 50 (45.9%) |
| Educational Services | 257 (71.2%) | 104 (28.8%) |
| Health Care & Social Assistance | 548 (59.1%) | 380 (40.9%) |
| Arts, Entertainment & Recreation | 191 (80.6%) | 46 (19.4%) |
| Accommodation & Food Services | 29 (69.1%) | 13 (30.9%) |
| Public Administration | 69 (52.3%) | 63 (47.7%) |
| Total | 3,302 (60.2%) | 2,182 (39.8%) |
Education in San Marino
School Enrollment in San Marino
The most common levels of schooling among the 3,381 students in San Marino are high school (820 | 24.2%), middle school (570 | 16.9%), and elementary school (529 | 15.7%).
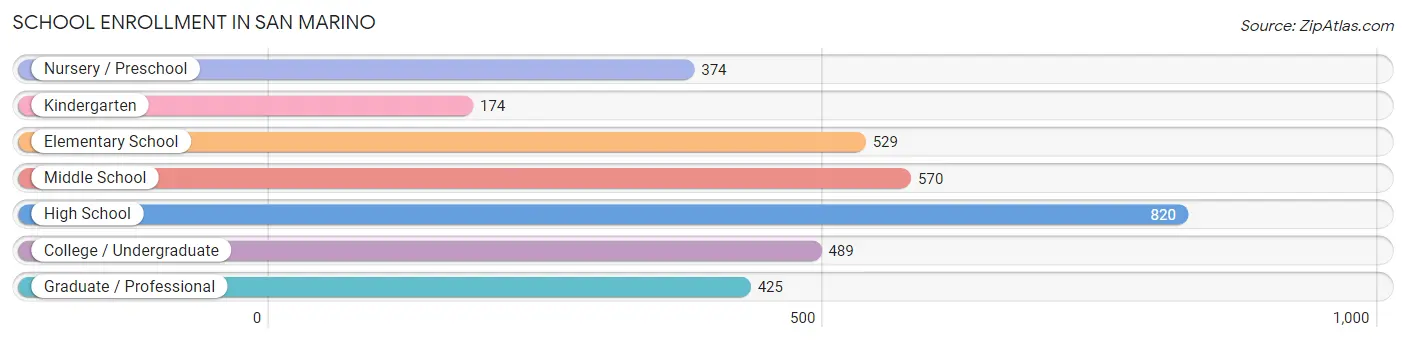
| School Level | # Students | % Students |
| Nursery / Preschool | 374 | 11.1% |
| Kindergarten | 174 | 5.1% |
| Elementary School | 529 | 15.7% |
| Middle School | 570 | 16.9% |
| High School | 820 | 24.2% |
| College / Undergraduate | 489 | 14.5% |
| Graduate / Professional | 425 | 12.6% |
| Total | 3,381 | 100.0% |
School Enrollment by Age by Funding Source in San Marino
Out of a total of 3,381 students who are enrolled in schools in San Marino, 1,339 (39.6%) attend a private institution, while the remaining 2,042 (60.4%) are enrolled in public schools. The age group of 3 to 4 year olds has the highest likelihood of being enrolled in private schools, with 226 (91.1% in the age bracket) enrolled. Conversely, the age group of 15 to 17 year olds has the lowest likelihood of being enrolled in a private school, with 589 (75.0% in the age bracket) attending a public institution.
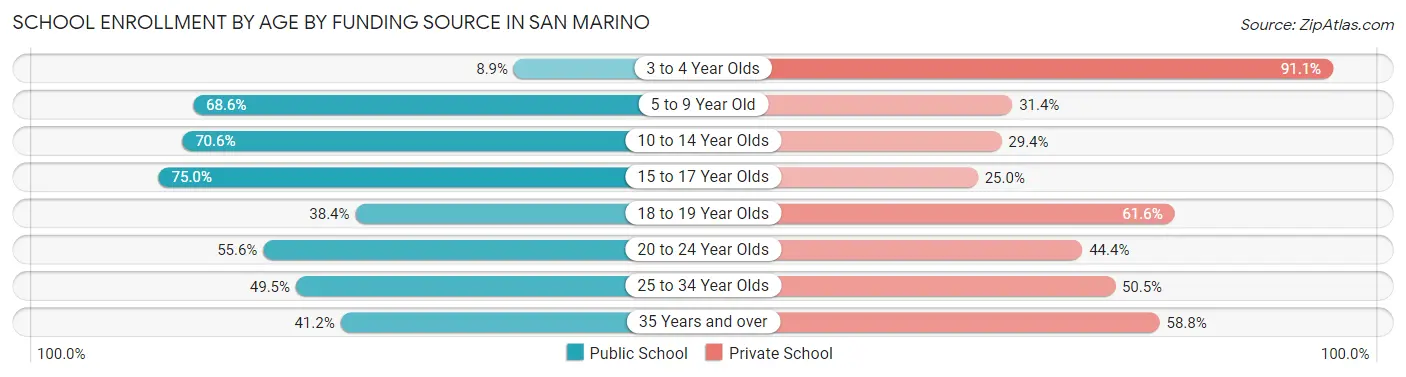
| Age Bracket | Public School | Private School |
| 3 to 4 Year Olds | 22 (8.9%) | 226 (91.1%) |
| 5 to 9 Year Old | 542 (68.6%) | 248 (31.4%) |
| 10 to 14 Year Olds | 445 (70.6%) | 185 (29.4%) |
| 15 to 17 Year Olds | 589 (75.0%) | 196 (25.0%) |
| 18 to 19 Year Olds | 43 (38.4%) | 69 (61.6%) |
| 20 to 24 Year Olds | 195 (55.6%) | 156 (44.4%) |
| 25 to 34 Year Olds | 93 (49.5%) | 95 (50.5%) |
| 35 Years and over | 114 (41.2%) | 163 (58.8%) |
| Total | 2,042 (60.4%) | 1,339 (39.6%) |
Educational Attainment by Field of Study in San Marino
Business (2,261 | 29.5%), social sciences (984 | 12.8%), bio, nature & agricultural (680 | 8.9%), psychology (511 | 6.7%), and science & technology (467 | 6.1%) are the most common fields of study among 7,663 individuals in San Marino who have obtained a bachelor's degree or higher.
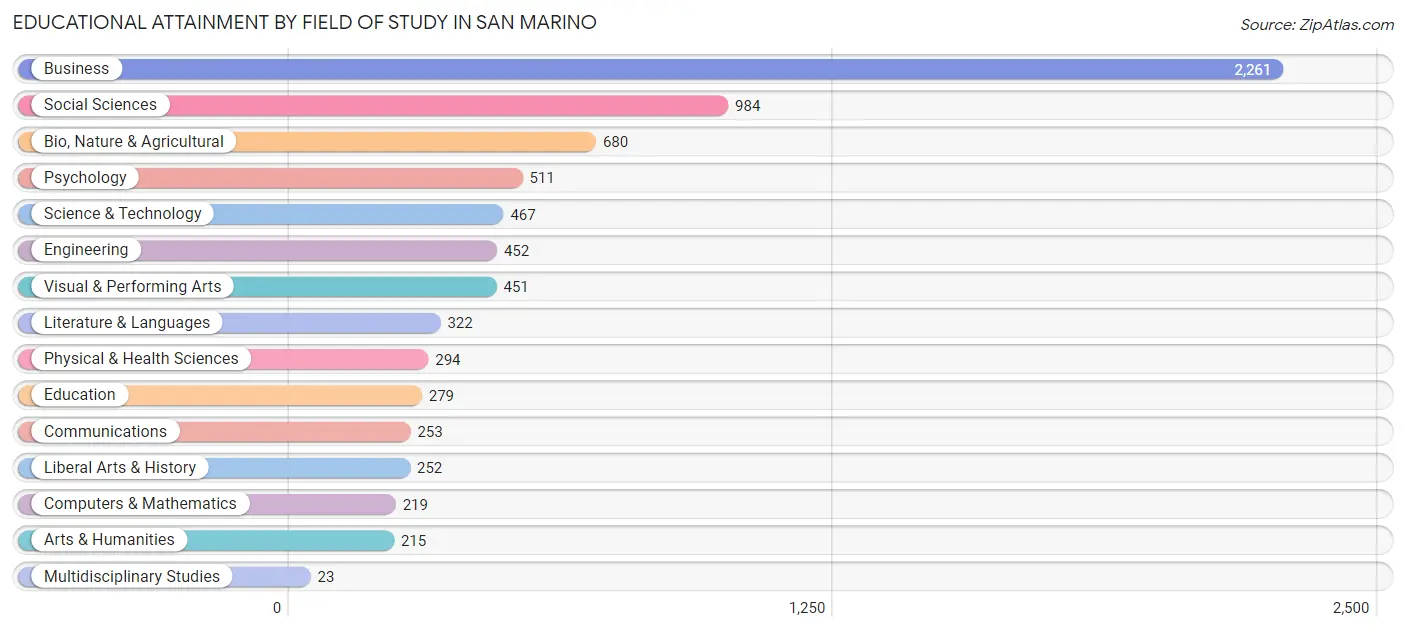
| Field of Study | # Graduates | % Graduates |
| Computers & Mathematics | 219 | 2.9% |
| Bio, Nature & Agricultural | 680 | 8.9% |
| Physical & Health Sciences | 294 | 3.8% |
| Psychology | 511 | 6.7% |
| Social Sciences | 984 | 12.8% |
| Engineering | 452 | 5.9% |
| Multidisciplinary Studies | 23 | 0.3% |
| Science & Technology | 467 | 6.1% |
| Business | 2,261 | 29.5% |
| Education | 279 | 3.6% |
| Literature & Languages | 322 | 4.2% |
| Liberal Arts & History | 252 | 3.3% |
| Visual & Performing Arts | 451 | 5.9% |
| Communications | 253 | 3.3% |
| Arts & Humanities | 215 | 2.8% |
| Total | 7,663 | 100.0% |
Transportation & Commute in San Marino
Vehicle Availability by Sex in San Marino
The most prevalent vehicle ownership categories in San Marino are males with 2 vehicles (1,274, accounting for 42.4%) and females with 2 vehicles (776, making up 59.4%).
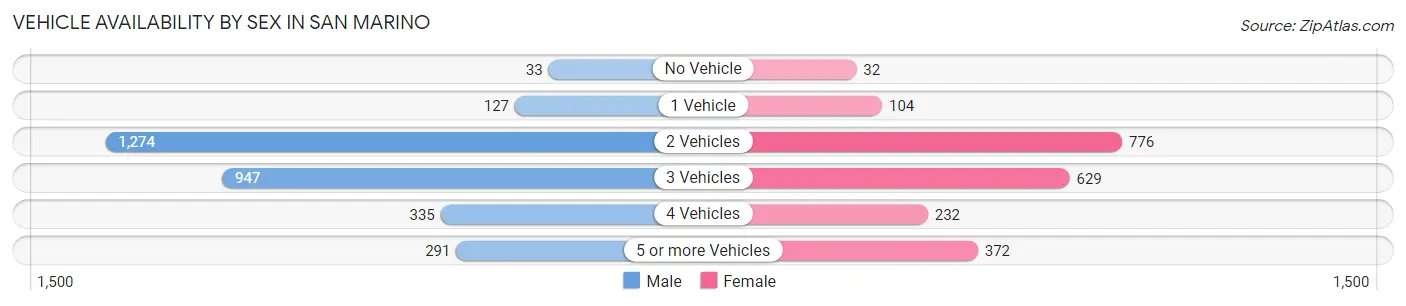
| Vehicles Available | Male | Female |
| No Vehicle | 33 (1.1%) | 32 (1.5%) |
| 1 Vehicle | 127 (4.2%) | 104 (4.9%) |
| 2 Vehicles | 1,274 (42.4%) | 776 (36.2%) |
| 3 Vehicles | 947 (31.5%) | 629 (29.3%) |
| 4 Vehicles | 335 (11.1%) | 232 (10.8%) |
| 5 or more Vehicles | 291 (9.7%) | 372 (17.3%) |
| Total | 3,007 (100.0%) | 2,145 (100.0%) |
Commute Time in San Marino
The most frequently occuring commute durations in San Marino are 15 to 19 minutes (759 commuters, 18.6%), 10 to 14 minutes (661 commuters, 16.2%), and 20 to 24 minutes (517 commuters, 12.7%).
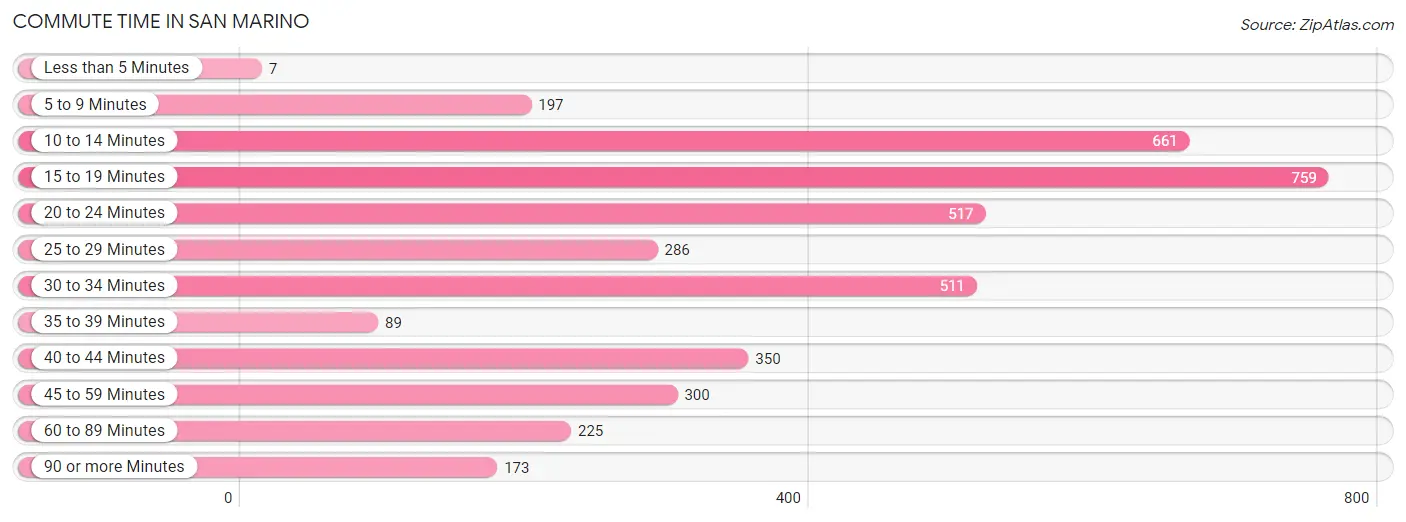
| Commute Time | # Commuters | % Commuters |
| Less than 5 Minutes | 7 | 0.2% |
| 5 to 9 Minutes | 197 | 4.8% |
| 10 to 14 Minutes | 661 | 16.2% |
| 15 to 19 Minutes | 759 | 18.6% |
| 20 to 24 Minutes | 517 | 12.7% |
| 25 to 29 Minutes | 286 | 7.0% |
| 30 to 34 Minutes | 511 | 12.5% |
| 35 to 39 Minutes | 89 | 2.2% |
| 40 to 44 Minutes | 350 | 8.6% |
| 45 to 59 Minutes | 300 | 7.4% |
| 60 to 89 Minutes | 225 | 5.5% |
| 90 or more Minutes | 173 | 4.3% |
Commute Time by Sex in San Marino
The most common commute times in San Marino are 10 to 14 minutes (436 commuters, 18.9%) for males and 15 to 19 minutes (431 commuters, 24.3%) for females.
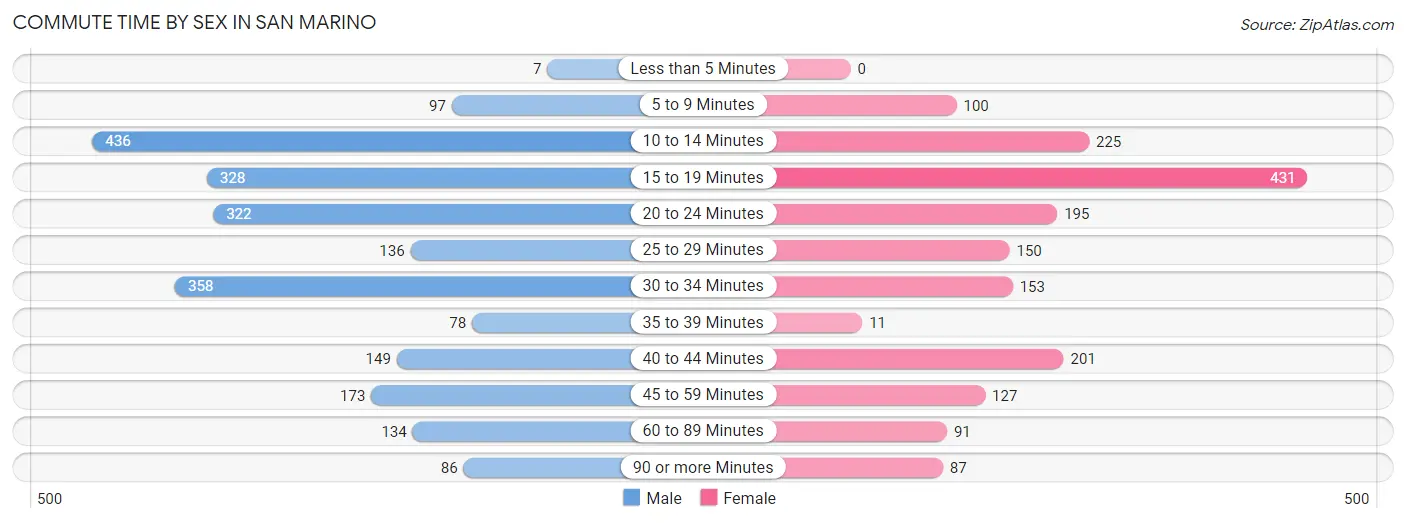
| Commute Time | Male | Female |
| Less than 5 Minutes | 7 (0.3%) | 0 (0.0%) |
| 5 to 9 Minutes | 97 (4.2%) | 100 (5.7%) |
| 10 to 14 Minutes | 436 (18.9%) | 225 (12.7%) |
| 15 to 19 Minutes | 328 (14.2%) | 431 (24.3%) |
| 20 to 24 Minutes | 322 (14.0%) | 195 (11.0%) |
| 25 to 29 Minutes | 136 (5.9%) | 150 (8.5%) |
| 30 to 34 Minutes | 358 (15.5%) | 153 (8.6%) |
| 35 to 39 Minutes | 78 (3.4%) | 11 (0.6%) |
| 40 to 44 Minutes | 149 (6.5%) | 201 (11.4%) |
| 45 to 59 Minutes | 173 (7.5%) | 127 (7.2%) |
| 60 to 89 Minutes | 134 (5.8%) | 91 (5.1%) |
| 90 or more Minutes | 86 (3.7%) | 87 (4.9%) |
Time of Departure to Work by Sex in San Marino
The most frequent times of departure to work in San Marino are 7:00 AM to 7:29 AM (413, 17.9%) for males and 8:00 AM to 8:29 AM (349, 19.7%) for females.
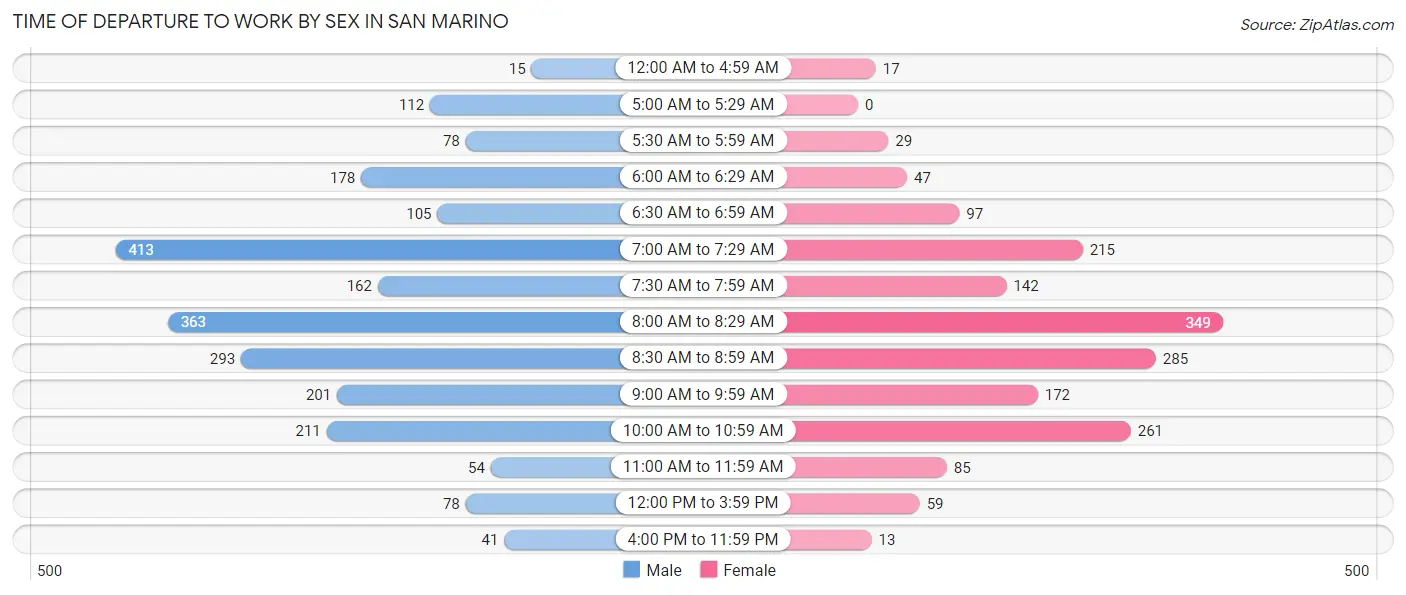
| Time of Departure | Male | Female |
| 12:00 AM to 4:59 AM | 15 (0.6%) | 17 (1.0%) |
| 5:00 AM to 5:29 AM | 112 (4.9%) | 0 (0.0%) |
| 5:30 AM to 5:59 AM | 78 (3.4%) | 29 (1.6%) |
| 6:00 AM to 6:29 AM | 178 (7.7%) | 47 (2.6%) |
| 6:30 AM to 6:59 AM | 105 (4.6%) | 97 (5.5%) |
| 7:00 AM to 7:29 AM | 413 (17.9%) | 215 (12.1%) |
| 7:30 AM to 7:59 AM | 162 (7.0%) | 142 (8.0%) |
| 8:00 AM to 8:29 AM | 363 (15.8%) | 349 (19.7%) |
| 8:30 AM to 8:59 AM | 293 (12.7%) | 285 (16.1%) |
| 9:00 AM to 9:59 AM | 201 (8.7%) | 172 (9.7%) |
| 10:00 AM to 10:59 AM | 211 (9.2%) | 261 (14.7%) |
| 11:00 AM to 11:59 AM | 54 (2.3%) | 85 (4.8%) |
| 12:00 PM to 3:59 PM | 78 (3.4%) | 59 (3.3%) |
| 4:00 PM to 11:59 PM | 41 (1.8%) | 13 (0.7%) |
| Total | 2,304 (100.0%) | 1,771 (100.0%) |
Housing Occupancy in San Marino
Occupancy by Ownership in San Marino
Of the total 3,916 dwellings in San Marino, owner-occupied units account for 3,255 (83.1%), while renter-occupied units make up 661 (16.9%).
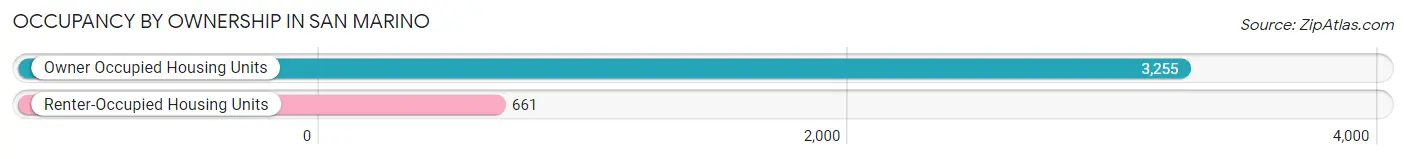
| Occupancy | # Housing Units | % Housing Units |
| Owner Occupied Housing Units | 3,255 | 83.1% |
| Renter-Occupied Housing Units | 661 | 16.9% |
| Total Occupied Housing Units | 3,916 | 100.0% |
Occupancy by Household Size in San Marino
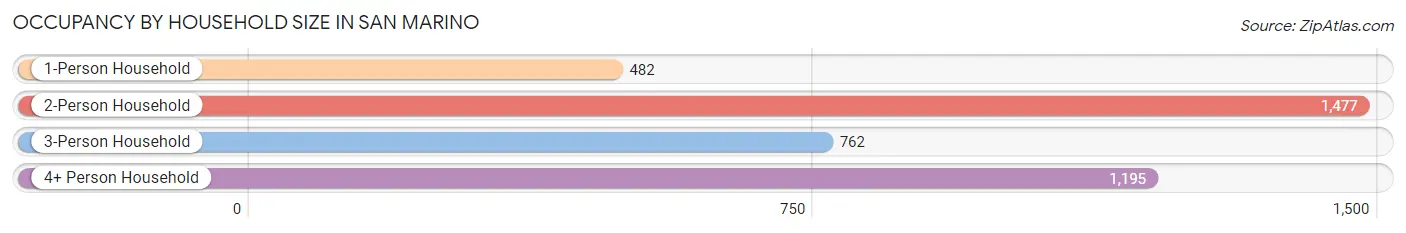
| Household Size | # Housing Units | % Housing Units |
| 1-Person Household | 482 | 12.3% |
| 2-Person Household | 1,477 | 37.7% |
| 3-Person Household | 762 | 19.5% |
| 4+ Person Household | 1,195 | 30.5% |
| Total Housing Units | 3,916 | 100.0% |
Occupancy by Ownership by Household Size in San Marino
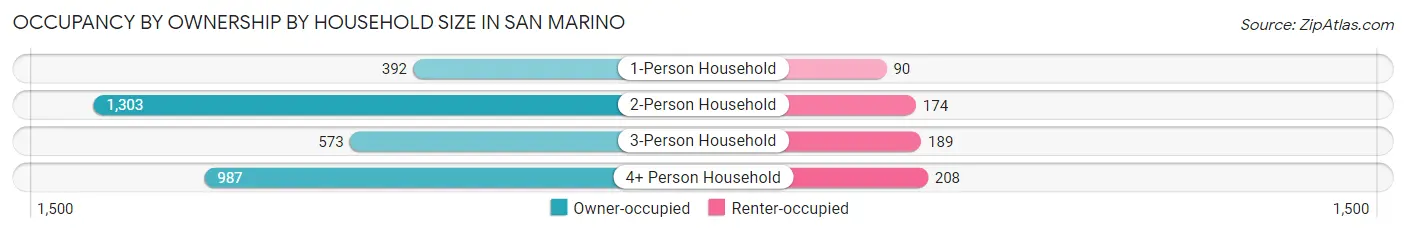
| Household Size | Owner-occupied | Renter-occupied |
| 1-Person Household | 392 (81.3%) | 90 (18.7%) |
| 2-Person Household | 1,303 (88.2%) | 174 (11.8%) |
| 3-Person Household | 573 (75.2%) | 189 (24.8%) |
| 4+ Person Household | 987 (82.6%) | 208 (17.4%) |
| Total Housing Units | 3,255 (83.1%) | 661 (16.9%) |
Occupancy by Educational Attainment in San Marino
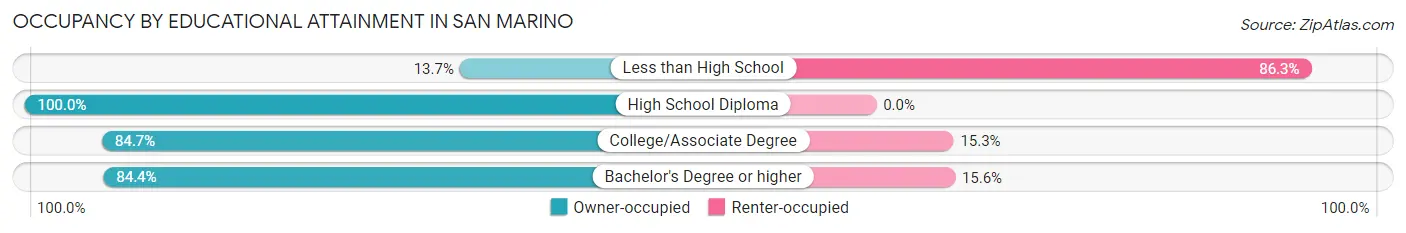
| Household Size | Owner-occupied | Renter-occupied |
| Less than High School | 14 (13.7%) | 88 (86.3%) |
| High School Diploma | 139 (100.0%) | 0 (0.0%) |
| College/Associate Degree | 304 (84.7%) | 55 (15.3%) |
| Bachelor's Degree or higher | 2,798 (84.4%) | 518 (15.6%) |
Occupancy by Age of Householder in San Marino
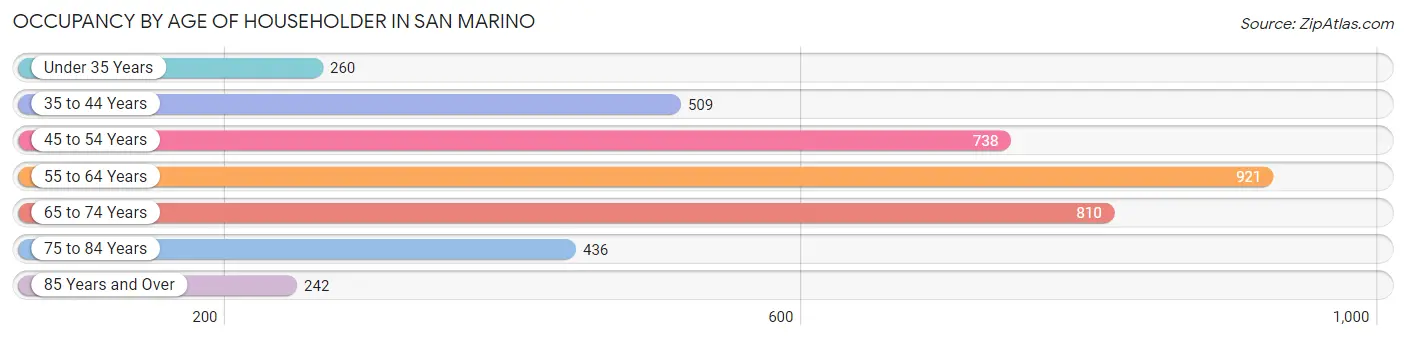
| Age Bracket | # Households | % Households |
| Under 35 Years | 260 | 6.6% |
| 35 to 44 Years | 509 | 13.0% |
| 45 to 54 Years | 738 | 18.9% |
| 55 to 64 Years | 921 | 23.5% |
| 65 to 74 Years | 810 | 20.7% |
| 75 to 84 Years | 436 | 11.1% |
| 85 Years and Over | 242 | 6.2% |
| Total | 3,916 | 100.0% |
Housing Finances in San Marino
Median Income by Occupancy in San Marino
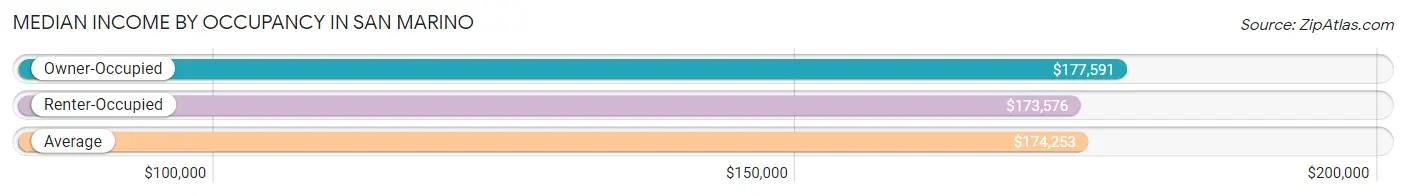
| Occupancy Type | # Households | Median Income |
| Owner-Occupied | 3,255 (83.1%) | $177,591 |
| Renter-Occupied | 661 (16.9%) | $173,576 |
| Average | 3,916 (100.0%) | $174,253 |
Occupancy by Householder Income Bracket in San Marino
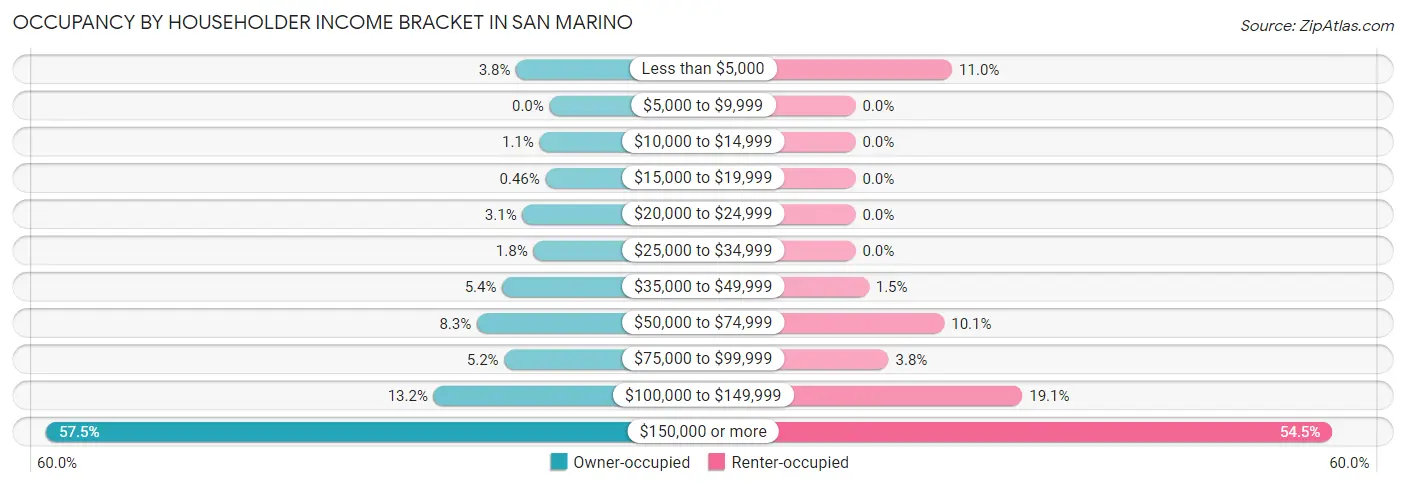
| Income Bracket | Owner-occupied | Renter-occupied |
| Less than $5,000 | 124 (3.8%) | 73 (11.0%) |
| $5,000 to $9,999 | 0 (0.0%) | 0 (0.0%) |
| $10,000 to $14,999 | 37 (1.1%) | 0 (0.0%) |
| $15,000 to $19,999 | 15 (0.5%) | 0 (0.0%) |
| $20,000 to $24,999 | 101 (3.1%) | 0 (0.0%) |
| $25,000 to $34,999 | 60 (1.8%) | 0 (0.0%) |
| $35,000 to $49,999 | 176 (5.4%) | 10 (1.5%) |
| $50,000 to $74,999 | 270 (8.3%) | 67 (10.1%) |
| $75,000 to $99,999 | 168 (5.2%) | 25 (3.8%) |
| $100,000 to $149,999 | 431 (13.2%) | 126 (19.1%) |
| $150,000 or more | 1,873 (57.5%) | 360 (54.5%) |
| Total | 3,255 (100.0%) | 661 (100.0%) |
Monthly Housing Cost Tiers in San Marino
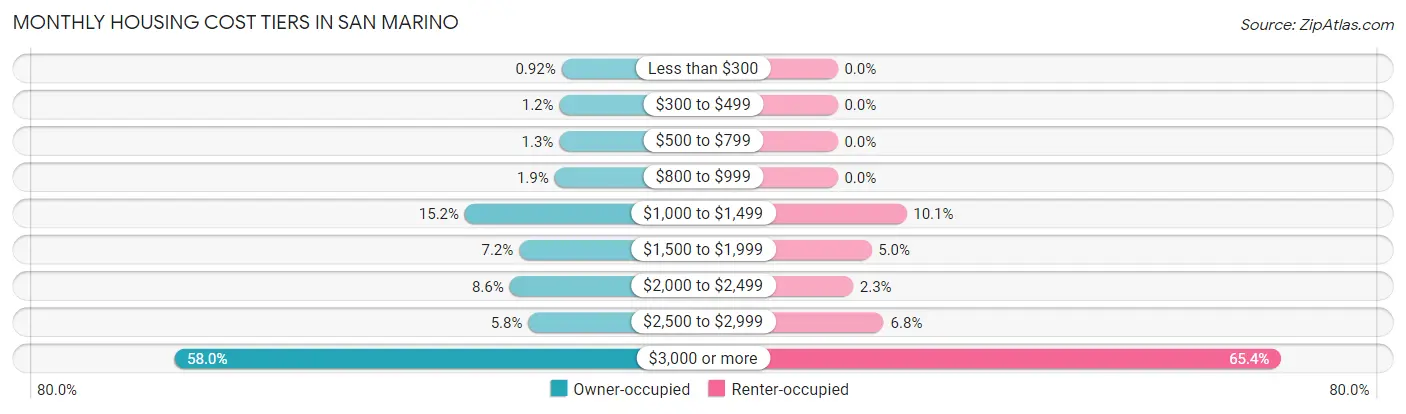
| Monthly Cost | Owner-occupied | Renter-occupied |
| Less than $300 | 30 (0.9%) | 0 (0.0%) |
| $300 to $499 | 40 (1.2%) | 0 (0.0%) |
| $500 to $799 | 41 (1.3%) | 0 (0.0%) |
| $800 to $999 | 63 (1.9%) | 0 (0.0%) |
| $1,000 to $1,499 | 493 (15.1%) | 67 (10.1%) |
| $1,500 to $1,999 | 233 (7.2%) | 33 (5.0%) |
| $2,000 to $2,499 | 279 (8.6%) | 15 (2.3%) |
| $2,500 to $2,999 | 189 (5.8%) | 45 (6.8%) |
| $3,000 or more | 1,887 (58.0%) | 432 (65.4%) |
| Total | 3,255 (100.0%) | 661 (100.0%) |
Physical Housing Characteristics in San Marino
Housing Structures in San Marino
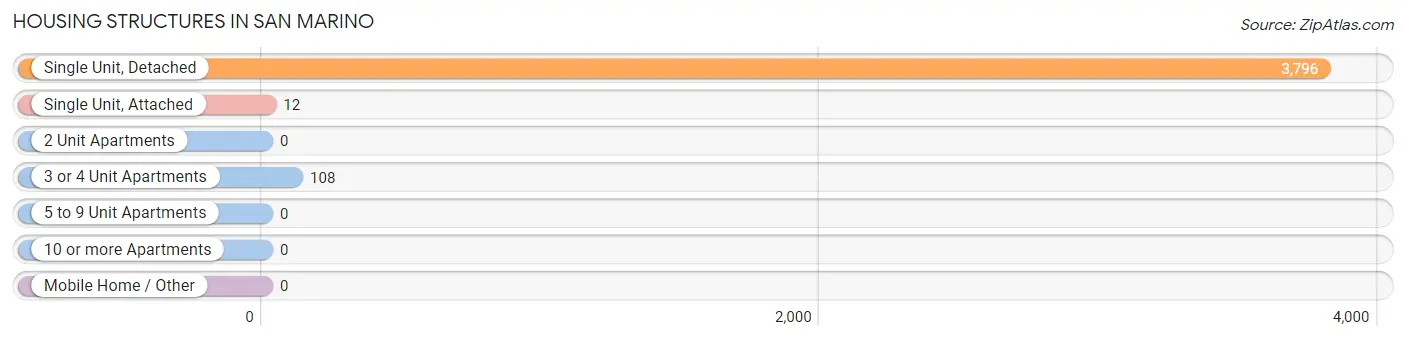
| Structure Type | # Housing Units | % Housing Units |
| Single Unit, Detached | 3,796 | 96.9% |
| Single Unit, Attached | 12 | 0.3% |
| 2 Unit Apartments | 0 | 0.0% |
| 3 or 4 Unit Apartments | 108 | 2.8% |
| 5 to 9 Unit Apartments | 0 | 0.0% |
| 10 or more Apartments | 0 | 0.0% |
| Mobile Home / Other | 0 | 0.0% |
| Total | 3,916 | 100.0% |
Housing Structures by Occupancy in San Marino
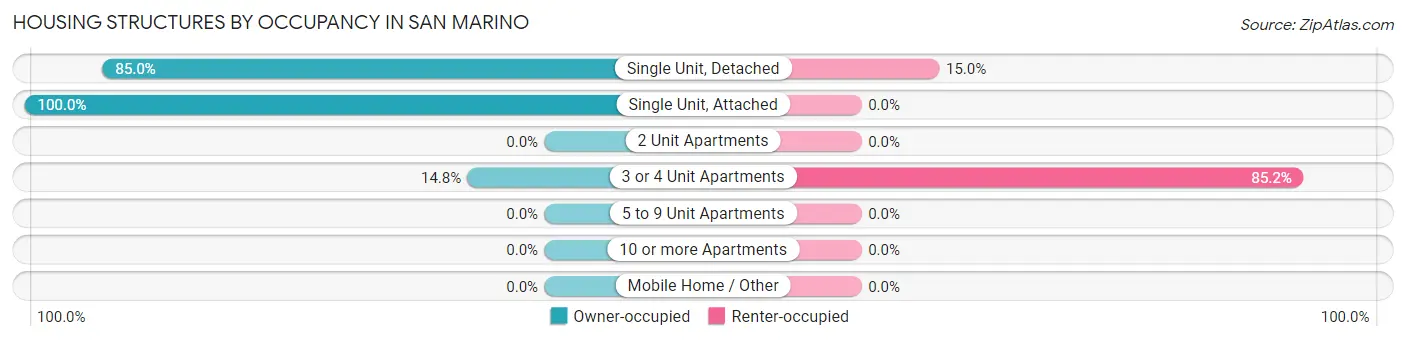
| Structure Type | Owner-occupied | Renter-occupied |
| Single Unit, Detached | 3,227 (85.0%) | 569 (15.0%) |
| Single Unit, Attached | 12 (100.0%) | 0 (0.0%) |
| 2 Unit Apartments | 0 (0.0%) | 0 (0.0%) |
| 3 or 4 Unit Apartments | 16 (14.8%) | 92 (85.2%) |
| 5 to 9 Unit Apartments | 0 (0.0%) | 0 (0.0%) |
| 10 or more Apartments | 0 (0.0%) | 0 (0.0%) |
| Mobile Home / Other | 0 (0.0%) | 0 (0.0%) |
| Total | 3,255 (83.1%) | 661 (16.9%) |
Housing Structures by Number of Rooms in San Marino
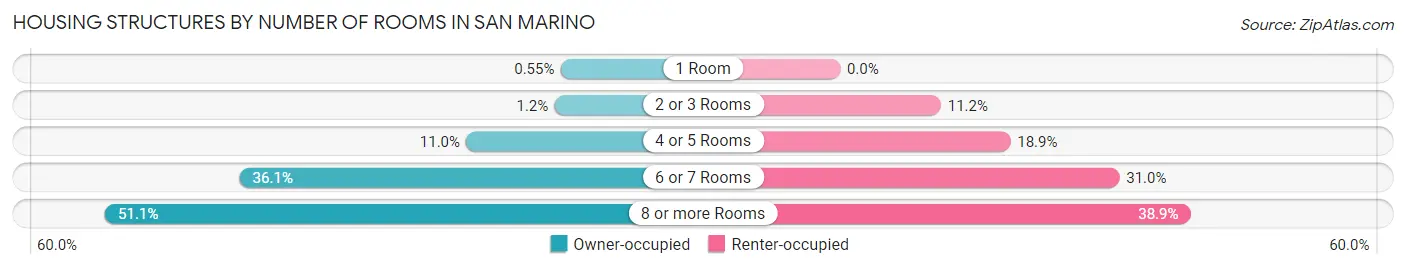
| Number of Rooms | Owner-occupied | Renter-occupied |
| 1 Room | 18 (0.5%) | 0 (0.0%) |
| 2 or 3 Rooms | 40 (1.2%) | 74 (11.2%) |
| 4 or 5 Rooms | 359 (11.0%) | 125 (18.9%) |
| 6 or 7 Rooms | 1,176 (36.1%) | 205 (31.0%) |
| 8 or more Rooms | 1,662 (51.1%) | 257 (38.9%) |
| Total | 3,255 (100.0%) | 661 (100.0%) |
Housing Structure by Heating Type in San Marino
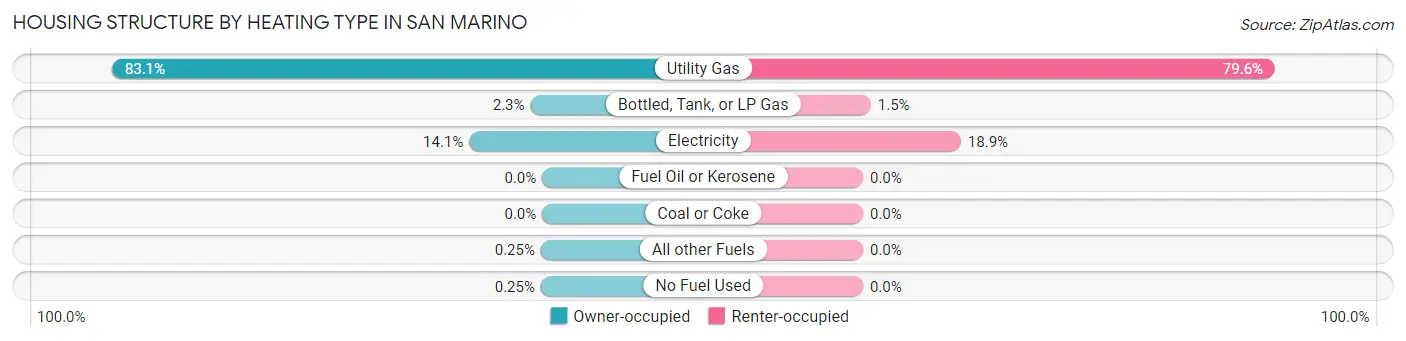
| Heating Type | Owner-occupied | Renter-occupied |
| Utility Gas | 2,706 (83.1%) | 526 (79.6%) |
| Bottled, Tank, or LP Gas | 74 (2.3%) | 10 (1.5%) |
| Electricity | 459 (14.1%) | 125 (18.9%) |
| Fuel Oil or Kerosene | 0 (0.0%) | 0 (0.0%) |
| Coal or Coke | 0 (0.0%) | 0 (0.0%) |
| All other Fuels | 8 (0.3%) | 0 (0.0%) |
| No Fuel Used | 8 (0.3%) | 0 (0.0%) |
| Total | 3,255 (100.0%) | 661 (100.0%) |
Household Vehicle Usage in San Marino
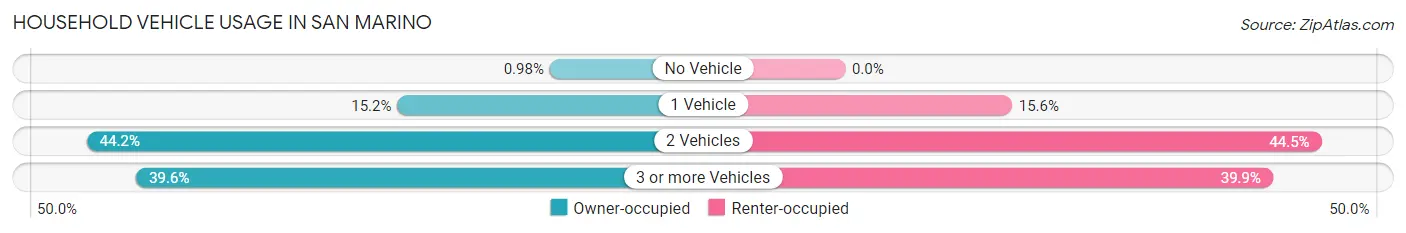
| Vehicles per Household | Owner-occupied | Renter-occupied |
| No Vehicle | 32 (1.0%) | 0 (0.0%) |
| 1 Vehicle | 495 (15.2%) | 103 (15.6%) |
| 2 Vehicles | 1,439 (44.2%) | 294 (44.5%) |
| 3 or more Vehicles | 1,289 (39.6%) | 264 (39.9%) |
| Total | 3,255 (100.0%) | 661 (100.0%) |
Real Estate & Mortgages in San Marino
Real Estate and Mortgage Overview in San Marino
| Characteristic | Without Mortgage | With Mortgage |
| Housing Units | 1,477 | 1,778 |
| Median Property Value | $2,000,001 | $2,000,001 |
| Median Household Income | $109,561 | $1,293 |
| Monthly Housing Costs | $1,501 | $1,616 |
| Real Estate Taxes | $10,001 | $18 |
Property Value by Mortgage Status in San Marino
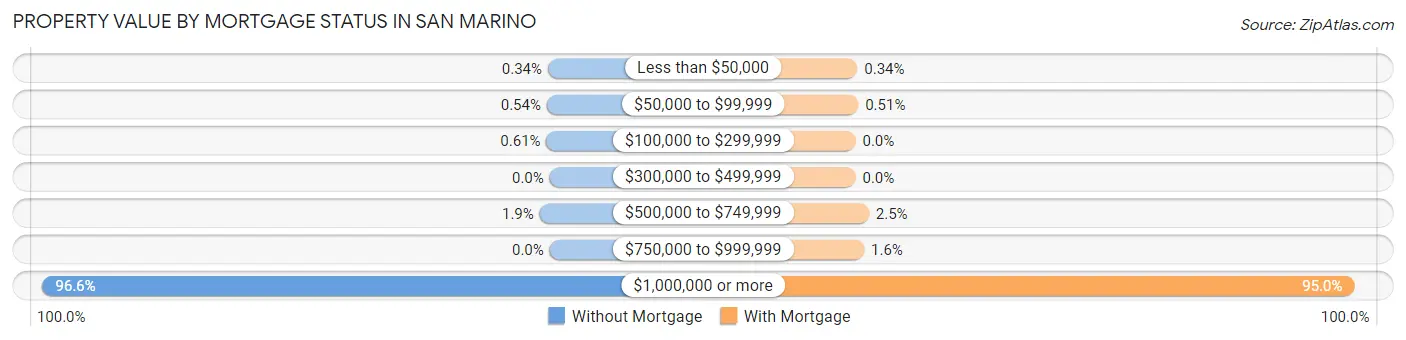
| Property Value | Without Mortgage | With Mortgage |
| Less than $50,000 | 5 (0.3%) | 6 (0.3%) |
| $50,000 to $99,999 | 8 (0.5%) | 9 (0.5%) |
| $100,000 to $299,999 | 9 (0.6%) | 0 (0.0%) |
| $300,000 to $499,999 | 0 (0.0%) | 0 (0.0%) |
| $500,000 to $749,999 | 28 (1.9%) | 45 (2.5%) |
| $750,000 to $999,999 | 0 (0.0%) | 29 (1.6%) |
| $1,000,000 or more | 1,427 (96.6%) | 1,689 (95.0%) |
| Total | 1,477 (100.0%) | 1,778 (100.0%) |
Household Income by Mortgage Status in San Marino
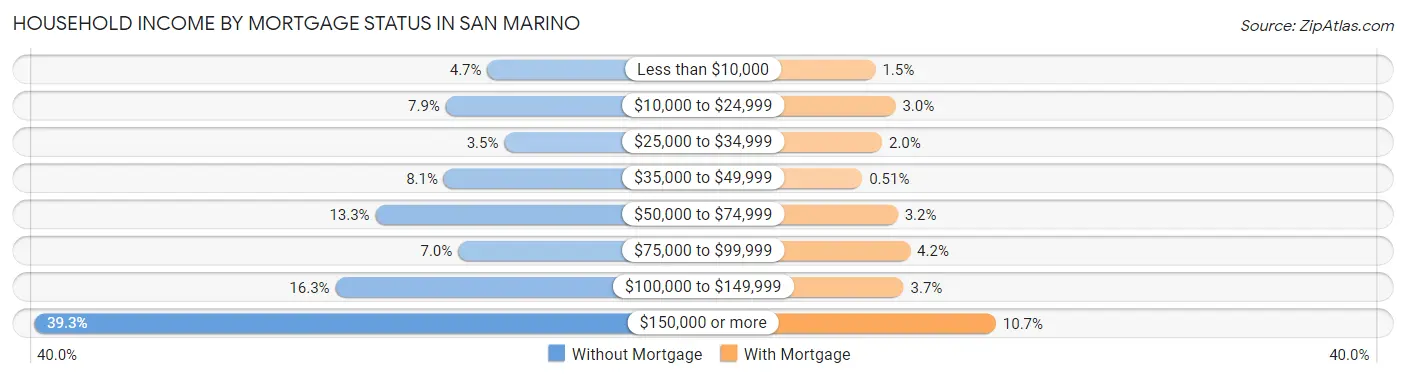
| Household Income | Without Mortgage | With Mortgage |
| Less than $10,000 | 70 (4.7%) | 27 (1.5%) |
| $10,000 to $24,999 | 117 (7.9%) | 54 (3.0%) |
| $25,000 to $34,999 | 51 (3.5%) | 36 (2.0%) |
| $35,000 to $49,999 | 119 (8.1%) | 9 (0.5%) |
| $50,000 to $74,999 | 196 (13.3%) | 57 (3.2%) |
| $75,000 to $99,999 | 103 (7.0%) | 74 (4.2%) |
| $100,000 to $149,999 | 241 (16.3%) | 65 (3.7%) |
| $150,000 or more | 580 (39.3%) | 190 (10.7%) |
| Total | 1,477 (100.0%) | 1,778 (100.0%) |
Property Value to Household Income Ratio in San Marino
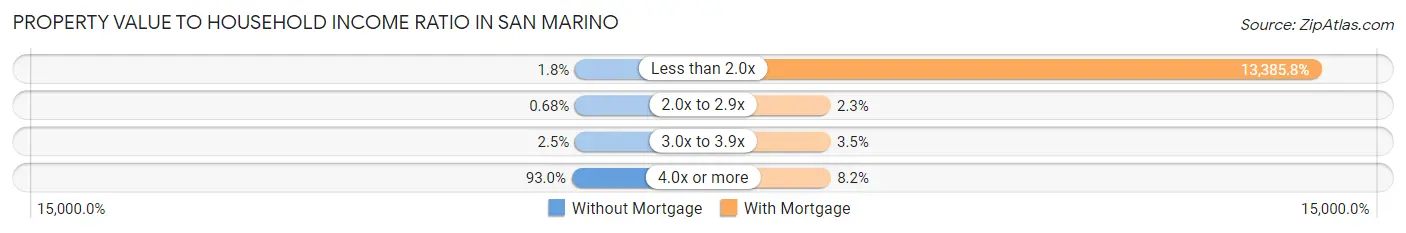
| Value-to-Income Ratio | Without Mortgage | With Mortgage |
| Less than 2.0x | 27 (1.8%) | 238,000 (13,385.8%) |
| 2.0x to 2.9x | 10 (0.7%) | 41 (2.3%) |
| 3.0x to 3.9x | 37 (2.5%) | 63 (3.5%) |
| 4.0x or more | 1,373 (93.0%) | 146 (8.2%) |
| Total | 1,477 (100.0%) | 1,778 (100.0%) |
Real Estate Taxes by Mortgage Status in San Marino
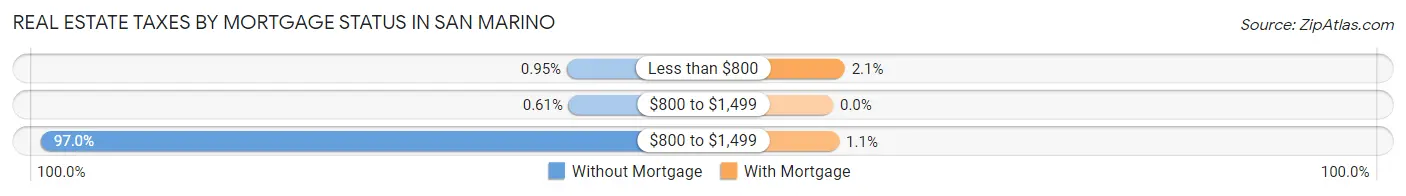
| Property Taxes | Without Mortgage | With Mortgage |
| Less than $800 | 14 (0.9%) | 38 (2.1%) |
| $800 to $1,499 | 9 (0.6%) | 0 (0.0%) |
| $800 to $1,499 | 1,433 (97.0%) | 20 (1.1%) |
| Total | 1,477 (100.0%) | 1,778 (100.0%) |
Health & Disability in San Marino
Health Insurance Coverage by Age in San Marino
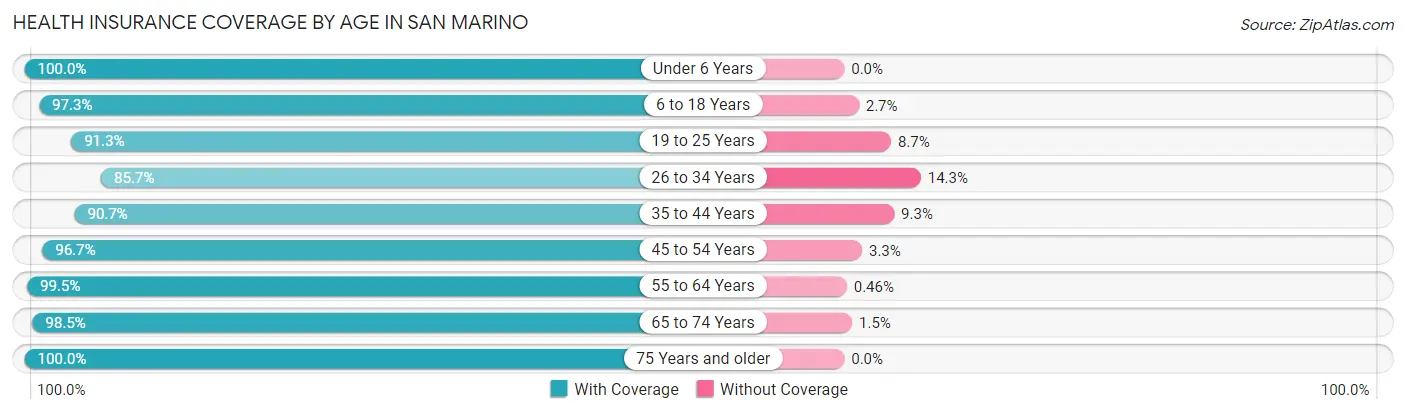
| Age Bracket | With Coverage | Without Coverage |
| Under 6 Years | 857 (100.0%) | 0 (0.0%) |
| 6 to 18 Years | 2,021 (97.3%) | 56 (2.7%) |
| 19 to 25 Years | 535 (91.3%) | 51 (8.7%) |
| 26 to 34 Years | 1,094 (85.7%) | 182 (14.3%) |
| 35 to 44 Years | 1,180 (90.7%) | 121 (9.3%) |
| 45 to 54 Years | 1,870 (96.7%) | 64 (3.3%) |
| 55 to 64 Years | 1,749 (99.5%) | 8 (0.5%) |
| 65 to 74 Years | 1,548 (98.5%) | 23 (1.5%) |
| 75 Years and older | 1,083 (100.0%) | 0 (0.0%) |
| Total | 11,937 (95.9%) | 505 (4.1%) |
Health Insurance Coverage by Citizenship Status in San Marino
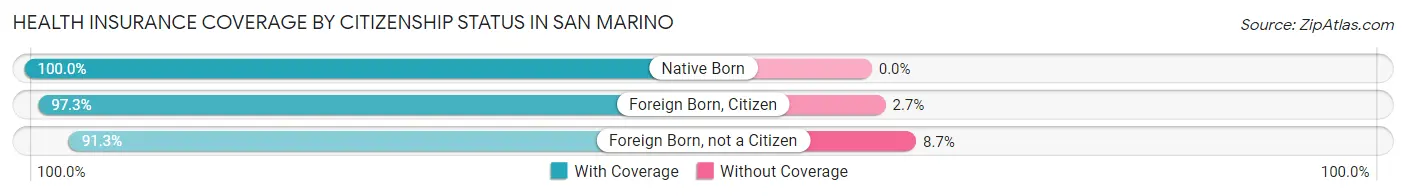
| Citizenship Status | With Coverage | Without Coverage |
| Native Born | 857 (100.0%) | 0 (0.0%) |
| Foreign Born, Citizen | 2,021 (97.3%) | 56 (2.7%) |
| Foreign Born, not a Citizen | 535 (91.3%) | 51 (8.7%) |
Health Insurance Coverage by Household Income in San Marino
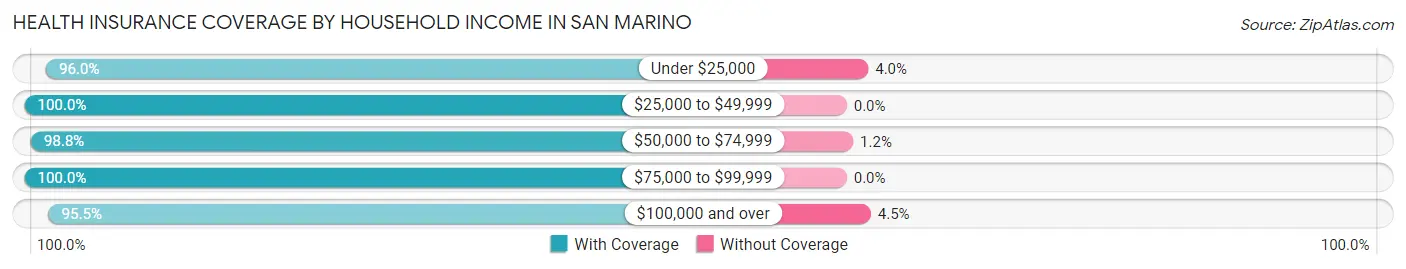
| Household Income | With Coverage | Without Coverage |
| Under $25,000 | 762 (96.0%) | 32 (4.0%) |
| $25,000 to $49,999 | 489 (100.0%) | 0 (0.0%) |
| $50,000 to $74,999 | 662 (98.8%) | 8 (1.2%) |
| $75,000 to $99,999 | 618 (100.0%) | 0 (0.0%) |
| $100,000 and over | 9,300 (95.5%) | 439 (4.5%) |
Public vs Private Health Insurance Coverage by Age in San Marino
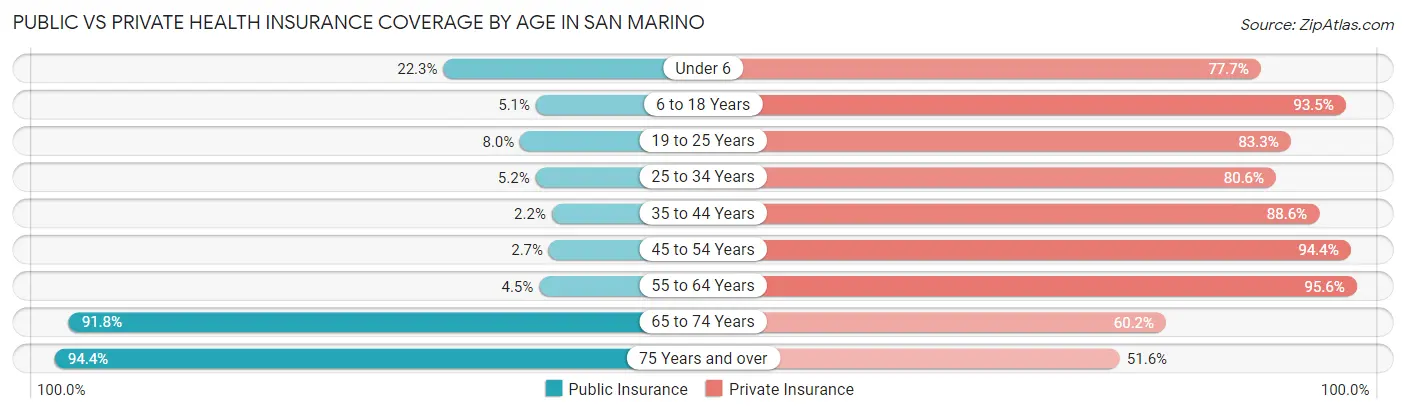
| Age Bracket | Public Insurance | Private Insurance |
| Under 6 | 191 (22.3%) | 666 (77.7%) |
| 6 to 18 Years | 106 (5.1%) | 1,942 (93.5%) |
| 19 to 25 Years | 47 (8.0%) | 488 (83.3%) |
| 25 to 34 Years | 66 (5.2%) | 1,028 (80.6%) |
| 35 to 44 Years | 28 (2.1%) | 1,152 (88.5%) |
| 45 to 54 Years | 52 (2.7%) | 1,826 (94.4%) |
| 55 to 64 Years | 79 (4.5%) | 1,679 (95.6%) |
| 65 to 74 Years | 1,442 (91.8%) | 945 (60.2%) |
| 75 Years and over | 1,022 (94.4%) | 559 (51.6%) |
| Total | 3,033 (24.4%) | 10,285 (82.7%) |
Disability Status by Sex by Age in San Marino
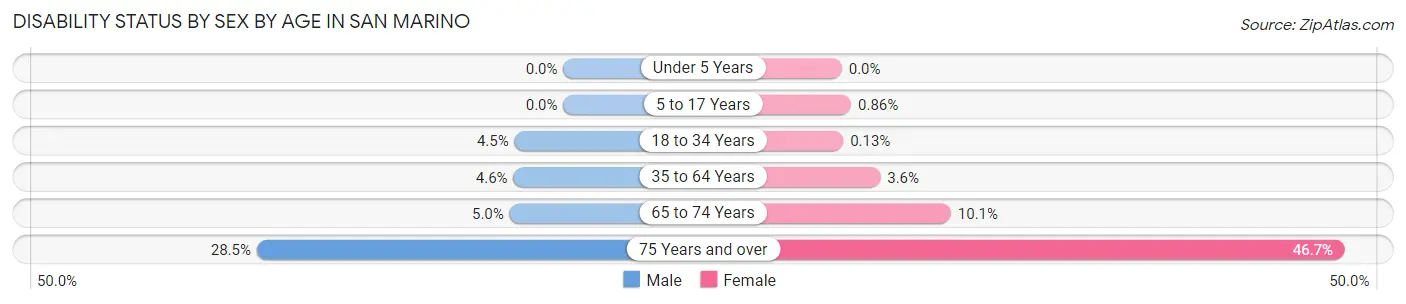
| Age Bracket | Male | Female |
| Under 5 Years | 0 (0.0%) | 0 (0.0%) |
| 5 to 17 Years | 0 (0.0%) | 8 (0.9%) |
| 18 to 34 Years | 52 (4.5%) | 1 (0.1%) |
| 35 to 64 Years | 112 (4.6%) | 92 (3.6%) |
| 65 to 74 Years | 37 (5.0%) | 84 (10.1%) |
| 75 Years and over | 132 (28.4%) | 289 (46.7%) |
Disability Class by Sex by Age in San Marino
Disability Class: Hearing Difficulty
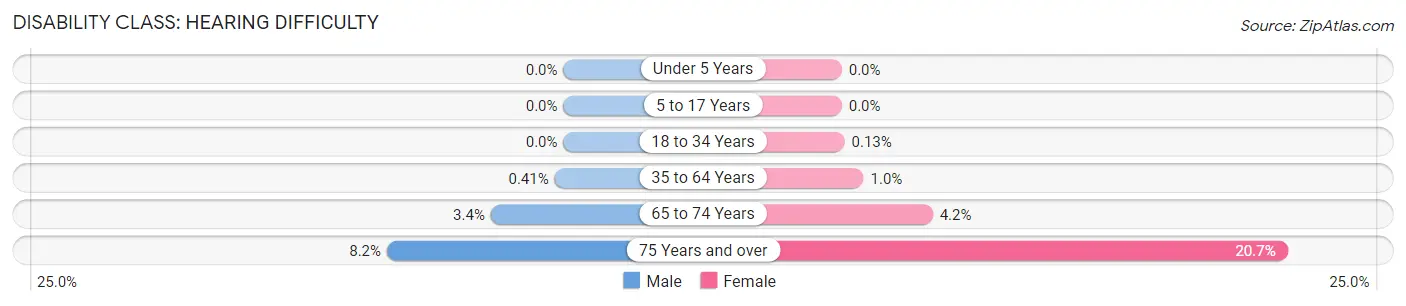
| Age Bracket | Male | Female |
| Under 5 Years | 0 (0.0%) | 0 (0.0%) |
| 5 to 17 Years | 0 (0.0%) | 0 (0.0%) |
| 18 to 34 Years | 0 (0.0%) | 1 (0.1%) |
| 35 to 64 Years | 10 (0.4%) | 26 (1.0%) |
| 65 to 74 Years | 25 (3.4%) | 35 (4.2%) |
| 75 Years and over | 38 (8.2%) | 128 (20.7%) |
Disability Class: Vision Difficulty
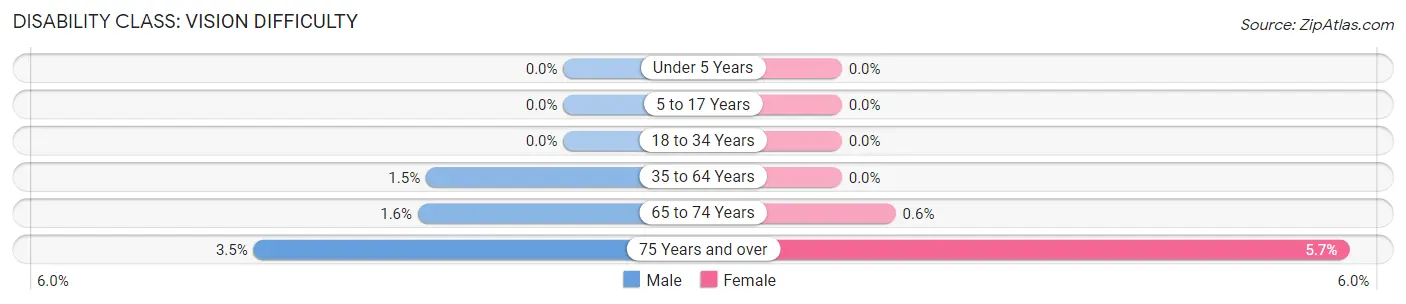
| Age Bracket | Male | Female |
| Under 5 Years | 0 (0.0%) | 0 (0.0%) |
| 5 to 17 Years | 0 (0.0%) | 0 (0.0%) |
| 18 to 34 Years | 0 (0.0%) | 0 (0.0%) |
| 35 to 64 Years | 37 (1.5%) | 0 (0.0%) |
| 65 to 74 Years | 12 (1.6%) | 5 (0.6%) |
| 75 Years and over | 16 (3.5%) | 35 (5.7%) |
Disability Class: Cognitive Difficulty
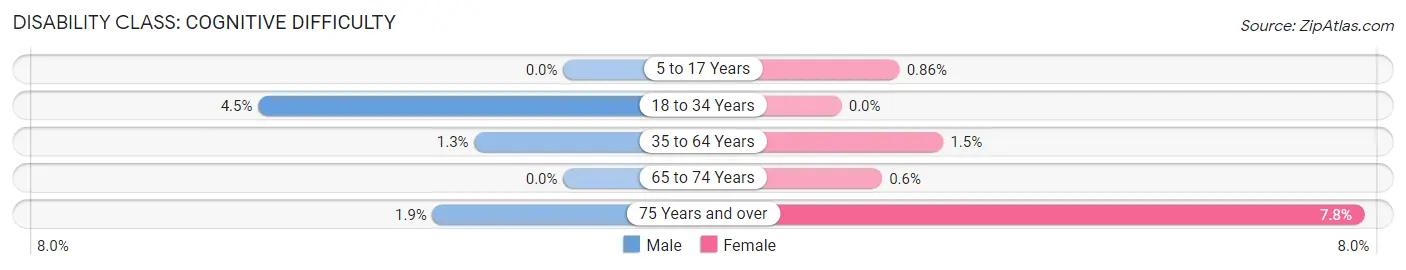
| Age Bracket | Male | Female |
| 5 to 17 Years | 0 (0.0%) | 8 (0.9%) |
| 18 to 34 Years | 52 (4.5%) | 0 (0.0%) |
| 35 to 64 Years | 32 (1.3%) | 39 (1.5%) |
| 65 to 74 Years | 0 (0.0%) | 5 (0.6%) |
| 75 Years and over | 9 (1.9%) | 48 (7.7%) |
Disability Class: Ambulatory Difficulty
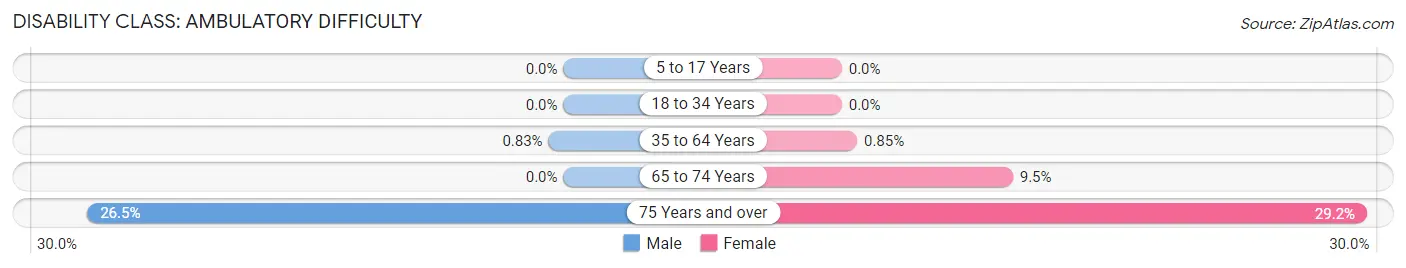
| Age Bracket | Male | Female |
| 5 to 17 Years | 0 (0.0%) | 0 (0.0%) |
| 18 to 34 Years | 0 (0.0%) | 0 (0.0%) |
| 35 to 64 Years | 20 (0.8%) | 22 (0.9%) |
| 65 to 74 Years | 0 (0.0%) | 79 (9.5%) |
| 75 Years and over | 123 (26.5%) | 181 (29.2%) |
Disability Class: Self-Care Difficulty
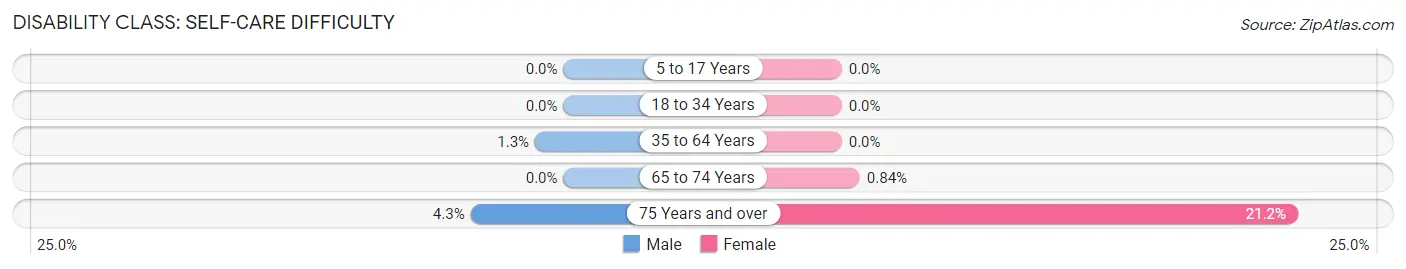
| Age Bracket | Male | Female |
| 5 to 17 Years | 0 (0.0%) | 0 (0.0%) |
| 18 to 34 Years | 0 (0.0%) | 0 (0.0%) |
| 35 to 64 Years | 32 (1.3%) | 0 (0.0%) |
| 65 to 74 Years | 0 (0.0%) | 7 (0.8%) |
| 75 Years and over | 20 (4.3%) | 131 (21.2%) |
Technology Access in San Marino
Computing Device Access in San Marino
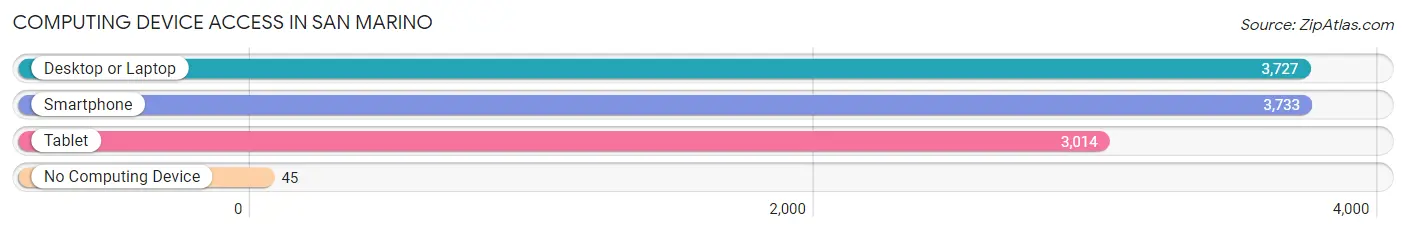
| Device Type | # Households | % Households |
| Desktop or Laptop | 3,727 | 95.2% |
| Smartphone | 3,733 | 95.3% |
| Tablet | 3,014 | 77.0% |
| No Computing Device | 45 | 1.1% |
| Total | 3,916 | 100.0% |
Internet Access in San Marino
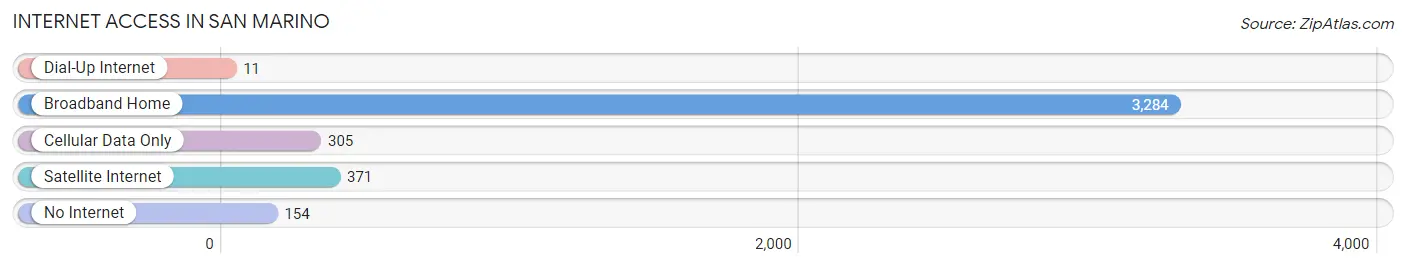
| Internet Type | # Households | % Households |
| Dial-Up Internet | 11 | 0.3% |
| Broadband Home | 3,284 | 83.9% |
| Cellular Data Only | 305 | 7.8% |
| Satellite Internet | 371 | 9.5% |
| No Internet | 154 | 3.9% |
| Total | 3,916 | 100.0% |
San Marino Summary
San Marino is a city located in Los Angeles County, California, United States. It is located in the San Gabriel Valley, and is bordered by the cities of Pasadena, South Pasadena, Alhambra, and San Gabriel. The city is named after the Republic of San Marino, which is located in Italy. As of the 2010 census, the city had a population of 13,147.
History
The area that is now San Marino was originally inhabited by the Tongva Native American tribe. The area was later colonized by the Spanish in the late 18th century, and was part of the Rancho San Pascual land grant. In 1875, the area was purchased by Henry E. Huntington, who developed the area into a residential community. The city was incorporated in 1913, and was named after the Republic of San Marino, which is located in Italy.
Geography
San Marino is located at 34°08'N 118°07'W (34.13, -118.12). It is located in the San Gabriel Valley, and is bordered by the cities of Pasadena, South Pasadena, Alhambra, and San Gabriel. The city has a total area of 2.8 square miles, all of which is land.
Economy
The economy of San Marino is largely based on the service industry, with many residents employed in the retail, hospitality, and healthcare sectors. The city is also home to several corporate headquarters, including the headquarters of the Huntington Library, Art Collections, and Botanical Gardens.
Demographics
As of the 2010 census, there were 13,147 people, 4,845 households, and 3,717 families residing in the city. The population density was 4,637.3 people per square mile. The racial makeup of the city was 68.2% White, 1.2% African American, 0.2% Native American, 25.2% Asian, 0.1% Pacific Islander, 2.2% from other races, and 2.9% from two or more races. Hispanic or Latino of any race were 8.2% of the population.
The median income for a household in the city was $118,871, and the median income for a family was $139,945. The per capita income for the city was $64,945. About 3.2% of families and 4.3% of the population were below the poverty line, including 4.3% of those under age 18 and 4.2% of those age 65 or over.
Common Questions
What is Per Capita Income in San Marino?
Per Capita income in San Marino is $88,297.
What is the Median Family Income in San Marino?
Median Family Income in San Marino is $199,931.
What is the Median Household income in San Marino?
Median Household Income in San Marino is $174,253.
What is Income or Wage Gap in San Marino?
Income or Wage Gap in San Marino is 55.6%.
Women in San Marino earn 44.4 cents for every dollar earned by a man.
What is Inequality or Gini Index in San Marino?
Inequality or Gini Index in San Marino is 0.51.
What is the Total Population of San Marino?
Total Population of San Marino is 12,442.
What is the Total Male Population of San Marino?
Total Male Population of San Marino is 6,345.
What is the Total Female Population of San Marino?
Total Female Population of San Marino is 6,097.
What is the Ratio of Males per 100 Females in San Marino?
There are 104.07 Males per 100 Females in San Marino.
What is the Ratio of Females per 100 Males in San Marino?
There are 96.09 Females per 100 Males in San Marino.
What is the Median Population Age in San Marino?
Median Population Age in San Marino is 45.5 Years.
What is the Average Family Size in San Marino
Average Family Size in San Marino is 3.3 People.
What is the Average Household Size in San Marino
Average Household Size in San Marino is 3.1 People.
How Large is the Labor Force in San Marino?
There are 5,737 People in the Labor Forcein in San Marino.
What is the Percentage of People in the Labor Force in San Marino?
57.1% of People are in the Labor Force in San Marino.
What is the Unemployment Rate in San Marino?
Unemployment Rate in San Marino is 4.4%.