Green Valley CDP Los Angeles County, CA Map & Demographics
Green Valley CDP Los Angeles County Overview
$49,047
PER CAPITA INCOME
$88,000
AVG FAMILY INCOME
$82,083
AVG HOUSEHOLD INCOME
4.7%
WAGE / INCOME GAP [ % ]
95.3¢/ $1
WAGE / INCOME GAP [ $ ]
0.46
INEQUALITY / GINI INDEX
832
TOTAL POPULATION
453
MALE POPULATION
379
FEMALE POPULATION
119.53
MALES / 100 FEMALES
83.66
FEMALES / 100 MALES
45.8
MEDIAN AGE
2.6
AVG FAMILY SIZE
2.1
AVG HOUSEHOLD SIZE
400
LABOR FORCE [ PEOPLE ]
55.3%
PERCENT IN LABOR FORCE
14.3%
UNEMPLOYMENT RATE
Income in Green Valley CDP Los Angeles County
Income Overview in Green Valley CDP Los Angeles County
Per Capita Income in Green Valley CDP Los Angeles County is $49,047, while median incomes of families and households are $88,000 and $82,083 respectively.
| Characteristic | Number | Measure |
| Per Capita Income | 832 | $49,047 |
| Median Family Income | 218 | $88,000 |
| Mean Family Income | 218 | $113,885 |
| Median Household Income | 390 | $82,083 |
| Mean Household Income | 390 | $104,395 |
| Income Deficit | 218 | $0 |
| Wage / Income Gap (%) | 832 | 4.68% |
| Wage / Income Gap ($) | 832 | 95.32¢ per $1 |
| Gini / Inequality Index | 832 | 0.46 |
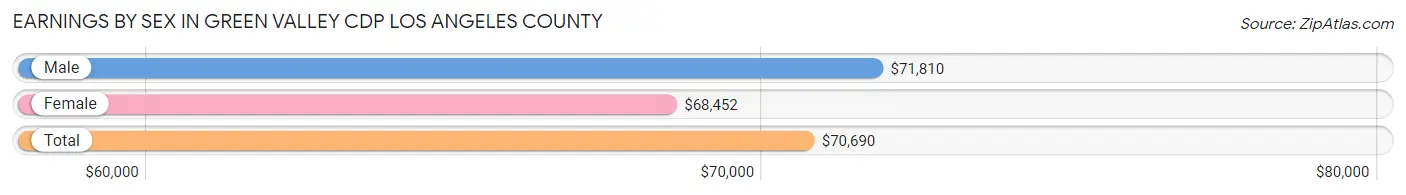
Earnings by Sex in Green Valley CDP Los Angeles County
Average Earnings in Green Valley CDP Los Angeles County are $70,690, $71,810 for men and $68,452 for women, a difference of 4.7%.
| Sex | Number | Average Earnings |
| Male | 220 (59.1%) | $71,810 |
| Female | 152 (40.9%) | $68,452 |
| Total | 372 (100.0%) | $70,690 |
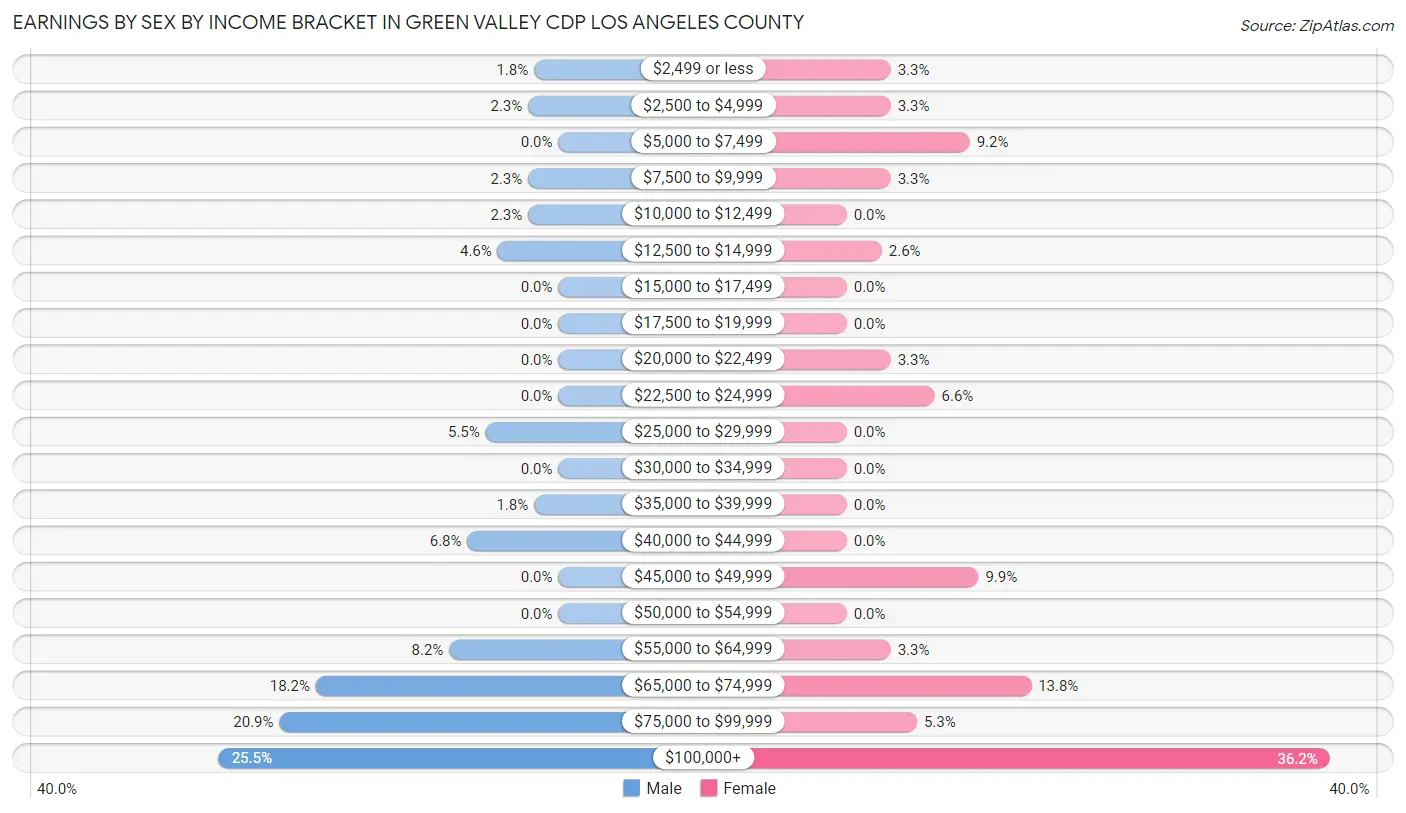
Earnings by Sex by Income Bracket in Green Valley CDP Los Angeles County
The most common earnings brackets in Green Valley CDP Los Angeles County are $100,000+ for men (56 | 25.5%) and $100,000+ for women (55 | 36.2%).
| Income | Male | Female |
| $2,499 or less | 4 (1.8%) | 5 (3.3%) |
| $2,500 to $4,999 | 5 (2.3%) | 5 (3.3%) |
| $5,000 to $7,499 | 0 (0.0%) | 14 (9.2%) |
| $7,500 to $9,999 | 5 (2.3%) | 5 (3.3%) |
| $10,000 to $12,499 | 5 (2.3%) | 0 (0.0%) |
| $12,500 to $14,999 | 10 (4.5%) | 4 (2.6%) |
| $15,000 to $17,499 | 0 (0.0%) | 0 (0.0%) |
| $17,500 to $19,999 | 0 (0.0%) | 0 (0.0%) |
| $20,000 to $22,499 | 0 (0.0%) | 5 (3.3%) |
| $22,500 to $24,999 | 0 (0.0%) | 10 (6.6%) |
| $25,000 to $29,999 | 12 (5.4%) | 0 (0.0%) |
| $30,000 to $34,999 | 0 (0.0%) | 0 (0.0%) |
| $35,000 to $39,999 | 4 (1.8%) | 0 (0.0%) |
| $40,000 to $44,999 | 15 (6.8%) | 0 (0.0%) |
| $45,000 to $49,999 | 0 (0.0%) | 15 (9.9%) |
| $50,000 to $54,999 | 0 (0.0%) | 0 (0.0%) |
| $55,000 to $64,999 | 18 (8.2%) | 5 (3.3%) |
| $65,000 to $74,999 | 40 (18.2%) | 21 (13.8%) |
| $75,000 to $99,999 | 46 (20.9%) | 8 (5.3%) |
| $100,000+ | 56 (25.5%) | 55 (36.2%) |
| Total | 220 (100.0%) | 152 (100.0%) |
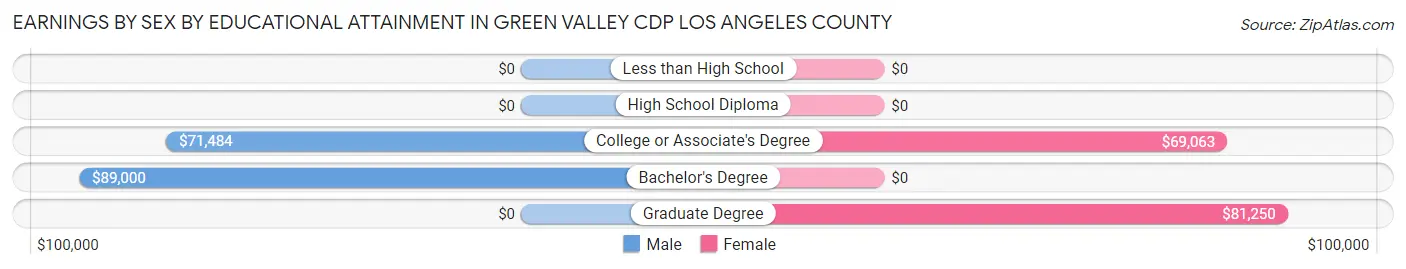
Earnings by Sex by Educational Attainment in Green Valley CDP Los Angeles County
Average earnings in Green Valley CDP Los Angeles County are $72,241 for men and $69,524 for women, a difference of 3.8%. Men with an educational attainment of bachelor's degree enjoy the highest average annual earnings of $89,000, while those with college or associate's degree education earn the least with $71,484. Women with an educational attainment of graduate degree earn the most with the average annual earnings of $81,250, while those with college or associate's degree education have the smallest earnings of $69,063.
| Educational Attainment | Male Income | Female Income |
| Less than High School | - | - |
| High School Diploma | - | - |
| College or Associate's Degree | $71,484 | $69,063 |
| Bachelor's Degree | $89,000 | $0 |
| Graduate Degree | - | - |
| Total | $72,241 | $69,524 |
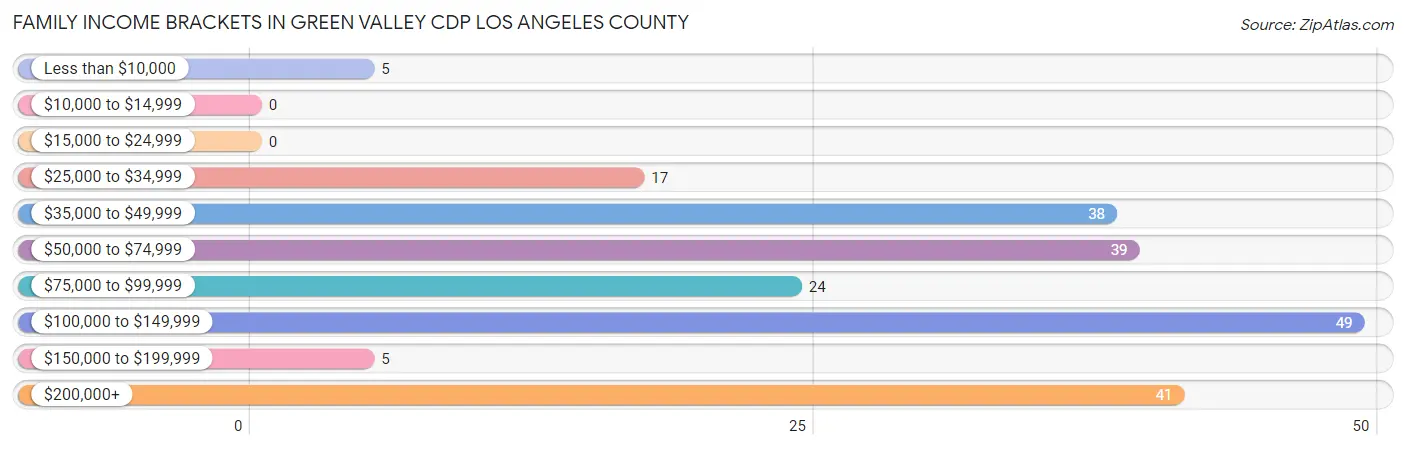
Family Income in Green Valley CDP Los Angeles County
Family Income Brackets in Green Valley CDP Los Angeles County
According to the Green Valley CDP Los Angeles County family income data, there are 49 families falling into the $100,000 to $149,999 income range, which is the most common income bracket and makes up 22.5% of all families.
| Income Bracket | # Families | % Families |
| Less than $10,000 | 5 | 2.3% |
| $10,000 to $14,999 | 0 | 0.0% |
| $15,000 to $24,999 | 0 | 0.0% |
| $25,000 to $34,999 | 17 | 7.8% |
| $35,000 to $49,999 | 38 | 17.4% |
| $50,000 to $74,999 | 39 | 17.9% |
| $75,000 to $99,999 | 24 | 11.0% |
| $100,000 to $149,999 | 49 | 22.5% |
| $150,000 to $199,999 | 5 | 2.3% |
| $200,000+ | 41 | 18.8% |
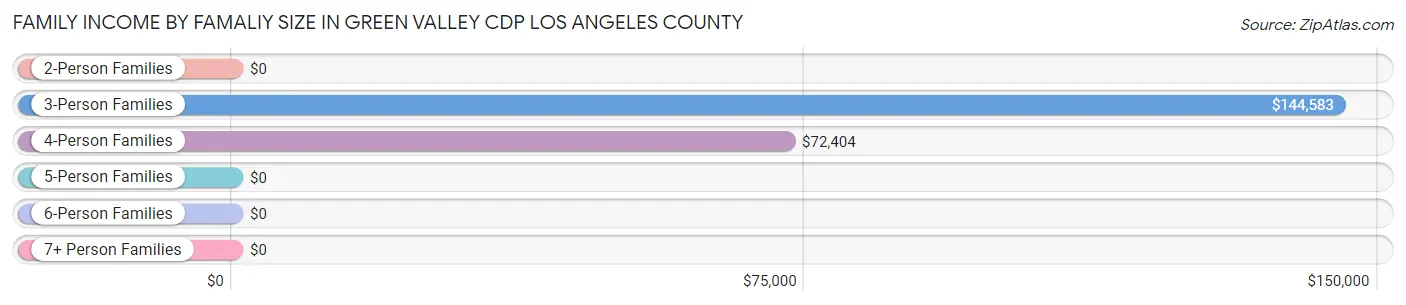
Family Income by Famaliy Size in Green Valley CDP Los Angeles County
3-person families (45 | 20.6%) account for the highest median family income in Green Valley CDP Los Angeles County with $144,583 per family, while 3-person families (45 | 20.6%) have the highest median income of $48,194 per family member.
| Income Bracket | # Families | Median Income |
| 2-Person Families | 133 (61.0%) | $0 |
| 3-Person Families | 45 (20.6%) | $144,583 |
| 4-Person Families | 37 (17.0%) | $72,404 |
| 5-Person Families | 0 (0.0%) | $0 |
| 6-Person Families | 3 (1.4%) | $0 |
| 7+ Person Families | 0 (0.0%) | $0 |
| Total | 218 (100.0%) | $88,000 |
Family Income by Number of Earners in Green Valley CDP Los Angeles County
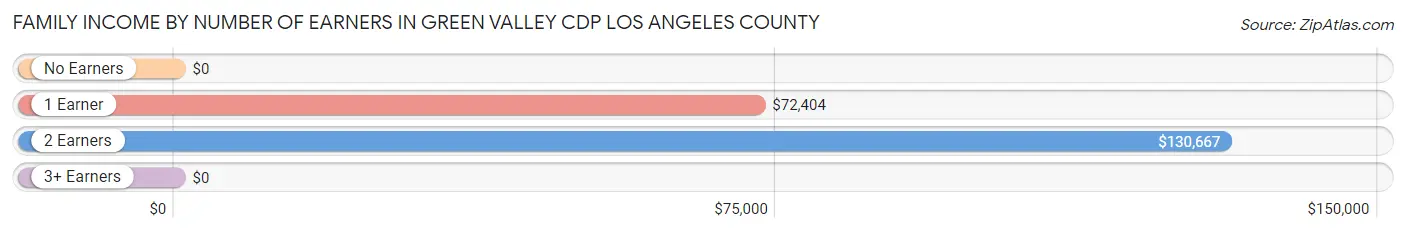
| Number of Earners | # Families | Median Income |
| No Earners | 56 (25.7%) | $0 |
| 1 Earner | 111 (50.9%) | $72,404 |
| 2 Earners | 42 (19.3%) | $130,667 |
| 3+ Earners | 9 (4.1%) | $0 |
| Total | 218 (100.0%) | $88,000 |
Household Income in Green Valley CDP Los Angeles County
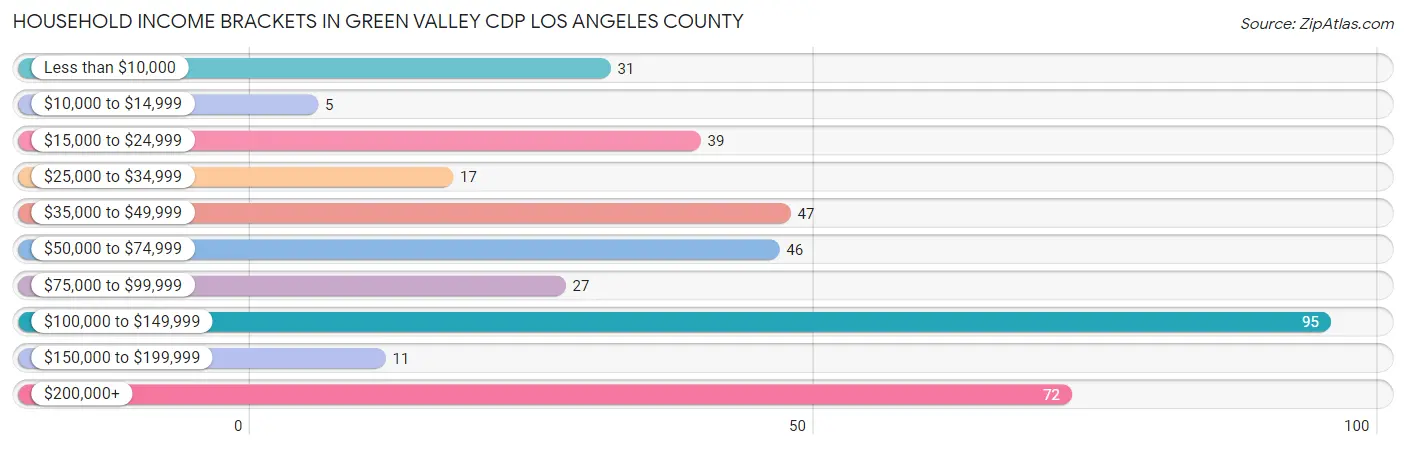
Household Income Brackets in Green Valley CDP Los Angeles County
With 95 households falling in the category, the $100,000 to $149,999 income range is the most frequent in Green Valley CDP Los Angeles County, accounting for 24.4% of all households. In contrast, only 5 households (1.3%) fall into the $10,000 to $14,999 income bracket, making it the least populous group.
| Income Bracket | # Households | % Households |
| Less than $10,000 | 31 | 7.9% |
| $10,000 to $14,999 | 5 | 1.3% |
| $15,000 to $24,999 | 39 | 10.0% |
| $25,000 to $34,999 | 17 | 4.4% |
| $35,000 to $49,999 | 47 | 12.1% |
| $50,000 to $74,999 | 46 | 11.8% |
| $75,000 to $99,999 | 27 | 6.9% |
| $100,000 to $149,999 | 95 | 24.4% |
| $150,000 to $199,999 | 11 | 2.8% |
| $200,000+ | 72 | 18.5% |
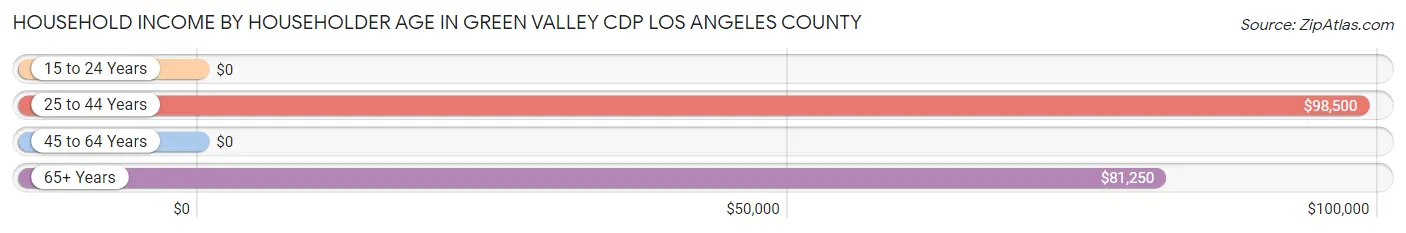
Household Income by Householder Age in Green Valley CDP Los Angeles County
The median household income in Green Valley CDP Los Angeles County is $82,083, with the highest median household income of $98,500 found in the 25 to 44 years age bracket for the primary householder. A total of 128 households (32.8%) fall into this category.
| Income Bracket | # Households | Median Income |
| 15 to 24 Years | 0 (0.0%) | $0 |
| 25 to 44 Years | 128 (32.8%) | $98,500 |
| 45 to 64 Years | 178 (45.6%) | $0 |
| 65+ Years | 84 (21.5%) | $81,250 |
| Total | 390 (100.0%) | $82,083 |
Poverty in Green Valley CDP Los Angeles County
Income Below Poverty by Sex and Age in Green Valley CDP Los Angeles County
With 16.8% poverty level for males and 11.6% for females among the residents of Green Valley CDP Los Angeles County, 6 to 11 year old males and 45 to 54 year old females are the most vulnerable to poverty, with 12 males (100.0%) and 17 females (36.2%) in their respective age groups living below the poverty level.
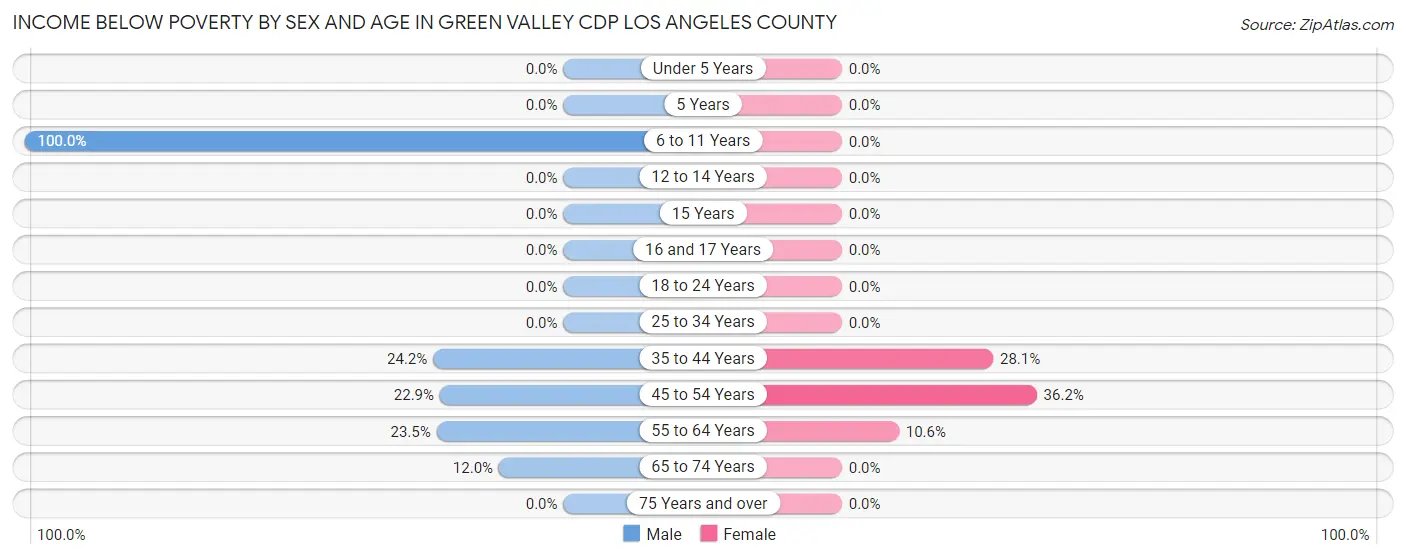
| Age Bracket | Male | Female |
| Under 5 Years | 0 (0.0%) | 0 (0.0%) |
| 5 Years | 0 (0.0%) | 0 (0.0%) |
| 6 to 11 Years | 12 (100.0%) | 0 (0.0%) |
| 12 to 14 Years | 0 (0.0%) | 0 (0.0%) |
| 15 Years | 0 (0.0%) | 0 (0.0%) |
| 16 and 17 Years | 0 (0.0%) | 0 (0.0%) |
| 18 to 24 Years | 0 (0.0%) | 0 (0.0%) |
| 25 to 34 Years | 0 (0.0%) | 0 (0.0%) |
| 35 to 44 Years | 22 (24.2%) | 16 (28.1%) |
| 45 to 54 Years | 11 (22.9%) | 17 (36.2%) |
| 55 to 64 Years | 20 (23.5%) | 11 (10.6%) |
| 65 to 74 Years | 11 (12.0%) | 0 (0.0%) |
| 75 Years and over | 0 (0.0%) | 0 (0.0%) |
| Total | 76 (16.8%) | 44 (11.6%) |
Income Above Poverty by Sex and Age in Green Valley CDP Los Angeles County
According to the poverty statistics in Green Valley CDP Los Angeles County, males aged under 5 years and females aged under 5 years are the age groups that are most secure financially, with 100.0% of males and 100.0% of females in these age groups living above the poverty line.
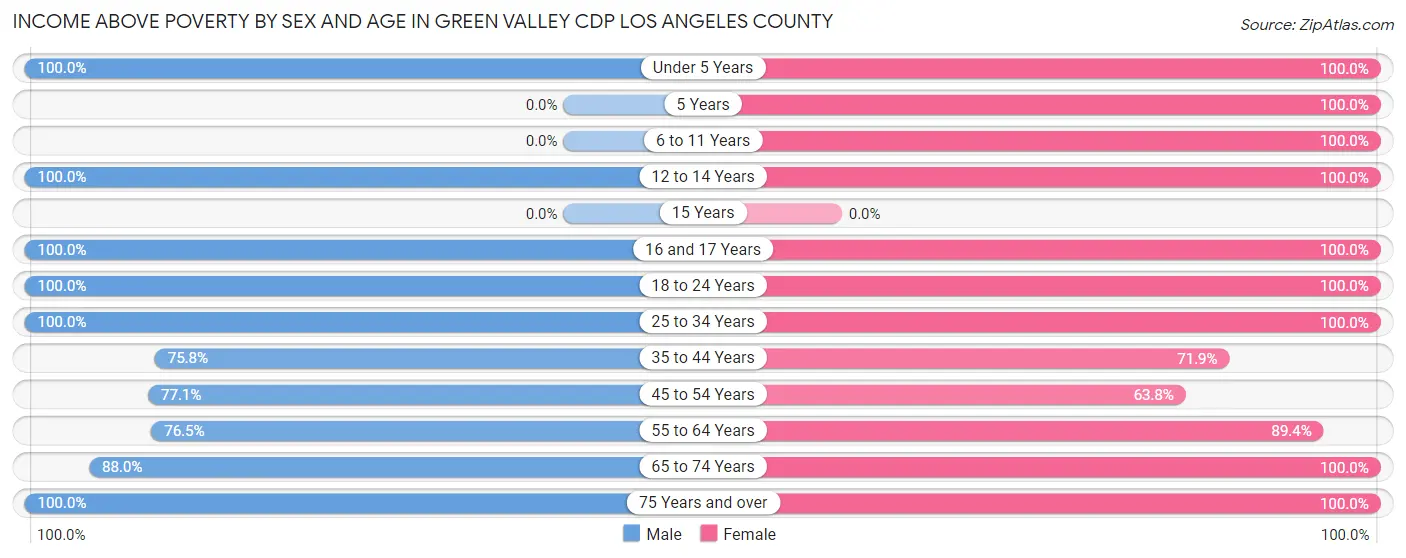
| Age Bracket | Male | Female |
| Under 5 Years | 5 (100.0%) | 5 (100.0%) |
| 5 Years | 0 (0.0%) | 16 (100.0%) |
| 6 to 11 Years | 0 (0.0%) | 50 (100.0%) |
| 12 to 14 Years | 8 (100.0%) | 13 (100.0%) |
| 15 Years | 0 (0.0%) | 0 (0.0%) |
| 16 and 17 Years | 22 (100.0%) | 5 (100.0%) |
| 18 to 24 Years | 10 (100.0%) | 19 (100.0%) |
| 25 to 34 Years | 48 (100.0%) | 30 (100.0%) |
| 35 to 44 Years | 69 (75.8%) | 41 (71.9%) |
| 45 to 54 Years | 37 (77.1%) | 30 (63.8%) |
| 55 to 64 Years | 65 (76.5%) | 93 (89.4%) |
| 65 to 74 Years | 81 (88.0%) | 28 (100.0%) |
| 75 Years and over | 32 (100.0%) | 5 (100.0%) |
| Total | 377 (83.2%) | 335 (88.4%) |
Income Below Poverty Among Married-Couple Families in Green Valley CDP Los Angeles County
The poverty statistics for married-couple families in Green Valley CDP Los Angeles County show that 6.4% or 11 of the total 171 families live below the poverty line. Families with 1 or 2 children have the highest poverty rate of 14.6%, comprising of 6 families. On the other hand, families with no children have the lowest poverty rate of 3.8%, which includes 5 families.
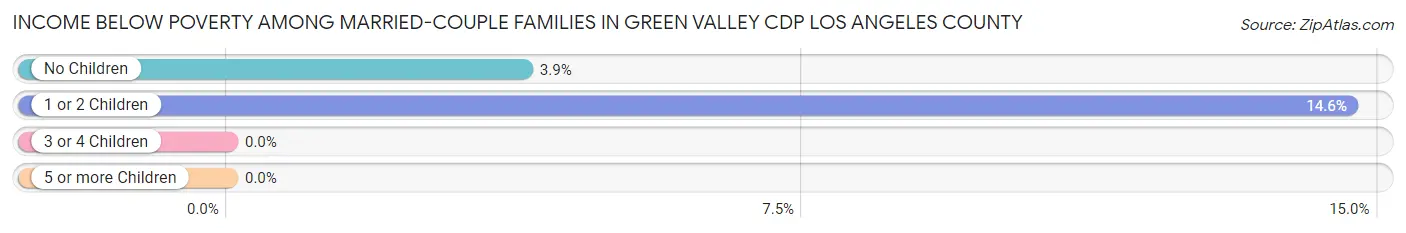
| Children | Above Poverty | Below Poverty |
| No Children | 125 (96.2%) | 5 (3.8%) |
| 1 or 2 Children | 35 (85.4%) | 6 (14.6%) |
| 3 or 4 Children | 0 (0.0%) | 0 (0.0%) |
| 5 or more Children | 0 (0.0%) | 0 (0.0%) |
| Total | 160 (93.6%) | 11 (6.4%) |
Income Below Poverty Among Single-Parent Households in Green Valley CDP Los Angeles County
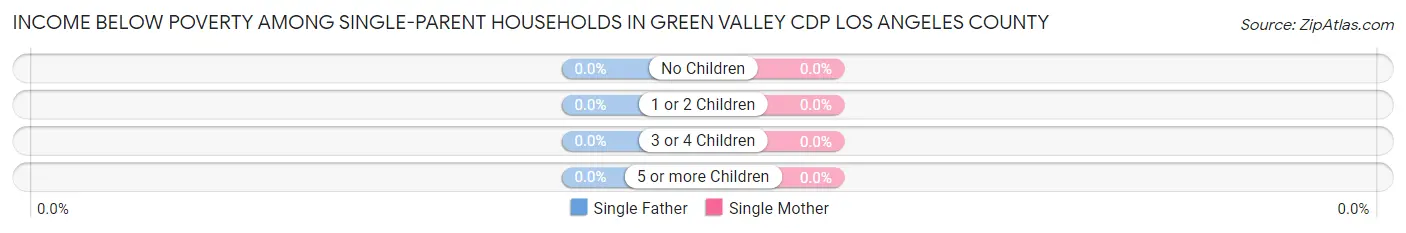
| Children | Single Father | Single Mother |
| No Children | 0 (0.0%) | 0 (0.0%) |
| 1 or 2 Children | 0 (0.0%) | 0 (0.0%) |
| 3 or 4 Children | 0 (0.0%) | 0 (0.0%) |
| 5 or more Children | 0 (0.0%) | 0 (0.0%) |
| Total | 0 (0.0%) | 0 (0.0%) |
Income Below Poverty Among Married-Couple vs Single-Parent Households in Green Valley CDP Los Angeles County
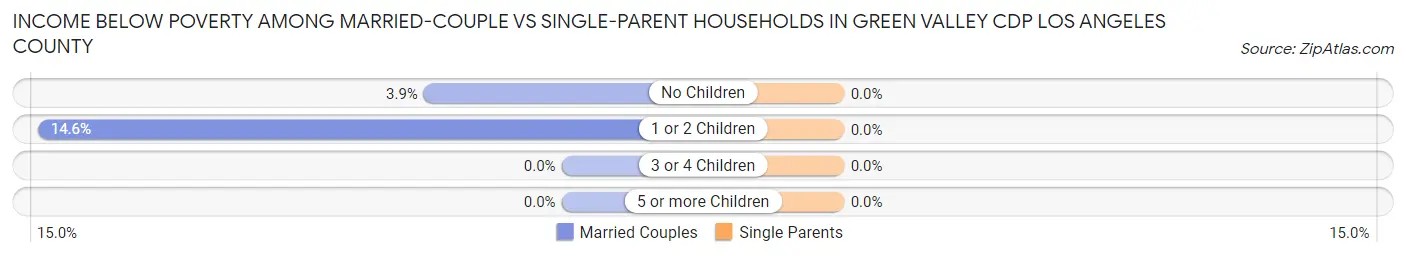
| Children | Married-Couple Families | Single-Parent Households |
| No Children | 5 (3.8%) | 0 (0.0%) |
| 1 or 2 Children | 6 (14.6%) | 0 (0.0%) |
| 3 or 4 Children | 0 (0.0%) | 0 (0.0%) |
| 5 or more Children | 0 (0.0%) | 0 (0.0%) |
| Total | 11 (6.4%) | 0 (0.0%) |
Race in Green Valley CDP Los Angeles County
The most populous races in Green Valley CDP Los Angeles County are White / Caucasian (798 | 95.9%), Hispanic or Latino (79 | 9.5%), and Two or more Races (16 | 1.9%).
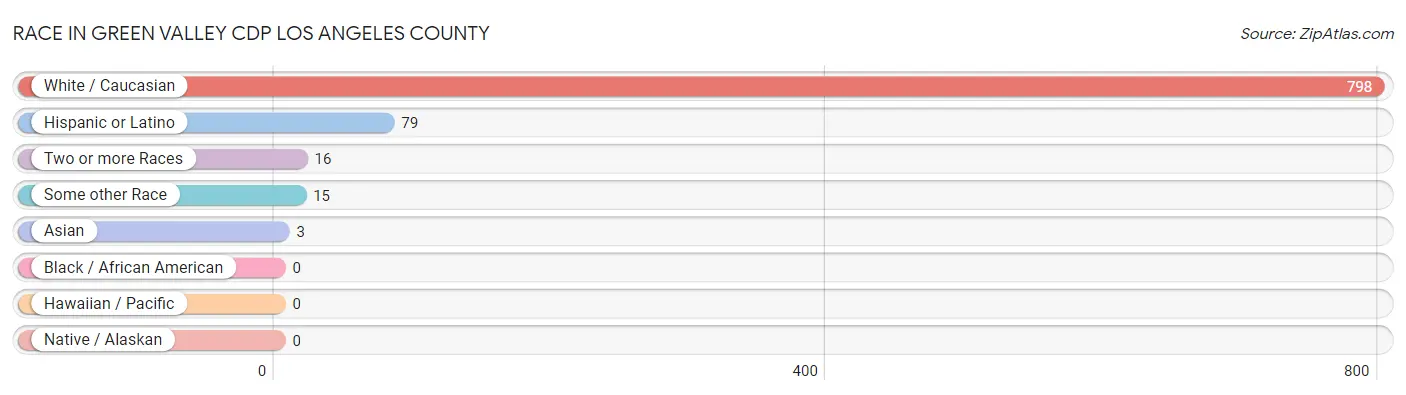
| Race | # Population | % Population |
| Asian | 3 | 0.4% |
| Black / African American | 0 | 0.0% |
| Hawaiian / Pacific | 0 | 0.0% |
| Hispanic or Latino | 79 | 9.5% |
| Native / Alaskan | 0 | 0.0% |
| White / Caucasian | 798 | 95.9% |
| Two or more Races | 16 | 1.9% |
| Some other Race | 15 | 1.8% |
| Total | 832 | 100.0% |
Ancestry in Green Valley CDP Los Angeles County
The most populous ancestries reported in Green Valley CDP Los Angeles County are English (166 | 20.0%), Irish (165 | 19.8%), German (132 | 15.9%), Mexican (68 | 8.2%), and French (65 | 7.8%), together accounting for 71.6% of all Green Valley CDP Los Angeles County residents.
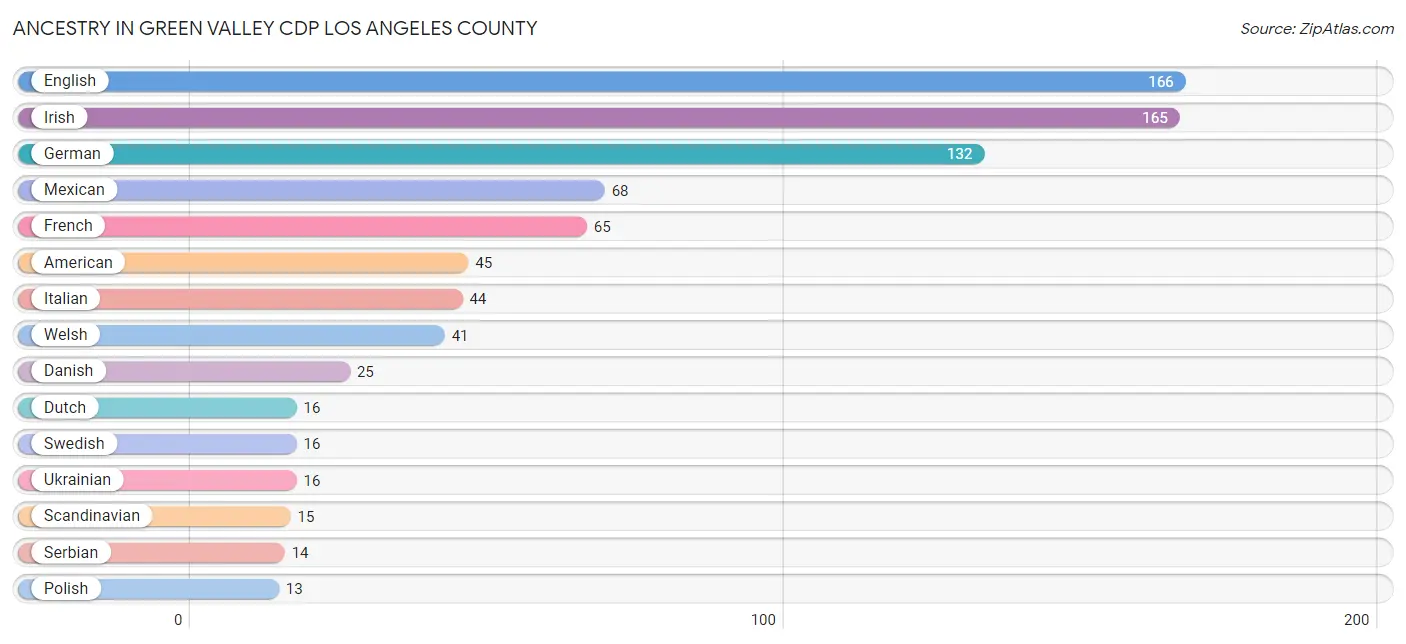
| Ancestry | # Population | % Population |
| American | 45 | 5.4% |
| Austrian | 5 | 0.6% |
| Blackfeet | 10 | 1.2% |
| British | 5 | 0.6% |
| Central American | 11 | 1.3% |
| Danish | 25 | 3.0% |
| Dutch | 16 | 1.9% |
| English | 166 | 20.0% |
| French | 65 | 7.8% |
| German | 132 | 15.9% |
| Guatemalan | 6 | 0.7% |
| Irish | 165 | 19.8% |
| Italian | 44 | 5.3% |
| Mexican | 68 | 8.2% |
| Norwegian | 5 | 0.6% |
| Polish | 13 | 1.6% |
| Russian | 4 | 0.5% |
| Salvadoran | 5 | 0.6% |
| Scandinavian | 15 | 1.8% |
| Scotch-Irish | 5 | 0.6% |
| Scottish | 4 | 0.5% |
| Serbian | 14 | 1.7% |
| Swedish | 16 | 1.9% |
| Ukrainian | 16 | 1.9% |
| Welsh | 41 | 4.9% | View All 25 Rows |
Immigrants in Green Valley CDP Los Angeles County
The most numerous immigrant groups reported in Green Valley CDP Los Angeles County came from Europe (26 | 3.1%), Western Europe (16 | 1.9%), Central America (15 | 1.8%), Latin America (15 | 1.8%), and Mexico (15 | 1.8%), together accounting for 10.4% of all Green Valley CDP Los Angeles County residents.
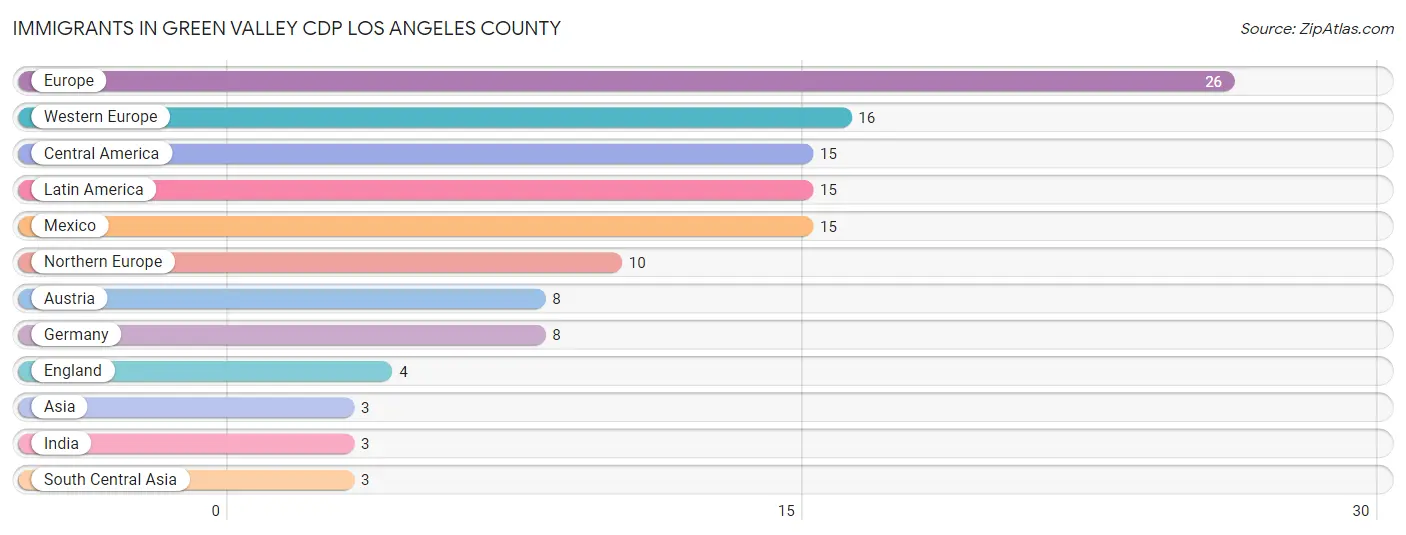
| Immigration Origin | # Population | % Population |
| Asia | 3 | 0.4% |
| Austria | 8 | 1.0% |
| Central America | 15 | 1.8% |
| England | 4 | 0.5% |
| Europe | 26 | 3.1% |
| Germany | 8 | 1.0% |
| India | 3 | 0.4% |
| Latin America | 15 | 1.8% |
| Mexico | 15 | 1.8% |
| Northern Europe | 10 | 1.2% |
| South Central Asia | 3 | 0.4% |
| Western Europe | 16 | 1.9% | View All 12 Rows |
Sex and Age in Green Valley CDP Los Angeles County
Sex and Age in Green Valley CDP Los Angeles County
The most populous age groups in Green Valley CDP Los Angeles County are 65 to 69 Years (86 | 19.0%) for men and 55 to 59 Years (74 | 19.5%) for women.
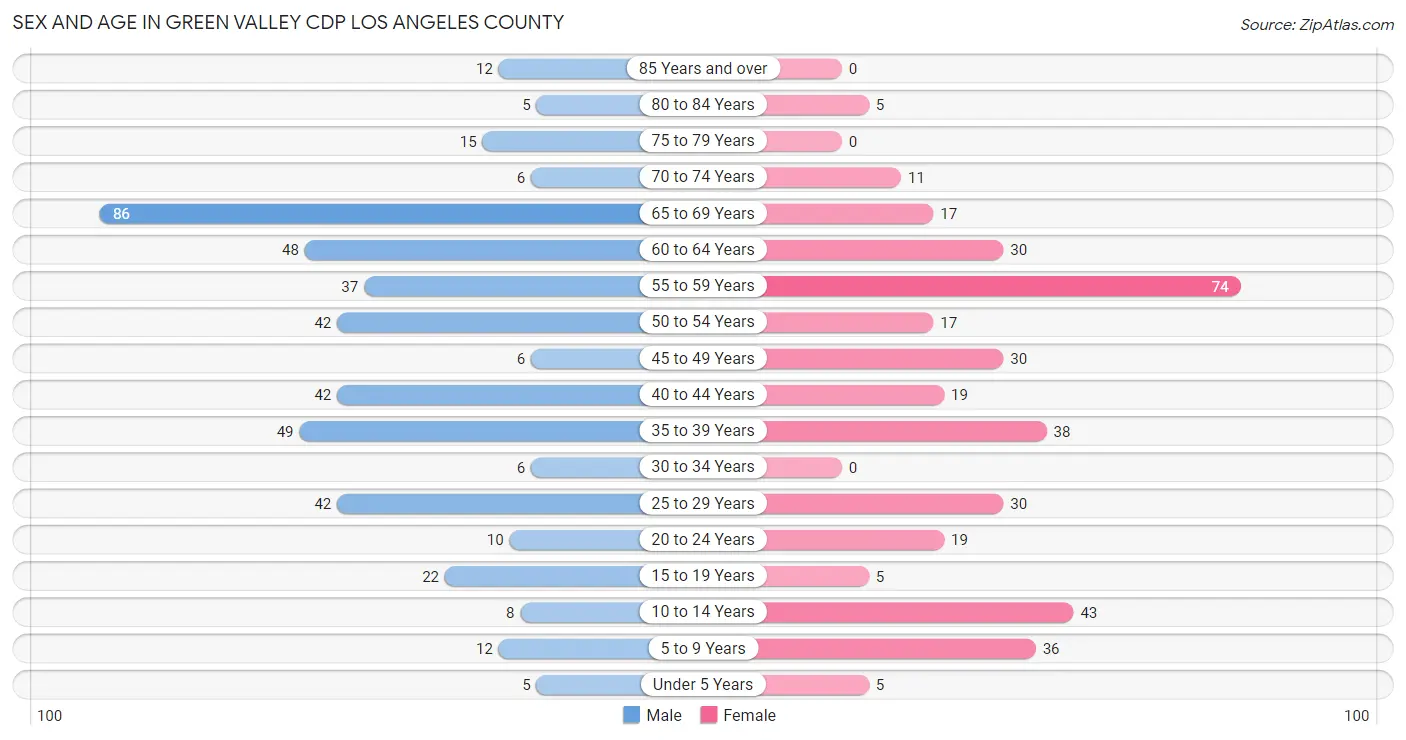
| Age Bracket | Male | Female |
| Under 5 Years | 5 (1.1%) | 5 (1.3%) |
| 5 to 9 Years | 12 (2.6%) | 36 (9.5%) |
| 10 to 14 Years | 8 (1.8%) | 43 (11.4%) |
| 15 to 19 Years | 22 (4.9%) | 5 (1.3%) |
| 20 to 24 Years | 10 (2.2%) | 19 (5.0%) |
| 25 to 29 Years | 42 (9.3%) | 30 (7.9%) |
| 30 to 34 Years | 6 (1.3%) | 0 (0.0%) |
| 35 to 39 Years | 49 (10.8%) | 38 (10.0%) |
| 40 to 44 Years | 42 (9.3%) | 19 (5.0%) |
| 45 to 49 Years | 6 (1.3%) | 30 (7.9%) |
| 50 to 54 Years | 42 (9.3%) | 17 (4.5%) |
| 55 to 59 Years | 37 (8.2%) | 74 (19.5%) |
| 60 to 64 Years | 48 (10.6%) | 30 (7.9%) |
| 65 to 69 Years | 86 (19.0%) | 17 (4.5%) |
| 70 to 74 Years | 6 (1.3%) | 11 (2.9%) |
| 75 to 79 Years | 15 (3.3%) | 0 (0.0%) |
| 80 to 84 Years | 5 (1.1%) | 5 (1.3%) |
| 85 Years and over | 12 (2.6%) | 0 (0.0%) |
| Total | 453 (100.0%) | 379 (100.0%) |
Families and Households in Green Valley CDP Los Angeles County
Median Family Size in Green Valley CDP Los Angeles County
The median family size in Green Valley CDP Los Angeles County is 2.63 persons per family, with single male/father families (5 | 2.3%) accounting for the largest median family size of 3 persons per family. On the other hand, single female/mother families (42 | 19.3%) represent the smallest median family size with 2.40 persons per family.
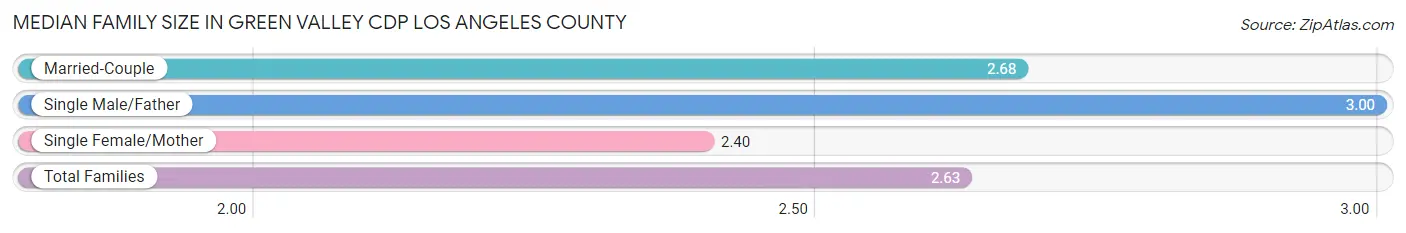
| Family Type | # Families | Family Size |
| Married-Couple | 171 (78.4%) | 2.68 |
| Single Male/Father | 5 (2.3%) | 3.00 |
| Single Female/Mother | 42 (19.3%) | 2.40 |
| Total Families | 218 (100.0%) | 2.63 |
Median Household Size in Green Valley CDP Los Angeles County
The median household size in Green Valley CDP Los Angeles County is 2.13 persons per household, with single female/mother households (42 | 10.8%) accounting for the largest median household size of 3.29 persons per household. non-family households (172 | 44.1%) represent the smallest median household size with 1.28 persons per household.
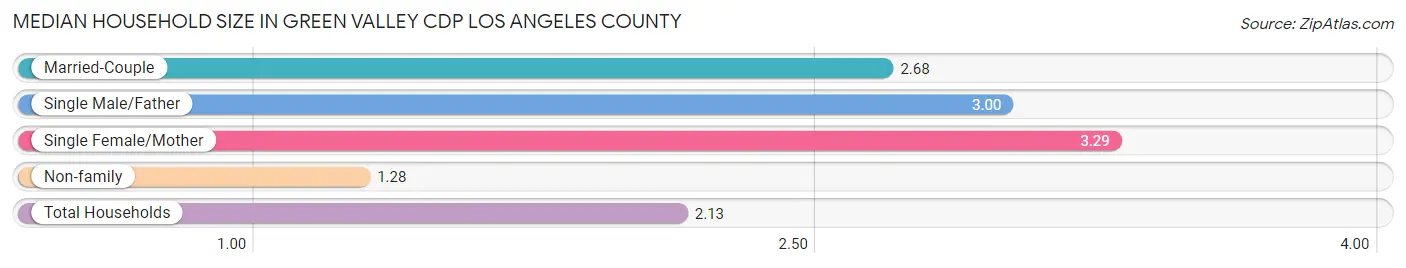
| Household Type | # Households | Household Size |
| Married-Couple | 171 (43.9%) | 2.68 |
| Single Male/Father | 5 (1.3%) | 3.00 |
| Single Female/Mother | 42 (10.8%) | 3.29 |
| Non-family | 172 (44.1%) | 1.28 |
| Total Households | 390 (100.0%) | 2.13 |
Household Size by Marriage Status in Green Valley CDP Los Angeles County
Out of a total of 390 households in Green Valley CDP Los Angeles County, 218 (55.9%) are family households, while 172 (44.1%) are nonfamily households. The most numerous type of family households are 2-person households, comprising 111, and the most common type of nonfamily households are 1-person households, comprising 131.
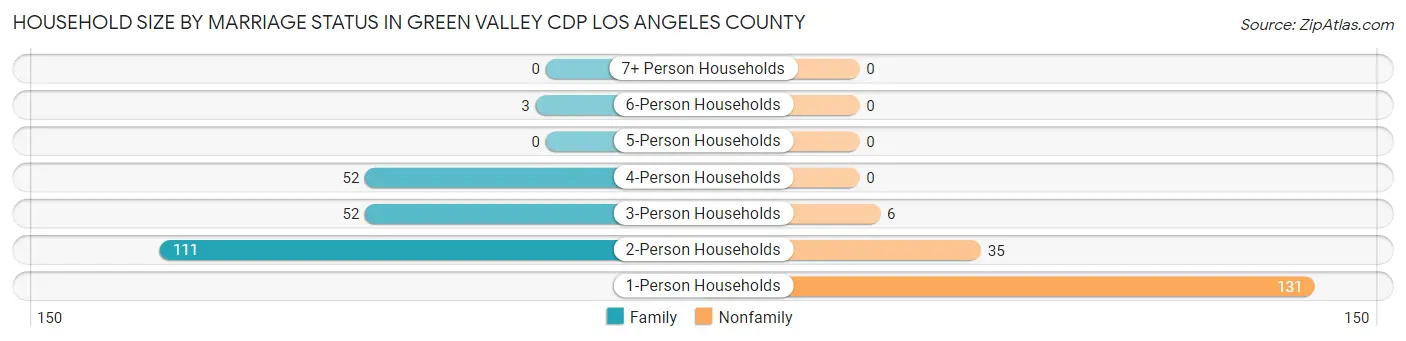
| Household Size | Family Households | Nonfamily Households |
| 1-Person Households | - | 131 (33.6%) |
| 2-Person Households | 111 (28.5%) | 35 (9.0%) |
| 3-Person Households | 52 (13.3%) | 6 (1.5%) |
| 4-Person Households | 52 (13.3%) | 0 (0.0%) |
| 5-Person Households | 0 (0.0%) | 0 (0.0%) |
| 6-Person Households | 3 (0.8%) | 0 (0.0%) |
| 7+ Person Households | 0 (0.0%) | 0 (0.0%) |
| Total | 218 (55.9%) | 172 (44.1%) |
Female Fertility in Green Valley CDP Los Angeles County
Fertility by Age in Green Valley CDP Los Angeles County
| Age Bracket | Women with Births | Births / 1,000 Women |
| 15 to 19 years | 0 (0.0%) | 0.0 |
| 20 to 34 years | 0 (0.0%) | 0.0 |
| 35 to 50 years | 0 (0.0%) | 0.0 |
| Total | 0 (0.0%) | 0.0 |
Fertility by Age by Marriage Status in Green Valley CDP Los Angeles County
| Age Bracket | Married | Unmarried |
| 15 to 19 years | 0 (0.0%) | 0 (0.0%) |
| 20 to 34 years | 0 (0.0%) | 0 (0.0%) |
| 35 to 50 years | 0 (0.0%) | 0 (0.0%) |
| Total | 0 (0.0%) | 0 (0.0%) |
Fertility by Education in Green Valley CDP Los Angeles County
| Educational Attainment | Women with Births | Births / 1,000 Women |
| Less than High School | 0 (0.0%) | 0.0 |
| High School Diploma | 0 (0.0%) | 0.0 |
| College or Associate's Degree | 0 (0.0%) | 0.0 |
| Bachelor's Degree | 0 (0.0%) | 0.0 |
| Graduate Degree | 0 (0.0%) | 0.0 |
| Total | 0 (0.0%) | 0.0 |
Fertility by Education by Marriage Status in Green Valley CDP Los Angeles County
| Educational Attainment | Married | Unmarried |
| Less than High School | 0 (0.0%) | 0 (0.0%) |
| High School Diploma | 0 (0.0%) | 0 (0.0%) |
| College or Associate's Degree | 0 (0.0%) | 0 (0.0%) |
| Bachelor's Degree | 0 (0.0%) | 0 (0.0%) |
| Graduate Degree | 0 (0.0%) | 0 (0.0%) |
| Total | 0 (0.0%) | 0 (0.0%) |
Employment Characteristics in Green Valley CDP Los Angeles County
Employment by Class of Employer in Green Valley CDP Los Angeles County
Among the 332 employed individuals in Green Valley CDP Los Angeles County, private company employees (221 | 66.6%), local government employees (58 | 17.5%), and not-for-profit organizations (20 | 6.0%) make up the most common classes of employment.
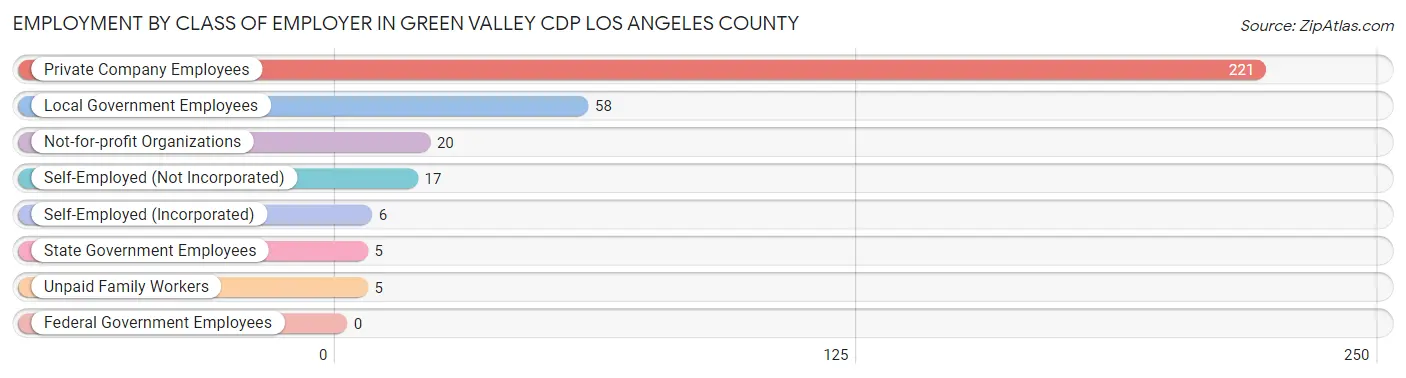
| Employer Class | # Employees | % Employees |
| Private Company Employees | 221 | 66.6% |
| Self-Employed (Incorporated) | 6 | 1.8% |
| Self-Employed (Not Incorporated) | 17 | 5.1% |
| Not-for-profit Organizations | 20 | 6.0% |
| Local Government Employees | 58 | 17.5% |
| State Government Employees | 5 | 1.5% |
| Federal Government Employees | 0 | 0.0% |
| Unpaid Family Workers | 5 | 1.5% |
| Total | 332 | 100.0% |
Employment Status by Age in Green Valley CDP Los Angeles County
According to the labor force statistics for Green Valley CDP Los Angeles County, out of the total population over 16 years of age (723), 55.3% or 400 individuals are in the labor force, with 14.3% or 57 of them unemployed. The age group with the highest labor force participation rate is 20 to 24 years, with 100.0% or 29 individuals in the labor force. Within the labor force, the 20 to 24 years age range has the highest percentage of unemployed individuals, with 37.9% or 11 of them being unemployed.
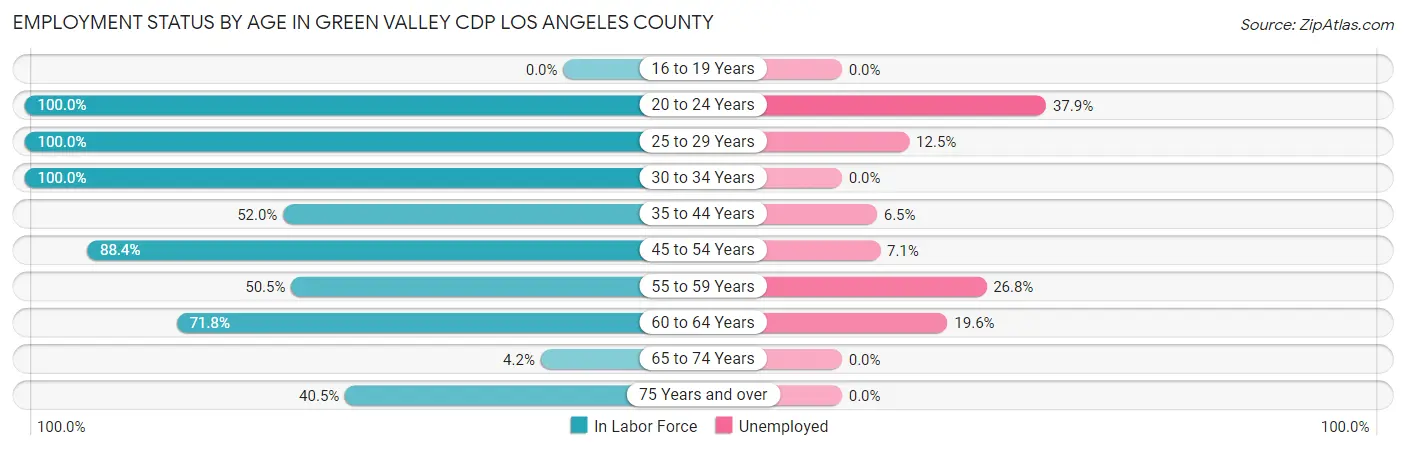
| Age Bracket | In Labor Force | Unemployed |
| 16 to 19 Years | 0 (0.0%) | 0 (0.0%) |
| 20 to 24 Years | 29 (100.0%) | 11 (37.9%) |
| 25 to 29 Years | 72 (100.0%) | 9 (12.5%) |
| 30 to 34 Years | 6 (100.0%) | 0 (0.0%) |
| 35 to 44 Years | 77 (52.0%) | 5 (6.5%) |
| 45 to 54 Years | 84 (88.4%) | 6 (7.1%) |
| 55 to 59 Years | 56 (50.5%) | 15 (26.8%) |
| 60 to 64 Years | 56 (71.8%) | 11 (19.6%) |
| 65 to 74 Years | 5 (4.2%) | 0 (0.0%) |
| 75 Years and over | 15 (40.5%) | 0 (0.0%) |
| Total | 400 (55.3%) | 57 (14.3%) |
Employment Status by Educational Attainment in Green Valley CDP Los Angeles County
According to labor force statistics for Green Valley CDP Los Angeles County, 68.8% of individuals (351) out of the total population between 25 and 64 years of age (510) are in the labor force, with 13.1% or 46 of them being unemployed. The group with the highest labor force participation rate are those with the educational attainment of bachelor's degree or higher, with 88.1% or 119 individuals in the labor force. Within the labor force, individuals with less than high school education have the highest percentage of unemployment, with 45.5% or 5 of them being unemployed.
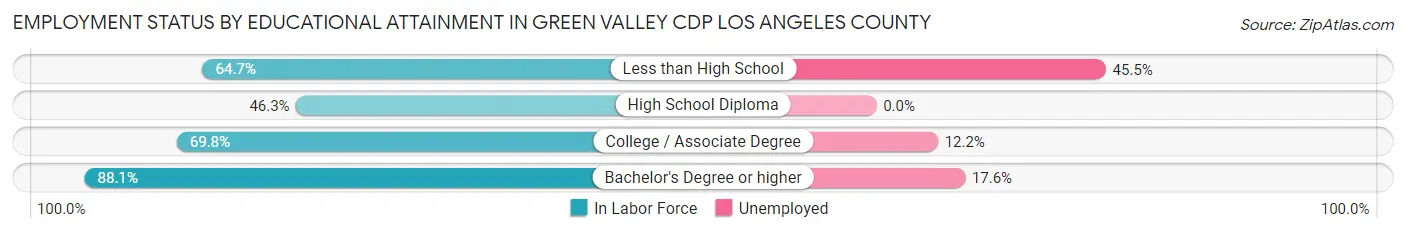
| Educational Attainment | In Labor Force | Unemployed |
| Less than High School | 11 (64.7%) | 8 (45.5%) |
| High School Diploma | 57 (46.3%) | 0 (0.0%) |
| College / Associate Degree | 164 (69.8%) | 29 (12.2%) |
| Bachelor's Degree or higher | 119 (88.1%) | 24 (17.6%) |
| Total | 351 (68.8%) | 67 (13.1%) |
Employment Occupations by Sex in Green Valley CDP Los Angeles County
Management, Business, Science and Arts Occupations
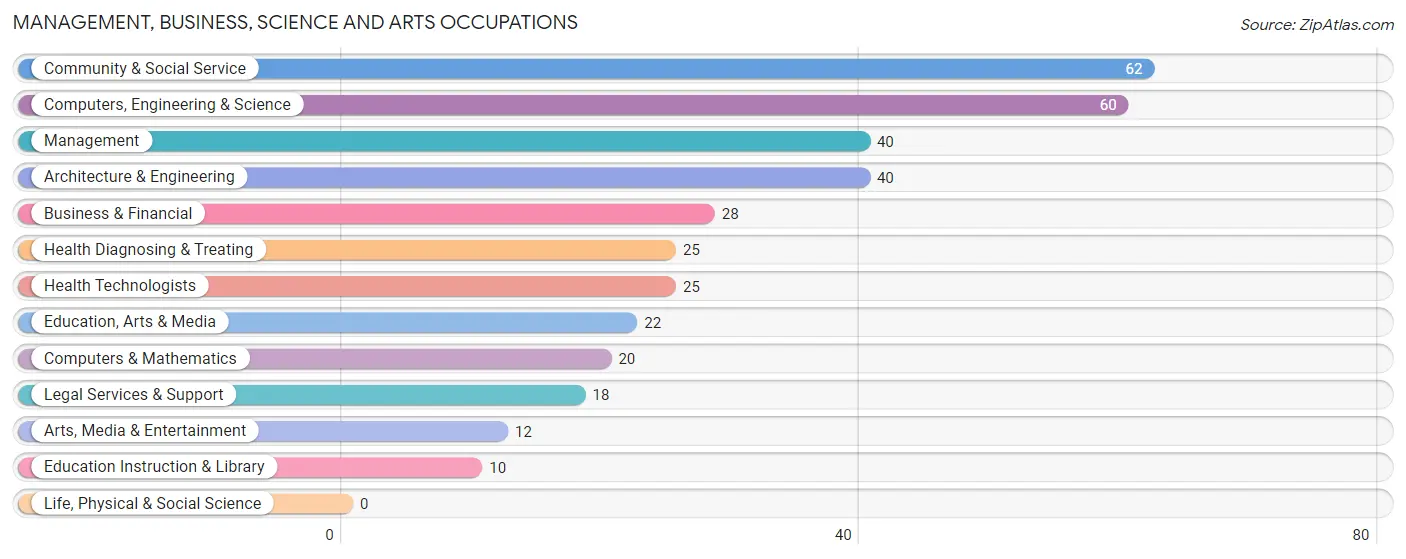
The most common Management, Business, Science and Arts occupations in Green Valley CDP Los Angeles County are Community & Social Service (62 | 18.1%), Computers, Engineering & Science (60 | 17.5%), Management (40 | 11.7%), Architecture & Engineering (40 | 11.7%), and Business & Financial (28 | 8.2%).
Management, Business, Science and Arts Occupations by Sex
Within the Management, Business, Science and Arts occupations in Green Valley CDP Los Angeles County, the most male-oriented occupations are Business & Financial (100.0%), Computers & Mathematics (100.0%), and Education, Arts & Media (100.0%), while the most female-oriented occupations are Health Diagnosing & Treating (100.0%), Health Technologists (100.0%), and Management (72.5%).
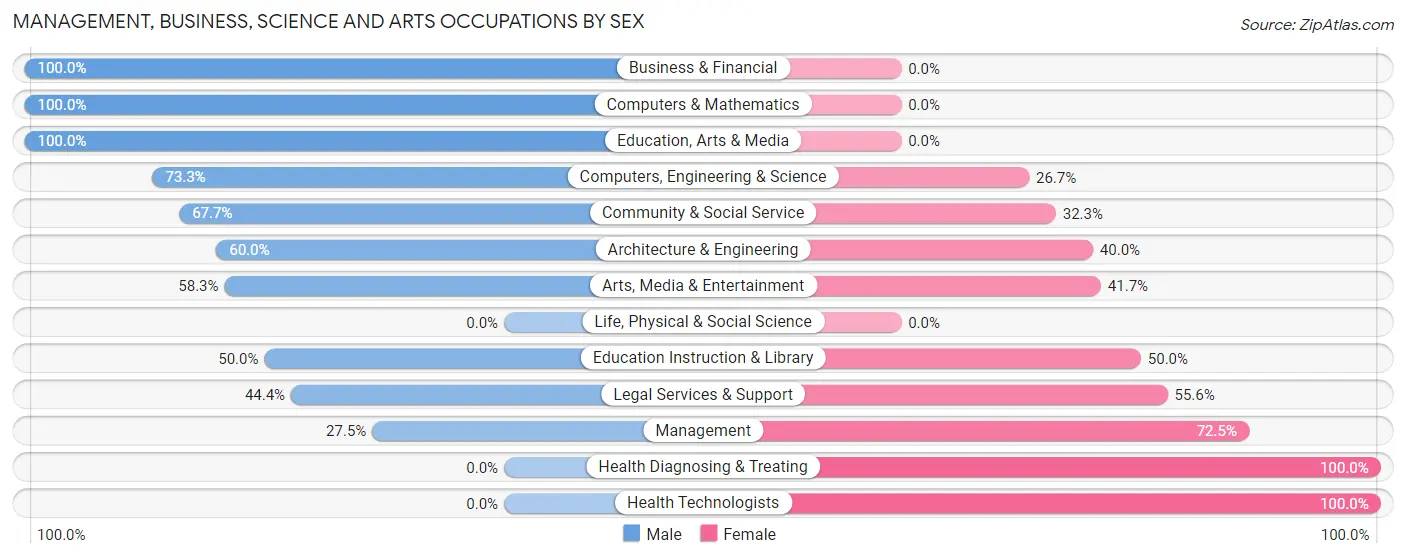
| Occupation | Male | Female |
| Management | 11 (27.5%) | 29 (72.5%) |
| Business & Financial | 28 (100.0%) | 0 (0.0%) |
| Computers, Engineering & Science | 44 (73.3%) | 16 (26.7%) |
| Computers & Mathematics | 20 (100.0%) | 0 (0.0%) |
| Architecture & Engineering | 24 (60.0%) | 16 (40.0%) |
| Life, Physical & Social Science | 0 (0.0%) | 0 (0.0%) |
| Community & Social Service | 42 (67.7%) | 20 (32.3%) |
| Education, Arts & Media | 22 (100.0%) | 0 (0.0%) |
| Legal Services & Support | 8 (44.4%) | 10 (55.6%) |
| Education Instruction & Library | 5 (50.0%) | 5 (50.0%) |
| Arts, Media & Entertainment | 7 (58.3%) | 5 (41.7%) |
| Health Diagnosing & Treating | 0 (0.0%) | 25 (100.0%) |
| Health Technologists | 0 (0.0%) | 25 (100.0%) |
| Total (Category) | 125 (58.1%) | 90 (41.9%) |
| Total (Overall) | 211 (61.5%) | 132 (38.5%) |
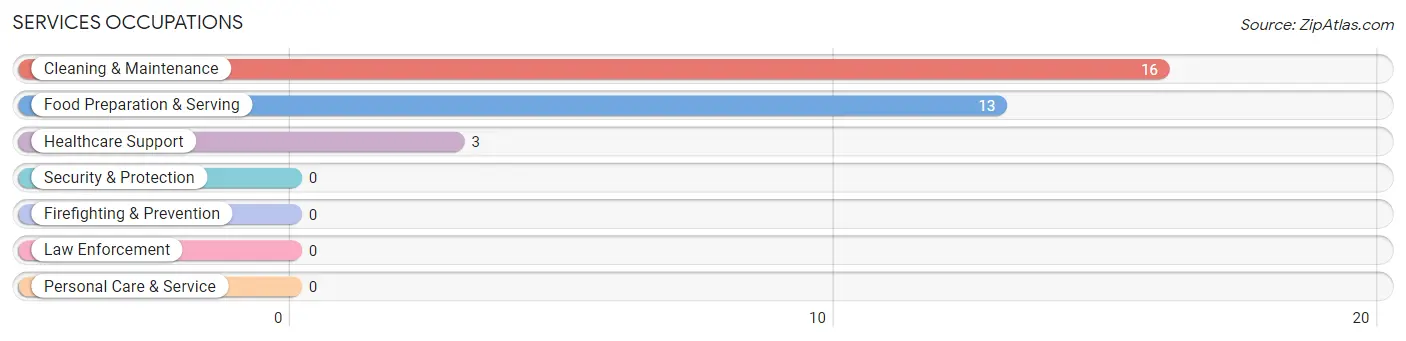
Services Occupations
The most common Services occupations in Green Valley CDP Los Angeles County are Cleaning & Maintenance (16 | 4.7%), Food Preparation & Serving (13 | 3.8%), and Healthcare Support (3 | 0.9%).
Services Occupations by Sex
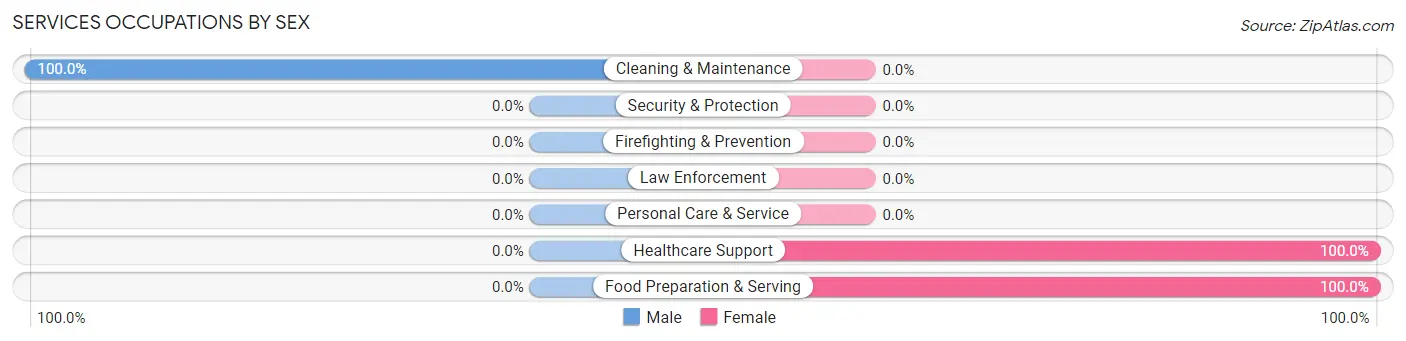
| Occupation | Male | Female |
| Healthcare Support | 0 (0.0%) | 3 (100.0%) |
| Security & Protection | 0 (0.0%) | 0 (0.0%) |
| Firefighting & Prevention | 0 (0.0%) | 0 (0.0%) |
| Law Enforcement | 0 (0.0%) | 0 (0.0%) |
| Food Preparation & Serving | 0 (0.0%) | 13 (100.0%) |
| Cleaning & Maintenance | 16 (100.0%) | 0 (0.0%) |
| Personal Care & Service | 0 (0.0%) | 0 (0.0%) |
| Total (Category) | 16 (50.0%) | 16 (50.0%) |
| Total (Overall) | 211 (61.5%) | 132 (38.5%) |
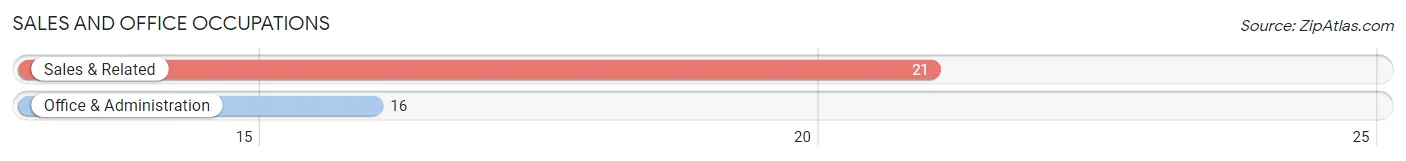
Sales and Office Occupations
The most common Sales and Office occupations in Green Valley CDP Los Angeles County are Sales & Related (21 | 6.1%), and Office & Administration (16 | 4.7%).
Sales and Office Occupations by Sex
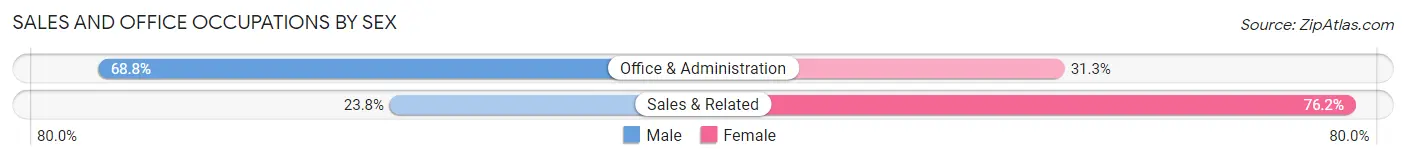
| Occupation | Male | Female |
| Sales & Related | 5 (23.8%) | 16 (76.2%) |
| Office & Administration | 11 (68.8%) | 5 (31.2%) |
| Total (Category) | 16 (43.2%) | 21 (56.8%) |
| Total (Overall) | 211 (61.5%) | 132 (38.5%) |
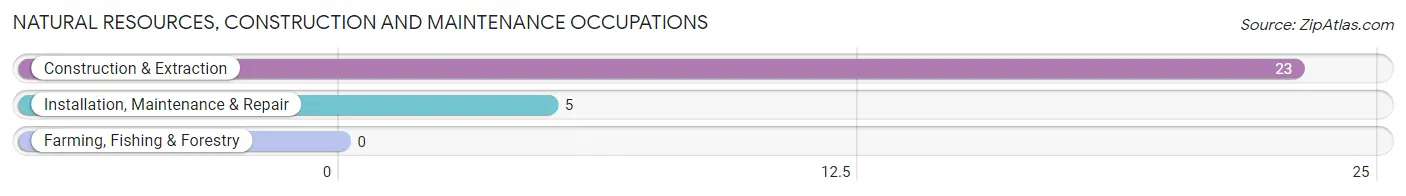
Natural Resources, Construction and Maintenance Occupations
The most common Natural Resources, Construction and Maintenance occupations in Green Valley CDP Los Angeles County are Construction & Extraction (23 | 6.7%), and Installation, Maintenance & Repair (5 | 1.5%).
Natural Resources, Construction and Maintenance Occupations by Sex
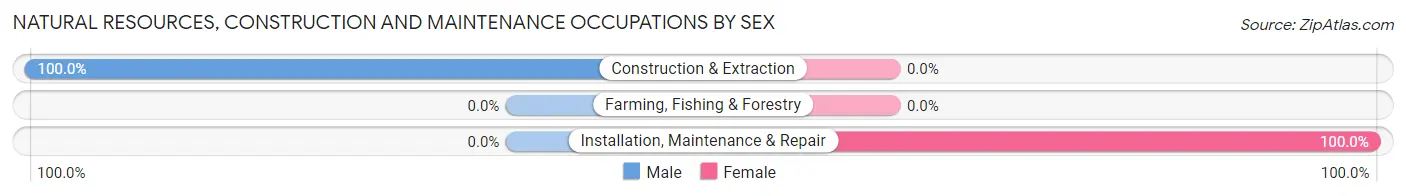
| Occupation | Male | Female |
| Farming, Fishing & Forestry | 0 (0.0%) | 0 (0.0%) |
| Construction & Extraction | 23 (100.0%) | 0 (0.0%) |
| Installation, Maintenance & Repair | 0 (0.0%) | 5 (100.0%) |
| Total (Category) | 23 (82.1%) | 5 (17.9%) |
| Total (Overall) | 211 (61.5%) | 132 (38.5%) |
Production, Transportation and Moving Occupations
The most common Production, Transportation and Moving occupations in Green Valley CDP Los Angeles County are Transportation (26 | 7.6%), and Production (5 | 1.5%).
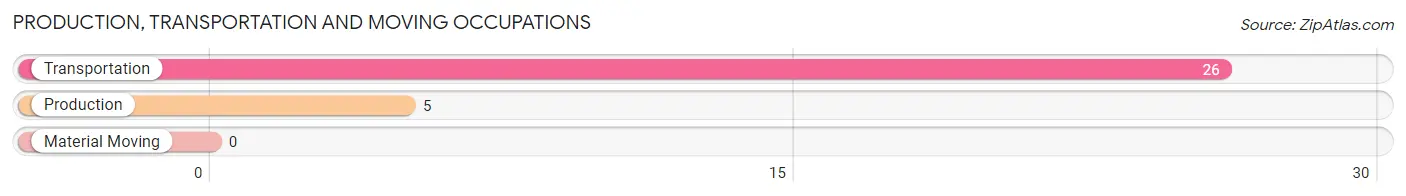
Production, Transportation and Moving Occupations by Sex
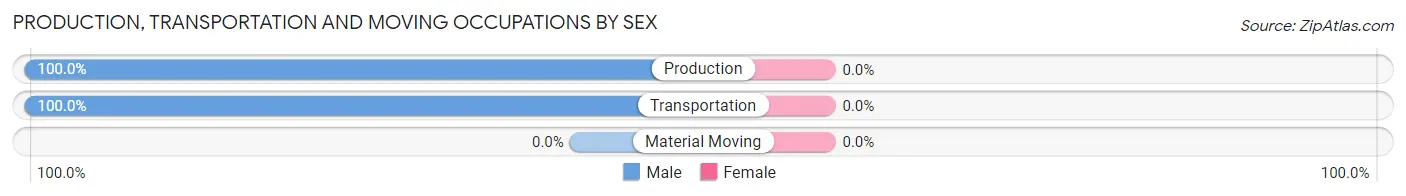
| Occupation | Male | Female |
| Production | 5 (100.0%) | 0 (0.0%) |
| Transportation | 26 (100.0%) | 0 (0.0%) |
| Material Moving | 0 (0.0%) | 0 (0.0%) |
| Total (Category) | 31 (100.0%) | 0 (0.0%) |
| Total (Overall) | 211 (61.5%) | 132 (38.5%) |
Employment Industries by Sex in Green Valley CDP Los Angeles County
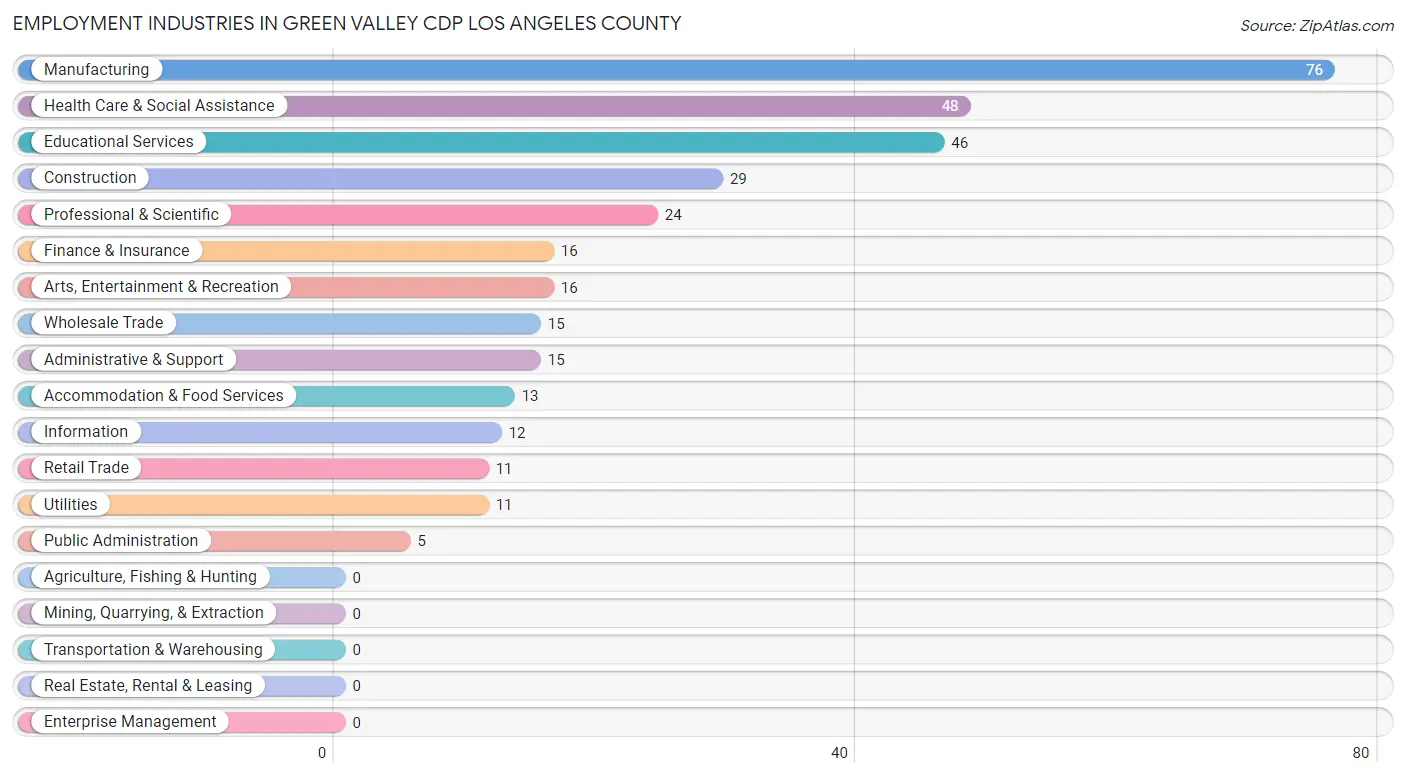
Employment Industries in Green Valley CDP Los Angeles County
The major employment industries in Green Valley CDP Los Angeles County include Manufacturing (76 | 22.2%), Health Care & Social Assistance (48 | 14.0%), Educational Services (46 | 13.4%), Construction (29 | 8.5%), and Professional & Scientific (24 | 7.0%).
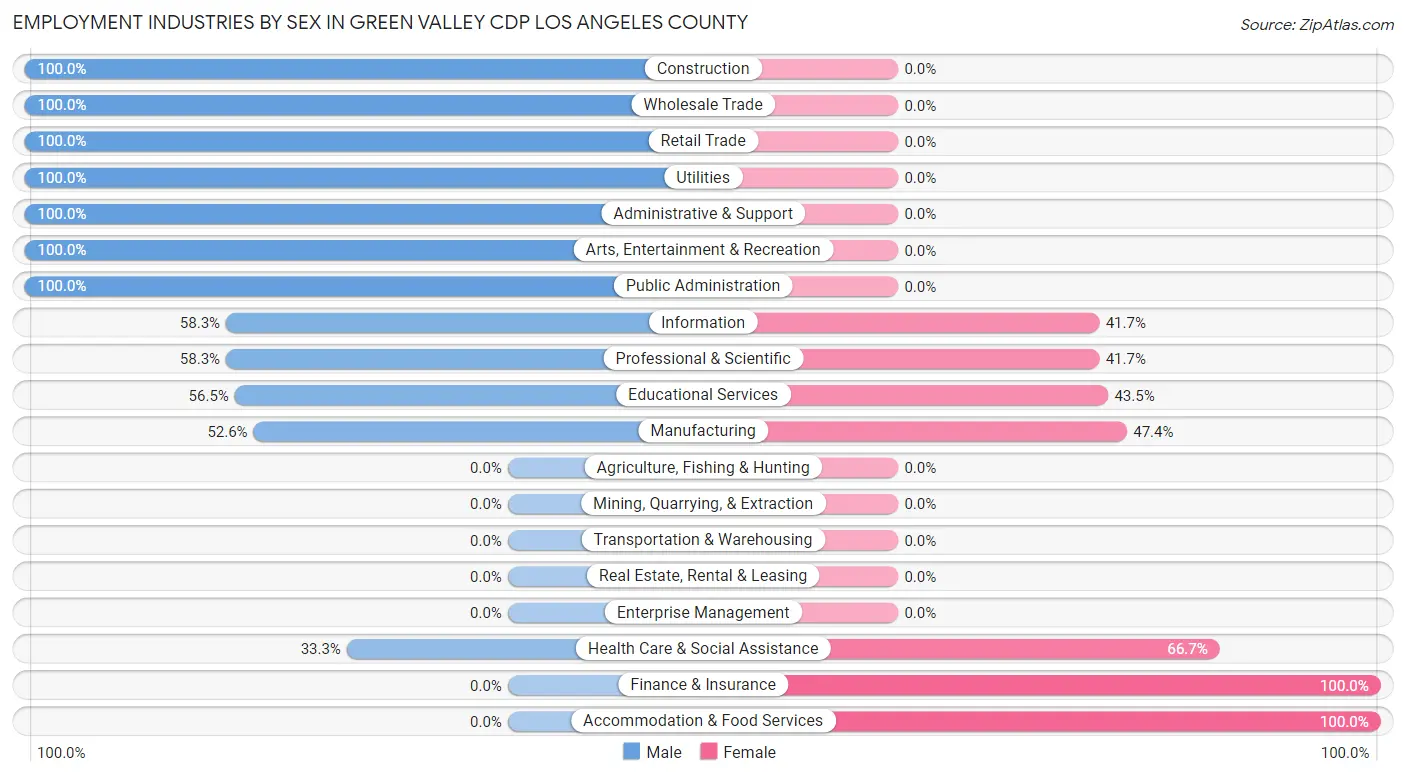
Employment Industries by Sex in Green Valley CDP Los Angeles County
The Green Valley CDP Los Angeles County industries that see more men than women are Construction (100.0%), Wholesale Trade (100.0%), and Retail Trade (100.0%), whereas the industries that tend to have a higher number of women are Finance & Insurance (100.0%), Accommodation & Food Services (100.0%), and Health Care & Social Assistance (66.7%).
| Industry | Male | Female |
| Agriculture, Fishing & Hunting | 0 (0.0%) | 0 (0.0%) |
| Mining, Quarrying, & Extraction | 0 (0.0%) | 0 (0.0%) |
| Construction | 29 (100.0%) | 0 (0.0%) |
| Manufacturing | 40 (52.6%) | 36 (47.4%) |
| Wholesale Trade | 15 (100.0%) | 0 (0.0%) |
| Retail Trade | 11 (100.0%) | 0 (0.0%) |
| Transportation & Warehousing | 0 (0.0%) | 0 (0.0%) |
| Utilities | 11 (100.0%) | 0 (0.0%) |
| Information | 7 (58.3%) | 5 (41.7%) |
| Finance & Insurance | 0 (0.0%) | 16 (100.0%) |
| Real Estate, Rental & Leasing | 0 (0.0%) | 0 (0.0%) |
| Professional & Scientific | 14 (58.3%) | 10 (41.7%) |
| Enterprise Management | 0 (0.0%) | 0 (0.0%) |
| Administrative & Support | 15 (100.0%) | 0 (0.0%) |
| Educational Services | 26 (56.5%) | 20 (43.5%) |
| Health Care & Social Assistance | 16 (33.3%) | 32 (66.7%) |
| Arts, Entertainment & Recreation | 16 (100.0%) | 0 (0.0%) |
| Accommodation & Food Services | 0 (0.0%) | 13 (100.0%) |
| Public Administration | 5 (100.0%) | 0 (0.0%) |
| Total | 211 (61.5%) | 132 (38.5%) |
Education in Green Valley CDP Los Angeles County
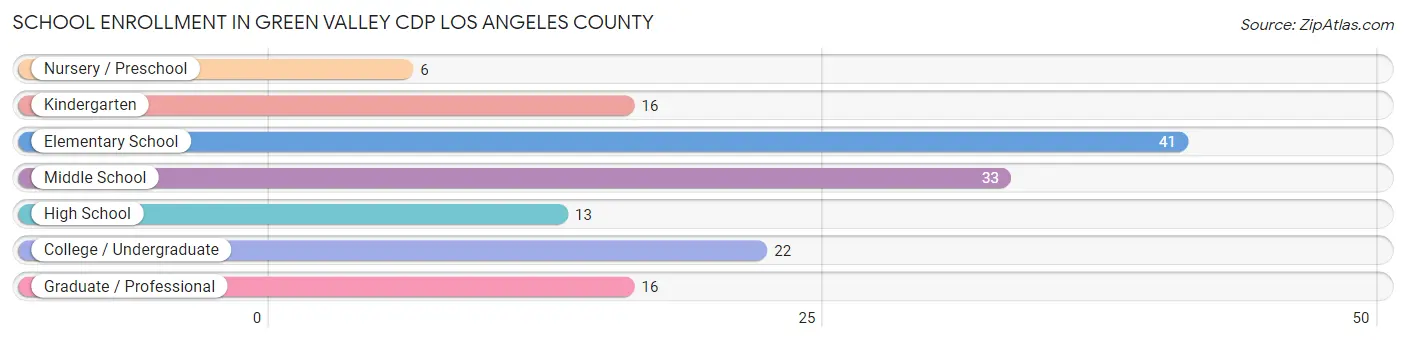
School Enrollment in Green Valley CDP Los Angeles County
The most common levels of schooling among the 147 students in Green Valley CDP Los Angeles County are elementary school (41 | 27.9%), middle school (33 | 22.5%), and college / undergraduate (22 | 15.0%).
| School Level | # Students | % Students |
| Nursery / Preschool | 6 | 4.1% |
| Kindergarten | 16 | 10.9% |
| Elementary School | 41 | 27.9% |
| Middle School | 33 | 22.5% |
| High School | 13 | 8.8% |
| College / Undergraduate | 22 | 15.0% |
| Graduate / Professional | 16 | 10.9% |
| Total | 147 | 100.0% |
School Enrollment by Age by Funding Source in Green Valley CDP Los Angeles County
Out of a total of 147 students who are enrolled in schools in Green Valley CDP Los Angeles County, 16 (10.9%) attend a private institution, while the remaining 131 (89.1%) are enrolled in public schools. The age group of 25 to 34 year olds has the highest likelihood of being enrolled in private schools, with 16 (100.0% in the age bracket) enrolled. Conversely, the age group of 5 to 9 year old has the lowest likelihood of being enrolled in a private school, with 48 (100.0% in the age bracket) attending a public institution.
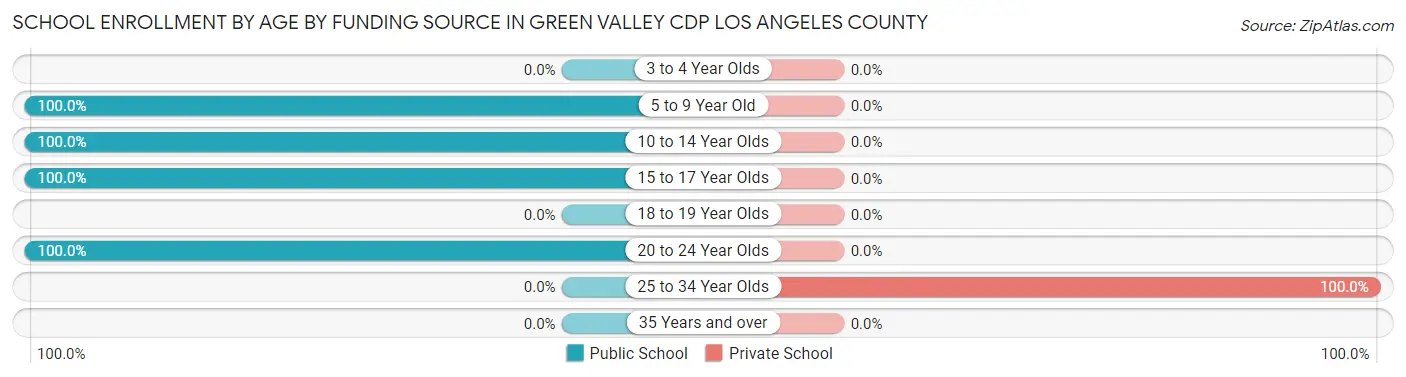
| Age Bracket | Public School | Private School |
| 3 to 4 Year Olds | 0 (0.0%) | 0 (0.0%) |
| 5 to 9 Year Old | 48 (100.0%) | 0 (0.0%) |
| 10 to 14 Year Olds | 51 (100.0%) | 0 (0.0%) |
| 15 to 17 Year Olds | 27 (100.0%) | 0 (0.0%) |
| 18 to 19 Year Olds | 0 (0.0%) | 0 (0.0%) |
| 20 to 24 Year Olds | 5 (100.0%) | 0 (0.0%) |
| 25 to 34 Year Olds | 0 (0.0%) | 16 (100.0%) |
| 35 Years and over | 0 (0.0%) | 0 (0.0%) |
| Total | 131 (89.1%) | 16 (10.9%) |
Educational Attainment by Field of Study in Green Valley CDP Los Angeles County
Education (24 | 12.9%), literature & languages (21 | 11.3%), psychology (20 | 10.7%), liberal arts & history (19 | 10.2%), and social sciences (16 | 8.6%) are the most common fields of study among 186 individuals in Green Valley CDP Los Angeles County who have obtained a bachelor's degree or higher.
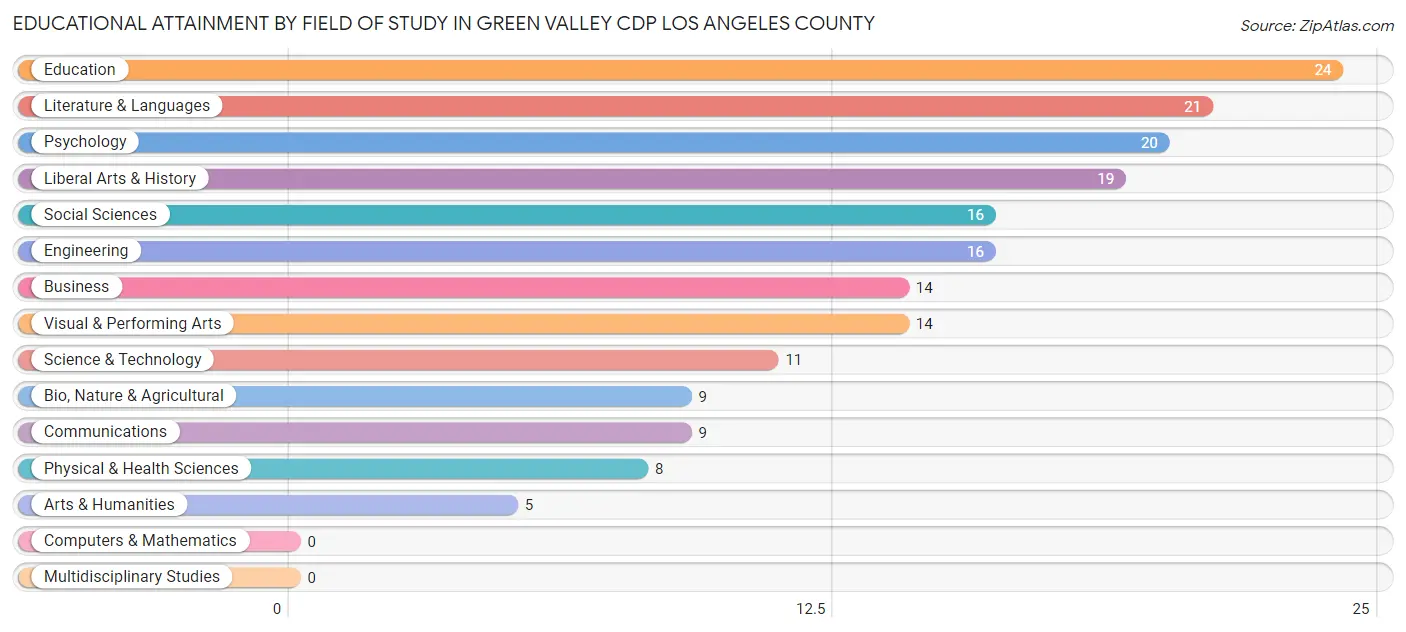
| Field of Study | # Graduates | % Graduates |
| Computers & Mathematics | 0 | 0.0% |
| Bio, Nature & Agricultural | 9 | 4.8% |
| Physical & Health Sciences | 8 | 4.3% |
| Psychology | 20 | 10.7% |
| Social Sciences | 16 | 8.6% |
| Engineering | 16 | 8.6% |
| Multidisciplinary Studies | 0 | 0.0% |
| Science & Technology | 11 | 5.9% |
| Business | 14 | 7.5% |
| Education | 24 | 12.9% |
| Literature & Languages | 21 | 11.3% |
| Liberal Arts & History | 19 | 10.2% |
| Visual & Performing Arts | 14 | 7.5% |
| Communications | 9 | 4.8% |
| Arts & Humanities | 5 | 2.7% |
| Total | 186 | 100.0% |
Transportation & Commute in Green Valley CDP Los Angeles County
Vehicle Availability by Sex in Green Valley CDP Los Angeles County
The most prevalent vehicle ownership categories in Green Valley CDP Los Angeles County are males with 2 vehicles (79, accounting for 38.5%) and females with 2 vehicles (26, making up 62.2%).
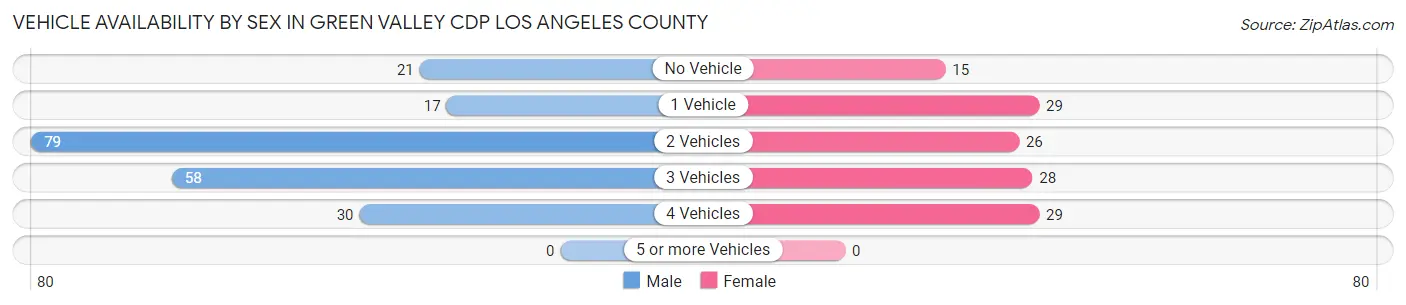
| Vehicles Available | Male | Female |
| No Vehicle | 21 (10.2%) | 15 (11.8%) |
| 1 Vehicle | 17 (8.3%) | 29 (22.8%) |
| 2 Vehicles | 79 (38.5%) | 26 (20.5%) |
| 3 Vehicles | 58 (28.3%) | 28 (22.1%) |
| 4 Vehicles | 30 (14.6%) | 29 (22.8%) |
| 5 or more Vehicles | 0 (0.0%) | 0 (0.0%) |
| Total | 205 (100.0%) | 127 (100.0%) |
Commute Time in Green Valley CDP Los Angeles County
The most frequently occuring commute durations in Green Valley CDP Los Angeles County are 40 to 44 minutes (88 commuters, 28.4%), 60 to 89 minutes (59 commuters, 19.0%), and 90 or more minutes (57 commuters, 18.4%).
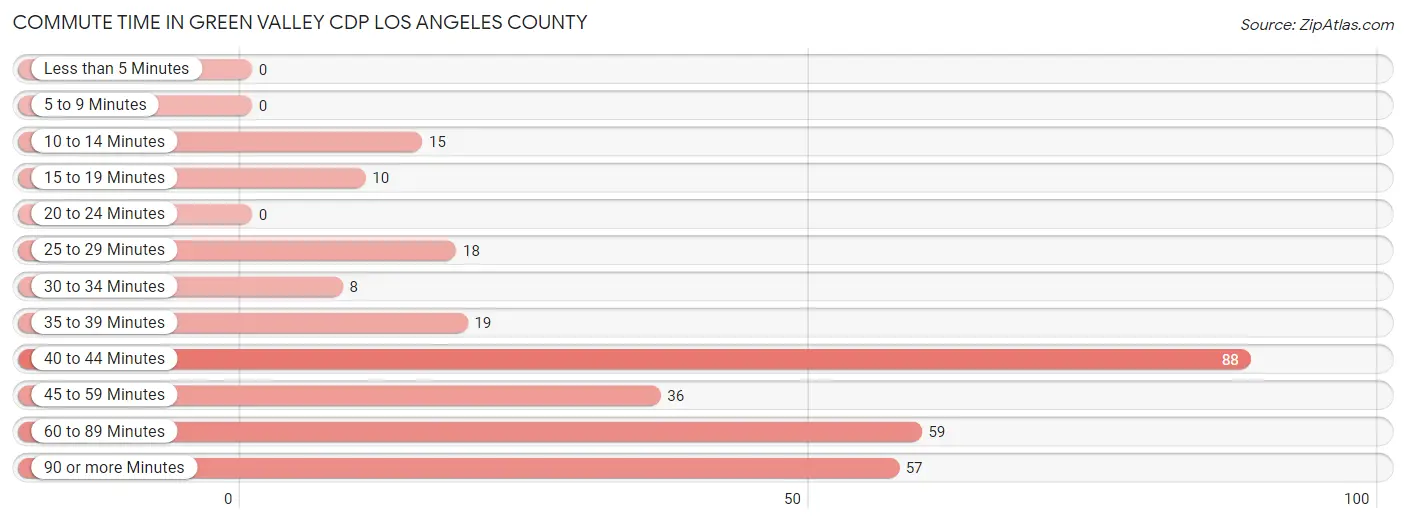
| Commute Time | # Commuters | % Commuters |
| Less than 5 Minutes | 0 | 0.0% |
| 5 to 9 Minutes | 0 | 0.0% |
| 10 to 14 Minutes | 15 | 4.8% |
| 15 to 19 Minutes | 10 | 3.2% |
| 20 to 24 Minutes | 0 | 0.0% |
| 25 to 29 Minutes | 18 | 5.8% |
| 30 to 34 Minutes | 8 | 2.6% |
| 35 to 39 Minutes | 19 | 6.1% |
| 40 to 44 Minutes | 88 | 28.4% |
| 45 to 59 Minutes | 36 | 11.6% |
| 60 to 89 Minutes | 59 | 19.0% |
| 90 or more Minutes | 57 | 18.4% |
Commute Time by Sex in Green Valley CDP Los Angeles County
The most common commute times in Green Valley CDP Los Angeles County are 40 to 44 minutes (63 commuters, 32.6%) for males and 60 to 89 minutes (30 commuters, 25.6%) for females.
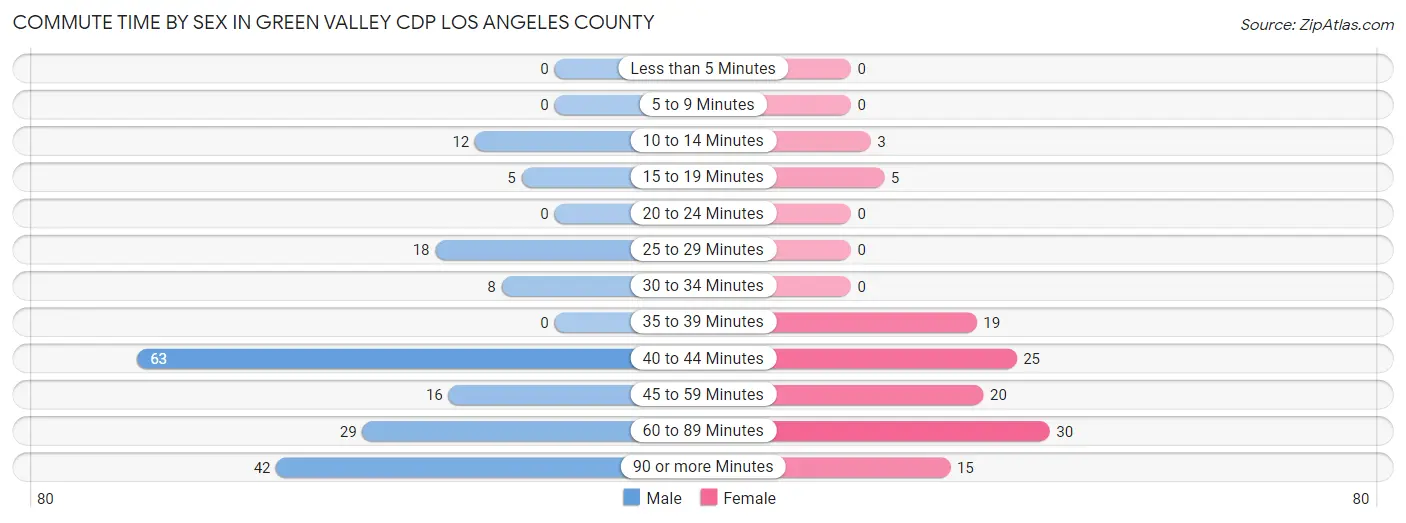
| Commute Time | Male | Female |
| Less than 5 Minutes | 0 (0.0%) | 0 (0.0%) |
| 5 to 9 Minutes | 0 (0.0%) | 0 (0.0%) |
| 10 to 14 Minutes | 12 (6.2%) | 3 (2.6%) |
| 15 to 19 Minutes | 5 (2.6%) | 5 (4.3%) |
| 20 to 24 Minutes | 0 (0.0%) | 0 (0.0%) |
| 25 to 29 Minutes | 18 (9.3%) | 0 (0.0%) |
| 30 to 34 Minutes | 8 (4.2%) | 0 (0.0%) |
| 35 to 39 Minutes | 0 (0.0%) | 19 (16.2%) |
| 40 to 44 Minutes | 63 (32.6%) | 25 (21.4%) |
| 45 to 59 Minutes | 16 (8.3%) | 20 (17.1%) |
| 60 to 89 Minutes | 29 (15.0%) | 30 (25.6%) |
| 90 or more Minutes | 42 (21.8%) | 15 (12.8%) |
Time of Departure to Work by Sex in Green Valley CDP Los Angeles County
The most frequent times of departure to work in Green Valley CDP Los Angeles County are 5:00 AM to 5:29 AM (50, 25.9%) for males and 6:00 AM to 6:29 AM (37, 31.6%) for females.
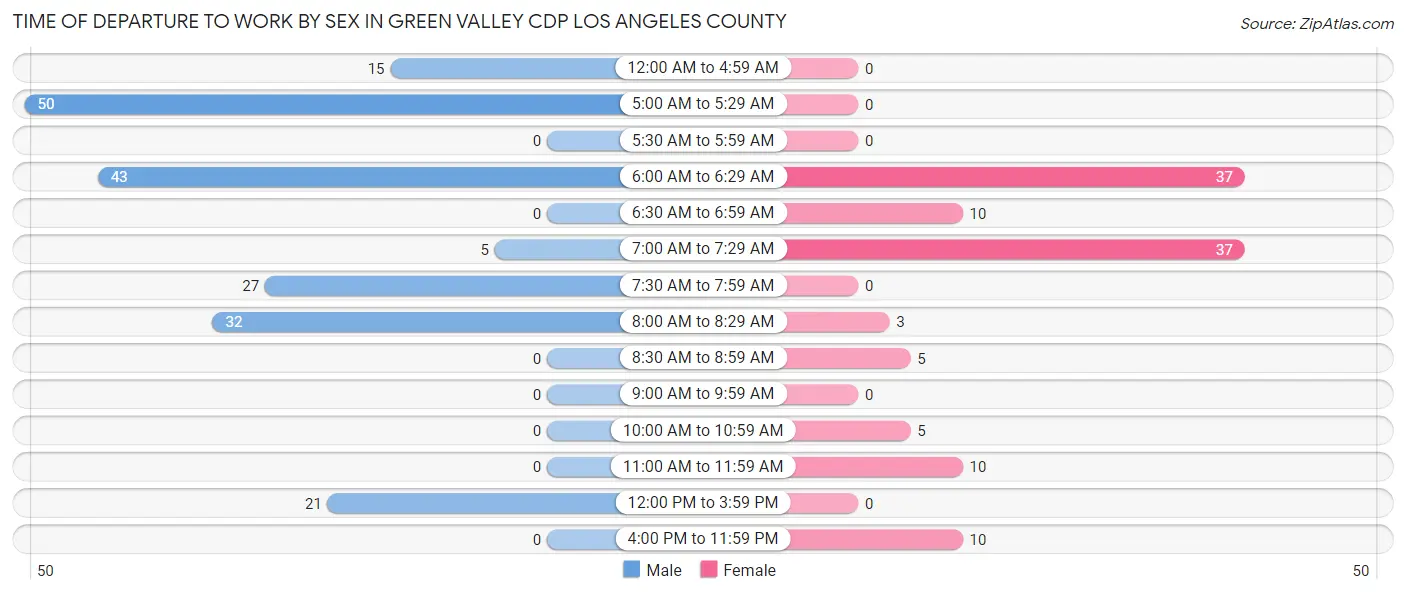
| Time of Departure | Male | Female |
| 12:00 AM to 4:59 AM | 15 (7.8%) | 0 (0.0%) |
| 5:00 AM to 5:29 AM | 50 (25.9%) | 0 (0.0%) |
| 5:30 AM to 5:59 AM | 0 (0.0%) | 0 (0.0%) |
| 6:00 AM to 6:29 AM | 43 (22.3%) | 37 (31.6%) |
| 6:30 AM to 6:59 AM | 0 (0.0%) | 10 (8.6%) |
| 7:00 AM to 7:29 AM | 5 (2.6%) | 37 (31.6%) |
| 7:30 AM to 7:59 AM | 27 (14.0%) | 0 (0.0%) |
| 8:00 AM to 8:29 AM | 32 (16.6%) | 3 (2.6%) |
| 8:30 AM to 8:59 AM | 0 (0.0%) | 5 (4.3%) |
| 9:00 AM to 9:59 AM | 0 (0.0%) | 0 (0.0%) |
| 10:00 AM to 10:59 AM | 0 (0.0%) | 5 (4.3%) |
| 11:00 AM to 11:59 AM | 0 (0.0%) | 10 (8.6%) |
| 12:00 PM to 3:59 PM | 21 (10.9%) | 0 (0.0%) |
| 4:00 PM to 11:59 PM | 0 (0.0%) | 10 (8.6%) |
| Total | 193 (100.0%) | 117 (100.0%) |
Housing Occupancy in Green Valley CDP Los Angeles County
Occupancy by Ownership in Green Valley CDP Los Angeles County
Of the total 390 dwellings in Green Valley CDP Los Angeles County, owner-occupied units account for 281 (72.1%), while renter-occupied units make up 109 (28.0%).
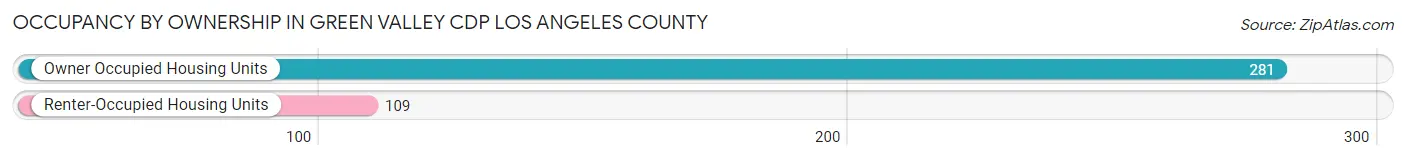
| Occupancy | # Housing Units | % Housing Units |
| Owner Occupied Housing Units | 281 | 72.1% |
| Renter-Occupied Housing Units | 109 | 28.0% |
| Total Occupied Housing Units | 390 | 100.0% |
Occupancy by Household Size in Green Valley CDP Los Angeles County
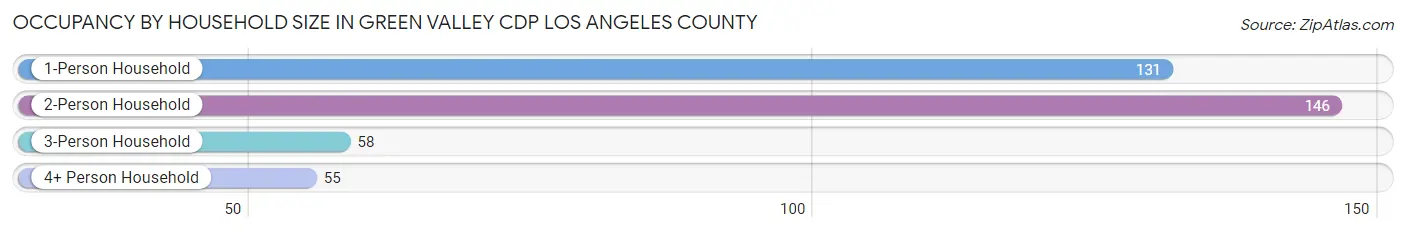
| Household Size | # Housing Units | % Housing Units |
| 1-Person Household | 131 | 33.6% |
| 2-Person Household | 146 | 37.4% |
| 3-Person Household | 58 | 14.9% |
| 4+ Person Household | 55 | 14.1% |
| Total Housing Units | 390 | 100.0% |
Occupancy by Ownership by Household Size in Green Valley CDP Los Angeles County
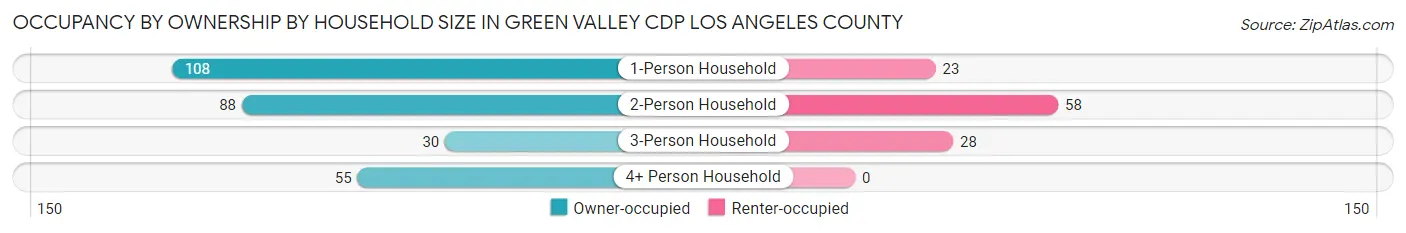
| Household Size | Owner-occupied | Renter-occupied |
| 1-Person Household | 108 (82.4%) | 23 (17.6%) |
| 2-Person Household | 88 (60.3%) | 58 (39.7%) |
| 3-Person Household | 30 (51.7%) | 28 (48.3%) |
| 4+ Person Household | 55 (100.0%) | 0 (0.0%) |
| Total Housing Units | 281 (72.1%) | 109 (28.0%) |
Occupancy by Educational Attainment in Green Valley CDP Los Angeles County
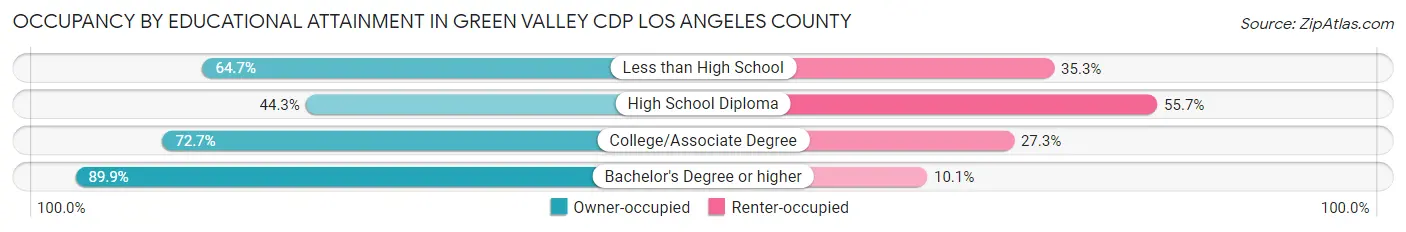
| Household Size | Owner-occupied | Renter-occupied |
| Less than High School | 11 (64.7%) | 6 (35.3%) |
| High School Diploma | 31 (44.3%) | 39 (55.7%) |
| College/Associate Degree | 141 (72.7%) | 53 (27.3%) |
| Bachelor's Degree or higher | 98 (89.9%) | 11 (10.1%) |
Occupancy by Age of Householder in Green Valley CDP Los Angeles County
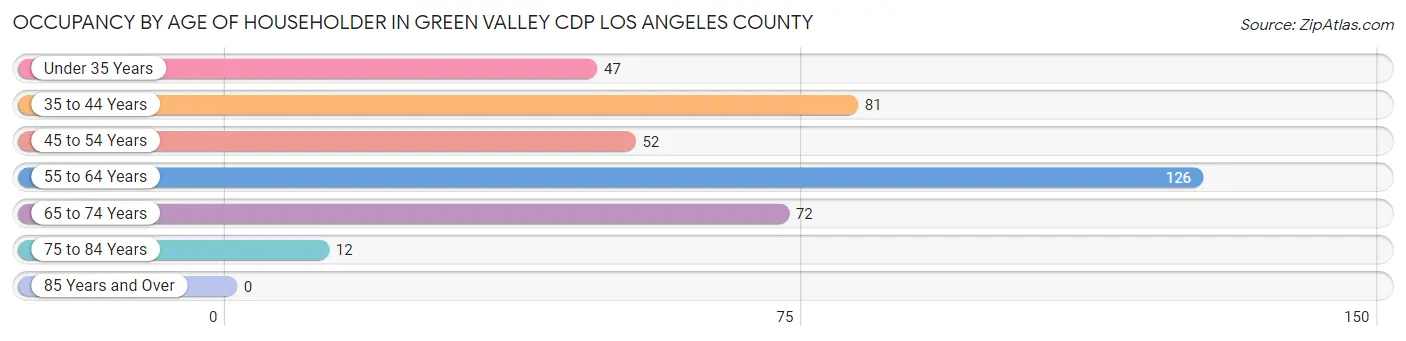
| Age Bracket | # Households | % Households |
| Under 35 Years | 47 | 12.0% |
| 35 to 44 Years | 81 | 20.8% |
| 45 to 54 Years | 52 | 13.3% |
| 55 to 64 Years | 126 | 32.3% |
| 65 to 74 Years | 72 | 18.5% |
| 75 to 84 Years | 12 | 3.1% |
| 85 Years and Over | 0 | 0.0% |
| Total | 390 | 100.0% |
Housing Finances in Green Valley CDP Los Angeles County
Median Income by Occupancy in Green Valley CDP Los Angeles County
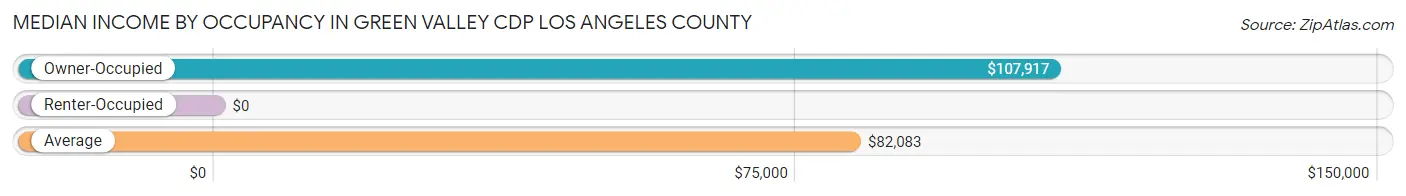
| Occupancy Type | # Households | Median Income |
| Owner-Occupied | 281 (72.1%) | $107,917 |
| Renter-Occupied | 109 (28.0%) | $0 |
| Average | 390 (100.0%) | $82,083 |
Occupancy by Householder Income Bracket in Green Valley CDP Los Angeles County
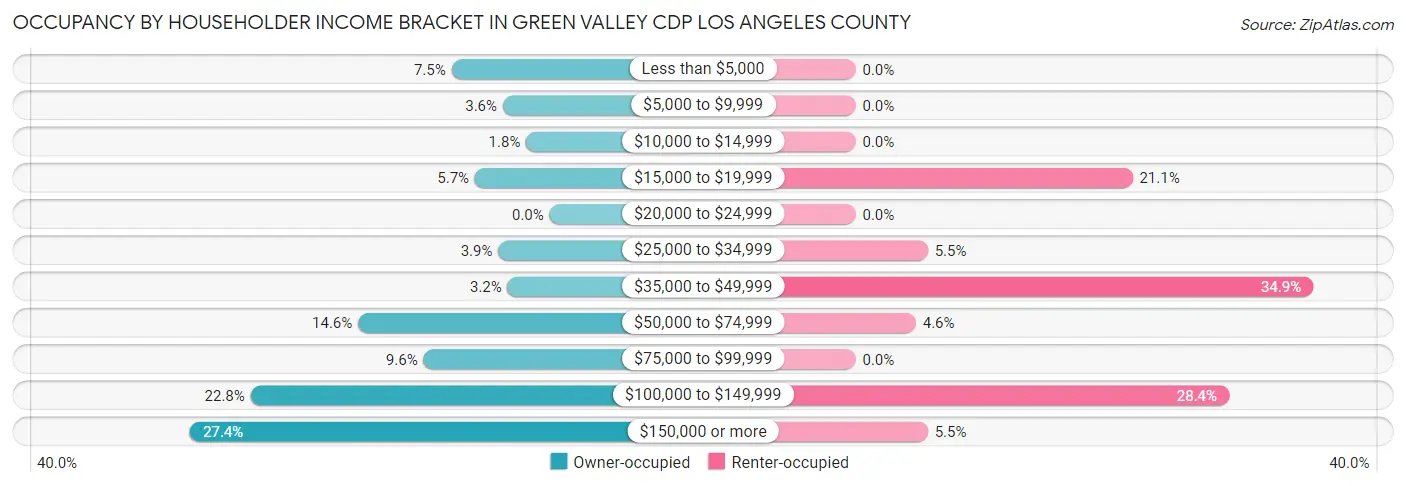
| Income Bracket | Owner-occupied | Renter-occupied |
| Less than $5,000 | 21 (7.5%) | 0 (0.0%) |
| $5,000 to $9,999 | 10 (3.6%) | 0 (0.0%) |
| $10,000 to $14,999 | 5 (1.8%) | 0 (0.0%) |
| $15,000 to $19,999 | 16 (5.7%) | 23 (21.1%) |
| $20,000 to $24,999 | 0 (0.0%) | 0 (0.0%) |
| $25,000 to $34,999 | 11 (3.9%) | 6 (5.5%) |
| $35,000 to $49,999 | 9 (3.2%) | 38 (34.9%) |
| $50,000 to $74,999 | 41 (14.6%) | 5 (4.6%) |
| $75,000 to $99,999 | 27 (9.6%) | 0 (0.0%) |
| $100,000 to $149,999 | 64 (22.8%) | 31 (28.4%) |
| $150,000 or more | 77 (27.4%) | 6 (5.5%) |
| Total | 281 (100.0%) | 109 (100.0%) |
Monthly Housing Cost Tiers in Green Valley CDP Los Angeles County
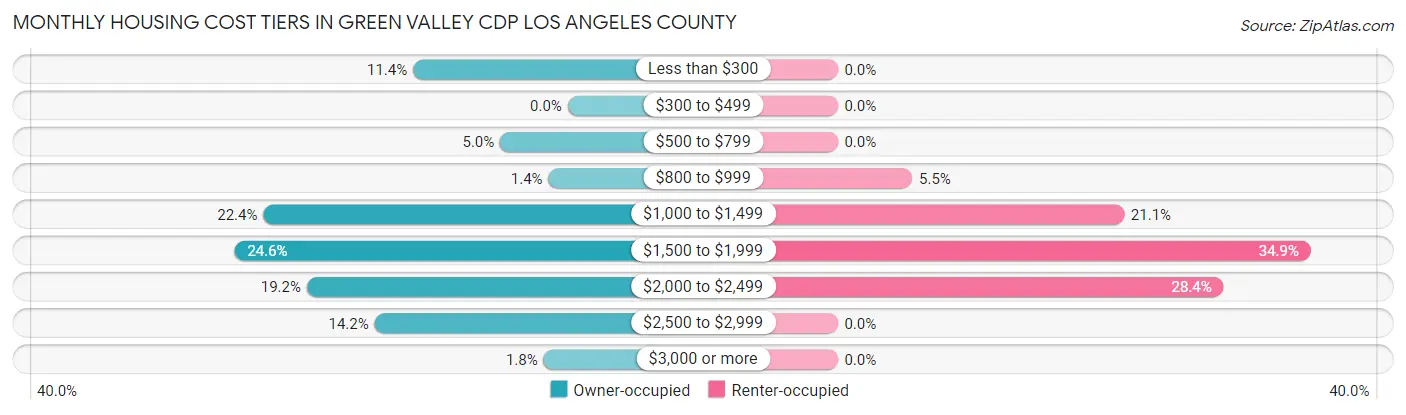
| Monthly Cost | Owner-occupied | Renter-occupied |
| Less than $300 | 32 (11.4%) | 0 (0.0%) |
| $300 to $499 | 0 (0.0%) | 0 (0.0%) |
| $500 to $799 | 14 (5.0%) | 0 (0.0%) |
| $800 to $999 | 4 (1.4%) | 6 (5.5%) |
| $1,000 to $1,499 | 63 (22.4%) | 23 (21.1%) |
| $1,500 to $1,999 | 69 (24.6%) | 38 (34.9%) |
| $2,000 to $2,499 | 54 (19.2%) | 31 (28.4%) |
| $2,500 to $2,999 | 40 (14.2%) | 0 (0.0%) |
| $3,000 or more | 5 (1.8%) | 0 (0.0%) |
| Total | 281 (100.0%) | 109 (100.0%) |
Physical Housing Characteristics in Green Valley CDP Los Angeles County
Housing Structures in Green Valley CDP Los Angeles County
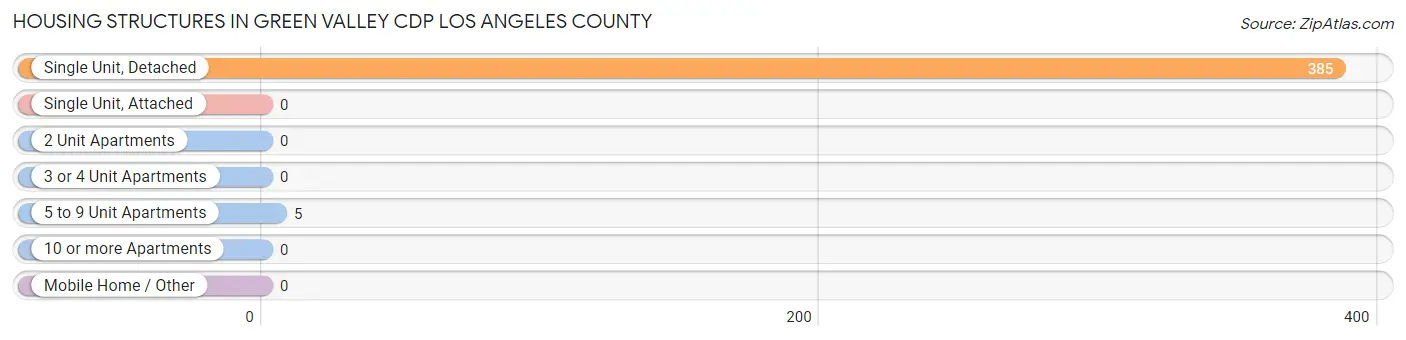
| Structure Type | # Housing Units | % Housing Units |
| Single Unit, Detached | 385 | 98.7% |
| Single Unit, Attached | 0 | 0.0% |
| 2 Unit Apartments | 0 | 0.0% |
| 3 or 4 Unit Apartments | 0 | 0.0% |
| 5 to 9 Unit Apartments | 5 | 1.3% |
| 10 or more Apartments | 0 | 0.0% |
| Mobile Home / Other | 0 | 0.0% |
| Total | 390 | 100.0% |
Housing Structures by Occupancy in Green Valley CDP Los Angeles County
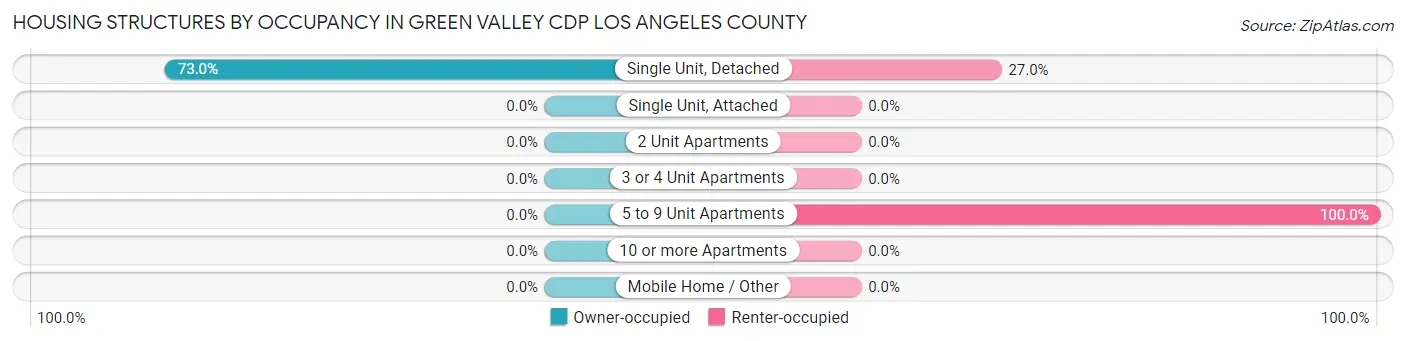
| Structure Type | Owner-occupied | Renter-occupied |
| Single Unit, Detached | 281 (73.0%) | 104 (27.0%) |
| Single Unit, Attached | 0 (0.0%) | 0 (0.0%) |
| 2 Unit Apartments | 0 (0.0%) | 0 (0.0%) |
| 3 or 4 Unit Apartments | 0 (0.0%) | 0 (0.0%) |
| 5 to 9 Unit Apartments | 0 (0.0%) | 5 (100.0%) |
| 10 or more Apartments | 0 (0.0%) | 0 (0.0%) |
| Mobile Home / Other | 0 (0.0%) | 0 (0.0%) |
| Total | 281 (72.1%) | 109 (28.0%) |
Housing Structures by Number of Rooms in Green Valley CDP Los Angeles County
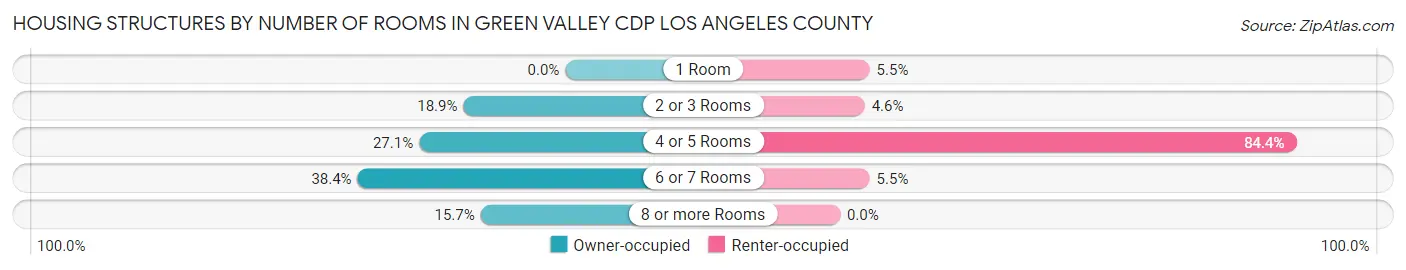
| Number of Rooms | Owner-occupied | Renter-occupied |
| 1 Room | 0 (0.0%) | 6 (5.5%) |
| 2 or 3 Rooms | 53 (18.9%) | 5 (4.6%) |
| 4 or 5 Rooms | 76 (27.1%) | 92 (84.4%) |
| 6 or 7 Rooms | 108 (38.4%) | 6 (5.5%) |
| 8 or more Rooms | 44 (15.7%) | 0 (0.0%) |
| Total | 281 (100.0%) | 109 (100.0%) |
Housing Structure by Heating Type in Green Valley CDP Los Angeles County
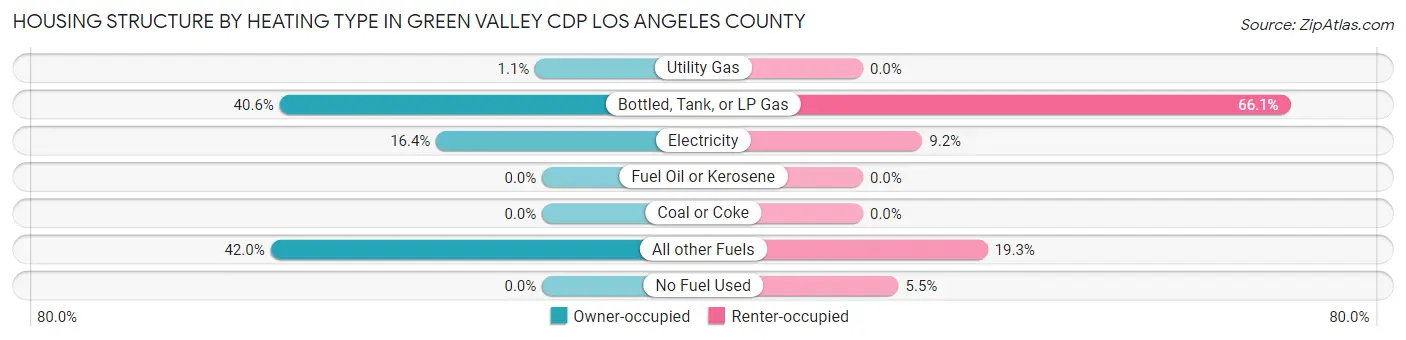
| Heating Type | Owner-occupied | Renter-occupied |
| Utility Gas | 3 (1.1%) | 0 (0.0%) |
| Bottled, Tank, or LP Gas | 114 (40.6%) | 72 (66.1%) |
| Electricity | 46 (16.4%) | 10 (9.2%) |
| Fuel Oil or Kerosene | 0 (0.0%) | 0 (0.0%) |
| Coal or Coke | 0 (0.0%) | 0 (0.0%) |
| All other Fuels | 118 (42.0%) | 21 (19.3%) |
| No Fuel Used | 0 (0.0%) | 6 (5.5%) |
| Total | 281 (100.0%) | 109 (100.0%) |
Household Vehicle Usage in Green Valley CDP Los Angeles County
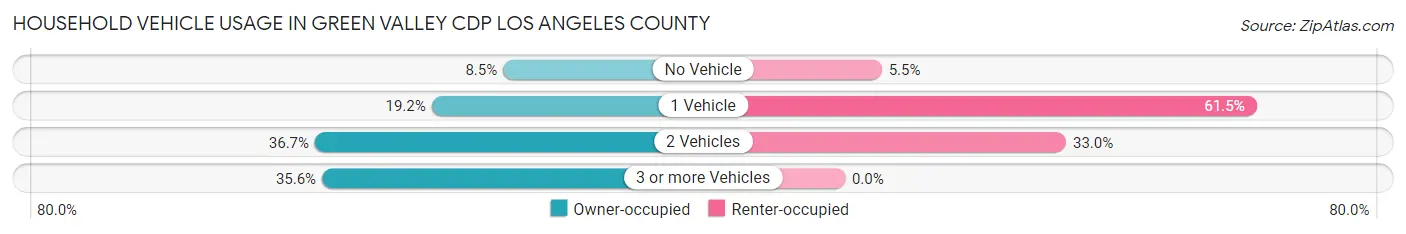
| Vehicles per Household | Owner-occupied | Renter-occupied |
| No Vehicle | 24 (8.5%) | 6 (5.5%) |
| 1 Vehicle | 54 (19.2%) | 67 (61.5%) |
| 2 Vehicles | 103 (36.6%) | 36 (33.0%) |
| 3 or more Vehicles | 100 (35.6%) | 0 (0.0%) |
| Total | 281 (100.0%) | 109 (100.0%) |
Real Estate & Mortgages in Green Valley CDP Los Angeles County
Real Estate and Mortgage Overview in Green Valley CDP Los Angeles County
| Characteristic | Without Mortgage | With Mortgage |
| Housing Units | 87 | 194 |
| Median Property Value | $393,100 | $400,000 |
| Median Household Income | - | - |
| Monthly Housing Costs | $682 | $5 |
| Real Estate Taxes | $2,167 | $0 |
Property Value by Mortgage Status in Green Valley CDP Los Angeles County
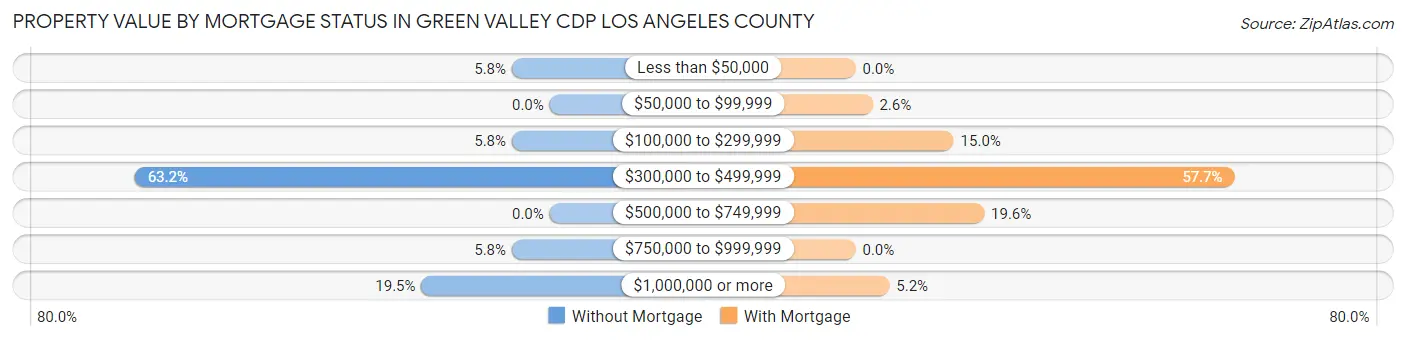
| Property Value | Without Mortgage | With Mortgage |
| Less than $50,000 | 5 (5.8%) | 0 (0.0%) |
| $50,000 to $99,999 | 0 (0.0%) | 5 (2.6%) |
| $100,000 to $299,999 | 5 (5.8%) | 29 (14.9%) |
| $300,000 to $499,999 | 55 (63.2%) | 112 (57.7%) |
| $500,000 to $749,999 | 0 (0.0%) | 38 (19.6%) |
| $750,000 to $999,999 | 5 (5.8%) | 0 (0.0%) |
| $1,000,000 or more | 17 (19.5%) | 10 (5.1%) |
| Total | 87 (100.0%) | 194 (100.0%) |
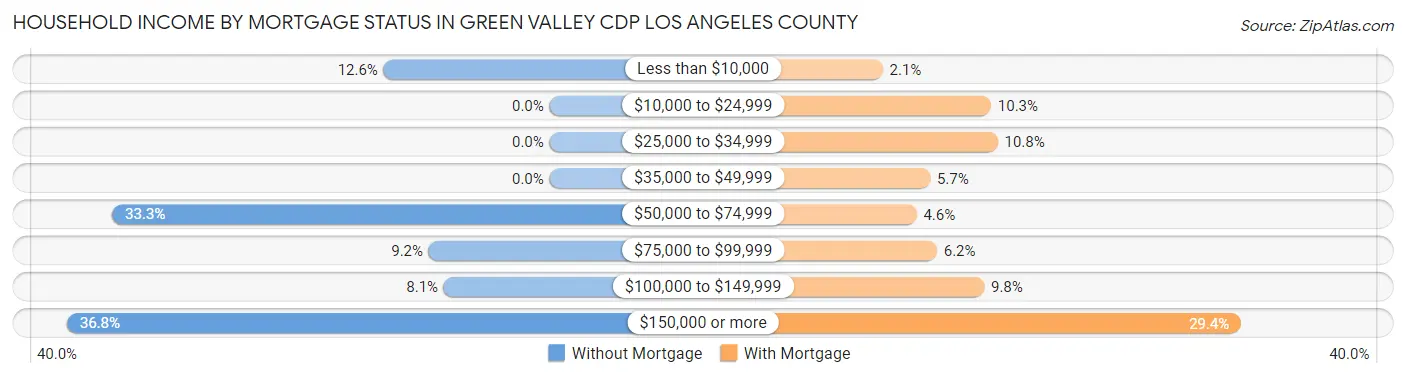
Household Income by Mortgage Status in Green Valley CDP Los Angeles County
| Household Income | Without Mortgage | With Mortgage |
| Less than $10,000 | 11 (12.6%) | 4 (2.1%) |
| $10,000 to $24,999 | 0 (0.0%) | 20 (10.3%) |
| $25,000 to $34,999 | 0 (0.0%) | 21 (10.8%) |
| $35,000 to $49,999 | 0 (0.0%) | 11 (5.7%) |
| $50,000 to $74,999 | 29 (33.3%) | 9 (4.6%) |
| $75,000 to $99,999 | 8 (9.2%) | 12 (6.2%) |
| $100,000 to $149,999 | 7 (8.1%) | 19 (9.8%) |
| $150,000 or more | 32 (36.8%) | 57 (29.4%) |
| Total | 87 (100.0%) | 194 (100.0%) |
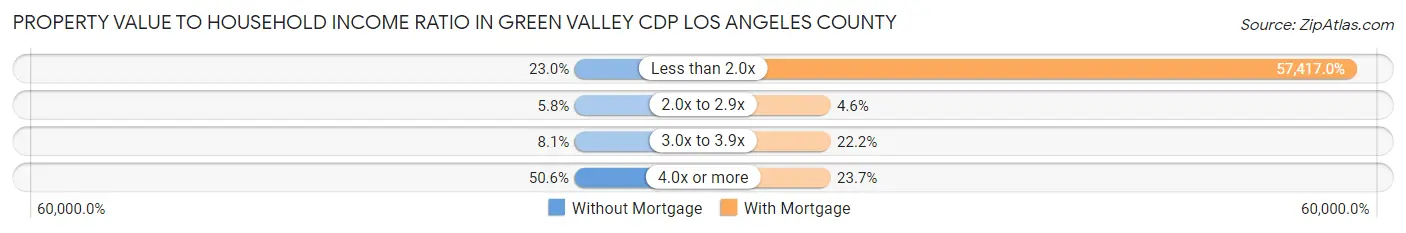
Property Value to Household Income Ratio in Green Valley CDP Los Angeles County
| Value-to-Income Ratio | Without Mortgage | With Mortgage |
| Less than 2.0x | 20 (23.0%) | 111,389 (57,417.0%) |
| 2.0x to 2.9x | 5 (5.8%) | 9 (4.6%) |
| 3.0x to 3.9x | 7 (8.1%) | 43 (22.2%) |
| 4.0x or more | 44 (50.6%) | 46 (23.7%) |
| Total | 87 (100.0%) | 194 (100.0%) |
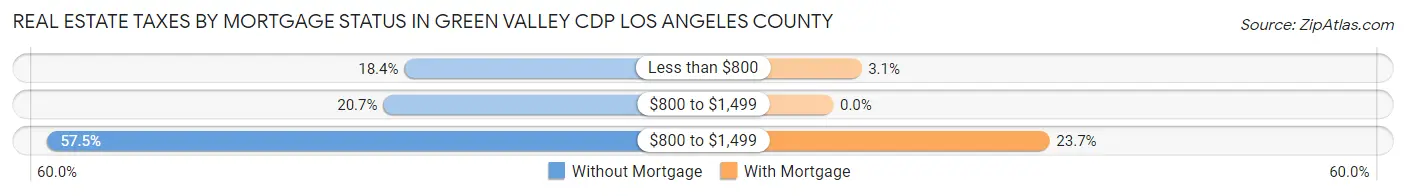
Real Estate Taxes by Mortgage Status in Green Valley CDP Los Angeles County
| Property Taxes | Without Mortgage | With Mortgage |
| Less than $800 | 16 (18.4%) | 6 (3.1%) |
| $800 to $1,499 | 18 (20.7%) | 0 (0.0%) |
| $800 to $1,499 | 50 (57.5%) | 46 (23.7%) |
| Total | 87 (100.0%) | 194 (100.0%) |
Health & Disability in Green Valley CDP Los Angeles County
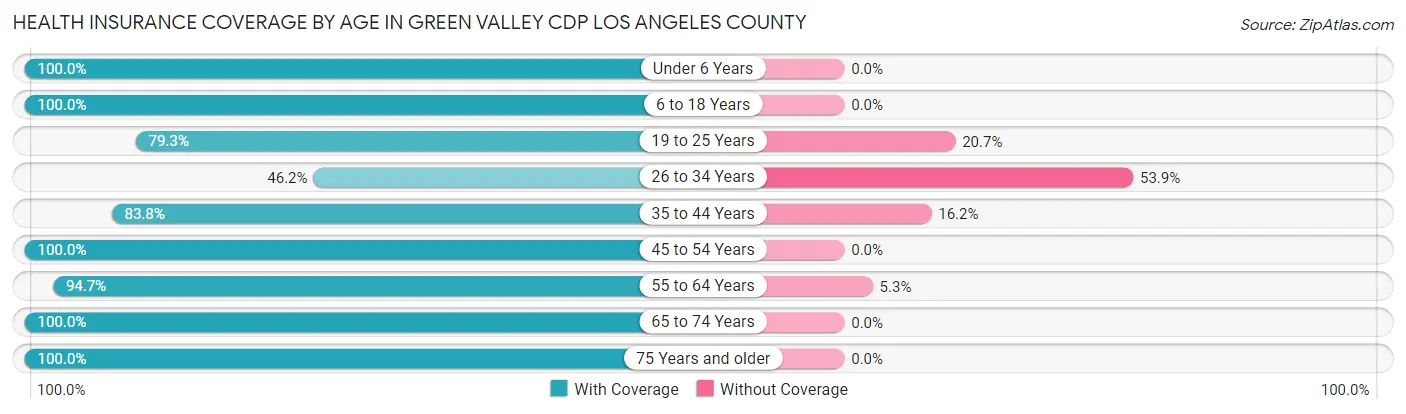
Health Insurance Coverage by Age in Green Valley CDP Los Angeles County
| Age Bracket | With Coverage | Without Coverage |
| Under 6 Years | 26 (100.0%) | 0 (0.0%) |
| 6 to 18 Years | 110 (100.0%) | 0 (0.0%) |
| 19 to 25 Years | 23 (79.3%) | 6 (20.7%) |
| 26 to 34 Years | 36 (46.2%) | 42 (53.8%) |
| 35 to 44 Years | 124 (83.8%) | 24 (16.2%) |
| 45 to 54 Years | 95 (100.0%) | 0 (0.0%) |
| 55 to 64 Years | 179 (94.7%) | 10 (5.3%) |
| 65 to 74 Years | 120 (100.0%) | 0 (0.0%) |
| 75 Years and older | 37 (100.0%) | 0 (0.0%) |
| Total | 750 (90.1%) | 82 (9.9%) |
Health Insurance Coverage by Citizenship Status in Green Valley CDP Los Angeles County
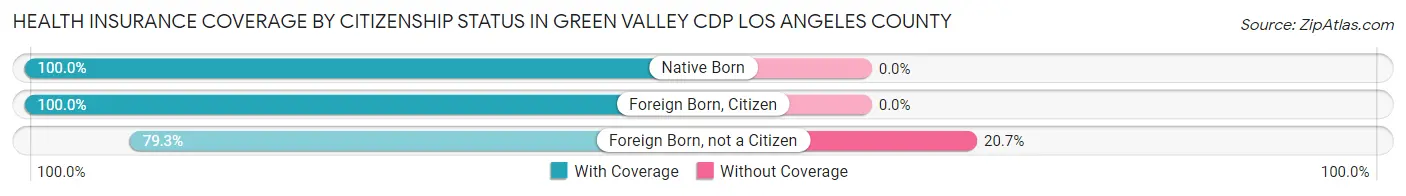
| Citizenship Status | With Coverage | Without Coverage |
| Native Born | 26 (100.0%) | 0 (0.0%) |
| Foreign Born, Citizen | 110 (100.0%) | 0 (0.0%) |
| Foreign Born, not a Citizen | 23 (79.3%) | 6 (20.7%) |
Health Insurance Coverage by Household Income in Green Valley CDP Los Angeles County
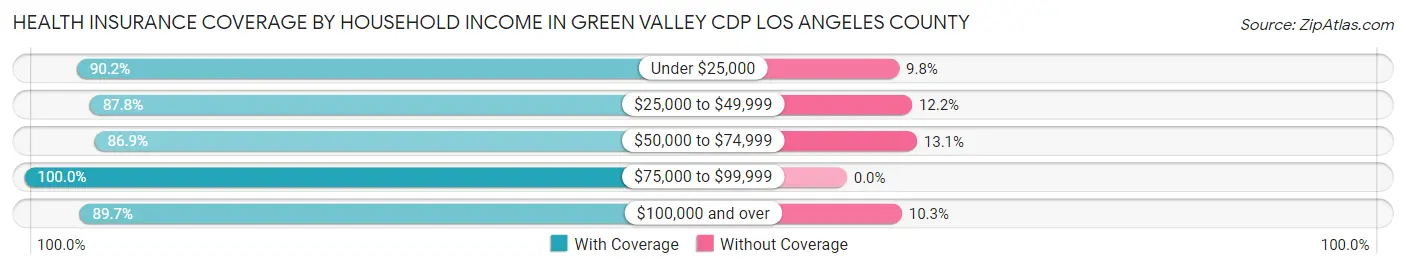
| Household Income | With Coverage | Without Coverage |
| Under $25,000 | 92 (90.2%) | 10 (9.8%) |
| $25,000 to $49,999 | 115 (87.8%) | 16 (12.2%) |
| $50,000 to $74,999 | 86 (86.9%) | 13 (13.1%) |
| $75,000 to $99,999 | 83 (100.0%) | 0 (0.0%) |
| $100,000 and over | 374 (89.7%) | 43 (10.3%) |
Public vs Private Health Insurance Coverage by Age in Green Valley CDP Los Angeles County
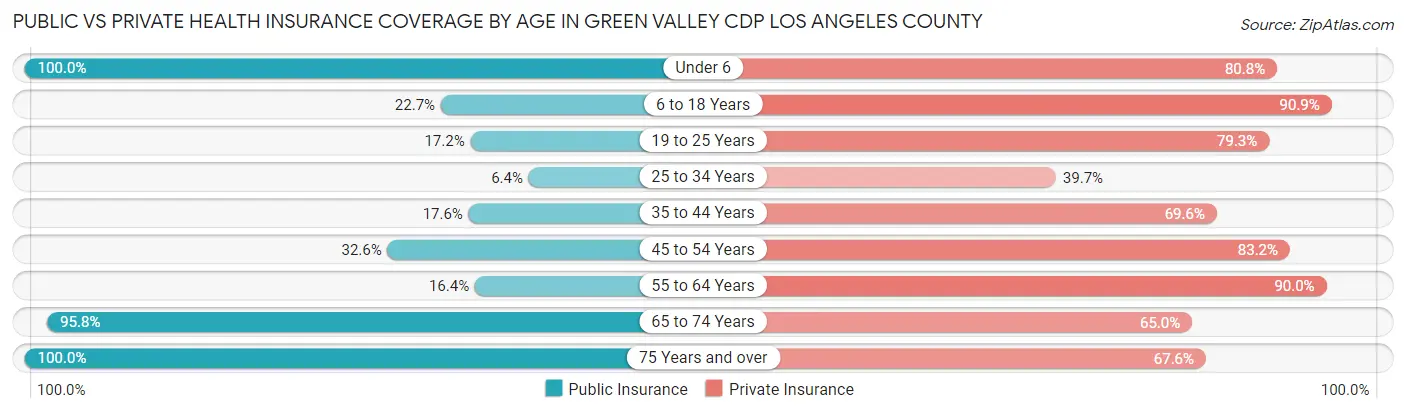
| Age Bracket | Public Insurance | Private Insurance |
| Under 6 | 26 (100.0%) | 21 (80.8%) |
| 6 to 18 Years | 25 (22.7%) | 100 (90.9%) |
| 19 to 25 Years | 5 (17.2%) | 23 (79.3%) |
| 25 to 34 Years | 5 (6.4%) | 31 (39.7%) |
| 35 to 44 Years | 26 (17.6%) | 103 (69.6%) |
| 45 to 54 Years | 31 (32.6%) | 79 (83.2%) |
| 55 to 64 Years | 31 (16.4%) | 170 (89.9%) |
| 65 to 74 Years | 115 (95.8%) | 78 (65.0%) |
| 75 Years and over | 37 (100.0%) | 25 (67.6%) |
| Total | 301 (36.2%) | 630 (75.7%) |
Disability Status by Sex by Age in Green Valley CDP Los Angeles County
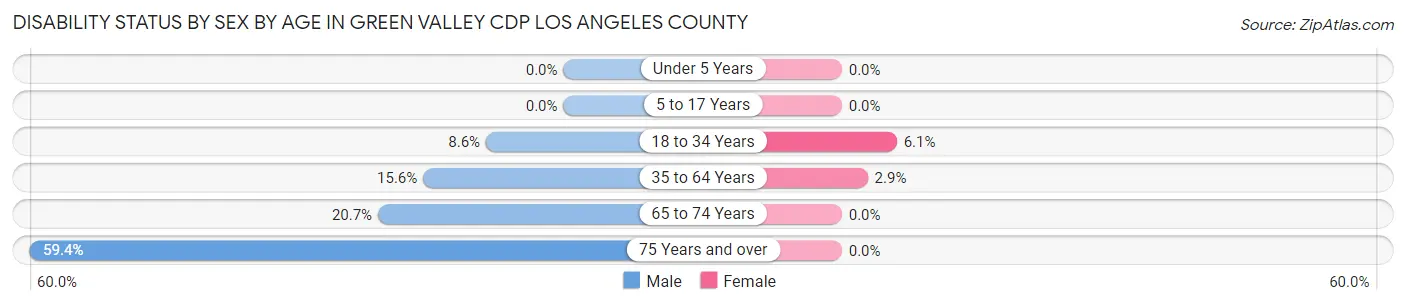
| Age Bracket | Male | Female |
| Under 5 Years | 0 (0.0%) | 0 (0.0%) |
| 5 to 17 Years | 0 (0.0%) | 0 (0.0%) |
| 18 to 34 Years | 5 (8.6%) | 3 (6.1%) |
| 35 to 64 Years | 35 (15.6%) | 6 (2.9%) |
| 65 to 74 Years | 19 (20.6%) | 0 (0.0%) |
| 75 Years and over | 19 (59.4%) | 0 (0.0%) |
Disability Class by Sex by Age in Green Valley CDP Los Angeles County
Disability Class: Hearing Difficulty
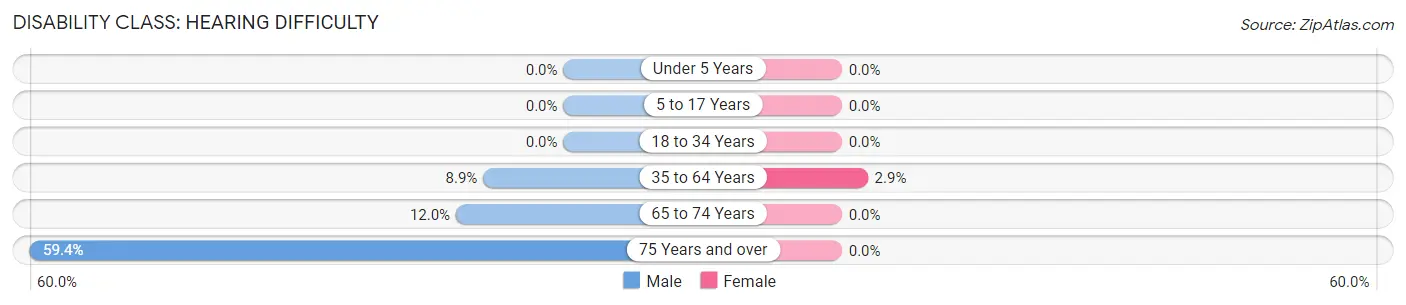
| Age Bracket | Male | Female |
| Under 5 Years | 0 (0.0%) | 0 (0.0%) |
| 5 to 17 Years | 0 (0.0%) | 0 (0.0%) |
| 18 to 34 Years | 0 (0.0%) | 0 (0.0%) |
| 35 to 64 Years | 20 (8.9%) | 6 (2.9%) |
| 65 to 74 Years | 11 (12.0%) | 0 (0.0%) |
| 75 Years and over | 19 (59.4%) | 0 (0.0%) |
Disability Class: Vision Difficulty
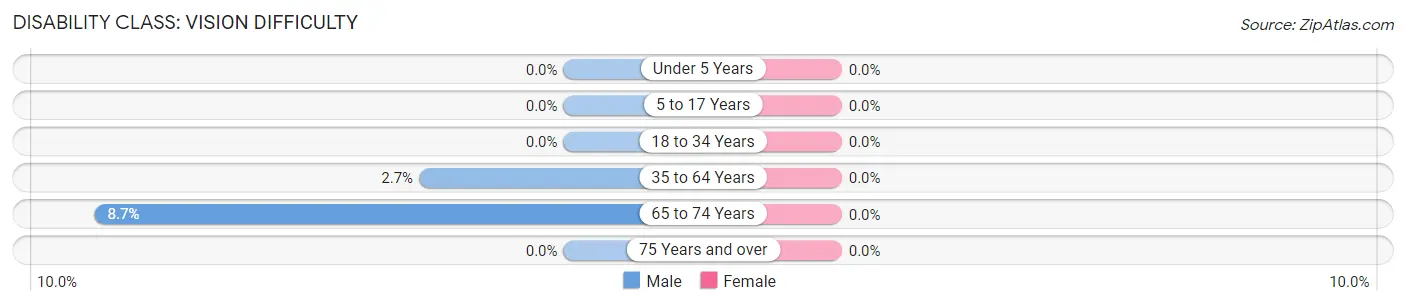
| Age Bracket | Male | Female |
| Under 5 Years | 0 (0.0%) | 0 (0.0%) |
| 5 to 17 Years | 0 (0.0%) | 0 (0.0%) |
| 18 to 34 Years | 0 (0.0%) | 0 (0.0%) |
| 35 to 64 Years | 6 (2.7%) | 0 (0.0%) |
| 65 to 74 Years | 8 (8.7%) | 0 (0.0%) |
| 75 Years and over | 0 (0.0%) | 0 (0.0%) |
Disability Class: Cognitive Difficulty
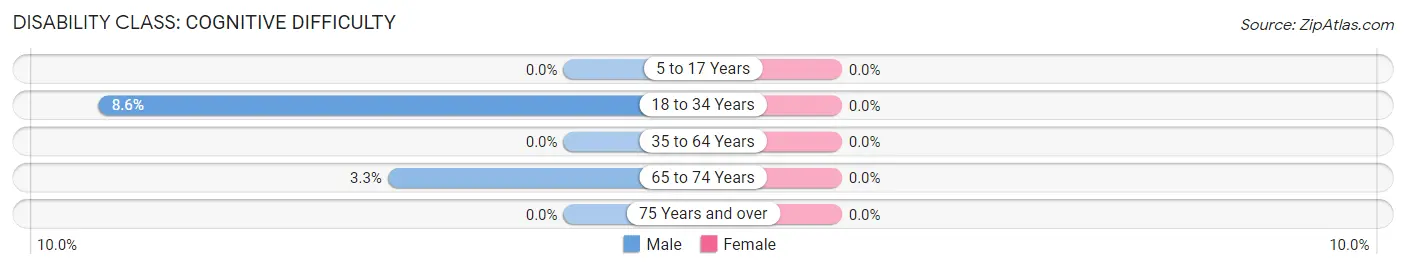
| Age Bracket | Male | Female |
| 5 to 17 Years | 0 (0.0%) | 0 (0.0%) |
| 18 to 34 Years | 5 (8.6%) | 0 (0.0%) |
| 35 to 64 Years | 0 (0.0%) | 0 (0.0%) |
| 65 to 74 Years | 3 (3.3%) | 0 (0.0%) |
| 75 Years and over | 0 (0.0%) | 0 (0.0%) |
Disability Class: Ambulatory Difficulty
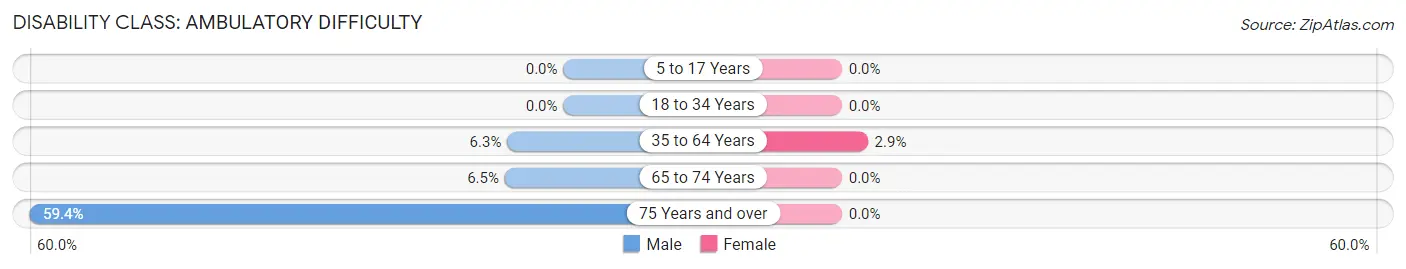
| Age Bracket | Male | Female |
| 5 to 17 Years | 0 (0.0%) | 0 (0.0%) |
| 18 to 34 Years | 0 (0.0%) | 0 (0.0%) |
| 35 to 64 Years | 14 (6.2%) | 6 (2.9%) |
| 65 to 74 Years | 6 (6.5%) | 0 (0.0%) |
| 75 Years and over | 19 (59.4%) | 0 (0.0%) |
Disability Class: Self-Care Difficulty
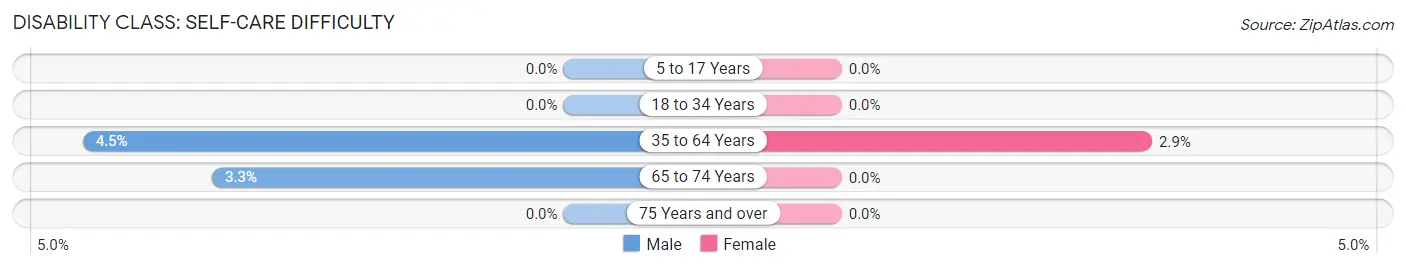
| Age Bracket | Male | Female |
| 5 to 17 Years | 0 (0.0%) | 0 (0.0%) |
| 18 to 34 Years | 0 (0.0%) | 0 (0.0%) |
| 35 to 64 Years | 10 (4.5%) | 6 (2.9%) |
| 65 to 74 Years | 3 (3.3%) | 0 (0.0%) |
| 75 Years and over | 0 (0.0%) | 0 (0.0%) |
Technology Access in Green Valley CDP Los Angeles County
Computing Device Access in Green Valley CDP Los Angeles County
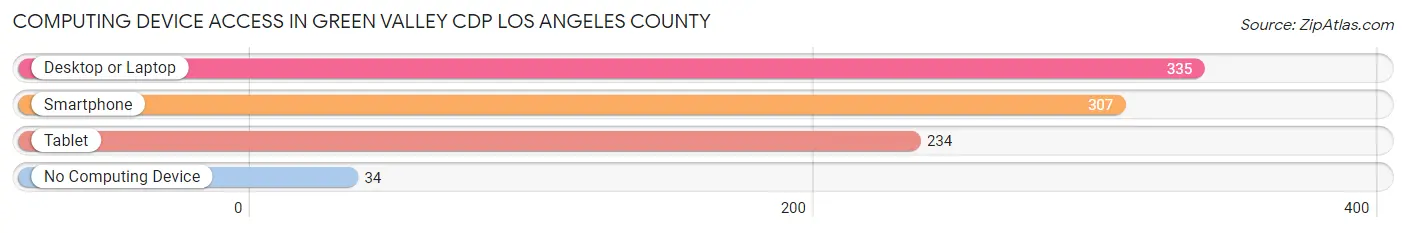
| Device Type | # Households | % Households |
| Desktop or Laptop | 335 | 85.9% |
| Smartphone | 307 | 78.7% |
| Tablet | 234 | 60.0% |
| No Computing Device | 34 | 8.7% |
| Total | 390 | 100.0% |
Internet Access in Green Valley CDP Los Angeles County
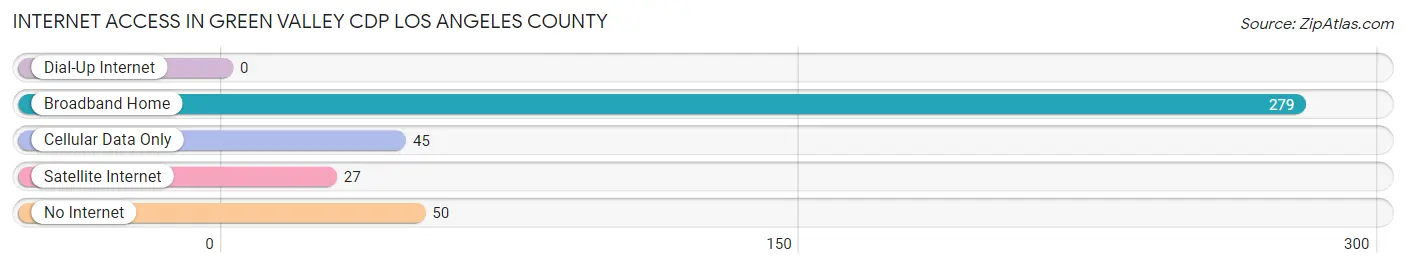
| Internet Type | # Households | % Households |
| Dial-Up Internet | 0 | 0.0% |
| Broadband Home | 279 | 71.5% |
| Cellular Data Only | 45 | 11.5% |
| Satellite Internet | 27 | 6.9% |
| No Internet | 50 | 12.8% |
| Total | 390 | 100.0% |
Green Valley CDP Los Angeles County Summary
History
Green Valley is a census-designated place (CDP) located in Los Angeles County, California. It is located in the San Gabriel Valley, approximately 20 miles east of downtown Los Angeles. The area was originally inhabited by the Tongva Native American tribe, who were the original inhabitants of the Los Angeles Basin. The area was first settled by Spanish missionaries in the late 1700s, and the area was later developed for agriculture. The area was known as "Green Valley" due to the abundance of green vegetation in the area.
The area was annexed by Los Angeles County in 1887, and the population began to grow rapidly. The area was primarily used for agriculture, and the population was largely made up of Mexican immigrants. The area was also home to a large number of Japanese immigrants, who were drawn to the area due to its agricultural opportunities.
In the early 1900s, the area began to experience rapid growth due to the development of the Los Angeles Aqueduct, which brought water to the area. This allowed for the development of the area's agricultural industry, and the population began to grow rapidly. By the 1950s, the area had become a popular residential area for middle-class families.
Geography
Green Valley is located in the San Gabriel Valley, approximately 20 miles east of downtown Los Angeles. The area is bordered by the cities of El Monte, South El Monte, and Baldwin Park to the north, and the cities of Covina and West Covina to the south. The area is located at an elevation of approximately 500 feet above sea level.
The area is primarily made up of residential neighborhoods, with some commercial and industrial areas. The area is home to several parks, including the Green Valley Park, which is a popular destination for outdoor recreation.
Economy
Green Valley has a diverse economy, with a mix of retail, manufacturing, and service industries. The area is home to several large employers, including the Los Angeles County Department of Public Works, the Los Angeles County Sheriff's Department, and the Los Angeles County Fire Department.
The area is also home to several small businesses, including restaurants, retail stores, and professional services. The area is also home to several industrial parks, which are home to a variety of manufacturing and distribution companies.
Demographics
As of the 2010 census, the population of Green Valley was 11,845. The population is primarily Hispanic, with a large percentage of Mexican immigrants. The median household income is $50,845, and the median home value is $521,000. The area is home to a large number of families, with a median age of 33.
Conclusion
Green Valley is a census-designated place located in Los Angeles County, California. The area was originally inhabited by the Tongva Native American tribe, and was later developed for agriculture. The area experienced rapid growth in the early 1900s due to the development of the Los Angeles Aqueduct, and the population has continued to grow since then. The area has a diverse economy, with a mix of retail, manufacturing, and service industries. The population is primarily Hispanic, with a large percentage of Mexican immigrants. The median household income is $50,845, and the median home value is $521,000.
Common Questions
What is Per Capita Income in Green Valley CDP Los Angeles County?
Per Capita income in Green Valley CDP Los Angeles County is $49,047.
What is the Median Family Income in Green Valley CDP Los Angeles County?
Median Family Income in Green Valley CDP Los Angeles County is $88,000.
What is the Median Household income in Green Valley CDP Los Angeles County?
Median Household Income in Green Valley CDP Los Angeles County is $82,083.
What is Income or Wage Gap in Green Valley CDP Los Angeles County?
Income or Wage Gap in Green Valley CDP Los Angeles County is 4.7%.
Women in Green Valley CDP Los Angeles County earn 95.3 cents for every dollar earned by a man.
What is Inequality or Gini Index in Green Valley CDP Los Angeles County?
Inequality or Gini Index in Green Valley CDP Los Angeles County is 0.46.
What is the Total Population of Green Valley CDP Los Angeles County?
Total Population of Green Valley CDP Los Angeles County is 832.
What is the Total Male Population of Green Valley CDP Los Angeles County?
Total Male Population of Green Valley CDP Los Angeles County is 453.
What is the Total Female Population of Green Valley CDP Los Angeles County?
Total Female Population of Green Valley CDP Los Angeles County is 379.
What is the Ratio of Males per 100 Females in Green Valley CDP Los Angeles County?
There are 119.53 Males per 100 Females in Green Valley CDP Los Angeles County.
What is the Ratio of Females per 100 Males in Green Valley CDP Los Angeles County?
There are 83.66 Females per 100 Males in Green Valley CDP Los Angeles County.
What is the Median Population Age in Green Valley CDP Los Angeles County?
Median Population Age in Green Valley CDP Los Angeles County is 45.8 Years.
What is the Average Family Size in Green Valley CDP Los Angeles County
Average Family Size in Green Valley CDP Los Angeles County is 2.6 People.
What is the Average Household Size in Green Valley CDP Los Angeles County
Average Household Size in Green Valley CDP Los Angeles County is 2.1 People.
How Large is the Labor Force in Green Valley CDP Los Angeles County?
There are 400 People in the Labor Forcein in Green Valley CDP Los Angeles County.
What is the Percentage of People in the Labor Force in Green Valley CDP Los Angeles County?
55.3% of People are in the Labor Force in Green Valley CDP Los Angeles County.
What is the Unemployment Rate in Green Valley CDP Los Angeles County?
Unemployment Rate in Green Valley CDP Los Angeles County is 14.3%.