Moraga, CA Map & Demographics
Moraga Map
Moraga Overview
$88,262
PER CAPITA INCOME
$245,451
AVG FAMILY INCOME
$193,707
AVG HOUSEHOLD INCOME
65.8%
WAGE / INCOME GAP [ % ]
34.2¢/ $1
WAGE / INCOME GAP [ $ ]
0.46
INEQUALITY / GINI INDEX
16,859
TOTAL POPULATION
8,020
MALE POPULATION
8,839
FEMALE POPULATION
90.73
MALES / 100 FEMALES
110.21
FEMALES / 100 MALES
41.3
MEDIAN AGE
3.1
AVG FAMILY SIZE
2.7
AVG HOUSEHOLD SIZE
7,871
LABOR FORCE [ PEOPLE ]
57.4%
PERCENT IN LABOR FORCE
5.3%
UNEMPLOYMENT RATE
Moraga Area Codes
Income in Moraga
Income Overview in Moraga
Per Capita Income in Moraga is $88,262, while median incomes of families and households are $245,451 and $193,707 respectively.
| Characteristic | Number | Measure |
| Per Capita Income | 16,859 | $88,262 |
| Median Family Income | 4,173 | $245,451 |
| Mean Family Income | 4,173 | $307,677 |
| Median Household Income | 5,610 | $193,707 |
| Mean Household Income | 5,610 | $259,468 |
| Income Deficit | 4,173 | $0 |
| Wage / Income Gap (%) | 16,859 | 65.77% |
| Wage / Income Gap ($) | 16,859 | 34.23¢ per $1 |
| Gini / Inequality Index | 16,859 | 0.46 |
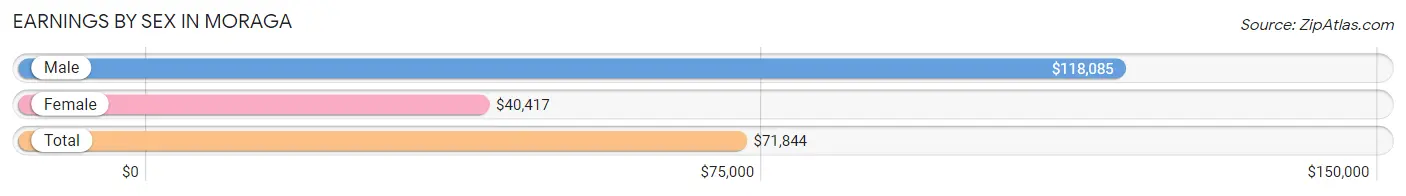
Earnings by Sex in Moraga
Average Earnings in Moraga are $71,844, $118,085 for men and $40,417 for women, a difference of 65.8%.
| Sex | Number | Average Earnings |
| Male | 4,228 (49.1%) | $118,085 |
| Female | 4,386 (50.9%) | $40,417 |
| Total | 8,614 (100.0%) | $71,844 |
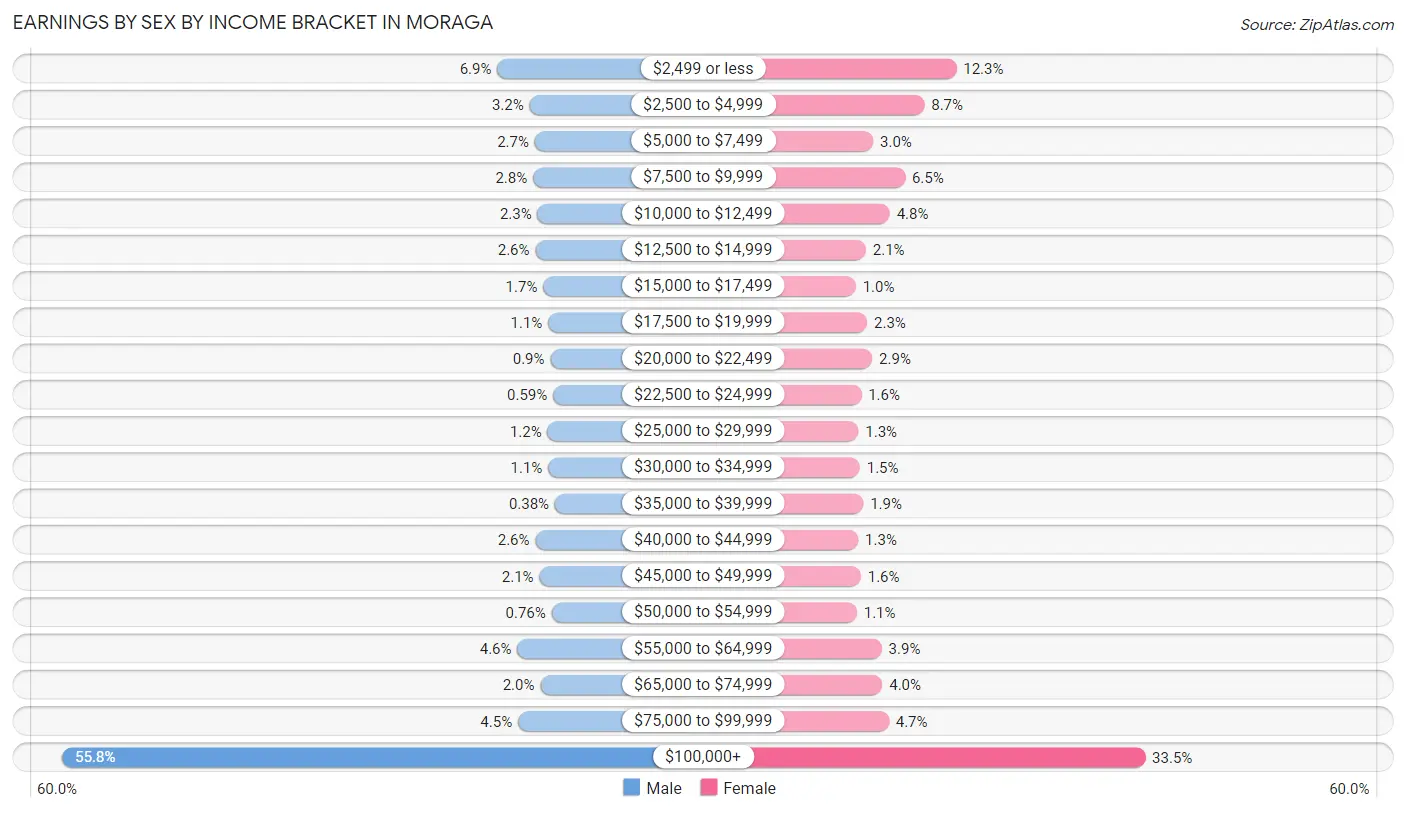
Earnings by Sex by Income Bracket in Moraga
The most common earnings brackets in Moraga are $100,000+ for men (2,359 | 55.8%) and $100,000+ for women (1,471 | 33.5%).
| Income | Male | Female |
| $2,499 or less | 290 (6.9%) | 540 (12.3%) |
| $2,500 to $4,999 | 137 (3.2%) | 382 (8.7%) |
| $5,000 to $7,499 | 112 (2.6%) | 130 (3.0%) |
| $7,500 to $9,999 | 120 (2.8%) | 287 (6.5%) |
| $10,000 to $12,499 | 99 (2.3%) | 212 (4.8%) |
| $12,500 to $14,999 | 109 (2.6%) | 94 (2.1%) |
| $15,000 to $17,499 | 72 (1.7%) | 44 (1.0%) |
| $17,500 to $19,999 | 48 (1.1%) | 100 (2.3%) |
| $20,000 to $22,499 | 38 (0.9%) | 125 (2.9%) |
| $22,500 to $24,999 | 25 (0.6%) | 71 (1.6%) |
| $25,000 to $29,999 | 51 (1.2%) | 57 (1.3%) |
| $30,000 to $34,999 | 48 (1.1%) | 64 (1.5%) |
| $35,000 to $39,999 | 16 (0.4%) | 81 (1.8%) |
| $40,000 to $44,999 | 109 (2.6%) | 56 (1.3%) |
| $45,000 to $49,999 | 90 (2.1%) | 69 (1.6%) |
| $50,000 to $54,999 | 32 (0.8%) | 49 (1.1%) |
| $55,000 to $64,999 | 195 (4.6%) | 172 (3.9%) |
| $65,000 to $74,999 | 86 (2.0%) | 175 (4.0%) |
| $75,000 to $99,999 | 192 (4.5%) | 207 (4.7%) |
| $100,000+ | 2,359 (55.8%) | 1,471 (33.5%) |
| Total | 4,228 (100.0%) | 4,386 (100.0%) |
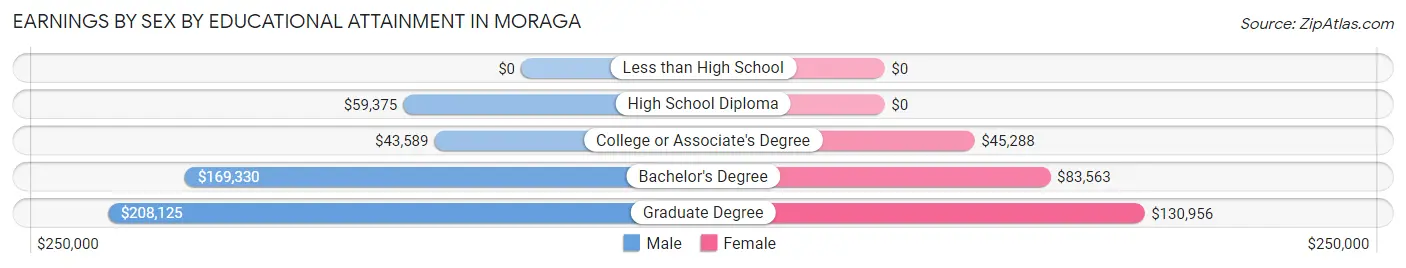
Earnings by Sex by Educational Attainment in Moraga
Average earnings in Moraga are $165,179 for men and $84,254 for women, a difference of 49.0%. Men with an educational attainment of graduate degree enjoy the highest average annual earnings of $208,125, while those with college or associate's degree education earn the least with $43,589. Women with an educational attainment of graduate degree earn the most with the average annual earnings of $130,956, while those with college or associate's degree education have the smallest earnings of $45,288.
| Educational Attainment | Male Income | Female Income |
| Less than High School | - | - |
| High School Diploma | $59,375 | $0 |
| College or Associate's Degree | $43,589 | $45,288 |
| Bachelor's Degree | $169,330 | $83,563 |
| Graduate Degree | $208,125 | $130,956 |
| Total | $165,179 | $84,254 |
Family Income in Moraga
Family Income Brackets in Moraga
According to the Moraga family income data, there are 2,483 families falling into the $200,000+ income range, which is the most common income bracket and makes up 59.5% of all families. Conversely, the $10,000 to $14,999 income bracket is the least frequent group with only 21 families (0.5%) belonging to this category.
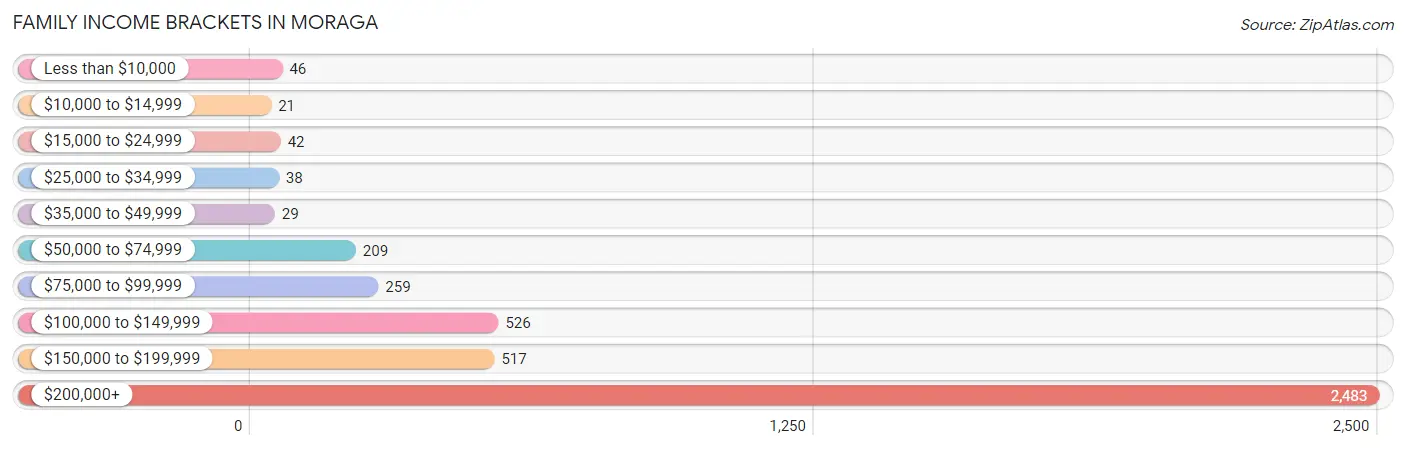
| Income Bracket | # Families | % Families |
| Less than $10,000 | 46 | 1.1% |
| $10,000 to $14,999 | 21 | 0.5% |
| $15,000 to $24,999 | 42 | 1.0% |
| $25,000 to $34,999 | 38 | 0.9% |
| $35,000 to $49,999 | 29 | 0.7% |
| $50,000 to $74,999 | 209 | 5.0% |
| $75,000 to $99,999 | 259 | 6.2% |
| $100,000 to $149,999 | 526 | 12.6% |
| $150,000 to $199,999 | 517 | 12.4% |
| $200,000+ | 2,483 | 59.5% |
Family Income by Famaliy Size in Moraga
3-person families (847 | 20.3%) account for the highest median family income in Moraga with $250,001 per family, while 2-person families (1,906 | 45.7%) have the highest median income of $101,042 per family member.
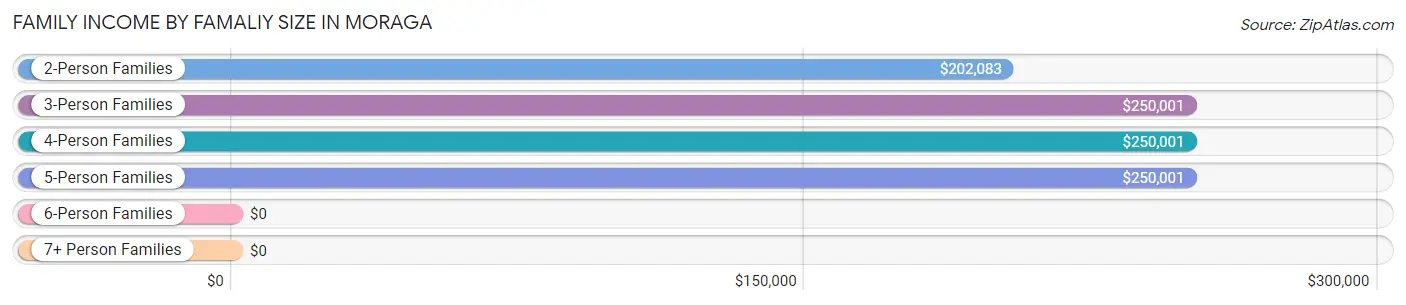
| Income Bracket | # Families | Median Income |
| 2-Person Families | 1,906 (45.7%) | $202,083 |
| 3-Person Families | 847 (20.3%) | $250,001 |
| 4-Person Families | 1,033 (24.7%) | $250,001 |
| 5-Person Families | 276 (6.6%) | $250,001 |
| 6-Person Families | 97 (2.3%) | $0 |
| 7+ Person Families | 14 (0.3%) | $0 |
| Total | 4,173 (100.0%) | $245,451 |
Family Income by Number of Earners in Moraga
The median family income in Moraga is $245,451, with families comprising 2 earners (1,818) having the highest median family income of $250,001, while families with no earners (690) have the lowest median family income of $153,333, accounting for 43.6% and 16.5% of families, respectively.
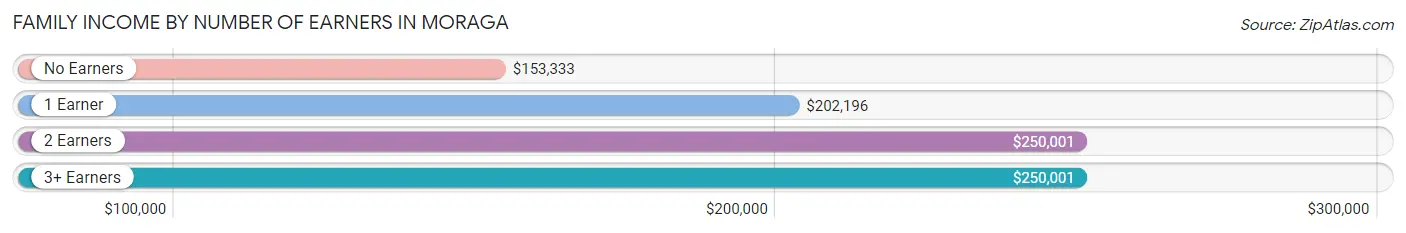
| Number of Earners | # Families | Median Income |
| No Earners | 690 (16.5%) | $153,333 |
| 1 Earner | 1,361 (32.6%) | $202,196 |
| 2 Earners | 1,818 (43.6%) | $250,001 |
| 3+ Earners | 304 (7.3%) | $250,001 |
| Total | 4,173 (100.0%) | $245,451 |
Household Income in Moraga
Household Income Brackets in Moraga
With 2,760 households falling in the category, the $200,000+ income range is the most frequent in Moraga, accounting for 49.2% of all households. In contrast, only 84 households (1.5%) fall into the $25,000 to $34,999 income bracket, making it the least populous group.
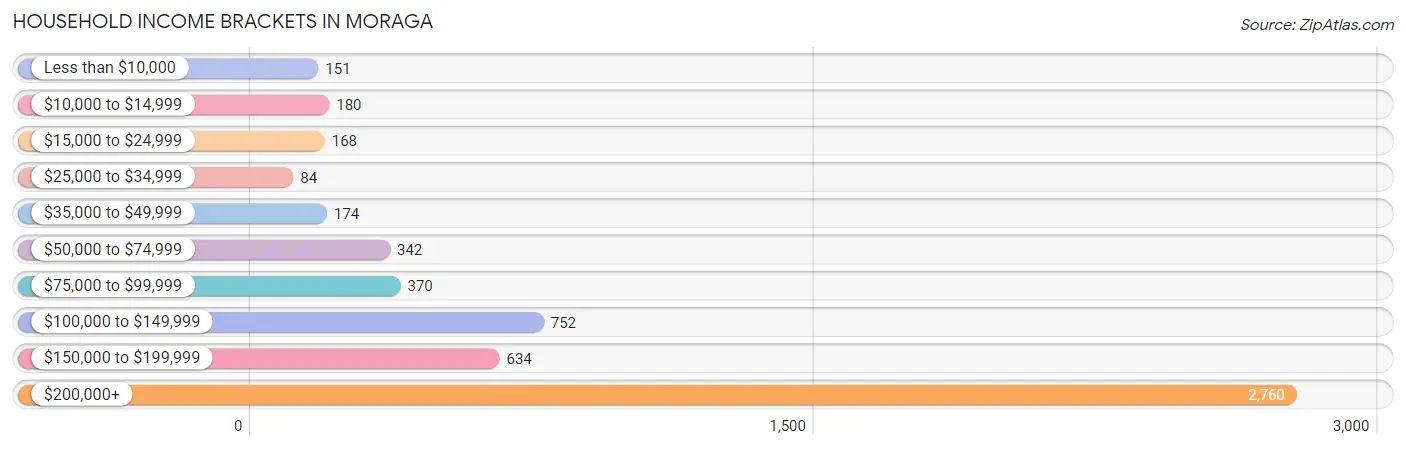
| Income Bracket | # Households | % Households |
| Less than $10,000 | 151 | 2.7% |
| $10,000 to $14,999 | 180 | 3.2% |
| $15,000 to $24,999 | 168 | 3.0% |
| $25,000 to $34,999 | 84 | 1.5% |
| $35,000 to $49,999 | 174 | 3.1% |
| $50,000 to $74,999 | 342 | 6.1% |
| $75,000 to $99,999 | 370 | 6.6% |
| $100,000 to $149,999 | 752 | 13.4% |
| $150,000 to $199,999 | 634 | 11.3% |
| $200,000+ | 2,760 | 49.2% |
Household Income by Householder Age in Moraga
The median household income in Moraga is $193,707, with the highest median household income of $250,001 found in the 45 to 64 years age bracket for the primary householder. A total of 2,141 households (38.2%) fall into this category. Meanwhile, the 15 to 24 years age bracket for the primary householder has the lowest median household income of $16,186, with 228 households (4.1%) in this group.
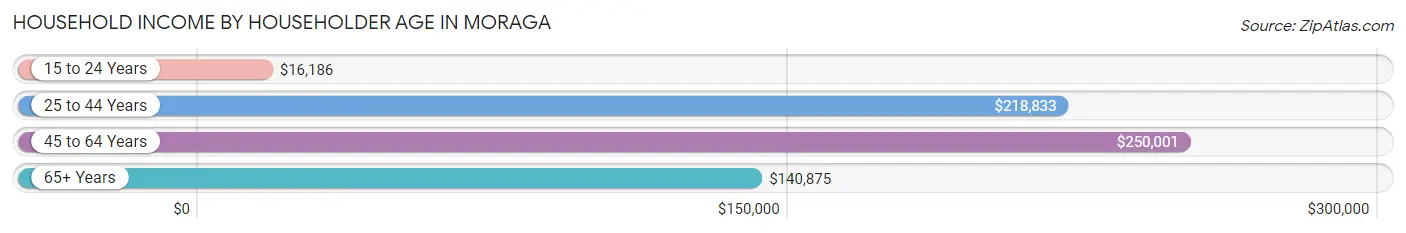
| Income Bracket | # Households | Median Income |
| 15 to 24 Years | 228 (4.1%) | $16,186 |
| 25 to 44 Years | 1,106 (19.7%) | $218,833 |
| 45 to 64 Years | 2,141 (38.2%) | $250,001 |
| 65+ Years | 2,135 (38.1%) | $140,875 |
| Total | 5,610 (100.0%) | $193,707 |
Poverty in Moraga
Income Below Poverty by Sex and Age in Moraga
With 6.3% poverty level for males and 9.2% for females among the residents of Moraga, 18 to 24 year old males and 18 to 24 year old females are the most vulnerable to poverty, with 182 males (26.9%) and 341 females (53.8%) in their respective age groups living below the poverty level.
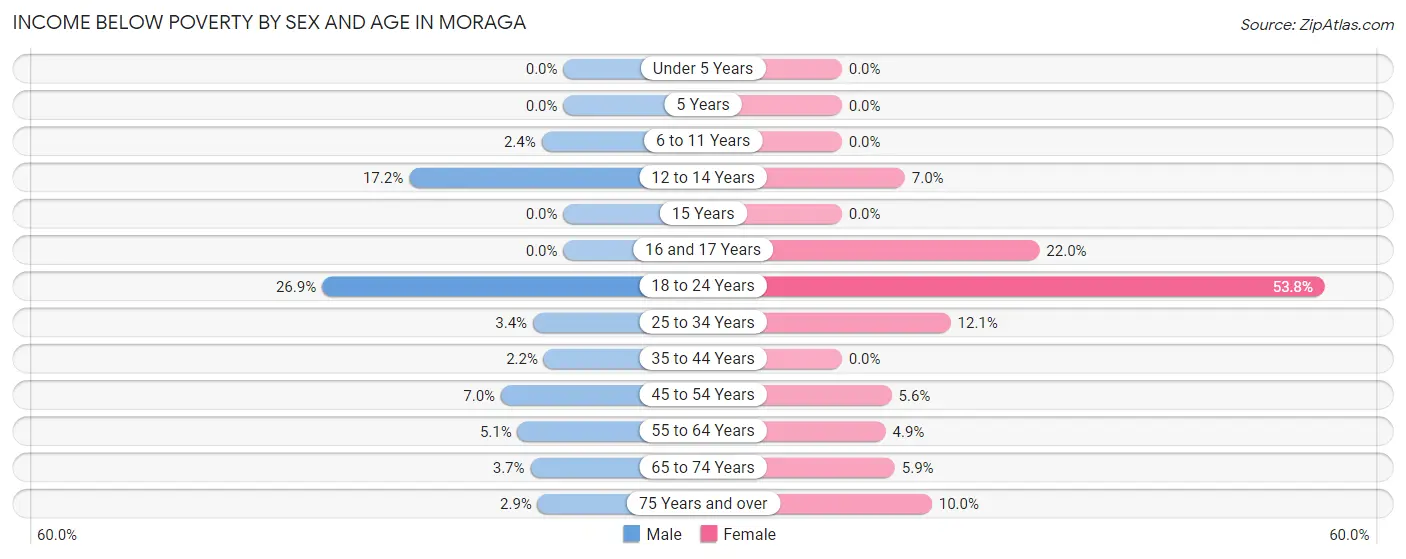
| Age Bracket | Male | Female |
| Under 5 Years | 0 (0.0%) | 0 (0.0%) |
| 5 Years | 0 (0.0%) | 0 (0.0%) |
| 6 to 11 Years | 16 (2.4%) | 0 (0.0%) |
| 12 to 14 Years | 66 (17.2%) | 28 (7.0%) |
| 15 Years | 0 (0.0%) | 0 (0.0%) |
| 16 and 17 Years | 0 (0.0%) | 35 (22.0%) |
| 18 to 24 Years | 182 (26.9%) | 341 (53.8%) |
| 25 to 34 Years | 13 (3.4%) | 52 (12.1%) |
| 35 to 44 Years | 22 (2.2%) | 0 (0.0%) |
| 45 to 54 Years | 64 (7.0%) | 64 (5.6%) |
| 55 to 64 Years | 48 (5.1%) | 54 (4.9%) |
| 65 to 74 Years | 34 (3.7%) | 54 (5.9%) |
| 75 Years and over | 22 (2.9%) | 90 (10.0%) |
| Total | 467 (6.3%) | 718 (9.2%) |
Income Above Poverty by Sex and Age in Moraga
According to the poverty statistics in Moraga, males aged under 5 years and females aged under 5 years are the age groups that are most secure financially, with 100.0% of males and 100.0% of females in these age groups living above the poverty line.
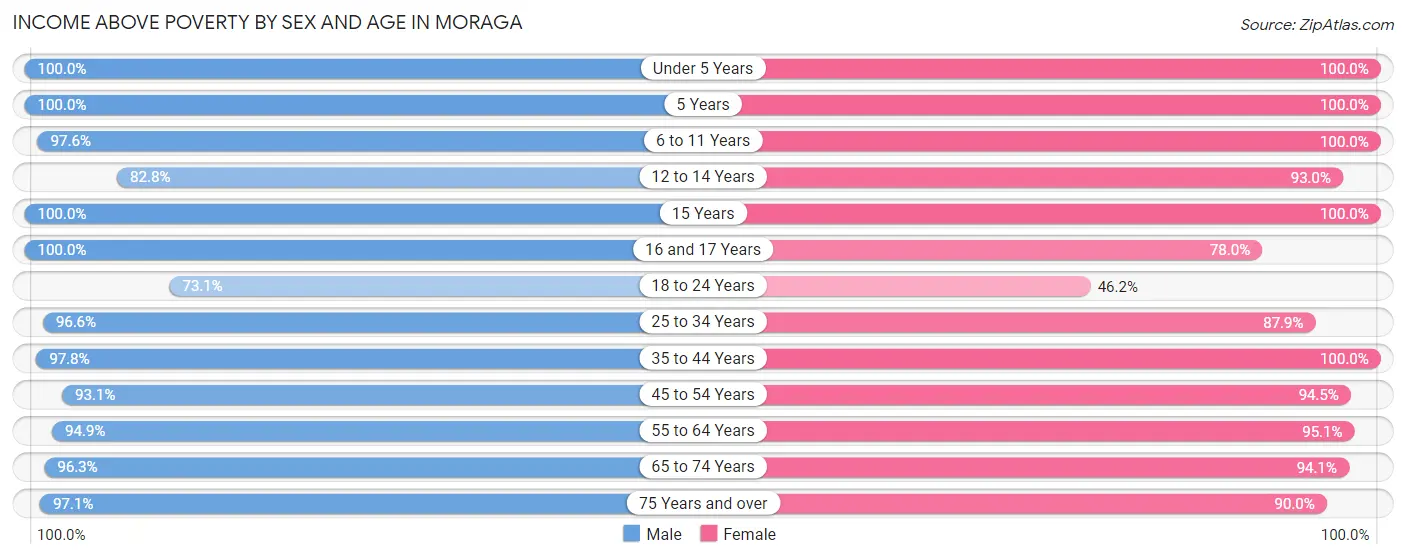
| Age Bracket | Male | Female |
| Under 5 Years | 428 (100.0%) | 304 (100.0%) |
| 5 Years | 55 (100.0%) | 103 (100.0%) |
| 6 to 11 Years | 642 (97.6%) | 532 (100.0%) |
| 12 to 14 Years | 318 (82.8%) | 371 (93.0%) |
| 15 Years | 95 (100.0%) | 189 (100.0%) |
| 16 and 17 Years | 193 (100.0%) | 124 (78.0%) |
| 18 to 24 Years | 495 (73.1%) | 293 (46.2%) |
| 25 to 34 Years | 370 (96.6%) | 377 (87.9%) |
| 35 to 44 Years | 987 (97.8%) | 960 (100.0%) |
| 45 to 54 Years | 857 (93.0%) | 1,090 (94.5%) |
| 55 to 64 Years | 894 (94.9%) | 1,053 (95.1%) |
| 65 to 74 Years | 892 (96.3%) | 860 (94.1%) |
| 75 Years and over | 747 (97.1%) | 808 (90.0%) |
| Total | 6,973 (93.7%) | 7,064 (90.8%) |
Income Below Poverty Among Married-Couple Families in Moraga
The poverty statistics for married-couple families in Moraga show that 2.4% or 87 of the total 3,679 families live below the poverty line. Families with 3 or 4 children have the highest poverty rate of 6.4%, comprising of 15 families. On the other hand, families with 5 or more children have the lowest poverty rate of 0.0%, which includes 0 families.
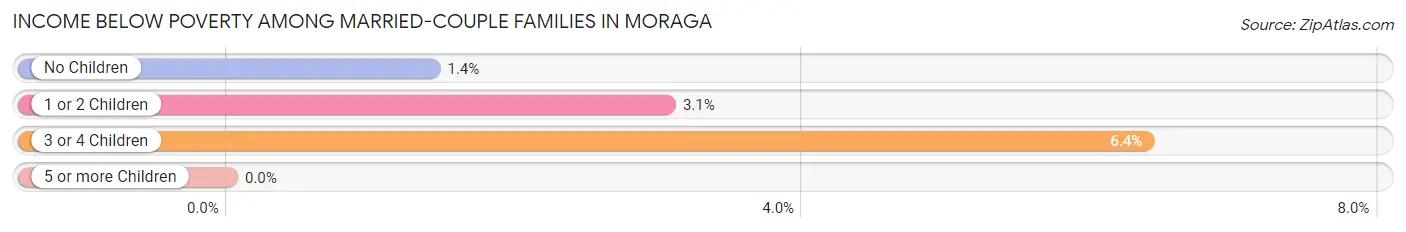
| Children | Above Poverty | Below Poverty |
| No Children | 1,963 (98.6%) | 28 (1.4%) |
| 1 or 2 Children | 1,398 (97.0%) | 44 (3.0%) |
| 3 or 4 Children | 220 (93.6%) | 15 (6.4%) |
| 5 or more Children | 11 (100.0%) | 0 (0.0%) |
| Total | 3,592 (97.6%) | 87 (2.4%) |
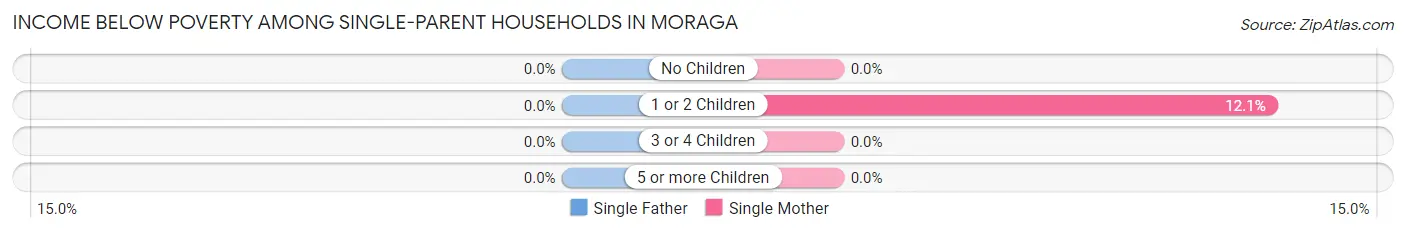
Income Below Poverty Among Single-Parent Households in Moraga
| Children | Single Father | Single Mother |
| No Children | 0 (0.0%) | 0 (0.0%) |
| 1 or 2 Children | 0 (0.0%) | 20 (12.1%) |
| 3 or 4 Children | 0 (0.0%) | 0 (0.0%) |
| 5 or more Children | 0 (0.0%) | 0 (0.0%) |
| Total | 0 (0.0%) | 20 (5.4%) |
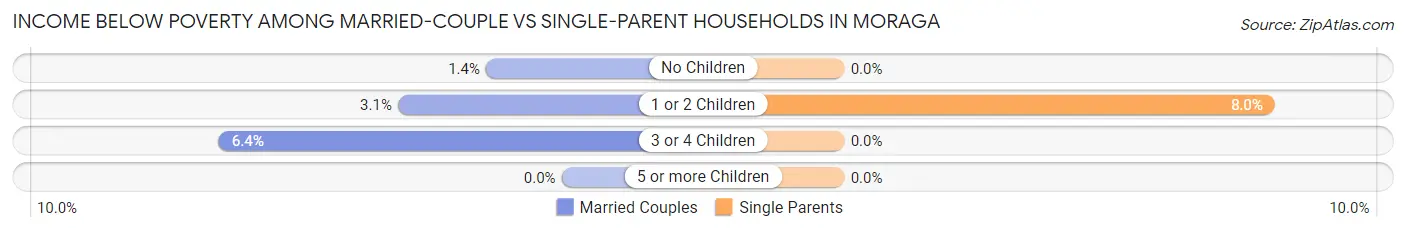
Income Below Poverty Among Married-Couple vs Single-Parent Households in Moraga
The poverty data for Moraga shows that 87 of the married-couple family households (2.4%) and 20 of the single-parent households (4.1%) are living below the poverty level. Within the married-couple family households, those with 3 or 4 children have the highest poverty rate, with 15 households (6.4%) falling below the poverty line. Among the single-parent households, those with 1 or 2 children have the highest poverty rate, with 20 household (8.0%) living below poverty.
| Children | Married-Couple Families | Single-Parent Households |
| No Children | 28 (1.4%) | 0 (0.0%) |
| 1 or 2 Children | 44 (3.0%) | 20 (8.0%) |
| 3 or 4 Children | 15 (6.4%) | 0 (0.0%) |
| 5 or more Children | 0 (0.0%) | 0 (0.0%) |
| Total | 87 (2.4%) | 20 (4.1%) |
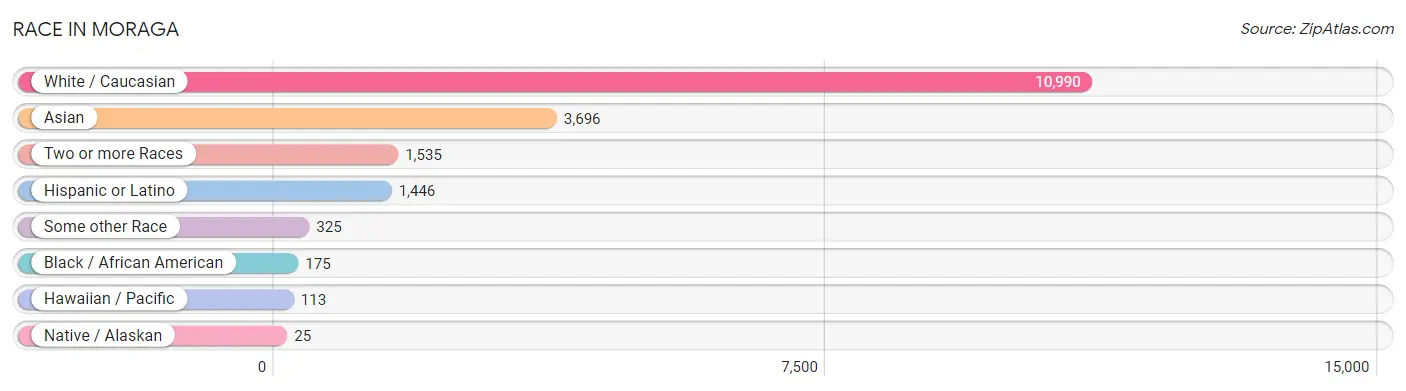
Race in Moraga
The most populous races in Moraga are White / Caucasian (10,990 | 65.2%), Asian (3,696 | 21.9%), and Two or more Races (1,535 | 9.1%).
| Race | # Population | % Population |
| Asian | 3,696 | 21.9% |
| Black / African American | 175 | 1.0% |
| Hawaiian / Pacific | 113 | 0.7% |
| Hispanic or Latino | 1,446 | 8.6% |
| Native / Alaskan | 25 | 0.2% |
| White / Caucasian | 10,990 | 65.2% |
| Two or more Races | 1,535 | 9.1% |
| Some other Race | 325 | 1.9% |
| Total | 16,859 | 100.0% |
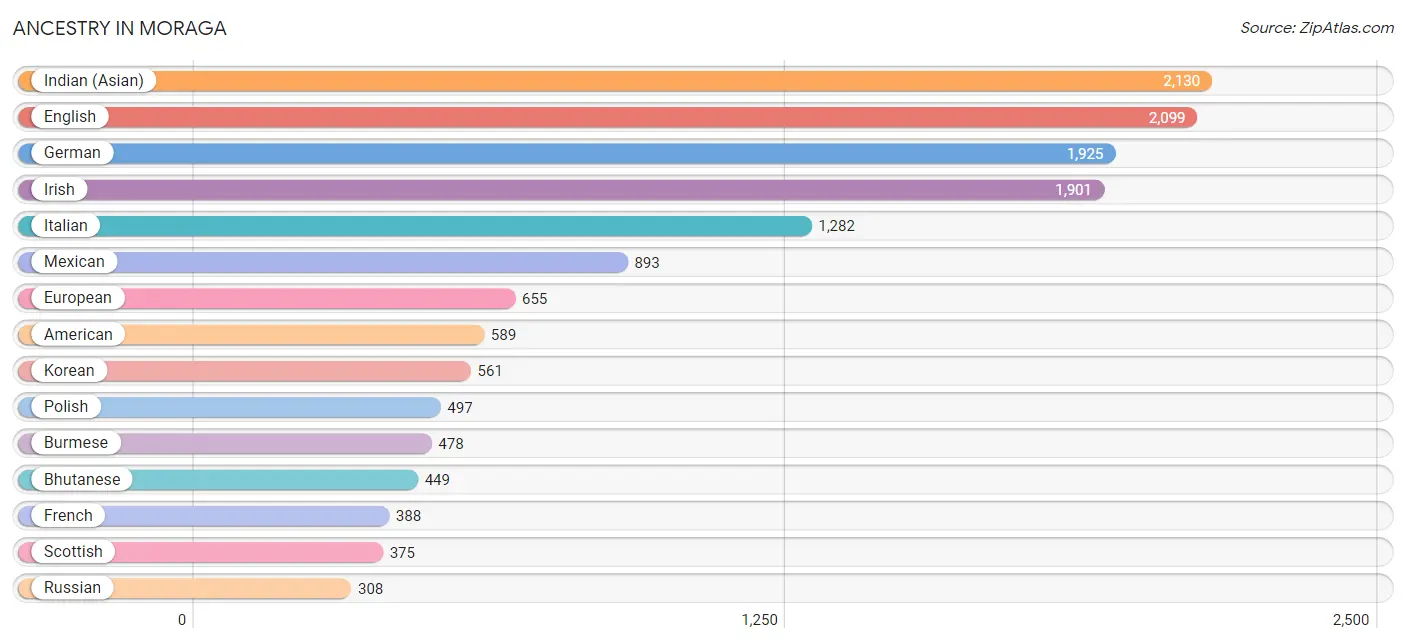
Ancestry in Moraga
The most populous ancestries reported in Moraga are Indian (Asian) (2,130 | 12.6%), English (2,099 | 12.4%), German (1,925 | 11.4%), Irish (1,901 | 11.3%), and Italian (1,282 | 7.6%), together accounting for 55.4% of all Moraga residents.
| Ancestry | # Population | % Population |
| African | 35 | 0.2% |
| American | 589 | 3.5% |
| Arab | 69 | 0.4% |
| Argentinean | 18 | 0.1% |
| Armenian | 38 | 0.2% |
| Australian | 22 | 0.1% |
| Austrian | 128 | 0.8% |
| Basque | 63 | 0.4% |
| Belgian | 19 | 0.1% |
| Bhutanese | 449 | 2.7% |
| Blackfeet | 14 | 0.1% |
| Brazilian | 15 | 0.1% |
| British | 87 | 0.5% |
| Burmese | 478 | 2.8% |
| Cambodian | 58 | 0.3% |
| Canadian | 64 | 0.4% |
| Celtic | 28 | 0.2% |
| Central American | 52 | 0.3% |
| Cherokee | 14 | 0.1% |
| Chilean | 36 | 0.2% |
| Choctaw | 9 | 0.1% |
| Colombian | 7 | 0.0% |
| Croatian | 43 | 0.3% |
| Cuban | 28 | 0.2% |
| Czech | 49 | 0.3% |
| Czechoslovakian | 7 | 0.0% |
| Danish | 128 | 0.8% |
| Dutch | 160 | 0.9% |
| Eastern European | 232 | 1.4% |
| Egyptian | 16 | 0.1% |
| English | 2,099 | 12.4% |
| Estonian | 14 | 0.1% |
| European | 655 | 3.9% |
| Filipino | 129 | 0.8% |
| Finnish | 70 | 0.4% |
| French | 388 | 2.3% |
| French Canadian | 101 | 0.6% |
| German | 1,925 | 11.4% |
| Greek | 86 | 0.5% |
| Guamanian / Chamorro | 67 | 0.4% |
| Hopi | 19 | 0.1% |
| Hungarian | 113 | 0.7% |
| Icelander | 10 | 0.1% |
| Indian (Asian) | 2,130 | 12.6% |
| Iranian | 86 | 0.5% |
| Irish | 1,901 | 11.3% |
| Israeli | 58 | 0.3% |
| Italian | 1,282 | 7.6% |
| Korean | 561 | 3.3% |
| Laotian | 245 | 1.5% |
| Lebanese | 24 | 0.1% |
| Lithuanian | 89 | 0.5% |
| Mexican | 893 | 5.3% |
| Mexican American Indian | 14 | 0.1% |
| Moroccan | 10 | 0.1% |
| Native Hawaiian | 100 | 0.6% |
| Nicaraguan | 27 | 0.2% |
| Northern European | 102 | 0.6% |
| Norwegian | 207 | 1.2% |
| Pakistani | 4 | 0.0% |
| Palestinian | 5 | 0.0% |
| Peruvian | 101 | 0.6% |
| Polish | 497 | 2.9% |
| Portuguese | 223 | 1.3% |
| Pueblo | 19 | 0.1% |
| Puerto Rican | 88 | 0.5% |
| Romanian | 103 | 0.6% |
| Russian | 308 | 1.8% |
| Salvadoran | 25 | 0.2% |
| Samoan | 51 | 0.3% |
| Scandinavian | 52 | 0.3% |
| Scotch-Irish | 196 | 1.2% |
| Scottish | 375 | 2.2% |
| Sioux | 1 | 0.0% |
| Slovak | 41 | 0.2% |
| Slovene | 46 | 0.3% |
| South African | 46 | 0.3% |
| South American | 162 | 1.0% |
| Spaniard | 87 | 0.5% |
| Spanish | 83 | 0.5% |
| Sri Lankan | 250 | 1.5% |
| Subsaharan African | 90 | 0.5% |
| Swedish | 248 | 1.5% |
| Swiss | 41 | 0.2% |
| Thai | 249 | 1.5% |
| Turkish | 92 | 0.5% |
| Ukrainian | 41 | 0.2% |
| Welsh | 83 | 0.5% | View All 88 Rows |
Immigrants in Moraga
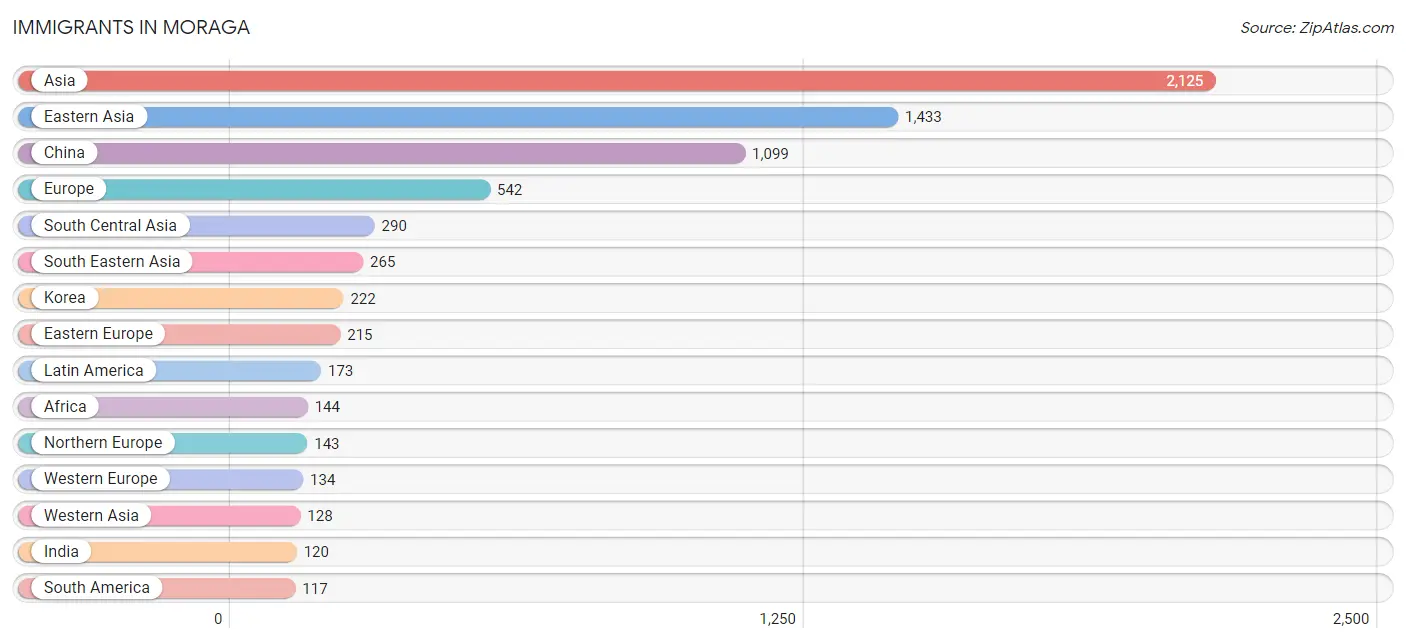
The most numerous immigrant groups reported in Moraga came from Asia (2,125 | 12.6%), Eastern Asia (1,433 | 8.5%), China (1,099 | 6.5%), Europe (542 | 3.2%), and South Central Asia (290 | 1.7%), together accounting for 32.6% of all Moraga residents.
| Immigration Origin | # Population | % Population |
| Africa | 144 | 0.9% |
| Asia | 2,125 | 12.6% |
| Australia | 39 | 0.2% |
| Belgium | 11 | 0.1% |
| Brazil | 36 | 0.2% |
| Cameroon | 33 | 0.2% |
| Canada | 93 | 0.5% |
| Caribbean | 13 | 0.1% |
| Central America | 43 | 0.3% |
| Chile | 35 | 0.2% |
| China | 1,099 | 6.5% |
| Colombia | 7 | 0.0% |
| Cuba | 13 | 0.1% |
| Denmark | 17 | 0.1% |
| Eastern Africa | 22 | 0.1% |
| Eastern Asia | 1,433 | 8.5% |
| Eastern Europe | 215 | 1.3% |
| Egypt | 10 | 0.1% |
| El Salvador | 5 | 0.0% |
| England | 64 | 0.4% |
| Europe | 542 | 3.2% |
| Fiji | 10 | 0.1% |
| France | 55 | 0.3% |
| Germany | 46 | 0.3% |
| Hong Kong | 84 | 0.5% |
| Hungary | 19 | 0.1% |
| India | 120 | 0.7% |
| Indonesia | 80 | 0.5% |
| Iran | 100 | 0.6% |
| Ireland | 8 | 0.1% |
| Israel | 34 | 0.2% |
| Italy | 28 | 0.2% |
| Japan | 54 | 0.3% |
| Korea | 222 | 1.3% |
| Latin America | 173 | 1.0% |
| Latvia | 6 | 0.0% |
| Lebanon | 16 | 0.1% |
| Lithuania | 4 | 0.0% |
| Mexico | 26 | 0.2% |
| Middle Africa | 33 | 0.2% |
| Nepal | 6 | 0.0% |
| Netherlands | 22 | 0.1% |
| Nicaragua | 12 | 0.1% |
| Northern Africa | 10 | 0.1% |
| Northern Europe | 143 | 0.9% |
| Oceania | 49 | 0.3% |
| Peru | 27 | 0.2% |
| Philippines | 91 | 0.5% |
| Poland | 25 | 0.2% |
| Portugal | 11 | 0.1% |
| Romania | 29 | 0.2% |
| Russia | 72 | 0.4% |
| Singapore | 12 | 0.1% |
| South Africa | 79 | 0.5% |
| South America | 117 | 0.7% |
| South Central Asia | 290 | 1.7% |
| South Eastern Asia | 265 | 1.6% |
| Southern Europe | 39 | 0.2% |
| Sweden | 14 | 0.1% |
| Taiwan | 94 | 0.6% |
| Turkey | 78 | 0.5% |
| Ukraine | 18 | 0.1% |
| Uzbekistan | 64 | 0.4% |
| Venezuela | 12 | 0.1% |
| Vietnam | 82 | 0.5% |
| Western Asia | 128 | 0.8% |
| Western Europe | 134 | 0.8% |
| Zimbabwe | 13 | 0.1% | View All 68 Rows |
Sex and Age in Moraga
Sex and Age in Moraga
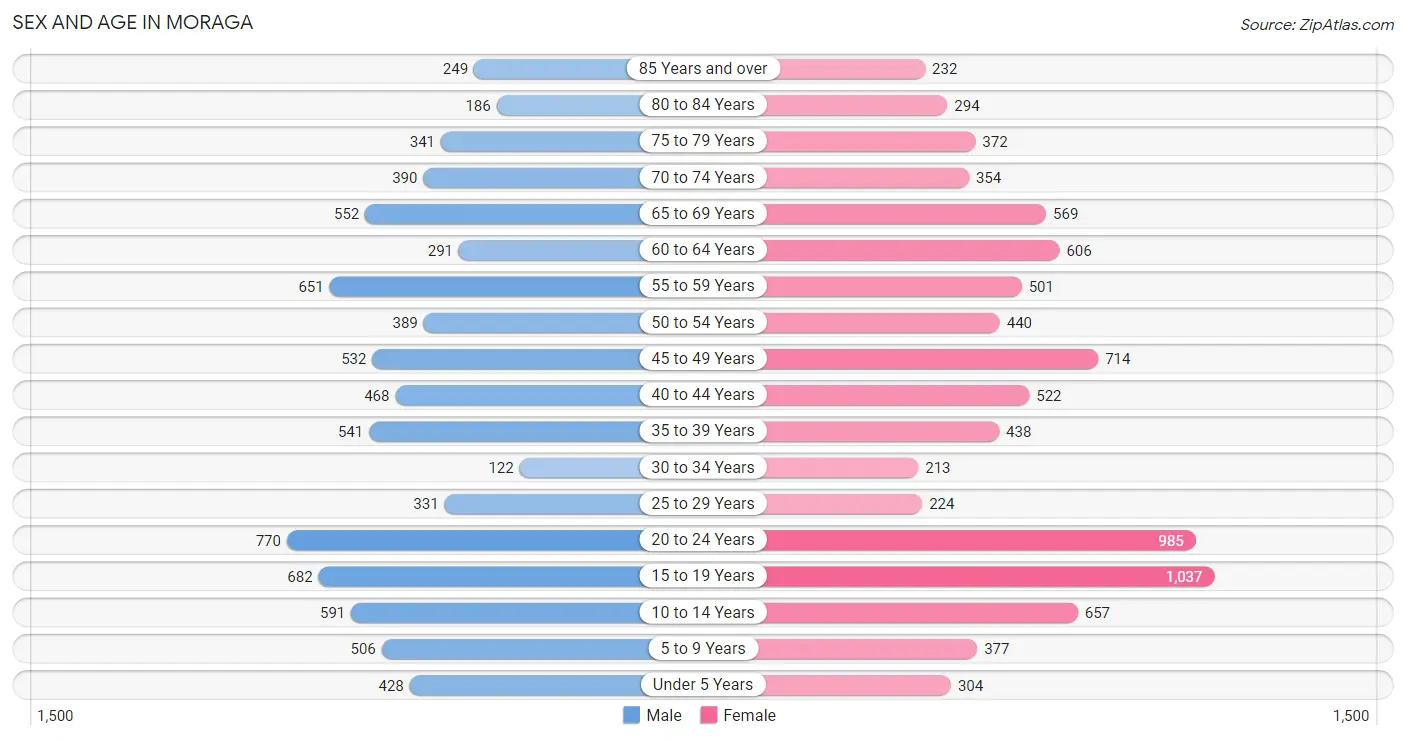
The most populous age groups in Moraga are 20 to 24 Years (770 | 9.6%) for men and 15 to 19 Years (1,037 | 11.7%) for women.
| Age Bracket | Male | Female |
| Under 5 Years | 428 (5.3%) | 304 (3.4%) |
| 5 to 9 Years | 506 (6.3%) | 377 (4.3%) |
| 10 to 14 Years | 591 (7.4%) | 657 (7.4%) |
| 15 to 19 Years | 682 (8.5%) | 1,037 (11.7%) |
| 20 to 24 Years | 770 (9.6%) | 985 (11.1%) |
| 25 to 29 Years | 331 (4.1%) | 224 (2.5%) |
| 30 to 34 Years | 122 (1.5%) | 213 (2.4%) |
| 35 to 39 Years | 541 (6.8%) | 438 (5.0%) |
| 40 to 44 Years | 468 (5.8%) | 522 (5.9%) |
| 45 to 49 Years | 532 (6.6%) | 714 (8.1%) |
| 50 to 54 Years | 389 (4.9%) | 440 (5.0%) |
| 55 to 59 Years | 651 (8.1%) | 501 (5.7%) |
| 60 to 64 Years | 291 (3.6%) | 606 (6.9%) |
| 65 to 69 Years | 552 (6.9%) | 569 (6.4%) |
| 70 to 74 Years | 390 (4.9%) | 354 (4.0%) |
| 75 to 79 Years | 341 (4.3%) | 372 (4.2%) |
| 80 to 84 Years | 186 (2.3%) | 294 (3.3%) |
| 85 Years and over | 249 (3.1%) | 232 (2.6%) |
| Total | 8,020 (100.0%) | 8,839 (100.0%) |
Families and Households in Moraga
Median Family Size in Moraga
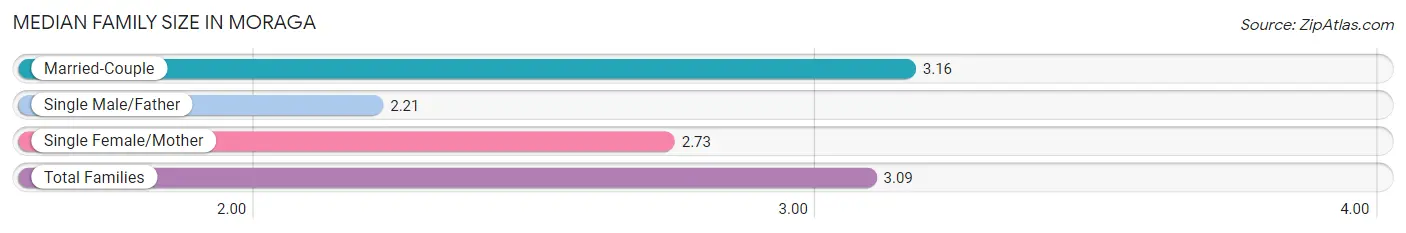
The median family size in Moraga is 3.09 persons per family, with married-couple families (3,679 | 88.2%) accounting for the largest median family size of 3.16 persons per family. On the other hand, single male/father families (121 | 2.9%) represent the smallest median family size with 2.21 persons per family.
| Family Type | # Families | Family Size |
| Married-Couple | 3,679 (88.2%) | 3.16 |
| Single Male/Father | 121 (2.9%) | 2.21 |
| Single Female/Mother | 373 (8.9%) | 2.73 |
| Total Families | 4,173 (100.0%) | 3.09 |
Median Household Size in Moraga
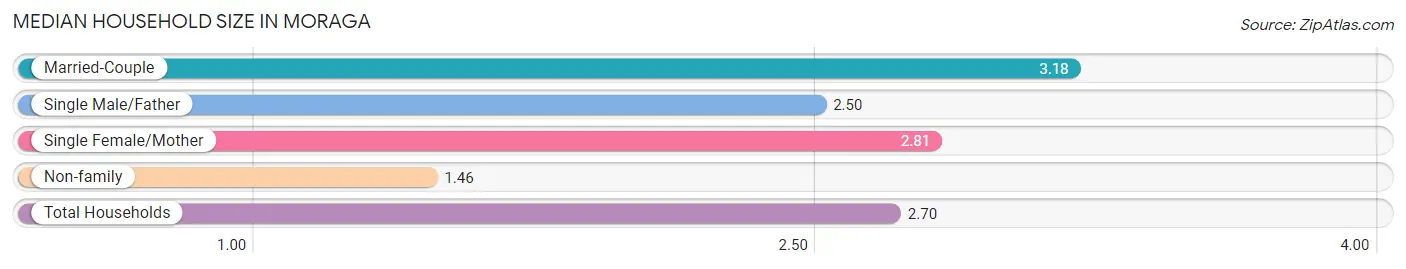
The median household size in Moraga is 2.70 persons per household, with married-couple households (3,679 | 65.6%) accounting for the largest median household size of 3.18 persons per household. non-family households (1,437 | 25.6%) represent the smallest median household size with 1.46 persons per household.
| Household Type | # Households | Household Size |
| Married-Couple | 3,679 (65.6%) | 3.18 |
| Single Male/Father | 121 (2.2%) | 2.50 |
| Single Female/Mother | 373 (6.7%) | 2.81 |
| Non-family | 1,437 (25.6%) | 1.46 |
| Total Households | 5,610 (100.0%) | 2.70 |
Household Size by Marriage Status in Moraga
Out of a total of 5,610 households in Moraga, 4,173 (74.4%) are family households, while 1,437 (25.6%) are nonfamily households. The most numerous type of family households are 2-person households, comprising 1,842, and the most common type of nonfamily households are 1-person households, comprising 1,023.
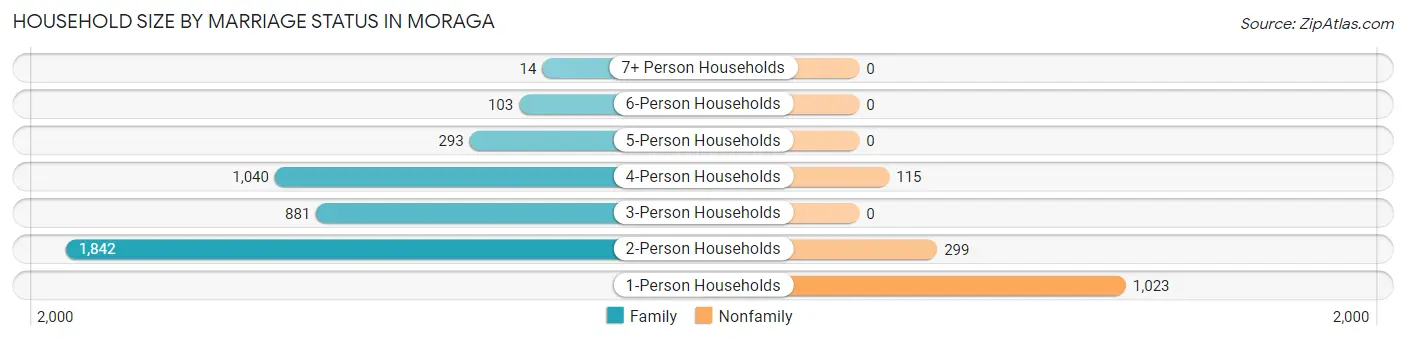
| Household Size | Family Households | Nonfamily Households |
| 1-Person Households | - | 1,023 (18.2%) |
| 2-Person Households | 1,842 (32.8%) | 299 (5.3%) |
| 3-Person Households | 881 (15.7%) | 0 (0.0%) |
| 4-Person Households | 1,040 (18.5%) | 115 (2.1%) |
| 5-Person Households | 293 (5.2%) | 0 (0.0%) |
| 6-Person Households | 103 (1.8%) | 0 (0.0%) |
| 7+ Person Households | 14 (0.3%) | 0 (0.0%) |
| Total | 4,173 (74.4%) | 1,437 (25.6%) |
Female Fertility in Moraga
Fertility by Age in Moraga
Average fertility rate in Moraga is 47.0 births per 1,000 women. Women in the age bracket of 35 to 50 years have the highest fertility rate with 65.0 births per 1,000 women. Women in the age bracket of 35 to 50 years acount for 58.7% of all women with births.
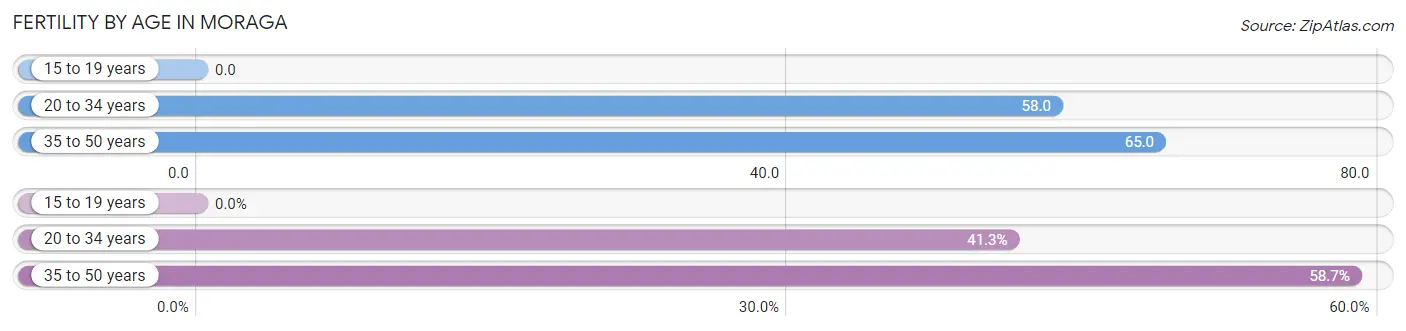
| Age Bracket | Women with Births | Births / 1,000 Women |
| 15 to 19 years | 0 (0.0%) | 0.0 |
| 20 to 34 years | 83 (41.3%) | 58.0 |
| 35 to 50 years | 118 (58.7%) | 65.0 |
| Total | 201 (100.0%) | 47.0 |
Fertility by Age by Marriage Status in Moraga
88.6% of women with births (201) in Moraga are married. The highest percentage of unmarried women with births falls into 20 to 34 years age bracket with 16.9% of them unmarried at the time of birth, while the lowest percentage of unmarried women with births belong to 35 to 50 years age bracket with 7.6% of them unmarried.
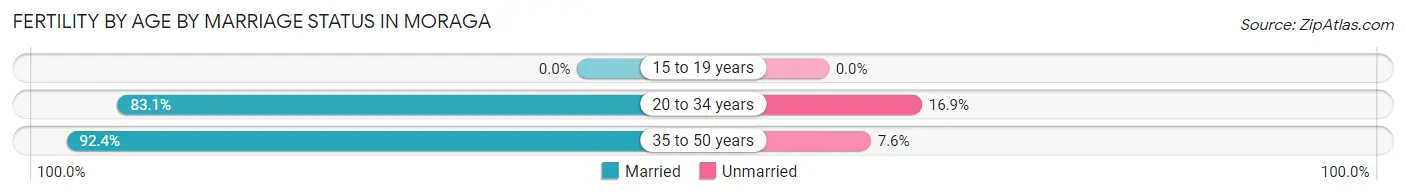
| Age Bracket | Married | Unmarried |
| 15 to 19 years | 0 (0.0%) | 0 (0.0%) |
| 20 to 34 years | 69 (83.1%) | 14 (16.9%) |
| 35 to 50 years | 109 (92.4%) | 9 (7.6%) |
| Total | 178 (88.6%) | 23 (11.4%) |
Fertility by Education in Moraga
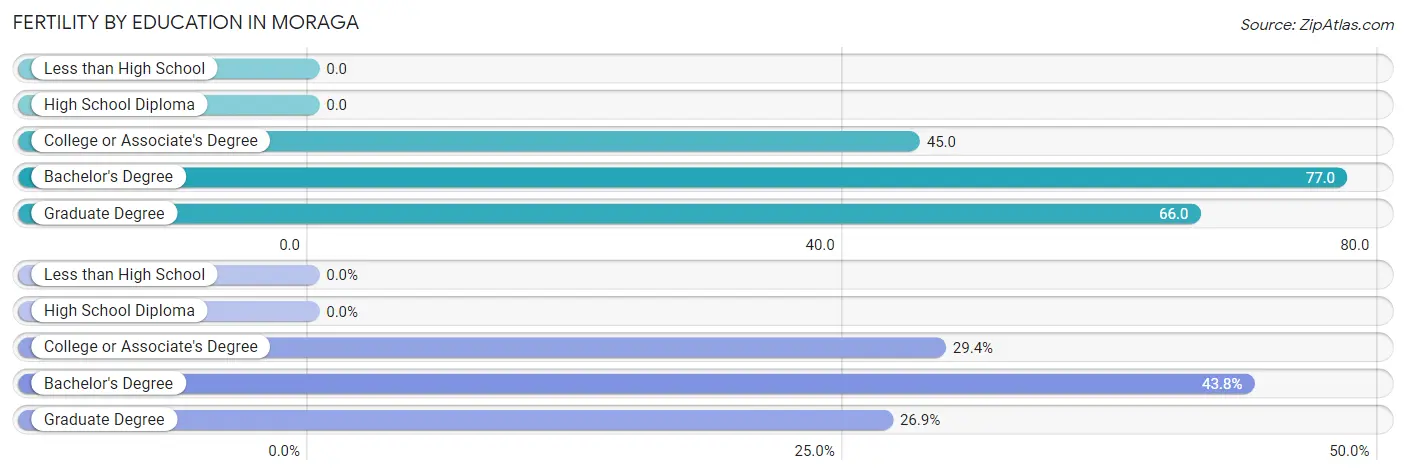
| Educational Attainment | Women with Births | Births / 1,000 Women |
| Less than High School | 0 (0.0%) | 0.0 |
| High School Diploma | 0 (0.0%) | 0.0 |
| College or Associate's Degree | 59 (29.3%) | 45.0 |
| Bachelor's Degree | 88 (43.8%) | 77.0 |
| Graduate Degree | 54 (26.9%) | 66.0 |
| Total | 201 (100.0%) | 47.0 |
Fertility by Education by Marriage Status in Moraga
11.4% of women with births in Moraga are unmarried. Women with the educational attainment of graduate degree are most likely to be married with 100.0% of them married at childbirth, while women with the educational attainment of college or associate's degree are least likely to be married with 23.7% of them unmarried at childbirth.
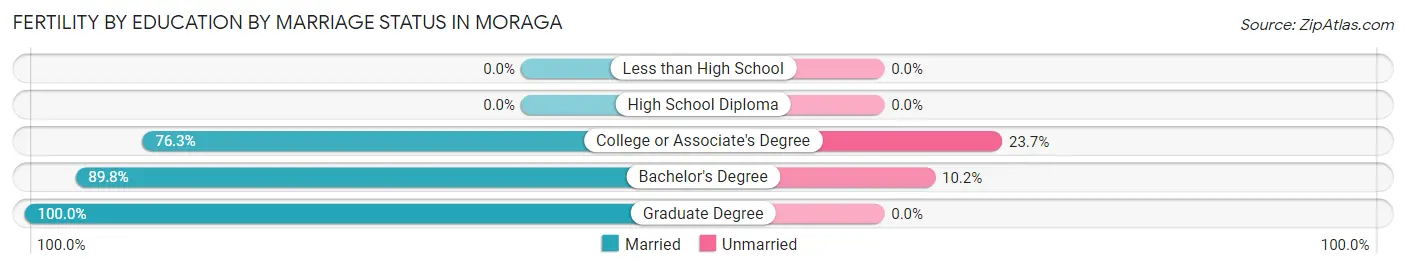
| Educational Attainment | Married | Unmarried |
| Less than High School | 0 (0.0%) | 0 (0.0%) |
| High School Diploma | 0 (0.0%) | 0 (0.0%) |
| College or Associate's Degree | 45 (76.3%) | 14 (23.7%) |
| Bachelor's Degree | 79 (89.8%) | 9 (10.2%) |
| Graduate Degree | 54 (100.0%) | 0 (0.0%) |
| Total | 178 (88.6%) | 23 (11.4%) |
Employment Characteristics in Moraga
Employment by Class of Employer in Moraga
Among the 7,307 employed individuals in Moraga, private company employees (4,614 | 63.1%), self-employed (not incorporated) (625 | 8.6%), and local government employees (597 | 8.2%) make up the most common classes of employment.
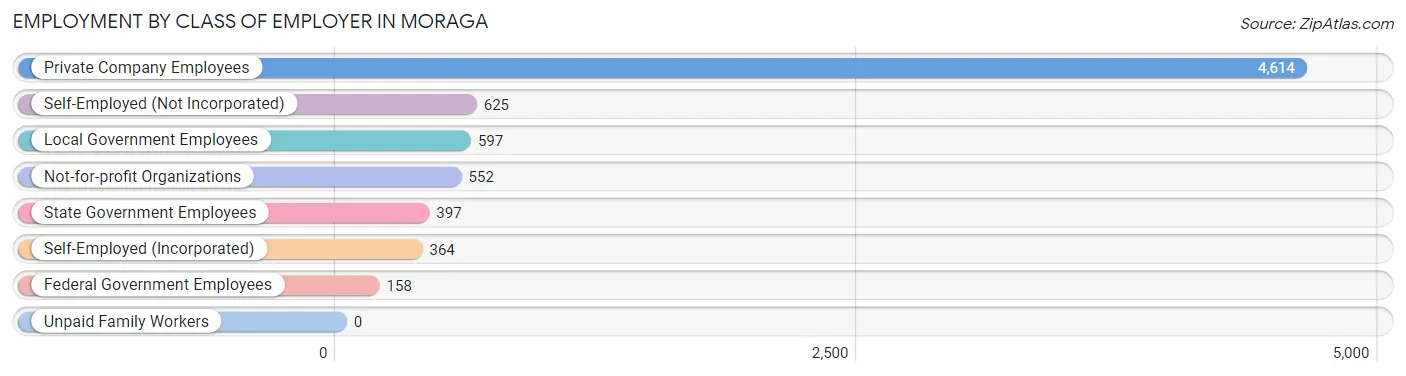
| Employer Class | # Employees | % Employees |
| Private Company Employees | 4,614 | 63.1% |
| Self-Employed (Incorporated) | 364 | 5.0% |
| Self-Employed (Not Incorporated) | 625 | 8.6% |
| Not-for-profit Organizations | 552 | 7.5% |
| Local Government Employees | 597 | 8.2% |
| State Government Employees | 397 | 5.4% |
| Federal Government Employees | 158 | 2.2% |
| Unpaid Family Workers | 0 | 0.0% |
| Total | 7,307 | 100.0% |
Employment Status by Age in Moraga
According to the labor force statistics for Moraga, out of the total population over 16 years of age (13,712), 57.4% or 7,871 individuals are in the labor force, with 5.3% or 417 of them unemployed. The age group with the highest labor force participation rate is 45 to 54 years, with 84.0% or 1,743 individuals in the labor force. Within the labor force, the 20 to 24 years age range has the highest percentage of unemployed individuals, with 13.2% or 137 of them being unemployed.
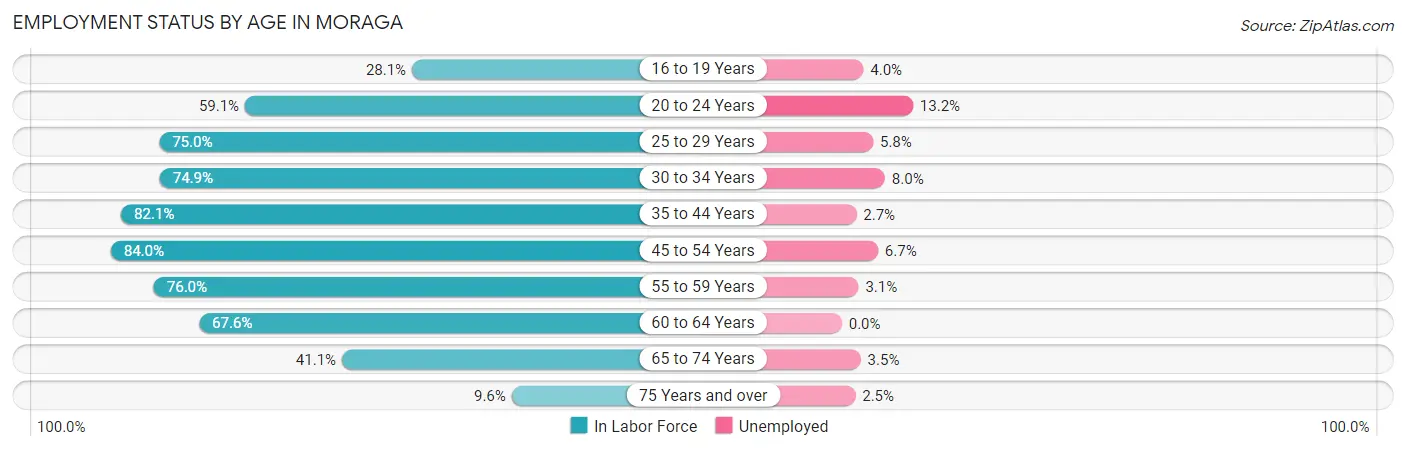
| Age Bracket | In Labor Force | Unemployed |
| 16 to 19 Years | 403 (28.1%) | 16 (4.0%) |
| 20 to 24 Years | 1,037 (59.1%) | 137 (13.2%) |
| 25 to 29 Years | 416 (75.0%) | 24 (5.8%) |
| 30 to 34 Years | 251 (74.9%) | 20 (8.0%) |
| 35 to 44 Years | 1,617 (82.1%) | 44 (2.7%) |
| 45 to 54 Years | 1,743 (84.0%) | 117 (6.7%) |
| 55 to 59 Years | 876 (76.0%) | 27 (3.1%) |
| 60 to 64 Years | 606 (67.6%) | 0 (0.0%) |
| 65 to 74 Years | 767 (41.1%) | 27 (3.5%) |
| 75 Years and over | 161 (9.6%) | 4 (2.5%) |
| Total | 7,871 (57.4%) | 417 (5.3%) |
Employment Status by Educational Attainment in Moraga
According to labor force statistics for Moraga, 78.9% of individuals (5,510) out of the total population between 25 and 64 years of age (6,983) are in the labor force, with 4.2% or 231 of them being unemployed. The group with the highest labor force participation rate are those with the educational attainment of high school diploma, with 84.4% or 152 individuals in the labor force. Within the labor force, individuals with less than high school education have the highest percentage of unemployment, with 41.7% or 10 of them being unemployed.
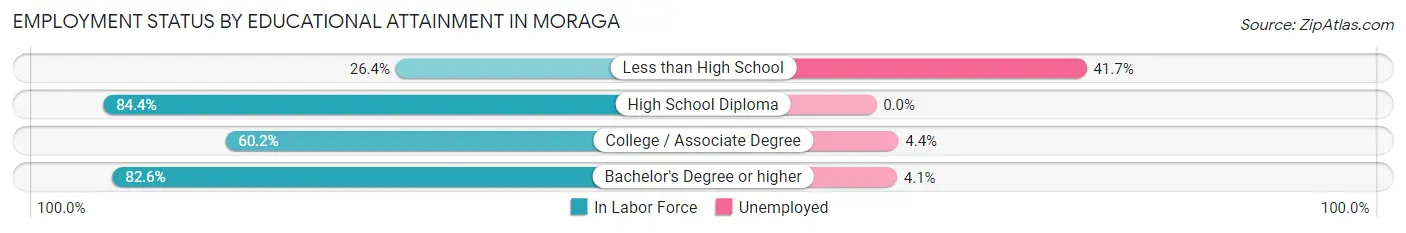
| Educational Attainment | In Labor Force | Unemployed |
| Less than High School | 24 (26.4%) | 38 (41.7%) |
| High School Diploma | 152 (84.4%) | 0 (0.0%) |
| College / Associate Degree | 571 (60.2%) | 42 (4.4%) |
| Bachelor's Degree or higher | 4,760 (82.6%) | 236 (4.1%) |
| Total | 5,510 (78.9%) | 293 (4.2%) |
Employment Occupations by Sex in Moraga
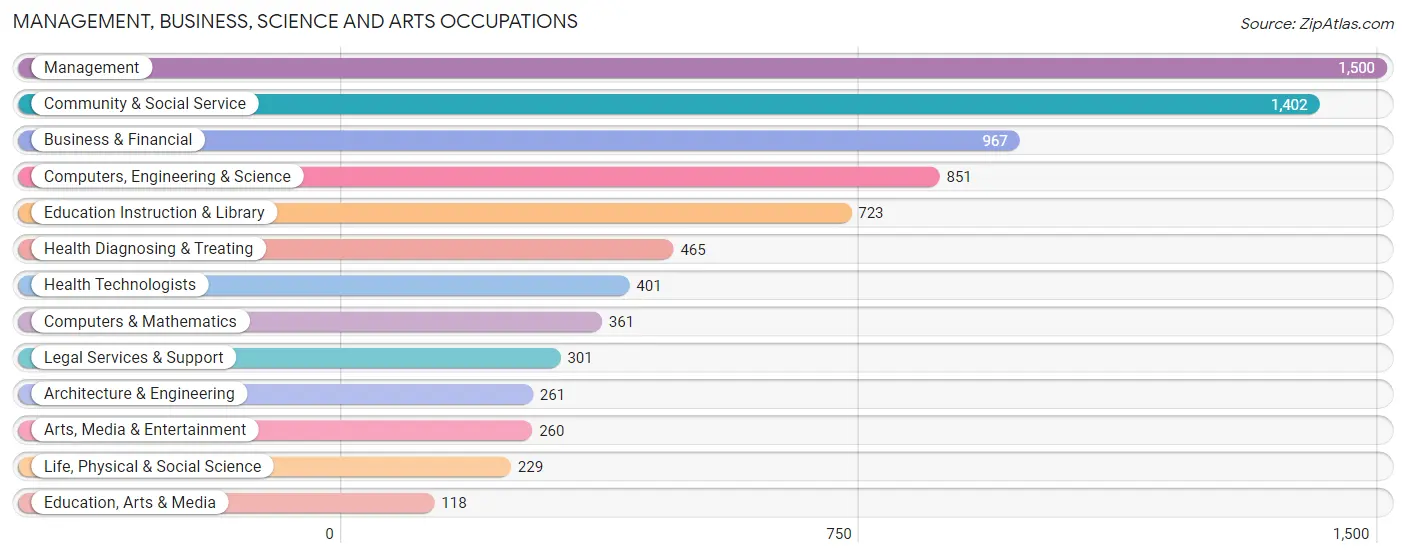
Management, Business, Science and Arts Occupations
The most common Management, Business, Science and Arts occupations in Moraga are Management (1,500 | 20.1%), Community & Social Service (1,402 | 18.8%), Business & Financial (967 | 13.0%), Computers, Engineering & Science (851 | 11.4%), and Education Instruction & Library (723 | 9.7%).
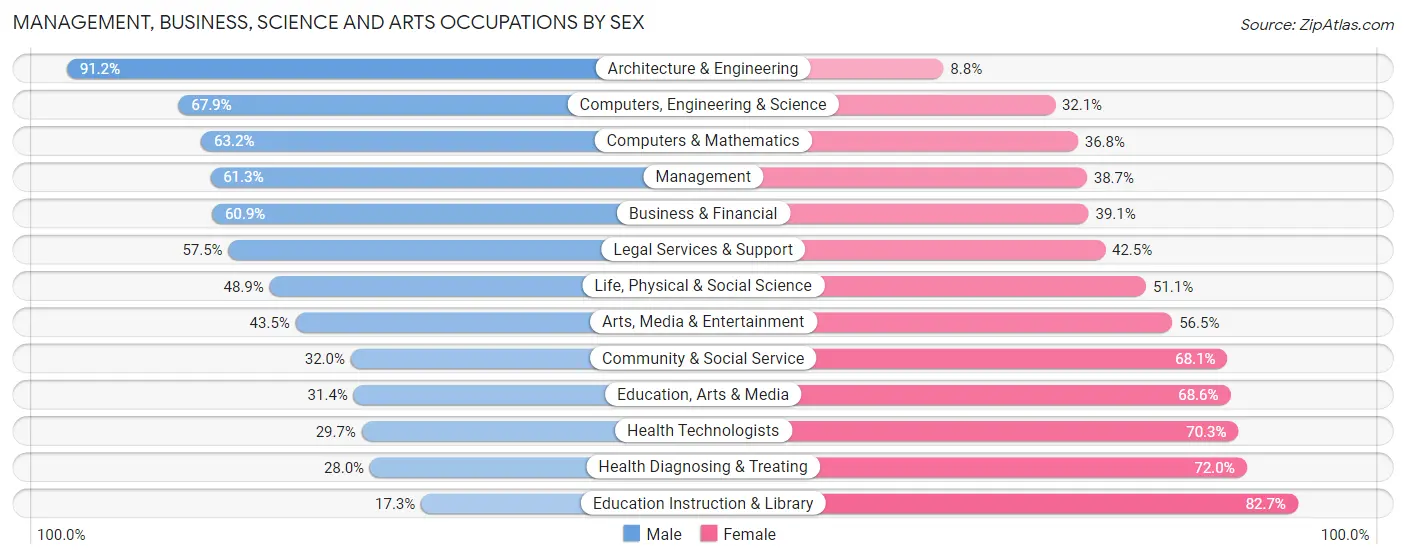
Management, Business, Science and Arts Occupations by Sex
Within the Management, Business, Science and Arts occupations in Moraga, the most male-oriented occupations are Architecture & Engineering (91.2%), Computers, Engineering & Science (67.9%), and Computers & Mathematics (63.2%), while the most female-oriented occupations are Education Instruction & Library (82.7%), Health Diagnosing & Treating (72.0%), and Health Technologists (70.3%).
| Occupation | Male | Female |
| Management | 919 (61.3%) | 581 (38.7%) |
| Business & Financial | 589 (60.9%) | 378 (39.1%) |
| Computers, Engineering & Science | 578 (67.9%) | 273 (32.1%) |
| Computers & Mathematics | 228 (63.2%) | 133 (36.8%) |
| Architecture & Engineering | 238 (91.2%) | 23 (8.8%) |
| Life, Physical & Social Science | 112 (48.9%) | 117 (51.1%) |
| Community & Social Service | 448 (32.0%) | 954 (68.0%) |
| Education, Arts & Media | 37 (31.4%) | 81 (68.6%) |
| Legal Services & Support | 173 (57.5%) | 128 (42.5%) |
| Education Instruction & Library | 125 (17.3%) | 598 (82.7%) |
| Arts, Media & Entertainment | 113 (43.5%) | 147 (56.5%) |
| Health Diagnosing & Treating | 130 (28.0%) | 335 (72.0%) |
| Health Technologists | 119 (29.7%) | 282 (70.3%) |
| Total (Category) | 2,664 (51.4%) | 2,521 (48.6%) |
| Total (Overall) | 3,681 (49.3%) | 3,779 (50.7%) |
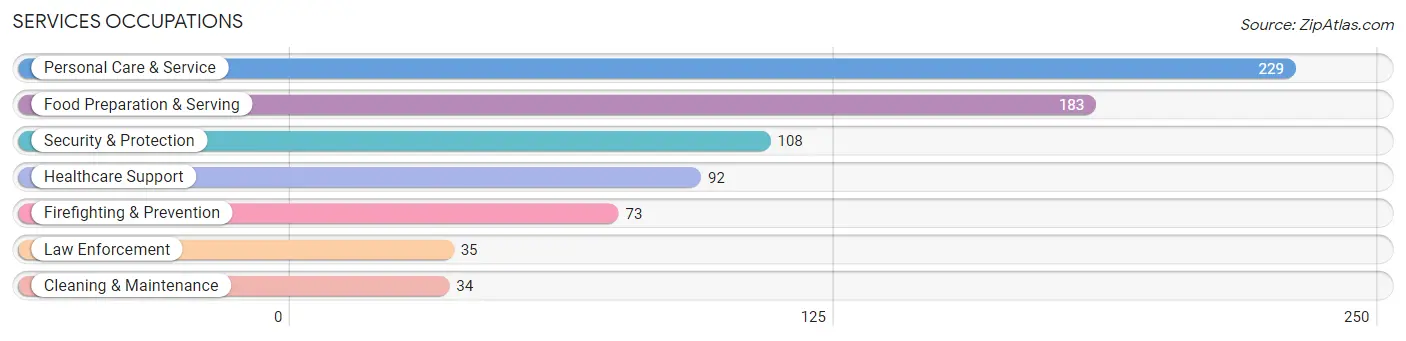
Services Occupations
The most common Services occupations in Moraga are Personal Care & Service (229 | 3.1%), Food Preparation & Serving (183 | 2.5%), Security & Protection (108 | 1.5%), Healthcare Support (92 | 1.2%), and Firefighting & Prevention (73 | 1.0%).
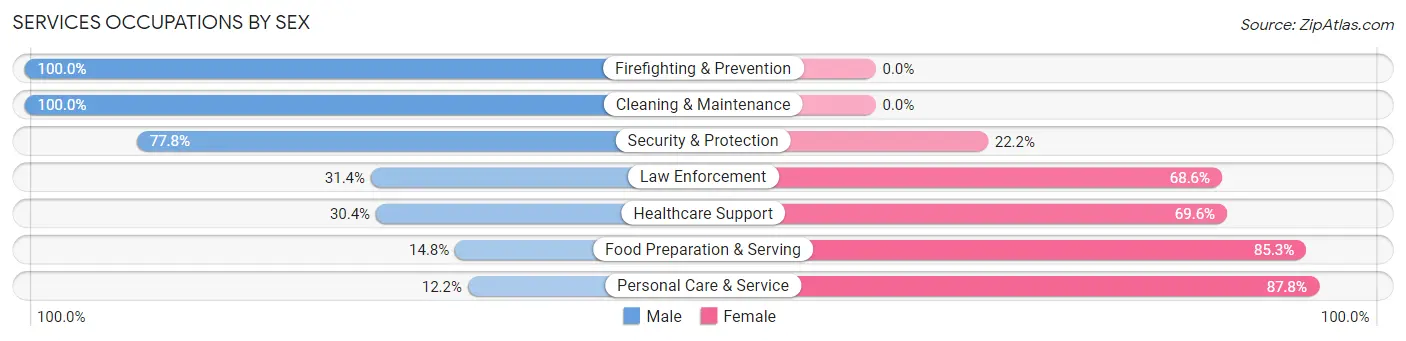
Services Occupations by Sex
Within the Services occupations in Moraga, the most male-oriented occupations are Firefighting & Prevention (100.0%), Cleaning & Maintenance (100.0%), and Security & Protection (77.8%), while the most female-oriented occupations are Personal Care & Service (87.8%), Food Preparation & Serving (85.3%), and Healthcare Support (69.6%).
| Occupation | Male | Female |
| Healthcare Support | 28 (30.4%) | 64 (69.6%) |
| Security & Protection | 84 (77.8%) | 24 (22.2%) |
| Firefighting & Prevention | 73 (100.0%) | 0 (0.0%) |
| Law Enforcement | 11 (31.4%) | 24 (68.6%) |
| Food Preparation & Serving | 27 (14.7%) | 156 (85.3%) |
| Cleaning & Maintenance | 34 (100.0%) | 0 (0.0%) |
| Personal Care & Service | 28 (12.2%) | 201 (87.8%) |
| Total (Category) | 201 (31.1%) | 445 (68.9%) |
| Total (Overall) | 3,681 (49.3%) | 3,779 (50.7%) |
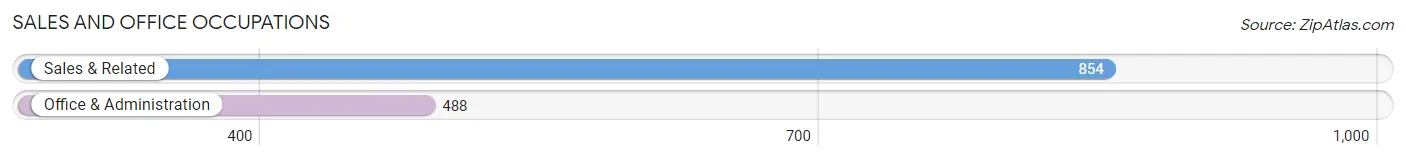
Sales and Office Occupations
The most common Sales and Office occupations in Moraga are Sales & Related (854 | 11.5%), and Office & Administration (488 | 6.5%).
Sales and Office Occupations by Sex
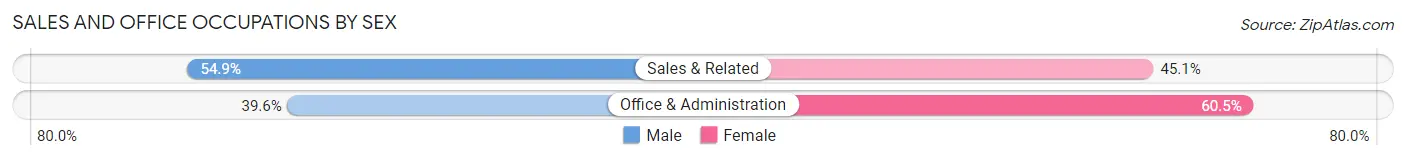
| Occupation | Male | Female |
| Sales & Related | 469 (54.9%) | 385 (45.1%) |
| Office & Administration | 193 (39.6%) | 295 (60.5%) |
| Total (Category) | 662 (49.3%) | 680 (50.7%) |
| Total (Overall) | 3,681 (49.3%) | 3,779 (50.7%) |
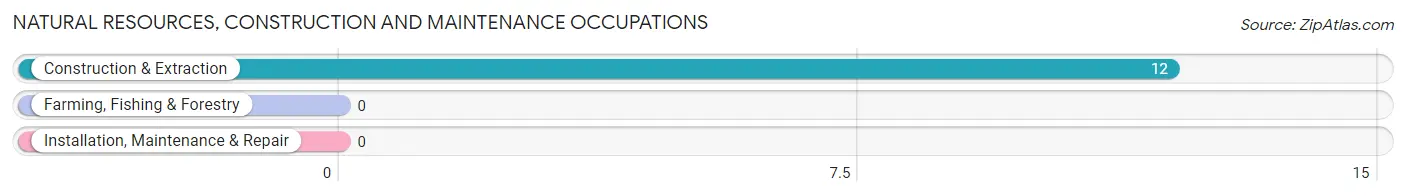
Natural Resources, Construction and Maintenance Occupations
The most common Natural Resources, Construction and Maintenance occupations in Moraga are , and Construction & Extraction (12 | 0.2%).
Natural Resources, Construction and Maintenance Occupations by Sex
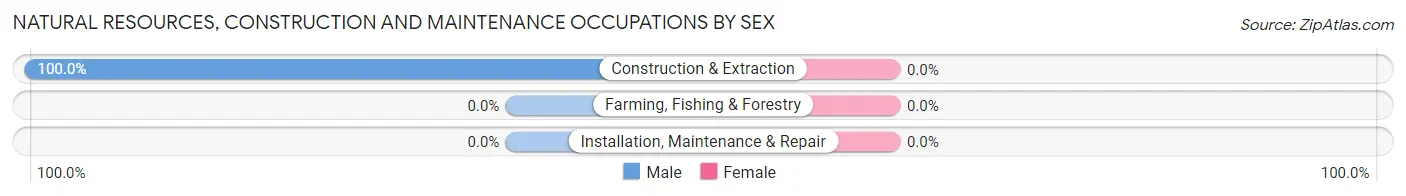
| Occupation | Male | Female |
| Farming, Fishing & Forestry | 0 (0.0%) | 0 (0.0%) |
| Construction & Extraction | 12 (100.0%) | 0 (0.0%) |
| Installation, Maintenance & Repair | 0 (0.0%) | 0 (0.0%) |
| Total (Category) | 12 (100.0%) | 0 (0.0%) |
| Total (Overall) | 3,681 (49.3%) | 3,779 (50.7%) |
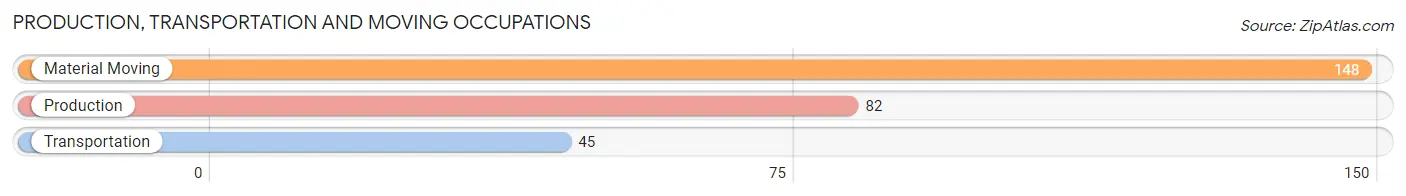
Production, Transportation and Moving Occupations
The most common Production, Transportation and Moving occupations in Moraga are Material Moving (148 | 2.0%), Production (82 | 1.1%), and Transportation (45 | 0.6%).
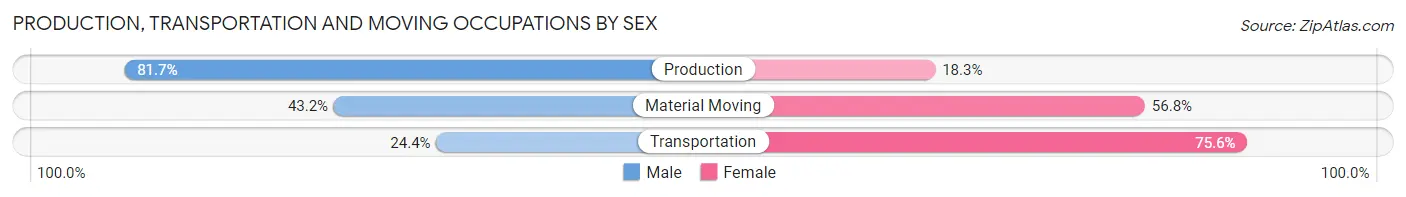
Production, Transportation and Moving Occupations by Sex
| Occupation | Male | Female |
| Production | 67 (81.7%) | 15 (18.3%) |
| Transportation | 11 (24.4%) | 34 (75.6%) |
| Material Moving | 64 (43.2%) | 84 (56.8%) |
| Total (Category) | 142 (51.6%) | 133 (48.4%) |
| Total (Overall) | 3,681 (49.3%) | 3,779 (50.7%) |
Employment Industries by Sex in Moraga
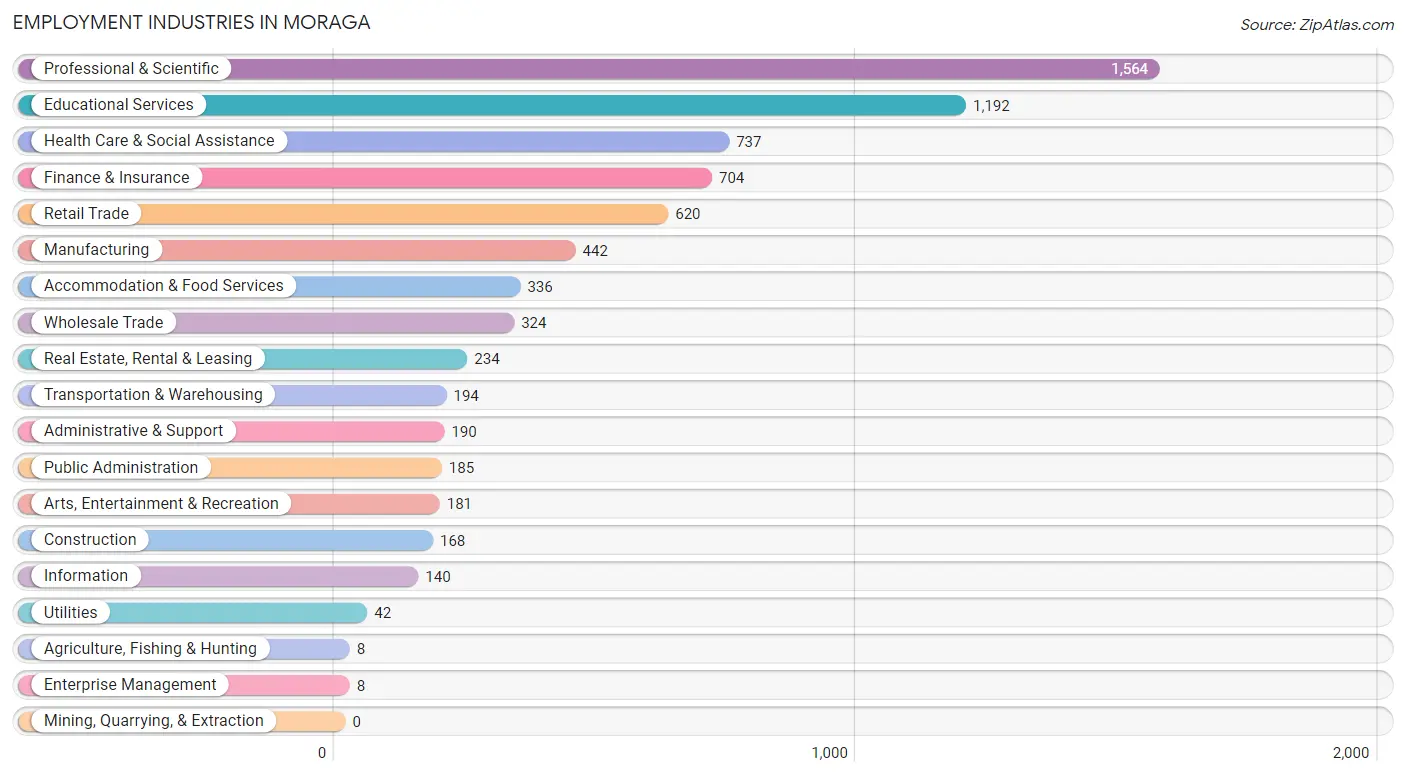
Employment Industries in Moraga
The major employment industries in Moraga include Professional & Scientific (1,564 | 21.0%), Educational Services (1,192 | 16.0%), Health Care & Social Assistance (737 | 9.9%), Finance & Insurance (704 | 9.4%), and Retail Trade (620 | 8.3%).
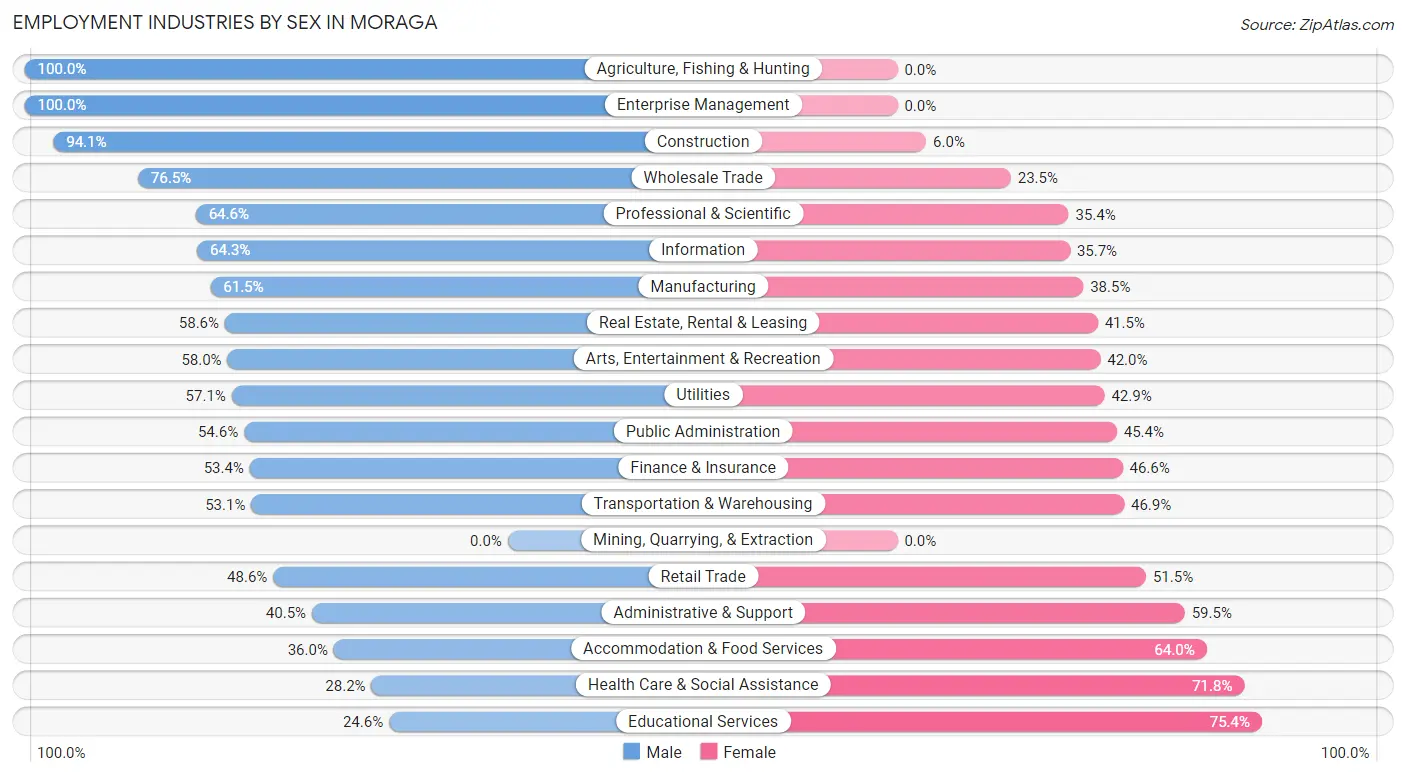
Employment Industries by Sex in Moraga
The Moraga industries that see more men than women are Agriculture, Fishing & Hunting (100.0%), Enterprise Management (100.0%), and Construction (94.1%), whereas the industries that tend to have a higher number of women are Educational Services (75.4%), Health Care & Social Assistance (71.8%), and Accommodation & Food Services (64.0%).
| Industry | Male | Female |
| Agriculture, Fishing & Hunting | 8 (100.0%) | 0 (0.0%) |
| Mining, Quarrying, & Extraction | 0 (0.0%) | 0 (0.0%) |
| Construction | 158 (94.1%) | 10 (5.9%) |
| Manufacturing | 272 (61.5%) | 170 (38.5%) |
| Wholesale Trade | 248 (76.5%) | 76 (23.5%) |
| Retail Trade | 301 (48.5%) | 319 (51.4%) |
| Transportation & Warehousing | 103 (53.1%) | 91 (46.9%) |
| Utilities | 24 (57.1%) | 18 (42.9%) |
| Information | 90 (64.3%) | 50 (35.7%) |
| Finance & Insurance | 376 (53.4%) | 328 (46.6%) |
| Real Estate, Rental & Leasing | 137 (58.6%) | 97 (41.4%) |
| Professional & Scientific | 1,010 (64.6%) | 554 (35.4%) |
| Enterprise Management | 8 (100.0%) | 0 (0.0%) |
| Administrative & Support | 77 (40.5%) | 113 (59.5%) |
| Educational Services | 293 (24.6%) | 899 (75.4%) |
| Health Care & Social Assistance | 208 (28.2%) | 529 (71.8%) |
| Arts, Entertainment & Recreation | 105 (58.0%) | 76 (42.0%) |
| Accommodation & Food Services | 121 (36.0%) | 215 (64.0%) |
| Public Administration | 101 (54.6%) | 84 (45.4%) |
| Total | 3,681 (49.3%) | 3,779 (50.7%) |
Education in Moraga
School Enrollment in Moraga
The most common levels of schooling among the 6,020 students in Moraga are college / undergraduate (2,739 | 45.5%), middle school (943 | 15.7%), and high school (927 | 15.4%).
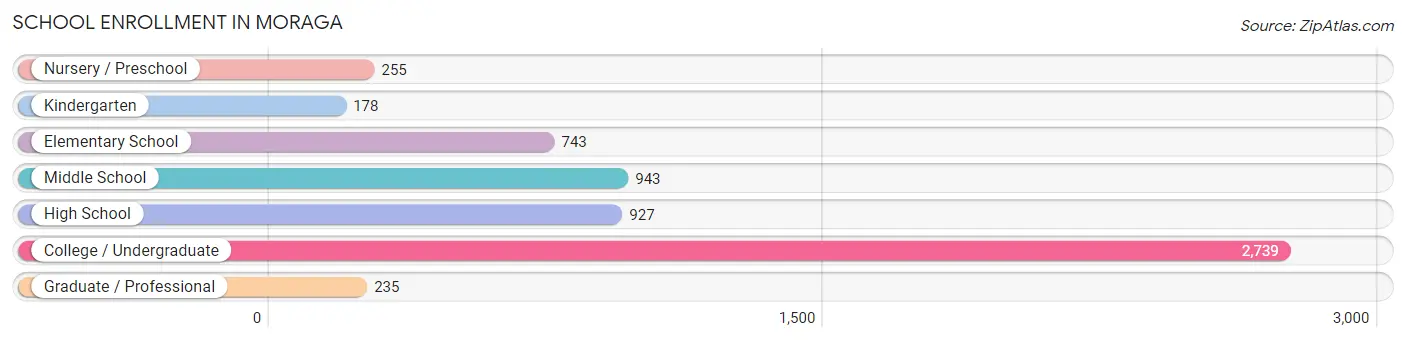
| School Level | # Students | % Students |
| Nursery / Preschool | 255 | 4.2% |
| Kindergarten | 178 | 3.0% |
| Elementary School | 743 | 12.3% |
| Middle School | 943 | 15.7% |
| High School | 927 | 15.4% |
| College / Undergraduate | 2,739 | 45.5% |
| Graduate / Professional | 235 | 3.9% |
| Total | 6,020 | 100.0% |
School Enrollment by Age by Funding Source in Moraga
Out of a total of 6,020 students who are enrolled in schools in Moraga, 2,565 (42.6%) attend a private institution, while the remaining 3,455 (57.4%) are enrolled in public schools. The age group of 3 to 4 year olds has the highest likelihood of being enrolled in private schools, with 222 (97.8% in the age bracket) enrolled. Conversely, the age group of 15 to 17 year olds has the lowest likelihood of being enrolled in a private school, with 587 (92.3% in the age bracket) attending a public institution.
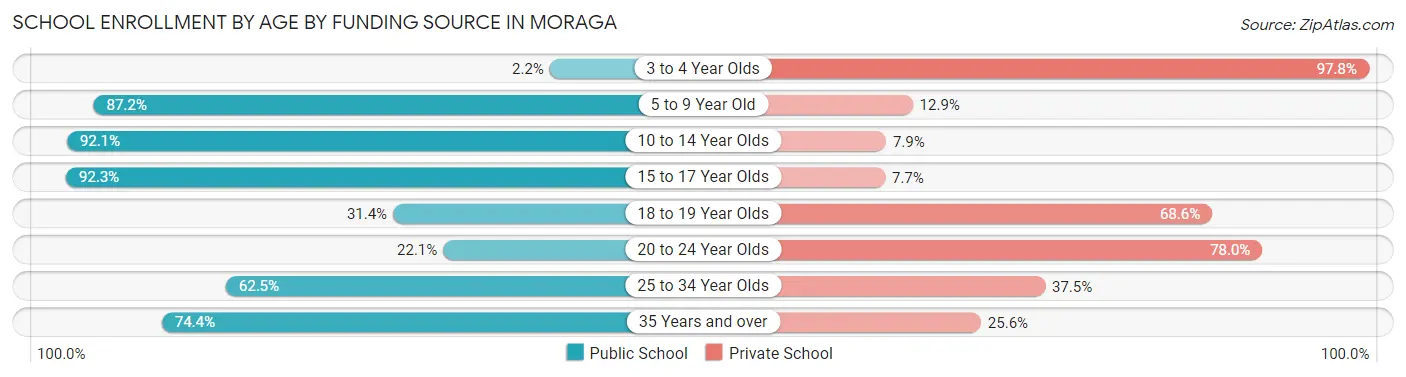
| Age Bracket | Public School | Private School |
| 3 to 4 Year Olds | 5 (2.2%) | 222 (97.8%) |
| 5 to 9 Year Old | 739 (87.2%) | 109 (12.9%) |
| 10 to 14 Year Olds | 1,123 (92.1%) | 96 (7.9%) |
| 15 to 17 Year Olds | 587 (92.3%) | 49 (7.7%) |
| 18 to 19 Year Olds | 340 (31.4%) | 743 (68.6%) |
| 20 to 24 Year Olds | 337 (22.1%) | 1,191 (77.9%) |
| 25 to 34 Year Olds | 160 (62.5%) | 96 (37.5%) |
| 35 Years and over | 166 (74.4%) | 57 (25.6%) |
| Total | 3,455 (57.4%) | 2,565 (42.6%) |
Educational Attainment by Field of Study in Moraga
Business (1,879 | 20.5%), social sciences (1,414 | 15.4%), engineering (854 | 9.3%), bio, nature & agricultural (791 | 8.6%), and literature & languages (592 | 6.5%) are the most common fields of study among 9,178 individuals in Moraga who have obtained a bachelor's degree or higher.
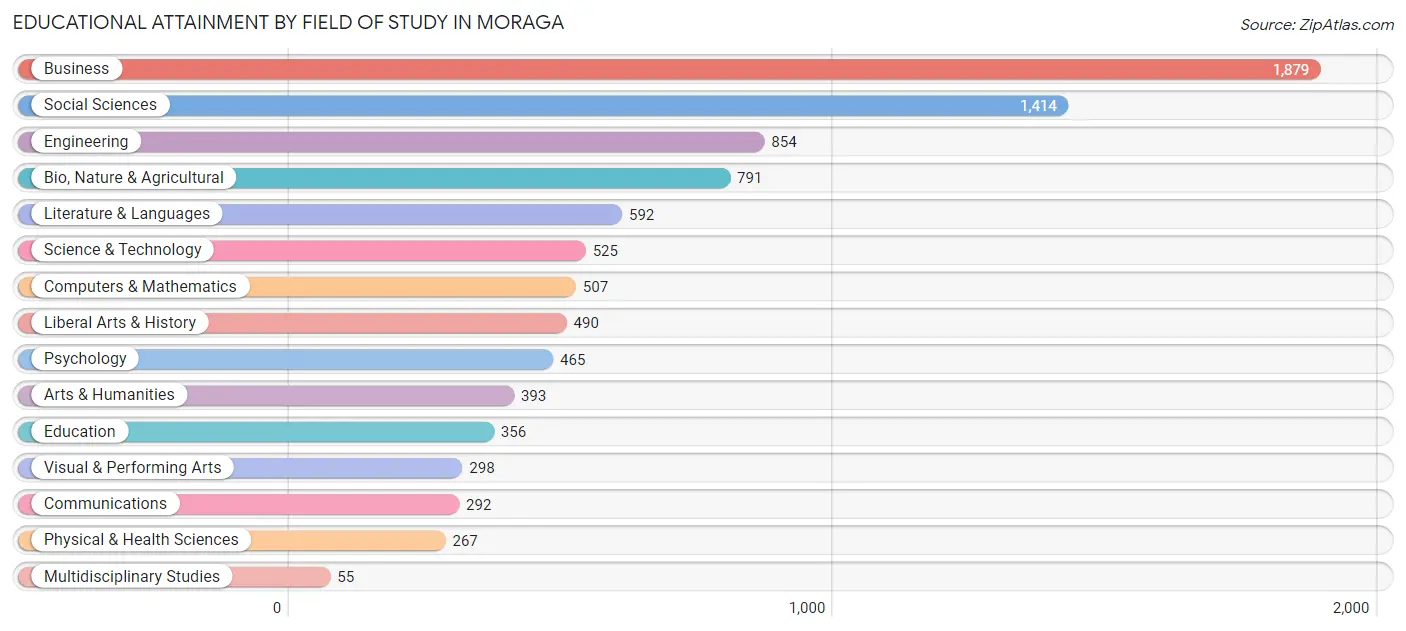
| Field of Study | # Graduates | % Graduates |
| Computers & Mathematics | 507 | 5.5% |
| Bio, Nature & Agricultural | 791 | 8.6% |
| Physical & Health Sciences | 267 | 2.9% |
| Psychology | 465 | 5.1% |
| Social Sciences | 1,414 | 15.4% |
| Engineering | 854 | 9.3% |
| Multidisciplinary Studies | 55 | 0.6% |
| Science & Technology | 525 | 5.7% |
| Business | 1,879 | 20.5% |
| Education | 356 | 3.9% |
| Literature & Languages | 592 | 6.5% |
| Liberal Arts & History | 490 | 5.3% |
| Visual & Performing Arts | 298 | 3.3% |
| Communications | 292 | 3.2% |
| Arts & Humanities | 393 | 4.3% |
| Total | 9,178 | 100.0% |
Transportation & Commute in Moraga
Vehicle Availability by Sex in Moraga
The most prevalent vehicle ownership categories in Moraga are males with 2 vehicles (1,789, accounting for 51.3%) and females with 2 vehicles (1,562, making up 55.0%).
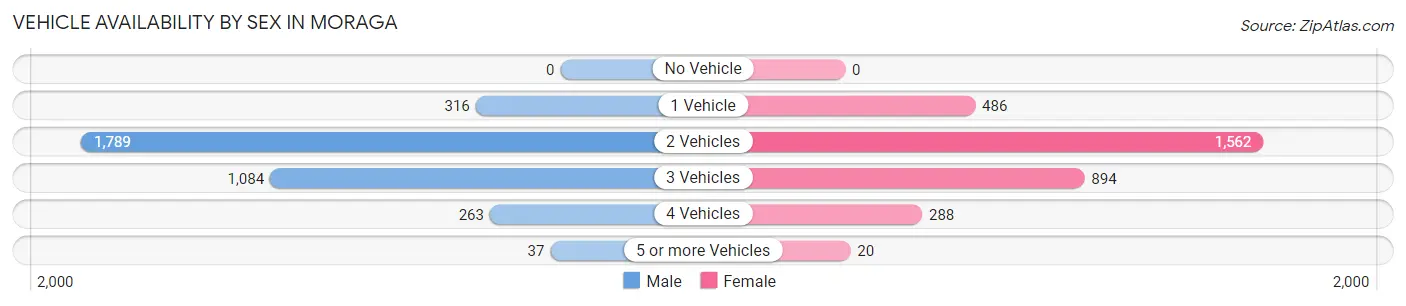
| Vehicles Available | Male | Female |
| No Vehicle | 0 (0.0%) | 0 (0.0%) |
| 1 Vehicle | 316 (9.1%) | 486 (14.9%) |
| 2 Vehicles | 1,789 (51.3%) | 1,562 (48.1%) |
| 3 Vehicles | 1,084 (31.1%) | 894 (27.5%) |
| 4 Vehicles | 263 (7.5%) | 288 (8.9%) |
| 5 or more Vehicles | 37 (1.1%) | 20 (0.6%) |
| Total | 3,489 (100.0%) | 3,250 (100.0%) |
Commute Time in Moraga
The most frequently occuring commute durations in Moraga are 30 to 34 minutes (872 commuters, 17.4%), 60 to 89 minutes (583 commuters, 11.6%), and 5 to 9 minutes (577 commuters, 11.5%).
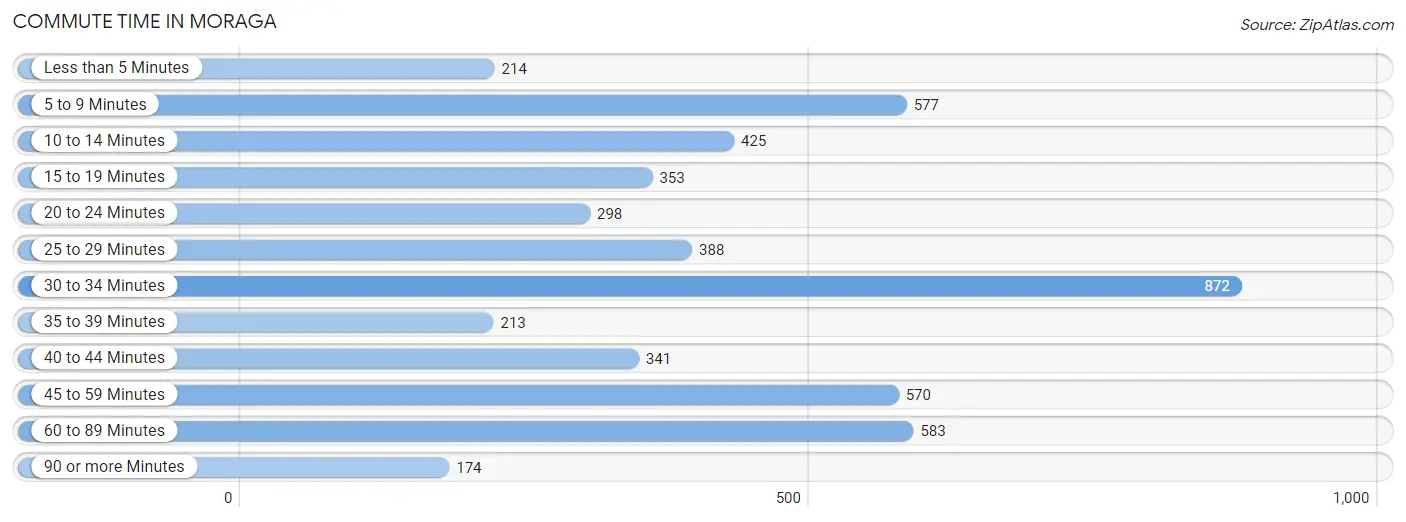
| Commute Time | # Commuters | % Commuters |
| Less than 5 Minutes | 214 | 4.3% |
| 5 to 9 Minutes | 577 | 11.5% |
| 10 to 14 Minutes | 425 | 8.5% |
| 15 to 19 Minutes | 353 | 7.0% |
| 20 to 24 Minutes | 298 | 5.9% |
| 25 to 29 Minutes | 388 | 7.7% |
| 30 to 34 Minutes | 872 | 17.4% |
| 35 to 39 Minutes | 213 | 4.3% |
| 40 to 44 Minutes | 341 | 6.8% |
| 45 to 59 Minutes | 570 | 11.4% |
| 60 to 89 Minutes | 583 | 11.6% |
| 90 or more Minutes | 174 | 3.5% |
Commute Time by Sex in Moraga
The most common commute times in Moraga are 30 to 34 minutes (409 commuters, 17.2%) for males and 30 to 34 minutes (463 commuters, 17.6%) for females.
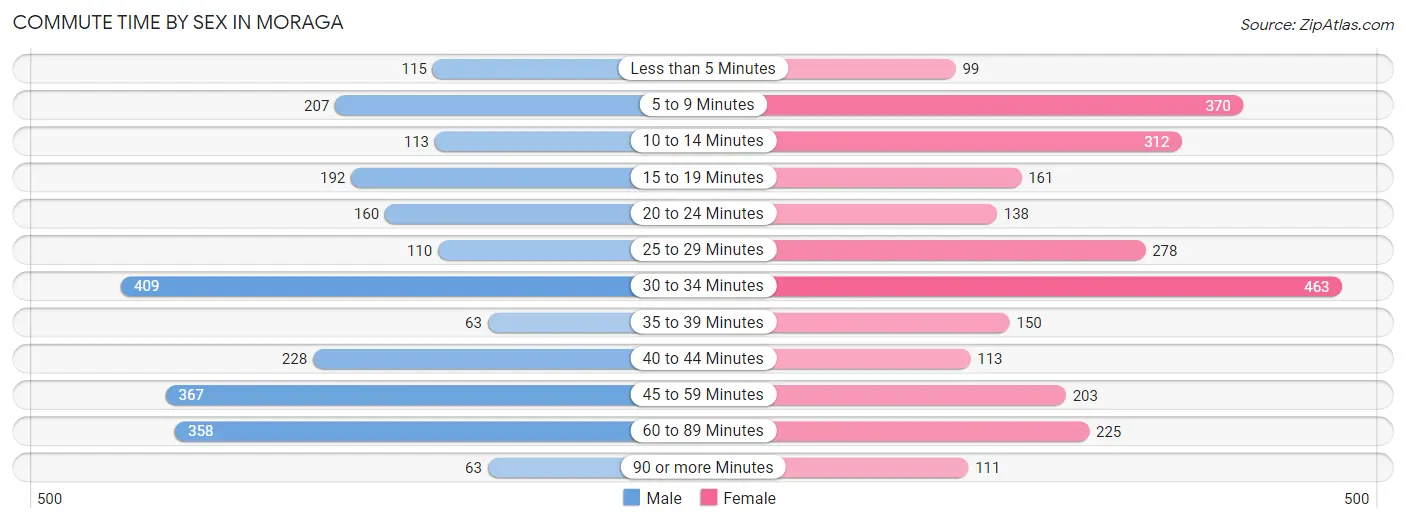
| Commute Time | Male | Female |
| Less than 5 Minutes | 115 (4.8%) | 99 (3.8%) |
| 5 to 9 Minutes | 207 (8.7%) | 370 (14.1%) |
| 10 to 14 Minutes | 113 (4.7%) | 312 (11.9%) |
| 15 to 19 Minutes | 192 (8.1%) | 161 (6.1%) |
| 20 to 24 Minutes | 160 (6.7%) | 138 (5.3%) |
| 25 to 29 Minutes | 110 (4.6%) | 278 (10.6%) |
| 30 to 34 Minutes | 409 (17.2%) | 463 (17.6%) |
| 35 to 39 Minutes | 63 (2.6%) | 150 (5.7%) |
| 40 to 44 Minutes | 228 (9.6%) | 113 (4.3%) |
| 45 to 59 Minutes | 367 (15.4%) | 203 (7.7%) |
| 60 to 89 Minutes | 358 (15.0%) | 225 (8.6%) |
| 90 or more Minutes | 63 (2.6%) | 111 (4.2%) |
Time of Departure to Work by Sex in Moraga
The most frequent times of departure to work in Moraga are 8:00 AM to 8:29 AM (451, 18.9%) for males and 7:00 AM to 7:29 AM (418, 15.9%) for females.
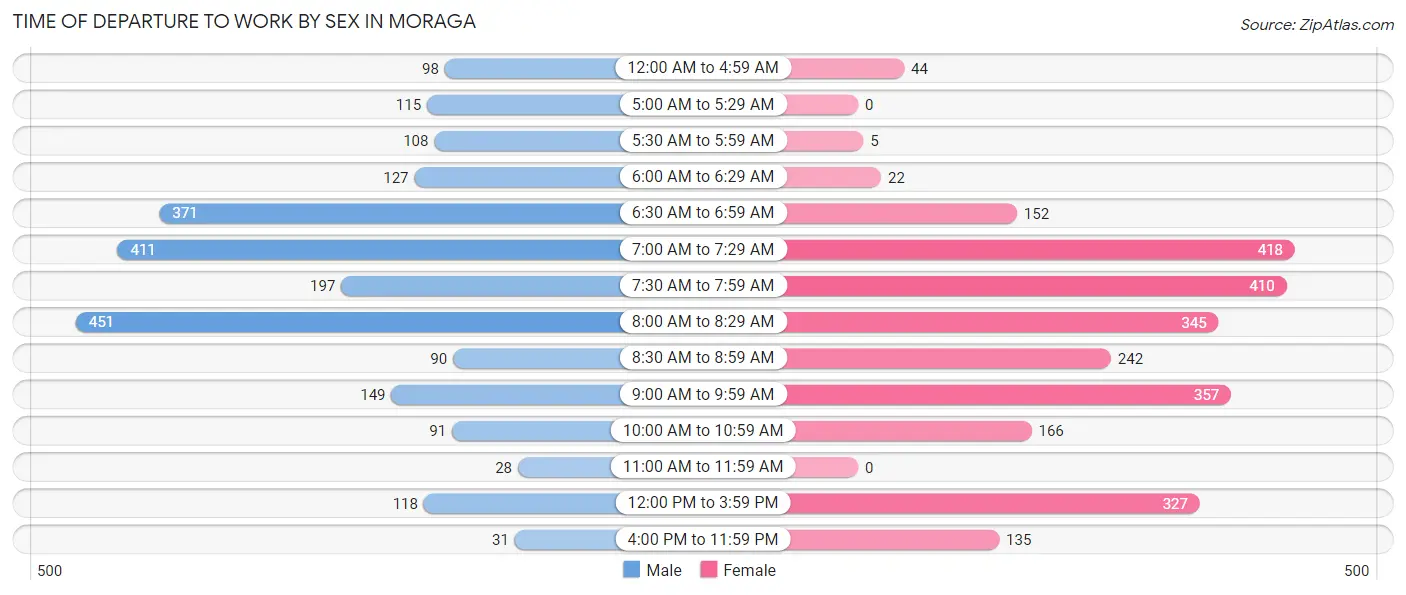
| Time of Departure | Male | Female |
| 12:00 AM to 4:59 AM | 98 (4.1%) | 44 (1.7%) |
| 5:00 AM to 5:29 AM | 115 (4.8%) | 0 (0.0%) |
| 5:30 AM to 5:59 AM | 108 (4.5%) | 5 (0.2%) |
| 6:00 AM to 6:29 AM | 127 (5.3%) | 22 (0.8%) |
| 6:30 AM to 6:59 AM | 371 (15.6%) | 152 (5.8%) |
| 7:00 AM to 7:29 AM | 411 (17.2%) | 418 (15.9%) |
| 7:30 AM to 7:59 AM | 197 (8.3%) | 410 (15.6%) |
| 8:00 AM to 8:29 AM | 451 (18.9%) | 345 (13.2%) |
| 8:30 AM to 8:59 AM | 90 (3.8%) | 242 (9.2%) |
| 9:00 AM to 9:59 AM | 149 (6.2%) | 357 (13.6%) |
| 10:00 AM to 10:59 AM | 91 (3.8%) | 166 (6.3%) |
| 11:00 AM to 11:59 AM | 28 (1.2%) | 0 (0.0%) |
| 12:00 PM to 3:59 PM | 118 (5.0%) | 327 (12.5%) |
| 4:00 PM to 11:59 PM | 31 (1.3%) | 135 (5.1%) |
| Total | 2,385 (100.0%) | 2,623 (100.0%) |
Housing Occupancy in Moraga
Occupancy by Ownership in Moraga
Of the total 5,610 dwellings in Moraga, owner-occupied units account for 4,712 (84.0%), while renter-occupied units make up 898 (16.0%).
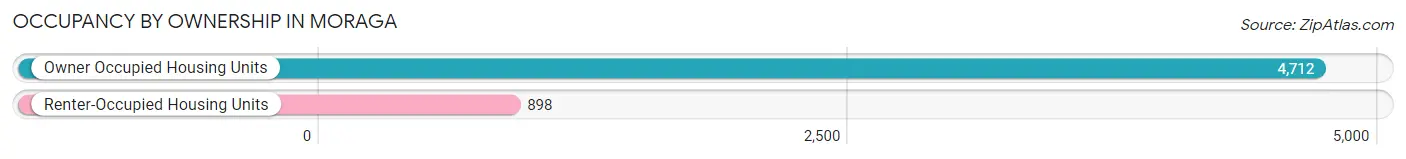
| Occupancy | # Housing Units | % Housing Units |
| Owner Occupied Housing Units | 4,712 | 84.0% |
| Renter-Occupied Housing Units | 898 | 16.0% |
| Total Occupied Housing Units | 5,610 | 100.0% |
Occupancy by Household Size in Moraga
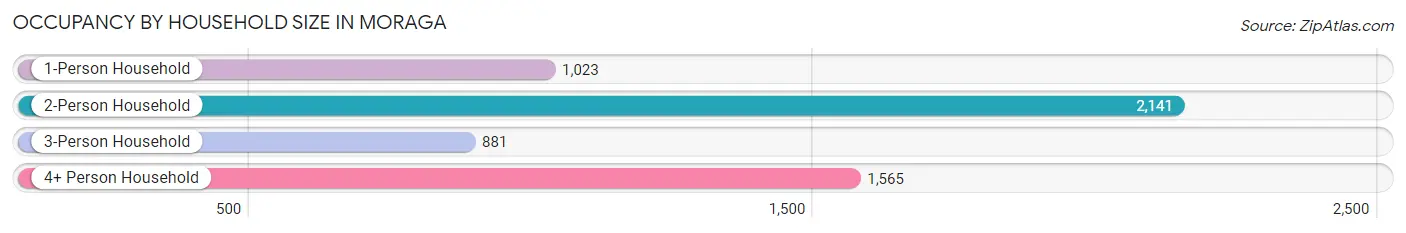
| Household Size | # Housing Units | % Housing Units |
| 1-Person Household | 1,023 | 18.2% |
| 2-Person Household | 2,141 | 38.2% |
| 3-Person Household | 881 | 15.7% |
| 4+ Person Household | 1,565 | 27.9% |
| Total Housing Units | 5,610 | 100.0% |
Occupancy by Ownership by Household Size in Moraga
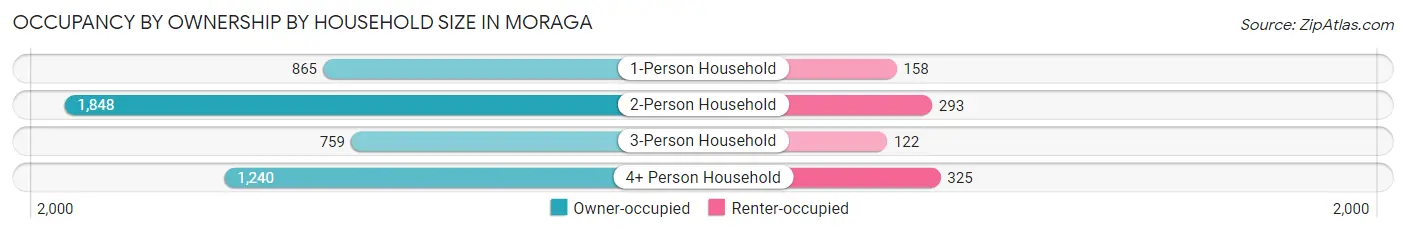
| Household Size | Owner-occupied | Renter-occupied |
| 1-Person Household | 865 (84.6%) | 158 (15.4%) |
| 2-Person Household | 1,848 (86.3%) | 293 (13.7%) |
| 3-Person Household | 759 (86.2%) | 122 (13.9%) |
| 4+ Person Household | 1,240 (79.2%) | 325 (20.8%) |
| Total Housing Units | 4,712 (84.0%) | 898 (16.0%) |
Occupancy by Educational Attainment in Moraga
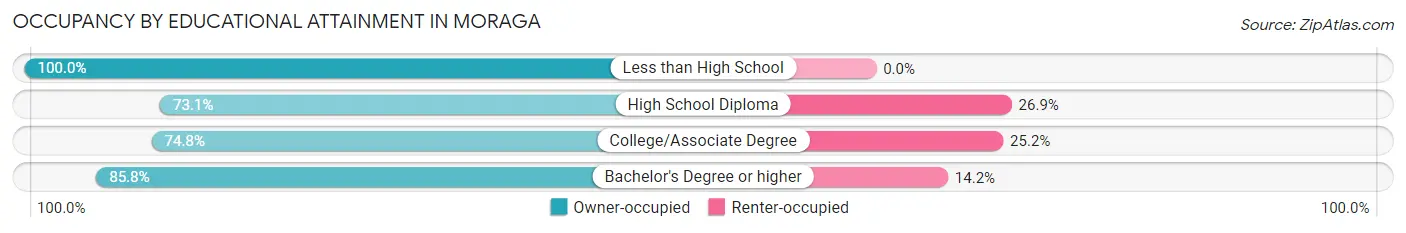
| Household Size | Owner-occupied | Renter-occupied |
| Less than High School | 33 (100.0%) | 0 (0.0%) |
| High School Diploma | 177 (73.1%) | 65 (26.9%) |
| College/Associate Degree | 508 (74.8%) | 171 (25.2%) |
| Bachelor's Degree or higher | 3,994 (85.8%) | 662 (14.2%) |
Occupancy by Age of Householder in Moraga
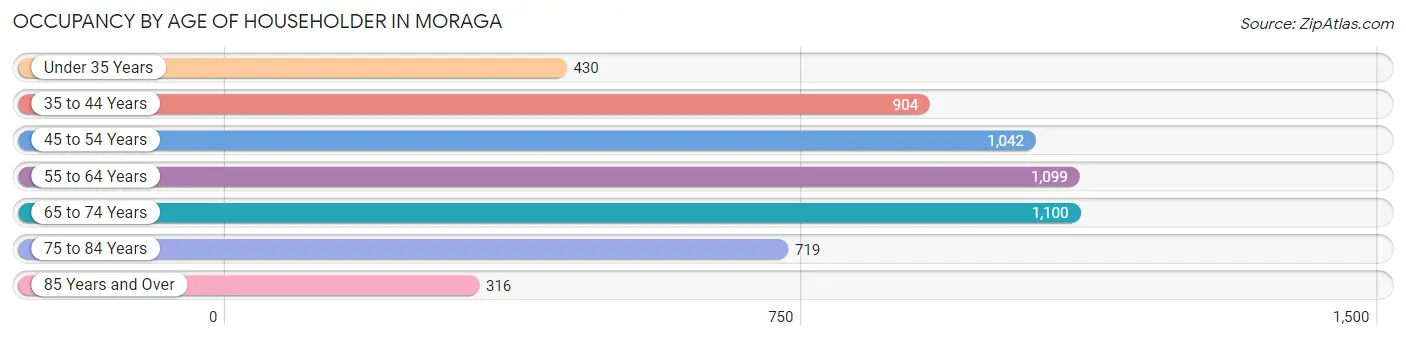
| Age Bracket | # Households | % Households |
| Under 35 Years | 430 | 7.7% |
| 35 to 44 Years | 904 | 16.1% |
| 45 to 54 Years | 1,042 | 18.6% |
| 55 to 64 Years | 1,099 | 19.6% |
| 65 to 74 Years | 1,100 | 19.6% |
| 75 to 84 Years | 719 | 12.8% |
| 85 Years and Over | 316 | 5.6% |
| Total | 5,610 | 100.0% |
Housing Finances in Moraga
Median Income by Occupancy in Moraga
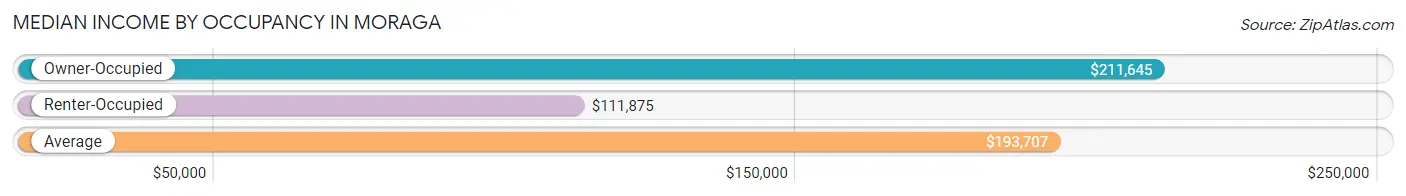
| Occupancy Type | # Households | Median Income |
| Owner-Occupied | 4,712 (84.0%) | $211,645 |
| Renter-Occupied | 898 (16.0%) | $111,875 |
| Average | 5,610 (100.0%) | $193,707 |
Occupancy by Householder Income Bracket in Moraga
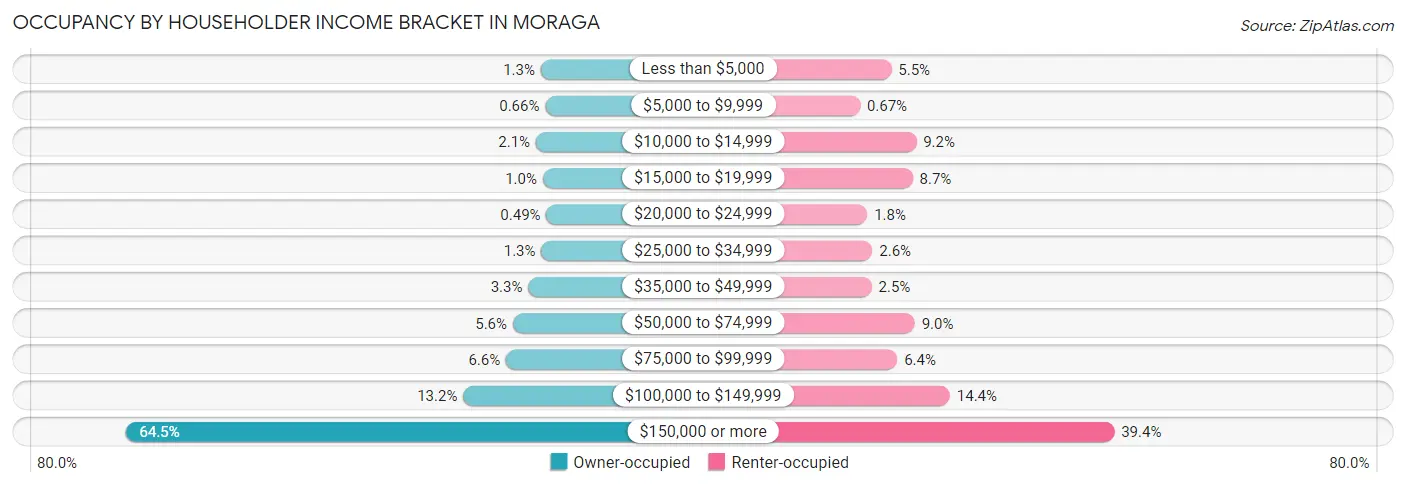
| Income Bracket | Owner-occupied | Renter-occupied |
| Less than $5,000 | 63 (1.3%) | 49 (5.5%) |
| $5,000 to $9,999 | 31 (0.7%) | 6 (0.7%) |
| $10,000 to $14,999 | 98 (2.1%) | 83 (9.2%) |
| $15,000 to $19,999 | 49 (1.0%) | 78 (8.7%) |
| $20,000 to $24,999 | 23 (0.5%) | 16 (1.8%) |
| $25,000 to $34,999 | 59 (1.3%) | 23 (2.6%) |
| $35,000 to $49,999 | 153 (3.3%) | 22 (2.5%) |
| $50,000 to $74,999 | 264 (5.6%) | 81 (9.0%) |
| $75,000 to $99,999 | 313 (6.6%) | 57 (6.4%) |
| $100,000 to $149,999 | 620 (13.2%) | 129 (14.4%) |
| $150,000 or more | 3,039 (64.5%) | 354 (39.4%) |
| Total | 4,712 (100.0%) | 898 (100.0%) |
Monthly Housing Cost Tiers in Moraga
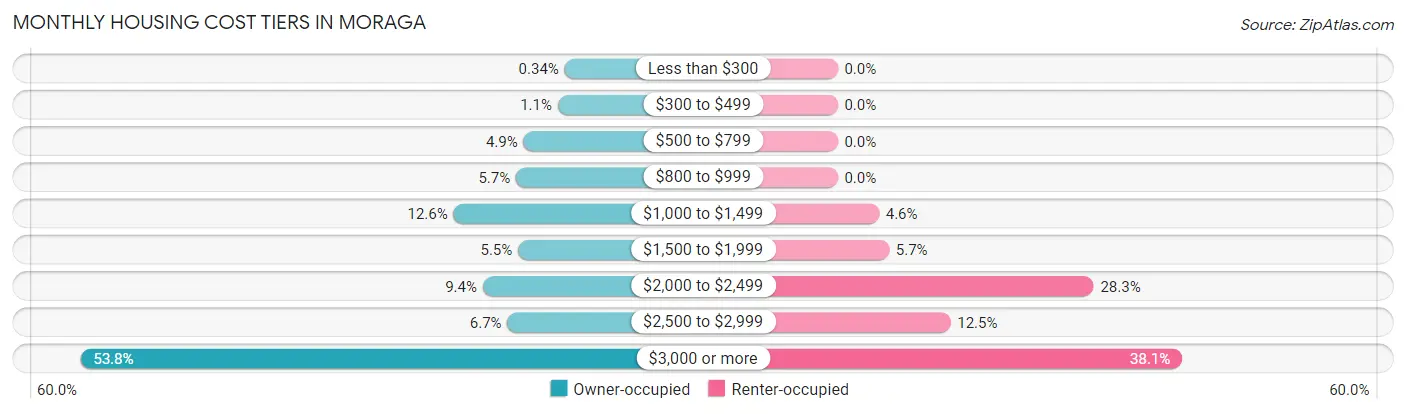
| Monthly Cost | Owner-occupied | Renter-occupied |
| Less than $300 | 16 (0.3%) | 0 (0.0%) |
| $300 to $499 | 52 (1.1%) | 0 (0.0%) |
| $500 to $799 | 230 (4.9%) | 0 (0.0%) |
| $800 to $999 | 269 (5.7%) | 0 (0.0%) |
| $1,000 to $1,499 | 594 (12.6%) | 41 (4.6%) |
| $1,500 to $1,999 | 258 (5.5%) | 51 (5.7%) |
| $2,000 to $2,499 | 442 (9.4%) | 254 (28.3%) |
| $2,500 to $2,999 | 314 (6.7%) | 112 (12.5%) |
| $3,000 or more | 2,537 (53.8%) | 342 (38.1%) |
| Total | 4,712 (100.0%) | 898 (100.0%) |
Physical Housing Characteristics in Moraga
Housing Structures in Moraga
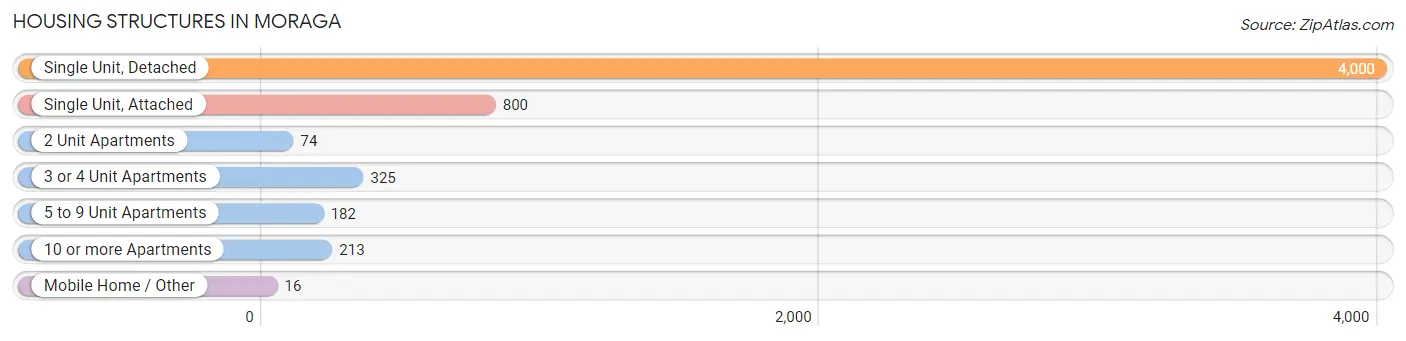
| Structure Type | # Housing Units | % Housing Units |
| Single Unit, Detached | 4,000 | 71.3% |
| Single Unit, Attached | 800 | 14.3% |
| 2 Unit Apartments | 74 | 1.3% |
| 3 or 4 Unit Apartments | 325 | 5.8% |
| 5 to 9 Unit Apartments | 182 | 3.2% |
| 10 or more Apartments | 213 | 3.8% |
| Mobile Home / Other | 16 | 0.3% |
| Total | 5,610 | 100.0% |
Housing Structures by Occupancy in Moraga
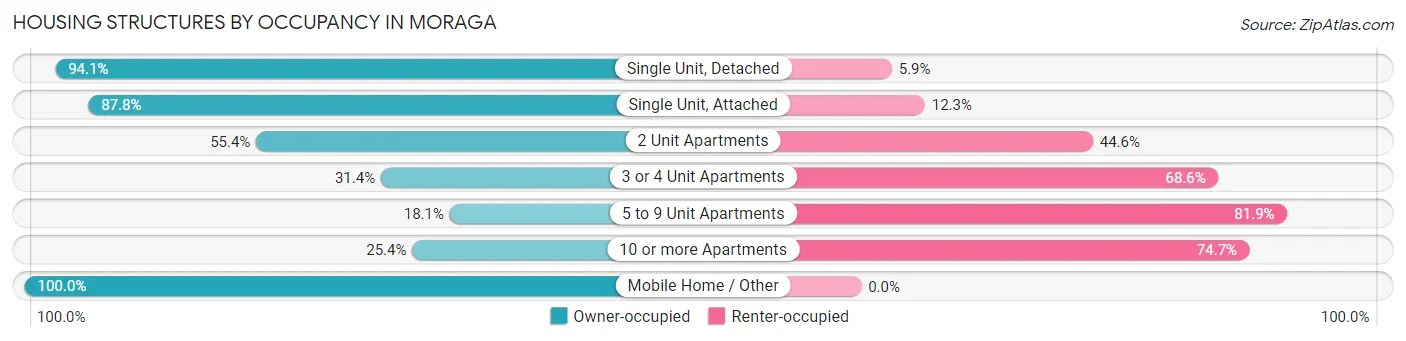
| Structure Type | Owner-occupied | Renter-occupied |
| Single Unit, Detached | 3,764 (94.1%) | 236 (5.9%) |
| Single Unit, Attached | 702 (87.7%) | 98 (12.2%) |
| 2 Unit Apartments | 41 (55.4%) | 33 (44.6%) |
| 3 or 4 Unit Apartments | 102 (31.4%) | 223 (68.6%) |
| 5 to 9 Unit Apartments | 33 (18.1%) | 149 (81.9%) |
| 10 or more Apartments | 54 (25.4%) | 159 (74.7%) |
| Mobile Home / Other | 16 (100.0%) | 0 (0.0%) |
| Total | 4,712 (84.0%) | 898 (16.0%) |
Housing Structures by Number of Rooms in Moraga
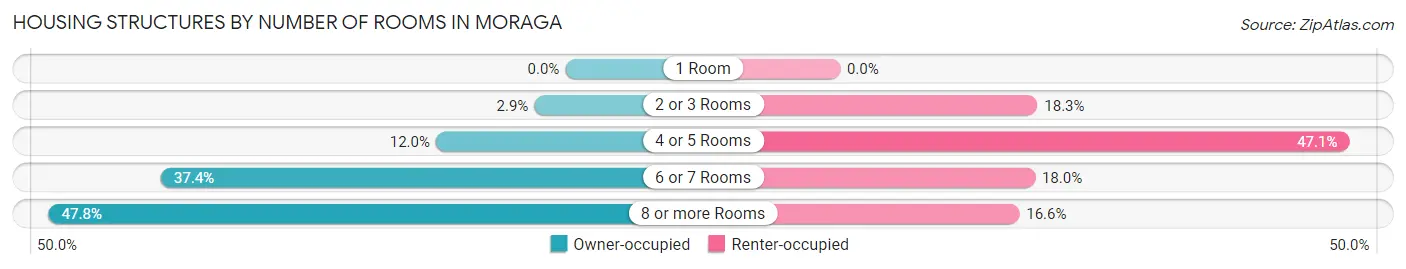
| Number of Rooms | Owner-occupied | Renter-occupied |
| 1 Room | 0 (0.0%) | 0 (0.0%) |
| 2 or 3 Rooms | 135 (2.9%) | 164 (18.3%) |
| 4 or 5 Rooms | 564 (12.0%) | 423 (47.1%) |
| 6 or 7 Rooms | 1,762 (37.4%) | 162 (18.0%) |
| 8 or more Rooms | 2,251 (47.8%) | 149 (16.6%) |
| Total | 4,712 (100.0%) | 898 (100.0%) |
Housing Structure by Heating Type in Moraga
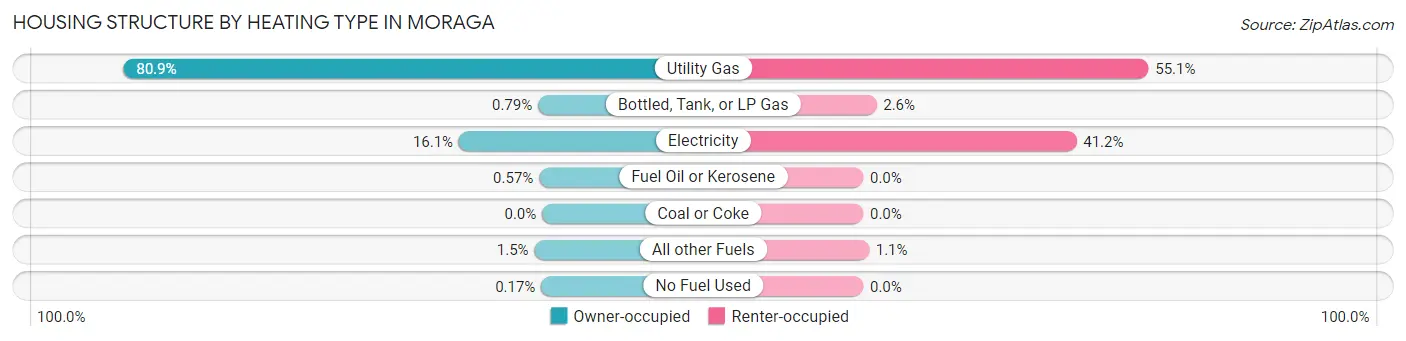
| Heating Type | Owner-occupied | Renter-occupied |
| Utility Gas | 3,813 (80.9%) | 495 (55.1%) |
| Bottled, Tank, or LP Gas | 37 (0.8%) | 23 (2.6%) |
| Electricity | 757 (16.1%) | 370 (41.2%) |
| Fuel Oil or Kerosene | 27 (0.6%) | 0 (0.0%) |
| Coal or Coke | 0 (0.0%) | 0 (0.0%) |
| All other Fuels | 70 (1.5%) | 10 (1.1%) |
| No Fuel Used | 8 (0.2%) | 0 (0.0%) |
| Total | 4,712 (100.0%) | 898 (100.0%) |
Household Vehicle Usage in Moraga
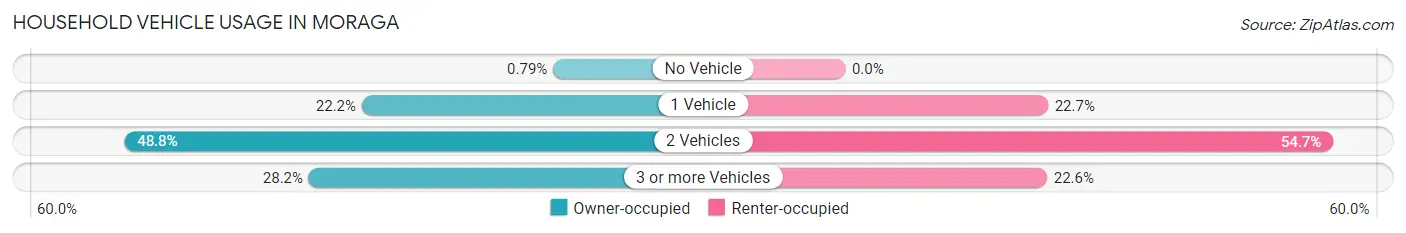
| Vehicles per Household | Owner-occupied | Renter-occupied |
| No Vehicle | 37 (0.8%) | 0 (0.0%) |
| 1 Vehicle | 1,047 (22.2%) | 204 (22.7%) |
| 2 Vehicles | 2,301 (48.8%) | 491 (54.7%) |
| 3 or more Vehicles | 1,327 (28.2%) | 203 (22.6%) |
| Total | 4,712 (100.0%) | 898 (100.0%) |
Real Estate & Mortgages in Moraga
Real Estate and Mortgage Overview in Moraga
| Characteristic | Without Mortgage | With Mortgage |
| Housing Units | 1,533 | 3,179 |
| Median Property Value | $1,392,000 | $1,525,800 |
| Median Household Income | $136,250 | $2,311 |
| Monthly Housing Costs | $1,225 | $2,454 |
| Real Estate Taxes | $7,429 | $10 |
Property Value by Mortgage Status in Moraga
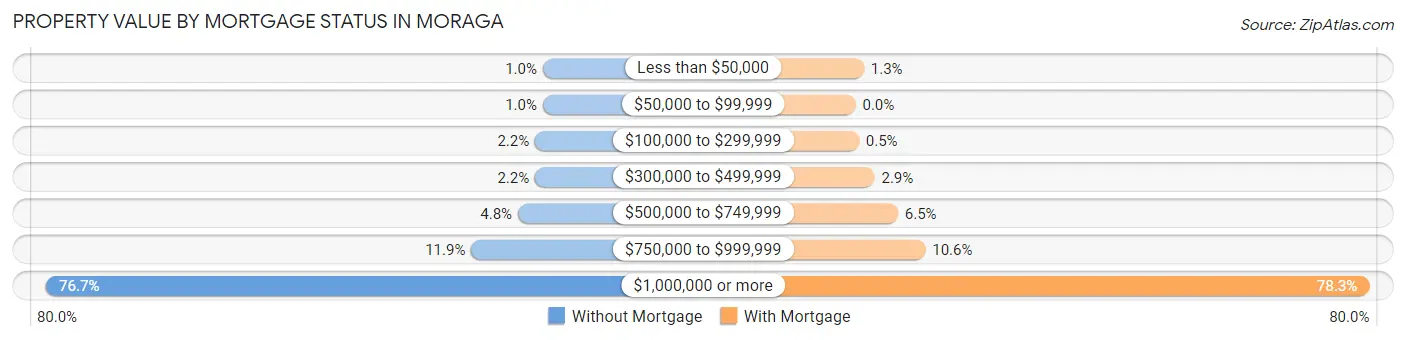
| Property Value | Without Mortgage | With Mortgage |
| Less than $50,000 | 16 (1.0%) | 40 (1.3%) |
| $50,000 to $99,999 | 16 (1.0%) | 0 (0.0%) |
| $100,000 to $299,999 | 34 (2.2%) | 16 (0.5%) |
| $300,000 to $499,999 | 34 (2.2%) | 92 (2.9%) |
| $500,000 to $749,999 | 74 (4.8%) | 205 (6.5%) |
| $750,000 to $999,999 | 183 (11.9%) | 338 (10.6%) |
| $1,000,000 or more | 1,176 (76.7%) | 2,488 (78.3%) |
| Total | 1,533 (100.0%) | 3,179 (100.0%) |
Household Income by Mortgage Status in Moraga
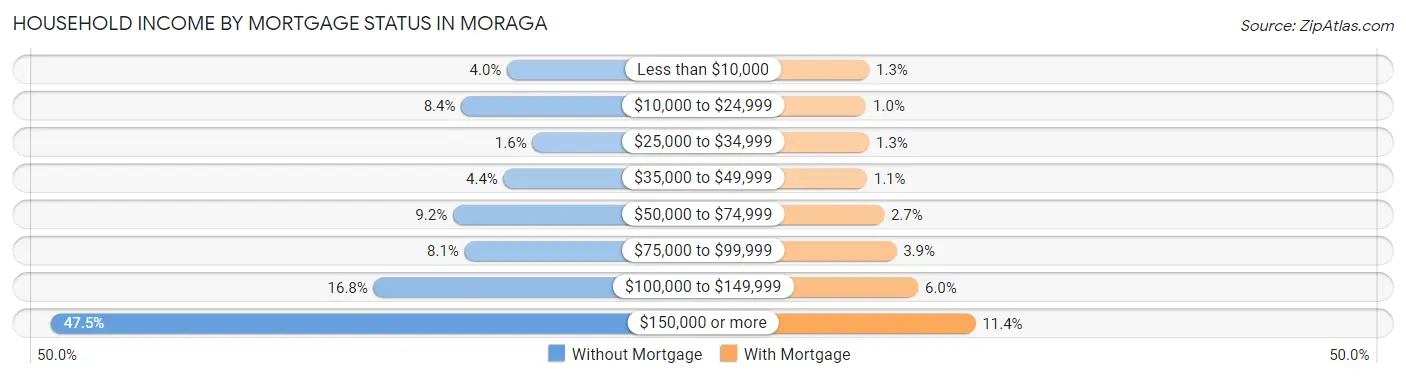
| Household Income | Without Mortgage | With Mortgage |
| Less than $10,000 | 62 (4.0%) | 41 (1.3%) |
| $10,000 to $24,999 | 129 (8.4%) | 32 (1.0%) |
| $25,000 to $34,999 | 25 (1.6%) | 41 (1.3%) |
| $35,000 to $49,999 | 67 (4.4%) | 34 (1.1%) |
| $50,000 to $74,999 | 141 (9.2%) | 86 (2.7%) |
| $75,000 to $99,999 | 124 (8.1%) | 123 (3.9%) |
| $100,000 to $149,999 | 257 (16.8%) | 189 (5.9%) |
| $150,000 or more | 728 (47.5%) | 363 (11.4%) |
| Total | 1,533 (100.0%) | 3,179 (100.0%) |
Property Value to Household Income Ratio in Moraga
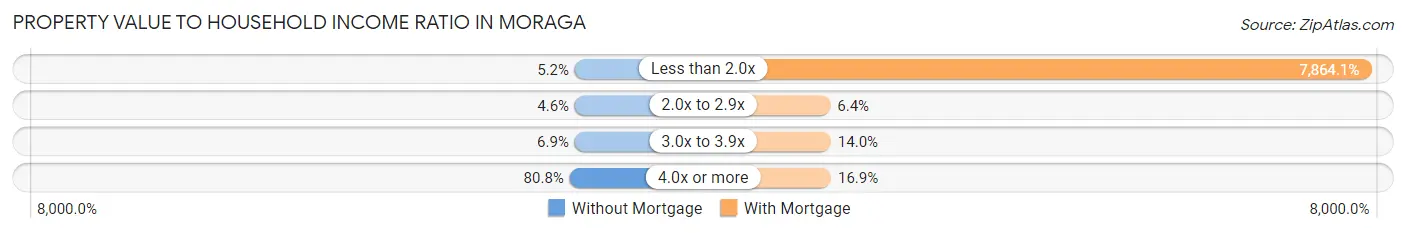
| Value-to-Income Ratio | Without Mortgage | With Mortgage |
| Less than 2.0x | 80 (5.2%) | 250,001 (7,864.1%) |
| 2.0x to 2.9x | 71 (4.6%) | 202 (6.4%) |
| 3.0x to 3.9x | 105 (6.9%) | 446 (14.0%) |
| 4.0x or more | 1,239 (80.8%) | 538 (16.9%) |
| Total | 1,533 (100.0%) | 3,179 (100.0%) |
Real Estate Taxes by Mortgage Status in Moraga
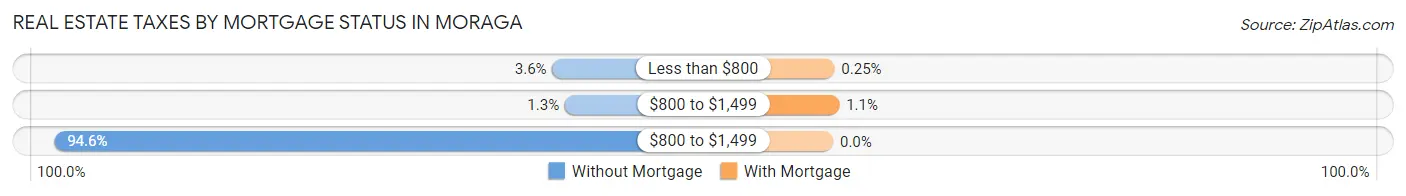
| Property Taxes | Without Mortgage | With Mortgage |
| Less than $800 | 55 (3.6%) | 8 (0.3%) |
| $800 to $1,499 | 20 (1.3%) | 36 (1.1%) |
| $800 to $1,499 | 1,450 (94.6%) | 0 (0.0%) |
| Total | 1,533 (100.0%) | 3,179 (100.0%) |
Health & Disability in Moraga
Health Insurance Coverage by Age in Moraga
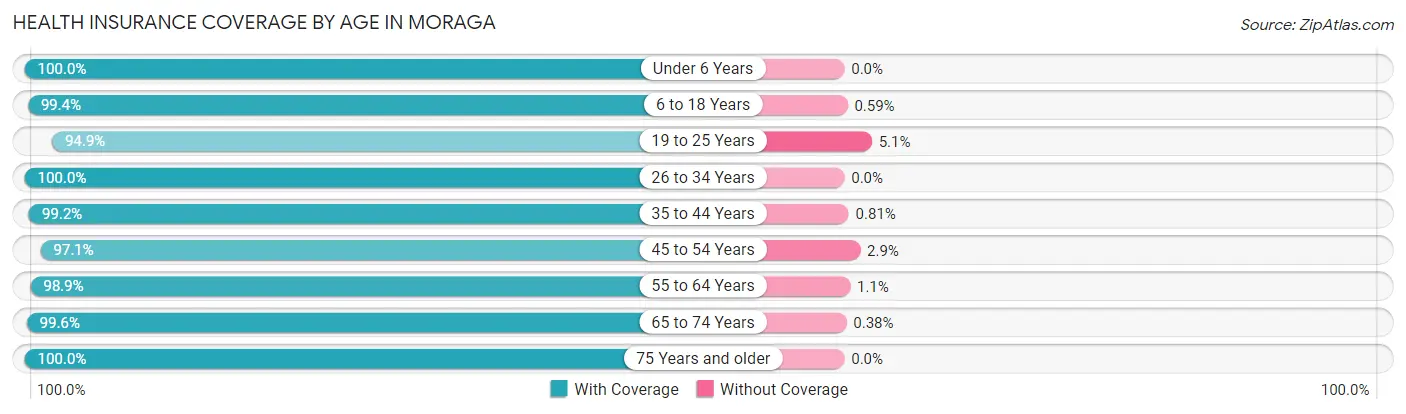
| Age Bracket | With Coverage | Without Coverage |
| Under 6 Years | 890 (100.0%) | 0 (0.0%) |
| 6 to 18 Years | 3,197 (99.4%) | 19 (0.6%) |
| 19 to 25 Years | 2,245 (94.9%) | 121 (5.1%) |
| 26 to 34 Years | 747 (100.0%) | 0 (0.0%) |
| 35 to 44 Years | 1,953 (99.2%) | 16 (0.8%) |
| 45 to 54 Years | 2,014 (97.1%) | 61 (2.9%) |
| 55 to 64 Years | 2,027 (98.9%) | 22 (1.1%) |
| 65 to 74 Years | 1,833 (99.6%) | 7 (0.4%) |
| 75 Years and older | 1,667 (100.0%) | 0 (0.0%) |
| Total | 16,573 (98.5%) | 246 (1.5%) |
Health Insurance Coverage by Citizenship Status in Moraga
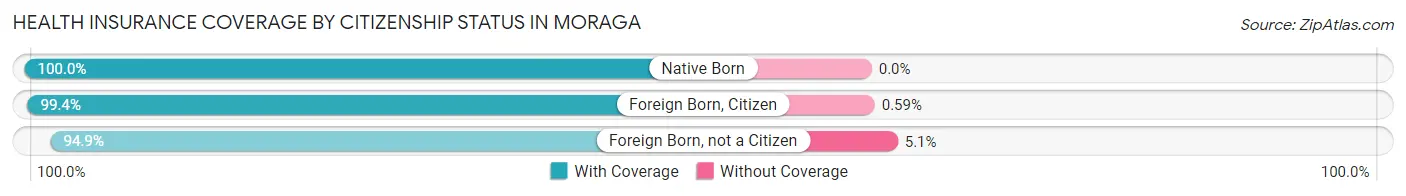
| Citizenship Status | With Coverage | Without Coverage |
| Native Born | 890 (100.0%) | 0 (0.0%) |
| Foreign Born, Citizen | 3,197 (99.4%) | 19 (0.6%) |
| Foreign Born, not a Citizen | 2,245 (94.9%) | 121 (5.1%) |
Health Insurance Coverage by Household Income in Moraga
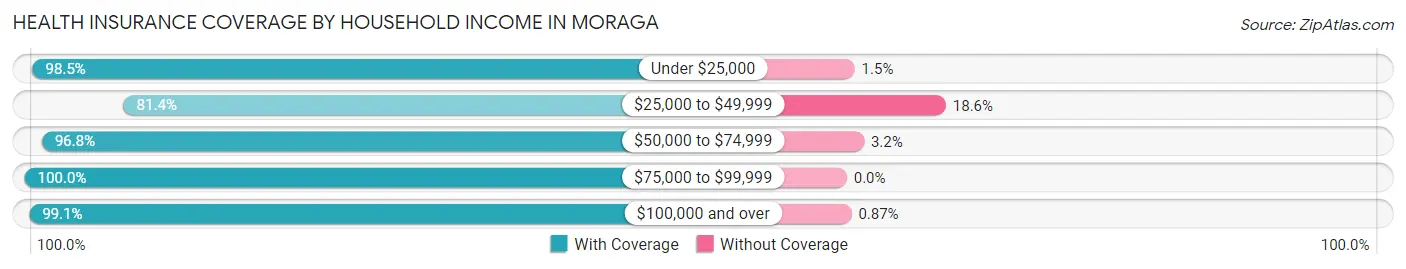
| Household Income | With Coverage | Without Coverage |
| Under $25,000 | 1,073 (98.5%) | 16 (1.5%) |
| $25,000 to $49,999 | 329 (81.4%) | 75 (18.6%) |
| $50,000 to $74,999 | 871 (96.8%) | 29 (3.2%) |
| $75,000 to $99,999 | 855 (100.0%) | 0 (0.0%) |
| $100,000 and over | 11,820 (99.1%) | 104 (0.9%) |
Public vs Private Health Insurance Coverage by Age in Moraga
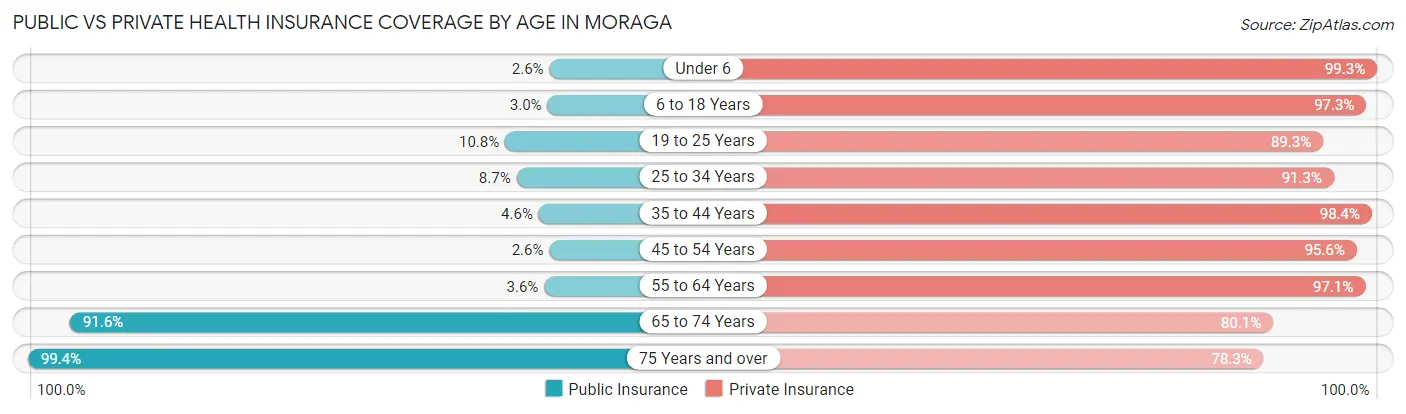
| Age Bracket | Public Insurance | Private Insurance |
| Under 6 | 23 (2.6%) | 884 (99.3%) |
| 6 to 18 Years | 95 (2.9%) | 3,130 (97.3%) |
| 19 to 25 Years | 256 (10.8%) | 2,113 (89.3%) |
| 25 to 34 Years | 65 (8.7%) | 682 (91.3%) |
| 35 to 44 Years | 90 (4.6%) | 1,937 (98.4%) |
| 45 to 54 Years | 54 (2.6%) | 1,983 (95.6%) |
| 55 to 64 Years | 73 (3.6%) | 1,990 (97.1%) |
| 65 to 74 Years | 1,685 (91.6%) | 1,473 (80.0%) |
| 75 Years and over | 1,657 (99.4%) | 1,305 (78.3%) |
| Total | 3,998 (23.8%) | 15,497 (92.1%) |
Disability Status by Sex by Age in Moraga
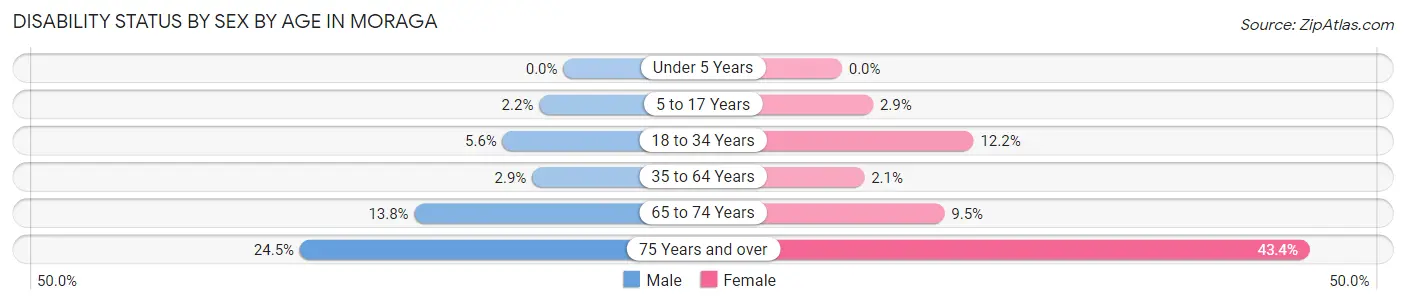
| Age Bracket | Male | Female |
| Under 5 Years | 0 (0.0%) | 0 (0.0%) |
| 5 to 17 Years | 31 (2.2%) | 40 (2.9%) |
| 18 to 34 Years | 91 (5.6%) | 257 (12.2%) |
| 35 to 64 Years | 83 (2.9%) | 67 (2.1%) |
| 65 to 74 Years | 128 (13.8%) | 87 (9.5%) |
| 75 Years and over | 188 (24.4%) | 390 (43.4%) |
Disability Class by Sex by Age in Moraga
Disability Class: Hearing Difficulty
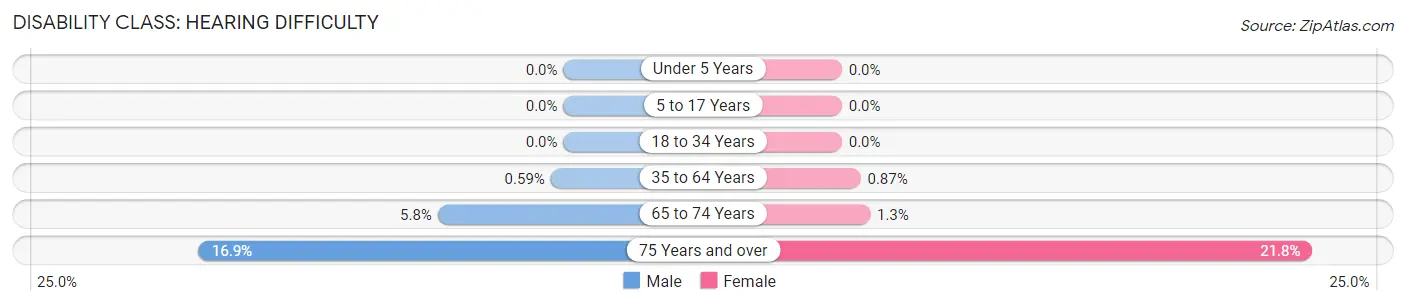
| Age Bracket | Male | Female |
| Under 5 Years | 0 (0.0%) | 0 (0.0%) |
| 5 to 17 Years | 0 (0.0%) | 0 (0.0%) |
| 18 to 34 Years | 0 (0.0%) | 0 (0.0%) |
| 35 to 64 Years | 17 (0.6%) | 28 (0.9%) |
| 65 to 74 Years | 54 (5.8%) | 12 (1.3%) |
| 75 Years and over | 130 (16.9%) | 196 (21.8%) |
Disability Class: Vision Difficulty
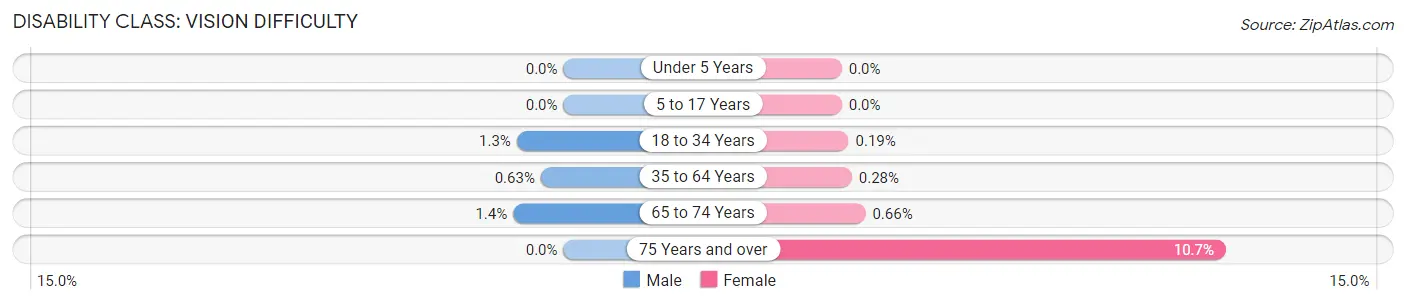
| Age Bracket | Male | Female |
| Under 5 Years | 0 (0.0%) | 0 (0.0%) |
| 5 to 17 Years | 0 (0.0%) | 0 (0.0%) |
| 18 to 34 Years | 21 (1.3%) | 4 (0.2%) |
| 35 to 64 Years | 18 (0.6%) | 9 (0.3%) |
| 65 to 74 Years | 13 (1.4%) | 6 (0.7%) |
| 75 Years and over | 0 (0.0%) | 96 (10.7%) |
Disability Class: Cognitive Difficulty
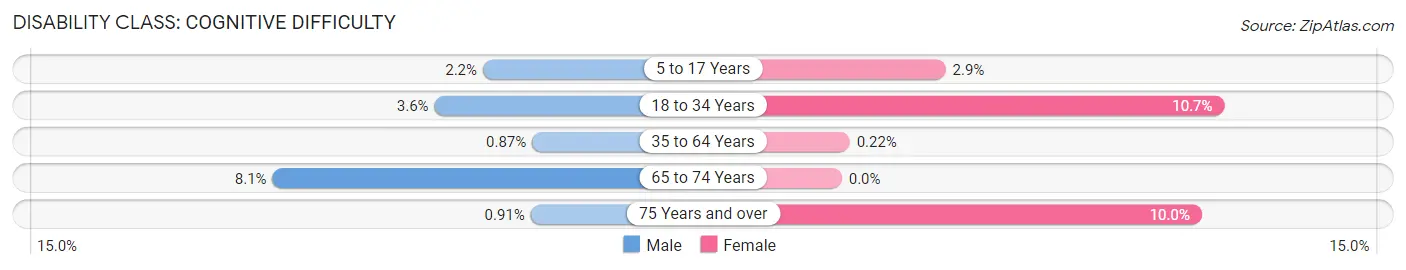
| Age Bracket | Male | Female |
| 5 to 17 Years | 31 (2.2%) | 40 (2.9%) |
| 18 to 34 Years | 58 (3.6%) | 224 (10.6%) |
| 35 to 64 Years | 25 (0.9%) | 7 (0.2%) |
| 65 to 74 Years | 75 (8.1%) | 0 (0.0%) |
| 75 Years and over | 7 (0.9%) | 90 (10.0%) |
Disability Class: Ambulatory Difficulty
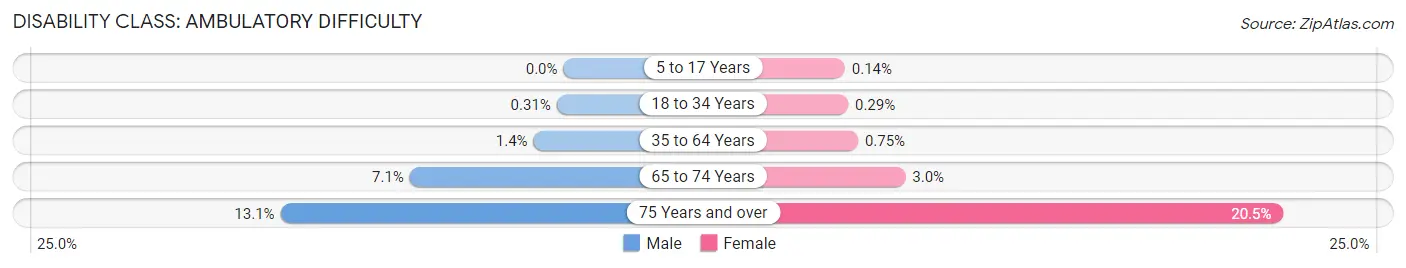
| Age Bracket | Male | Female |
| 5 to 17 Years | 0 (0.0%) | 2 (0.1%) |
| 18 to 34 Years | 5 (0.3%) | 6 (0.3%) |
| 35 to 64 Years | 40 (1.4%) | 24 (0.7%) |
| 65 to 74 Years | 66 (7.1%) | 27 (2.9%) |
| 75 Years and over | 101 (13.1%) | 184 (20.5%) |
Disability Class: Self-Care Difficulty
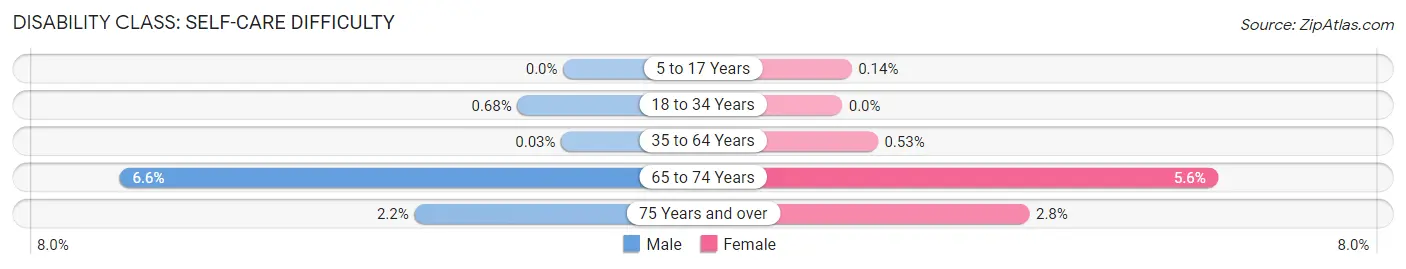
| Age Bracket | Male | Female |
| 5 to 17 Years | 0 (0.0%) | 2 (0.1%) |
| 18 to 34 Years | 11 (0.7%) | 0 (0.0%) |
| 35 to 64 Years | 1 (0.0%) | 17 (0.5%) |
| 65 to 74 Years | 61 (6.6%) | 51 (5.6%) |
| 75 Years and over | 17 (2.2%) | 25 (2.8%) |
Technology Access in Moraga
Computing Device Access in Moraga
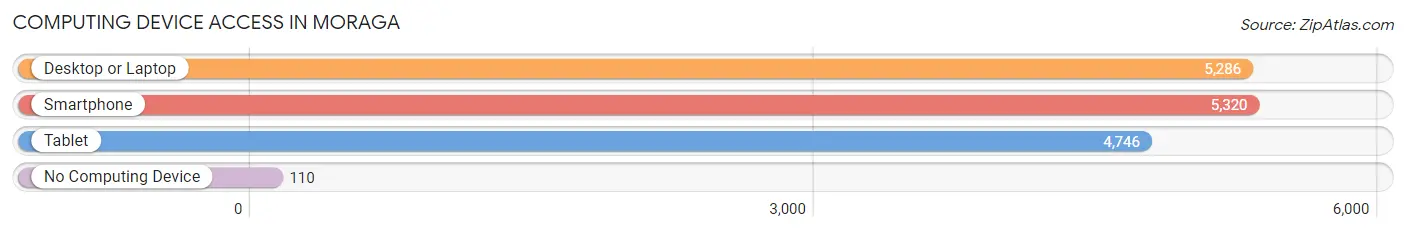
| Device Type | # Households | % Households |
| Desktop or Laptop | 5,286 | 94.2% |
| Smartphone | 5,320 | 94.8% |
| Tablet | 4,746 | 84.6% |
| No Computing Device | 110 | 2.0% |
| Total | 5,610 | 100.0% |
Internet Access in Moraga
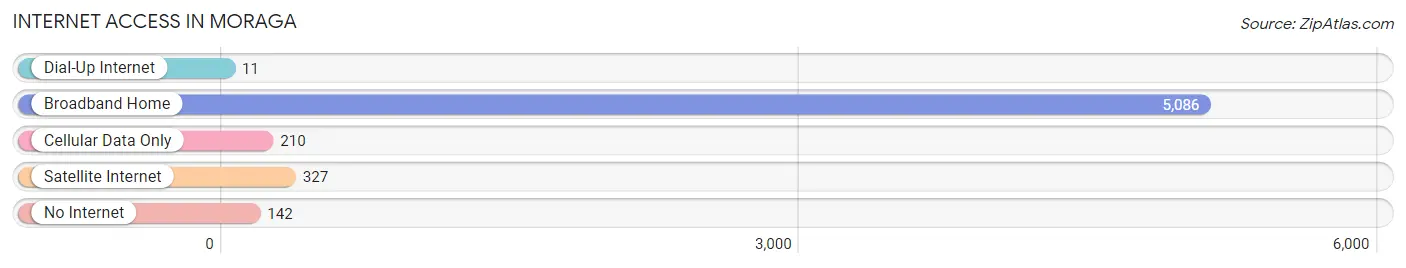
| Internet Type | # Households | % Households |
| Dial-Up Internet | 11 | 0.2% |
| Broadband Home | 5,086 | 90.7% |
| Cellular Data Only | 210 | 3.7% |
| Satellite Internet | 327 | 5.8% |
| No Internet | 142 | 2.5% |
| Total | 5,610 | 100.0% |
Moraga Summary
Moraga, California is a small town located in Contra Costa County, in the San Francisco Bay Area. It is situated in the East Bay region, about 17 miles east of Oakland and 25 miles northeast of San Francisco. The town has a population of approximately 17,000 people and covers an area of 8.8 square miles.
History
Moraga was founded in the mid-1800s by Joaquin Moraga, a Spanish soldier and rancher. He was the grandson of Jose Joaquin Moraga, who was the founder of the city of San Jose. The town was originally known as Moraga Valley, and it was a rural farming community. In the early 1900s, the town began to grow and develop, and it was incorporated in 1974.
Geography
Moraga is located in the East Bay region of the San Francisco Bay Area. It is situated in the foothills of the Diablo Range, and it is surrounded by rolling hills and open space. The town is located at an elevation of about 500 feet, and it has a Mediterranean climate with mild winters and hot, dry summers.
Economy
The economy of Moraga is largely based on the service industry. The town is home to several businesses, including restaurants, retail stores, and professional services. The town also has a number of educational institutions, including Saint Mary's College of California and Campolindo High School.
Demographics
As of the 2010 census, the population of Moraga was 17,000. The racial makeup of the town was 79.3% White, 8.2% Asian, 6.2% Hispanic or Latino, and 4.3% African American. The median household income was $118,000, and the median age was 44.
Moraga is a small town with a rich history and a diverse population. It is a great place to live, work, and raise a family. The town has a strong economy and a great quality of life, and it is a great place to call home.
Common Questions
What is Per Capita Income in Moraga?
Per Capita income in Moraga is $88,262.
What is the Median Family Income in Moraga?
Median Family Income in Moraga is $245,451.
What is the Median Household income in Moraga?
Median Household Income in Moraga is $193,707.
What is Income or Wage Gap in Moraga?
Income or Wage Gap in Moraga is 65.8%.
Women in Moraga earn 34.2 cents for every dollar earned by a man.
What is Inequality or Gini Index in Moraga?
Inequality or Gini Index in Moraga is 0.46.
What is the Total Population of Moraga?
Total Population of Moraga is 16,859.
What is the Total Male Population of Moraga?
Total Male Population of Moraga is 8,020.
What is the Total Female Population of Moraga?
Total Female Population of Moraga is 8,839.
What is the Ratio of Males per 100 Females in Moraga?
There are 90.73 Males per 100 Females in Moraga.
What is the Ratio of Females per 100 Males in Moraga?
There are 110.21 Females per 100 Males in Moraga.
What is the Median Population Age in Moraga?
Median Population Age in Moraga is 41.3 Years.
What is the Average Family Size in Moraga
Average Family Size in Moraga is 3.1 People.
What is the Average Household Size in Moraga
Average Household Size in Moraga is 2.7 People.
How Large is the Labor Force in Moraga?
There are 7,871 People in the Labor Forcein in Moraga.
What is the Percentage of People in the Labor Force in Moraga?
57.4% of People are in the Labor Force in Moraga.
What is the Unemployment Rate in Moraga?
Unemployment Rate in Moraga is 5.3%.