Cities with the Highest Percentage of Population Employed in Legal Services & Support in Louisiana
RELATED REPORTS & OPTIONS
Legal Services & Support
Louisiana
Compare Cities
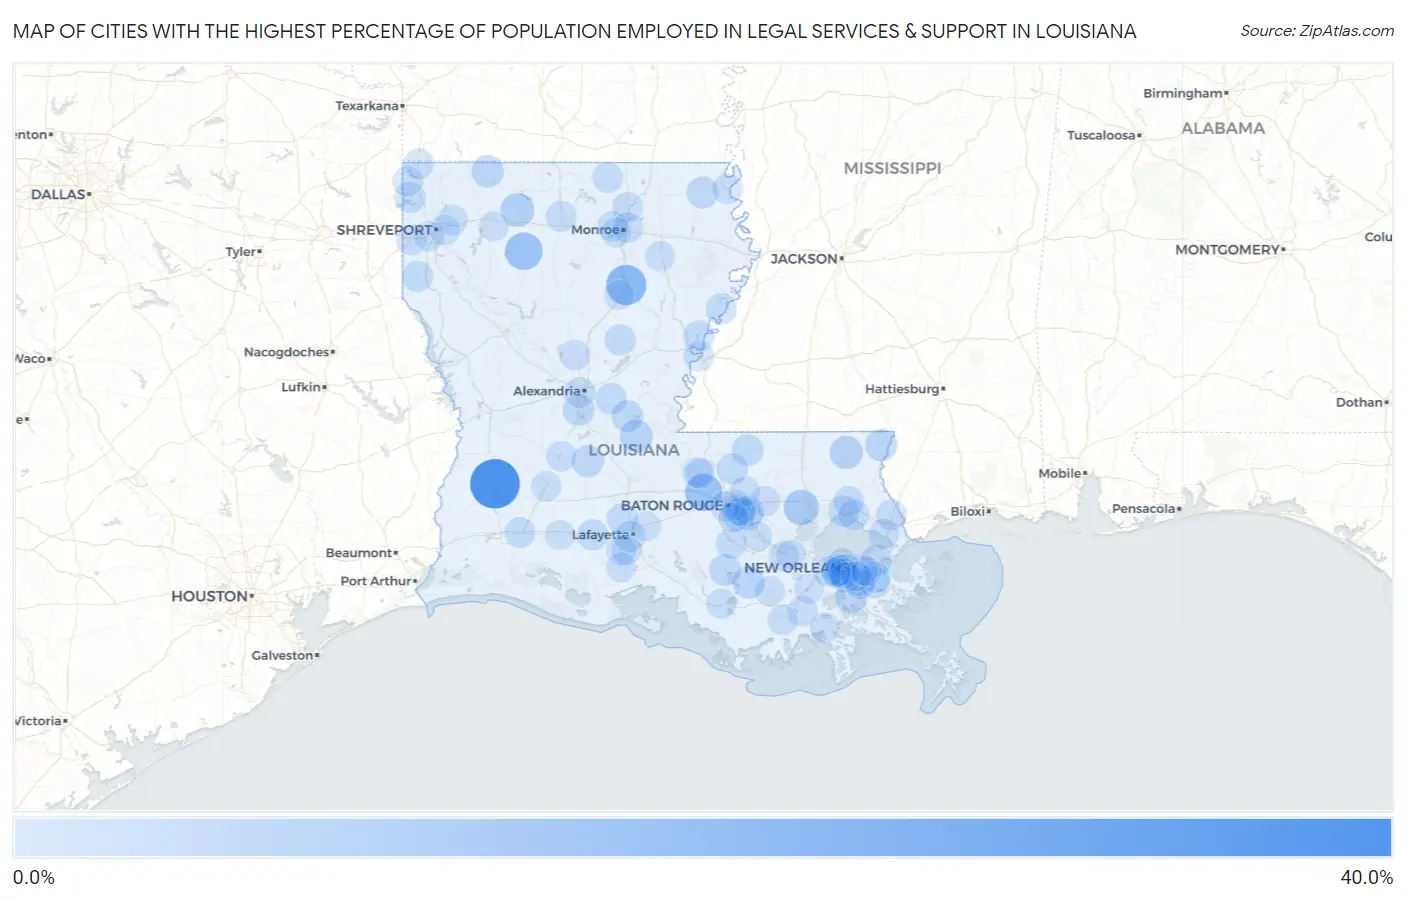
Map of Cities with the Highest Percentage of Population Employed in Legal Services & Support in Louisiana
0.0%
40.0%
Cities with the Highest Percentage of Population Employed in Legal Services & Support in Louisiana
| City | % Employed | vs State | vs National | |
| 1. | Longville | 36.4% | 1.3%(+35.0)#1 | 1.2%(+35.2)#18 |
| 2. | Columbia | 19.0% | 1.3%(+17.6)#2 | 1.2%(+17.8)#67 |
| 3. | Bienville | 13.8% | 1.3%(+12.5)#3 | 1.2%(+12.7)#124 |
| 4. | Erwinville | 13.4% | 1.3%(+12.1)#4 | 1.2%(+12.3)#132 |
| 5. | Springfield | 9.9% | 1.3%(+8.55)#5 | 1.2%(+8.70)#229 |
| 6. | Athens | 7.4% | 1.3%(+6.12)#6 | 1.2%(+6.26)#385 |
| 7. | Franklinton | 6.5% | 1.3%(+5.12)#7 | 1.2%(+5.27)#522 |
| 8. | Plaucheville | 6.0% | 1.3%(+4.67)#8 | 1.2%(+4.82)#603 |
| 9. | Supreme | 5.2% | 1.3%(+3.86)#9 | 1.2%(+4.01)#790 |
| 10. | Shongaloo | 5.1% | 1.3%(+3.80)#10 | 1.2%(+3.94)#816 |
| 11. | Jean Lafitte | 4.7% | 1.3%(+3.39)#11 | 1.2%(+3.54)#937 |
| 12. | Oak Hills Place | 4.6% | 1.3%(+3.26)#12 | 1.2%(+3.40)#986 |
| 13. | Varnado | 4.5% | 1.3%(+3.21)#13 | 1.2%(+3.36)#1,004 |
| 14. | Pierre Part | 4.3% | 1.3%(+2.95)#14 | 1.2%(+3.10)#1,094 |
| 15. | Jefferson | 4.3% | 1.3%(+2.94)#15 | 1.2%(+3.09)#1,099 |
| 16. | Forest | 4.2% | 1.3%(+2.84)#16 | 1.2%(+2.98)#1,148 |
| 17. | Pine Prairie | 4.1% | 1.3%(+2.81)#17 | 1.2%(+2.96)#1,158 |
| 18. | Marksville | 4.0% | 1.3%(+2.68)#18 | 1.2%(+2.83)#1,223 |
| 19. | River Ridge | 3.9% | 1.3%(+2.61)#19 | 1.2%(+2.76)#1,261 |
| 20. | Woodworth | 3.9% | 1.3%(+2.56)#20 | 1.2%(+2.71)#1,289 |
| 21. | Clinton | 3.6% | 1.3%(+2.26)#21 | 1.2%(+2.41)#1,465 |
| 22. | Timberlane | 3.5% | 1.3%(+2.20)#22 | 1.2%(+2.34)#1,515 |
| 23. | Madisonville | 3.3% | 1.3%(+1.98)#23 | 1.2%(+2.12)#1,680 |
| 24. | Center Point | 3.3% | 1.3%(+1.95)#24 | 1.2%(+2.10)#1,695 |
| 25. | New Orleans | 3.2% | 1.3%(+1.91)#25 | 1.2%(+2.05)#1,723 |
| 26. | Poydras | 3.1% | 1.3%(+1.81)#26 | 1.2%(+1.95)#1,818 |
| 27. | Spokane | 3.0% | 1.3%(+1.70)#27 | 1.2%(+1.85)#1,892 |
| 28. | St Joseph | 3.0% | 1.3%(+1.64)#28 | 1.2%(+1.78)#1,965 |
| 29. | Slaughter | 2.9% | 1.3%(+1.61)#29 | 1.2%(+1.76)#1,993 |
| 30. | Crowley | 2.8% | 1.3%(+1.50)#30 | 1.2%(+1.64)#2,097 |
| 31. | Cankton | 2.8% | 1.3%(+1.44)#31 | 1.2%(+1.58)#2,170 |
| 32. | Oil City | 2.8% | 1.3%(+1.42)#32 | 1.2%(+1.57)#2,184 |
| 33. | Jena | 2.7% | 1.3%(+1.36)#33 | 1.2%(+1.50)#2,248 |
| 34. | Keachi | 2.7% | 1.3%(+1.34)#34 | 1.2%(+1.48)#2,267 |
| 35. | Lafayette | 2.7% | 1.3%(+1.33)#35 | 1.2%(+1.48)#2,274 |
| 36. | Iowa | 2.6% | 1.3%(+1.29)#36 | 1.2%(+1.44)#2,323 |
| 37. | Elmwood | 2.6% | 1.3%(+1.28)#37 | 1.2%(+1.43)#2,331 |
| 38. | Pearl River | 2.5% | 1.3%(+1.16)#38 | 1.2%(+1.31)#2,453 |
| 39. | Metairie | 2.4% | 1.3%(+1.12)#39 | 1.2%(+1.26)#2,507 |
| 40. | Alexandria | 2.4% | 1.3%(+1.09)#40 | 1.2%(+1.24)#2,551 |
| 41. | Harahan | 2.4% | 1.3%(+1.09)#41 | 1.2%(+1.23)#2,561 |
| 42. | Mandeville | 2.4% | 1.3%(+1.05)#42 | 1.2%(+1.20)#2,610 |
| 43. | Westwego | 2.3% | 1.3%(+1.01)#43 | 1.2%(+1.16)#2,665 |
| 44. | Vienna | 2.3% | 1.3%(+0.995)#44 | 1.2%(+1.14)#2,686 |
| 45. | Old Jefferson | 2.3% | 1.3%(+0.929)#45 | 1.2%(+1.08)#2,778 |
| 46. | Marion | 2.2% | 1.3%(+0.862)#46 | 1.2%(+1.01)#2,880 |
| 47. | Sterlington | 2.2% | 1.3%(+0.822)#47 | 1.2%(+0.969)#2,957 |
| 48. | White Castle | 2.1% | 1.3%(+0.771)#48 | 1.2%(+0.918)#3,035 |
| 49. | Violet | 2.1% | 1.3%(+0.745)#49 | 1.2%(+0.892)#3,082 |
| 50. | Ama | 2.0% | 1.3%(+0.710)#50 | 1.2%(+0.857)#3,135 |
| 51. | Belle Chasse | 2.0% | 1.3%(+0.709)#51 | 1.2%(+0.856)#3,145 |
| 52. | Claiborne | 2.0% | 1.3%(+0.672)#52 | 1.2%(+0.819)#3,212 |
| 53. | Westminster | 2.0% | 1.3%(+0.650)#53 | 1.2%(+0.797)#3,251 |
| 54. | Mangham | 1.9% | 1.3%(+0.611)#54 | 1.2%(+0.758)#3,326 |
| 55. | Covington | 1.9% | 1.3%(+0.602)#55 | 1.2%(+0.749)#3,338 |
| 56. | New Roads | 1.9% | 1.3%(+0.578)#56 | 1.2%(+0.725)#3,387 |
| 57. | Baton Rouge | 1.9% | 1.3%(+0.550)#57 | 1.2%(+0.697)#3,454 |
| 58. | Walker | 1.9% | 1.3%(+0.534)#58 | 1.2%(+0.680)#3,484 |
| 59. | Red Chute | 1.9% | 1.3%(+0.532)#59 | 1.2%(+0.679)#3,487 |
| 60. | Eden Isle | 1.8% | 1.3%(+0.510)#60 | 1.2%(+0.657)#3,533 |
| 61. | Dry Prong | 1.8% | 1.3%(+0.504)#61 | 1.2%(+0.651)#3,550 |
| 62. | Greenwood | 1.8% | 1.3%(+0.502)#62 | 1.2%(+0.649)#3,558 |
| 63. | Shenandoah | 1.8% | 1.3%(+0.464)#63 | 1.2%(+0.611)#3,657 |
| 64. | Lake Providence | 1.8% | 1.3%(+0.446)#64 | 1.2%(+0.593)#3,695 |
| 65. | Oakdale | 1.8% | 1.3%(+0.443)#65 | 1.2%(+0.590)#3,705 |
| 66. | Vidalia | 1.8% | 1.3%(+0.429)#66 | 1.2%(+0.576)#3,728 |
| 67. | Gramercy | 1.7% | 1.3%(+0.347)#67 | 1.2%(+0.494)#3,947 |
| 68. | Port Allen | 1.7% | 1.3%(+0.323)#68 | 1.2%(+0.469)#3,995 |
| 69. | Ventress | 1.6% | 1.3%(+0.312)#69 | 1.2%(+0.459)#4,018 |
| 70. | Bridge City | 1.6% | 1.3%(+0.270)#70 | 1.2%(+0.416)#4,122 |
| 71. | Arabi | 1.6% | 1.3%(+0.256)#71 | 1.2%(+0.403)#4,157 |
| 72. | New Orleans Station | 1.6% | 1.3%(+0.225)#72 | 1.2%(+0.372)#4,238 |
| 73. | Lockport | 1.5% | 1.3%(+0.213)#73 | 1.2%(+0.359)#4,277 |
| 74. | Shreveport | 1.5% | 1.3%(+0.194)#74 | 1.2%(+0.341)#4,333 |
| 75. | Oberlin | 1.5% | 1.3%(+0.191)#75 | 1.2%(+0.338)#4,340 |
| 76. | Vivian | 1.5% | 1.3%(+0.142)#76 | 1.2%(+0.289)#4,506 |
| 77. | Monroe | 1.5% | 1.3%(+0.137)#77 | 1.2%(+0.283)#4,528 |
| 78. | Ida | 1.4% | 1.3%(+0.098)#78 | 1.2%(+0.245)#4,646 |
| 79. | Houma | 1.4% | 1.3%(+0.053)#79 | 1.2%(+0.200)#4,796 |
| 80. | Berwick | 1.4% | 1.3%(+0.043)#80 | 1.2%(+0.190)#4,827 |
| 81. | Maurice | 1.4% | 1.3%(+0.041)#81 | 1.2%(+0.187)#4,833 |
| 82. | Milton | 1.3% | 1.3%(+0.006)#82 | 1.2%(+0.152)#4,945 |
| 83. | Bossier City | 1.3% | 1.3%(+0.004)#83 | 1.2%(+0.151)#4,951 |
| 84. | Des Allemands | 1.3% | 1.3%(-0.007)#84 | 1.2%(+0.139)#4,992 |
| 85. | Gretna | 1.3% | 1.3%(-0.008)#85 | 1.2%(+0.139)#4,996 |
| 86. | Brownsville | 1.3% | 1.3%(-0.032)#86 | 1.2%(+0.115)#5,062 |
| 87. | Cut Off | 1.3% | 1.3%(-0.054)#87 | 1.2%(+0.092)#5,141 |
| 88. | Waggaman | 1.3% | 1.3%(-0.058)#88 | 1.2%(+0.089)#5,153 |
| 89. | Inniswold | 1.3% | 1.3%(-0.080)#89 | 1.2%(+0.067)#5,252 |
| 90. | Clarks | 1.2% | 1.3%(-0.096)#90 | 1.2%(+0.051)#5,305 |
| 91. | Jennings | 1.2% | 1.3%(-0.104)#91 | 1.2%(+0.043)#5,346 |
| 92. | Central | 1.2% | 1.3%(-0.137)#92 | 1.2%(+0.010)#5,468 |
| 93. | Breaux Bridge | 1.2% | 1.3%(-0.155)#93 | 1.2%(-0.009)#5,544 |
| 94. | Dubberly | 1.2% | 1.3%(-0.161)#94 | 1.2%(-0.014)#5,569 |
| 95. | Gonzales | 1.2% | 1.3%(-0.173)#95 | 1.2%(-0.026)#5,619 |
| 96. | Thibodaux | 1.1% | 1.3%(-0.207)#96 | 1.2%(-0.060)#5,758 |
| 97. | Chalmette | 1.1% | 1.3%(-0.208)#97 | 1.2%(-0.061)#5,767 |
| 98. | Garyville | 1.1% | 1.3%(-0.257)#98 | 1.2%(-0.110)#5,990 |
| 99. | Gardere | 1.1% | 1.3%(-0.259)#99 | 1.2%(-0.113)#6,004 |
| 100. | Abbeville | 1.1% | 1.3%(-0.259)#100 | 1.2%(-0.113)#6,005 |
Common Questions
What are the Top 10 Cities with the Highest Percentage of Population Employed in Legal Services & Support in Louisiana?
Top 10 Cities with the Highest Percentage of Population Employed in Legal Services & Support in Louisiana are:
#1
36.4%
#2
19.0%
#3
13.8%
#4
13.4%
#5
9.9%
#6
7.4%
#7
6.5%
#8
6.0%
#9
5.2%
#10
5.1%
What city has the Highest Percentage of Population Employed in Legal Services & Support in Louisiana?
Longville has the Highest Percentage of Population Employed in Legal Services & Support in Louisiana with 36.4%.
What is the Percentage of Population Employed in Legal Services & Support in the State of Louisiana?
Percentage of Population Employed in Legal Services & Support in Louisiana is 1.3%.
What is the Percentage of Population Employed in Legal Services & Support in the United States?
Percentage of Population Employed in Legal Services & Support in the United States is 1.2%.