Newport Beach, CA Map & Demographics
Newport Beach Map
Newport Beach Overview
$110,535
PER CAPITA INCOME
$204,236
AVG FAMILY INCOME
$149,471
AVG HOUSEHOLD INCOME
45.1%
WAGE / INCOME GAP [ % ]
54.9¢/ $1
WAGE / INCOME GAP [ $ ]
$11,430
FAMILY INCOME DEFICIT
0.53
INEQUALITY / GINI INDEX
85,159
TOTAL POPULATION
41,980
MALE POPULATION
43,179
FEMALE POPULATION
97.22
MALES / 100 FEMALES
102.86
FEMALES / 100 MALES
46.7
MEDIAN AGE
2.8
AVG FAMILY SIZE
2.2
AVG HOUSEHOLD SIZE
45,232
LABOR FORCE [ PEOPLE ]
62.4%
PERCENT IN LABOR FORCE
4.1%
UNEMPLOYMENT RATE
Newport Beach Area Codes
Income in Newport Beach
Income Overview in Newport Beach
Per Capita Income in Newport Beach is $110,535, while median incomes of families and households are $204,236 and $149,471 respectively.
| Characteristic | Number | Measure |
| Per Capita Income | 85,159 | $110,535 |
| Median Family Income | 21,875 | $204,236 |
| Mean Family Income | 21,875 | $311,412 |
| Median Household Income | 38,636 | $149,471 |
| Mean Household Income | 38,636 | $240,906 |
| Income Deficit | 21,875 | $11,430 |
| Wage / Income Gap (%) | 85,159 | 45.06% |
| Wage / Income Gap ($) | 85,159 | 54.94¢ per $1 |
| Gini / Inequality Index | 85,159 | 0.53 |
Earnings by Sex in Newport Beach
Average Earnings in Newport Beach are $88,465, $115,909 for men and $63,679 for women, a difference of 45.1%.

| Sex | Number | Average Earnings |
| Male | 25,985 (55.2%) | $115,909 |
| Female | 21,074 (44.8%) | $63,679 |
| Total | 47,059 (100.0%) | $88,465 |
Earnings by Sex by Income Bracket in Newport Beach
The most common earnings brackets in Newport Beach are $100,000+ for men (14,573 | 56.1%) and $100,000+ for women (6,334 | 30.1%).
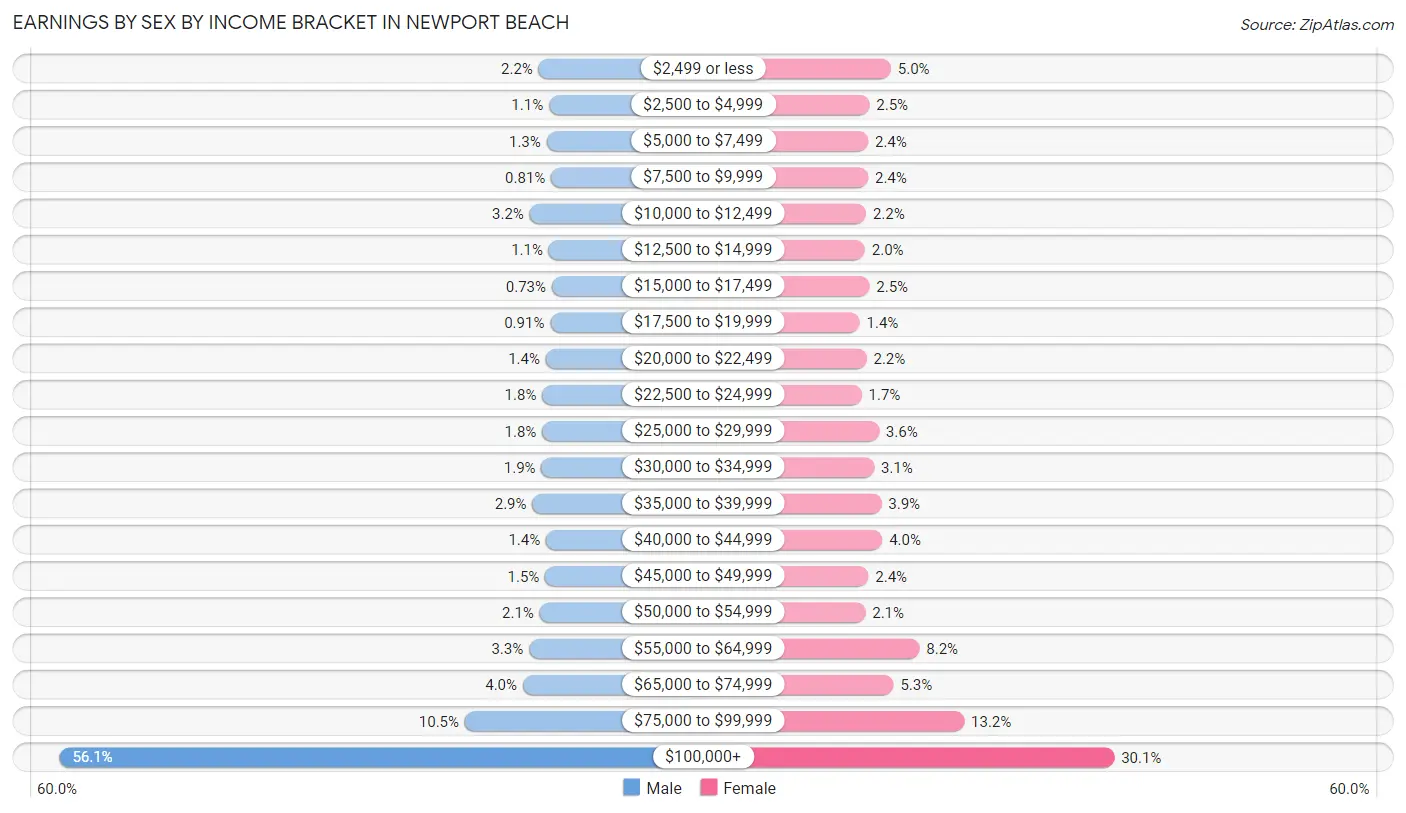
| Income | Male | Female |
| $2,499 or less | 573 (2.2%) | 1,043 (5.0%) |
| $2,500 to $4,999 | 273 (1.1%) | 536 (2.5%) |
| $5,000 to $7,499 | 343 (1.3%) | 504 (2.4%) |
| $7,500 to $9,999 | 211 (0.8%) | 503 (2.4%) |
| $10,000 to $12,499 | 836 (3.2%) | 456 (2.2%) |
| $12,500 to $14,999 | 277 (1.1%) | 428 (2.0%) |
| $15,000 to $17,499 | 190 (0.7%) | 535 (2.5%) |
| $17,500 to $19,999 | 236 (0.9%) | 304 (1.4%) |
| $20,000 to $22,499 | 366 (1.4%) | 467 (2.2%) |
| $22,500 to $24,999 | 470 (1.8%) | 349 (1.7%) |
| $25,000 to $29,999 | 472 (1.8%) | 761 (3.6%) |
| $30,000 to $34,999 | 494 (1.9%) | 644 (3.1%) |
| $35,000 to $39,999 | 760 (2.9%) | 817 (3.9%) |
| $40,000 to $44,999 | 358 (1.4%) | 839 (4.0%) |
| $45,000 to $49,999 | 385 (1.5%) | 511 (2.4%) |
| $50,000 to $54,999 | 545 (2.1%) | 439 (2.1%) |
| $55,000 to $64,999 | 855 (3.3%) | 1,719 (8.2%) |
| $65,000 to $74,999 | 1,036 (4.0%) | 1,106 (5.2%) |
| $75,000 to $99,999 | 2,732 (10.5%) | 2,779 (13.2%) |
| $100,000+ | 14,573 (56.1%) | 6,334 (30.1%) |
| Total | 25,985 (100.0%) | 21,074 (100.0%) |
Earnings by Sex by Educational Attainment in Newport Beach
Average earnings in Newport Beach are $125,560 for men and $70,485 for women, a difference of 43.9%. Men with an educational attainment of graduate degree enjoy the highest average annual earnings of $185,355, while those with less than high school education earn the least with $52,031. Women with an educational attainment of graduate degree earn the most with the average annual earnings of $100,009, while those with college or associate's degree education have the smallest earnings of $41,225.
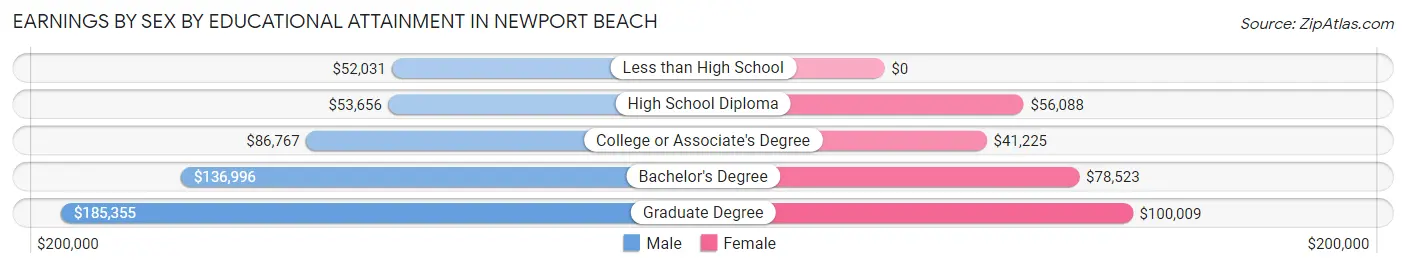
| Educational Attainment | Male Income | Female Income |
| Less than High School | $52,031 | $0 |
| High School Diploma | $53,656 | $56,088 |
| College or Associate's Degree | $86,767 | $41,225 |
| Bachelor's Degree | $136,996 | $78,523 |
| Graduate Degree | $185,355 | $100,009 |
| Total | $125,560 | $70,485 |
Family Income in Newport Beach
Family Income Brackets in Newport Beach
According to the Newport Beach family income data, there are 11,178 families falling into the $200,000+ income range, which is the most common income bracket and makes up 51.1% of all families. Conversely, the $10,000 to $14,999 income bracket is the least frequent group with only 328 families (1.5%) belonging to this category.
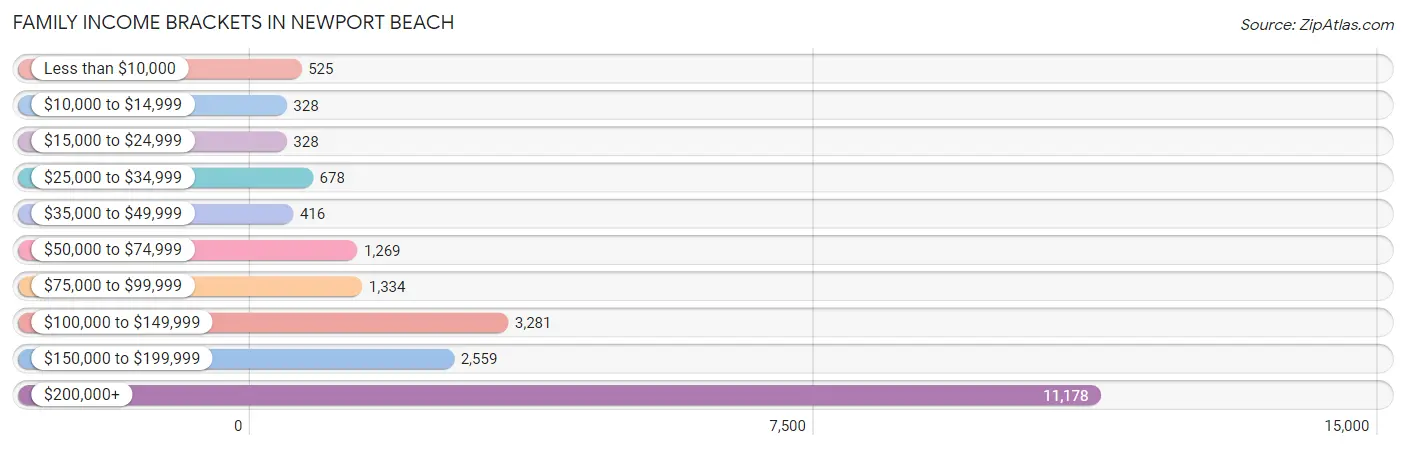
| Income Bracket | # Families | % Families |
| Less than $10,000 | 525 | 2.4% |
| $10,000 to $14,999 | 328 | 1.5% |
| $15,000 to $24,999 | 328 | 1.5% |
| $25,000 to $34,999 | 678 | 3.1% |
| $35,000 to $49,999 | 416 | 1.9% |
| $50,000 to $74,999 | 1,269 | 5.8% |
| $75,000 to $99,999 | 1,334 | 6.1% |
| $100,000 to $149,999 | 3,281 | 15.0% |
| $150,000 to $199,999 | 2,559 | 11.7% |
| $200,000+ | 11,178 | 51.1% |
Family Income by Famaliy Size in Newport Beach
4-person families (3,413 | 15.6%) account for the highest median family income in Newport Beach with $250,001 per family, while 2-person families (12,709 | 58.1%) have the highest median income of $87,085 per family member.
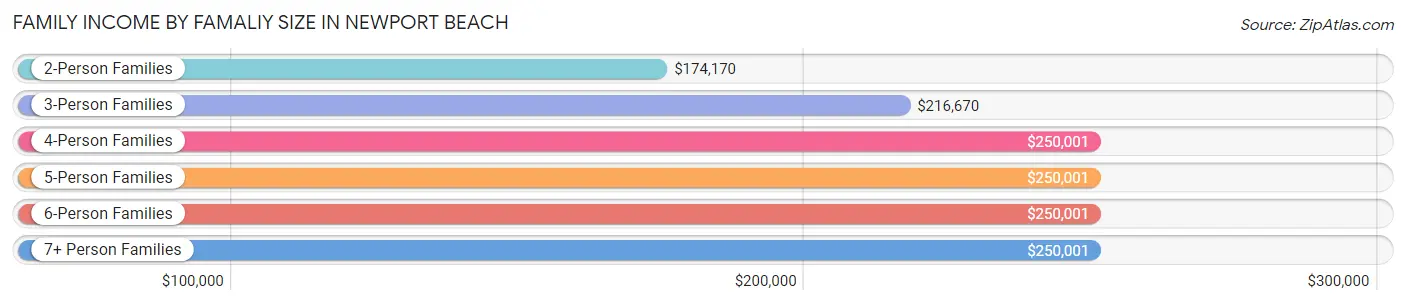
| Income Bracket | # Families | Median Income |
| 2-Person Families | 12,709 (58.1%) | $174,170 |
| 3-Person Families | 4,329 (19.8%) | $216,670 |
| 4-Person Families | 3,413 (15.6%) | $250,001 |
| 5-Person Families | 1,209 (5.5%) | $250,001 |
| 6-Person Families | 163 (0.7%) | $250,001 |
| 7+ Person Families | 52 (0.2%) | $250,001 |
| Total | 21,875 (100.0%) | $204,236 |
Family Income by Number of Earners in Newport Beach
The median family income in Newport Beach is $204,236, with families comprising 2 earners (8,642) having the highest median family income of $250,001, while families with no earners (3,985) have the lowest median family income of $113,583, accounting for 39.5% and 18.2% of families, respectively.
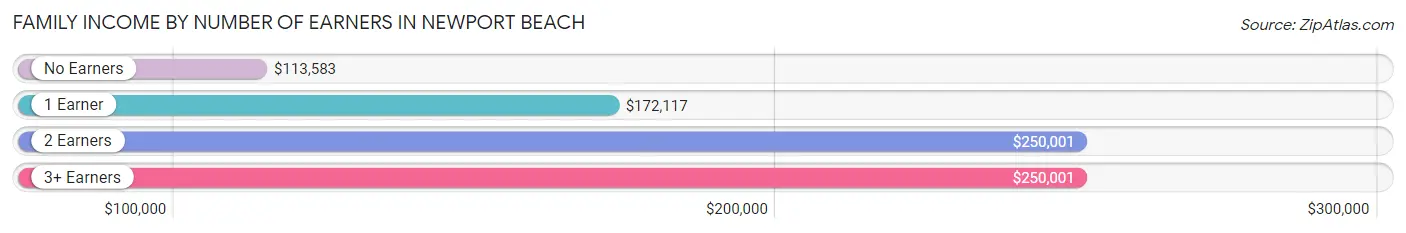
| Number of Earners | # Families | Median Income |
| No Earners | 3,985 (18.2%) | $113,583 |
| 1 Earner | 7,812 (35.7%) | $172,117 |
| 2 Earners | 8,642 (39.5%) | $250,001 |
| 3+ Earners | 1,436 (6.6%) | $250,001 |
| Total | 21,875 (100.0%) | $204,236 |
Household Income in Newport Beach
Household Income Brackets in Newport Beach
With 15,261 households falling in the category, the $200,000+ income range is the most frequent in Newport Beach, accounting for 39.5% of all households. In contrast, only 657 households (1.7%) fall into the $10,000 to $14,999 income bracket, making it the least populous group.
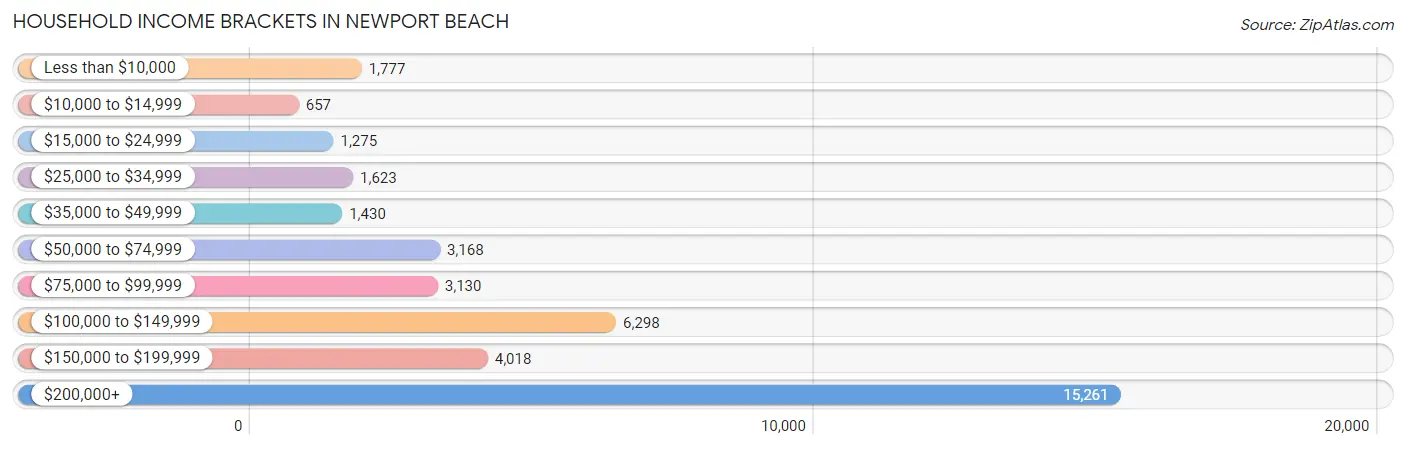
| Income Bracket | # Households | % Households |
| Less than $10,000 | 1,777 | 4.6% |
| $10,000 to $14,999 | 657 | 1.7% |
| $15,000 to $24,999 | 1,275 | 3.3% |
| $25,000 to $34,999 | 1,623 | 4.2% |
| $35,000 to $49,999 | 1,430 | 3.7% |
| $50,000 to $74,999 | 3,168 | 8.2% |
| $75,000 to $99,999 | 3,130 | 8.1% |
| $100,000 to $149,999 | 6,298 | 16.3% |
| $150,000 to $199,999 | 4,018 | 10.4% |
| $200,000+ | 15,261 | 39.5% |
Household Income by Householder Age in Newport Beach
The median household income in Newport Beach is $149,471, with the highest median household income of $202,844 found in the 45 to 64 years age bracket for the primary householder. A total of 14,675 households (38.0%) fall into this category. Meanwhile, the 15 to 24 years age bracket for the primary householder has the lowest median household income of $27,333, with 826 households (2.1%) in this group.
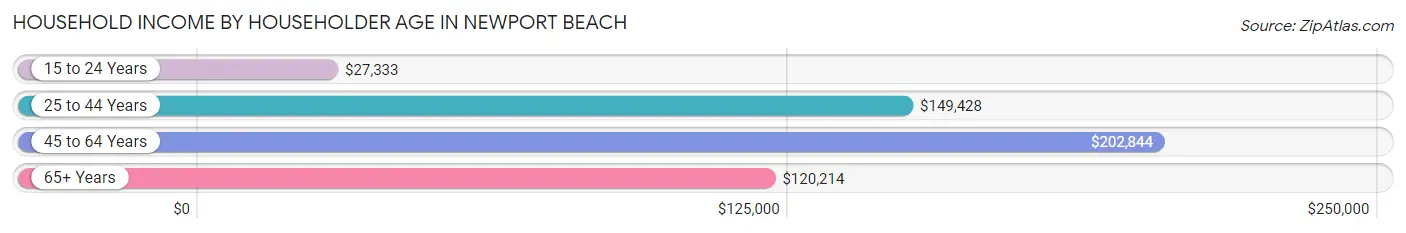
| Income Bracket | # Households | Median Income |
| 15 to 24 Years | 826 (2.1%) | $27,333 |
| 25 to 44 Years | 10,940 (28.3%) | $149,428 |
| 45 to 64 Years | 14,675 (38.0%) | $202,844 |
| 65+ Years | 12,195 (31.6%) | $120,214 |
| Total | 38,636 (100.0%) | $149,471 |
Poverty in Newport Beach
Income Below Poverty by Sex and Age in Newport Beach
With 6.8% poverty level for males and 9.1% for females among the residents of Newport Beach, 18 to 24 year old males and 15 year old females are the most vulnerable to poverty, with 1,025 males (33.7%) and 86 females (21.9%) in their respective age groups living below the poverty level.
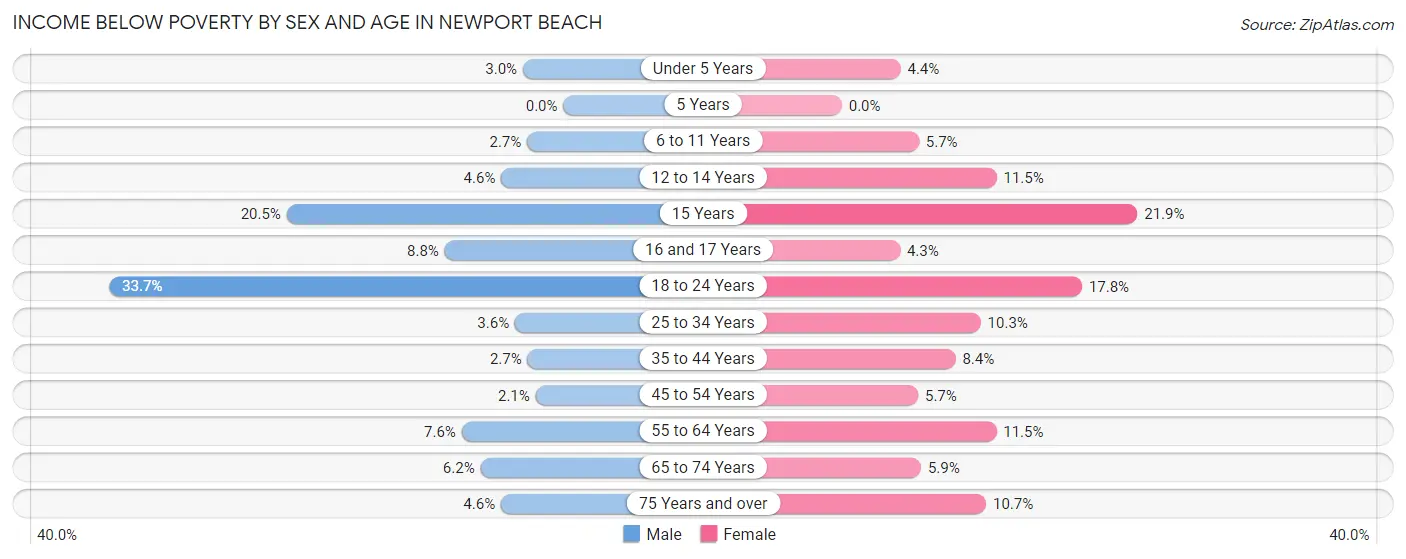
| Age Bracket | Male | Female |
| Under 5 Years | 50 (3.0%) | 63 (4.4%) |
| 5 Years | 0 (0.0%) | 0 (0.0%) |
| 6 to 11 Years | 57 (2.7%) | 143 (5.7%) |
| 12 to 14 Years | 77 (4.6%) | 177 (11.5%) |
| 15 Years | 152 (20.5%) | 86 (21.9%) |
| 16 and 17 Years | 84 (8.8%) | 29 (4.3%) |
| 18 to 24 Years | 1,025 (33.7%) | 428 (17.8%) |
| 25 to 34 Years | 201 (3.6%) | 558 (10.3%) |
| 35 to 44 Years | 136 (2.7%) | 432 (8.4%) |
| 45 to 54 Years | 116 (2.1%) | 318 (5.7%) |
| 55 to 64 Years | 456 (7.5%) | 804 (11.5%) |
| 65 to 74 Years | 289 (6.1%) | 338 (5.9%) |
| 75 Years and over | 200 (4.6%) | 522 (10.7%) |
| Total | 2,843 (6.8%) | 3,898 (9.1%) |
Income Above Poverty by Sex and Age in Newport Beach
According to the poverty statistics in Newport Beach, males aged 5 years and females aged 5 years are the age groups that are most secure financially, with 100.0% of males and 100.0% of females in these age groups living above the poverty line.
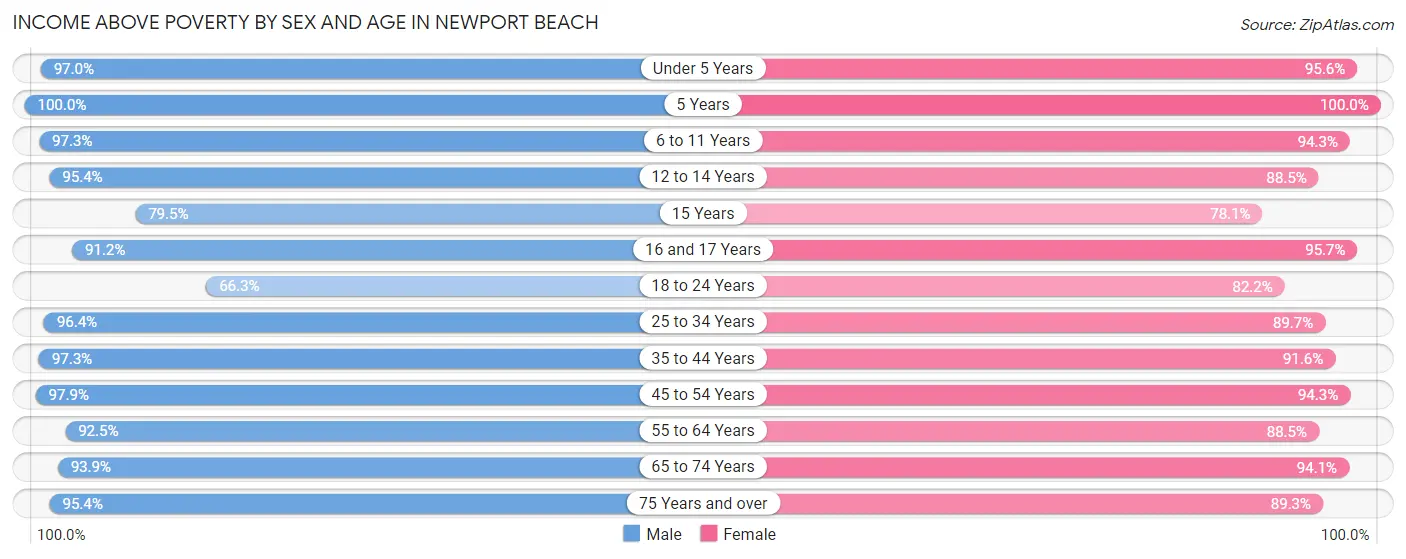
| Age Bracket | Male | Female |
| Under 5 Years | 1,618 (97.0%) | 1,383 (95.6%) |
| 5 Years | 290 (100.0%) | 269 (100.0%) |
| 6 to 11 Years | 2,059 (97.3%) | 2,357 (94.3%) |
| 12 to 14 Years | 1,593 (95.4%) | 1,363 (88.5%) |
| 15 Years | 588 (79.5%) | 306 (78.1%) |
| 16 and 17 Years | 869 (91.2%) | 643 (95.7%) |
| 18 to 24 Years | 2,015 (66.3%) | 1,972 (82.2%) |
| 25 to 34 Years | 5,392 (96.4%) | 4,852 (89.7%) |
| 35 to 44 Years | 4,986 (97.3%) | 4,684 (91.6%) |
| 45 to 54 Years | 5,507 (97.9%) | 5,304 (94.3%) |
| 55 to 64 Years | 5,583 (92.4%) | 6,205 (88.5%) |
| 65 to 74 Years | 4,410 (93.9%) | 5,413 (94.1%) |
| 75 Years and over | 4,120 (95.4%) | 4,353 (89.3%) |
| Total | 39,030 (93.2%) | 39,104 (90.9%) |
Income Below Poverty Among Married-Couple Families in Newport Beach
The poverty statistics for married-couple families in Newport Beach show that 2.9% or 524 of the total 17,863 families live below the poverty line. Families with no children have the highest poverty rate of 3.2%, comprising of 374 families. On the other hand, families with 3 or 4 children have the lowest poverty rate of 2.3%, which includes 22 families.
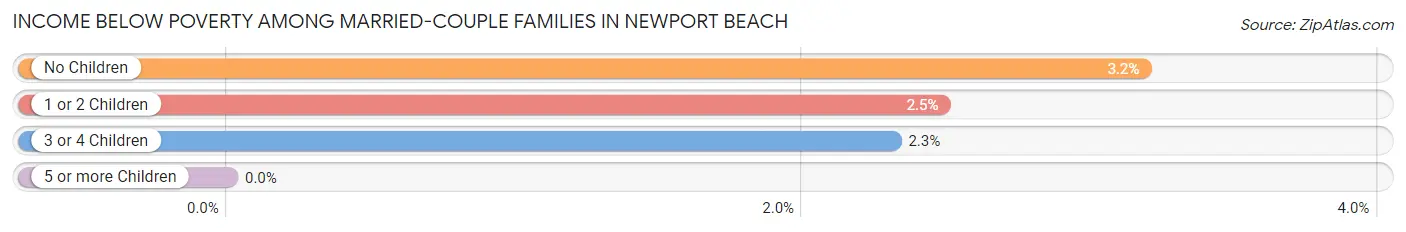
| Children | Above Poverty | Below Poverty |
| No Children | 11,381 (96.8%) | 374 (3.2%) |
| 1 or 2 Children | 5,028 (97.5%) | 128 (2.5%) |
| 3 or 4 Children | 930 (97.7%) | 22 (2.3%) |
| 5 or more Children | 0 (0.0%) | 0 (0.0%) |
| Total | 17,339 (97.1%) | 524 (2.9%) |
Income Below Poverty Among Single-Parent Households in Newport Beach
According to the poverty data in Newport Beach, 5.3% or 67 single-father households and 16.1% or 441 single-mother households are living below the poverty line. Among single-father households, those with 1 or 2 children have the highest poverty rate, with 50 households (8.2%) experiencing poverty. Likewise, among single-mother households, those with 3 or 4 children have the highest poverty rate, with 42 households (40.0%) falling below the poverty line.
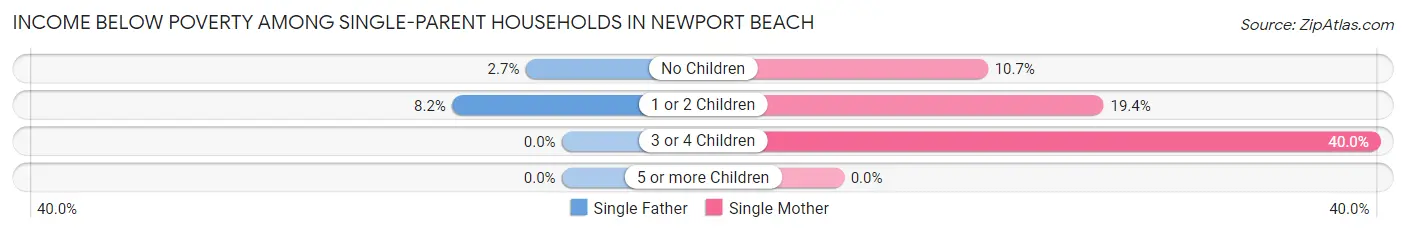
| Children | Single Father | Single Mother |
| No Children | 17 (2.7%) | 139 (10.7%) |
| 1 or 2 Children | 50 (8.2%) | 260 (19.4%) |
| 3 or 4 Children | 0 (0.0%) | 42 (40.0%) |
| 5 or more Children | 0 (0.0%) | 0 (0.0%) |
| Total | 67 (5.3%) | 441 (16.1%) |
Income Below Poverty Among Married-Couple vs Single-Parent Households in Newport Beach
The poverty data for Newport Beach shows that 524 of the married-couple family households (2.9%) and 508 of the single-parent households (12.7%) are living below the poverty level. Within the married-couple family households, those with no children have the highest poverty rate, with 374 households (3.2%) falling below the poverty line. Among the single-parent households, those with 3 or 4 children have the highest poverty rate, with 42 household (31.6%) living below poverty.
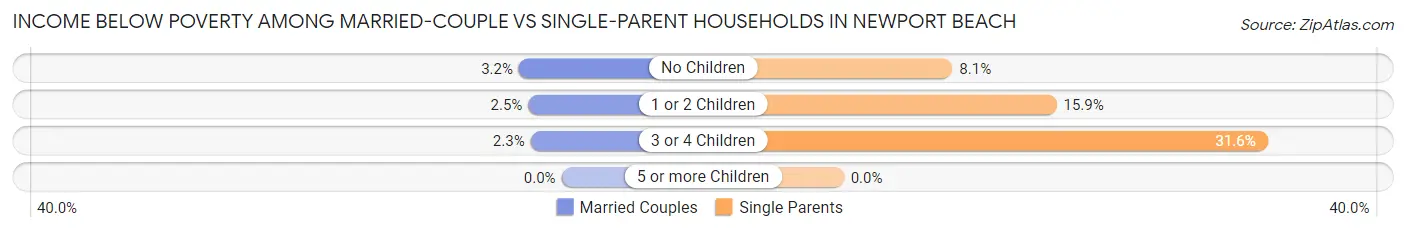
| Children | Married-Couple Families | Single-Parent Households |
| No Children | 374 (3.2%) | 156 (8.1%) |
| 1 or 2 Children | 128 (2.5%) | 310 (15.9%) |
| 3 or 4 Children | 22 (2.3%) | 42 (31.6%) |
| 5 or more Children | 0 (0.0%) | 0 (0.0%) |
| Total | 524 (2.9%) | 508 (12.7%) |
Race in Newport Beach
The most populous races in Newport Beach are White / Caucasian (67,972 | 79.8%), Hispanic or Latino (8,912 | 10.5%), and Two or more Races (7,447 | 8.7%).
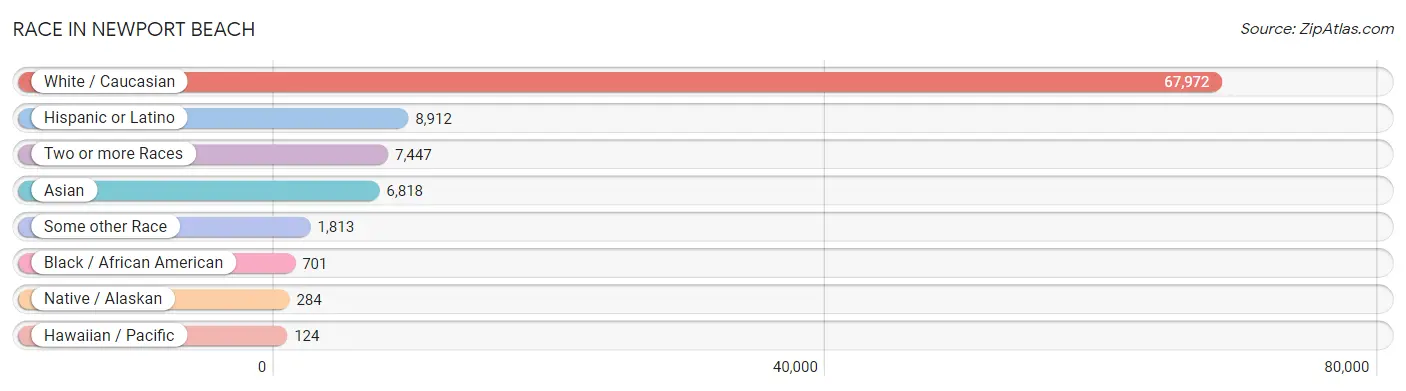
| Race | # Population | % Population |
| Asian | 6,818 | 8.0% |
| Black / African American | 701 | 0.8% |
| Hawaiian / Pacific | 124 | 0.2% |
| Hispanic or Latino | 8,912 | 10.5% |
| Native / Alaskan | 284 | 0.3% |
| White / Caucasian | 67,972 | 79.8% |
| Two or more Races | 7,447 | 8.7% |
| Some other Race | 1,813 | 2.1% |
| Total | 85,159 | 100.0% |
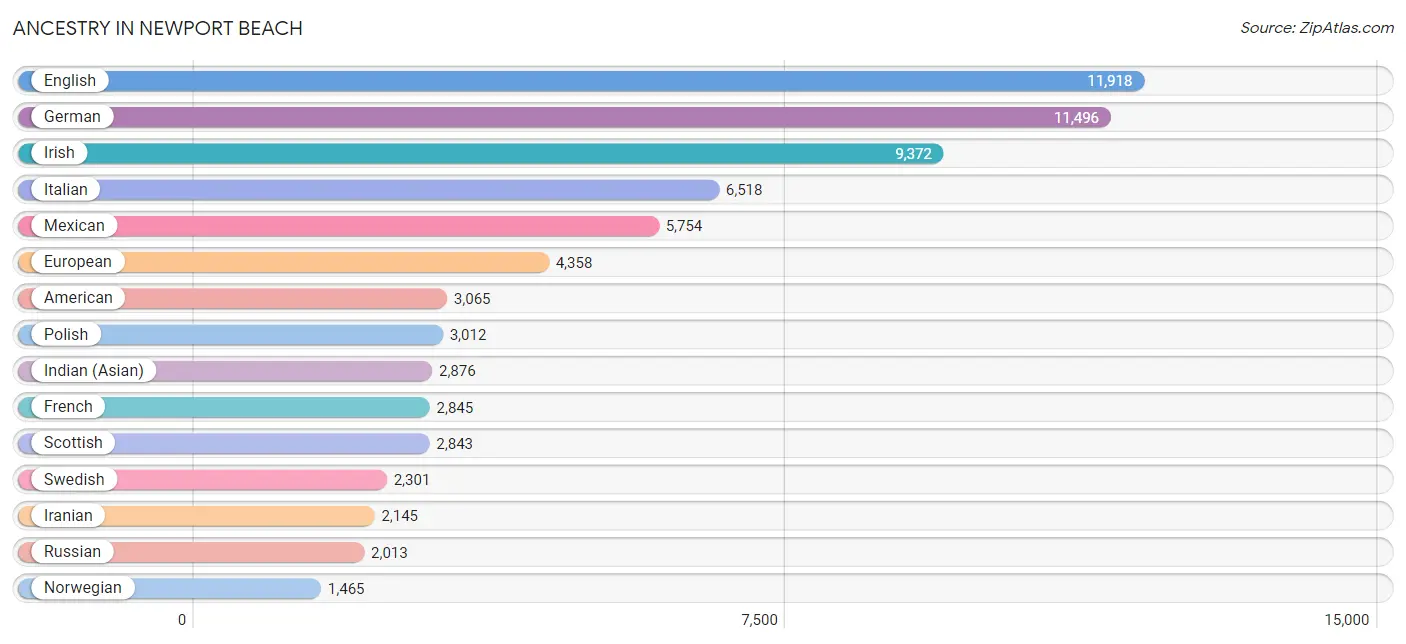
Ancestry in Newport Beach
The most populous ancestries reported in Newport Beach are English (11,918 | 14.0%), German (11,496 | 13.5%), Irish (9,372 | 11.0%), Italian (6,518 | 7.6%), and Mexican (5,754 | 6.8%), together accounting for 52.9% of all Newport Beach residents.
| Ancestry | # Population | % Population |
| African | 192 | 0.2% |
| Albanian | 110 | 0.1% |
| American | 3,065 | 3.6% |
| Apache | 5 | 0.0% |
| Arab | 996 | 1.2% |
| Argentinean | 272 | 0.3% |
| Armenian | 1,041 | 1.2% |
| Australian | 105 | 0.1% |
| Austrian | 467 | 0.5% |
| Basque | 29 | 0.0% |
| Belgian | 65 | 0.1% |
| Bhutanese | 1,047 | 1.2% |
| Blackfeet | 125 | 0.2% |
| Bolivian | 146 | 0.2% |
| Brazilian | 89 | 0.1% |
| British | 1,077 | 1.3% |
| Bulgarian | 7 | 0.0% |
| Burmese | 1,404 | 1.7% |
| Cajun | 38 | 0.0% |
| Canadian | 457 | 0.5% |
| Celtic | 85 | 0.1% |
| Central American | 383 | 0.4% |
| Cherokee | 160 | 0.2% |
| Chilean | 37 | 0.0% |
| Chippewa | 17 | 0.0% |
| Choctaw | 41 | 0.1% |
| Colombian | 201 | 0.2% |
| Creek | 34 | 0.0% |
| Croatian | 91 | 0.1% |
| Cuban | 204 | 0.2% |
| Czech | 283 | 0.3% |
| Czechoslovakian | 95 | 0.1% |
| Danish | 801 | 0.9% |
| Dominican | 72 | 0.1% |
| Dutch | 996 | 1.2% |
| Eastern European | 966 | 1.1% |
| Ecuadorian | 63 | 0.1% |
| Egyptian | 80 | 0.1% |
| English | 11,918 | 14.0% |
| Estonian | 11 | 0.0% |
| Ethiopian | 28 | 0.0% |
| European | 4,358 | 5.1% |
| Filipino | 529 | 0.6% |
| Finnish | 260 | 0.3% |
| French | 2,845 | 3.3% |
| French Canadian | 241 | 0.3% |
| German | 11,496 | 13.5% |
| Greek | 609 | 0.7% |
| Guamanian / Chamorro | 61 | 0.1% |
| Guatemalan | 156 | 0.2% |
| Haitian | 25 | 0.0% |
| Honduran | 17 | 0.0% |
| Hungarian | 579 | 0.7% |
| Icelander | 9 | 0.0% |
| Indian (Asian) | 2,876 | 3.4% |
| Indonesian | 28 | 0.0% |
| Iranian | 2,145 | 2.5% |
| Iraqi | 70 | 0.1% |
| Irish | 9,372 | 11.0% |
| Iroquois | 14 | 0.0% |
| Israeli | 58 | 0.1% |
| Italian | 6,518 | 7.6% |
| Japanese | 236 | 0.3% |
| Jordanian | 67 | 0.1% |
| Korean | 831 | 1.0% |
| Laotian | 107 | 0.1% |
| Latvian | 75 | 0.1% |
| Lebanese | 317 | 0.4% |
| Lithuanian | 179 | 0.2% |
| Luxembourger | 14 | 0.0% |
| Macedonian | 98 | 0.1% |
| Maltese | 99 | 0.1% |
| Mexican | 5,754 | 6.8% |
| Mexican American Indian | 158 | 0.2% |
| Mongolian | 15 | 0.0% |
| Moroccan | 10 | 0.0% |
| Native Hawaiian | 112 | 0.1% |
| Nepalese | 10 | 0.0% |
| New Zealander | 48 | 0.1% |
| Nicaraguan | 16 | 0.0% |
| Nigerian | 72 | 0.1% |
| Northern European | 637 | 0.7% |
| Norwegian | 1,465 | 1.7% |
| Pakistani | 140 | 0.2% |
| Panamanian | 83 | 0.1% |
| Pennsylvania German | 13 | 0.0% |
| Peruvian | 243 | 0.3% |
| Polish | 3,012 | 3.5% |
| Portuguese | 474 | 0.6% |
| Pueblo | 52 | 0.1% |
| Puerto Rican | 219 | 0.3% |
| Romanian | 149 | 0.2% |
| Russian | 2,013 | 2.4% |
| Salvadoran | 85 | 0.1% |
| Scandinavian | 925 | 1.1% |
| Scotch-Irish | 607 | 0.7% |
| Scottish | 2,843 | 3.3% |
| Serbian | 21 | 0.0% |
| Sioux | 18 | 0.0% |
| Slavic | 13 | 0.0% |
| Slovak | 303 | 0.4% |
| Slovene | 63 | 0.1% |
| South American | 1,213 | 1.4% |
| Spaniard | 381 | 0.4% |
| Spanish | 480 | 0.6% |
| Sri Lankan | 1,062 | 1.3% |
| Subsaharan African | 314 | 0.4% |
| Swedish | 2,301 | 2.7% |
| Swiss | 213 | 0.3% |
| Syrian | 94 | 0.1% |
| Thai | 1,007 | 1.2% |
| Trinidadian and Tobagonian | 16 | 0.0% |
| Turkish | 206 | 0.2% |
| Ukrainian | 364 | 0.4% |
| Uruguayan | 104 | 0.1% |
| Venezuelan | 77 | 0.1% |
| Vietnamese | 33 | 0.0% |
| Welsh | 645 | 0.8% |
| Yugoslavian | 26 | 0.0% | View All 119 Rows |
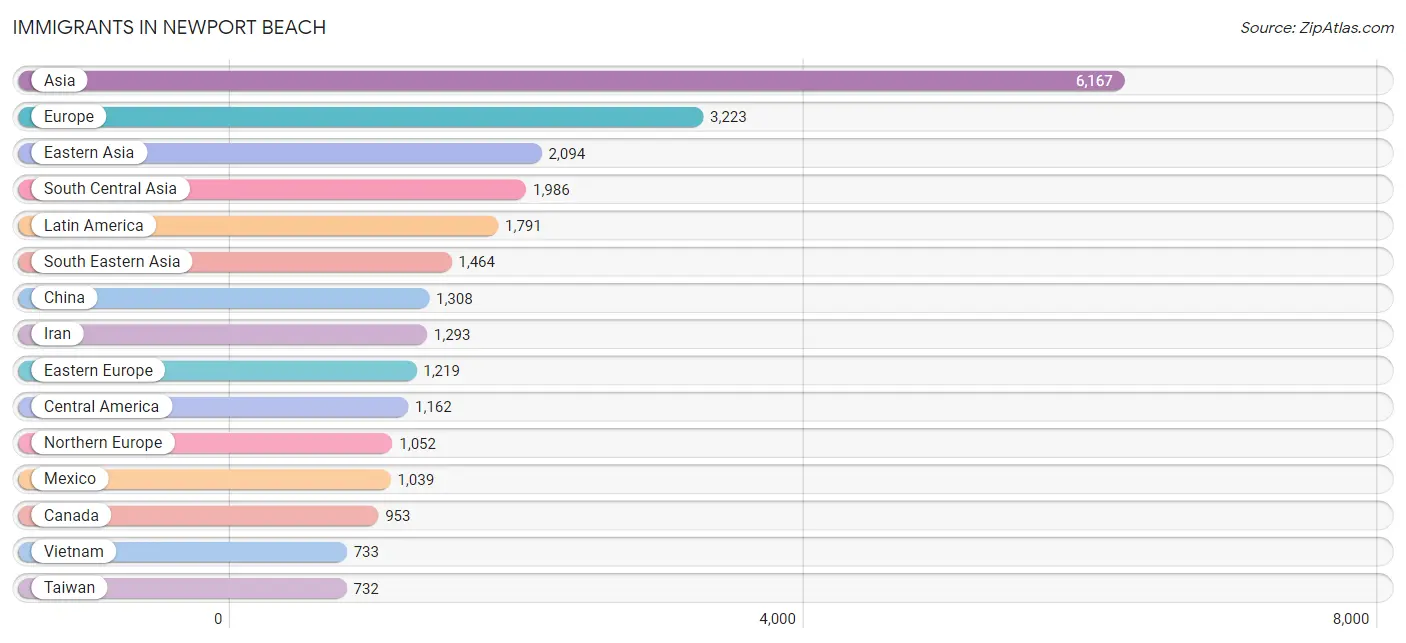
Immigrants in Newport Beach
The most numerous immigrant groups reported in Newport Beach came from Asia (6,167 | 7.2%), Europe (3,223 | 3.8%), Eastern Asia (2,094 | 2.5%), South Central Asia (1,986 | 2.3%), and Latin America (1,791 | 2.1%), together accounting for 17.9% of all Newport Beach residents.
| Immigration Origin | # Population | % Population |
| Africa | 289 | 0.3% |
| Albania | 16 | 0.0% |
| Argentina | 177 | 0.2% |
| Asia | 6,167 | 7.2% |
| Australia | 229 | 0.3% |
| Austria | 92 | 0.1% |
| Bangladesh | 33 | 0.0% |
| Belarus | 21 | 0.0% |
| Bolivia | 12 | 0.0% |
| Brazil | 180 | 0.2% |
| Bulgaria | 7 | 0.0% |
| Cambodia | 4 | 0.0% |
| Canada | 953 | 1.1% |
| Caribbean | 42 | 0.1% |
| Central America | 1,162 | 1.4% |
| China | 1,308 | 1.5% |
| Colombia | 89 | 0.1% |
| Cuba | 17 | 0.0% |
| Czechoslovakia | 371 | 0.4% |
| Denmark | 39 | 0.1% |
| Eastern Africa | 89 | 0.1% |
| Eastern Asia | 2,094 | 2.5% |
| Eastern Europe | 1,219 | 1.4% |
| Ecuador | 21 | 0.0% |
| Egypt | 63 | 0.1% |
| El Salvador | 29 | 0.0% |
| England | 420 | 0.5% |
| Europe | 3,223 | 3.8% |
| France | 448 | 0.5% |
| Germany | 137 | 0.2% |
| Greece | 6 | 0.0% |
| Guatemala | 71 | 0.1% |
| Haiti | 25 | 0.0% |
| Hong Kong | 93 | 0.1% |
| Hungary | 29 | 0.0% |
| India | 605 | 0.7% |
| Indonesia | 287 | 0.3% |
| Iran | 1,293 | 1.5% |
| Iraq | 17 | 0.0% |
| Ireland | 85 | 0.1% |
| Israel | 73 | 0.1% |
| Italy | 115 | 0.1% |
| Japan | 182 | 0.2% |
| Jordan | 5 | 0.0% |
| Kazakhstan | 43 | 0.1% |
| Kenya | 16 | 0.0% |
| Korea | 604 | 0.7% |
| Latin America | 1,791 | 2.1% |
| Latvia | 10 | 0.0% |
| Lebanon | 75 | 0.1% |
| Lithuania | 13 | 0.0% |
| Malaysia | 16 | 0.0% |
| Mexico | 1,039 | 1.2% |
| Netherlands | 15 | 0.0% |
| Nicaragua | 16 | 0.0% |
| Northern Africa | 63 | 0.1% |
| Northern Europe | 1,052 | 1.2% |
| Norway | 22 | 0.0% |
| Oceania | 302 | 0.4% |
| Pakistan | 12 | 0.0% |
| Panama | 7 | 0.0% |
| Peru | 52 | 0.1% |
| Philippines | 302 | 0.4% |
| Poland | 61 | 0.1% |
| Portugal | 32 | 0.0% |
| Romania | 54 | 0.1% |
| Russia | 379 | 0.4% |
| Saudi Arabia | 55 | 0.1% |
| Scotland | 83 | 0.1% |
| Serbia | 13 | 0.0% |
| Singapore | 7 | 0.0% |
| South Africa | 125 | 0.2% |
| South America | 587 | 0.7% |
| South Central Asia | 1,986 | 2.3% |
| South Eastern Asia | 1,464 | 1.7% |
| Southern Europe | 218 | 0.3% |
| Spain | 65 | 0.1% |
| Sweden | 75 | 0.1% |
| Switzerland | 27 | 0.0% |
| Syria | 72 | 0.1% |
| Taiwan | 732 | 0.9% |
| Thailand | 87 | 0.1% |
| Turkey | 290 | 0.3% |
| Ukraine | 121 | 0.1% |
| Uruguay | 17 | 0.0% |
| Venezuela | 39 | 0.1% |
| Vietnam | 733 | 0.9% |
| Western Asia | 587 | 0.7% |
| Western Europe | 719 | 0.8% |
| Zimbabwe | 44 | 0.1% | View All 90 Rows |
Sex and Age in Newport Beach
Sex and Age in Newport Beach
The most populous age groups in Newport Beach are 55 to 59 Years (3,172 | 7.6%) for men and 55 to 59 Years (3,796 | 8.8%) for women.
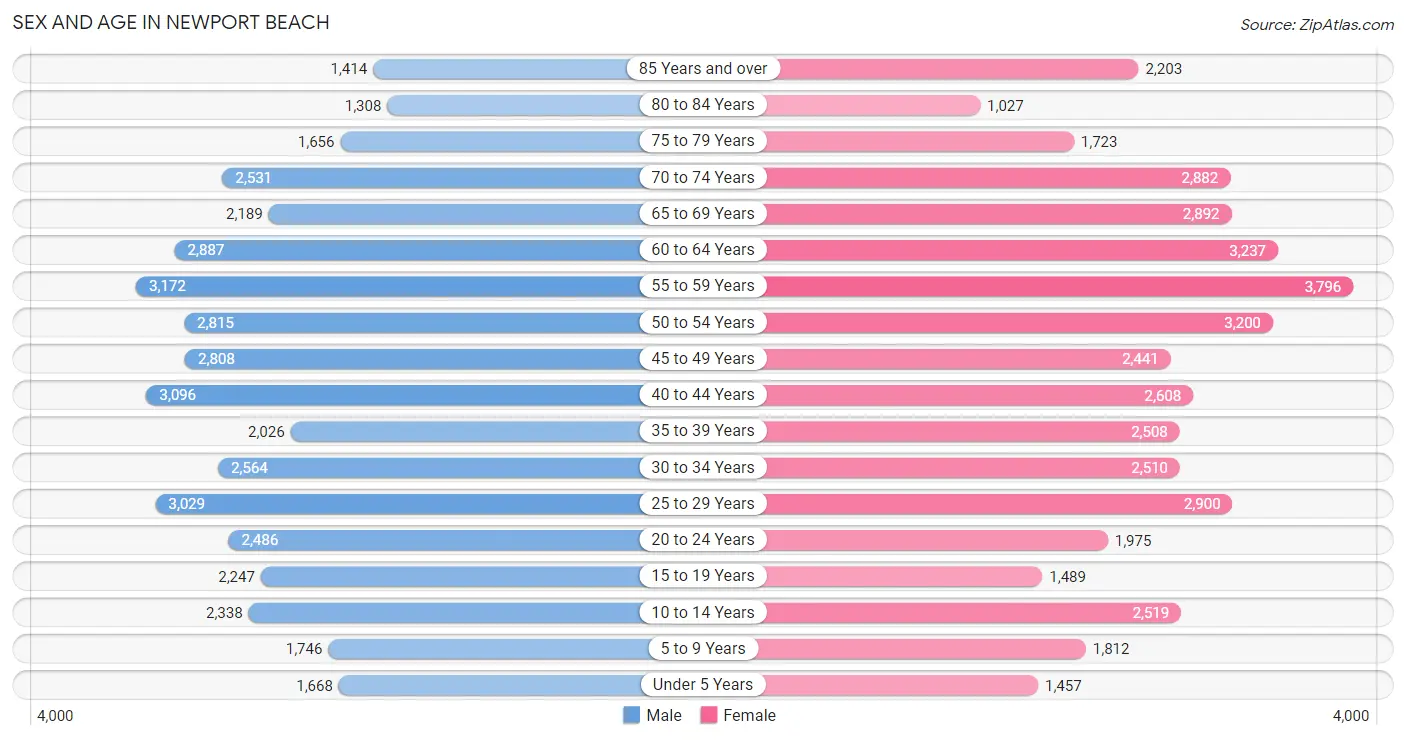
| Age Bracket | Male | Female |
| Under 5 Years | 1,668 (4.0%) | 1,457 (3.4%) |
| 5 to 9 Years | 1,746 (4.2%) | 1,812 (4.2%) |
| 10 to 14 Years | 2,338 (5.6%) | 2,519 (5.8%) |
| 15 to 19 Years | 2,247 (5.3%) | 1,489 (3.5%) |
| 20 to 24 Years | 2,486 (5.9%) | 1,975 (4.6%) |
| 25 to 29 Years | 3,029 (7.2%) | 2,900 (6.7%) |
| 30 to 34 Years | 2,564 (6.1%) | 2,510 (5.8%) |
| 35 to 39 Years | 2,026 (4.8%) | 2,508 (5.8%) |
| 40 to 44 Years | 3,096 (7.4%) | 2,608 (6.0%) |
| 45 to 49 Years | 2,808 (6.7%) | 2,441 (5.7%) |
| 50 to 54 Years | 2,815 (6.7%) | 3,200 (7.4%) |
| 55 to 59 Years | 3,172 (7.6%) | 3,796 (8.8%) |
| 60 to 64 Years | 2,887 (6.9%) | 3,237 (7.5%) |
| 65 to 69 Years | 2,189 (5.2%) | 2,892 (6.7%) |
| 70 to 74 Years | 2,531 (6.0%) | 2,882 (6.7%) |
| 75 to 79 Years | 1,656 (3.9%) | 1,723 (4.0%) |
| 80 to 84 Years | 1,308 (3.1%) | 1,027 (2.4%) |
| 85 Years and over | 1,414 (3.4%) | 2,203 (5.1%) |
| Total | 41,980 (100.0%) | 43,179 (100.0%) |
Families and Households in Newport Beach
Median Family Size in Newport Beach
The median family size in Newport Beach is 2.79 persons per family, with married-couple families (17,863 | 81.7%) accounting for the largest median family size of 2.83 persons per family. On the other hand, single female/mother families (2,744 | 12.5%) represent the smallest median family size with 2.58 persons per family.
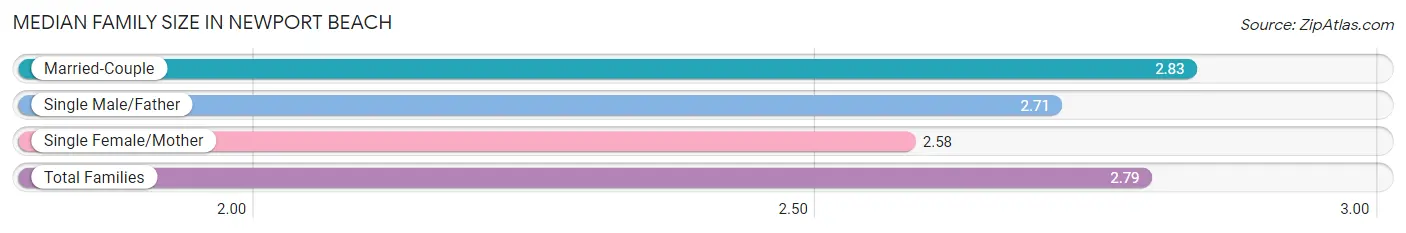
| Family Type | # Families | Family Size |
| Married-Couple | 17,863 (81.7%) | 2.83 |
| Single Male/Father | 1,268 (5.8%) | 2.71 |
| Single Female/Mother | 2,744 (12.5%) | 2.58 |
| Total Families | 21,875 (100.0%) | 2.79 |
Median Household Size in Newport Beach
The median household size in Newport Beach is 2.19 persons per household, with single male/father households (1,268 | 3.3%) accounting for the largest median household size of 3.15 persons per household. non-family households (16,761 | 43.4%) represent the smallest median household size with 1.34 persons per household.
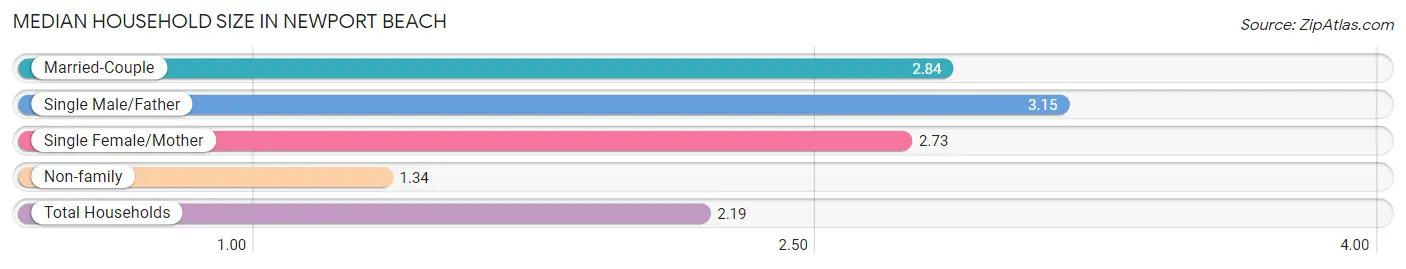
| Household Type | # Households | Household Size |
| Married-Couple | 17,863 (46.2%) | 2.84 |
| Single Male/Father | 1,268 (3.3%) | 3.15 |
| Single Female/Mother | 2,744 (7.1%) | 2.73 |
| Non-family | 16,761 (43.4%) | 1.34 |
| Total Households | 38,636 (100.0%) | 2.19 |
Household Size by Marriage Status in Newport Beach
Out of a total of 38,636 households in Newport Beach, 21,875 (56.6%) are family households, while 16,761 (43.4%) are nonfamily households. The most numerous type of family households are 2-person households, comprising 12,013, and the most common type of nonfamily households are 1-person households, comprising 12,922.
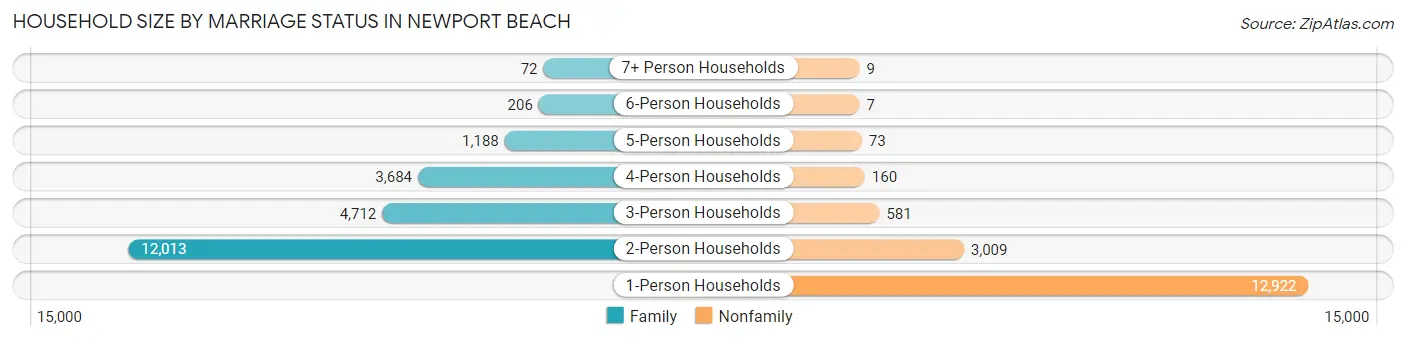
| Household Size | Family Households | Nonfamily Households |
| 1-Person Households | - | 12,922 (33.5%) |
| 2-Person Households | 12,013 (31.1%) | 3,009 (7.8%) |
| 3-Person Households | 4,712 (12.2%) | 581 (1.5%) |
| 4-Person Households | 3,684 (9.5%) | 160 (0.4%) |
| 5-Person Households | 1,188 (3.1%) | 73 (0.2%) |
| 6-Person Households | 206 (0.5%) | 7 (0.0%) |
| 7+ Person Households | 72 (0.2%) | 9 (0.0%) |
| Total | 21,875 (56.6%) | 16,761 (43.4%) |
Female Fertility in Newport Beach
Fertility by Age in Newport Beach
Average fertility rate in Newport Beach is 33.0 births per 1,000 women. Women in the age bracket of 20 to 34 years have the highest fertility rate with 46.0 births per 1,000 women. Women in the age bracket of 20 to 34 years acount for 60.6% of all women with births.
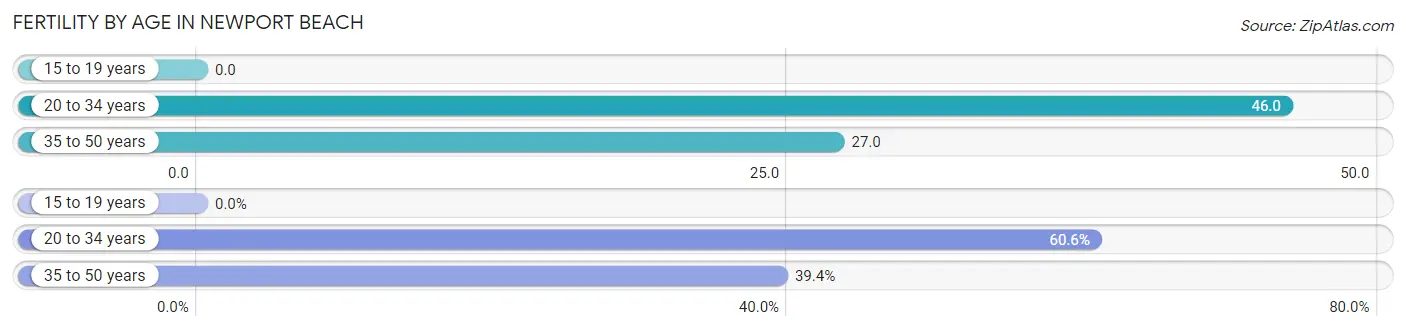
| Age Bracket | Women with Births | Births / 1,000 Women |
| 15 to 19 years | 0 (0.0%) | 0.0 |
| 20 to 34 years | 339 (60.6%) | 46.0 |
| 35 to 50 years | 220 (39.4%) | 27.0 |
| Total | 559 (100.0%) | 33.0 |
Fertility by Age by Marriage Status in Newport Beach
90.5% of women with births (559) in Newport Beach are married. The highest percentage of unmarried women with births falls into 35 to 50 years age bracket with 10.0% of them unmarried at the time of birth, while the lowest percentage of unmarried women with births belong to 20 to 34 years age bracket with 9.1% of them unmarried.
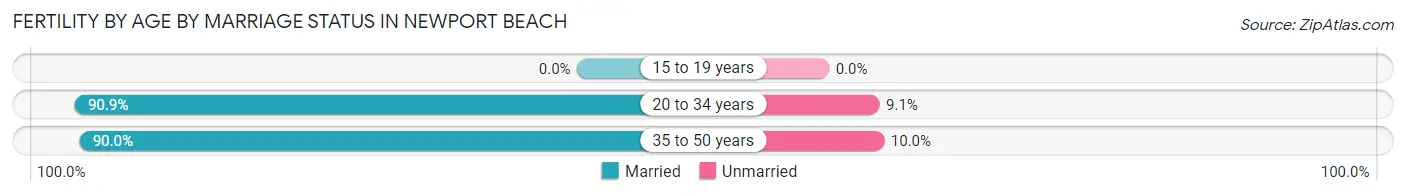
| Age Bracket | Married | Unmarried |
| 15 to 19 years | 0 (0.0%) | 0 (0.0%) |
| 20 to 34 years | 308 (90.9%) | 31 (9.1%) |
| 35 to 50 years | 198 (90.0%) | 22 (10.0%) |
| Total | 506 (90.5%) | 53 (9.5%) |
Fertility by Education in Newport Beach
Average fertility rate in Newport Beach is 33.0 births per 1,000 women. Women with the education attainment of graduate degree have the highest fertility rate of 48.0 births per 1,000 women, while women with the education attainment of less than high school have the lowest fertility at 13.0 births per 1,000 women. Women with the education attainment of bachelor's degree represent 38.5% of all women with births.
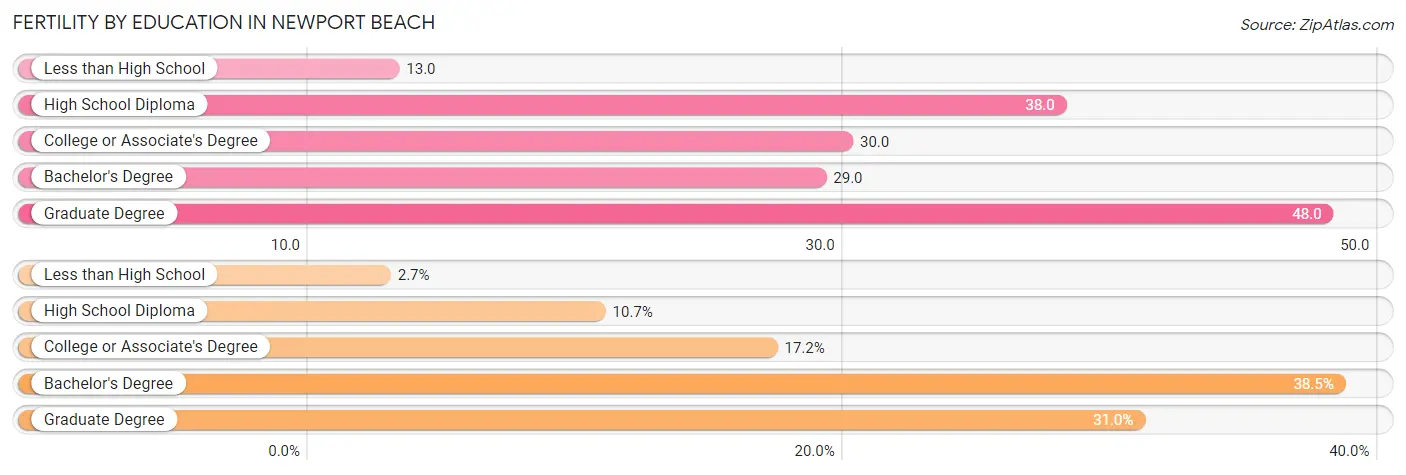
| Educational Attainment | Women with Births | Births / 1,000 Women |
| Less than High School | 15 (2.7%) | 13.0 |
| High School Diploma | 60 (10.7%) | 38.0 |
| College or Associate's Degree | 96 (17.2%) | 30.0 |
| Bachelor's Degree | 215 (38.5%) | 29.0 |
| Graduate Degree | 173 (30.9%) | 48.0 |
| Total | 559 (100.0%) | 33.0 |
Fertility by Education by Marriage Status in Newport Beach
9.5% of women with births in Newport Beach are unmarried. Women with the educational attainment of less than high school are most likely to be married with 100.0% of them married at childbirth, while women with the educational attainment of high school diploma are least likely to be married with 35.0% of them unmarried at childbirth.
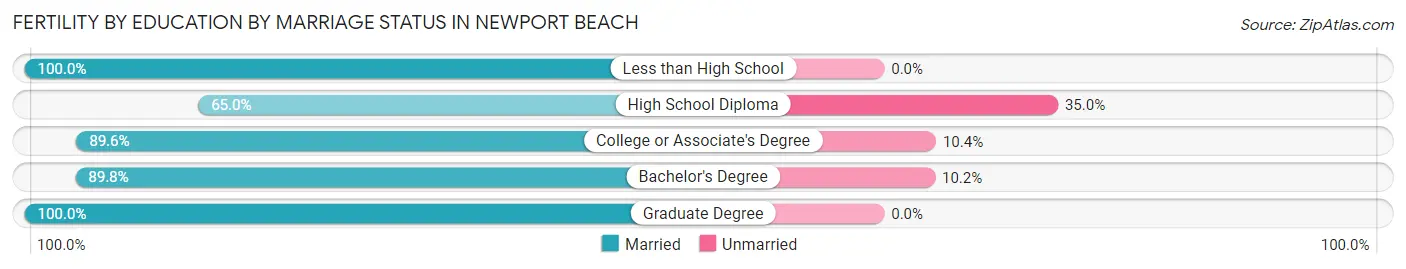
| Educational Attainment | Married | Unmarried |
| Less than High School | 15 (100.0%) | 0 (0.0%) |
| High School Diploma | 39 (65.0%) | 21 (35.0%) |
| College or Associate's Degree | 86 (89.6%) | 10 (10.4%) |
| Bachelor's Degree | 193 (89.8%) | 22 (10.2%) |
| Graduate Degree | 173 (100.0%) | 0 (0.0%) |
| Total | 506 (90.5%) | 53 (9.5%) |
Employment Characteristics in Newport Beach
Employment by Class of Employer in Newport Beach
Among the 42,685 employed individuals in Newport Beach, private company employees (27,820 | 65.2%), self-employed (incorporated) (5,156 | 12.1%), and self-employed (not incorporated) (4,595 | 10.8%) make up the most common classes of employment.
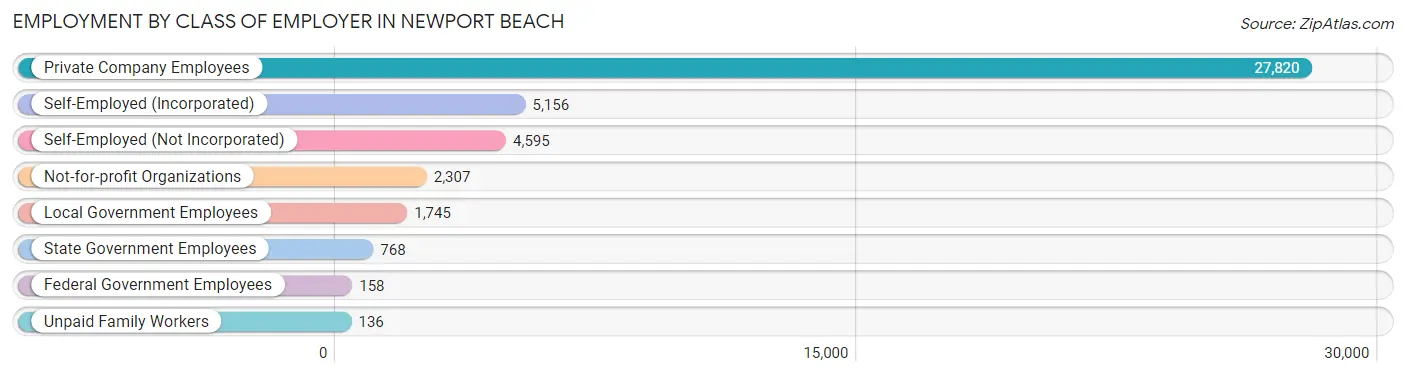
| Employer Class | # Employees | % Employees |
| Private Company Employees | 27,820 | 65.2% |
| Self-Employed (Incorporated) | 5,156 | 12.1% |
| Self-Employed (Not Incorporated) | 4,595 | 10.8% |
| Not-for-profit Organizations | 2,307 | 5.4% |
| Local Government Employees | 1,745 | 4.1% |
| State Government Employees | 768 | 1.8% |
| Federal Government Employees | 158 | 0.4% |
| Unpaid Family Workers | 136 | 0.3% |
| Total | 42,685 | 100.0% |
Employment Status by Age in Newport Beach
According to the labor force statistics for Newport Beach, out of the total population over 16 years of age (72,487), 62.4% or 45,232 individuals are in the labor force, with 4.1% or 1,855 of them unemployed. The age group with the highest labor force participation rate is 25 to 29 years, with 90.2% or 5,348 individuals in the labor force. Within the labor force, the 20 to 24 years age range has the highest percentage of unemployed individuals, with 11.3% or 359 of them being unemployed.
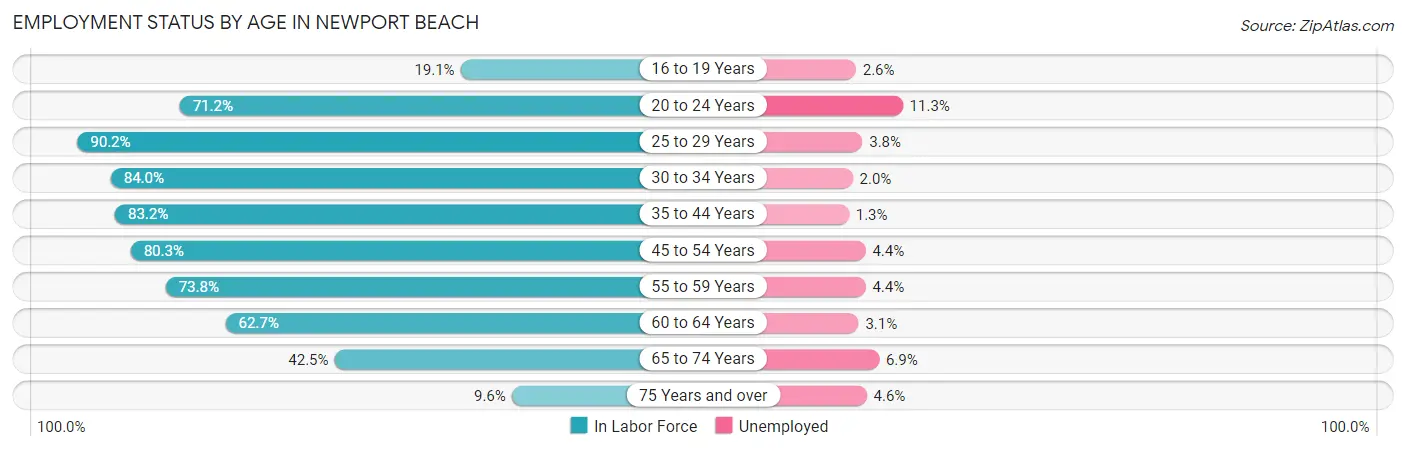
| Age Bracket | In Labor Force | Unemployed |
| 16 to 19 Years | 497 (19.1%) | 13 (2.6%) |
| 20 to 24 Years | 3,176 (71.2%) | 359 (11.3%) |
| 25 to 29 Years | 5,348 (90.2%) | 203 (3.8%) |
| 30 to 34 Years | 4,262 (84.0%) | 85 (2.0%) |
| 35 to 44 Years | 8,518 (83.2%) | 111 (1.3%) |
| 45 to 54 Years | 9,045 (80.3%) | 398 (4.4%) |
| 55 to 59 Years | 5,142 (73.8%) | 226 (4.4%) |
| 60 to 64 Years | 3,840 (62.7%) | 119 (3.1%) |
| 65 to 74 Years | 4,460 (42.5%) | 308 (6.9%) |
| 75 Years and over | 896 (9.6%) | 41 (4.6%) |
| Total | 45,232 (62.4%) | 1,855 (4.1%) |
Employment Status by Educational Attainment in Newport Beach
According to labor force statistics for Newport Beach, 79.3% of individuals (36,158) out of the total population between 25 and 64 years of age (45,597) are in the labor force, with 3.2% or 1,157 of them being unemployed. The group with the highest labor force participation rate are those with the educational attainment of bachelor's degree or higher, with 81.1% or 26,136 individuals in the labor force. Within the labor force, individuals with high school diploma education have the highest percentage of unemployment, with 7.7% or 180 of them being unemployed.
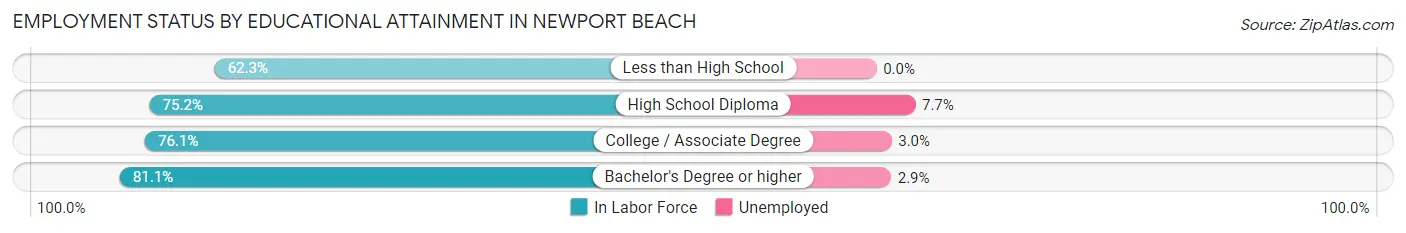
| Educational Attainment | In Labor Force | Unemployed |
| Less than High School | 598 (62.3%) | 0 (0.0%) |
| High School Diploma | 2,333 (75.2%) | 239 (7.7%) |
| College / Associate Degree | 7,083 (76.1%) | 279 (3.0%) |
| Bachelor's Degree or higher | 26,136 (81.1%) | 935 (2.9%) |
| Total | 36,158 (79.3%) | 1,459 (3.2%) |
Employment Occupations by Sex in Newport Beach
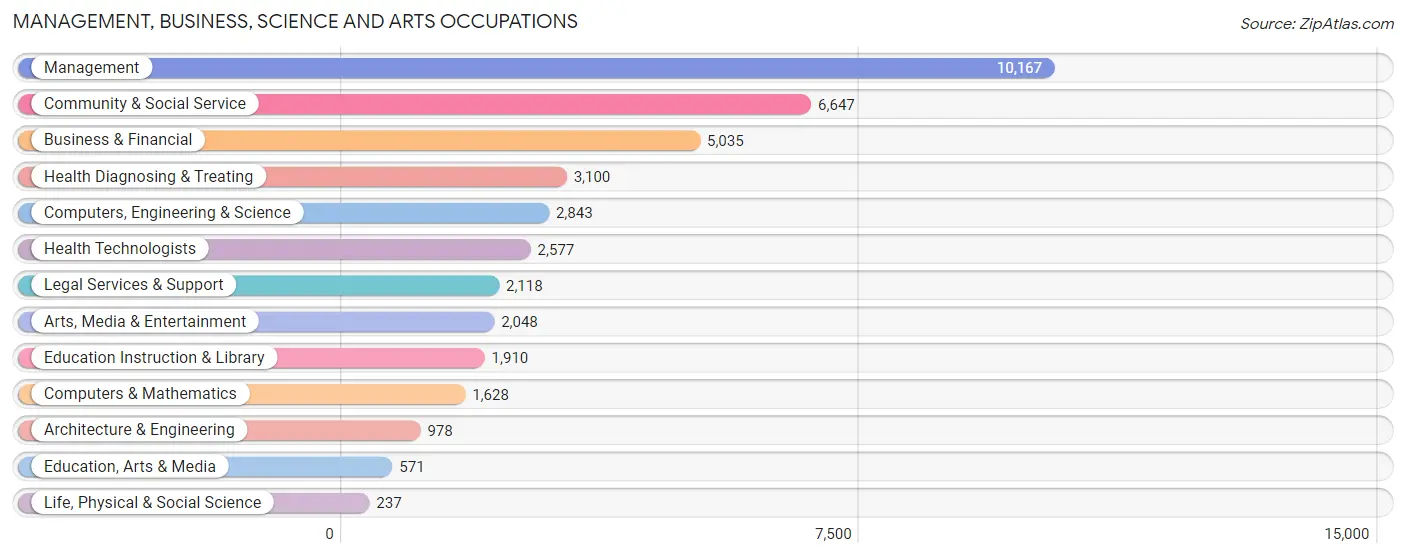
Management, Business, Science and Arts Occupations
The most common Management, Business, Science and Arts occupations in Newport Beach are Management (10,167 | 23.5%), Community & Social Service (6,647 | 15.3%), Business & Financial (5,035 | 11.6%), Health Diagnosing & Treating (3,100 | 7.1%), and Computers, Engineering & Science (2,843 | 6.6%).
Management, Business, Science and Arts Occupations by Sex
Within the Management, Business, Science and Arts occupations in Newport Beach, the most male-oriented occupations are Architecture & Engineering (89.1%), Computers, Engineering & Science (80.0%), and Computers & Mathematics (76.7%), while the most female-oriented occupations are Education, Arts & Media (69.2%), Education Instruction & Library (60.6%), and Health Technologists (59.4%).
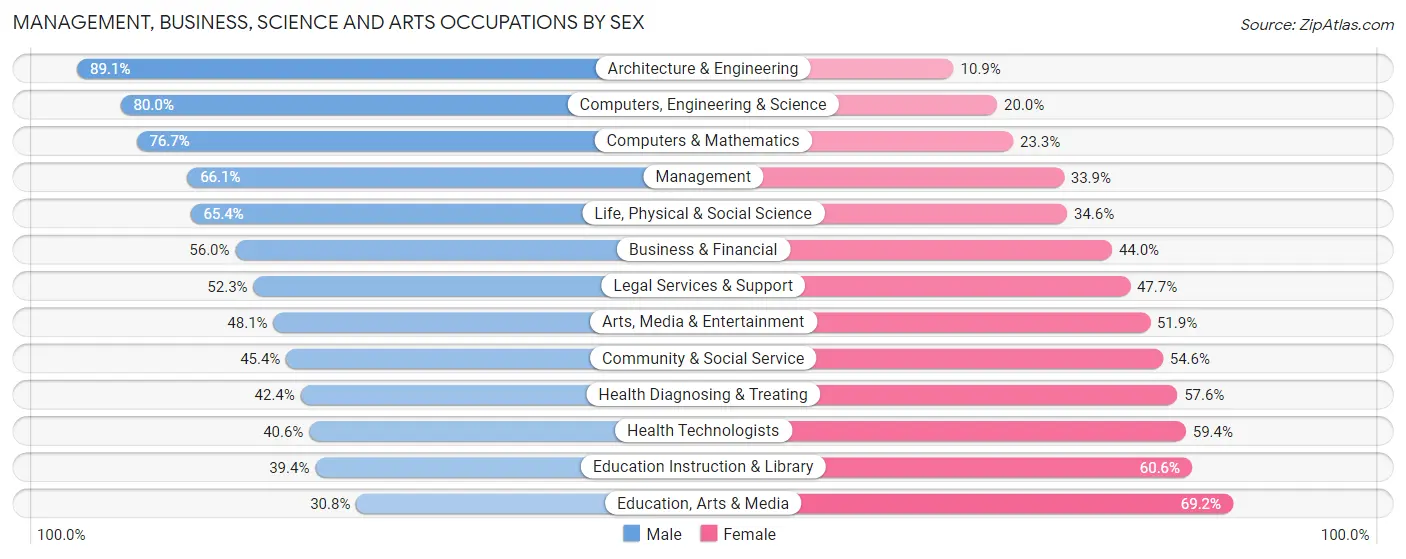
| Occupation | Male | Female |
| Management | 6,717 (66.1%) | 3,450 (33.9%) |
| Business & Financial | 2,821 (56.0%) | 2,214 (44.0%) |
| Computers, Engineering & Science | 2,274 (80.0%) | 569 (20.0%) |
| Computers & Mathematics | 1,248 (76.7%) | 380 (23.3%) |
| Architecture & Engineering | 871 (89.1%) | 107 (10.9%) |
| Life, Physical & Social Science | 155 (65.4%) | 82 (34.6%) |
| Community & Social Service | 3,020 (45.4%) | 3,627 (54.6%) |
| Education, Arts & Media | 176 (30.8%) | 395 (69.2%) |
| Legal Services & Support | 1,107 (52.3%) | 1,011 (47.7%) |
| Education Instruction & Library | 752 (39.4%) | 1,158 (60.6%) |
| Arts, Media & Entertainment | 985 (48.1%) | 1,063 (51.9%) |
| Health Diagnosing & Treating | 1,315 (42.4%) | 1,785 (57.6%) |
| Health Technologists | 1,047 (40.6%) | 1,530 (59.4%) |
| Total (Category) | 16,147 (58.1%) | 11,645 (41.9%) |
| Total (Overall) | 24,357 (56.2%) | 18,983 (43.8%) |
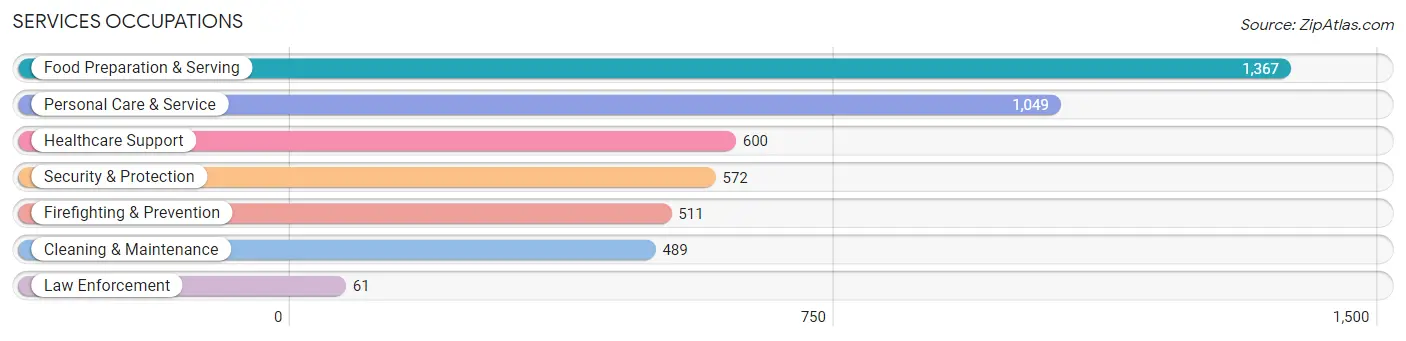
Services Occupations
The most common Services occupations in Newport Beach are Food Preparation & Serving (1,367 | 3.2%), Personal Care & Service (1,049 | 2.4%), Healthcare Support (600 | 1.4%), Security & Protection (572 | 1.3%), and Firefighting & Prevention (511 | 1.2%).
Services Occupations by Sex
Within the Services occupations in Newport Beach, the most male-oriented occupations are Firefighting & Prevention (95.9%), Security & Protection (89.2%), and Cleaning & Maintenance (38.7%), while the most female-oriented occupations are Personal Care & Service (73.1%), Healthcare Support (73.0%), and Law Enforcement (67.2%).
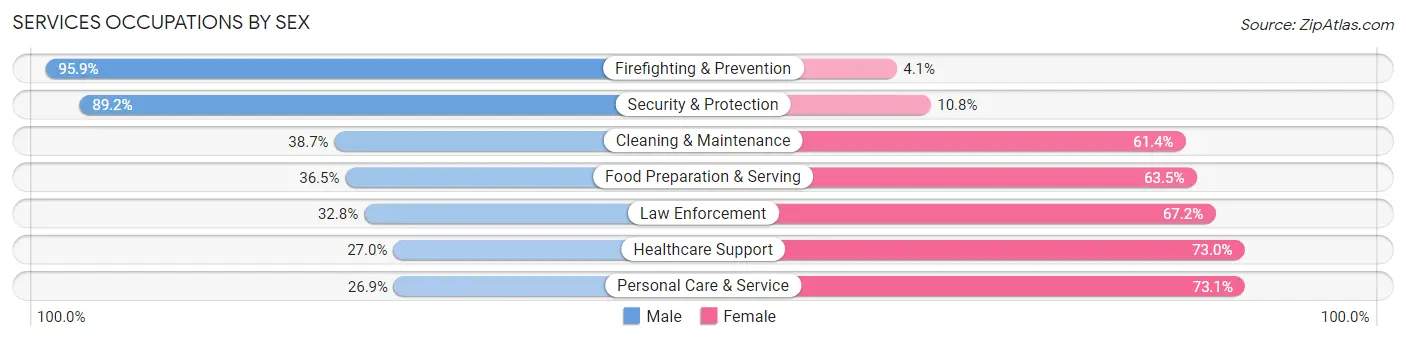
| Occupation | Male | Female |
| Healthcare Support | 162 (27.0%) | 438 (73.0%) |
| Security & Protection | 510 (89.2%) | 62 (10.8%) |
| Firefighting & Prevention | 490 (95.9%) | 21 (4.1%) |
| Law Enforcement | 20 (32.8%) | 41 (67.2%) |
| Food Preparation & Serving | 499 (36.5%) | 868 (63.5%) |
| Cleaning & Maintenance | 189 (38.7%) | 300 (61.4%) |
| Personal Care & Service | 282 (26.9%) | 767 (73.1%) |
| Total (Category) | 1,642 (40.3%) | 2,435 (59.7%) |
| Total (Overall) | 24,357 (56.2%) | 18,983 (43.8%) |
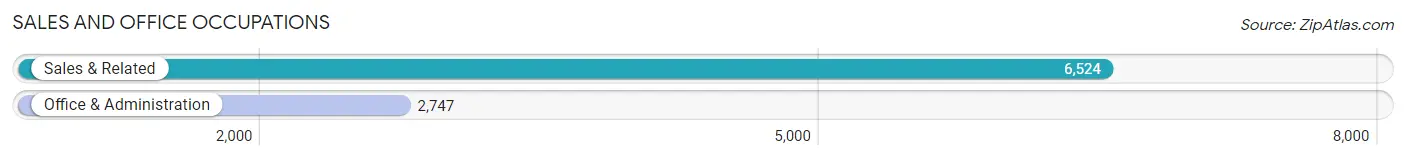
Sales and Office Occupations
The most common Sales and Office occupations in Newport Beach are Sales & Related (6,524 | 15.0%), and Office & Administration (2,747 | 6.3%).
Sales and Office Occupations by Sex
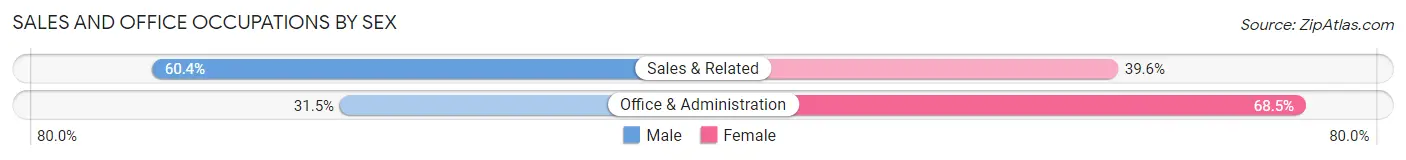
| Occupation | Male | Female |
| Sales & Related | 3,942 (60.4%) | 2,582 (39.6%) |
| Office & Administration | 865 (31.5%) | 1,882 (68.5%) |
| Total (Category) | 4,807 (51.8%) | 4,464 (48.1%) |
| Total (Overall) | 24,357 (56.2%) | 18,983 (43.8%) |
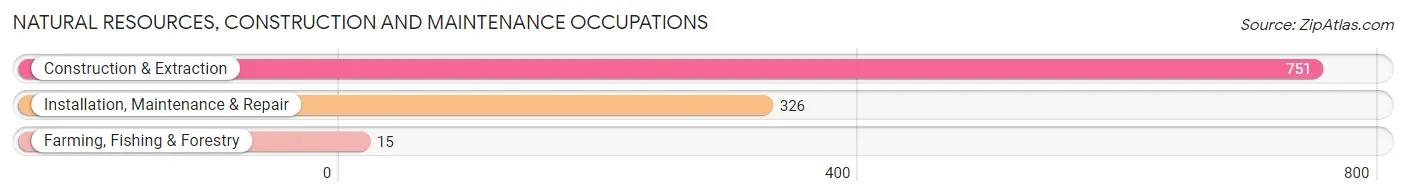
Natural Resources, Construction and Maintenance Occupations
The most common Natural Resources, Construction and Maintenance occupations in Newport Beach are Construction & Extraction (751 | 1.7%), Installation, Maintenance & Repair (326 | 0.7%), and Farming, Fishing & Forestry (15 | 0.0%).
Natural Resources, Construction and Maintenance Occupations by Sex
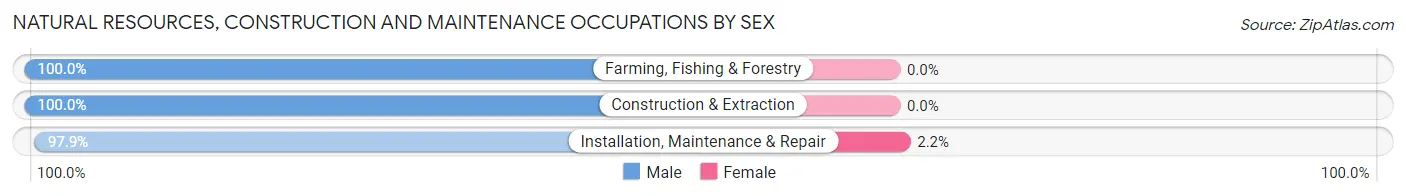
| Occupation | Male | Female |
| Farming, Fishing & Forestry | 15 (100.0%) | 0 (0.0%) |
| Construction & Extraction | 751 (100.0%) | 0 (0.0%) |
| Installation, Maintenance & Repair | 319 (97.9%) | 7 (2.1%) |
| Total (Category) | 1,085 (99.4%) | 7 (0.6%) |
| Total (Overall) | 24,357 (56.2%) | 18,983 (43.8%) |
Production, Transportation and Moving Occupations
The most common Production, Transportation and Moving occupations in Newport Beach are Transportation (493 | 1.1%), Production (365 | 0.8%), and Material Moving (250 | 0.6%).
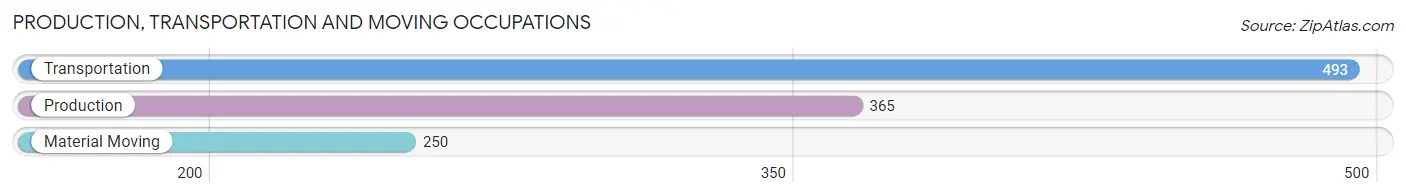
Production, Transportation and Moving Occupations by Sex
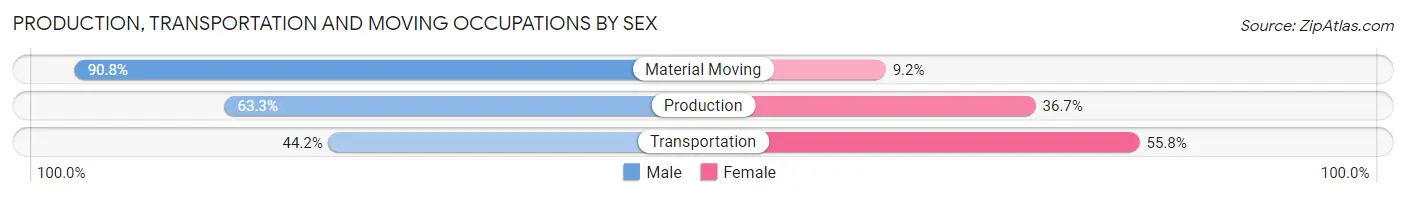
| Occupation | Male | Female |
| Production | 231 (63.3%) | 134 (36.7%) |
| Transportation | 218 (44.2%) | 275 (55.8%) |
| Material Moving | 227 (90.8%) | 23 (9.2%) |
| Total (Category) | 676 (61.0%) | 432 (39.0%) |
| Total (Overall) | 24,357 (56.2%) | 18,983 (43.8%) |
Employment Industries by Sex in Newport Beach
Employment Industries in Newport Beach
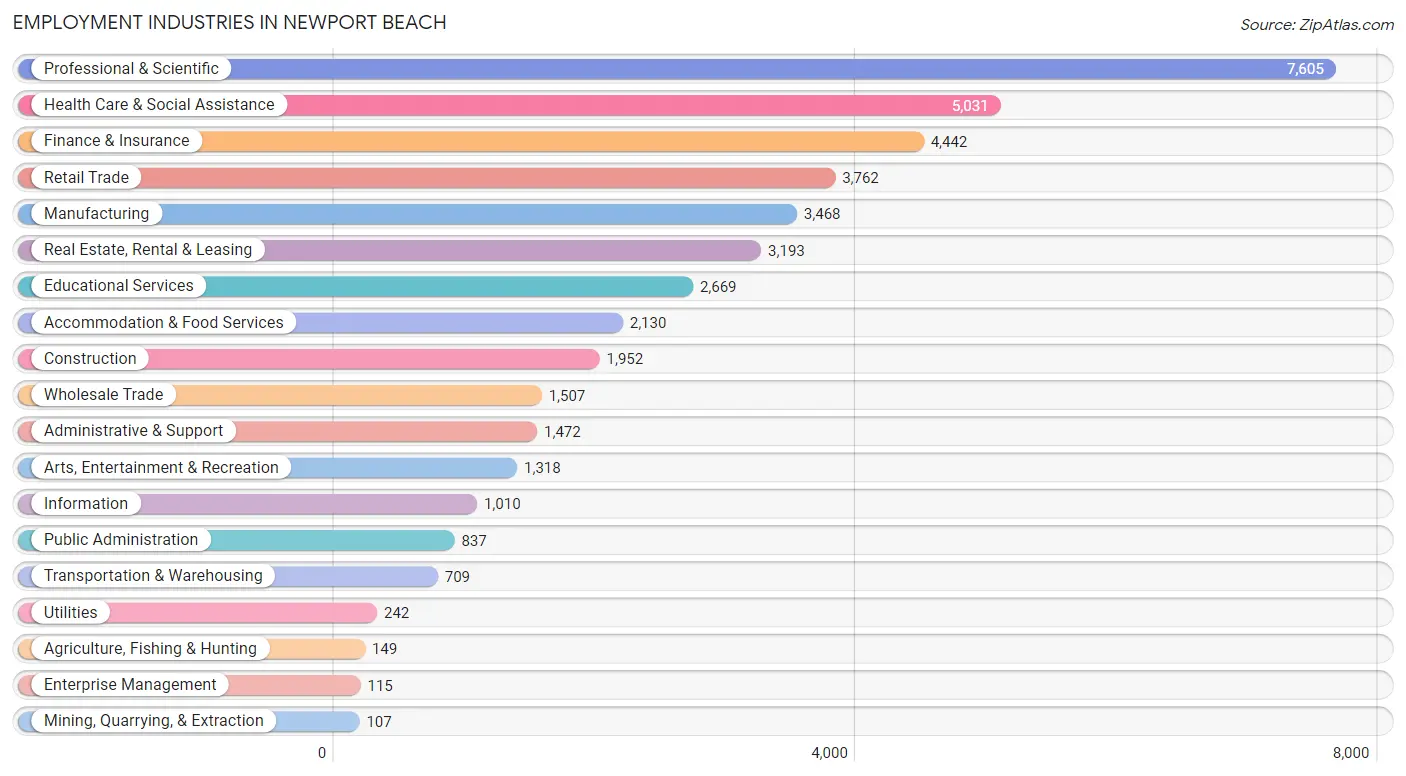
The major employment industries in Newport Beach include Professional & Scientific (7,605 | 17.5%), Health Care & Social Assistance (5,031 | 11.6%), Finance & Insurance (4,442 | 10.2%), Retail Trade (3,762 | 8.7%), and Manufacturing (3,468 | 8.0%).
Employment Industries by Sex in Newport Beach
The Newport Beach industries that see more men than women are Mining, Quarrying, & Extraction (100.0%), Agriculture, Fishing & Hunting (91.3%), and Construction (86.7%), whereas the industries that tend to have a higher number of women are Health Care & Social Assistance (67.1%), Educational Services (62.2%), and Accommodation & Food Services (60.0%).
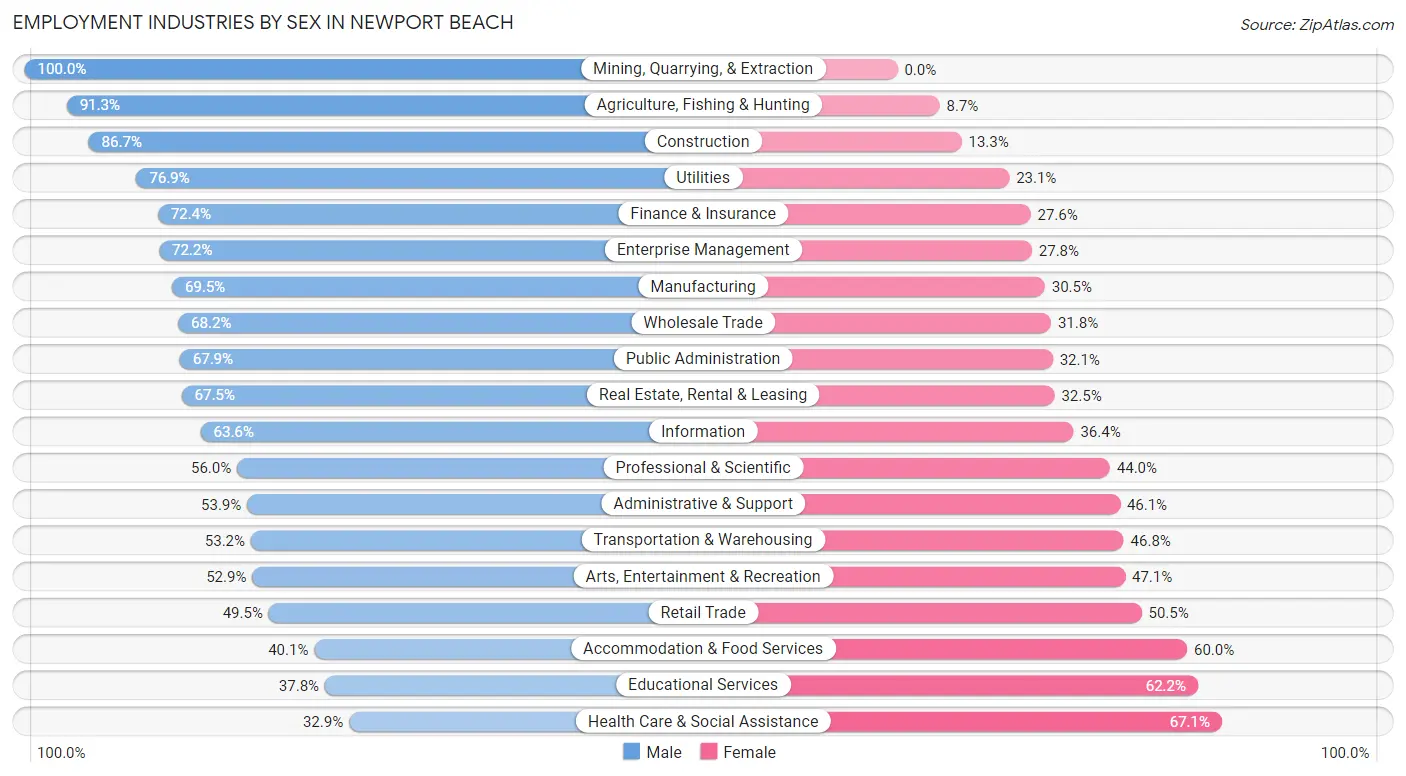
| Industry | Male | Female |
| Agriculture, Fishing & Hunting | 136 (91.3%) | 13 (8.7%) |
| Mining, Quarrying, & Extraction | 107 (100.0%) | 0 (0.0%) |
| Construction | 1,693 (86.7%) | 259 (13.3%) |
| Manufacturing | 2,410 (69.5%) | 1,058 (30.5%) |
| Wholesale Trade | 1,028 (68.2%) | 479 (31.8%) |
| Retail Trade | 1,861 (49.5%) | 1,901 (50.5%) |
| Transportation & Warehousing | 377 (53.2%) | 332 (46.8%) |
| Utilities | 186 (76.9%) | 56 (23.1%) |
| Information | 642 (63.6%) | 368 (36.4%) |
| Finance & Insurance | 3,218 (72.4%) | 1,224 (27.6%) |
| Real Estate, Rental & Leasing | 2,155 (67.5%) | 1,038 (32.5%) |
| Professional & Scientific | 4,261 (56.0%) | 3,344 (44.0%) |
| Enterprise Management | 83 (72.2%) | 32 (27.8%) |
| Administrative & Support | 794 (53.9%) | 678 (46.1%) |
| Educational Services | 1,010 (37.8%) | 1,659 (62.2%) |
| Health Care & Social Assistance | 1,653 (32.9%) | 3,378 (67.1%) |
| Arts, Entertainment & Recreation | 697 (52.9%) | 621 (47.1%) |
| Accommodation & Food Services | 853 (40.1%) | 1,277 (60.0%) |
| Public Administration | 568 (67.9%) | 269 (32.1%) |
| Total | 24,357 (56.2%) | 18,983 (43.8%) |
Education in Newport Beach
School Enrollment in Newport Beach
The most common levels of schooling among the 17,457 students in Newport Beach are college / undergraduate (3,917 | 22.4%), middle school (3,787 | 21.7%), and high school (3,413 | 19.6%).
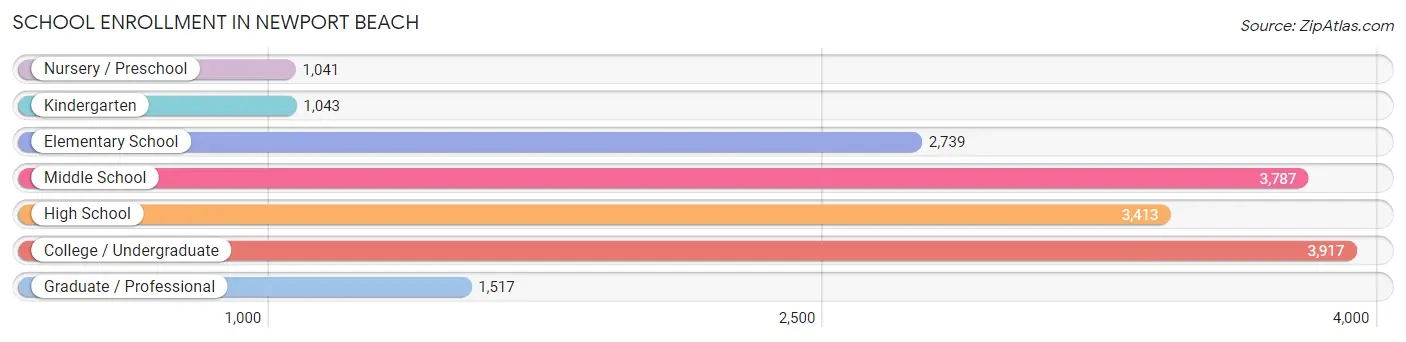
| School Level | # Students | % Students |
| Nursery / Preschool | 1,041 | 6.0% |
| Kindergarten | 1,043 | 6.0% |
| Elementary School | 2,739 | 15.7% |
| Middle School | 3,787 | 21.7% |
| High School | 3,413 | 19.6% |
| College / Undergraduate | 3,917 | 22.4% |
| Graduate / Professional | 1,517 | 8.7% |
| Total | 17,457 | 100.0% |
School Enrollment by Age by Funding Source in Newport Beach
Out of a total of 17,457 students who are enrolled in schools in Newport Beach, 6,058 (34.7%) attend a private institution, while the remaining 11,399 (65.3%) are enrolled in public schools. The age group of 3 to 4 year olds has the highest likelihood of being enrolled in private schools, with 543 (70.2% in the age bracket) enrolled. Conversely, the age group of 18 to 19 year olds has the lowest likelihood of being enrolled in a private school, with 734 (80.5% in the age bracket) attending a public institution.
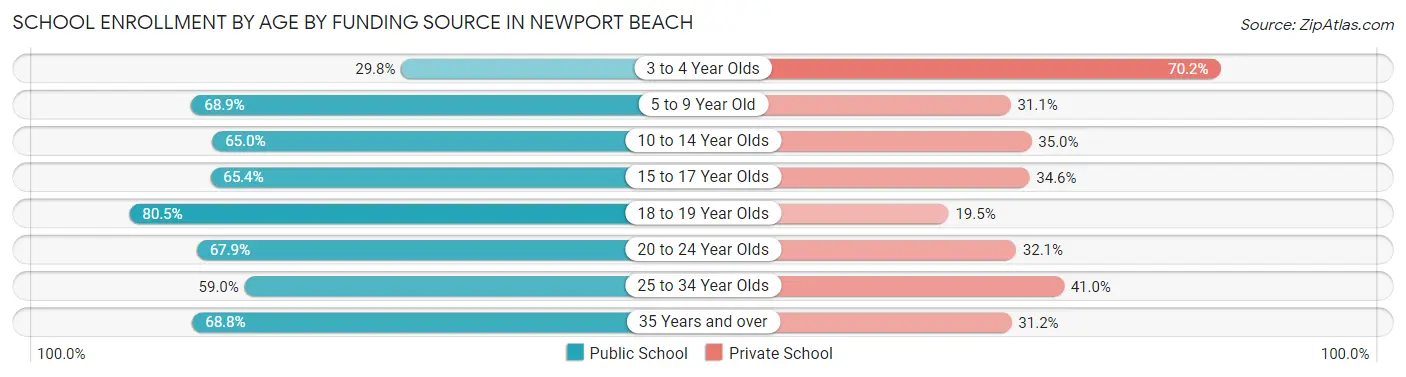
| Age Bracket | Public School | Private School |
| 3 to 4 Year Olds | 231 (29.8%) | 543 (70.2%) |
| 5 to 9 Year Old | 2,429 (68.9%) | 1,095 (31.1%) |
| 10 to 14 Year Olds | 3,115 (65.0%) | 1,674 (35.0%) |
| 15 to 17 Year Olds | 1,747 (65.4%) | 924 (34.6%) |
| 18 to 19 Year Olds | 734 (80.5%) | 178 (19.5%) |
| 20 to 24 Year Olds | 1,563 (67.9%) | 738 (32.1%) |
| 25 to 34 Year Olds | 808 (59.0%) | 561 (41.0%) |
| 35 Years and over | 768 (68.8%) | 349 (31.2%) |
| Total | 11,399 (65.3%) | 6,058 (34.7%) |
Educational Attainment by Field of Study in Newport Beach
Business (12,065 | 25.0%), social sciences (6,229 | 12.9%), engineering (3,843 | 8.0%), science & technology (3,527 | 7.3%), and bio, nature & agricultural (3,430 | 7.1%) are the most common fields of study among 48,212 individuals in Newport Beach who have obtained a bachelor's degree or higher.
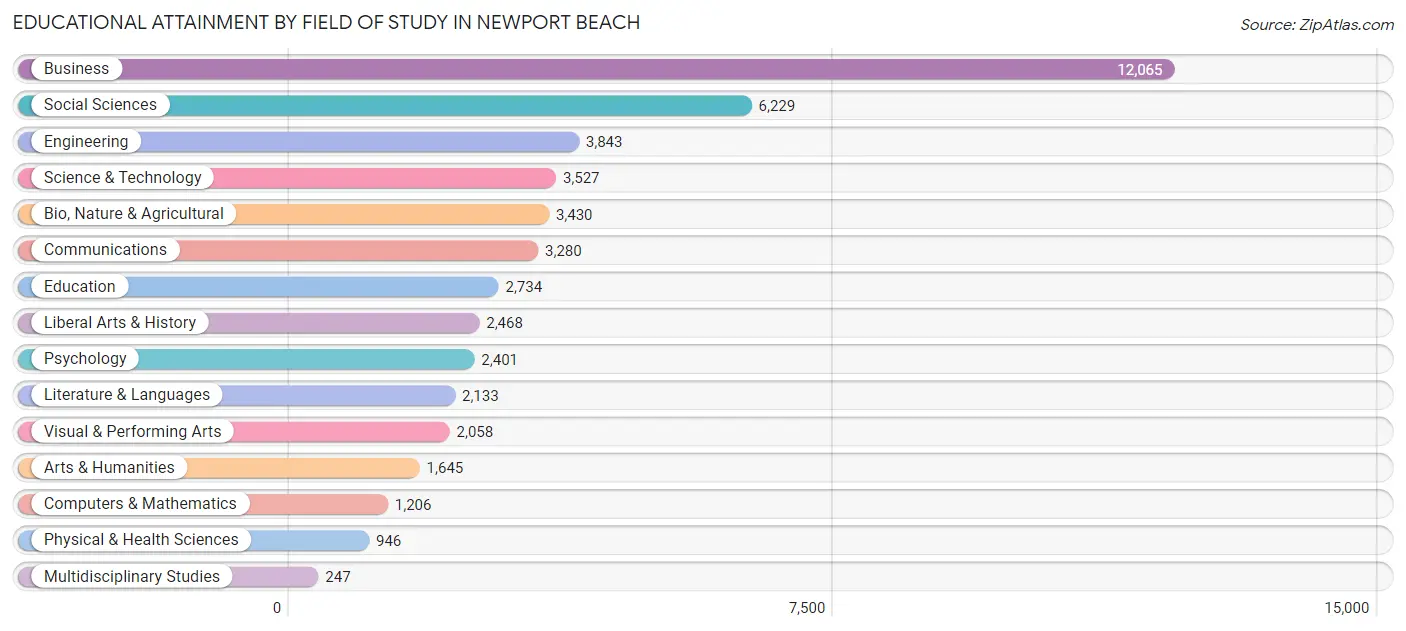
| Field of Study | # Graduates | % Graduates |
| Computers & Mathematics | 1,206 | 2.5% |
| Bio, Nature & Agricultural | 3,430 | 7.1% |
| Physical & Health Sciences | 946 | 2.0% |
| Psychology | 2,401 | 5.0% |
| Social Sciences | 6,229 | 12.9% |
| Engineering | 3,843 | 8.0% |
| Multidisciplinary Studies | 247 | 0.5% |
| Science & Technology | 3,527 | 7.3% |
| Business | 12,065 | 25.0% |
| Education | 2,734 | 5.7% |
| Literature & Languages | 2,133 | 4.4% |
| Liberal Arts & History | 2,468 | 5.1% |
| Visual & Performing Arts | 2,058 | 4.3% |
| Communications | 3,280 | 6.8% |
| Arts & Humanities | 1,645 | 3.4% |
| Total | 48,212 | 100.0% |
Transportation & Commute in Newport Beach
Vehicle Availability by Sex in Newport Beach
The most prevalent vehicle ownership categories in Newport Beach are males with 2 vehicles (11,530, accounting for 48.0%) and females with 2 vehicles (8,404, making up 61.8%).
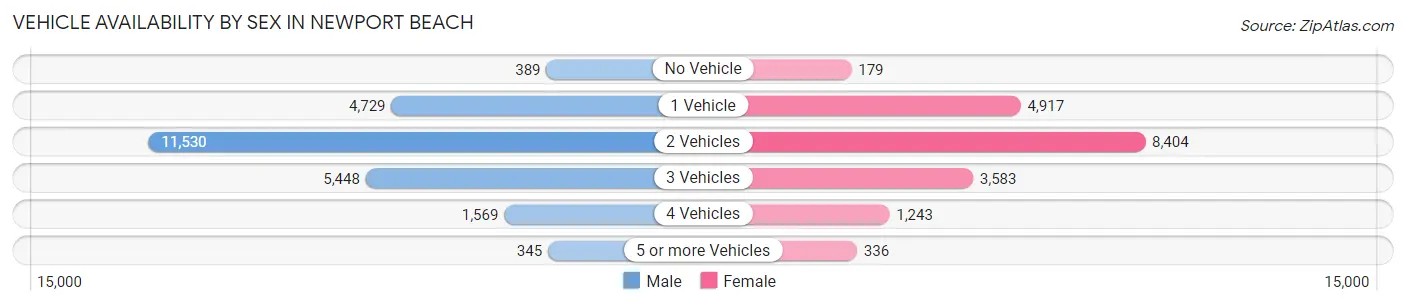
| Vehicles Available | Male | Female |
| No Vehicle | 389 (1.6%) | 179 (1.0%) |
| 1 Vehicle | 4,729 (19.7%) | 4,917 (26.4%) |
| 2 Vehicles | 11,530 (48.0%) | 8,404 (45.0%) |
| 3 Vehicles | 5,448 (22.7%) | 3,583 (19.2%) |
| 4 Vehicles | 1,569 (6.5%) | 1,243 (6.7%) |
| 5 or more Vehicles | 345 (1.4%) | 336 (1.8%) |
| Total | 24,010 (100.0%) | 18,662 (100.0%) |
Commute Time in Newport Beach
The most frequently occuring commute durations in Newport Beach are 15 to 19 minutes (7,352 commuters, 22.5%), 10 to 14 minutes (5,483 commuters, 16.8%), and 20 to 24 minutes (5,343 commuters, 16.3%).
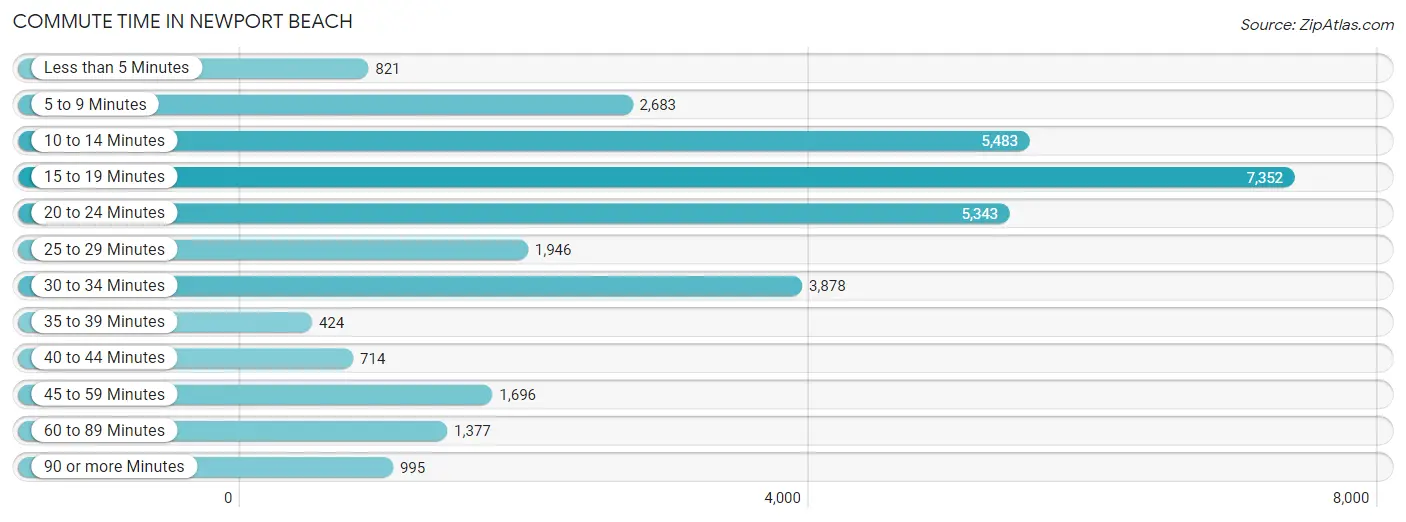
| Commute Time | # Commuters | % Commuters |
| Less than 5 Minutes | 821 | 2.5% |
| 5 to 9 Minutes | 2,683 | 8.2% |
| 10 to 14 Minutes | 5,483 | 16.8% |
| 15 to 19 Minutes | 7,352 | 22.5% |
| 20 to 24 Minutes | 5,343 | 16.3% |
| 25 to 29 Minutes | 1,946 | 5.9% |
| 30 to 34 Minutes | 3,878 | 11.8% |
| 35 to 39 Minutes | 424 | 1.3% |
| 40 to 44 Minutes | 714 | 2.2% |
| 45 to 59 Minutes | 1,696 | 5.2% |
| 60 to 89 Minutes | 1,377 | 4.2% |
| 90 or more Minutes | 995 | 3.0% |
Commute Time by Sex in Newport Beach
The most common commute times in Newport Beach are 15 to 19 minutes (4,539 commuters, 24.2%) for males and 10 to 14 minutes (2,881 commuters, 20.7%) for females.
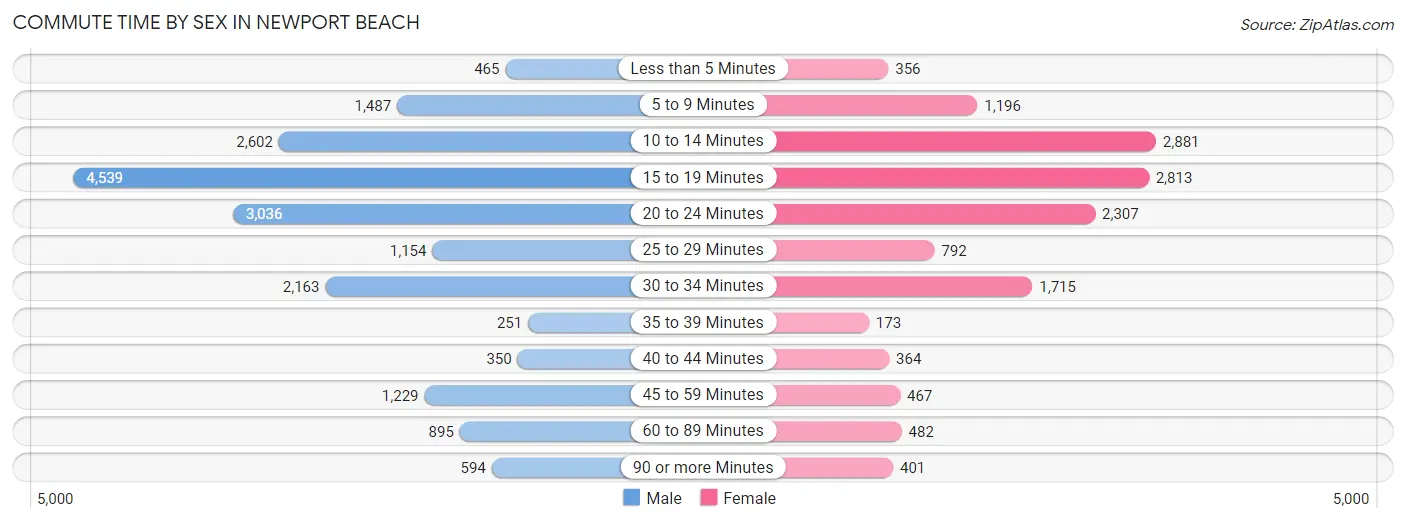
| Commute Time | Male | Female |
| Less than 5 Minutes | 465 (2.5%) | 356 (2.5%) |
| 5 to 9 Minutes | 1,487 (7.9%) | 1,196 (8.6%) |
| 10 to 14 Minutes | 2,602 (13.9%) | 2,881 (20.7%) |
| 15 to 19 Minutes | 4,539 (24.2%) | 2,813 (20.2%) |
| 20 to 24 Minutes | 3,036 (16.2%) | 2,307 (16.5%) |
| 25 to 29 Minutes | 1,154 (6.1%) | 792 (5.7%) |
| 30 to 34 Minutes | 2,163 (11.5%) | 1,715 (12.3%) |
| 35 to 39 Minutes | 251 (1.3%) | 173 (1.2%) |
| 40 to 44 Minutes | 350 (1.9%) | 364 (2.6%) |
| 45 to 59 Minutes | 1,229 (6.6%) | 467 (3.4%) |
| 60 to 89 Minutes | 895 (4.8%) | 482 (3.5%) |
| 90 or more Minutes | 594 (3.2%) | 401 (2.9%) |
Time of Departure to Work by Sex in Newport Beach
The most frequent times of departure to work in Newport Beach are 8:00 AM to 8:29 AM (3,636, 19.4%) for males and 9:00 AM to 9:59 AM (2,546, 18.2%) for females.
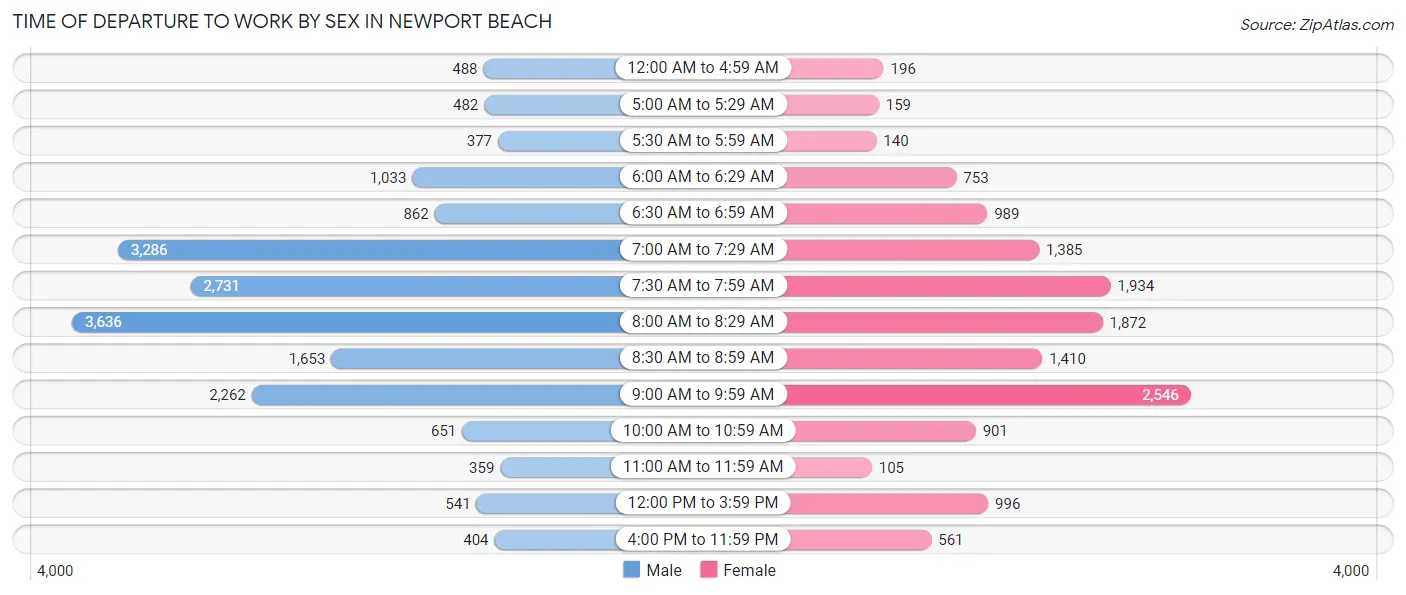
| Time of Departure | Male | Female |
| 12:00 AM to 4:59 AM | 488 (2.6%) | 196 (1.4%) |
| 5:00 AM to 5:29 AM | 482 (2.6%) | 159 (1.1%) |
| 5:30 AM to 5:59 AM | 377 (2.0%) | 140 (1.0%) |
| 6:00 AM to 6:29 AM | 1,033 (5.5%) | 753 (5.4%) |
| 6:30 AM to 6:59 AM | 862 (4.6%) | 989 (7.1%) |
| 7:00 AM to 7:29 AM | 3,286 (17.5%) | 1,385 (9.9%) |
| 7:30 AM to 7:59 AM | 2,731 (14.5%) | 1,934 (13.9%) |
| 8:00 AM to 8:29 AM | 3,636 (19.4%) | 1,872 (13.4%) |
| 8:30 AM to 8:59 AM | 1,653 (8.8%) | 1,410 (10.1%) |
| 9:00 AM to 9:59 AM | 2,262 (12.0%) | 2,546 (18.2%) |
| 10:00 AM to 10:59 AM | 651 (3.5%) | 901 (6.5%) |
| 11:00 AM to 11:59 AM | 359 (1.9%) | 105 (0.7%) |
| 12:00 PM to 3:59 PM | 541 (2.9%) | 996 (7.1%) |
| 4:00 PM to 11:59 PM | 404 (2.1%) | 561 (4.0%) |
| Total | 18,765 (100.0%) | 13,947 (100.0%) |
Housing Occupancy in Newport Beach
Occupancy by Ownership in Newport Beach
Of the total 38,636 dwellings in Newport Beach, owner-occupied units account for 20,277 (52.5%), while renter-occupied units make up 18,359 (47.5%).
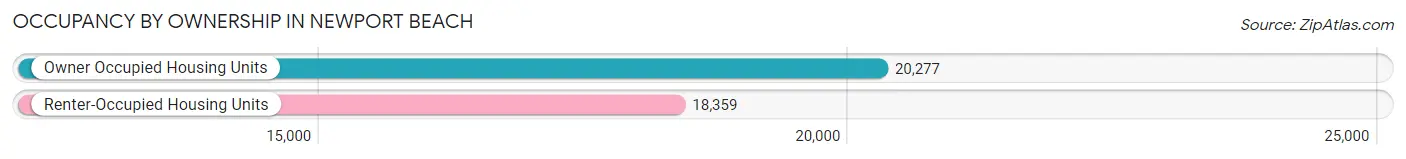
| Occupancy | # Housing Units | % Housing Units |
| Owner Occupied Housing Units | 20,277 | 52.5% |
| Renter-Occupied Housing Units | 18,359 | 47.5% |
| Total Occupied Housing Units | 38,636 | 100.0% |
Occupancy by Household Size in Newport Beach
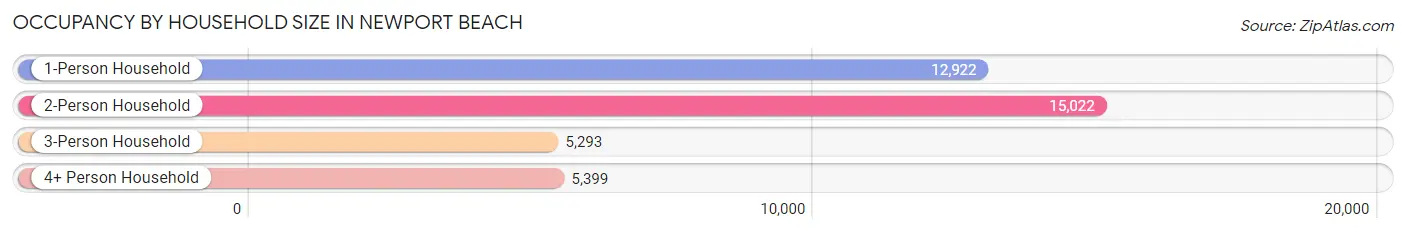
| Household Size | # Housing Units | % Housing Units |
| 1-Person Household | 12,922 | 33.5% |
| 2-Person Household | 15,022 | 38.9% |
| 3-Person Household | 5,293 | 13.7% |
| 4+ Person Household | 5,399 | 14.0% |
| Total Housing Units | 38,636 | 100.0% |
Occupancy by Ownership by Household Size in Newport Beach
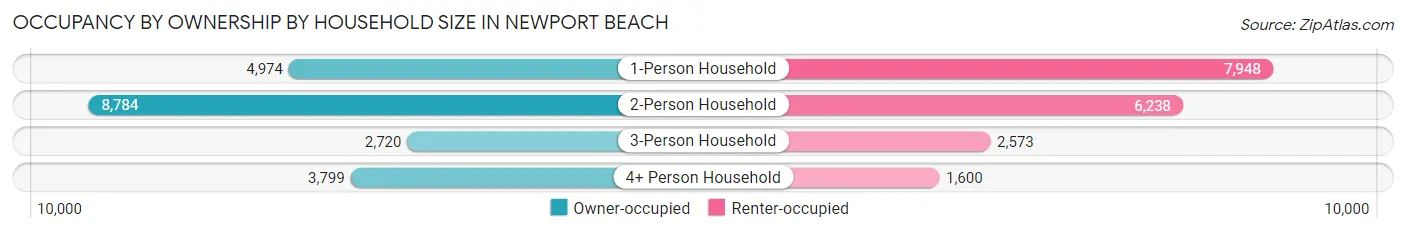
| Household Size | Owner-occupied | Renter-occupied |
| 1-Person Household | 4,974 (38.5%) | 7,948 (61.5%) |
| 2-Person Household | 8,784 (58.5%) | 6,238 (41.5%) |
| 3-Person Household | 2,720 (51.4%) | 2,573 (48.6%) |
| 4+ Person Household | 3,799 (70.4%) | 1,600 (29.6%) |
| Total Housing Units | 20,277 (52.5%) | 18,359 (47.5%) |
Occupancy by Educational Attainment in Newport Beach
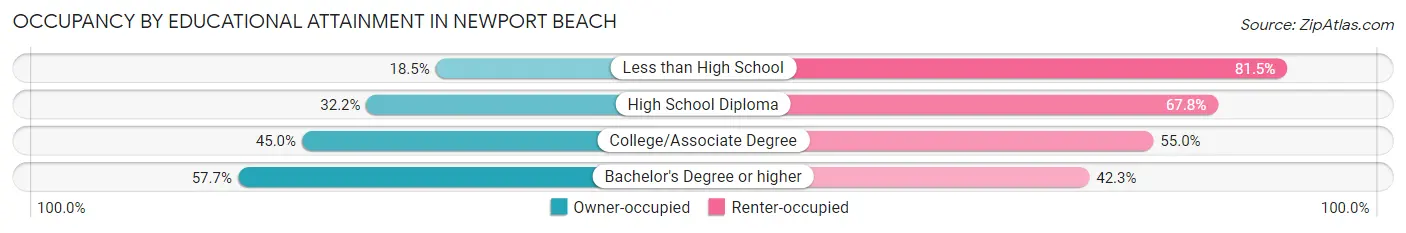
| Household Size | Owner-occupied | Renter-occupied |
| Less than High School | 131 (18.5%) | 576 (81.5%) |
| High School Diploma | 863 (32.2%) | 1,814 (67.8%) |
| College/Associate Degree | 3,794 (45.0%) | 4,631 (55.0%) |
| Bachelor's Degree or higher | 15,489 (57.7%) | 11,338 (42.3%) |
Occupancy by Age of Householder in Newport Beach
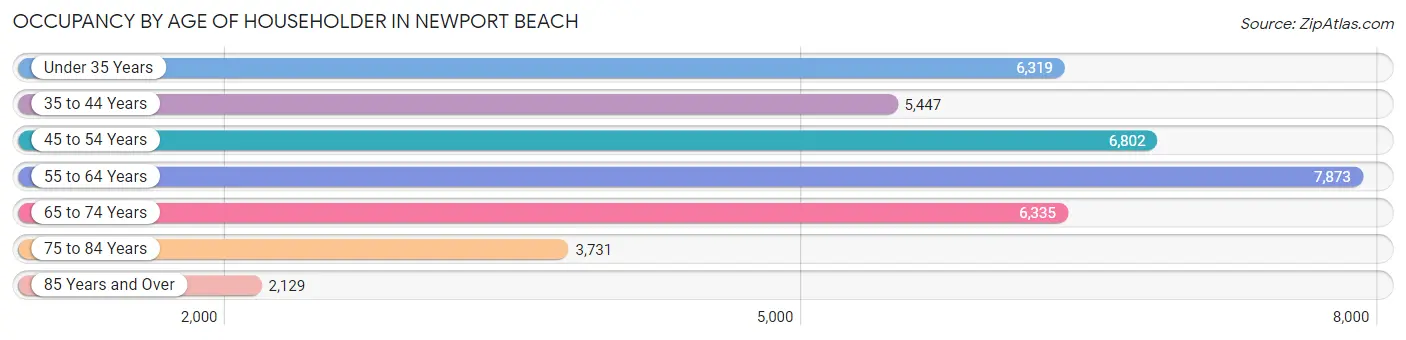
| Age Bracket | # Households | % Households |
| Under 35 Years | 6,319 | 16.4% |
| 35 to 44 Years | 5,447 | 14.1% |
| 45 to 54 Years | 6,802 | 17.6% |
| 55 to 64 Years | 7,873 | 20.4% |
| 65 to 74 Years | 6,335 | 16.4% |
| 75 to 84 Years | 3,731 | 9.7% |
| 85 Years and Over | 2,129 | 5.5% |
| Total | 38,636 | 100.0% |
Housing Finances in Newport Beach
Median Income by Occupancy in Newport Beach
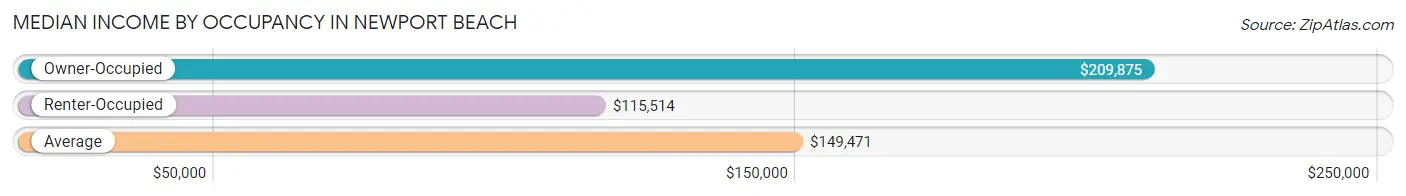
| Occupancy Type | # Households | Median Income |
| Owner-Occupied | 20,277 (52.5%) | $209,875 |
| Renter-Occupied | 18,359 (47.5%) | $115,514 |
| Average | 38,636 (100.0%) | $149,471 |
Occupancy by Householder Income Bracket in Newport Beach
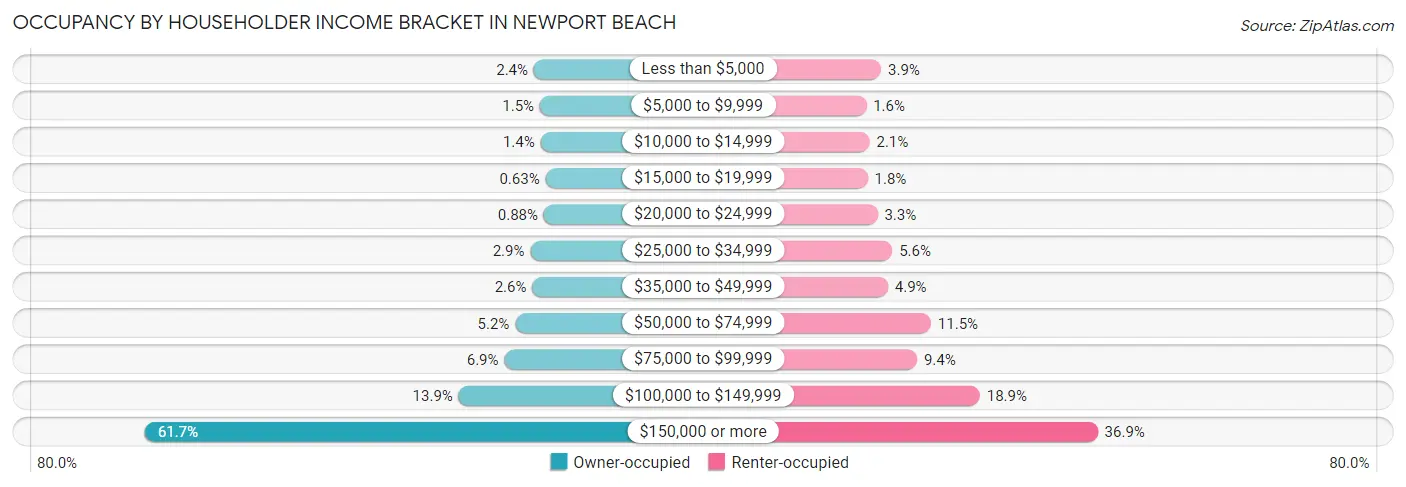
| Income Bracket | Owner-occupied | Renter-occupied |
| Less than $5,000 | 486 (2.4%) | 715 (3.9%) |
| $5,000 to $9,999 | 298 (1.5%) | 297 (1.6%) |
| $10,000 to $14,999 | 280 (1.4%) | 391 (2.1%) |
| $15,000 to $19,999 | 128 (0.6%) | 337 (1.8%) |
| $20,000 to $24,999 | 178 (0.9%) | 614 (3.3%) |
| $25,000 to $34,999 | 597 (2.9%) | 1,027 (5.6%) |
| $35,000 to $49,999 | 535 (2.6%) | 904 (4.9%) |
| $50,000 to $74,999 | 1,062 (5.2%) | 2,107 (11.5%) |
| $75,000 to $99,999 | 1,397 (6.9%) | 1,718 (9.4%) |
| $100,000 to $149,999 | 2,810 (13.9%) | 3,477 (18.9%) |
| $150,000 or more | 12,506 (61.7%) | 6,772 (36.9%) |
| Total | 20,277 (100.0%) | 18,359 (100.0%) |
Monthly Housing Cost Tiers in Newport Beach
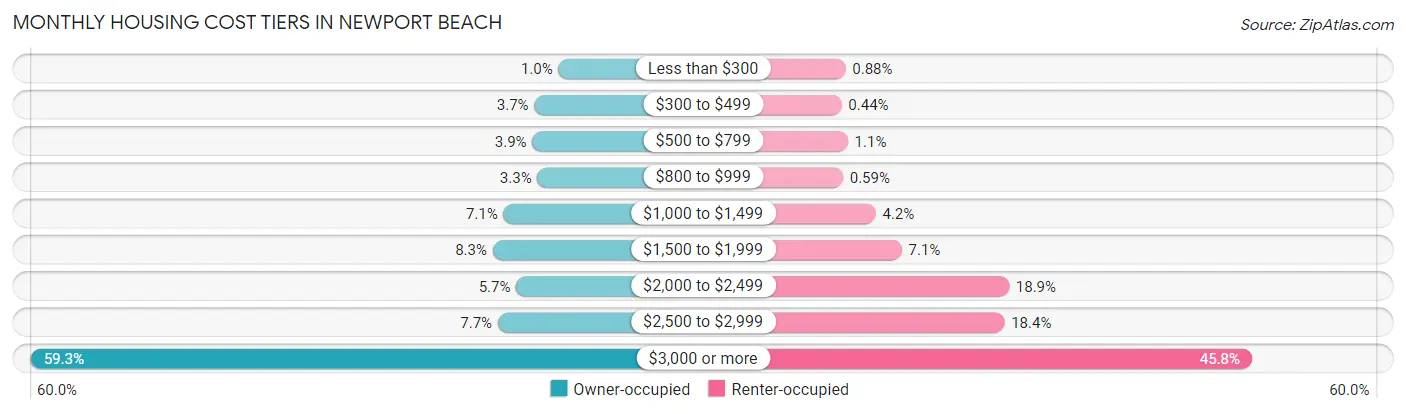
| Monthly Cost | Owner-occupied | Renter-occupied |
| Less than $300 | 205 (1.0%) | 162 (0.9%) |
| $300 to $499 | 747 (3.7%) | 81 (0.4%) |
| $500 to $799 | 790 (3.9%) | 208 (1.1%) |
| $800 to $999 | 677 (3.3%) | 108 (0.6%) |
| $1,000 to $1,499 | 1,437 (7.1%) | 771 (4.2%) |
| $1,500 to $1,999 | 1,679 (8.3%) | 1,301 (7.1%) |
| $2,000 to $2,499 | 1,151 (5.7%) | 3,477 (18.9%) |
| $2,500 to $2,999 | 1,563 (7.7%) | 3,384 (18.4%) |
| $3,000 or more | 12,028 (59.3%) | 8,404 (45.8%) |
| Total | 20,277 (100.0%) | 18,359 (100.0%) |
Physical Housing Characteristics in Newport Beach
Housing Structures in Newport Beach
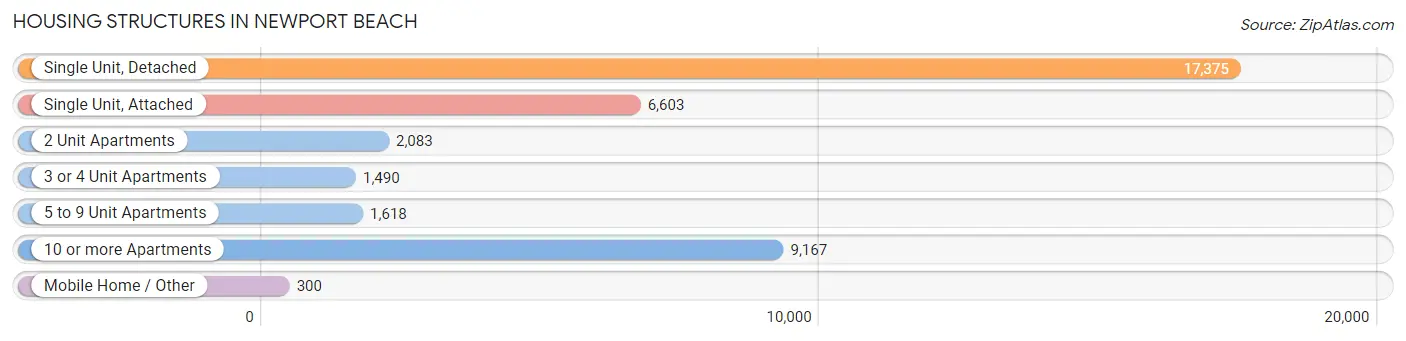
| Structure Type | # Housing Units | % Housing Units |
| Single Unit, Detached | 17,375 | 45.0% |
| Single Unit, Attached | 6,603 | 17.1% |
| 2 Unit Apartments | 2,083 | 5.4% |
| 3 or 4 Unit Apartments | 1,490 | 3.9% |
| 5 to 9 Unit Apartments | 1,618 | 4.2% |
| 10 or more Apartments | 9,167 | 23.7% |
| Mobile Home / Other | 300 | 0.8% |
| Total | 38,636 | 100.0% |
Housing Structures by Occupancy in Newport Beach
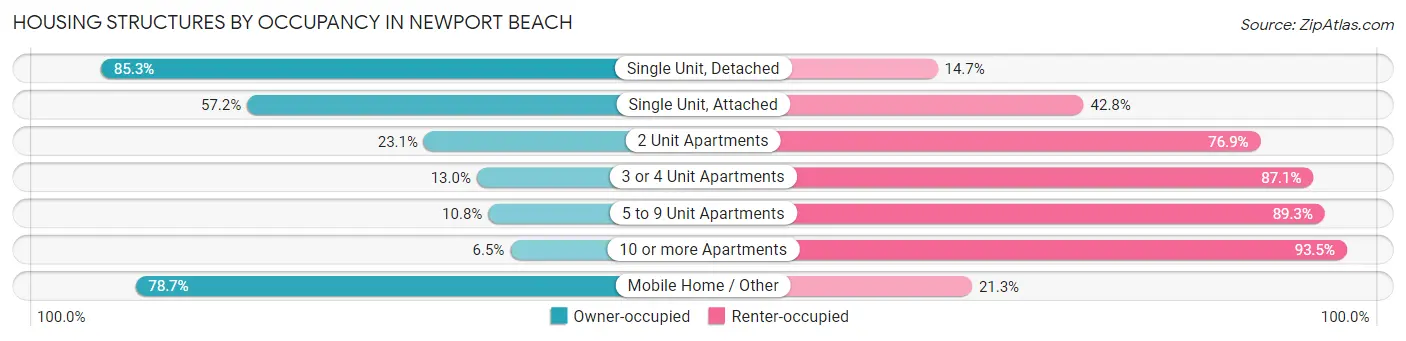
| Structure Type | Owner-occupied | Renter-occupied |
| Single Unit, Detached | 14,821 (85.3%) | 2,554 (14.7%) |
| Single Unit, Attached | 3,775 (57.2%) | 2,828 (42.8%) |
| 2 Unit Apartments | 482 (23.1%) | 1,601 (76.9%) |
| 3 or 4 Unit Apartments | 193 (13.0%) | 1,297 (87.1%) |
| 5 to 9 Unit Apartments | 174 (10.7%) | 1,444 (89.2%) |
| 10 or more Apartments | 596 (6.5%) | 8,571 (93.5%) |
| Mobile Home / Other | 236 (78.7%) | 64 (21.3%) |
| Total | 20,277 (52.5%) | 18,359 (47.5%) |
Housing Structures by Number of Rooms in Newport Beach
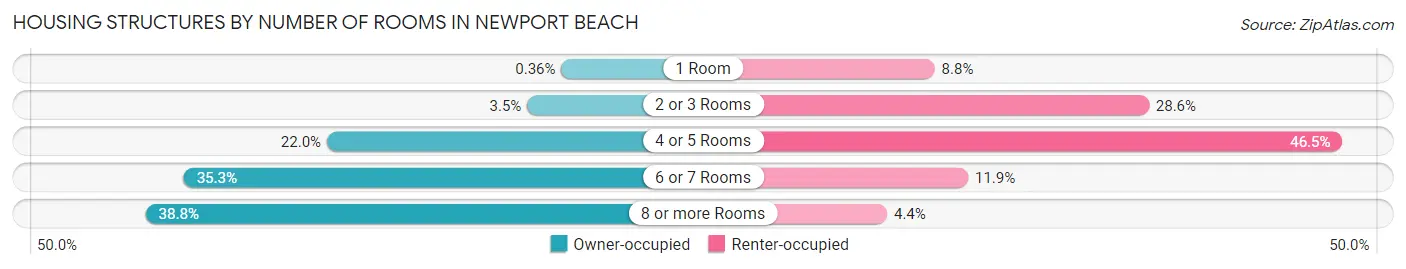
| Number of Rooms | Owner-occupied | Renter-occupied |
| 1 Room | 72 (0.4%) | 1,608 (8.8%) |
| 2 or 3 Rooms | 714 (3.5%) | 5,245 (28.6%) |
| 4 or 5 Rooms | 4,470 (22.0%) | 8,530 (46.5%) |
| 6 or 7 Rooms | 7,154 (35.3%) | 2,176 (11.8%) |
| 8 or more Rooms | 7,867 (38.8%) | 800 (4.4%) |
| Total | 20,277 (100.0%) | 18,359 (100.0%) |
Housing Structure by Heating Type in Newport Beach
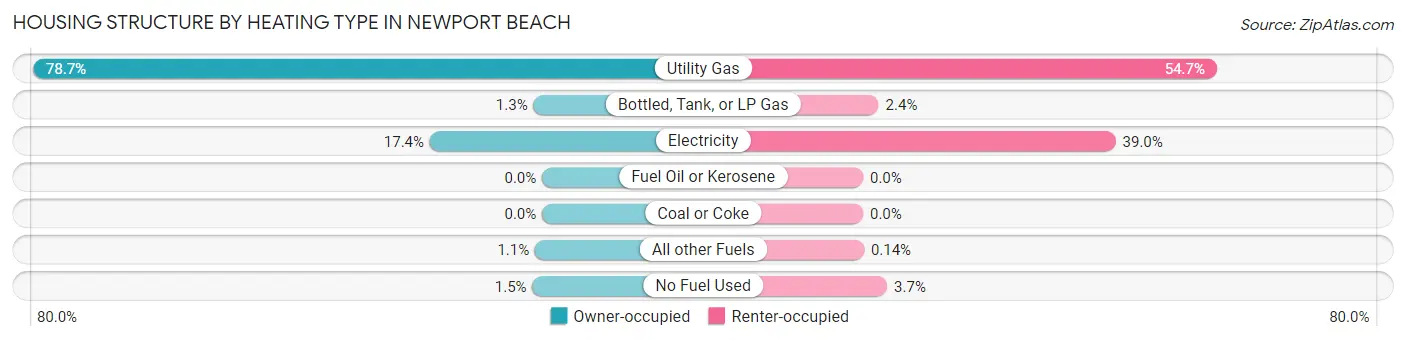
| Heating Type | Owner-occupied | Renter-occupied |
| Utility Gas | 15,961 (78.7%) | 10,039 (54.7%) |
| Bottled, Tank, or LP Gas | 270 (1.3%) | 443 (2.4%) |
| Electricity | 3,519 (17.3%) | 7,167 (39.0%) |
| Fuel Oil or Kerosene | 0 (0.0%) | 0 (0.0%) |
| Coal or Coke | 0 (0.0%) | 0 (0.0%) |
| All other Fuels | 222 (1.1%) | 26 (0.1%) |
| No Fuel Used | 305 (1.5%) | 684 (3.7%) |
| Total | 20,277 (100.0%) | 18,359 (100.0%) |
Household Vehicle Usage in Newport Beach
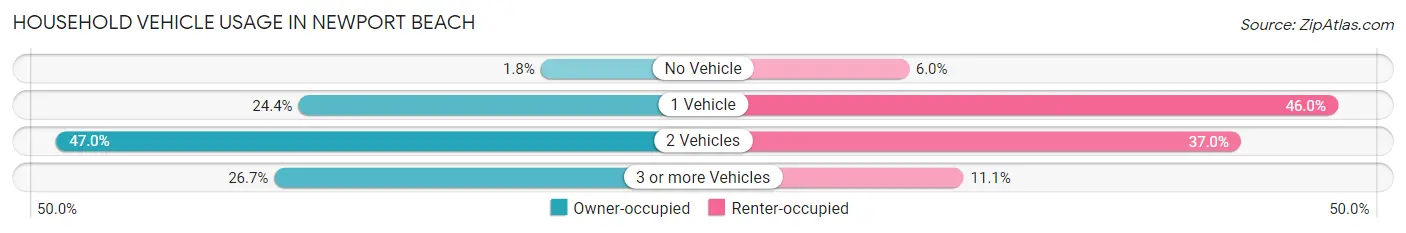
| Vehicles per Household | Owner-occupied | Renter-occupied |
| No Vehicle | 372 (1.8%) | 1,094 (6.0%) |
| 1 Vehicle | 4,956 (24.4%) | 8,446 (46.0%) |
| 2 Vehicles | 9,536 (47.0%) | 6,785 (37.0%) |
| 3 or more Vehicles | 5,413 (26.7%) | 2,034 (11.1%) |
| Total | 20,277 (100.0%) | 18,359 (100.0%) |
Real Estate & Mortgages in Newport Beach
Real Estate and Mortgage Overview in Newport Beach
| Characteristic | Without Mortgage | With Mortgage |
| Housing Units | 7,664 | 12,613 |
| Median Property Value | $2,000,001 | $2,000,001 |
| Median Household Income | $136,604 | $8,897 |
| Monthly Housing Costs | $1,501 | $10,493 |
| Real Estate Taxes | $10,001 | $100 |
Property Value by Mortgage Status in Newport Beach
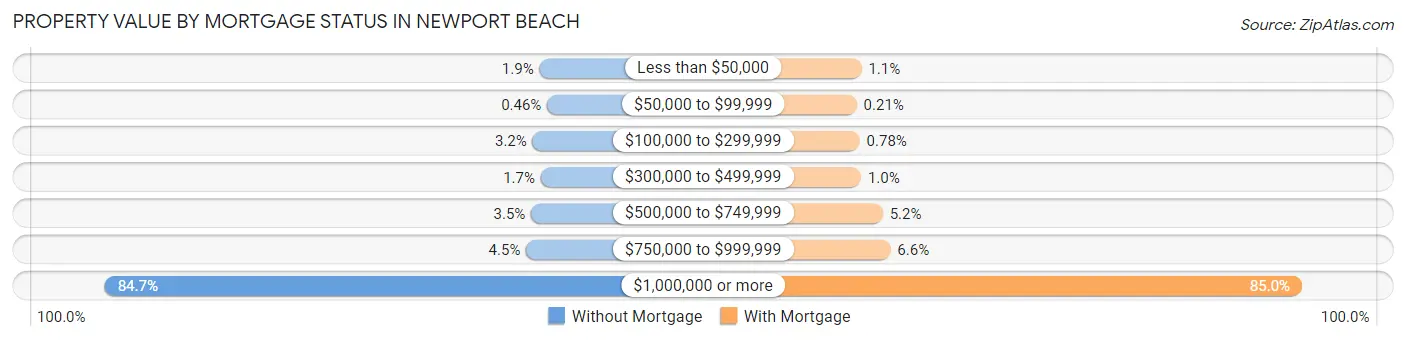
| Property Value | Without Mortgage | With Mortgage |
| Less than $50,000 | 148 (1.9%) | 143 (1.1%) |
| $50,000 to $99,999 | 35 (0.5%) | 26 (0.2%) |
| $100,000 to $299,999 | 248 (3.2%) | 99 (0.8%) |
| $300,000 to $499,999 | 129 (1.7%) | 131 (1.0%) |
| $500,000 to $749,999 | 269 (3.5%) | 652 (5.2%) |
| $750,000 to $999,999 | 341 (4.4%) | 838 (6.6%) |
| $1,000,000 or more | 6,494 (84.7%) | 10,724 (85.0%) |
| Total | 7,664 (100.0%) | 12,613 (100.0%) |
Household Income by Mortgage Status in Newport Beach
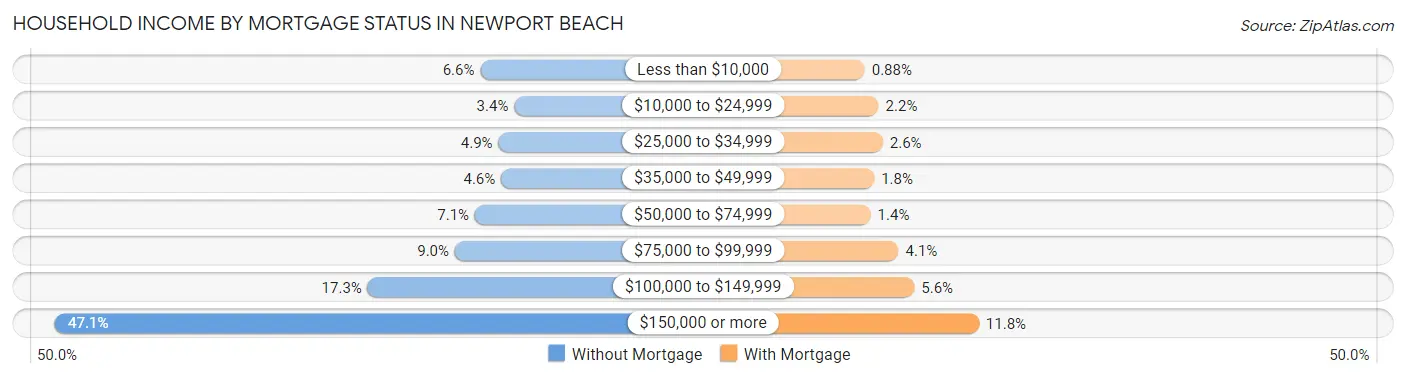
| Household Income | Without Mortgage | With Mortgage |
| Less than $10,000 | 506 (6.6%) | 111 (0.9%) |
| $10,000 to $24,999 | 258 (3.4%) | 278 (2.2%) |
| $25,000 to $34,999 | 373 (4.9%) | 328 (2.6%) |
| $35,000 to $49,999 | 354 (4.6%) | 224 (1.8%) |
| $50,000 to $74,999 | 545 (7.1%) | 181 (1.4%) |
| $75,000 to $99,999 | 691 (9.0%) | 517 (4.1%) |
| $100,000 to $149,999 | 1,328 (17.3%) | 706 (5.6%) |
| $150,000 or more | 3,609 (47.1%) | 1,482 (11.7%) |
| Total | 7,664 (100.0%) | 12,613 (100.0%) |
Property Value to Household Income Ratio in Newport Beach
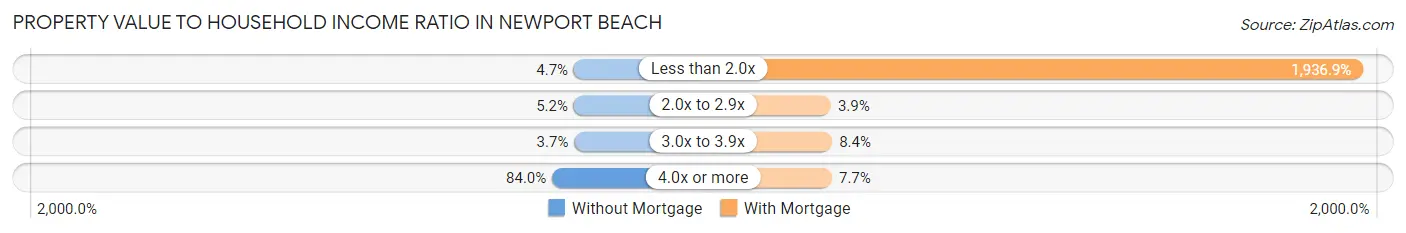
| Value-to-Income Ratio | Without Mortgage | With Mortgage |
| Less than 2.0x | 362 (4.7%) | 244,297 (1,936.9%) |
| 2.0x to 2.9x | 401 (5.2%) | 492 (3.9%) |
| 3.0x to 3.9x | 282 (3.7%) | 1,057 (8.4%) |
| 4.0x or more | 6,437 (84.0%) | 969 (7.7%) |
| Total | 7,664 (100.0%) | 12,613 (100.0%) |
Real Estate Taxes by Mortgage Status in Newport Beach
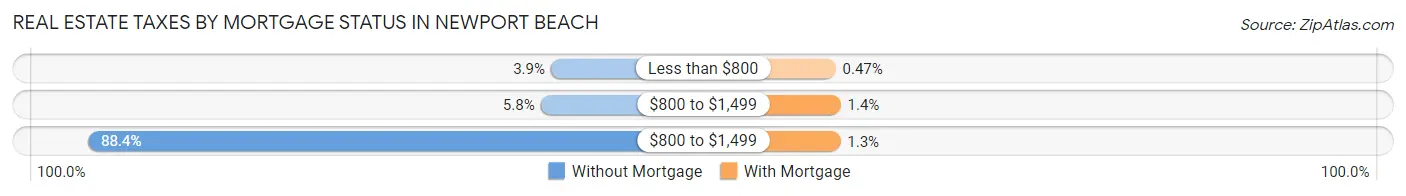
| Property Taxes | Without Mortgage | With Mortgage |
| Less than $800 | 298 (3.9%) | 59 (0.5%) |
| $800 to $1,499 | 442 (5.8%) | 174 (1.4%) |
| $800 to $1,499 | 6,775 (88.4%) | 169 (1.3%) |
| Total | 7,664 (100.0%) | 12,613 (100.0%) |
Health & Disability in Newport Beach
Health Insurance Coverage by Age in Newport Beach
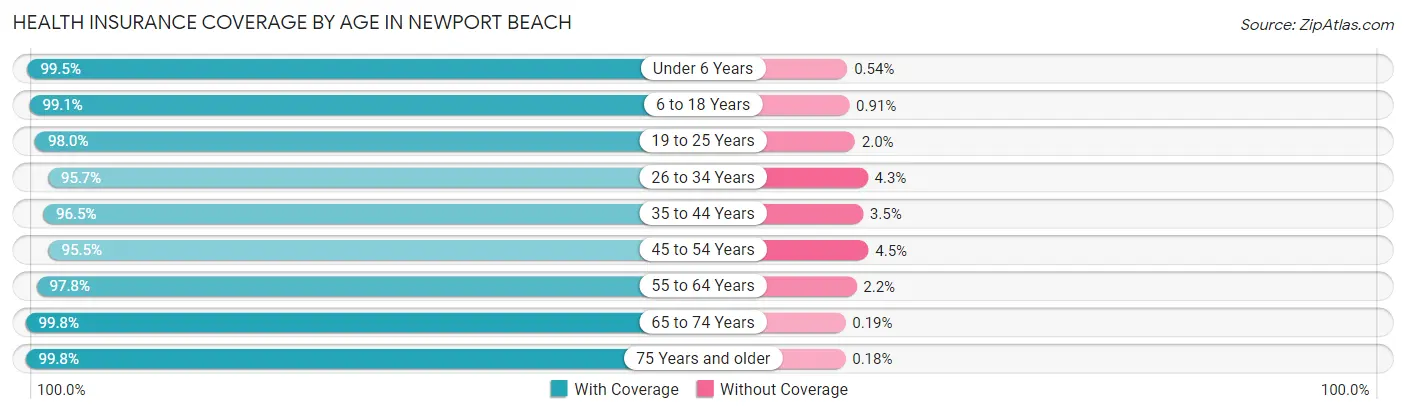
| Age Bracket | With Coverage | Without Coverage |
| Under 6 Years | 3,678 (99.5%) | 20 (0.5%) |
| 6 to 18 Years | 10,968 (99.1%) | 101 (0.9%) |
| 19 to 25 Years | 5,938 (98.0%) | 119 (2.0%) |
| 26 to 34 Years | 9,480 (95.7%) | 430 (4.3%) |
| 35 to 44 Years | 9,883 (96.5%) | 355 (3.5%) |
| 45 to 54 Years | 10,740 (95.5%) | 505 (4.5%) |
| 55 to 64 Years | 12,756 (97.8%) | 292 (2.2%) |
| 65 to 74 Years | 10,430 (99.8%) | 20 (0.2%) |
| 75 Years and older | 9,178 (99.8%) | 17 (0.2%) |
| Total | 83,051 (97.8%) | 1,859 (2.2%) |
Health Insurance Coverage by Citizenship Status in Newport Beach
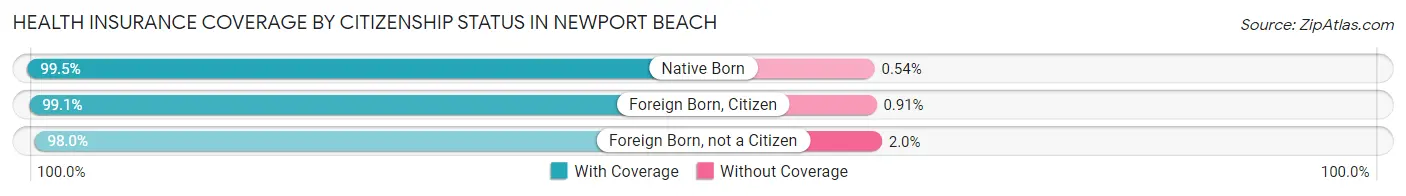
| Citizenship Status | With Coverage | Without Coverage |
| Native Born | 3,678 (99.5%) | 20 (0.5%) |
| Foreign Born, Citizen | 10,968 (99.1%) | 101 (0.9%) |
| Foreign Born, not a Citizen | 5,938 (98.0%) | 119 (2.0%) |
Health Insurance Coverage by Household Income in Newport Beach
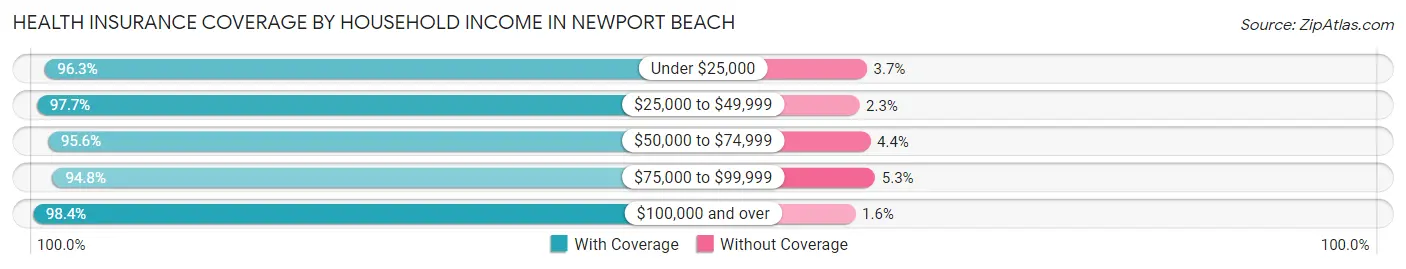
| Household Income | With Coverage | Without Coverage |
| Under $25,000 | 5,734 (96.3%) | 221 (3.7%) |
| $25,000 to $49,999 | 4,994 (97.7%) | 118 (2.3%) |
| $50,000 to $74,999 | 5,238 (95.6%) | 239 (4.4%) |
| $75,000 to $99,999 | 5,701 (94.8%) | 316 (5.2%) |
| $100,000 and over | 61,078 (98.4%) | 965 (1.6%) |
Public vs Private Health Insurance Coverage by Age in Newport Beach
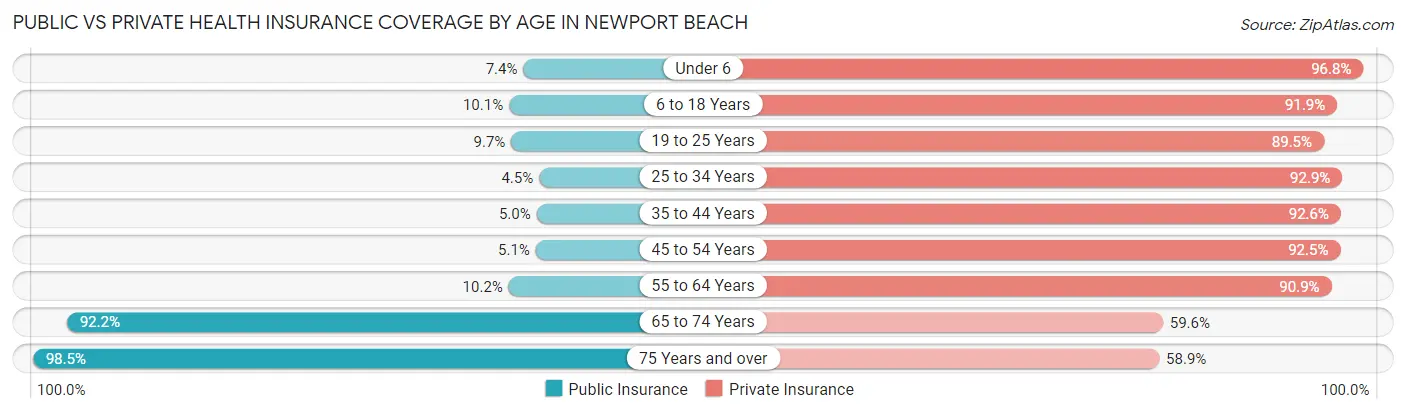
| Age Bracket | Public Insurance | Private Insurance |
| Under 6 | 275 (7.4%) | 3,579 (96.8%) |
| 6 to 18 Years | 1,117 (10.1%) | 10,176 (91.9%) |
| 19 to 25 Years | 587 (9.7%) | 5,419 (89.5%) |
| 25 to 34 Years | 447 (4.5%) | 9,203 (92.9%) |
| 35 to 44 Years | 510 (5.0%) | 9,481 (92.6%) |
| 45 to 54 Years | 577 (5.1%) | 10,403 (92.5%) |
| 55 to 64 Years | 1,325 (10.2%) | 11,857 (90.9%) |
| 65 to 74 Years | 9,632 (92.2%) | 6,226 (59.6%) |
| 75 Years and over | 9,056 (98.5%) | 5,417 (58.9%) |
| Total | 23,526 (27.7%) | 71,761 (84.5%) |
Disability Status by Sex by Age in Newport Beach
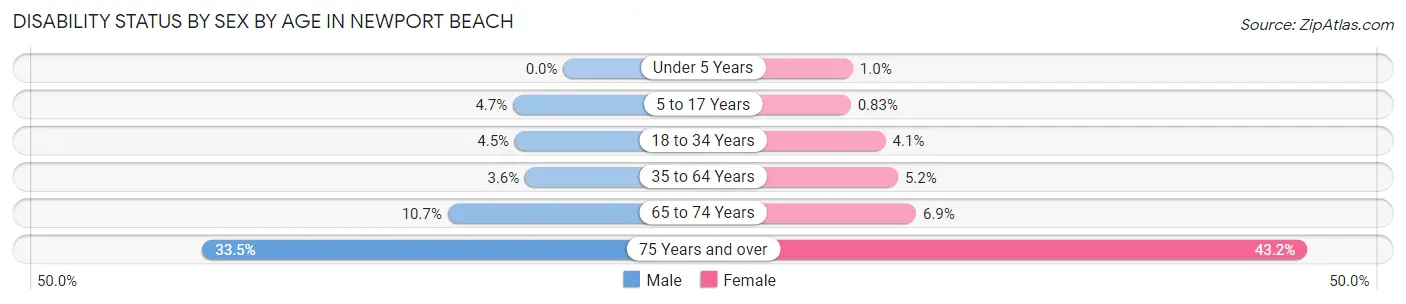
| Age Bracket | Male | Female |
| Under 5 Years | 0 (0.0%) | 15 (1.0%) |
| 5 to 17 Years | 270 (4.7%) | 45 (0.8%) |
| 18 to 34 Years | 387 (4.5%) | 318 (4.1%) |
| 35 to 64 Years | 596 (3.5%) | 925 (5.2%) |
| 65 to 74 Years | 504 (10.7%) | 396 (6.9%) |
| 75 Years and over | 1,447 (33.5%) | 2,105 (43.2%) |
Disability Class by Sex by Age in Newport Beach
Disability Class: Hearing Difficulty
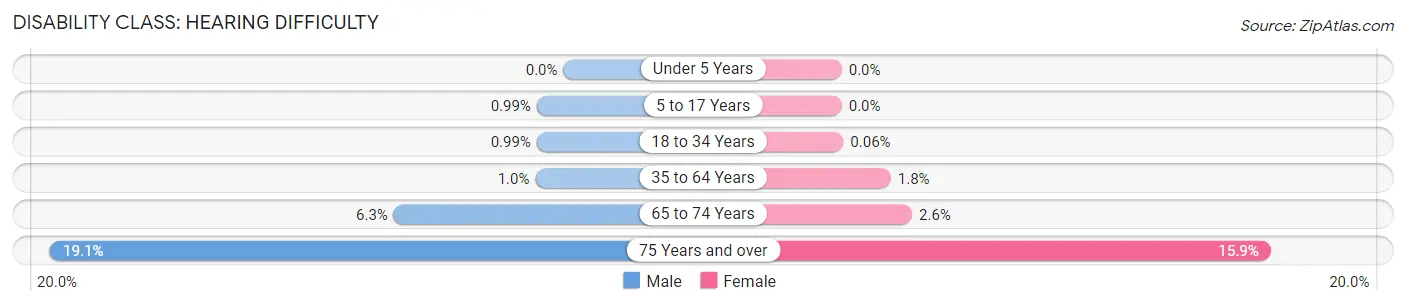
| Age Bracket | Male | Female |
| Under 5 Years | 0 (0.0%) | 0 (0.0%) |
| 5 to 17 Years | 57 (1.0%) | 0 (0.0%) |
| 18 to 34 Years | 85 (1.0%) | 5 (0.1%) |
| 35 to 64 Years | 174 (1.0%) | 323 (1.8%) |
| 65 to 74 Years | 296 (6.3%) | 150 (2.6%) |
| 75 Years and over | 823 (19.1%) | 776 (15.9%) |
Disability Class: Vision Difficulty
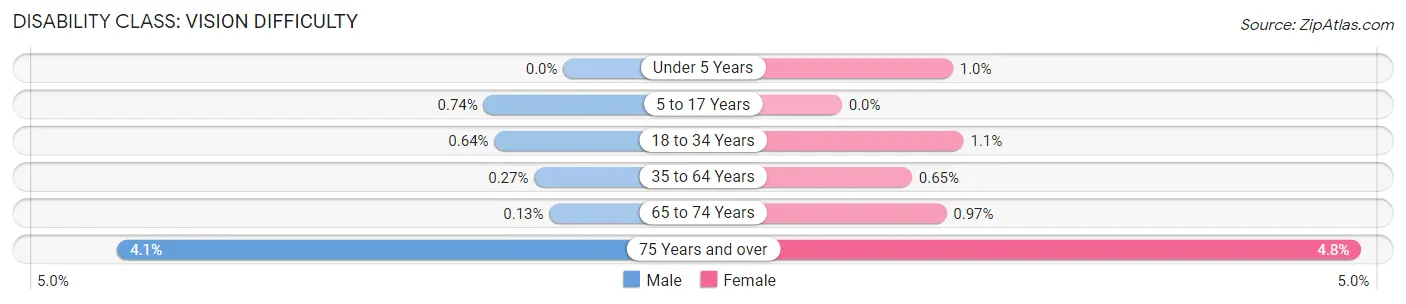
| Age Bracket | Male | Female |
| Under 5 Years | 0 (0.0%) | 15 (1.0%) |
| 5 to 17 Years | 43 (0.7%) | 0 (0.0%) |
| 18 to 34 Years | 55 (0.6%) | 88 (1.1%) |
| 35 to 64 Years | 46 (0.3%) | 115 (0.6%) |
| 65 to 74 Years | 6 (0.1%) | 56 (1.0%) |
| 75 Years and over | 179 (4.1%) | 235 (4.8%) |
Disability Class: Cognitive Difficulty
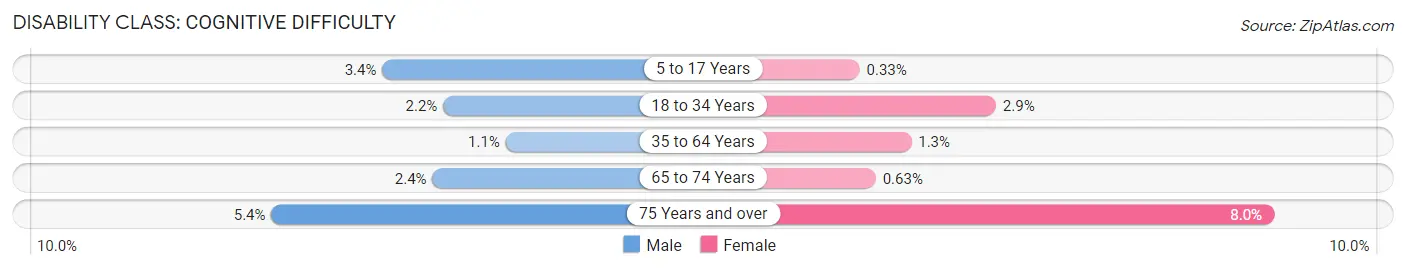
| Age Bracket | Male | Female |
| 5 to 17 Years | 194 (3.4%) | 18 (0.3%) |
| 18 to 34 Years | 192 (2.2%) | 223 (2.9%) |
| 35 to 64 Years | 180 (1.1%) | 229 (1.3%) |
| 65 to 74 Years | 114 (2.4%) | 36 (0.6%) |
| 75 Years and over | 234 (5.4%) | 391 (8.0%) |
Disability Class: Ambulatory Difficulty
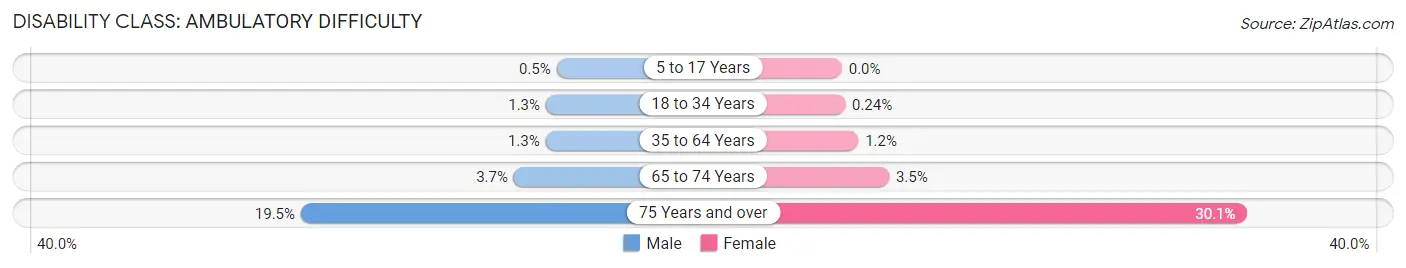
| Age Bracket | Male | Female |
| 5 to 17 Years | 29 (0.5%) | 0 (0.0%) |
| 18 to 34 Years | 112 (1.3%) | 19 (0.2%) |
| 35 to 64 Years | 221 (1.3%) | 217 (1.2%) |
| 65 to 74 Years | 173 (3.7%) | 201 (3.5%) |
| 75 Years and over | 842 (19.5%) | 1,468 (30.1%) |
Disability Class: Self-Care Difficulty
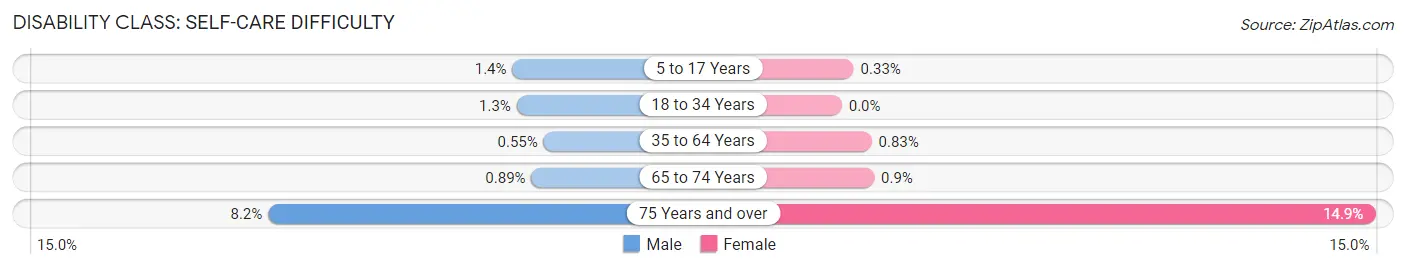
| Age Bracket | Male | Female |
| 5 to 17 Years | 82 (1.4%) | 18 (0.3%) |
| 18 to 34 Years | 112 (1.3%) | 0 (0.0%) |
| 35 to 64 Years | 92 (0.5%) | 148 (0.8%) |
| 65 to 74 Years | 42 (0.9%) | 52 (0.9%) |
| 75 Years and over | 355 (8.2%) | 724 (14.8%) |
Technology Access in Newport Beach
Computing Device Access in Newport Beach
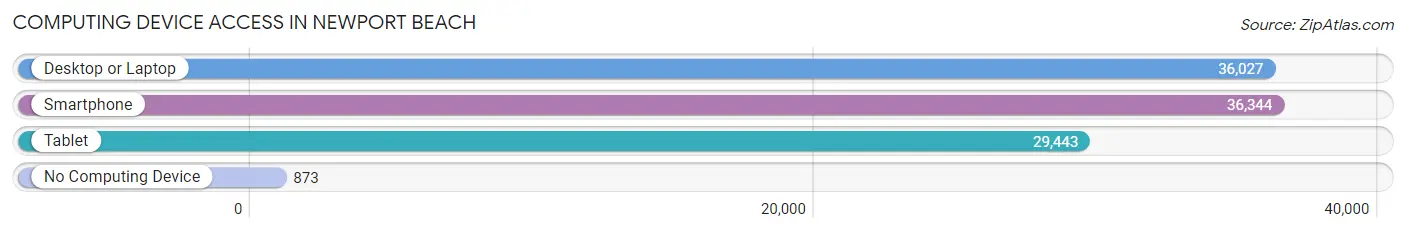
| Device Type | # Households | % Households |
| Desktop or Laptop | 36,027 | 93.2% |
| Smartphone | 36,344 | 94.1% |
| Tablet | 29,443 | 76.2% |
| No Computing Device | 873 | 2.3% |
| Total | 38,636 | 100.0% |
Internet Access in Newport Beach
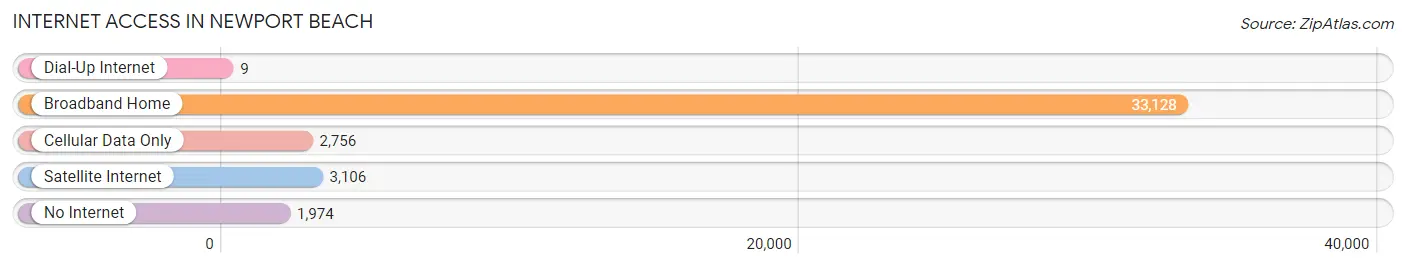
| Internet Type | # Households | % Households |
| Dial-Up Internet | 9 | 0.0% |
| Broadband Home | 33,128 | 85.7% |
| Cellular Data Only | 2,756 | 7.1% |
| Satellite Internet | 3,106 | 8.0% |
| No Internet | 1,974 | 5.1% |
| Total | 38,636 | 100.0% |
Newport Beach Summary
Newport Beach is a coastal city located in Orange County, California. It is situated on the Pacific Ocean, just south of Los Angeles. The city is known for its beautiful beaches, luxury homes, and upscale shopping and dining. It is also home to a large number of celebrities and wealthy residents.
History
The area that is now Newport Beach was originally inhabited by the Tongva people, who were the original inhabitants of the Los Angeles Basin. The area was first explored by Europeans in 1769, when Spanish explorer Gaspar de Portola and his expedition passed through the area. The area was later settled by the Spanish in the late 1700s, and the city of Newport Beach was officially incorporated in 1906.
Geography
Newport Beach is located in Orange County, California, on the Pacific Ocean. It is bordered by the cities of Costa Mesa, Huntington Beach, and Irvine. The city covers an area of 53.3 square miles, with a population of 86,252 as of the 2010 census. The city is divided into several distinct neighborhoods, including Balboa Island, Corona del Mar, Newport Coast, and West Newport.
Climate
Newport Beach has a Mediterranean climate, with mild temperatures year-round. The average high temperature in the summer is around 75°F, and the average low temperature in the winter is around 55°F. The city receives an average of 13 inches of rain per year.
Economy
Newport Beach is a major economic center in Orange County. The city is home to a number of large corporations, including Allergan, PIMCO, and Pacific Life Insurance. The city is also home to a number of luxury resorts and hotels, as well as a thriving tourism industry.
Demographics
As of the 2010 census, the population of Newport Beach was 86,252. The racial makeup of the city was 79.2% White, 4.2% Asian, 2.3% African American, 0.4% Native American, 0.1% Pacific Islander, and 13.8% from other races. The median household income was $103,845, and the median family income was $118,845. The per capita income was $50,845. The city has a large population of college-educated adults, with over 50% of the population having a bachelor's degree or higher.
Common Questions
What is Per Capita Income in Newport Beach?
Per Capita income in Newport Beach is $110,535.
What is the Median Family Income in Newport Beach?
Median Family Income in Newport Beach is $204,236.
What is the Median Household income in Newport Beach?
Median Household Income in Newport Beach is $149,471.
What is Income or Wage Gap in Newport Beach?
Income or Wage Gap in Newport Beach is 45.1%.
Women in Newport Beach earn 54.9 cents for every dollar earned by a man.
What is Family Income Deficit in Newport Beach?
Family Income Deficit in Newport Beach is $11,430.
Families that are below poverty line in Newport Beach earn $11,430 less on average than the poverty threshold level.
What is Inequality or Gini Index in Newport Beach?
Inequality or Gini Index in Newport Beach is 0.53.
What is the Total Population of Newport Beach?
Total Population of Newport Beach is 85,159.
What is the Total Male Population of Newport Beach?
Total Male Population of Newport Beach is 41,980.
What is the Total Female Population of Newport Beach?
Total Female Population of Newport Beach is 43,179.
What is the Ratio of Males per 100 Females in Newport Beach?
There are 97.22 Males per 100 Females in Newport Beach.
What is the Ratio of Females per 100 Males in Newport Beach?
There are 102.86 Females per 100 Males in Newport Beach.
What is the Median Population Age in Newport Beach?
Median Population Age in Newport Beach is 46.7 Years.
What is the Average Family Size in Newport Beach
Average Family Size in Newport Beach is 2.8 People.
What is the Average Household Size in Newport Beach
Average Household Size in Newport Beach is 2.2 People.
How Large is the Labor Force in Newport Beach?
There are 45,232 People in the Labor Forcein in Newport Beach.
What is the Percentage of People in the Labor Force in Newport Beach?
62.4% of People are in the Labor Force in Newport Beach.
What is the Unemployment Rate in Newport Beach?
Unemployment Rate in Newport Beach is 4.1%.