Zip Codes with the Highest Percentage of Population Employed in Legal Services & Support in Irvine, CA
RELATED REPORTS & OPTIONS
Legal Services & Support
Irvine
Compare Zip Codes
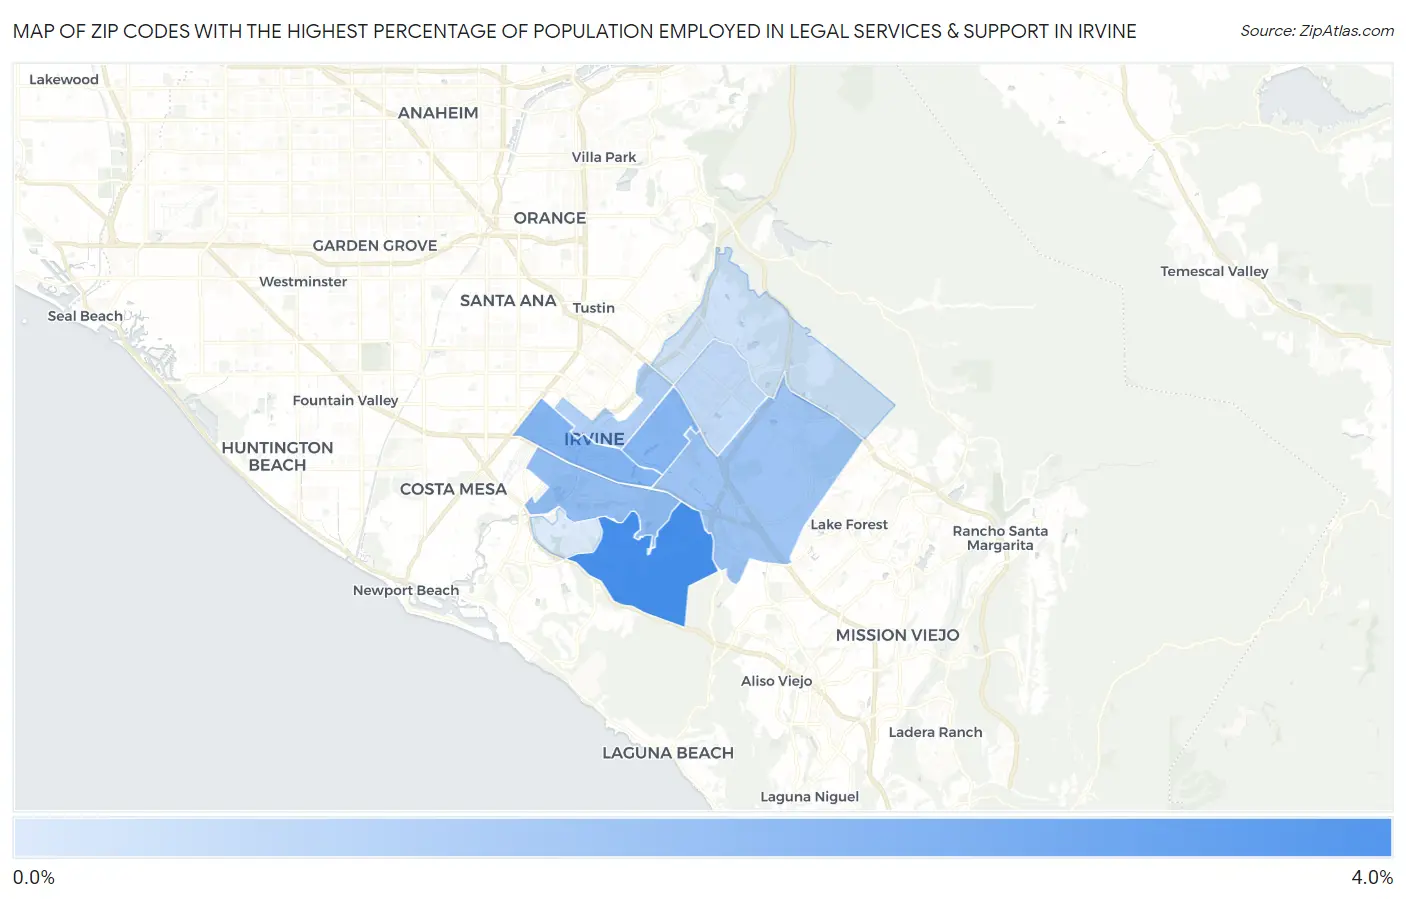
Map of Zip Codes with the Highest Percentage of Population Employed in Legal Services & Support in Irvine
0.75%
3.9%
Zip Codes with the Highest Percentage of Population Employed in Legal Services & Support in Irvine, CA
| Zip Code | % Employed | vs State | vs National | |
| 1. | 92603 | 3.9% | 1.3% (+2.65)#101 | 1.2% (+2.72)#1,178 |
| 2. | 92614 | 2.6% | 1.3% (+1.38)#199 | 1.2% (+1.46)#2,284 |
| 3. | 92604 | 2.5% | 1.3% (+1.28)#213 | 1.2% (+1.36)#2,449 |
| 4. | 92612 | 2.3% | 1.3% (+1.02)#248 | 1.2% (+1.09)#2,880 |
| 5. | 92618 | 2.1% | 1.3% (+0.805)#285 | 1.2% (+0.879)#3,302 |
| 6. | 92606 | 1.7% | 1.3% (+0.409)#376 | 1.2% (+0.484)#4,435 |
| 7. | 92620 | 1.3% | 1.3% (+0.052)#478 | 1.2% (+0.126)#5,891 |
| 8. | 92602 | 1.0% | 1.3% (-0.236)#625 | 1.2% (-0.162)#7,672 |
| 9. | 92617 | 0.75% | 1.3% (-0.513)#772 | 1.2% (-0.439)#9,971 |
1
Common Questions
What are the Top 5 Zip Codes with the Highest Percentage of Population Employed in Legal Services & Support in Irvine, CA?
Top 5 Zip Codes with the Highest Percentage of Population Employed in Legal Services & Support in Irvine, CA are:
What zip code has the Highest Percentage of Population Employed in Legal Services & Support in Irvine, CA?
92603 has the Highest Percentage of Population Employed in Legal Services & Support in Irvine, CA with 3.9%.
What is the Percentage of Population Employed in Legal Services & Support in Irvine, CA?
Percentage of Population Employed in Legal Services & Support in Irvine is 2.0%.
What is the Percentage of Population Employed in Legal Services & Support in California?
Percentage of Population Employed in Legal Services & Support in California is 1.3%.
What is the Percentage of Population Employed in Legal Services & Support in the United States?
Percentage of Population Employed in Legal Services & Support in the United States is 1.2%.