Los Altos Hills, CA Map & Demographics
Los Altos Hills Map
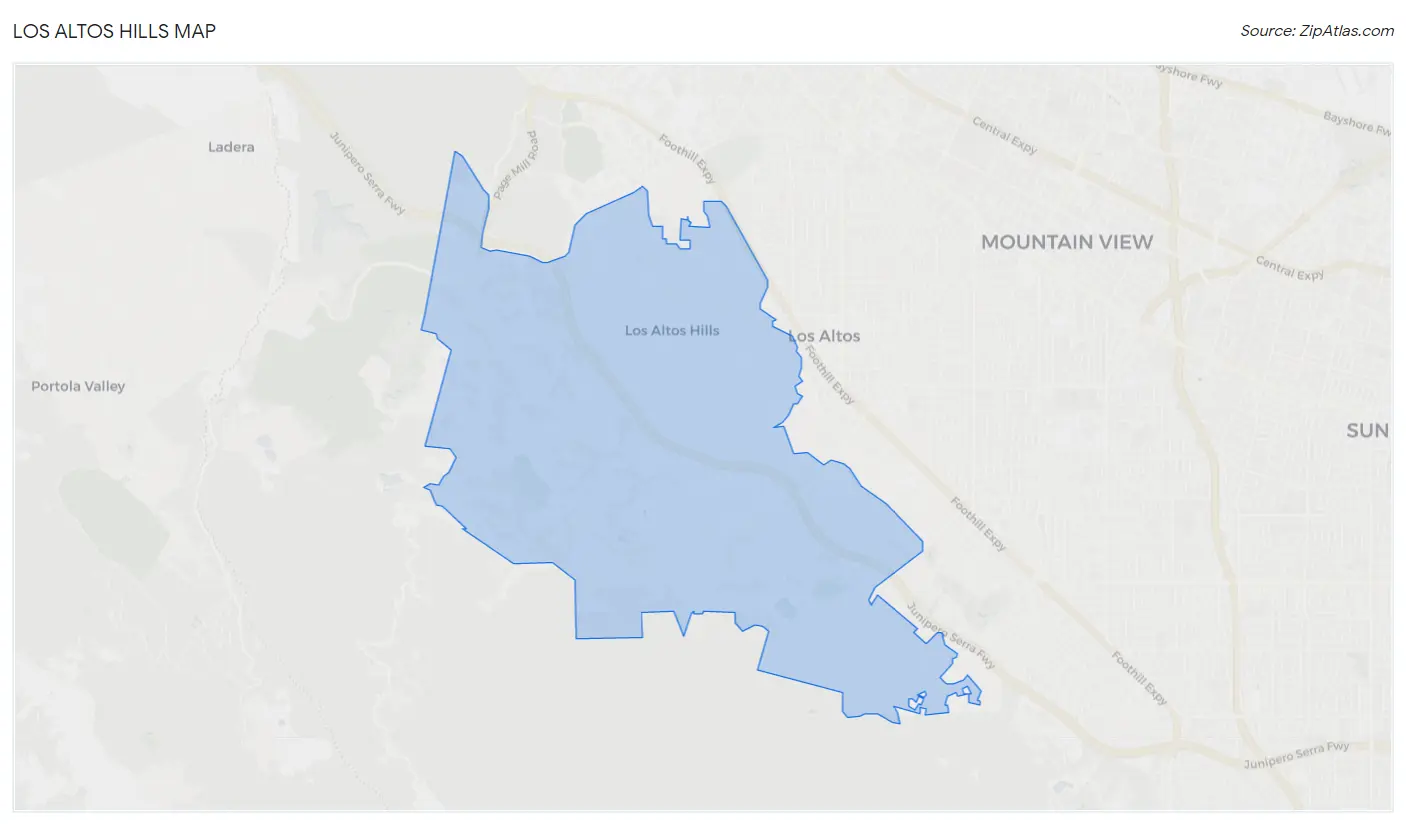
Los Altos Hills Overview
$170,801
PER CAPITA INCOME
$250,001
AVG FAMILY INCOME
$250,001
AVG HOUSEHOLD INCOME
57.1%
WAGE / INCOME GAP [ % ]
42.9¢/ $1
WAGE / INCOME GAP [ $ ]
0.51
INEQUALITY / GINI INDEX
8,441
TOTAL POPULATION
3,837
MALE POPULATION
4,604
FEMALE POPULATION
83.34
MALES / 100 FEMALES
119.99
FEMALES / 100 MALES
53.5
MEDIAN AGE
2.9
AVG FAMILY SIZE
2.7
AVG HOUSEHOLD SIZE
3,846
LABOR FORCE [ PEOPLE ]
53.8%
PERCENT IN LABOR FORCE
2.8%
UNEMPLOYMENT RATE
Los Altos Hills Area Codes
Income in Los Altos Hills
Income Overview in Los Altos Hills
Per Capita Income in Los Altos Hills is $170,801, while median incomes of families and households are $250,001 and $250,001 respectively.
| Characteristic | Number | Measure |
| Per Capita Income | 8,441 | $170,801 |
| Median Family Income | 2,620 | $250,001 |
| Mean Family Income | 2,620 | $508,717 |
| Median Household Income | 3,084 | $250,001 |
| Mean Household Income | 3,084 | $460,098 |
| Income Deficit | 2,620 | $0 |
| Wage / Income Gap (%) | 8,441 | 57.13% |
| Wage / Income Gap ($) | 8,441 | 42.87¢ per $1 |
| Gini / Inequality Index | 8,441 | 0.51 |
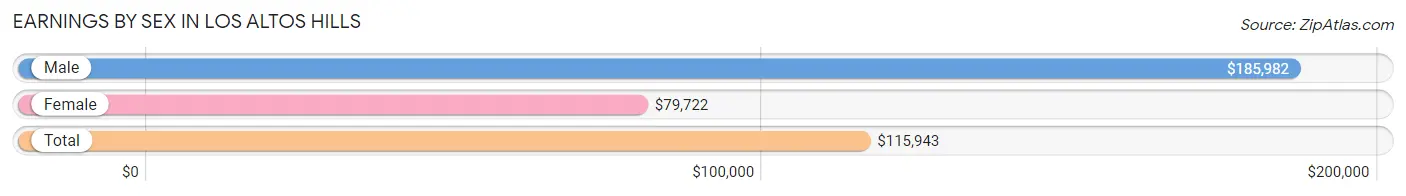
Earnings by Sex in Los Altos Hills
Average Earnings in Los Altos Hills are $115,943, $185,982 for men and $79,722 for women, a difference of 57.1%.
| Sex | Number | Average Earnings |
| Male | 2,112 (51.6%) | $185,982 |
| Female | 1,980 (48.4%) | $79,722 |
| Total | 4,092 (100.0%) | $115,943 |
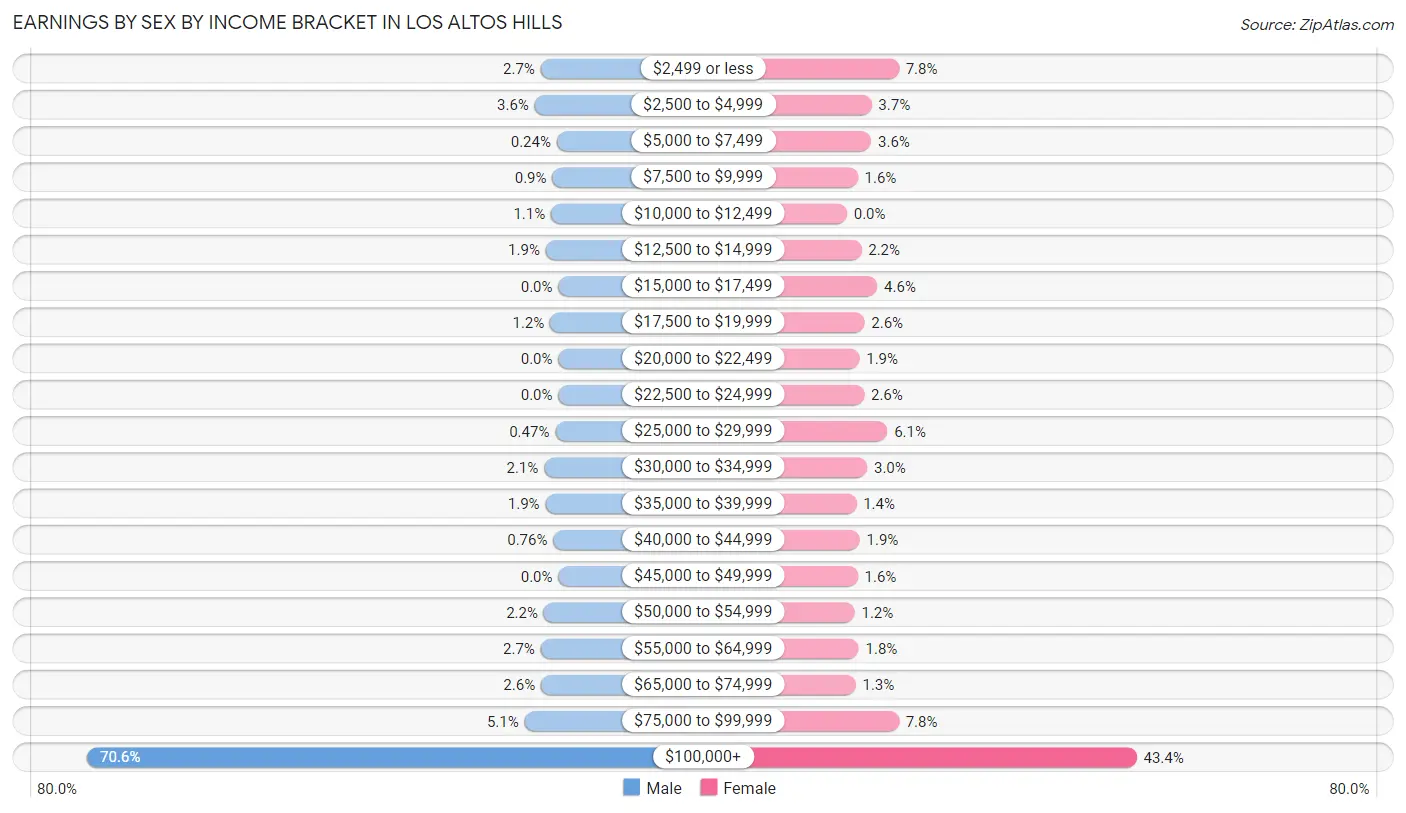
Earnings by Sex by Income Bracket in Los Altos Hills
The most common earnings brackets in Los Altos Hills are $100,000+ for men (1,492 | 70.6%) and $100,000+ for women (860 | 43.4%).
| Income | Male | Female |
| $2,499 or less | 56 (2.6%) | 154 (7.8%) |
| $2,500 to $4,999 | 75 (3.5%) | 73 (3.7%) |
| $5,000 to $7,499 | 5 (0.2%) | 72 (3.6%) |
| $7,500 to $9,999 | 19 (0.9%) | 32 (1.6%) |
| $10,000 to $12,499 | 23 (1.1%) | 0 (0.0%) |
| $12,500 to $14,999 | 40 (1.9%) | 43 (2.2%) |
| $15,000 to $17,499 | 0 (0.0%) | 90 (4.5%) |
| $17,500 to $19,999 | 26 (1.2%) | 52 (2.6%) |
| $20,000 to $22,499 | 0 (0.0%) | 37 (1.9%) |
| $22,500 to $24,999 | 0 (0.0%) | 51 (2.6%) |
| $25,000 to $29,999 | 10 (0.5%) | 120 (6.1%) |
| $30,000 to $34,999 | 45 (2.1%) | 60 (3.0%) |
| $35,000 to $39,999 | 41 (1.9%) | 28 (1.4%) |
| $40,000 to $44,999 | 16 (0.8%) | 38 (1.9%) |
| $45,000 to $49,999 | 0 (0.0%) | 32 (1.6%) |
| $50,000 to $54,999 | 46 (2.2%) | 23 (1.2%) |
| $55,000 to $64,999 | 56 (2.6%) | 35 (1.8%) |
| $65,000 to $74,999 | 55 (2.6%) | 26 (1.3%) |
| $75,000 to $99,999 | 107 (5.1%) | 154 (7.8%) |
| $100,000+ | 1,492 (70.6%) | 860 (43.4%) |
| Total | 2,112 (100.0%) | 1,980 (100.0%) |
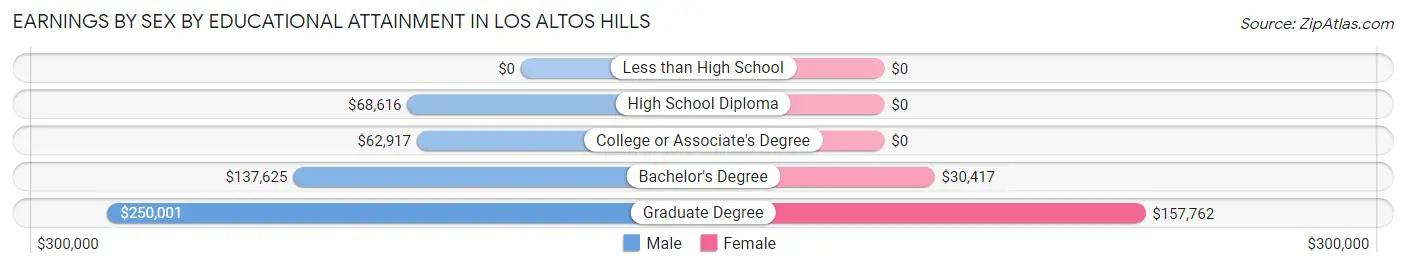
Earnings by Sex by Educational Attainment in Los Altos Hills
Average earnings in Los Altos Hills are $227,552 for men and $101,719 for women, a difference of 55.3%. Men with an educational attainment of graduate degree enjoy the highest average annual earnings of $250,001, while those with college or associate's degree education earn the least with $62,917. Women with an educational attainment of graduate degree earn the most with the average annual earnings of $157,762, while those with bachelor's degree education have the smallest earnings of $30,417.
| Educational Attainment | Male Income | Female Income |
| Less than High School | - | - |
| High School Diploma | $68,616 | $0 |
| College or Associate's Degree | $62,917 | $0 |
| Bachelor's Degree | $137,625 | $30,417 |
| Graduate Degree | $250,001 | $157,762 |
| Total | $227,552 | $101,719 |
Family Income in Los Altos Hills
Family Income Brackets in Los Altos Hills
According to the Los Altos Hills family income data, there are 1,920 families falling into the $200,000+ income range, which is the most common income bracket and makes up 73.3% of all families.
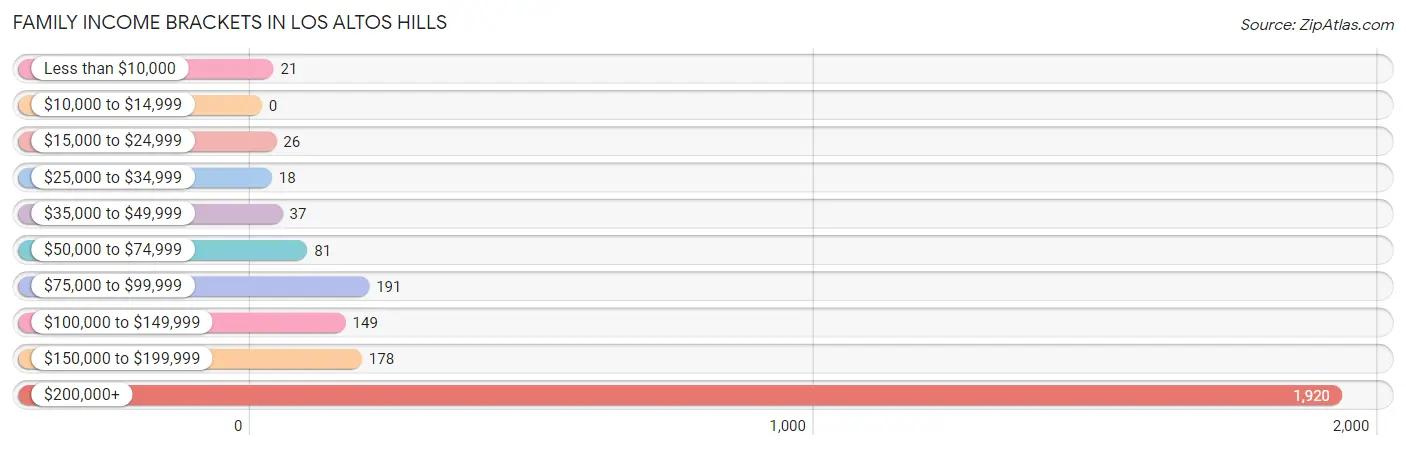
| Income Bracket | # Families | % Families |
| Less than $10,000 | 21 | 0.8% |
| $10,000 to $14,999 | 0 | 0.0% |
| $15,000 to $24,999 | 26 | 1.0% |
| $25,000 to $34,999 | 18 | 0.7% |
| $35,000 to $49,999 | 37 | 1.4% |
| $50,000 to $74,999 | 81 | 3.1% |
| $75,000 to $99,999 | 191 | 7.3% |
| $100,000 to $149,999 | 149 | 5.7% |
| $150,000 to $199,999 | 178 | 6.8% |
| $200,000+ | 1,920 | 73.3% |
Family Income by Famaliy Size in Los Altos Hills
2-person families (1,498 | 57.2%) account for the highest median family income in Los Altos Hills with $250,001 per family, while 2-person families (1,498 | 57.2%) have the highest median income of $125,000 per family member.
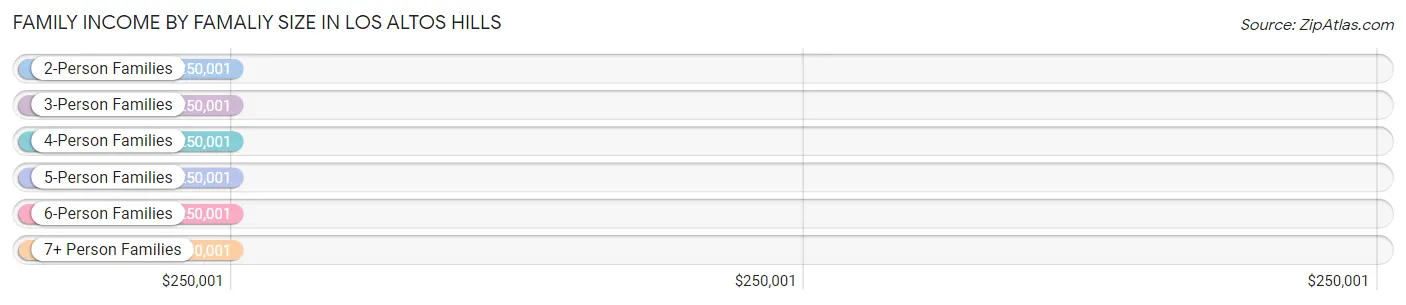
| Income Bracket | # Families | Median Income |
| 2-Person Families | 1,498 (57.2%) | $250,001 |
| 3-Person Families | 432 (16.5%) | $250,001 |
| 4-Person Families | 437 (16.7%) | $250,001 |
| 5-Person Families | 178 (6.8%) | $250,001 |
| 6-Person Families | 44 (1.7%) | $250,001 |
| 7+ Person Families | 31 (1.2%) | $250,001 |
| Total | 2,620 (100.0%) | $250,001 |
Family Income by Number of Earners in Los Altos Hills
The median family income in Los Altos Hills is $250,001, with families comprising 1 earner (824) having the highest median family income of $250,001, while families with no earners (508) have the lowest median family income of $247,266, accounting for 31.5% and 19.4% of families, respectively.
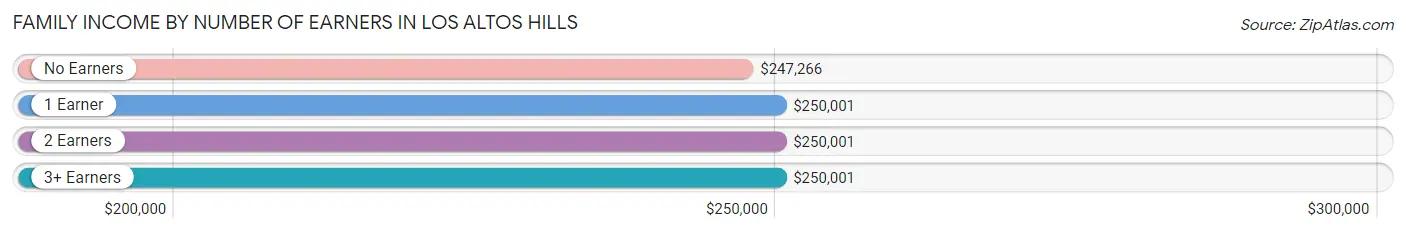
| Number of Earners | # Families | Median Income |
| No Earners | 508 (19.4%) | $247,266 |
| 1 Earner | 824 (31.5%) | $250,001 |
| 2 Earners | 1,077 (41.1%) | $250,001 |
| 3+ Earners | 211 (8.1%) | $250,001 |
| Total | 2,620 (100.0%) | $250,001 |
Household Income in Los Altos Hills
Household Income Brackets in Los Altos Hills
With 2,045 households falling in the category, the $200,000+ income range is the most frequent in Los Altos Hills, accounting for 66.3% of all households.
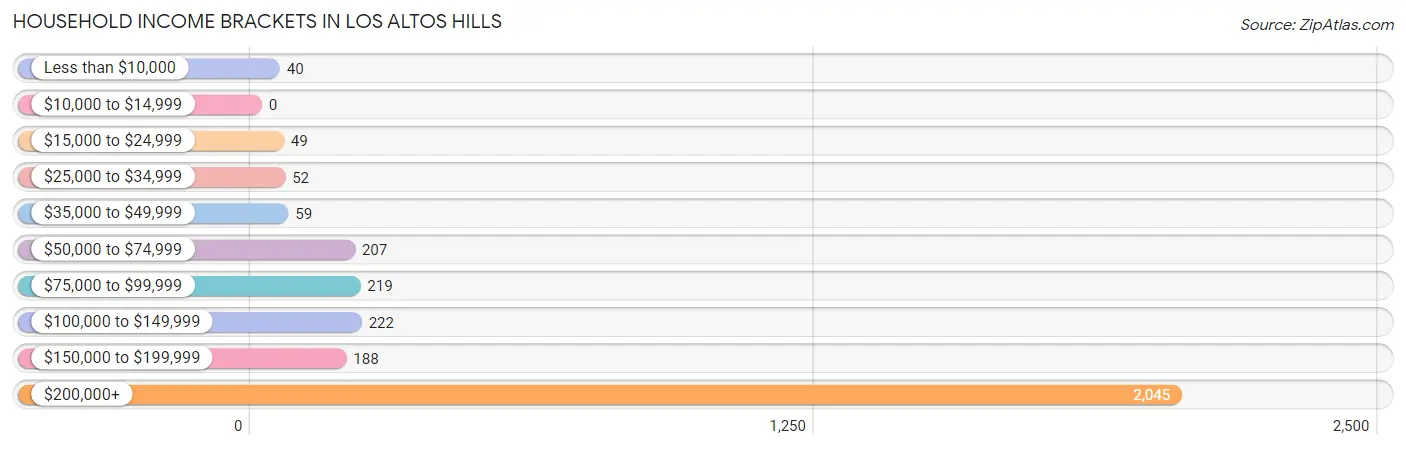
| Income Bracket | # Households | % Households |
| Less than $10,000 | 40 | 1.3% |
| $10,000 to $14,999 | 0 | 0.0% |
| $15,000 to $24,999 | 49 | 1.6% |
| $25,000 to $34,999 | 52 | 1.7% |
| $35,000 to $49,999 | 59 | 1.9% |
| $50,000 to $74,999 | 207 | 6.7% |
| $75,000 to $99,999 | 219 | 7.1% |
| $100,000 to $149,999 | 222 | 7.2% |
| $150,000 to $199,999 | 188 | 6.1% |
| $200,000+ | 2,045 | 66.3% |
Household Income by Householder Age in Los Altos Hills
The median household income in Los Altos Hills is $250,001, with the highest median household income of $250,001 found in the 25 to 44 years age bracket for the primary householder. A total of 259 households (8.4%) fall into this category.
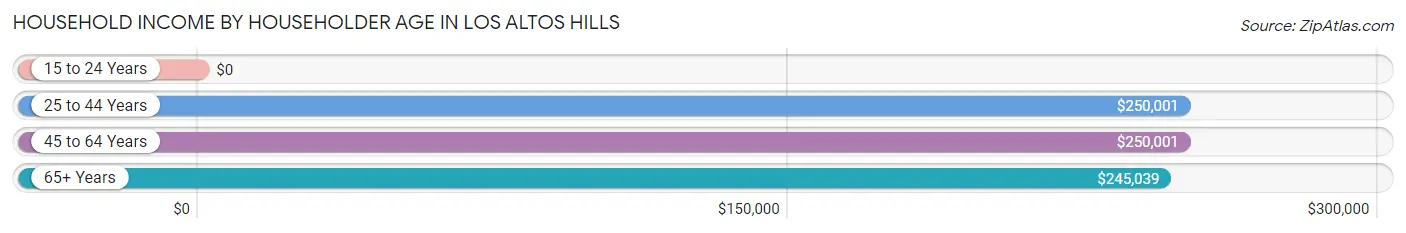
| Income Bracket | # Households | Median Income |
| 15 to 24 Years | 0 (0.0%) | $0 |
| 25 to 44 Years | 259 (8.4%) | $250,001 |
| 45 to 64 Years | 1,228 (39.8%) | $250,001 |
| 65+ Years | 1,597 (51.8%) | $245,039 |
| Total | 3,084 (100.0%) | $250,001 |
Poverty in Los Altos Hills
Income Below Poverty by Sex and Age in Los Altos Hills
With 1.3% poverty level for males and 2.6% for females among the residents of Los Altos Hills, 75 year old and over males and 55 to 64 year old females are the most vulnerable to poverty, with 39 males (6.1%) and 74 females (10.0%) in their respective age groups living below the poverty level.
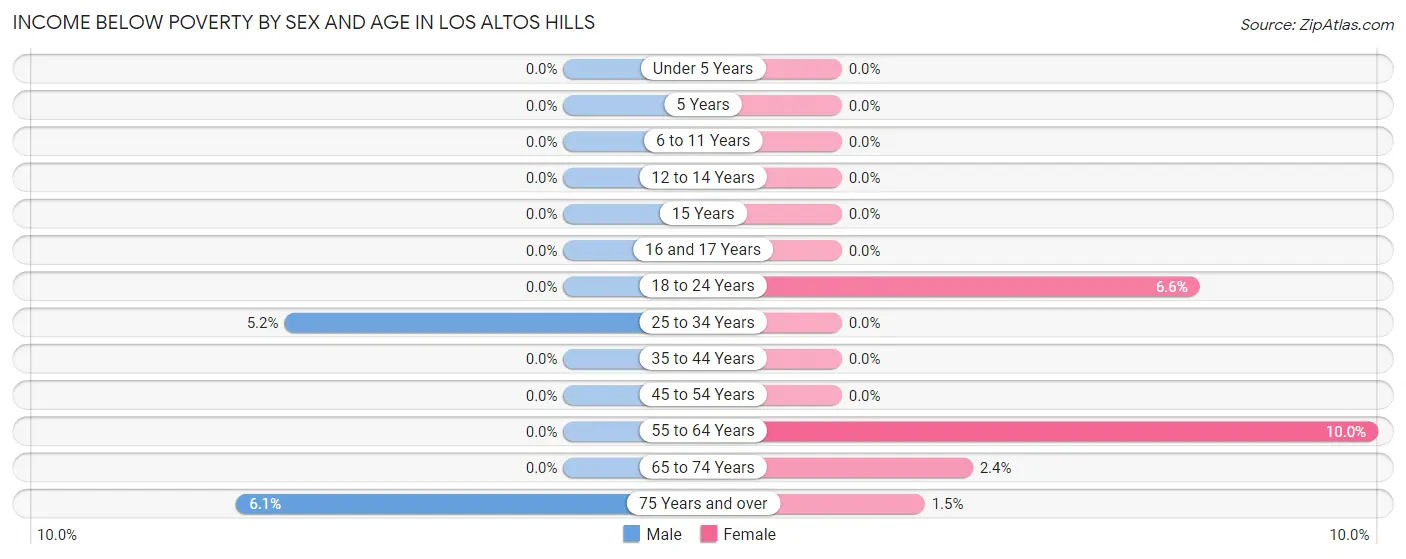
| Age Bracket | Male | Female |
| Under 5 Years | 0 (0.0%) | 0 (0.0%) |
| 5 Years | 0 (0.0%) | 0 (0.0%) |
| 6 to 11 Years | 0 (0.0%) | 0 (0.0%) |
| 12 to 14 Years | 0 (0.0%) | 0 (0.0%) |
| 15 Years | 0 (0.0%) | 0 (0.0%) |
| 16 and 17 Years | 0 (0.0%) | 0 (0.0%) |
| 18 to 24 Years | 0 (0.0%) | 19 (6.6%) |
| 25 to 34 Years | 10 (5.2%) | 0 (0.0%) |
| 35 to 44 Years | 0 (0.0%) | 0 (0.0%) |
| 45 to 54 Years | 0 (0.0%) | 0 (0.0%) |
| 55 to 64 Years | 0 (0.0%) | 74 (10.0%) |
| 65 to 74 Years | 0 (0.0%) | 20 (2.4%) |
| 75 Years and over | 39 (6.1%) | 9 (1.5%) |
| Total | 49 (1.3%) | 122 (2.6%) |
Income Above Poverty by Sex and Age in Los Altos Hills
According to the poverty statistics in Los Altos Hills, males aged under 5 years and females aged under 5 years are the age groups that are most secure financially, with 100.0% of males and 100.0% of females in these age groups living above the poverty line.
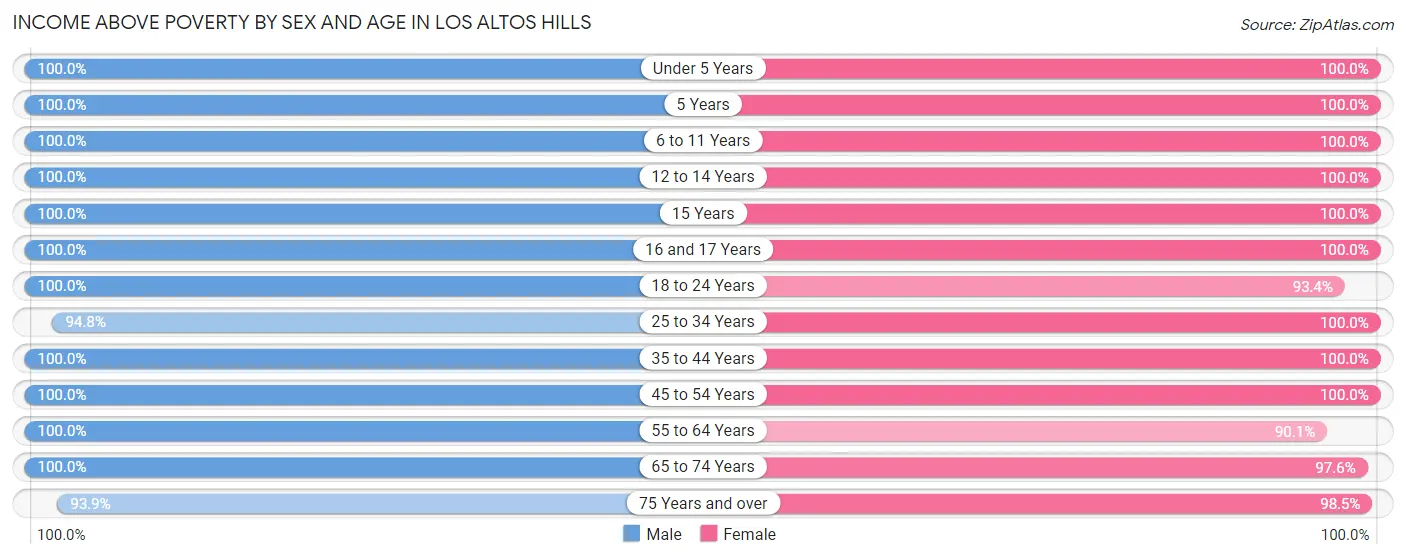
| Age Bracket | Male | Female |
| Under 5 Years | 148 (100.0%) | 189 (100.0%) |
| 5 Years | 8 (100.0%) | 36 (100.0%) |
| 6 to 11 Years | 252 (100.0%) | 204 (100.0%) |
| 12 to 14 Years | 131 (100.0%) | 205 (100.0%) |
| 15 Years | 47 (100.0%) | 72 (100.0%) |
| 16 and 17 Years | 93 (100.0%) | 225 (100.0%) |
| 18 to 24 Years | 204 (100.0%) | 267 (93.4%) |
| 25 to 34 Years | 183 (94.8%) | 332 (100.0%) |
| 35 to 44 Years | 225 (100.0%) | 295 (100.0%) |
| 45 to 54 Years | 721 (100.0%) | 610 (100.0%) |
| 55 to 64 Years | 532 (100.0%) | 670 (90.0%) |
| 65 to 74 Years | 641 (100.0%) | 803 (97.6%) |
| 75 Years and over | 603 (93.9%) | 574 (98.5%) |
| Total | 3,788 (98.7%) | 4,482 (97.4%) |
Income Below Poverty Among Married-Couple Families in Los Altos Hills
The poverty statistics for married-couple families in Los Altos Hills show that 1.4% or 30 of the total 2,170 families live below the poverty line. Families with no children have the highest poverty rate of 2.0%, comprising of 30 families. On the other hand, families with 1 or 2 children have the lowest poverty rate of 0.0%, which includes 0 families.
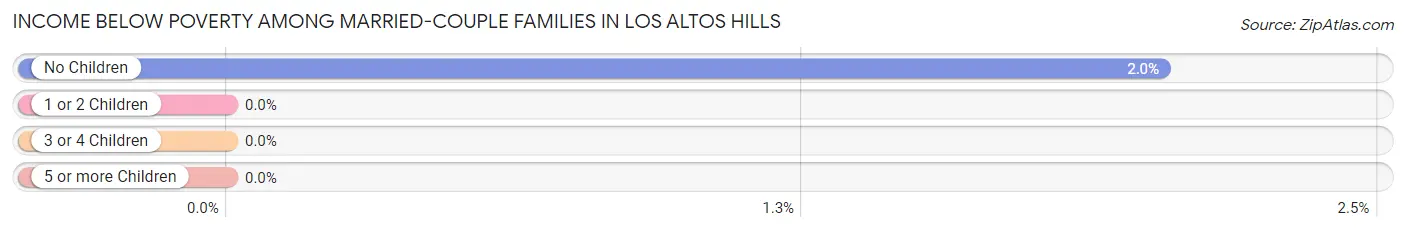
| Children | Above Poverty | Below Poverty |
| No Children | 1,448 (98.0%) | 30 (2.0%) |
| 1 or 2 Children | 504 (100.0%) | 0 (0.0%) |
| 3 or 4 Children | 188 (100.0%) | 0 (0.0%) |
| 5 or more Children | 0 (0.0%) | 0 (0.0%) |
| Total | 2,140 (98.6%) | 30 (1.4%) |
Income Below Poverty Among Single-Parent Households in Los Altos Hills
| Children | Single Father | Single Mother |
| No Children | 0 (0.0%) | 0 (0.0%) |
| 1 or 2 Children | 0 (0.0%) | 0 (0.0%) |
| 3 or 4 Children | 0 (0.0%) | 0 (0.0%) |
| 5 or more Children | 0 (0.0%) | 0 (0.0%) |
| Total | 0 (0.0%) | 0 (0.0%) |
Income Below Poverty Among Married-Couple vs Single-Parent Households in Los Altos Hills
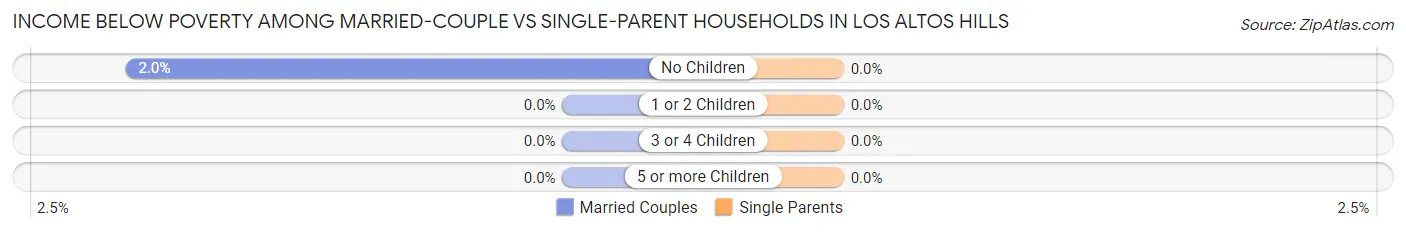
| Children | Married-Couple Families | Single-Parent Households |
| No Children | 30 (2.0%) | 0 (0.0%) |
| 1 or 2 Children | 0 (0.0%) | 0 (0.0%) |
| 3 or 4 Children | 0 (0.0%) | 0 (0.0%) |
| 5 or more Children | 0 (0.0%) | 0 (0.0%) |
| Total | 30 (1.4%) | 0 (0.0%) |
Race in Los Altos Hills
The most populous races in Los Altos Hills are White / Caucasian (4,699 | 55.7%), Asian (3,201 | 37.9%), and Hispanic or Latino (504 | 6.0%).
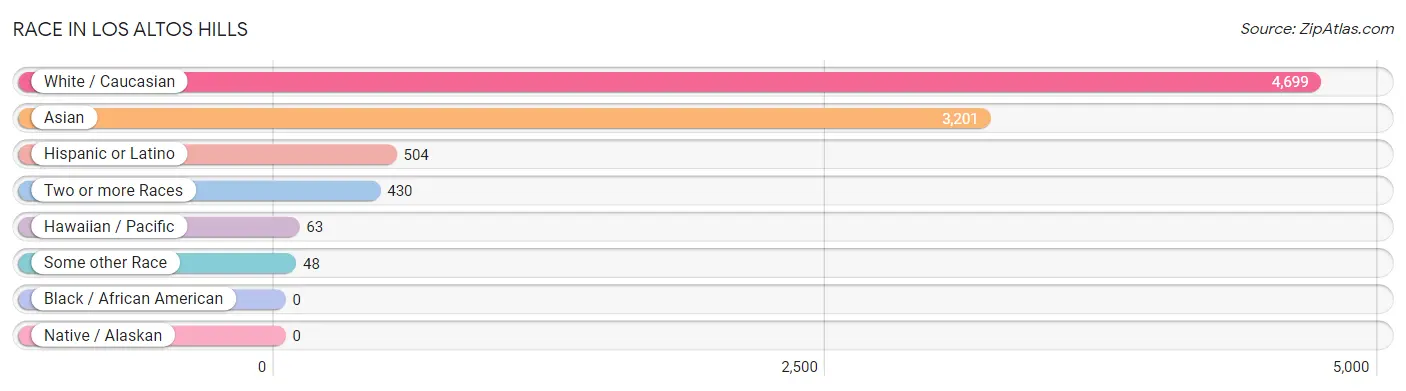
| Race | # Population | % Population |
| Asian | 3,201 | 37.9% |
| Black / African American | 0 | 0.0% |
| Hawaiian / Pacific | 63 | 0.7% |
| Hispanic or Latino | 504 | 6.0% |
| Native / Alaskan | 0 | 0.0% |
| White / Caucasian | 4,699 | 55.7% |
| Two or more Races | 430 | 5.1% |
| Some other Race | 48 | 0.6% |
| Total | 8,441 | 100.0% |
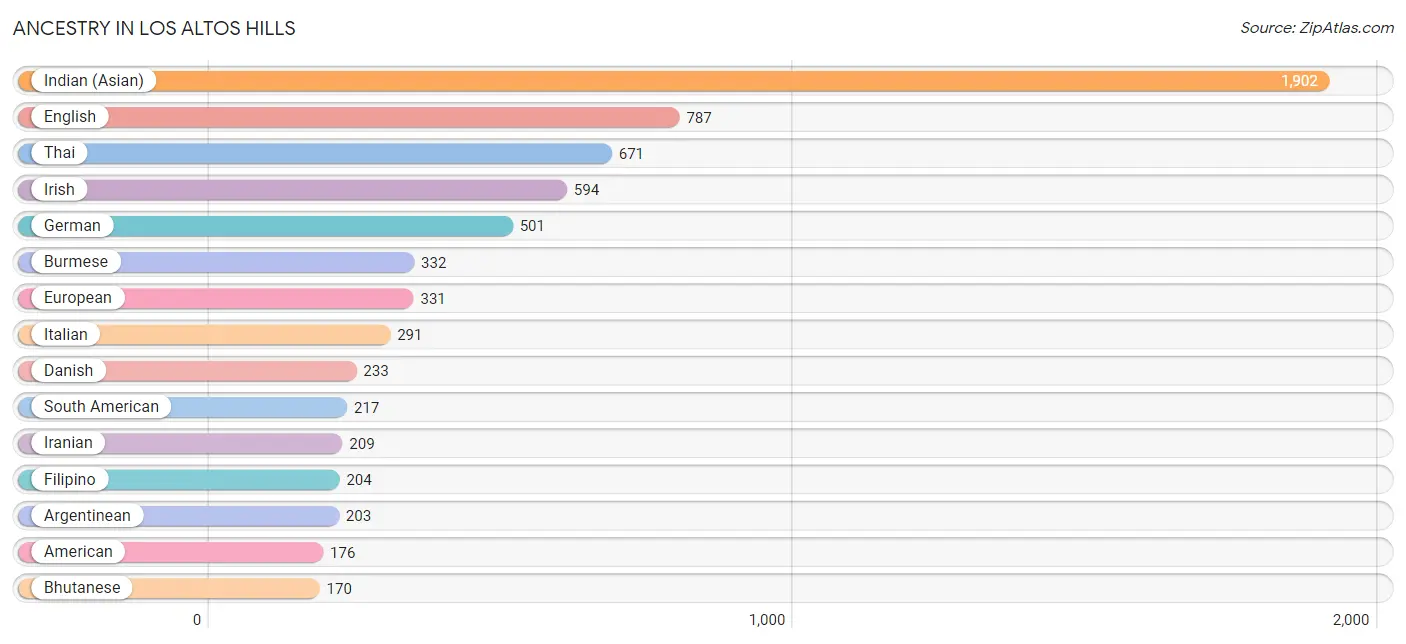
Ancestry in Los Altos Hills
The most populous ancestries reported in Los Altos Hills are Indian (Asian) (1,902 | 22.5%), English (787 | 9.3%), Thai (671 | 8.0%), Irish (594 | 7.0%), and German (501 | 5.9%), together accounting for 52.8% of all Los Altos Hills residents.
| Ancestry | # Population | % Population |
| American | 176 | 2.1% |
| Apache | 24 | 0.3% |
| Arab | 63 | 0.7% |
| Argentinean | 203 | 2.4% |
| Australian | 13 | 0.2% |
| Austrian | 20 | 0.2% |
| Basque | 16 | 0.2% |
| Belgian | 10 | 0.1% |
| Bhutanese | 170 | 2.0% |
| British | 95 | 1.1% |
| Burmese | 332 | 3.9% |
| Canadian | 20 | 0.2% |
| Central American | 11 | 0.1% |
| Cherokee | 19 | 0.2% |
| Cuban | 12 | 0.1% |
| Czech | 10 | 0.1% |
| Czechoslovakian | 9 | 0.1% |
| Danish | 233 | 2.8% |
| Dominican | 86 | 1.0% |
| Dutch | 49 | 0.6% |
| Eastern European | 21 | 0.3% |
| English | 787 | 9.3% |
| Estonian | 15 | 0.2% |
| European | 331 | 3.9% |
| Filipino | 204 | 2.4% |
| French | 153 | 1.8% |
| French Canadian | 10 | 0.1% |
| German | 501 | 5.9% |
| Greek | 10 | 0.1% |
| Hungarian | 113 | 1.3% |
| Indian (Asian) | 1,902 | 22.5% |
| Iranian | 209 | 2.5% |
| Irish | 594 | 7.0% |
| Israeli | 19 | 0.2% |
| Italian | 291 | 3.5% |
| Korean | 128 | 1.5% |
| Laotian | 9 | 0.1% |
| Lithuanian | 10 | 0.1% |
| Mexican | 131 | 1.5% |
| Nicaraguan | 11 | 0.1% |
| Northern European | 43 | 0.5% |
| Norwegian | 99 | 1.2% |
| Okinawan | 8 | 0.1% |
| Pakistani | 24 | 0.3% |
| Palestinian | 31 | 0.4% |
| Peruvian | 14 | 0.2% |
| Polish | 84 | 1.0% |
| Portuguese | 110 | 1.3% |
| Romanian | 79 | 0.9% |
| Russian | 159 | 1.9% |
| Scotch-Irish | 75 | 0.9% |
| Scottish | 150 | 1.8% |
| South African | 8 | 0.1% |
| South American | 217 | 2.6% |
| Spanish | 47 | 0.6% |
| Sri Lankan | 47 | 0.6% |
| Subsaharan African | 8 | 0.1% |
| Swedish | 146 | 1.7% |
| Swiss | 28 | 0.3% |
| Thai | 671 | 8.0% |
| Ukrainian | 21 | 0.3% |
| Welsh | 27 | 0.3% |
| Yugoslavian | 49 | 0.6% | View All 63 Rows |
Immigrants in Los Altos Hills
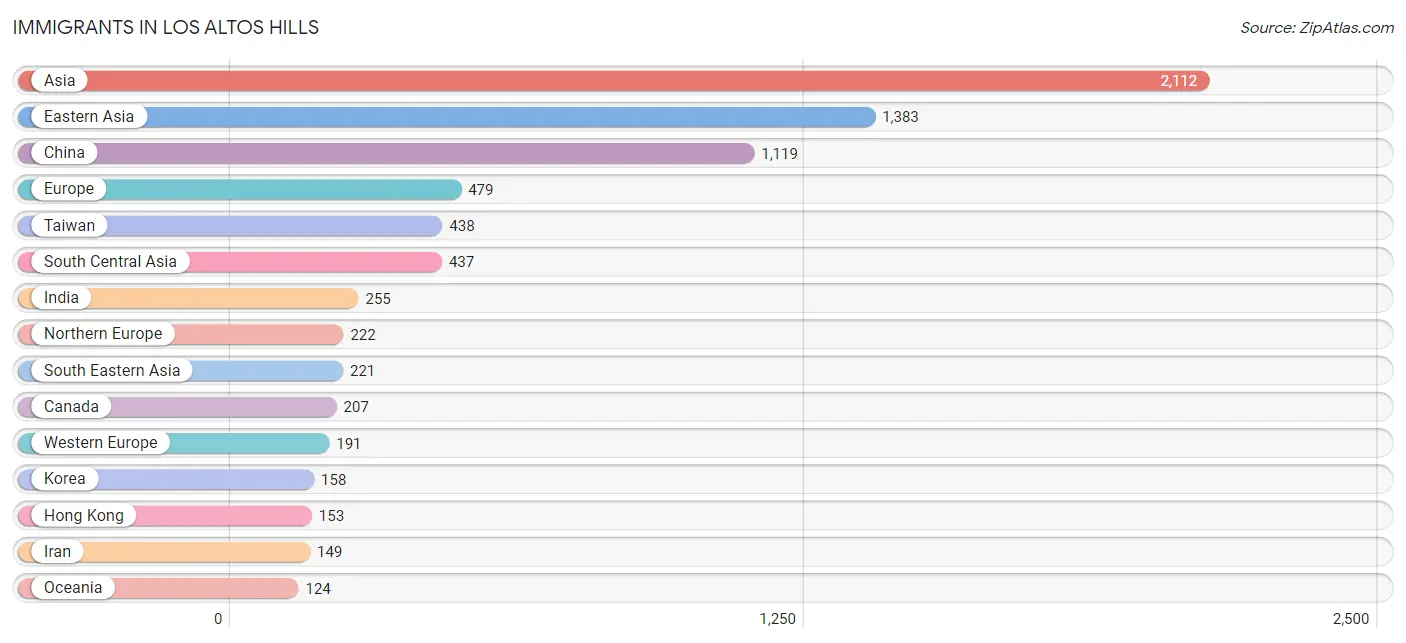
The most numerous immigrant groups reported in Los Altos Hills came from Asia (2,112 | 25.0%), Eastern Asia (1,383 | 16.4%), China (1,119 | 13.3%), Europe (479 | 5.7%), and Taiwan (438 | 5.2%), together accounting for 65.5% of all Los Altos Hills residents.
| Immigration Origin | # Population | % Population |
| Africa | 35 | 0.4% |
| Argentina | 29 | 0.3% |
| Asia | 2,112 | 25.0% |
| Australia | 32 | 0.4% |
| Austria | 32 | 0.4% |
| Belgium | 10 | 0.1% |
| Canada | 207 | 2.5% |
| Caribbean | 29 | 0.3% |
| Central America | 13 | 0.2% |
| China | 1,119 | 13.3% |
| Cuba | 12 | 0.1% |
| Denmark | 106 | 1.3% |
| Eastern Africa | 15 | 0.2% |
| Eastern Asia | 1,383 | 16.4% |
| Eastern Europe | 54 | 0.6% |
| England | 21 | 0.3% |
| Europe | 479 | 5.7% |
| Fiji | 63 | 0.7% |
| France | 88 | 1.0% |
| Germany | 53 | 0.6% |
| Hong Kong | 153 | 1.8% |
| Hungary | 8 | 0.1% |
| India | 255 | 3.0% |
| Indonesia | 9 | 0.1% |
| Iran | 149 | 1.8% |
| Israel | 40 | 0.5% |
| Italy | 12 | 0.1% |
| Japan | 106 | 1.3% |
| Kazakhstan | 11 | 0.1% |
| Kenya | 15 | 0.2% |
| Korea | 158 | 1.9% |
| Latin America | 85 | 1.0% |
| Northern Europe | 222 | 2.6% |
| Norway | 19 | 0.2% |
| Oceania | 124 | 1.5% |
| Pakistan | 22 | 0.3% |
| Panama | 13 | 0.2% |
| Peru | 14 | 0.2% |
| Philippines | 79 | 0.9% |
| Romania | 13 | 0.2% |
| Russia | 22 | 0.3% |
| Scotland | 13 | 0.2% |
| Singapore | 20 | 0.2% |
| South Africa | 8 | 0.1% |
| South America | 43 | 0.5% |
| South Central Asia | 437 | 5.2% |
| South Eastern Asia | 221 | 2.6% |
| Southern Europe | 12 | 0.1% |
| Switzerland | 8 | 0.1% |
| Taiwan | 438 | 5.2% |
| Thailand | 31 | 0.4% |
| Trinidad and Tobago | 17 | 0.2% |
| Ukraine | 11 | 0.1% |
| Vietnam | 52 | 0.6% |
| Western Asia | 40 | 0.5% |
| Western Europe | 191 | 2.3% | View All 56 Rows |
Sex and Age in Los Altos Hills
Sex and Age in Los Altos Hills
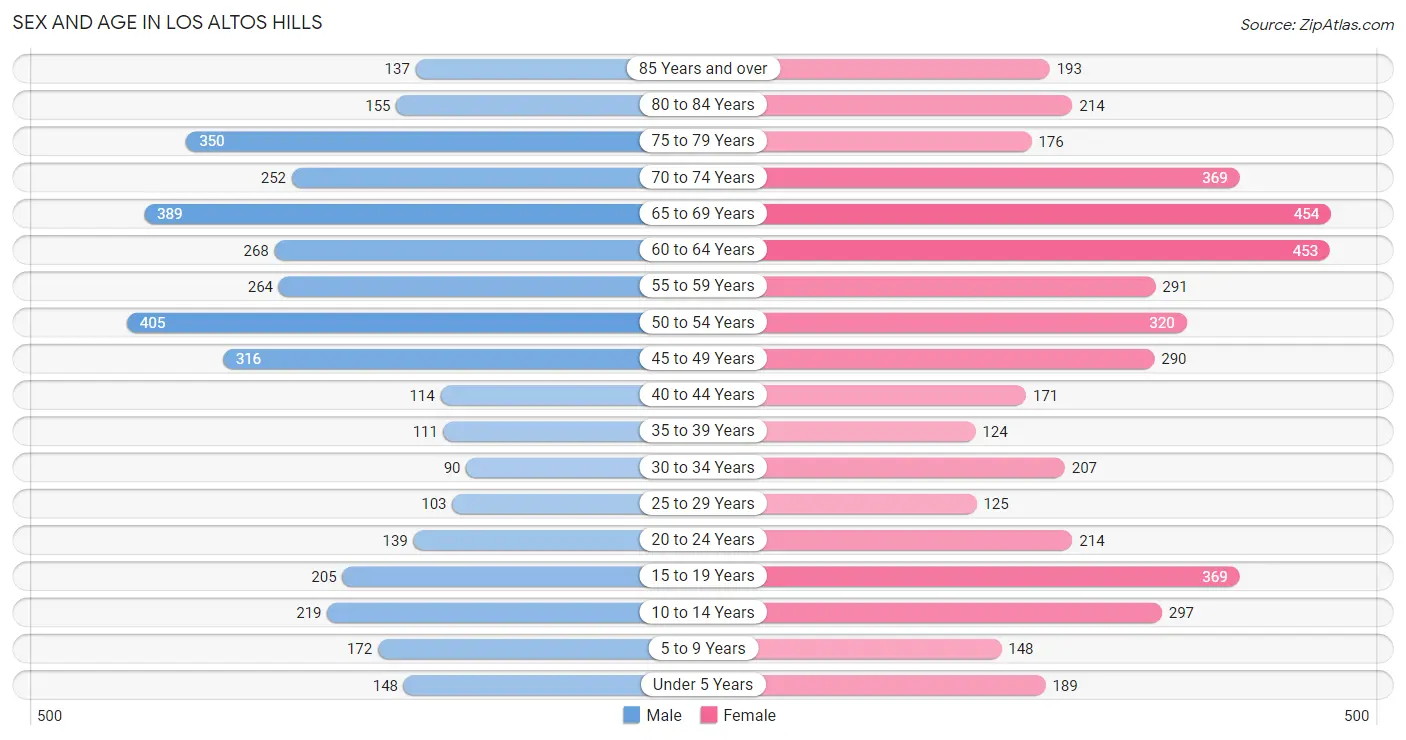
The most populous age groups in Los Altos Hills are 50 to 54 Years (405 | 10.6%) for men and 65 to 69 Years (454 | 9.9%) for women.
| Age Bracket | Male | Female |
| Under 5 Years | 148 (3.9%) | 189 (4.1%) |
| 5 to 9 Years | 172 (4.5%) | 148 (3.2%) |
| 10 to 14 Years | 219 (5.7%) | 297 (6.5%) |
| 15 to 19 Years | 205 (5.3%) | 369 (8.0%) |
| 20 to 24 Years | 139 (3.6%) | 214 (4.6%) |
| 25 to 29 Years | 103 (2.7%) | 125 (2.7%) |
| 30 to 34 Years | 90 (2.4%) | 207 (4.5%) |
| 35 to 39 Years | 111 (2.9%) | 124 (2.7%) |
| 40 to 44 Years | 114 (3.0%) | 171 (3.7%) |
| 45 to 49 Years | 316 (8.2%) | 290 (6.3%) |
| 50 to 54 Years | 405 (10.6%) | 320 (7.0%) |
| 55 to 59 Years | 264 (6.9%) | 291 (6.3%) |
| 60 to 64 Years | 268 (7.0%) | 453 (9.8%) |
| 65 to 69 Years | 389 (10.1%) | 454 (9.9%) |
| 70 to 74 Years | 252 (6.6%) | 369 (8.0%) |
| 75 to 79 Years | 350 (9.1%) | 176 (3.8%) |
| 80 to 84 Years | 155 (4.0%) | 214 (4.6%) |
| 85 Years and over | 137 (3.6%) | 193 (4.2%) |
| Total | 3,837 (100.0%) | 4,604 (100.0%) |
Families and Households in Los Altos Hills
Median Family Size in Los Altos Hills
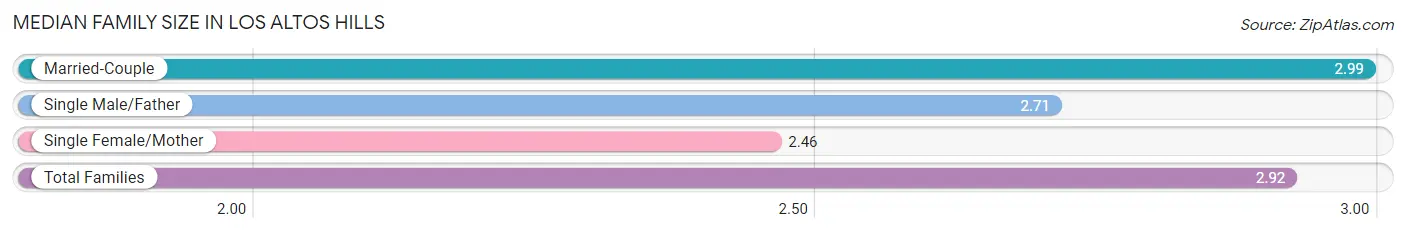
The median family size in Los Altos Hills is 2.92 persons per family, with married-couple families (2,170 | 82.8%) accounting for the largest median family size of 2.99 persons per family. On the other hand, single female/mother families (265 | 10.1%) represent the smallest median family size with 2.46 persons per family.
| Family Type | # Families | Family Size |
| Married-Couple | 2,170 (82.8%) | 2.99 |
| Single Male/Father | 185 (7.1%) | 2.71 |
| Single Female/Mother | 265 (10.1%) | 2.46 |
| Total Families | 2,620 (100.0%) | 2.92 |
Median Household Size in Los Altos Hills
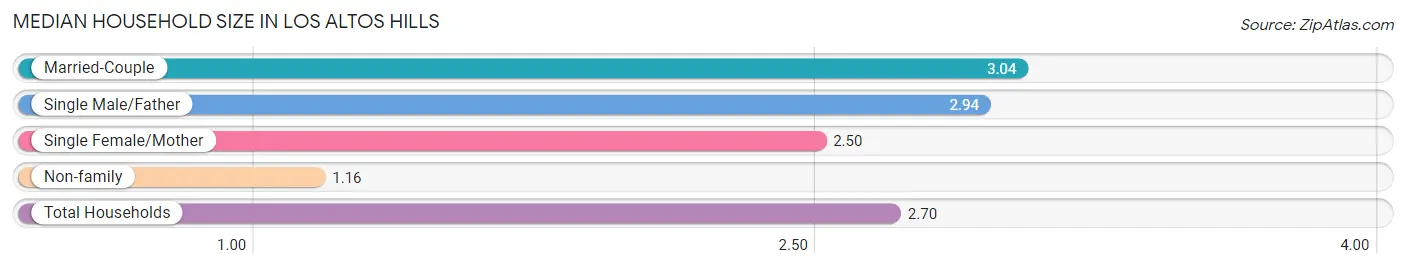
The median household size in Los Altos Hills is 2.70 persons per household, with married-couple households (2,170 | 70.4%) accounting for the largest median household size of 3.04 persons per household. non-family households (464 | 15.0%) represent the smallest median household size with 1.16 persons per household.
| Household Type | # Households | Household Size |
| Married-Couple | 2,170 (70.4%) | 3.04 |
| Single Male/Father | 185 (6.0%) | 2.94 |
| Single Female/Mother | 265 (8.6%) | 2.50 |
| Non-family | 464 (15.0%) | 1.16 |
| Total Households | 3,084 (100.0%) | 2.70 |
Household Size by Marriage Status in Los Altos Hills
Out of a total of 3,084 households in Los Altos Hills, 2,620 (85.0%) are family households, while 464 (15.0%) are nonfamily households. The most numerous type of family households are 2-person households, comprising 1,429, and the most common type of nonfamily households are 1-person households, comprising 388.
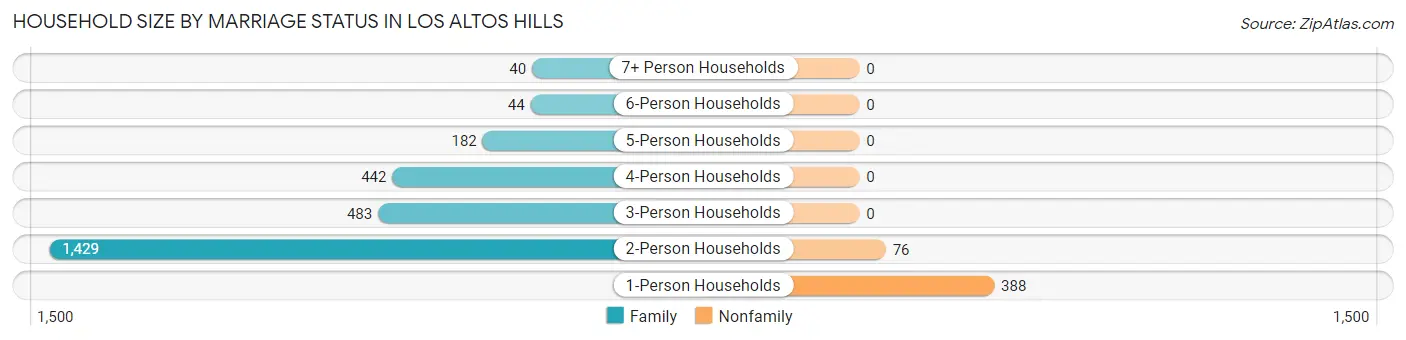
| Household Size | Family Households | Nonfamily Households |
| 1-Person Households | - | 388 (12.6%) |
| 2-Person Households | 1,429 (46.3%) | 76 (2.5%) |
| 3-Person Households | 483 (15.7%) | 0 (0.0%) |
| 4-Person Households | 442 (14.3%) | 0 (0.0%) |
| 5-Person Households | 182 (5.9%) | 0 (0.0%) |
| 6-Person Households | 44 (1.4%) | 0 (0.0%) |
| 7+ Person Households | 40 (1.3%) | 0 (0.0%) |
| Total | 2,620 (85.0%) | 464 (15.0%) |
Female Fertility in Los Altos Hills
Fertility by Age in Los Altos Hills
Average fertility rate in Los Altos Hills is 38.0 births per 1,000 women. Women in the age bracket of 35 to 50 years have the highest fertility rate with 60.0 births per 1,000 women. Women in the age bracket of 35 to 50 years acount for 65.0% of all women with births.
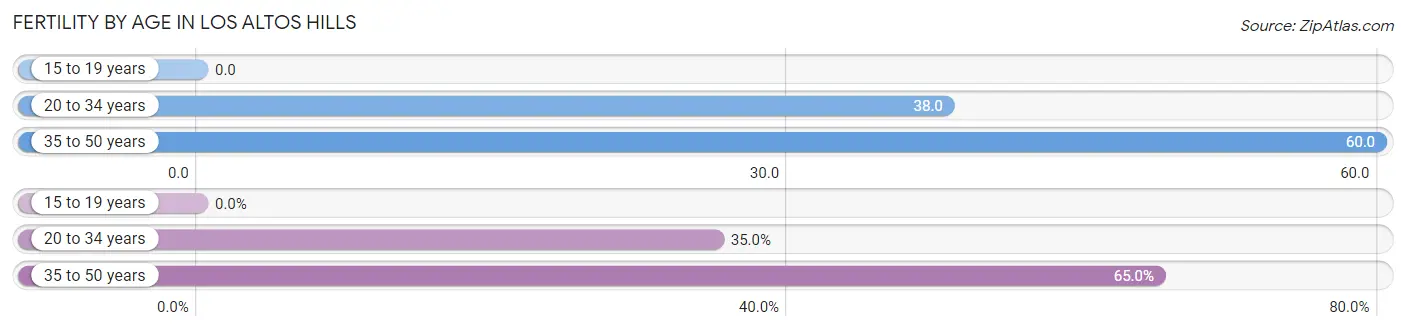
| Age Bracket | Women with Births | Births / 1,000 Women |
| 15 to 19 years | 0 (0.0%) | 0.0 |
| 20 to 34 years | 21 (35.0%) | 38.0 |
| 35 to 50 years | 39 (65.0%) | 60.0 |
| Total | 60 (100.0%) | 38.0 |
Fertility by Age by Marriage Status in Los Altos Hills
78.3% of women with births (60) in Los Altos Hills are married. The highest percentage of unmarried women with births falls into 35 to 50 years age bracket with 33.3% of them unmarried at the time of birth, while the lowest percentage of unmarried women with births belong to 20 to 34 years age bracket with 0.0% of them unmarried.
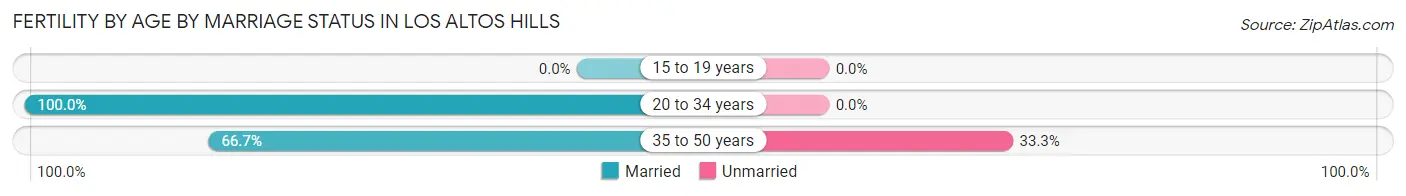
| Age Bracket | Married | Unmarried |
| 15 to 19 years | 0 (0.0%) | 0 (0.0%) |
| 20 to 34 years | 21 (100.0%) | 0 (0.0%) |
| 35 to 50 years | 26 (66.7%) | 13 (33.3%) |
| Total | 47 (78.3%) | 13 (21.7%) |
Fertility by Education in Los Altos Hills
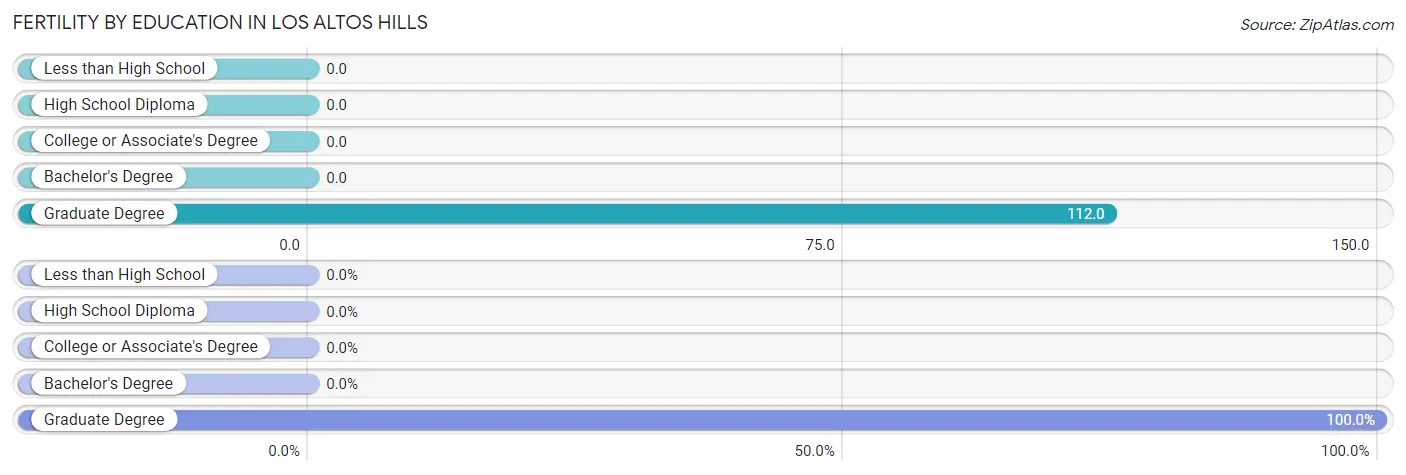
| Educational Attainment | Women with Births | Births / 1,000 Women |
| Less than High School | 0 (0.0%) | 0.0 |
| High School Diploma | 0 (0.0%) | 0.0 |
| College or Associate's Degree | 0 (0.0%) | 0.0 |
| Bachelor's Degree | 0 (0.0%) | 0.0 |
| Graduate Degree | 60 (100.0%) | 112.0 |
| Total | 60 (100.0%) | 38.0 |
Fertility by Education by Marriage Status in Los Altos Hills
21.7% of women with births in Los Altos Hills are unmarried. Women with the educational attainment of graduate degree are most likely to be married with 78.3% of them married at childbirth, while women with the educational attainment of graduate degree are least likely to be married with 21.7% of them unmarried at childbirth.
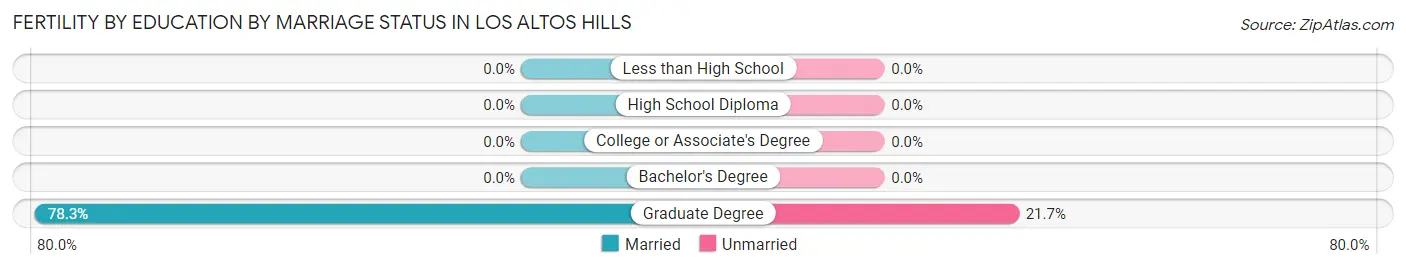
| Educational Attainment | Married | Unmarried |
| Less than High School | 0 (0.0%) | 0 (0.0%) |
| High School Diploma | 0 (0.0%) | 0 (0.0%) |
| College or Associate's Degree | 0 (0.0%) | 0 (0.0%) |
| Bachelor's Degree | 0 (0.0%) | 0 (0.0%) |
| Graduate Degree | 47 (78.3%) | 13 (21.7%) |
| Total | 47 (78.3%) | 13 (21.7%) |
Employment Characteristics in Los Altos Hills
Employment by Class of Employer in Los Altos Hills
Among the 3,677 employed individuals in Los Altos Hills, private company employees (2,597 | 70.6%), self-employed (not incorporated) (400 | 10.9%), and not-for-profit organizations (276 | 7.5%) make up the most common classes of employment.
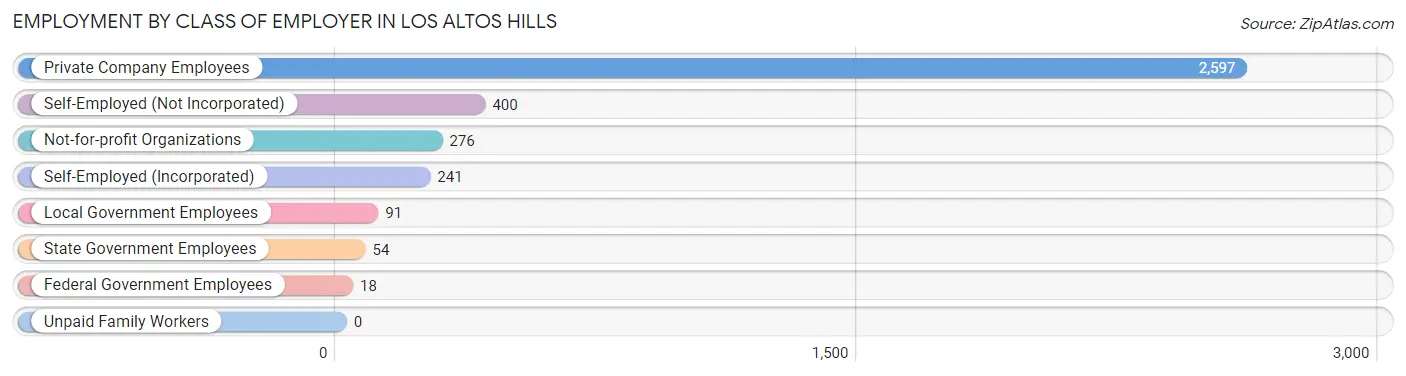
| Employer Class | # Employees | % Employees |
| Private Company Employees | 2,597 | 70.6% |
| Self-Employed (Incorporated) | 241 | 6.6% |
| Self-Employed (Not Incorporated) | 400 | 10.9% |
| Not-for-profit Organizations | 276 | 7.5% |
| Local Government Employees | 91 | 2.5% |
| State Government Employees | 54 | 1.5% |
| Federal Government Employees | 18 | 0.5% |
| Unpaid Family Workers | 0 | 0.0% |
| Total | 3,677 | 100.0% |
Employment Status by Age in Los Altos Hills
According to the labor force statistics for Los Altos Hills, out of the total population over 16 years of age (7,149), 53.8% or 3,846 individuals are in the labor force, with 2.8% or 108 of them unemployed. The age group with the highest labor force participation rate is 30 to 34 years, with 91.6% or 272 individuals in the labor force. Within the labor force, the 16 to 19 years age range has the highest percentage of unemployed individuals, with 16.7% or 13 of them being unemployed.
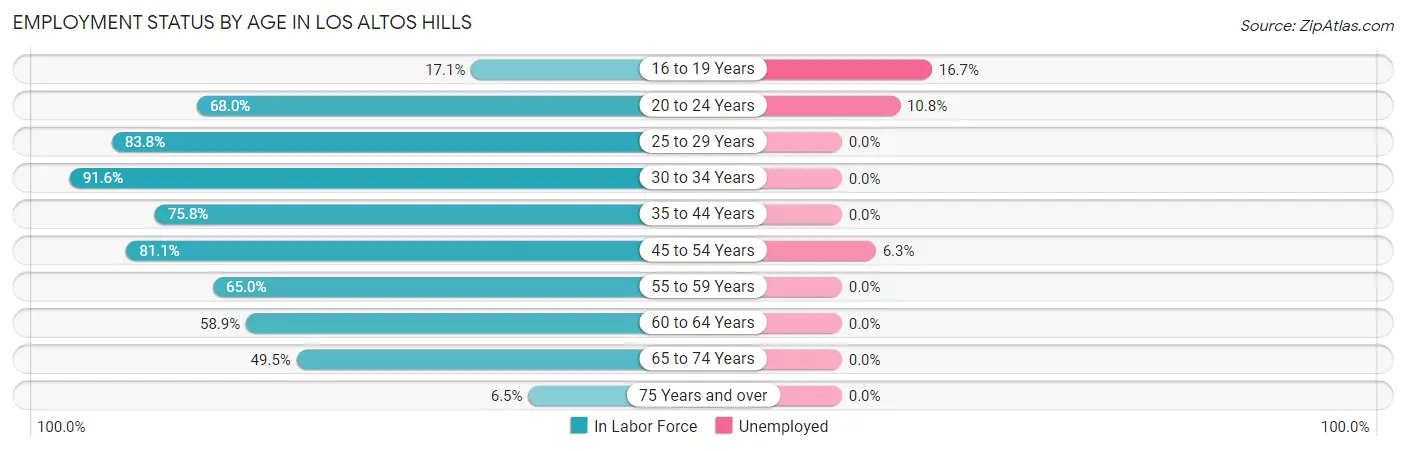
| Age Bracket | In Labor Force | Unemployed |
| 16 to 19 Years | 78 (17.1%) | 13 (16.7%) |
| 20 to 24 Years | 240 (68.0%) | 26 (10.8%) |
| 25 to 29 Years | 191 (83.8%) | 0 (0.0%) |
| 30 to 34 Years | 272 (91.6%) | 0 (0.0%) |
| 35 to 44 Years | 394 (75.8%) | 0 (0.0%) |
| 45 to 54 Years | 1,079 (81.1%) | 68 (6.3%) |
| 55 to 59 Years | 361 (65.0%) | 0 (0.0%) |
| 60 to 64 Years | 425 (58.9%) | 0 (0.0%) |
| 65 to 74 Years | 725 (49.5%) | 0 (0.0%) |
| 75 Years and over | 80 (6.5%) | 0 (0.0%) |
| Total | 3,846 (53.8%) | 108 (2.8%) |
Employment Status by Educational Attainment in Los Altos Hills
According to labor force statistics for Los Altos Hills, 74.6% of individuals (2,724) out of the total population between 25 and 64 years of age (3,652) are in the labor force, with 2.5% or 68 of them being unemployed. The group with the highest labor force participation rate are those with the educational attainment of bachelor's degree or higher, with 77.7% or 2,486 individuals in the labor force. Within the labor force, individuals with bachelor's degree or higher education have the highest percentage of unemployment, with 2.7% or 67 of them being unemployed.
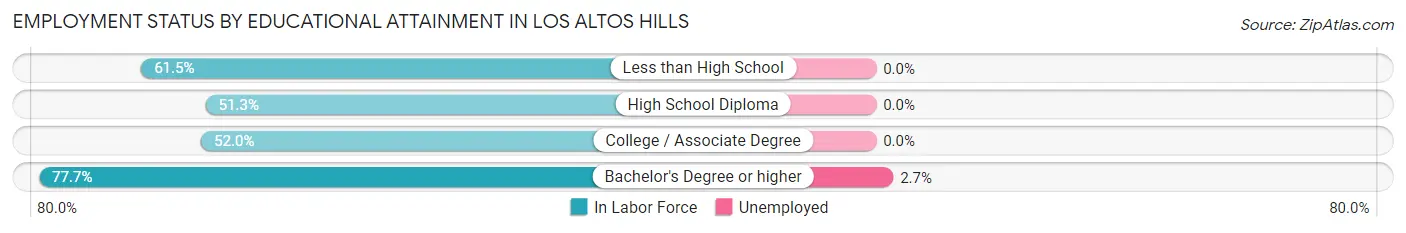
| Educational Attainment | In Labor Force | Unemployed |
| Less than High School | 24 (61.5%) | 0 (0.0%) |
| High School Diploma | 61 (51.3%) | 0 (0.0%) |
| College / Associate Degree | 153 (52.0%) | 0 (0.0%) |
| Bachelor's Degree or higher | 2,486 (77.7%) | 86 (2.7%) |
| Total | 2,724 (74.6%) | 91 (2.5%) |
Employment Occupations by Sex in Los Altos Hills
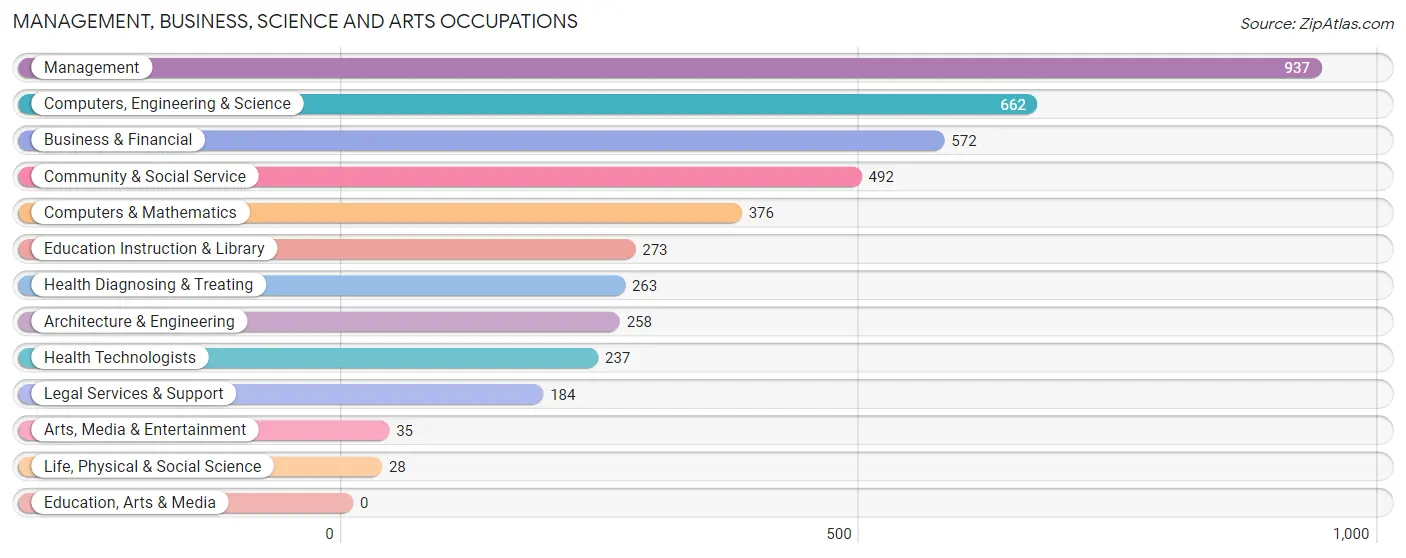
Management, Business, Science and Arts Occupations
The most common Management, Business, Science and Arts occupations in Los Altos Hills are Management (937 | 25.1%), Computers, Engineering & Science (662 | 17.7%), Business & Financial (572 | 15.3%), Community & Social Service (492 | 13.2%), and Computers & Mathematics (376 | 10.1%).
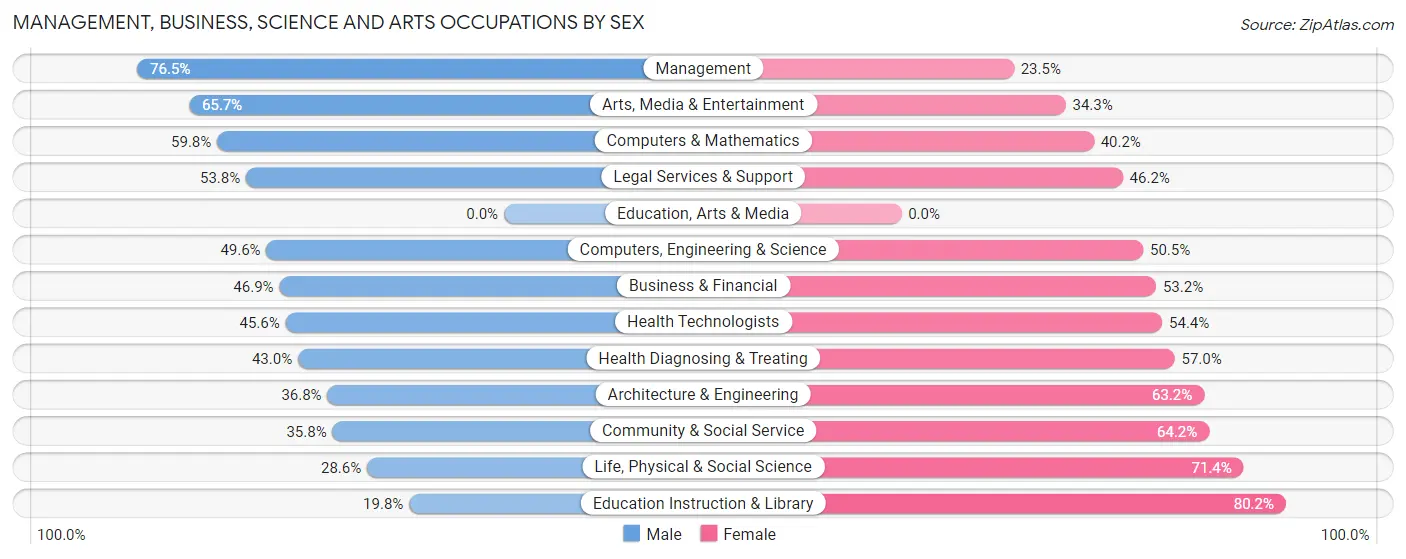
Management, Business, Science and Arts Occupations by Sex
Within the Management, Business, Science and Arts occupations in Los Altos Hills, the most male-oriented occupations are Management (76.5%), Arts, Media & Entertainment (65.7%), and Computers & Mathematics (59.8%), while the most female-oriented occupations are Education Instruction & Library (80.2%), Life, Physical & Social Science (71.4%), and Community & Social Service (64.2%).
| Occupation | Male | Female |
| Management | 717 (76.5%) | 220 (23.5%) |
| Business & Financial | 268 (46.9%) | 304 (53.1%) |
| Computers, Engineering & Science | 328 (49.5%) | 334 (50.4%) |
| Computers & Mathematics | 225 (59.8%) | 151 (40.2%) |
| Architecture & Engineering | 95 (36.8%) | 163 (63.2%) |
| Life, Physical & Social Science | 8 (28.6%) | 20 (71.4%) |
| Community & Social Service | 176 (35.8%) | 316 (64.2%) |
| Education, Arts & Media | 0 (0.0%) | 0 (0.0%) |
| Legal Services & Support | 99 (53.8%) | 85 (46.2%) |
| Education Instruction & Library | 54 (19.8%) | 219 (80.2%) |
| Arts, Media & Entertainment | 23 (65.7%) | 12 (34.3%) |
| Health Diagnosing & Treating | 113 (43.0%) | 150 (57.0%) |
| Health Technologists | 108 (45.6%) | 129 (54.4%) |
| Total (Category) | 1,602 (54.7%) | 1,324 (45.3%) |
| Total (Overall) | 1,909 (51.1%) | 1,829 (48.9%) |
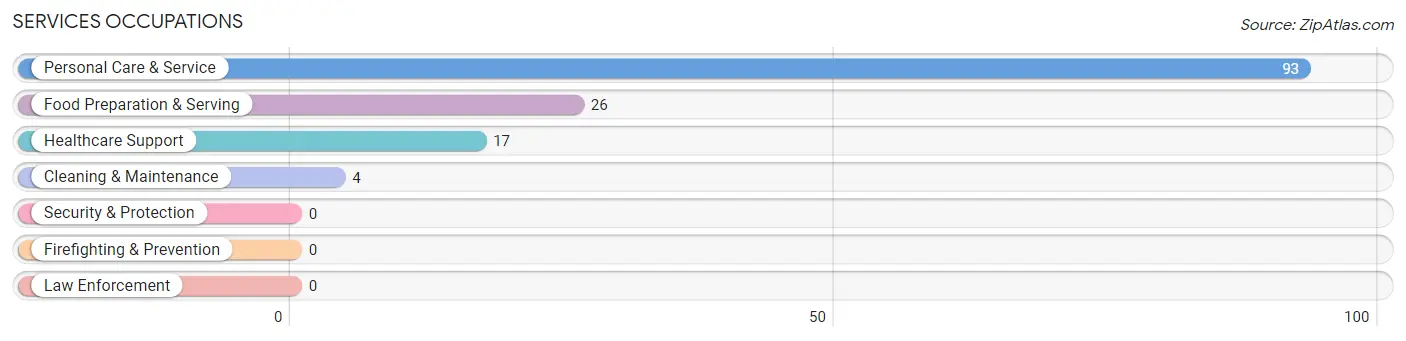
Services Occupations
The most common Services occupations in Los Altos Hills are Personal Care & Service (93 | 2.5%), Food Preparation & Serving (26 | 0.7%), Healthcare Support (17 | 0.4%), and Cleaning & Maintenance (4 | 0.1%).
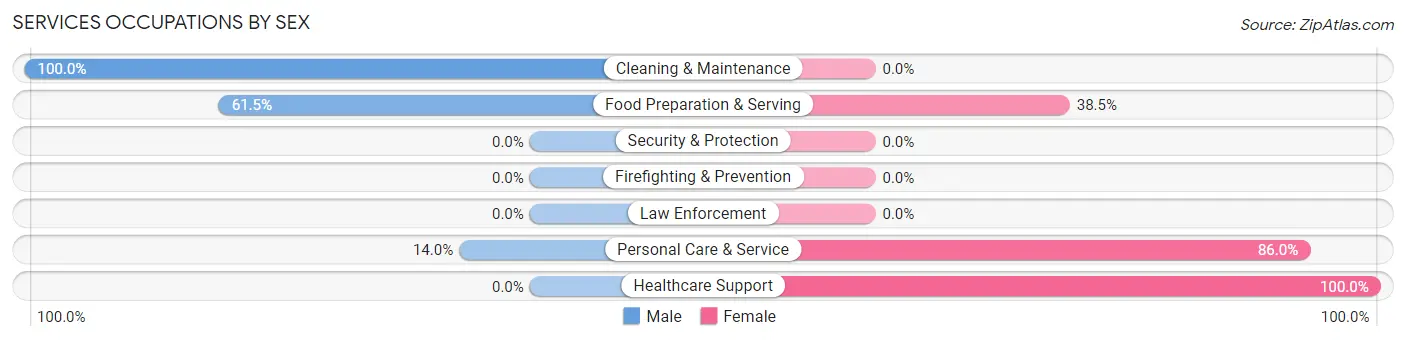
Services Occupations by Sex
Within the Services occupations in Los Altos Hills, the most male-oriented occupations are Cleaning & Maintenance (100.0%), Food Preparation & Serving (61.5%), and Personal Care & Service (14.0%), while the most female-oriented occupations are Healthcare Support (100.0%), Personal Care & Service (86.0%), and Food Preparation & Serving (38.5%).
| Occupation | Male | Female |
| Healthcare Support | 0 (0.0%) | 17 (100.0%) |
| Security & Protection | 0 (0.0%) | 0 (0.0%) |
| Firefighting & Prevention | 0 (0.0%) | 0 (0.0%) |
| Law Enforcement | 0 (0.0%) | 0 (0.0%) |
| Food Preparation & Serving | 16 (61.5%) | 10 (38.5%) |
| Cleaning & Maintenance | 4 (100.0%) | 0 (0.0%) |
| Personal Care & Service | 13 (14.0%) | 80 (86.0%) |
| Total (Category) | 33 (23.6%) | 107 (76.4%) |
| Total (Overall) | 1,909 (51.1%) | 1,829 (48.9%) |
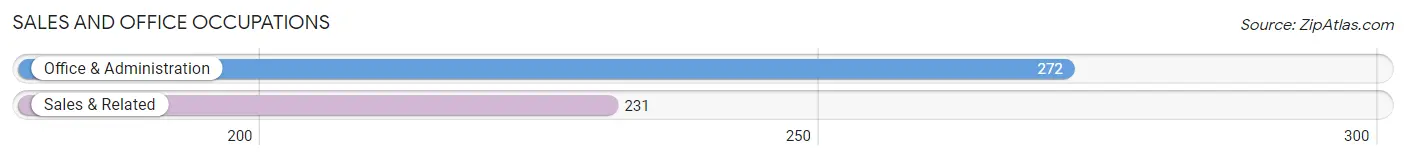
Sales and Office Occupations
The most common Sales and Office occupations in Los Altos Hills are Office & Administration (272 | 7.3%), and Sales & Related (231 | 6.2%).
Sales and Office Occupations by Sex
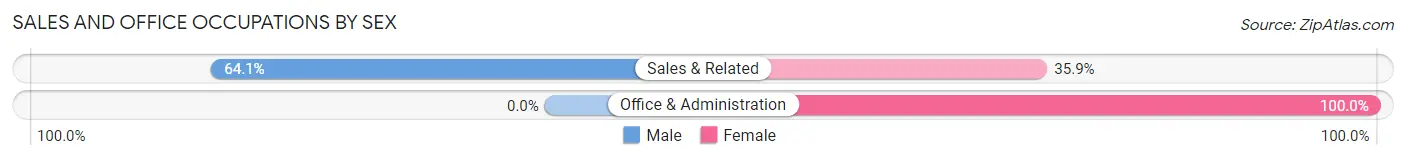
| Occupation | Male | Female |
| Sales & Related | 148 (64.1%) | 83 (35.9%) |
| Office & Administration | 0 (0.0%) | 272 (100.0%) |
| Total (Category) | 148 (29.4%) | 355 (70.6%) |
| Total (Overall) | 1,909 (51.1%) | 1,829 (48.9%) |
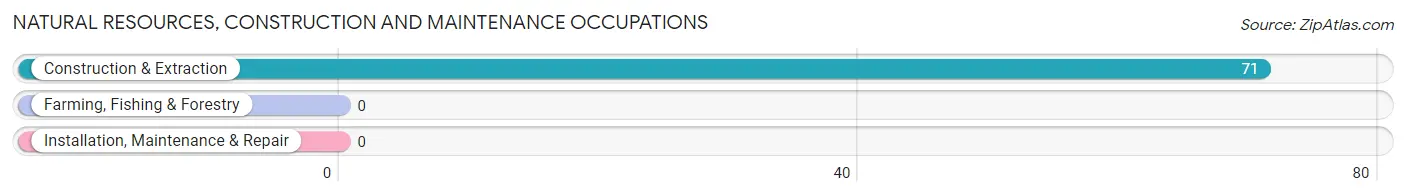
Natural Resources, Construction and Maintenance Occupations
The most common Natural Resources, Construction and Maintenance occupations in Los Altos Hills are , and Construction & Extraction (71 | 1.9%).
Natural Resources, Construction and Maintenance Occupations by Sex
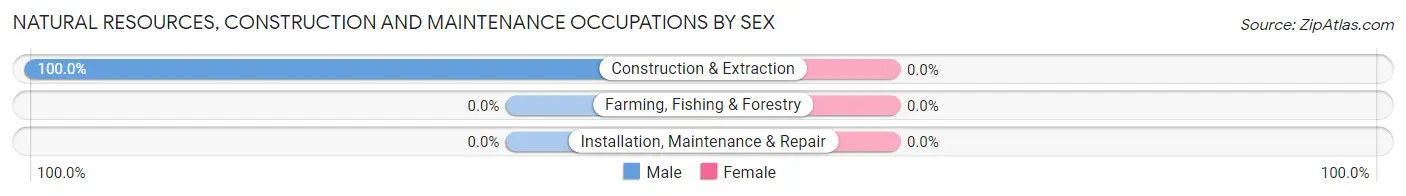
| Occupation | Male | Female |
| Farming, Fishing & Forestry | 0 (0.0%) | 0 (0.0%) |
| Construction & Extraction | 71 (100.0%) | 0 (0.0%) |
| Installation, Maintenance & Repair | 0 (0.0%) | 0 (0.0%) |
| Total (Category) | 71 (100.0%) | 0 (0.0%) |
| Total (Overall) | 1,909 (51.1%) | 1,829 (48.9%) |
Production, Transportation and Moving Occupations
The most common Production, Transportation and Moving occupations in Los Altos Hills are Transportation (88 | 2.4%), and Production (10 | 0.3%).
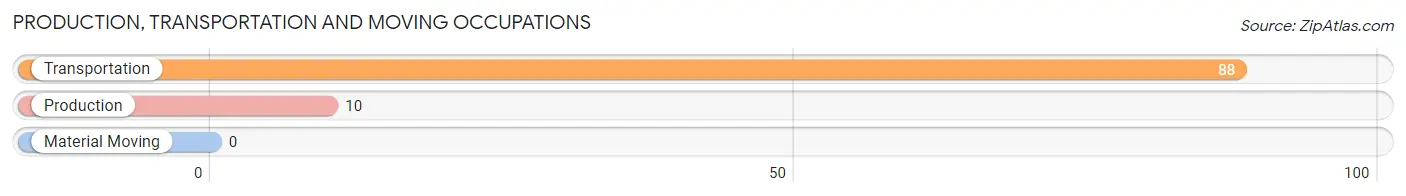
Production, Transportation and Moving Occupations by Sex
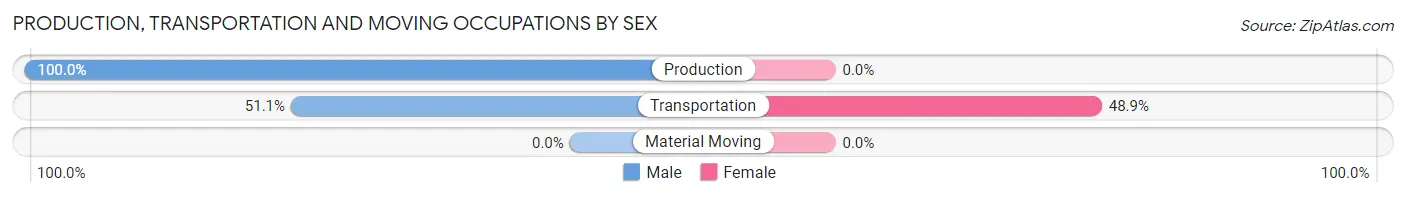
| Occupation | Male | Female |
| Production | 10 (100.0%) | 0 (0.0%) |
| Transportation | 45 (51.1%) | 43 (48.9%) |
| Material Moving | 0 (0.0%) | 0 (0.0%) |
| Total (Category) | 55 (56.1%) | 43 (43.9%) |
| Total (Overall) | 1,909 (51.1%) | 1,829 (48.9%) |
Employment Industries by Sex in Los Altos Hills
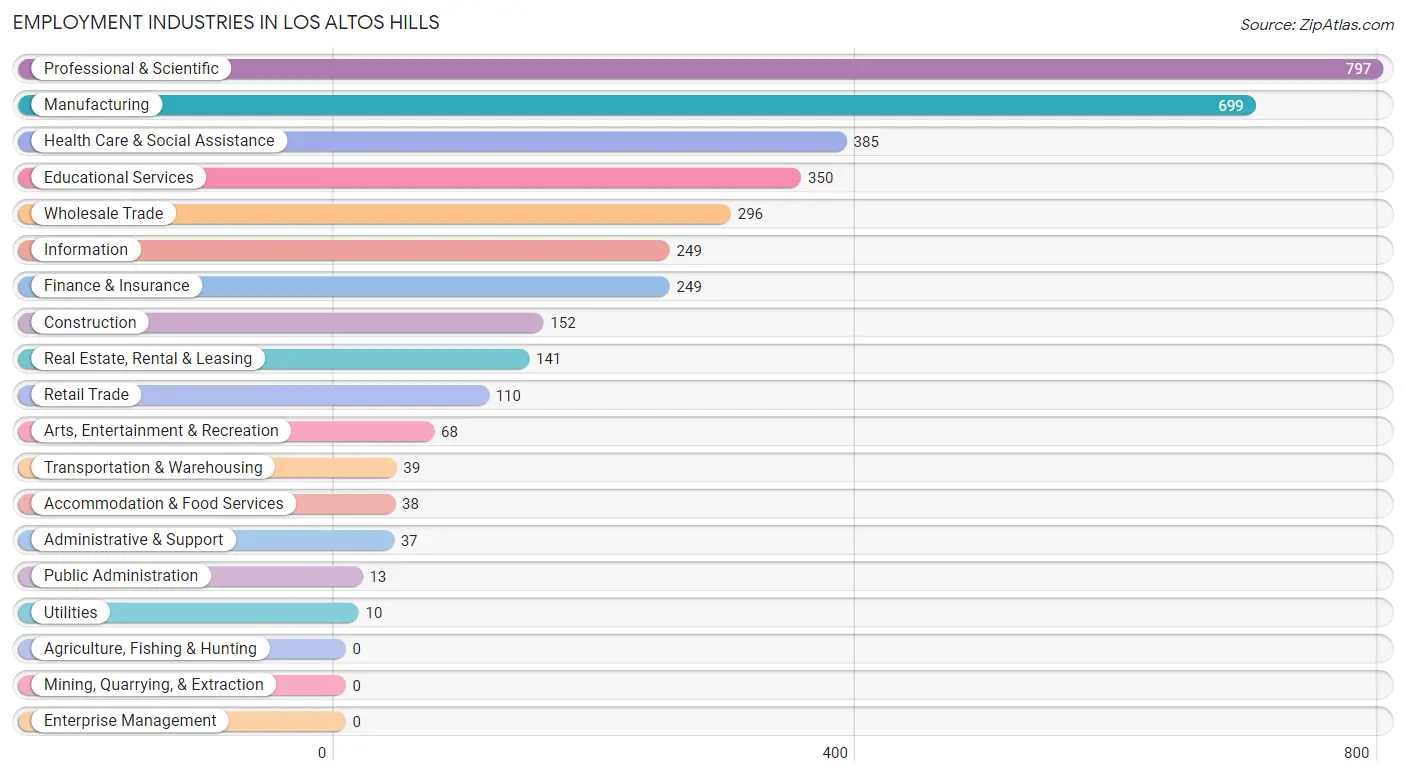
Employment Industries in Los Altos Hills
The major employment industries in Los Altos Hills include Professional & Scientific (797 | 21.3%), Manufacturing (699 | 18.7%), Health Care & Social Assistance (385 | 10.3%), Educational Services (350 | 9.4%), and Wholesale Trade (296 | 7.9%).
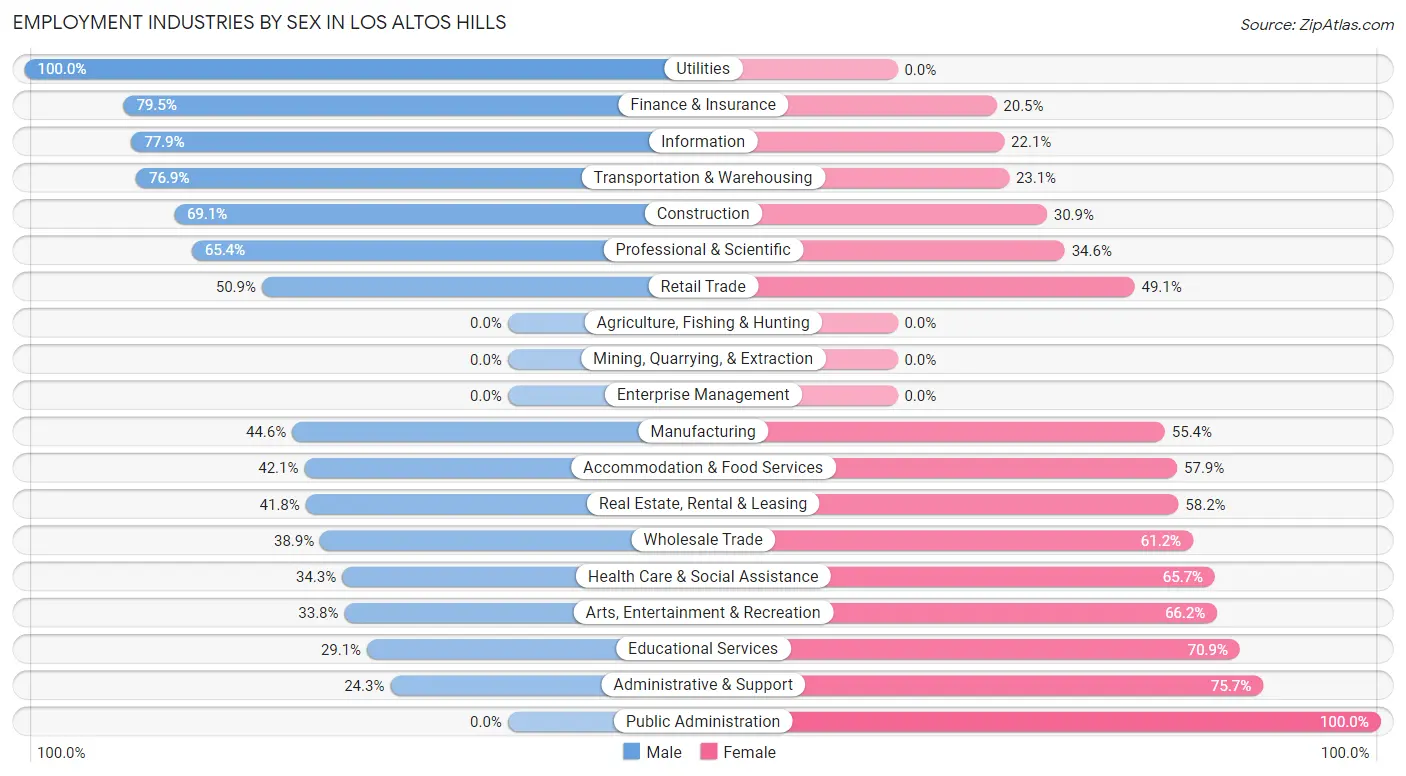
Employment Industries by Sex in Los Altos Hills
The Los Altos Hills industries that see more men than women are Utilities (100.0%), Finance & Insurance (79.5%), and Information (77.9%), whereas the industries that tend to have a higher number of women are Public Administration (100.0%), Administrative & Support (75.7%), and Educational Services (70.9%).
| Industry | Male | Female |
| Agriculture, Fishing & Hunting | 0 (0.0%) | 0 (0.0%) |
| Mining, Quarrying, & Extraction | 0 (0.0%) | 0 (0.0%) |
| Construction | 105 (69.1%) | 47 (30.9%) |
| Manufacturing | 312 (44.6%) | 387 (55.4%) |
| Wholesale Trade | 115 (38.9%) | 181 (61.2%) |
| Retail Trade | 56 (50.9%) | 54 (49.1%) |
| Transportation & Warehousing | 30 (76.9%) | 9 (23.1%) |
| Utilities | 10 (100.0%) | 0 (0.0%) |
| Information | 194 (77.9%) | 55 (22.1%) |
| Finance & Insurance | 198 (79.5%) | 51 (20.5%) |
| Real Estate, Rental & Leasing | 59 (41.8%) | 82 (58.2%) |
| Professional & Scientific | 521 (65.4%) | 276 (34.6%) |
| Enterprise Management | 0 (0.0%) | 0 (0.0%) |
| Administrative & Support | 9 (24.3%) | 28 (75.7%) |
| Educational Services | 102 (29.1%) | 248 (70.9%) |
| Health Care & Social Assistance | 132 (34.3%) | 253 (65.7%) |
| Arts, Entertainment & Recreation | 23 (33.8%) | 45 (66.2%) |
| Accommodation & Food Services | 16 (42.1%) | 22 (57.9%) |
| Public Administration | 0 (0.0%) | 13 (100.0%) |
| Total | 1,909 (51.1%) | 1,829 (48.9%) |
Education in Los Altos Hills
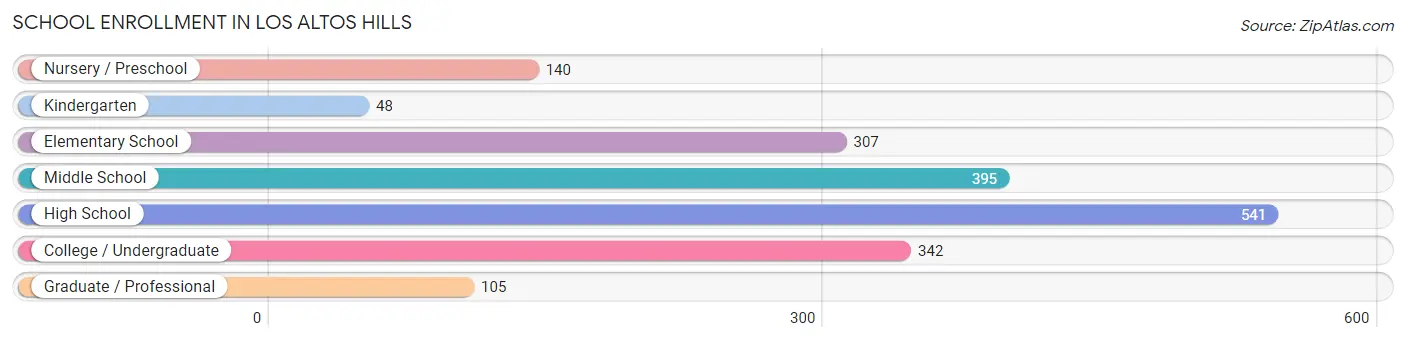
School Enrollment in Los Altos Hills
The most common levels of schooling among the 1,878 students in Los Altos Hills are high school (541 | 28.8%), middle school (395 | 21.0%), and college / undergraduate (342 | 18.2%).
| School Level | # Students | % Students |
| Nursery / Preschool | 140 | 7.4% |
| Kindergarten | 48 | 2.6% |
| Elementary School | 307 | 16.4% |
| Middle School | 395 | 21.0% |
| High School | 541 | 28.8% |
| College / Undergraduate | 342 | 18.2% |
| Graduate / Professional | 105 | 5.6% |
| Total | 1,878 | 100.0% |
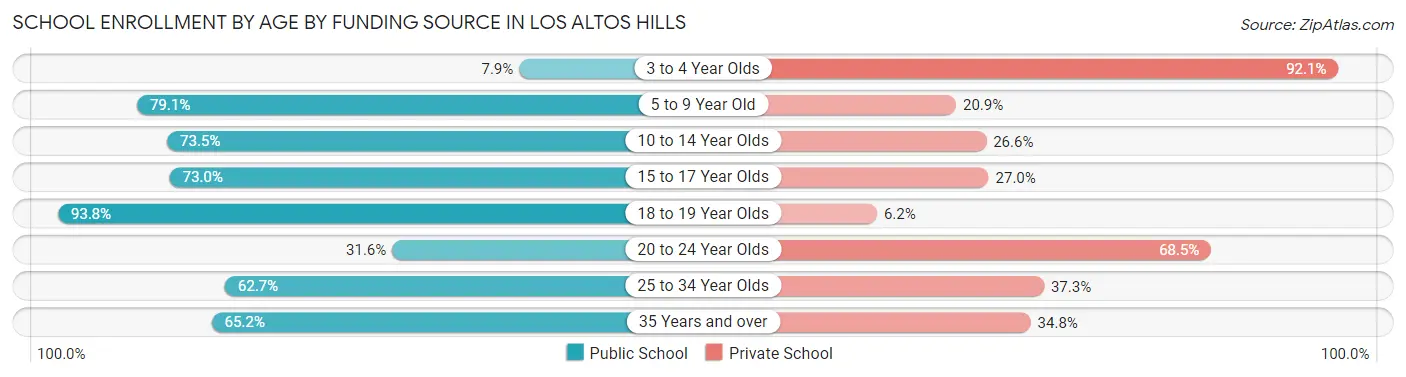
School Enrollment by Age by Funding Source in Los Altos Hills
Out of a total of 1,878 students who are enrolled in schools in Los Altos Hills, 633 (33.7%) attend a private institution, while the remaining 1,245 (66.3%) are enrolled in public schools. The age group of 3 to 4 year olds has the highest likelihood of being enrolled in private schools, with 105 (92.1% in the age bracket) enrolled. Conversely, the age group of 18 to 19 year olds has the lowest likelihood of being enrolled in a private school, with 121 (93.8% in the age bracket) attending a public institution.
| Age Bracket | Public School | Private School |
| 3 to 4 Year Olds | 9 (7.9%) | 105 (92.1%) |
| 5 to 9 Year Old | 253 (79.1%) | 67 (20.9%) |
| 10 to 14 Year Olds | 379 (73.5%) | 137 (26.6%) |
| 15 to 17 Year Olds | 319 (73.0%) | 118 (27.0%) |
| 18 to 19 Year Olds | 121 (93.8%) | 8 (6.2%) |
| 20 to 24 Year Olds | 65 (31.6%) | 141 (68.4%) |
| 25 to 34 Year Olds | 42 (62.7%) | 25 (37.3%) |
| 35 Years and over | 58 (65.2%) | 31 (34.8%) |
| Total | 1,245 (66.3%) | 633 (33.7%) |
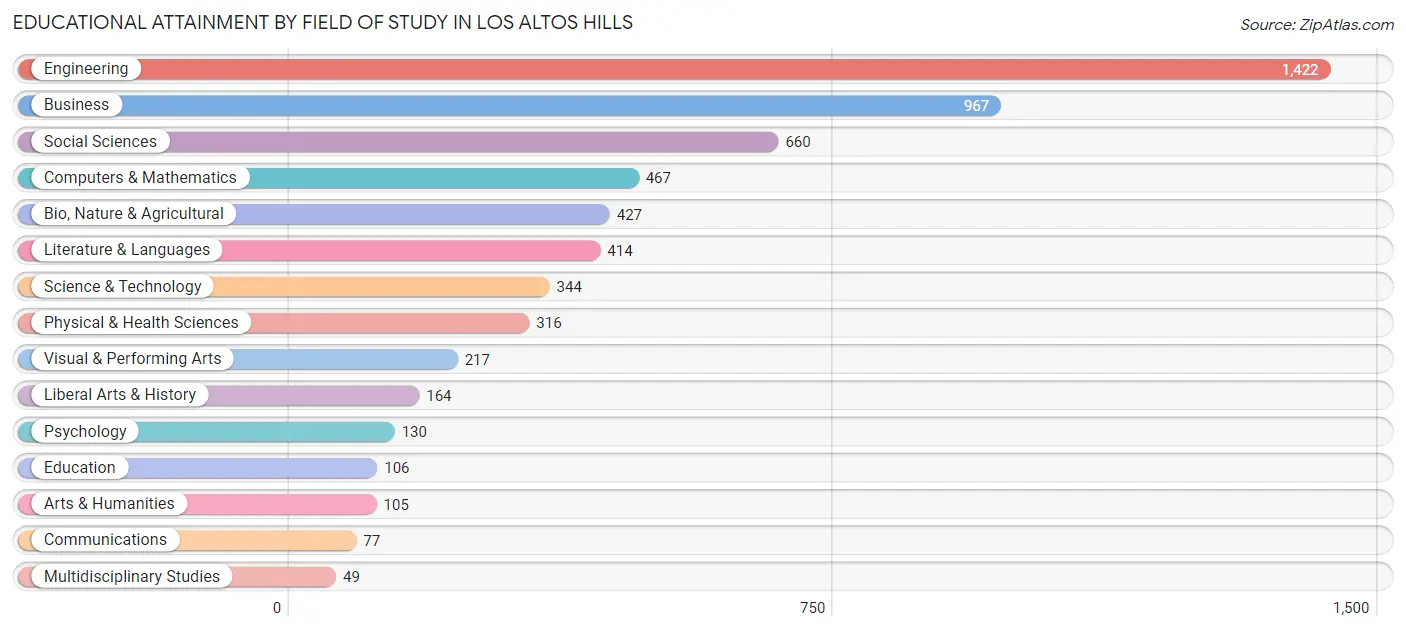
Educational Attainment by Field of Study in Los Altos Hills
Engineering (1,422 | 24.2%), business (967 | 16.5%), social sciences (660 | 11.3%), computers & mathematics (467 | 8.0%), and bio, nature & agricultural (427 | 7.3%) are the most common fields of study among 5,865 individuals in Los Altos Hills who have obtained a bachelor's degree or higher.
| Field of Study | # Graduates | % Graduates |
| Computers & Mathematics | 467 | 8.0% |
| Bio, Nature & Agricultural | 427 | 7.3% |
| Physical & Health Sciences | 316 | 5.4% |
| Psychology | 130 | 2.2% |
| Social Sciences | 660 | 11.3% |
| Engineering | 1,422 | 24.2% |
| Multidisciplinary Studies | 49 | 0.8% |
| Science & Technology | 344 | 5.9% |
| Business | 967 | 16.5% |
| Education | 106 | 1.8% |
| Literature & Languages | 414 | 7.1% |
| Liberal Arts & History | 164 | 2.8% |
| Visual & Performing Arts | 217 | 3.7% |
| Communications | 77 | 1.3% |
| Arts & Humanities | 105 | 1.8% |
| Total | 5,865 | 100.0% |
Transportation & Commute in Los Altos Hills
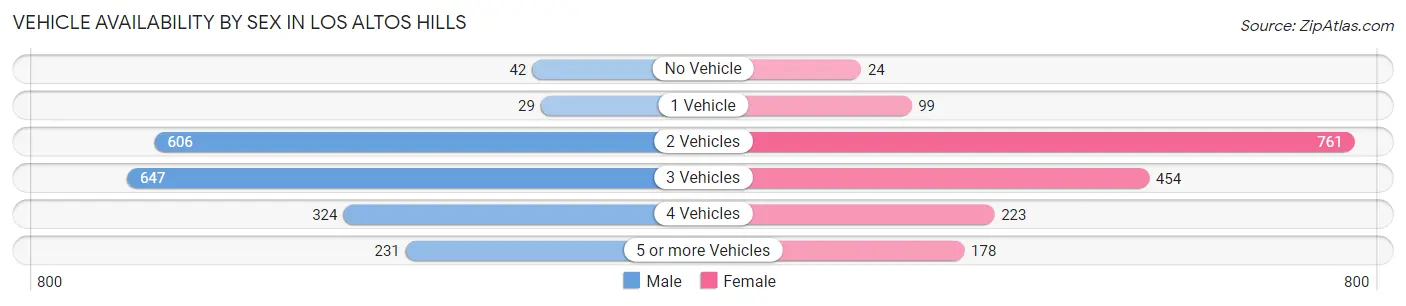
Vehicle Availability by Sex in Los Altos Hills
The most prevalent vehicle ownership categories in Los Altos Hills are males with 3 vehicles (647, accounting for 34.4%) and females with 3 vehicles (454, making up 37.2%).
| Vehicles Available | Male | Female |
| No Vehicle | 42 (2.2%) | 24 (1.4%) |
| 1 Vehicle | 29 (1.5%) | 99 (5.7%) |
| 2 Vehicles | 606 (32.3%) | 761 (43.8%) |
| 3 Vehicles | 647 (34.4%) | 454 (26.1%) |
| 4 Vehicles | 324 (17.2%) | 223 (12.8%) |
| 5 or more Vehicles | 231 (12.3%) | 178 (10.2%) |
| Total | 1,879 (100.0%) | 1,739 (100.0%) |
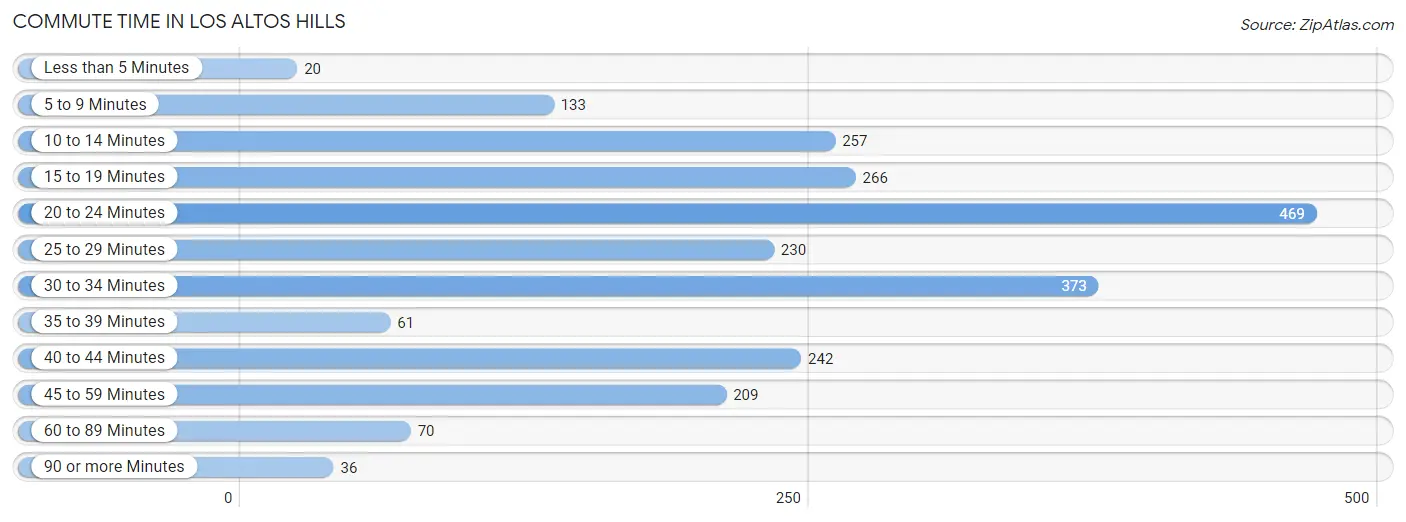
Commute Time in Los Altos Hills
The most frequently occuring commute durations in Los Altos Hills are 20 to 24 minutes (469 commuters, 19.8%), 30 to 34 minutes (373 commuters, 15.8%), and 15 to 19 minutes (266 commuters, 11.2%).
| Commute Time | # Commuters | % Commuters |
| Less than 5 Minutes | 20 | 0.9% |
| 5 to 9 Minutes | 133 | 5.6% |
| 10 to 14 Minutes | 257 | 10.9% |
| 15 to 19 Minutes | 266 | 11.2% |
| 20 to 24 Minutes | 469 | 19.8% |
| 25 to 29 Minutes | 230 | 9.7% |
| 30 to 34 Minutes | 373 | 15.8% |
| 35 to 39 Minutes | 61 | 2.6% |
| 40 to 44 Minutes | 242 | 10.2% |
| 45 to 59 Minutes | 209 | 8.8% |
| 60 to 89 Minutes | 70 | 3.0% |
| 90 or more Minutes | 36 | 1.5% |
Commute Time by Sex in Los Altos Hills
The most common commute times in Los Altos Hills are 20 to 24 minutes (297 commuters, 28.1%) for males and 30 to 34 minutes (219 commuters, 16.8%) for females.
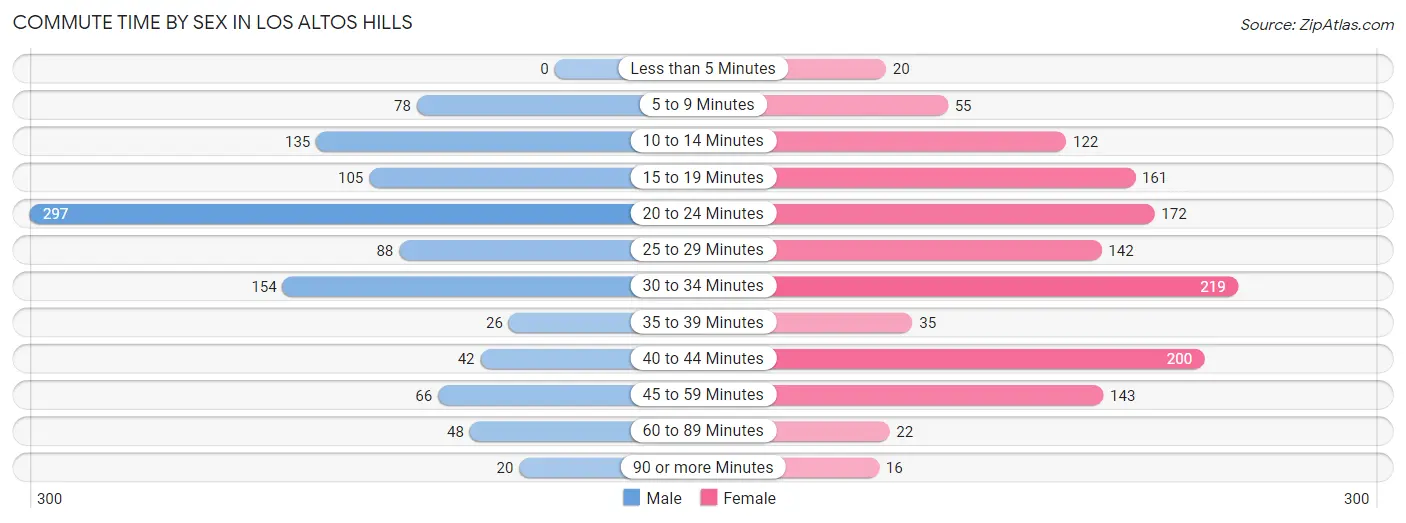
| Commute Time | Male | Female |
| Less than 5 Minutes | 0 (0.0%) | 20 (1.5%) |
| 5 to 9 Minutes | 78 (7.4%) | 55 (4.2%) |
| 10 to 14 Minutes | 135 (12.8%) | 122 (9.3%) |
| 15 to 19 Minutes | 105 (9.9%) | 161 (12.3%) |
| 20 to 24 Minutes | 297 (28.1%) | 172 (13.2%) |
| 25 to 29 Minutes | 88 (8.3%) | 142 (10.9%) |
| 30 to 34 Minutes | 154 (14.5%) | 219 (16.8%) |
| 35 to 39 Minutes | 26 (2.5%) | 35 (2.7%) |
| 40 to 44 Minutes | 42 (4.0%) | 200 (15.3%) |
| 45 to 59 Minutes | 66 (6.2%) | 143 (10.9%) |
| 60 to 89 Minutes | 48 (4.5%) | 22 (1.7%) |
| 90 or more Minutes | 20 (1.9%) | 16 (1.2%) |
Time of Departure to Work by Sex in Los Altos Hills
The most frequent times of departure to work in Los Altos Hills are 8:00 AM to 8:29 AM (206, 19.5%) for males and 8:00 AM to 8:29 AM (268, 20.5%) for females.
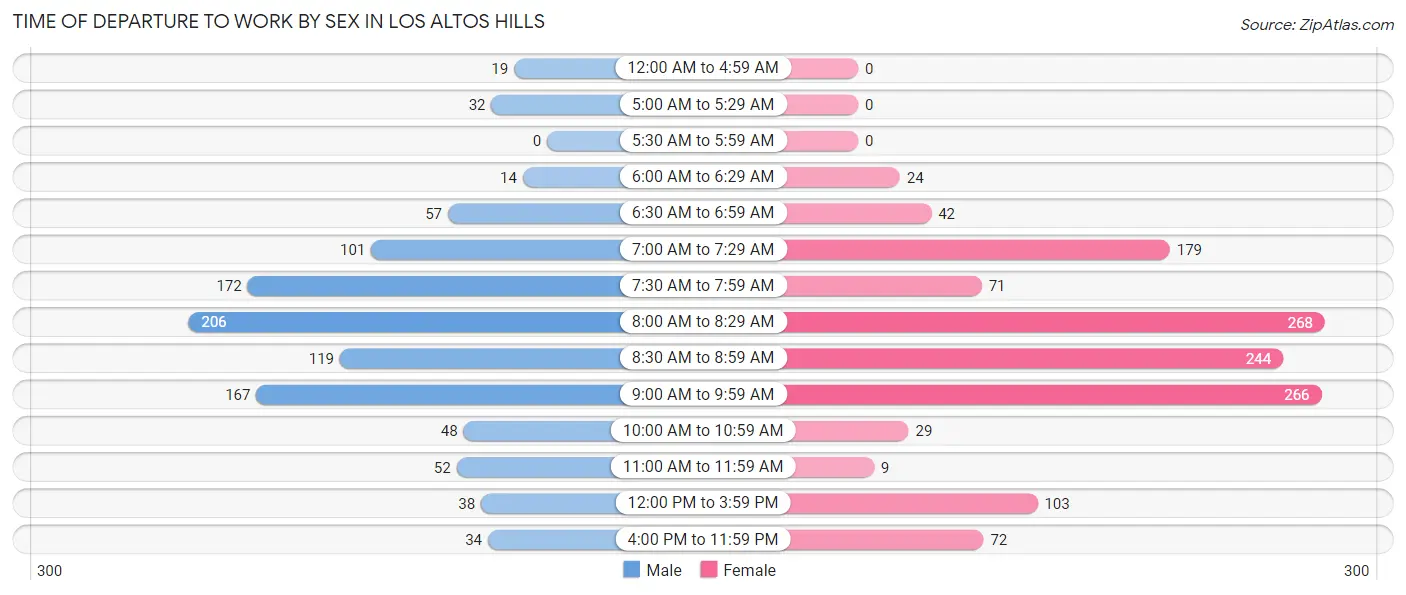
| Time of Departure | Male | Female |
| 12:00 AM to 4:59 AM | 19 (1.8%) | 0 (0.0%) |
| 5:00 AM to 5:29 AM | 32 (3.0%) | 0 (0.0%) |
| 5:30 AM to 5:59 AM | 0 (0.0%) | 0 (0.0%) |
| 6:00 AM to 6:29 AM | 14 (1.3%) | 24 (1.8%) |
| 6:30 AM to 6:59 AM | 57 (5.4%) | 42 (3.2%) |
| 7:00 AM to 7:29 AM | 101 (9.5%) | 179 (13.7%) |
| 7:30 AM to 7:59 AM | 172 (16.2%) | 71 (5.4%) |
| 8:00 AM to 8:29 AM | 206 (19.5%) | 268 (20.5%) |
| 8:30 AM to 8:59 AM | 119 (11.2%) | 244 (18.7%) |
| 9:00 AM to 9:59 AM | 167 (15.8%) | 266 (20.3%) |
| 10:00 AM to 10:59 AM | 48 (4.5%) | 29 (2.2%) |
| 11:00 AM to 11:59 AM | 52 (4.9%) | 9 (0.7%) |
| 12:00 PM to 3:59 PM | 38 (3.6%) | 103 (7.9%) |
| 4:00 PM to 11:59 PM | 34 (3.2%) | 72 (5.5%) |
| Total | 1,059 (100.0%) | 1,307 (100.0%) |
Housing Occupancy in Los Altos Hills
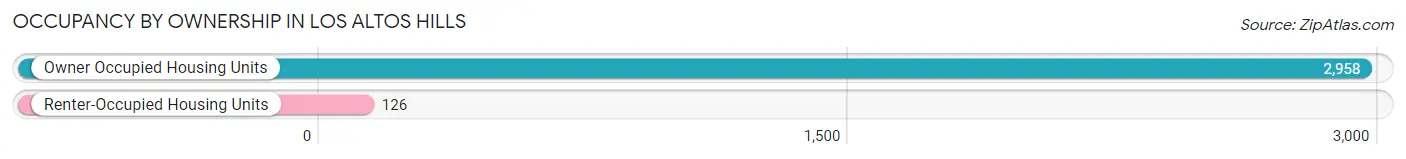
Occupancy by Ownership in Los Altos Hills
Of the total 3,084 dwellings in Los Altos Hills, owner-occupied units account for 2,958 (95.9%), while renter-occupied units make up 126 (4.1%).
| Occupancy | # Housing Units | % Housing Units |
| Owner Occupied Housing Units | 2,958 | 95.9% |
| Renter-Occupied Housing Units | 126 | 4.1% |
| Total Occupied Housing Units | 3,084 | 100.0% |
Occupancy by Household Size in Los Altos Hills
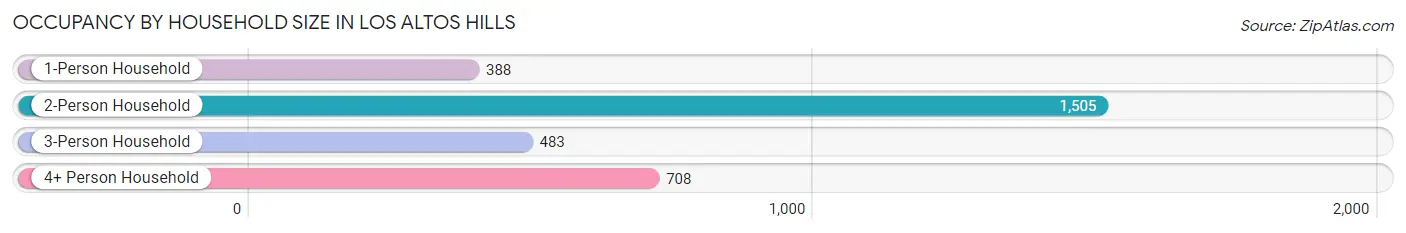
| Household Size | # Housing Units | % Housing Units |
| 1-Person Household | 388 | 12.6% |
| 2-Person Household | 1,505 | 48.8% |
| 3-Person Household | 483 | 15.7% |
| 4+ Person Household | 708 | 23.0% |
| Total Housing Units | 3,084 | 100.0% |
Occupancy by Ownership by Household Size in Los Altos Hills
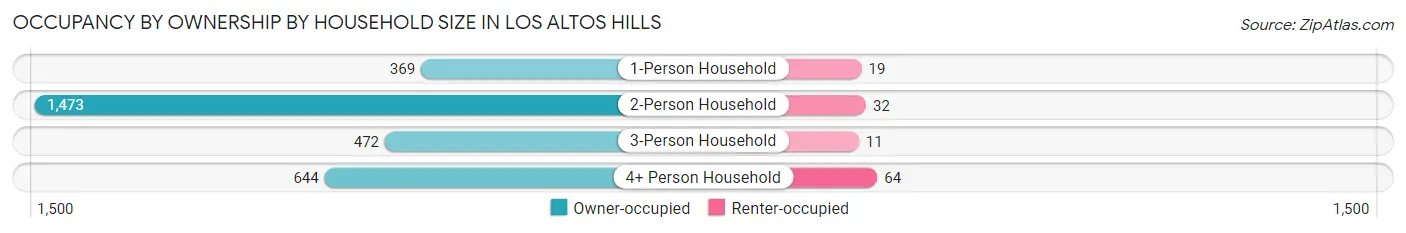
| Household Size | Owner-occupied | Renter-occupied |
| 1-Person Household | 369 (95.1%) | 19 (4.9%) |
| 2-Person Household | 1,473 (97.9%) | 32 (2.1%) |
| 3-Person Household | 472 (97.7%) | 11 (2.3%) |
| 4+ Person Household | 644 (91.0%) | 64 (9.0%) |
| Total Housing Units | 2,958 (95.9%) | 126 (4.1%) |
Occupancy by Educational Attainment in Los Altos Hills
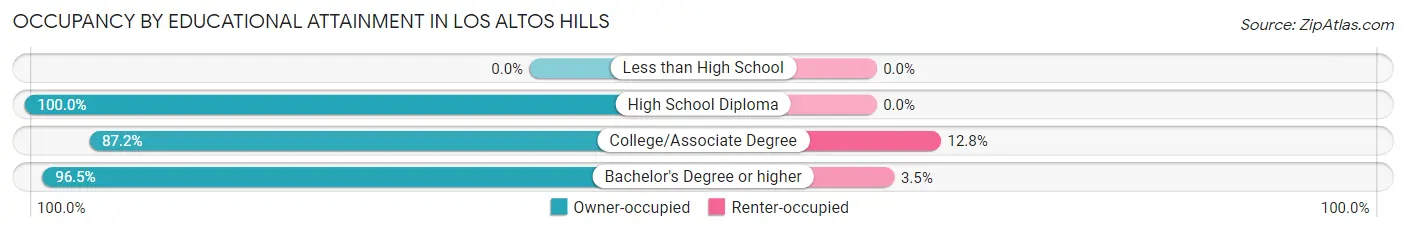
| Household Size | Owner-occupied | Renter-occupied |
| Less than High School | 0 (0.0%) | 0 (0.0%) |
| High School Diploma | 118 (100.0%) | 0 (0.0%) |
| College/Associate Degree | 205 (87.2%) | 30 (12.8%) |
| Bachelor's Degree or higher | 2,635 (96.5%) | 96 (3.5%) |
Occupancy by Age of Householder in Los Altos Hills
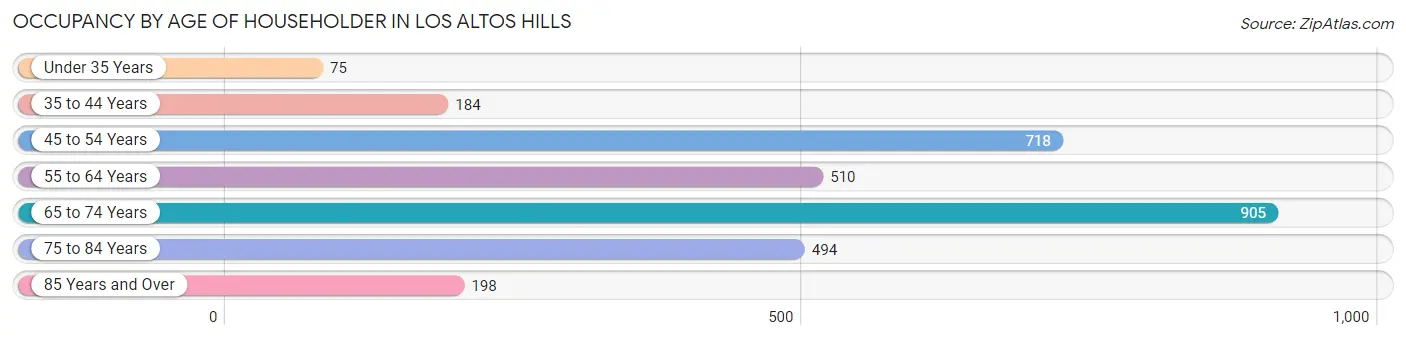
| Age Bracket | # Households | % Households |
| Under 35 Years | 75 | 2.4% |
| 35 to 44 Years | 184 | 6.0% |
| 45 to 54 Years | 718 | 23.3% |
| 55 to 64 Years | 510 | 16.5% |
| 65 to 74 Years | 905 | 29.3% |
| 75 to 84 Years | 494 | 16.0% |
| 85 Years and Over | 198 | 6.4% |
| Total | 3,084 | 100.0% |
Housing Finances in Los Altos Hills
Median Income by Occupancy in Los Altos Hills
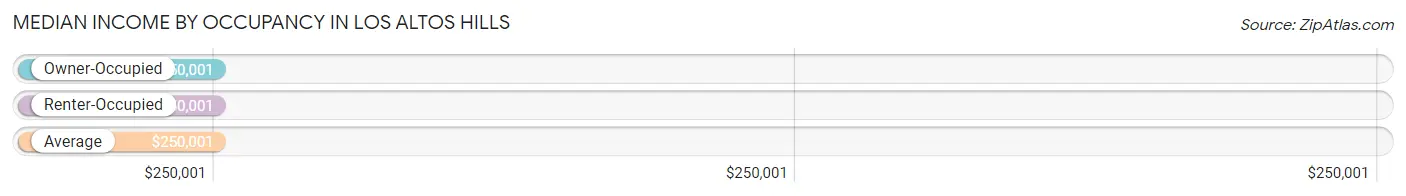
| Occupancy Type | # Households | Median Income |
| Owner-Occupied | 2,958 (95.9%) | $250,001 |
| Renter-Occupied | 126 (4.1%) | $250,001 |
| Average | 3,084 (100.0%) | $250,001 |
Occupancy by Householder Income Bracket in Los Altos Hills
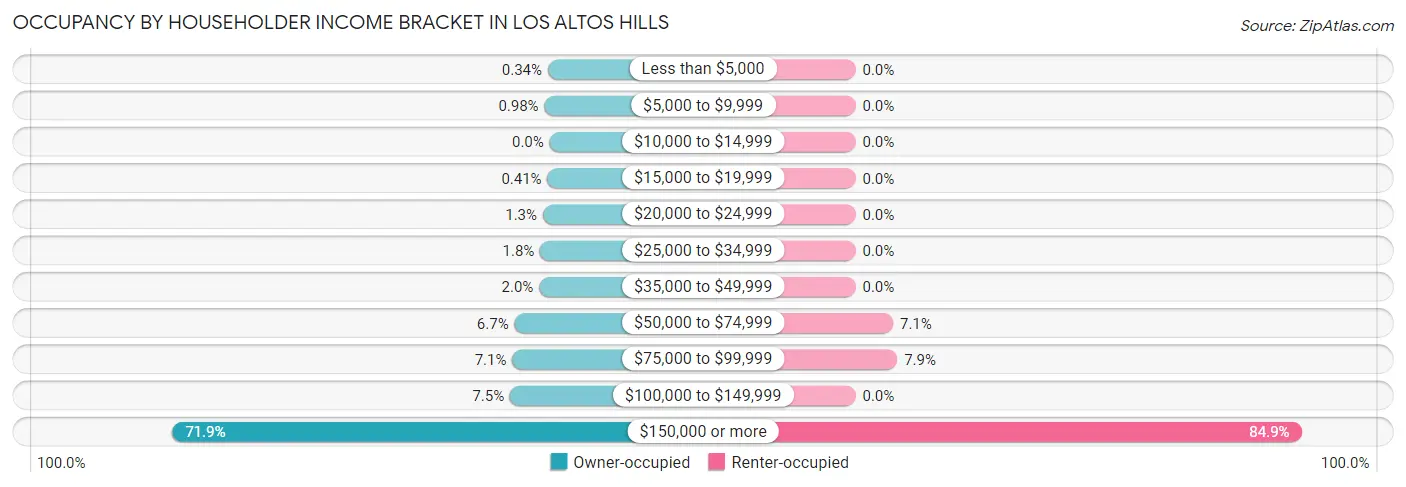
| Income Bracket | Owner-occupied | Renter-occupied |
| Less than $5,000 | 10 (0.3%) | 0 (0.0%) |
| $5,000 to $9,999 | 29 (1.0%) | 0 (0.0%) |
| $10,000 to $14,999 | 0 (0.0%) | 0 (0.0%) |
| $15,000 to $19,999 | 12 (0.4%) | 0 (0.0%) |
| $20,000 to $24,999 | 38 (1.3%) | 0 (0.0%) |
| $25,000 to $34,999 | 53 (1.8%) | 0 (0.0%) |
| $35,000 to $49,999 | 59 (2.0%) | 0 (0.0%) |
| $50,000 to $74,999 | 198 (6.7%) | 9 (7.1%) |
| $75,000 to $99,999 | 210 (7.1%) | 10 (7.9%) |
| $100,000 to $149,999 | 223 (7.5%) | 0 (0.0%) |
| $150,000 or more | 2,126 (71.9%) | 107 (84.9%) |
| Total | 2,958 (100.0%) | 126 (100.0%) |
Monthly Housing Cost Tiers in Los Altos Hills
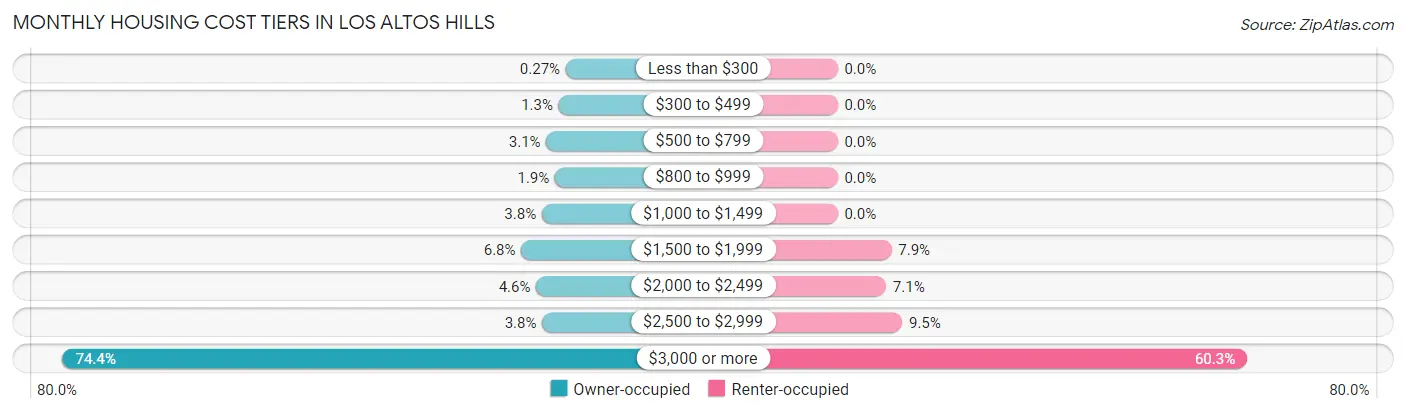
| Monthly Cost | Owner-occupied | Renter-occupied |
| Less than $300 | 8 (0.3%) | 0 (0.0%) |
| $300 to $499 | 39 (1.3%) | 0 (0.0%) |
| $500 to $799 | 93 (3.1%) | 0 (0.0%) |
| $800 to $999 | 55 (1.9%) | 0 (0.0%) |
| $1,000 to $1,499 | 112 (3.8%) | 0 (0.0%) |
| $1,500 to $1,999 | 202 (6.8%) | 10 (7.9%) |
| $2,000 to $2,499 | 137 (4.6%) | 9 (7.1%) |
| $2,500 to $2,999 | 111 (3.7%) | 12 (9.5%) |
| $3,000 or more | 2,201 (74.4%) | 76 (60.3%) |
| Total | 2,958 (100.0%) | 126 (100.0%) |
Physical Housing Characteristics in Los Altos Hills
Housing Structures in Los Altos Hills
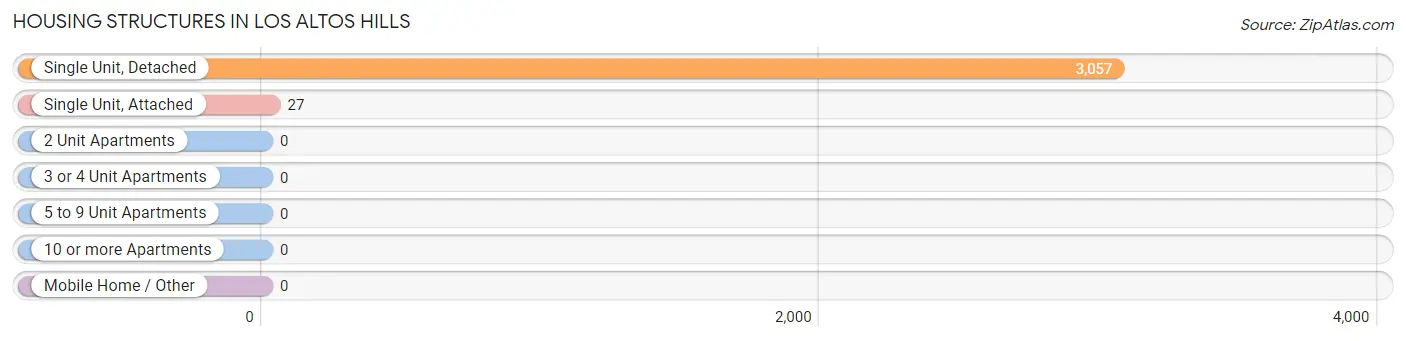
| Structure Type | # Housing Units | % Housing Units |
| Single Unit, Detached | 3,057 | 99.1% |
| Single Unit, Attached | 27 | 0.9% |
| 2 Unit Apartments | 0 | 0.0% |
| 3 or 4 Unit Apartments | 0 | 0.0% |
| 5 to 9 Unit Apartments | 0 | 0.0% |
| 10 or more Apartments | 0 | 0.0% |
| Mobile Home / Other | 0 | 0.0% |
| Total | 3,084 | 100.0% |
Housing Structures by Occupancy in Los Altos Hills
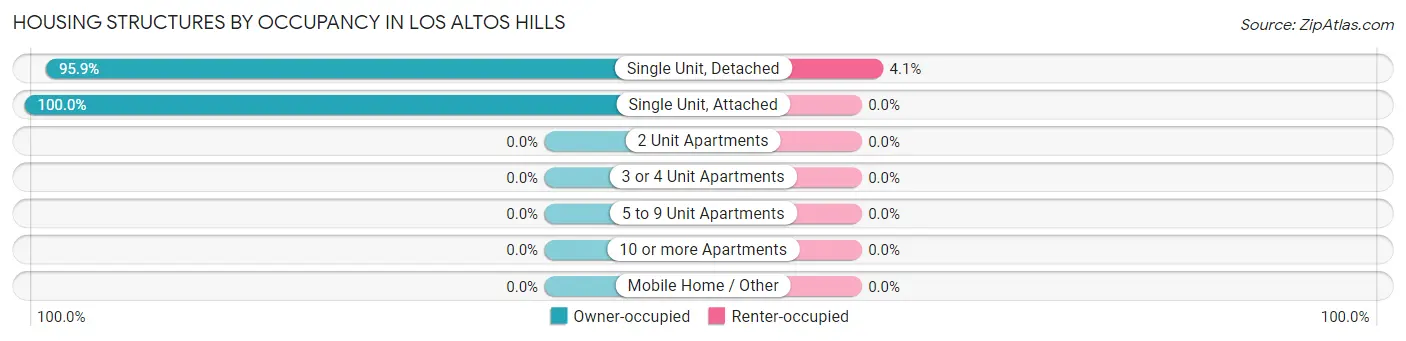
| Structure Type | Owner-occupied | Renter-occupied |
| Single Unit, Detached | 2,931 (95.9%) | 126 (4.1%) |
| Single Unit, Attached | 27 (100.0%) | 0 (0.0%) |
| 2 Unit Apartments | 0 (0.0%) | 0 (0.0%) |
| 3 or 4 Unit Apartments | 0 (0.0%) | 0 (0.0%) |
| 5 to 9 Unit Apartments | 0 (0.0%) | 0 (0.0%) |
| 10 or more Apartments | 0 (0.0%) | 0 (0.0%) |
| Mobile Home / Other | 0 (0.0%) | 0 (0.0%) |
| Total | 2,958 (95.9%) | 126 (4.1%) |
Housing Structures by Number of Rooms in Los Altos Hills
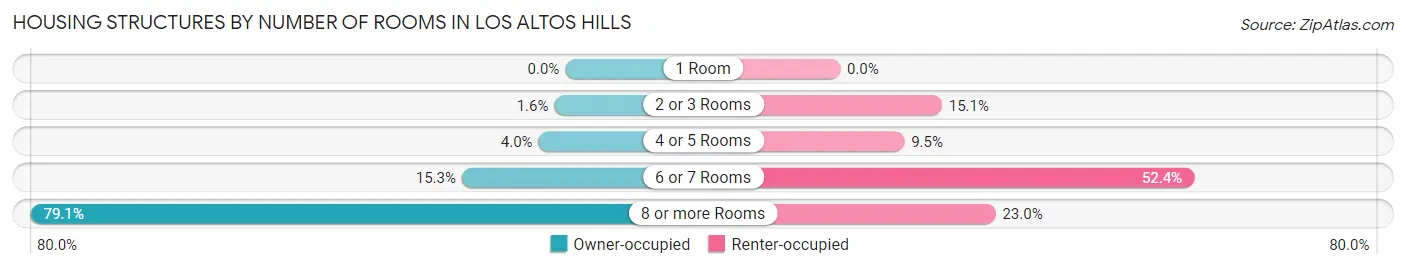
| Number of Rooms | Owner-occupied | Renter-occupied |
| 1 Room | 0 (0.0%) | 0 (0.0%) |
| 2 or 3 Rooms | 48 (1.6%) | 19 (15.1%) |
| 4 or 5 Rooms | 117 (4.0%) | 12 (9.5%) |
| 6 or 7 Rooms | 453 (15.3%) | 66 (52.4%) |
| 8 or more Rooms | 2,340 (79.1%) | 29 (23.0%) |
| Total | 2,958 (100.0%) | 126 (100.0%) |
Housing Structure by Heating Type in Los Altos Hills
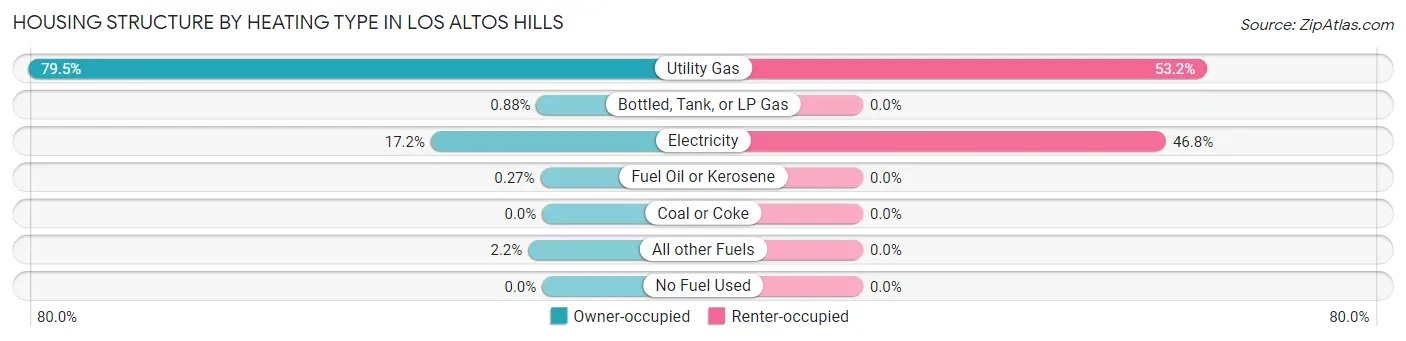
| Heating Type | Owner-occupied | Renter-occupied |
| Utility Gas | 2,351 (79.5%) | 67 (53.2%) |
| Bottled, Tank, or LP Gas | 26 (0.9%) | 0 (0.0%) |
| Electricity | 509 (17.2%) | 59 (46.8%) |
| Fuel Oil or Kerosene | 8 (0.3%) | 0 (0.0%) |
| Coal or Coke | 0 (0.0%) | 0 (0.0%) |
| All other Fuels | 64 (2.2%) | 0 (0.0%) |
| No Fuel Used | 0 (0.0%) | 0 (0.0%) |
| Total | 2,958 (100.0%) | 126 (100.0%) |
Household Vehicle Usage in Los Altos Hills
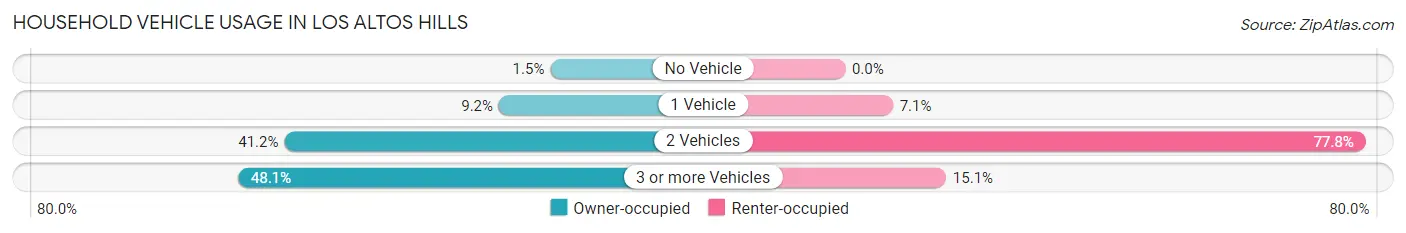
| Vehicles per Household | Owner-occupied | Renter-occupied |
| No Vehicle | 44 (1.5%) | 0 (0.0%) |
| 1 Vehicle | 271 (9.2%) | 9 (7.1%) |
| 2 Vehicles | 1,219 (41.2%) | 98 (77.8%) |
| 3 or more Vehicles | 1,424 (48.1%) | 19 (15.1%) |
| Total | 2,958 (100.0%) | 126 (100.0%) |
Real Estate & Mortgages in Los Altos Hills
Real Estate and Mortgage Overview in Los Altos Hills
| Characteristic | Without Mortgage | With Mortgage |
| Housing Units | 1,279 | 1,679 |
| Median Property Value | $2,000,001 | $2,000,001 |
| Median Household Income | $222,202 | $1,244 |
| Monthly Housing Costs | $1,501 | $1,579 |
| Real Estate Taxes | $10,001 | $0 |
Property Value by Mortgage Status in Los Altos Hills

| Property Value | Without Mortgage | With Mortgage |
| Less than $50,000 | 0 (0.0%) | 7 (0.4%) |
| $50,000 to $99,999 | 0 (0.0%) | 0 (0.0%) |
| $100,000 to $299,999 | 12 (0.9%) | 0 (0.0%) |
| $300,000 to $499,999 | 0 (0.0%) | 20 (1.2%) |
| $500,000 to $749,999 | 8 (0.6%) | 0 (0.0%) |
| $750,000 to $999,999 | 0 (0.0%) | 32 (1.9%) |
| $1,000,000 or more | 1,259 (98.4%) | 1,620 (96.5%) |
| Total | 1,279 (100.0%) | 1,679 (100.0%) |
Household Income by Mortgage Status in Los Altos Hills
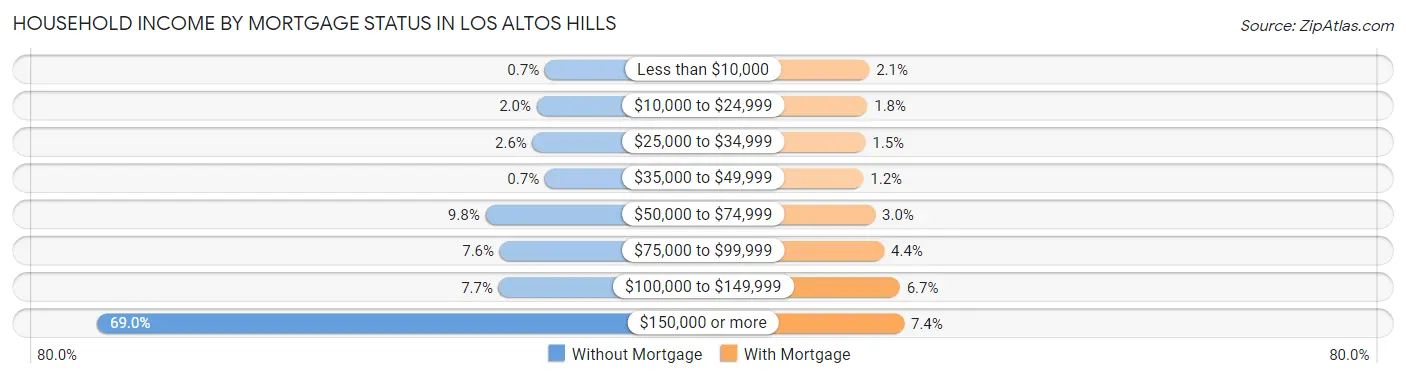
| Household Income | Without Mortgage | With Mortgage |
| Less than $10,000 | 9 (0.7%) | 35 (2.1%) |
| $10,000 to $24,999 | 25 (1.9%) | 30 (1.8%) |
| $25,000 to $34,999 | 33 (2.6%) | 25 (1.5%) |
| $35,000 to $49,999 | 9 (0.7%) | 20 (1.2%) |
| $50,000 to $74,999 | 125 (9.8%) | 50 (3.0%) |
| $75,000 to $99,999 | 97 (7.6%) | 73 (4.3%) |
| $100,000 to $149,999 | 99 (7.7%) | 113 (6.7%) |
| $150,000 or more | 882 (69.0%) | 124 (7.4%) |
| Total | 1,279 (100.0%) | 1,679 (100.0%) |
Property Value to Household Income Ratio in Los Altos Hills
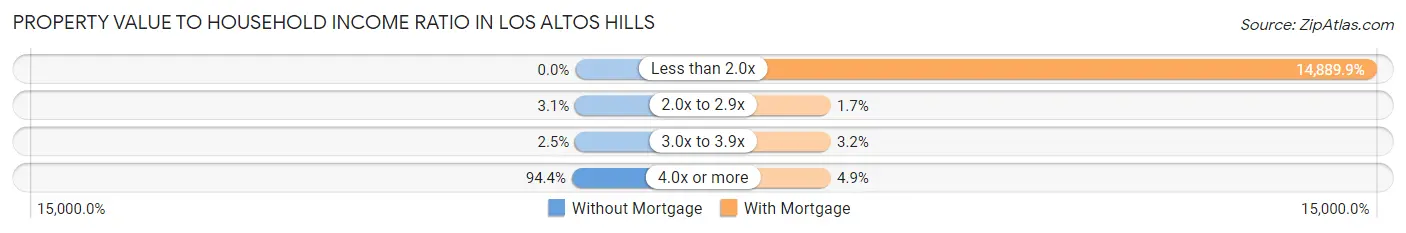
| Value-to-Income Ratio | Without Mortgage | With Mortgage |
| Less than 2.0x | 0 (0.0%) | 250,001 (14,889.9%) |
| 2.0x to 2.9x | 40 (3.1%) | 29 (1.7%) |
| 3.0x to 3.9x | 32 (2.5%) | 53 (3.2%) |
| 4.0x or more | 1,207 (94.4%) | 82 (4.9%) |
| Total | 1,279 (100.0%) | 1,679 (100.0%) |
Real Estate Taxes by Mortgage Status in Los Altos Hills
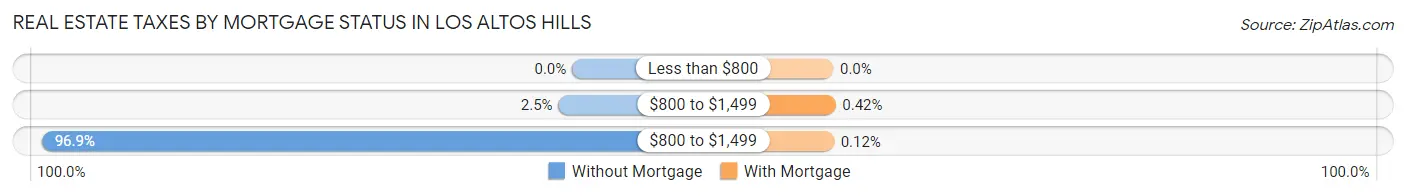
| Property Taxes | Without Mortgage | With Mortgage |
| Less than $800 | 0 (0.0%) | 0 (0.0%) |
| $800 to $1,499 | 32 (2.5%) | 7 (0.4%) |
| $800 to $1,499 | 1,239 (96.9%) | 2 (0.1%) |
| Total | 1,279 (100.0%) | 1,679 (100.0%) |
Health & Disability in Los Altos Hills
Health Insurance Coverage by Age in Los Altos Hills
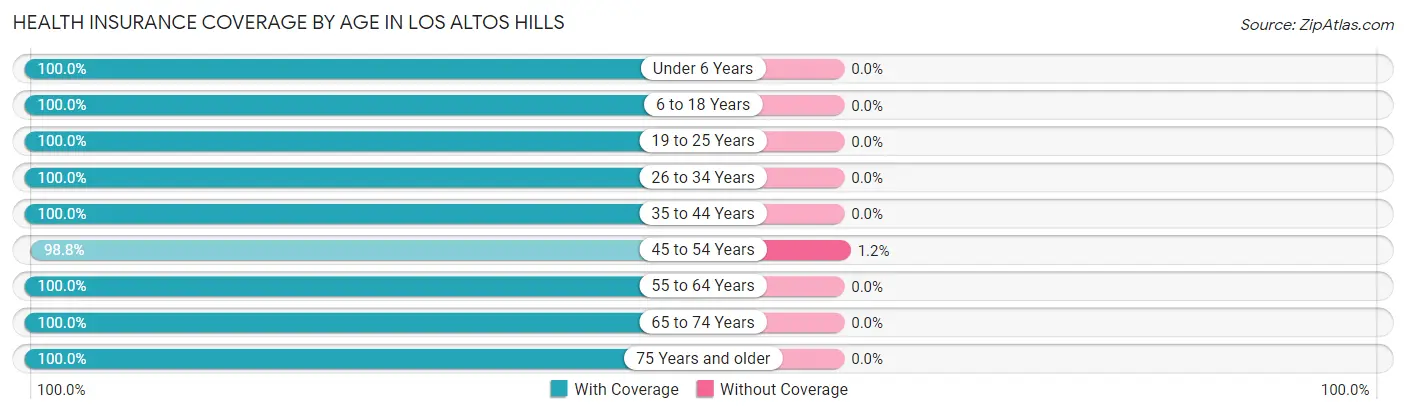
| Age Bracket | With Coverage | Without Coverage |
| Under 6 Years | 381 (100.0%) | 0 (0.0%) |
| 6 to 18 Years | 1,281 (100.0%) | 0 (0.0%) |
| 19 to 25 Years | 481 (100.0%) | 0 (0.0%) |
| 26 to 34 Years | 482 (100.0%) | 0 (0.0%) |
| 35 to 44 Years | 520 (100.0%) | 0 (0.0%) |
| 45 to 54 Years | 1,315 (98.8%) | 16 (1.2%) |
| 55 to 64 Years | 1,276 (100.0%) | 0 (0.0%) |
| 65 to 74 Years | 1,464 (100.0%) | 0 (0.0%) |
| 75 Years and older | 1,225 (100.0%) | 0 (0.0%) |
| Total | 8,425 (99.8%) | 16 (0.2%) |
Health Insurance Coverage by Citizenship Status in Los Altos Hills
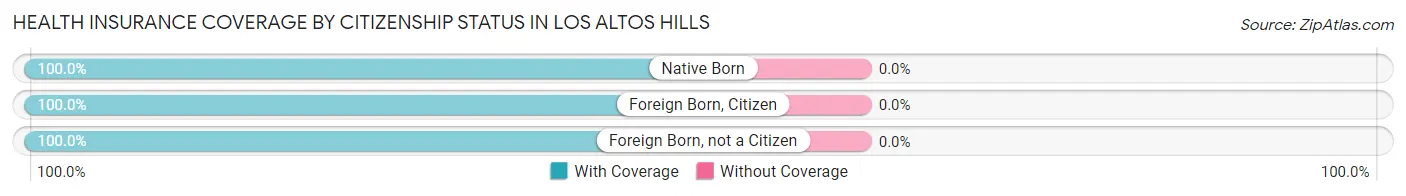
| Citizenship Status | With Coverage | Without Coverage |
| Native Born | 381 (100.0%) | 0 (0.0%) |
| Foreign Born, Citizen | 1,281 (100.0%) | 0 (0.0%) |
| Foreign Born, not a Citizen | 481 (100.0%) | 0 (0.0%) |
Health Insurance Coverage by Household Income in Los Altos Hills
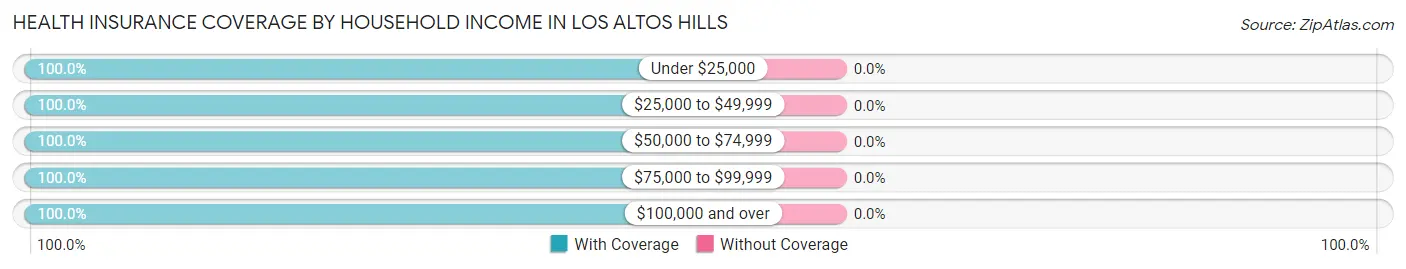
| Household Income | With Coverage | Without Coverage |
| Under $25,000 | 134 (100.0%) | 0 (0.0%) |
| $25,000 to $49,999 | 167 (100.0%) | 0 (0.0%) |
| $50,000 to $74,999 | 371 (100.0%) | 0 (0.0%) |
| $75,000 to $99,999 | 560 (100.0%) | 0 (0.0%) |
| $100,000 and over | 7,098 (100.0%) | 0 (0.0%) |
Public vs Private Health Insurance Coverage by Age in Los Altos Hills
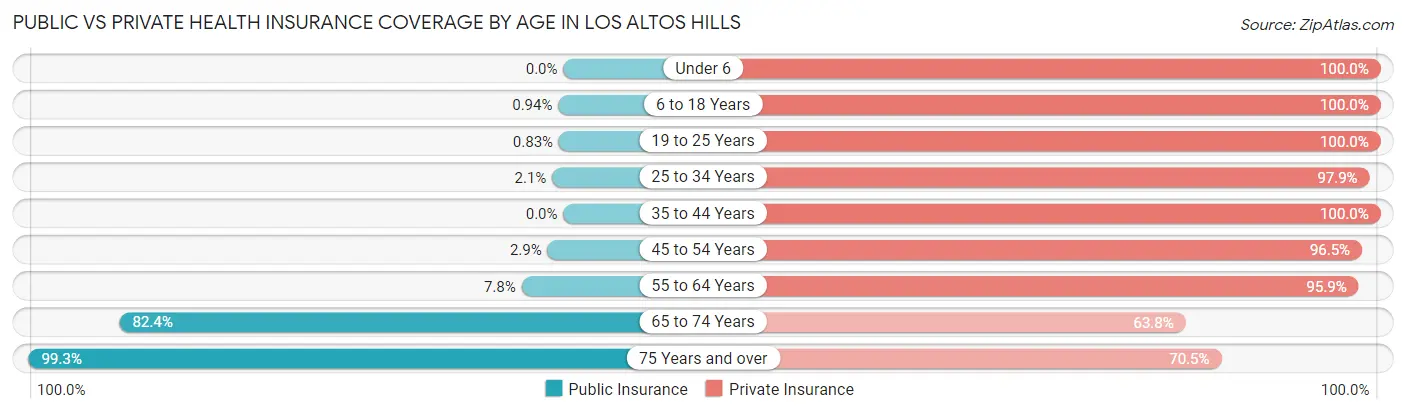
| Age Bracket | Public Insurance | Private Insurance |
| Under 6 | 0 (0.0%) | 381 (100.0%) |
| 6 to 18 Years | 12 (0.9%) | 1,281 (100.0%) |
| 19 to 25 Years | 4 (0.8%) | 481 (100.0%) |
| 25 to 34 Years | 10 (2.1%) | 472 (97.9%) |
| 35 to 44 Years | 0 (0.0%) | 520 (100.0%) |
| 45 to 54 Years | 39 (2.9%) | 1,285 (96.5%) |
| 55 to 64 Years | 99 (7.8%) | 1,224 (95.9%) |
| 65 to 74 Years | 1,206 (82.4%) | 934 (63.8%) |
| 75 Years and over | 1,216 (99.3%) | 863 (70.5%) |
| Total | 2,586 (30.6%) | 7,441 (88.1%) |
Disability Status by Sex by Age in Los Altos Hills
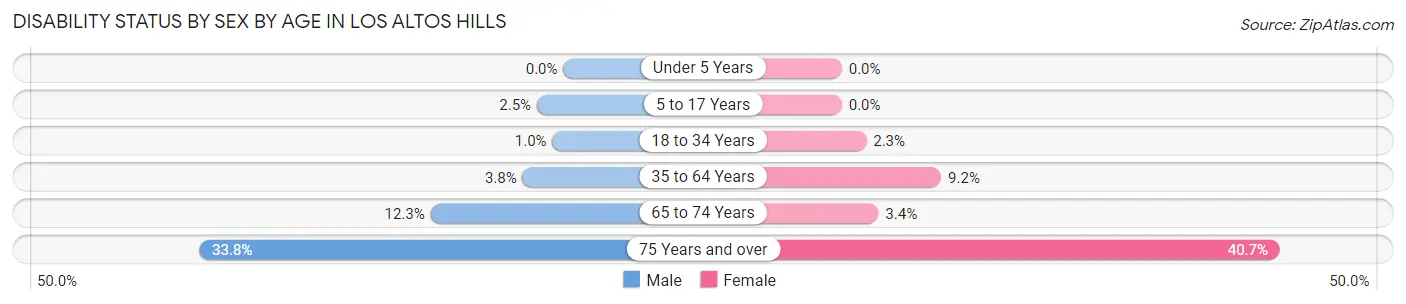
| Age Bracket | Male | Female |
| Under 5 Years | 0 (0.0%) | 0 (0.0%) |
| 5 to 17 Years | 13 (2.5%) | 0 (0.0%) |
| 18 to 34 Years | 4 (1.0%) | 14 (2.3%) |
| 35 to 64 Years | 56 (3.8%) | 152 (9.2%) |
| 65 to 74 Years | 79 (12.3%) | 28 (3.4%) |
| 75 Years and over | 217 (33.8%) | 237 (40.6%) |
Disability Class by Sex by Age in Los Altos Hills
Disability Class: Hearing Difficulty
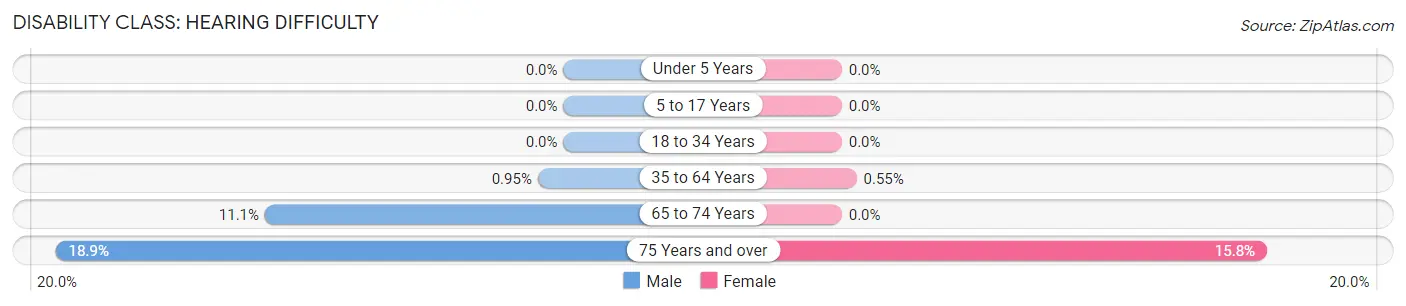
| Age Bracket | Male | Female |
| Under 5 Years | 0 (0.0%) | 0 (0.0%) |
| 5 to 17 Years | 0 (0.0%) | 0 (0.0%) |
| 18 to 34 Years | 0 (0.0%) | 0 (0.0%) |
| 35 to 64 Years | 14 (0.9%) | 9 (0.5%) |
| 65 to 74 Years | 71 (11.1%) | 0 (0.0%) |
| 75 Years and over | 121 (18.9%) | 92 (15.8%) |
Disability Class: Vision Difficulty
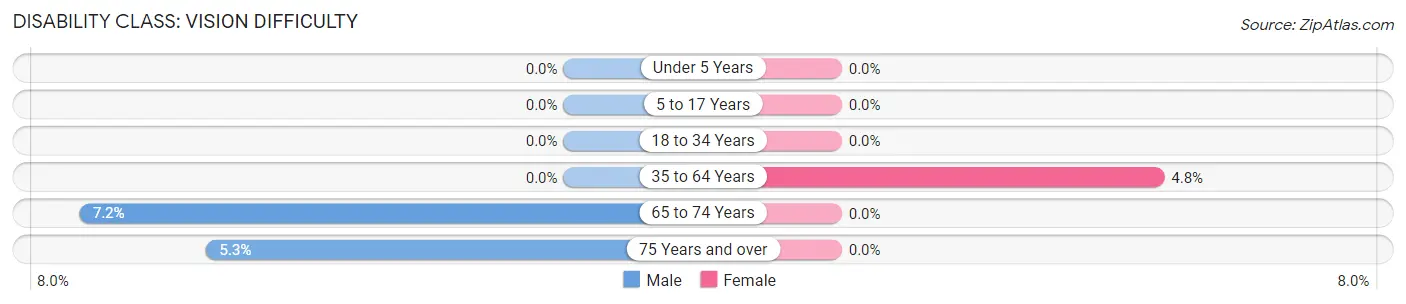
| Age Bracket | Male | Female |
| Under 5 Years | 0 (0.0%) | 0 (0.0%) |
| 5 to 17 Years | 0 (0.0%) | 0 (0.0%) |
| 18 to 34 Years | 0 (0.0%) | 0 (0.0%) |
| 35 to 64 Years | 0 (0.0%) | 79 (4.8%) |
| 65 to 74 Years | 46 (7.2%) | 0 (0.0%) |
| 75 Years and over | 34 (5.3%) | 0 (0.0%) |
Disability Class: Cognitive Difficulty
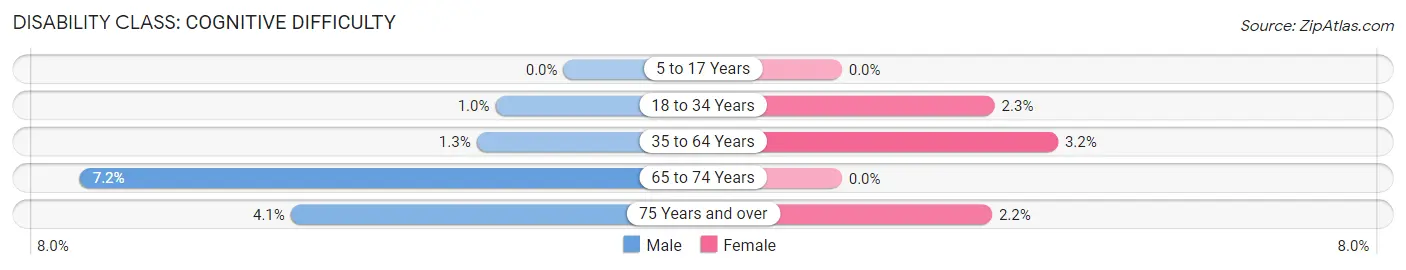
| Age Bracket | Male | Female |
| 5 to 17 Years | 0 (0.0%) | 0 (0.0%) |
| 18 to 34 Years | 4 (1.0%) | 14 (2.3%) |
| 35 to 64 Years | 19 (1.3%) | 53 (3.2%) |
| 65 to 74 Years | 46 (7.2%) | 0 (0.0%) |
| 75 Years and over | 26 (4.1%) | 13 (2.2%) |
Disability Class: Ambulatory Difficulty
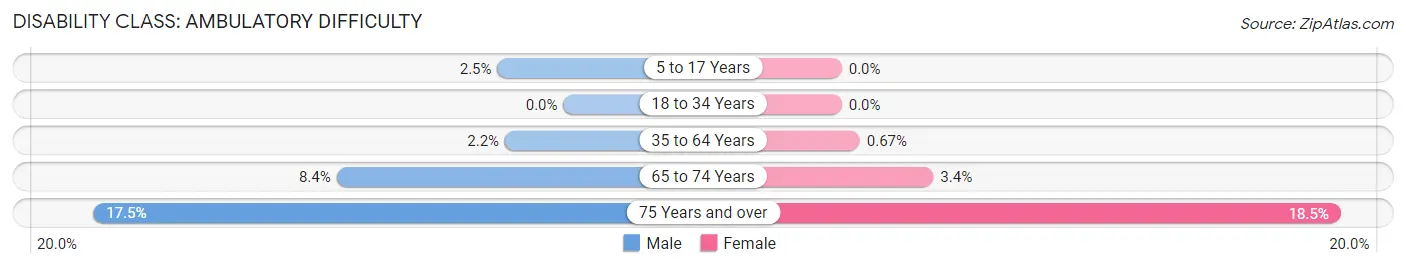
| Age Bracket | Male | Female |
| 5 to 17 Years | 13 (2.5%) | 0 (0.0%) |
| 18 to 34 Years | 0 (0.0%) | 0 (0.0%) |
| 35 to 64 Years | 32 (2.2%) | 11 (0.7%) |
| 65 to 74 Years | 54 (8.4%) | 28 (3.4%) |
| 75 Years and over | 112 (17.4%) | 108 (18.5%) |
Disability Class: Self-Care Difficulty
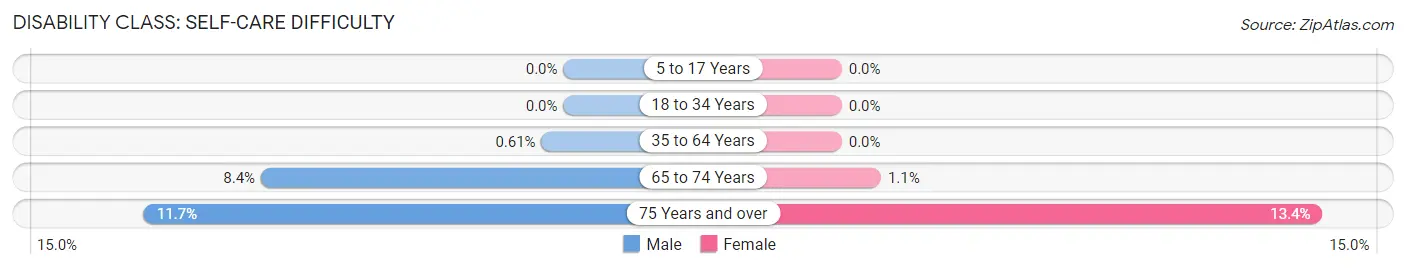
| Age Bracket | Male | Female |
| 5 to 17 Years | 0 (0.0%) | 0 (0.0%) |
| 18 to 34 Years | 0 (0.0%) | 0 (0.0%) |
| 35 to 64 Years | 9 (0.6%) | 0 (0.0%) |
| 65 to 74 Years | 54 (8.4%) | 9 (1.1%) |
| 75 Years and over | 75 (11.7%) | 78 (13.4%) |
Technology Access in Los Altos Hills
Computing Device Access in Los Altos Hills
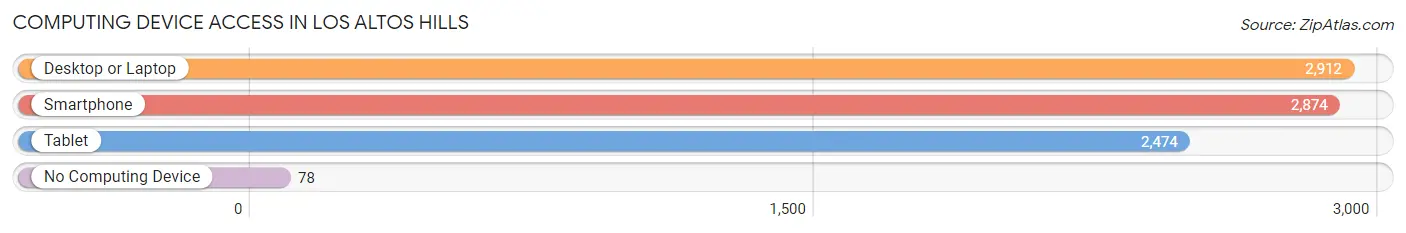
| Device Type | # Households | % Households |
| Desktop or Laptop | 2,912 | 94.4% |
| Smartphone | 2,874 | 93.2% |
| Tablet | 2,474 | 80.2% |
| No Computing Device | 78 | 2.5% |
| Total | 3,084 | 100.0% |
Internet Access in Los Altos Hills
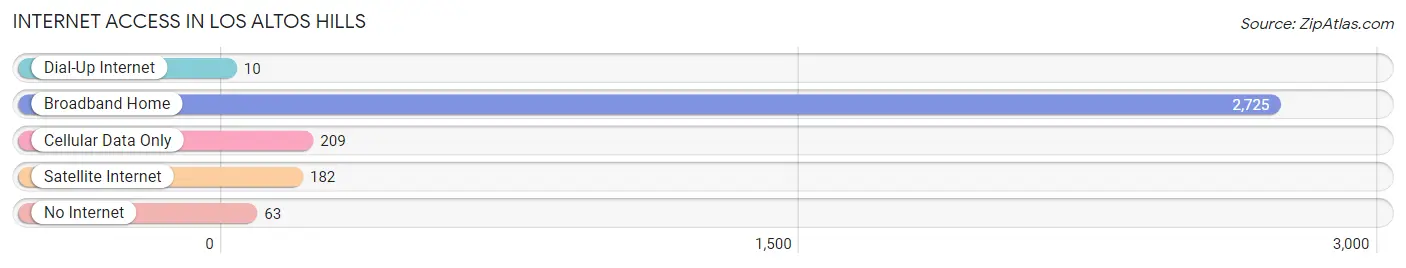
| Internet Type | # Households | % Households |
| Dial-Up Internet | 10 | 0.3% |
| Broadband Home | 2,725 | 88.4% |
| Cellular Data Only | 209 | 6.8% |
| Satellite Internet | 182 | 5.9% |
| No Internet | 63 | 2.0% |
| Total | 3,084 | 100.0% |
Los Altos Hills Summary
History
Los Altos Hills is a small town located in Santa Clara County, California. It is situated in the San Francisco Bay Area, just south of the city of Palo Alto. The town was incorporated in 1956 and is known for its rural atmosphere and its large estates.
The area that is now Los Altos Hills was originally inhabited by the Ohlone people, who were hunter-gatherers. The first Europeans to settle in the area were the Spanish, who established the Mission Santa Clara de Asís in 1777. The mission was the eighth of the 21 missions established in California by the Spanish.
In the mid-1800s, the area was part of Rancho San Antonio, a large Mexican land grant. The land was eventually divided up and sold off to settlers, who established small farms and ranches. In the early 1900s, the area began to be developed as a residential community.
Geography
Los Altos Hills is located in the San Francisco Bay Area, just south of the city of Palo Alto. It is situated in the foothills of the Santa Cruz Mountains, with an elevation of about 500 feet. The town covers an area of 8.8 square miles and is bordered by the cities of Palo Alto, Los Altos, and Mountain View.
The town is characterized by its rolling hills and rural atmosphere. It is home to many large estates, as well as several parks and open spaces. The town is also home to the Los Altos Hills County Park, which features a variety of recreational activities, including hiking, biking, and horseback riding.
Economy
Los Altos Hills is a wealthy town, with a median household income of $250,000. The town is home to many high-tech companies, including Google, Apple, and Facebook. These companies have helped to drive the local economy, as well as the housing market.
The town is also home to several small businesses, including restaurants, retail stores, and professional services. The town is also home to several wineries, which produce a variety of wines.
Demographics
As of the 2010 census, the population of Los Altos Hills was 8,495. The population is predominantly white (83.3%), with a small Asian population (10.2%). The median age is 47.7 years, and the median household income is $250,000.
The town is also home to a large number of wealthy residents. According to Forbes, Los Altos Hills is the second-wealthiest town in the United States, with a median household income of $250,000.
Conclusion
Los Altos Hills is a small town located in Santa Clara County, California. It is situated in the San Francisco Bay Area, just south of the city of Palo Alto. The town was incorporated in 1956 and is known for its rural atmosphere and its large estates. The town is characterized by its rolling hills and rural atmosphere, and is home to many high-tech companies, as well as several small businesses. The population of Los Altos Hills is predominantly white, with a median household income of $250,000. The town is also home to a large number of wealthy residents, making it the second-wealthiest town in the United States.
Common Questions
What is Per Capita Income in Los Altos Hills?
Per Capita income in Los Altos Hills is $170,801.
What is the Median Family Income in Los Altos Hills?
Median Family Income in Los Altos Hills is $250,001.
What is the Median Household income in Los Altos Hills?
Median Household Income in Los Altos Hills is $250,001.
What is Income or Wage Gap in Los Altos Hills?
Income or Wage Gap in Los Altos Hills is 57.1%.
Women in Los Altos Hills earn 42.9 cents for every dollar earned by a man.
What is Inequality or Gini Index in Los Altos Hills?
Inequality or Gini Index in Los Altos Hills is 0.51.
What is the Total Population of Los Altos Hills?
Total Population of Los Altos Hills is 8,441.
What is the Total Male Population of Los Altos Hills?
Total Male Population of Los Altos Hills is 3,837.
What is the Total Female Population of Los Altos Hills?
Total Female Population of Los Altos Hills is 4,604.
What is the Ratio of Males per 100 Females in Los Altos Hills?
There are 83.34 Males per 100 Females in Los Altos Hills.
What is the Ratio of Females per 100 Males in Los Altos Hills?
There are 119.99 Females per 100 Males in Los Altos Hills.
What is the Median Population Age in Los Altos Hills?
Median Population Age in Los Altos Hills is 53.5 Years.
What is the Average Family Size in Los Altos Hills
Average Family Size in Los Altos Hills is 2.9 People.
What is the Average Household Size in Los Altos Hills
Average Household Size in Los Altos Hills is 2.7 People.
How Large is the Labor Force in Los Altos Hills?
There are 3,846 People in the Labor Forcein in Los Altos Hills.
What is the Percentage of People in the Labor Force in Los Altos Hills?
53.8% of People are in the Labor Force in Los Altos Hills.
What is the Unemployment Rate in Los Altos Hills?
Unemployment Rate in Los Altos Hills is 2.8%.