Peters, CA Map & Demographics
Peters Map
Peters Overview
$55,264
PER CAPITA INCOME
$143,594
AVG FAMILY INCOME
$118,942
AVG HOUSEHOLD INCOME
22.6%
WAGE / INCOME GAP [ % ]
77.4¢/ $1
WAGE / INCOME GAP [ $ ]
0.37
INEQUALITY / GINI INDEX
309
TOTAL POPULATION
158
MALE POPULATION
151
FEMALE POPULATION
104.64
MALES / 100 FEMALES
95.57
FEMALES / 100 MALES
63.8
MEDIAN AGE
2.3
AVG FAMILY SIZE
2.1
AVG HOUSEHOLD SIZE
122
LABOR FORCE [ PEOPLE ]
41.6%
PERCENT IN LABOR FORCE
Income in Peters
Income Overview in Peters
Per Capita Income in Peters is $55,264, while median incomes of families and households are $143,594 and $118,942 respectively.
| Characteristic | Number | Measure |
| Per Capita Income | 309 | $55,264 |
| Median Family Income | 117 | $143,594 |
| Mean Family Income | 117 | $129,279 |
| Median Household Income | 149 | $118,942 |
| Mean Household Income | 149 | $107,021 |
| Income Deficit | 117 | $0 |
| Wage / Income Gap (%) | 309 | 22.59% |
| Wage / Income Gap ($) | 309 | 77.41¢ per $1 |
| Gini / Inequality Index | 309 | 0.37 |
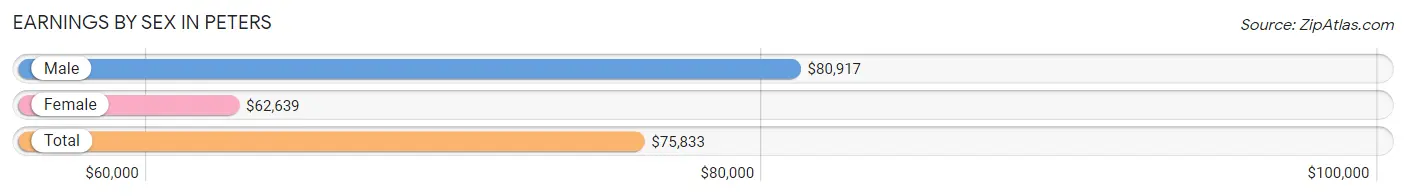
Earnings by Sex in Peters
Average Earnings in Peters are $75,833, $80,917 for men and $62,639 for women, a difference of 22.6%.
| Sex | Number | Average Earnings |
| Male | 79 (50.6%) | $80,917 |
| Female | 77 (49.4%) | $62,639 |
| Total | 156 (100.0%) | $75,833 |
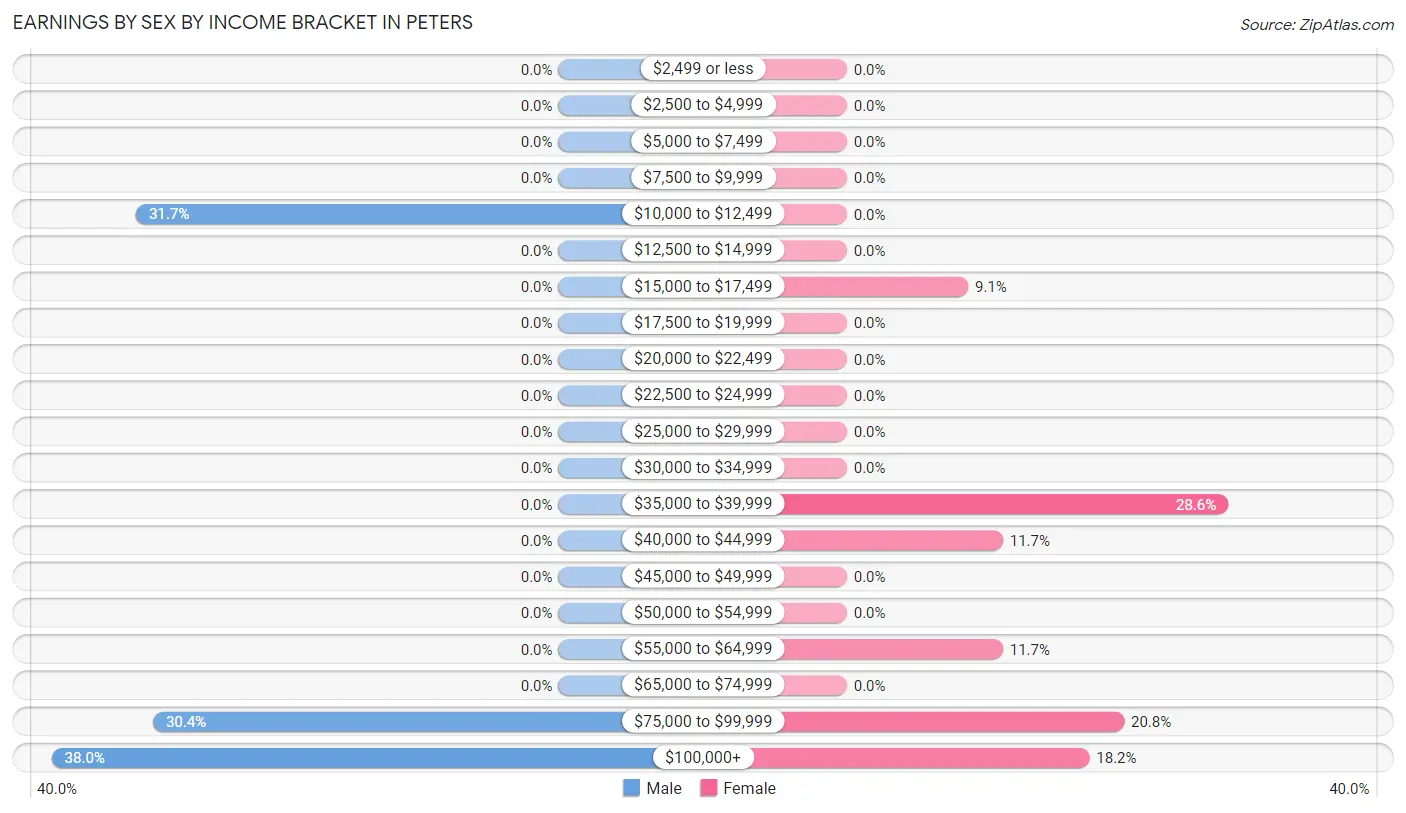
Earnings by Sex by Income Bracket in Peters
The most common earnings brackets in Peters are $100,000+ for men (30 | 38.0%) and $35,000 to $39,999 for women (22 | 28.6%).
| Income | Male | Female |
| $2,499 or less | 0 (0.0%) | 0 (0.0%) |
| $2,500 to $4,999 | 0 (0.0%) | 0 (0.0%) |
| $5,000 to $7,499 | 0 (0.0%) | 0 (0.0%) |
| $7,500 to $9,999 | 0 (0.0%) | 0 (0.0%) |
| $10,000 to $12,499 | 25 (31.7%) | 0 (0.0%) |
| $12,500 to $14,999 | 0 (0.0%) | 0 (0.0%) |
| $15,000 to $17,499 | 0 (0.0%) | 7 (9.1%) |
| $17,500 to $19,999 | 0 (0.0%) | 0 (0.0%) |
| $20,000 to $22,499 | 0 (0.0%) | 0 (0.0%) |
| $22,500 to $24,999 | 0 (0.0%) | 0 (0.0%) |
| $25,000 to $29,999 | 0 (0.0%) | 0 (0.0%) |
| $30,000 to $34,999 | 0 (0.0%) | 0 (0.0%) |
| $35,000 to $39,999 | 0 (0.0%) | 22 (28.6%) |
| $40,000 to $44,999 | 0 (0.0%) | 9 (11.7%) |
| $45,000 to $49,999 | 0 (0.0%) | 0 (0.0%) |
| $50,000 to $54,999 | 0 (0.0%) | 0 (0.0%) |
| $55,000 to $64,999 | 0 (0.0%) | 9 (11.7%) |
| $65,000 to $74,999 | 0 (0.0%) | 0 (0.0%) |
| $75,000 to $99,999 | 24 (30.4%) | 16 (20.8%) |
| $100,000+ | 30 (38.0%) | 14 (18.2%) |
| Total | 79 (100.0%) | 77 (100.0%) |
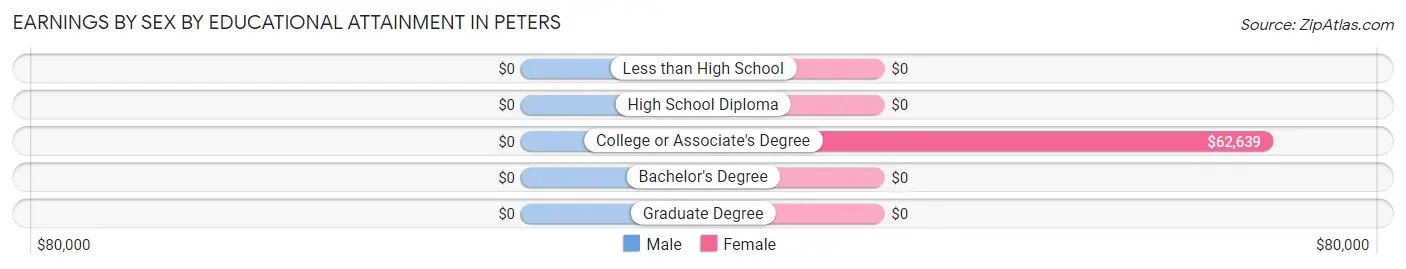
Earnings by Sex by Educational Attainment in Peters
| Educational Attainment | Male Income | Female Income |
| Less than High School | - | - |
| High School Diploma | - | - |
| College or Associate's Degree | - | - |
| Bachelor's Degree | - | - |
| Graduate Degree | - | - |
| Total | $80,917 | $62,639 |
Family Income in Peters
Family Income Brackets in Peters
According to the Peters family income data, there are 47 families falling into the $150,000 to $199,999 income range, which is the most common income bracket and makes up 40.2% of all families.
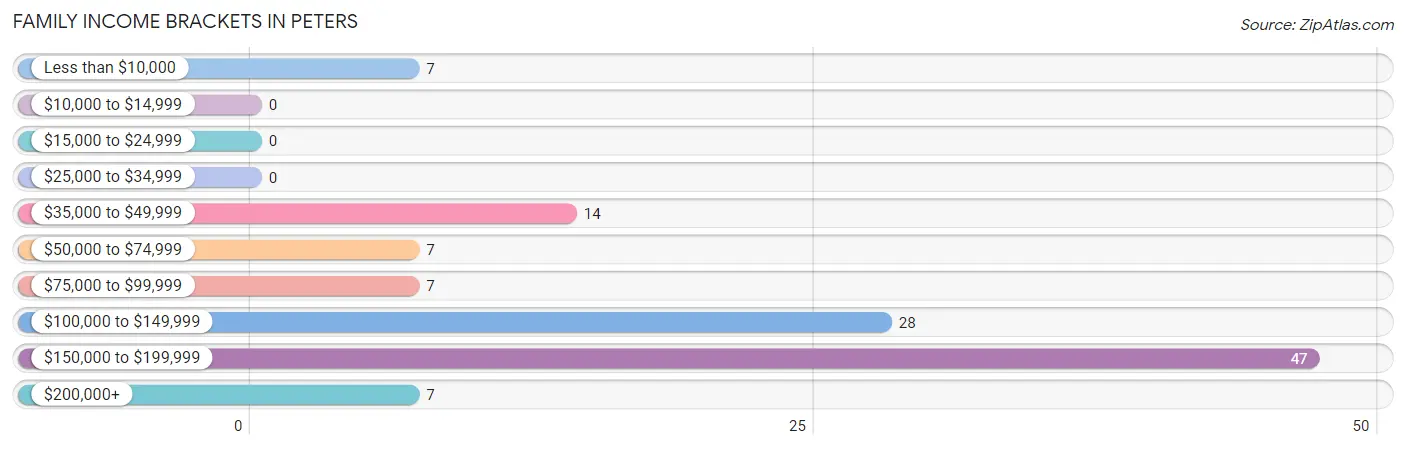
| Income Bracket | # Families | % Families |
| Less than $10,000 | 7 | 6.0% |
| $10,000 to $14,999 | 0 | 0.0% |
| $15,000 to $24,999 | 0 | 0.0% |
| $25,000 to $34,999 | 0 | 0.0% |
| $35,000 to $49,999 | 14 | 12.0% |
| $50,000 to $74,999 | 7 | 6.0% |
| $75,000 to $99,999 | 7 | 6.0% |
| $100,000 to $149,999 | 28 | 23.9% |
| $150,000 to $199,999 | 47 | 40.2% |
| $200,000+ | 7 | 6.0% |
Family Income by Famaliy Size in Peters
2-person families (102 | 87.2%) account for the highest median family income in Peters with $153,333 per family, while 2-person families (102 | 87.2%) have the highest median income of $76,666 per family member.
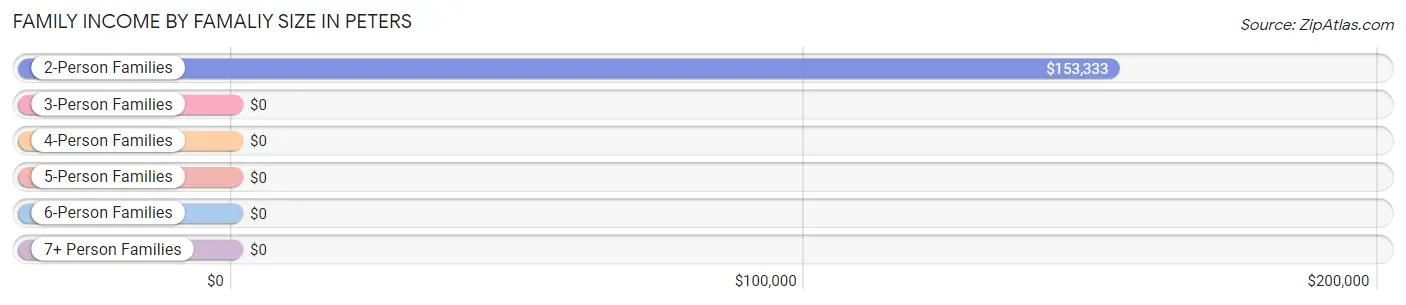
| Income Bracket | # Families | Median Income |
| 2-Person Families | 102 (87.2%) | $153,333 |
| 3-Person Families | 7 (6.0%) | $0 |
| 4-Person Families | 8 (6.8%) | $0 |
| 5-Person Families | 0 (0.0%) | $0 |
| 6-Person Families | 0 (0.0%) | $0 |
| 7+ Person Families | 0 (0.0%) | $0 |
| Total | 117 (100.0%) | $143,594 |
Family Income by Number of Earners in Peters
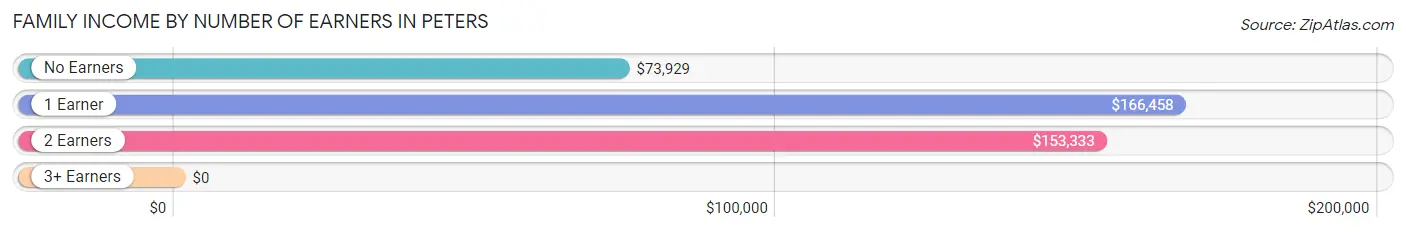
| Number of Earners | # Families | Median Income |
| No Earners | 50 (42.7%) | $73,929 |
| 1 Earner | 19 (16.2%) | $166,458 |
| 2 Earners | 48 (41.0%) | $153,333 |
| 3+ Earners | 0 (0.0%) | $0 |
| Total | 117 (100.0%) | $143,594 |
Household Income in Peters
Household Income Brackets in Peters
With 47 households falling in the category, the $150,000 to $199,999 income range is the most frequent in Peters, accounting for 31.5% of all households.
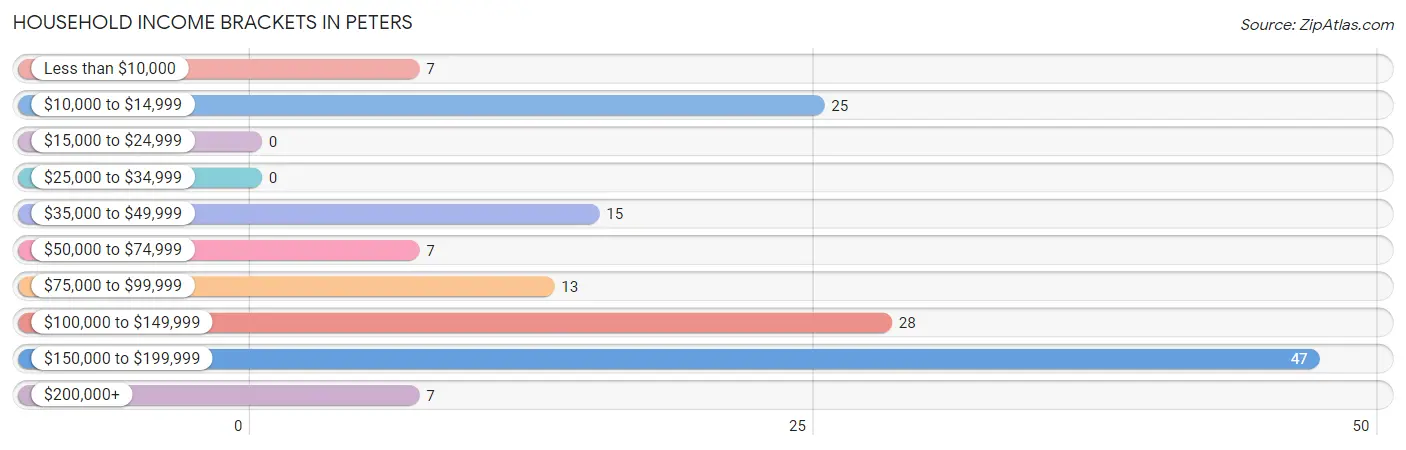
| Income Bracket | # Households | % Households |
| Less than $10,000 | 7 | 4.7% |
| $10,000 to $14,999 | 25 | 16.8% |
| $15,000 to $24,999 | 0 | 0.0% |
| $25,000 to $34,999 | 0 | 0.0% |
| $35,000 to $49,999 | 15 | 10.1% |
| $50,000 to $74,999 | 7 | 4.7% |
| $75,000 to $99,999 | 13 | 8.7% |
| $100,000 to $149,999 | 28 | 18.8% |
| $150,000 to $199,999 | 47 | 31.5% |
| $200,000+ | 7 | 4.7% |
Household Income by Householder Age in Peters
The median household income in Peters is $118,942, with the highest median household income of $175,417 found in the 45 to 64 years age bracket for the primary householder. A total of 47 households (31.5%) fall into this category.
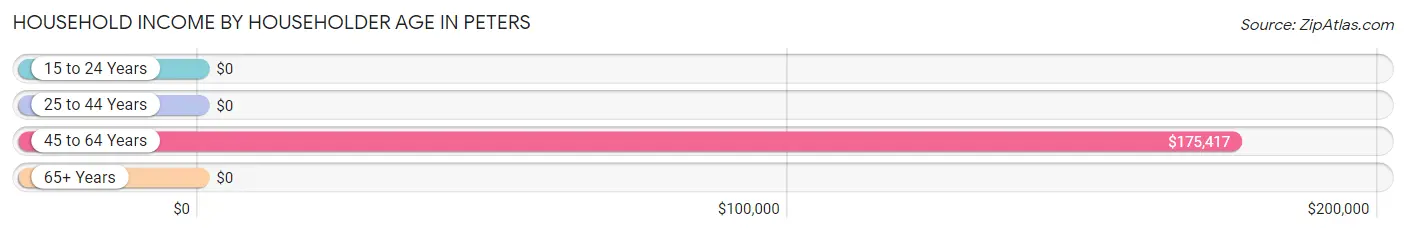
| Income Bracket | # Households | Median Income |
| 15 to 24 Years | 0 (0.0%) | $0 |
| 25 to 44 Years | 21 (14.1%) | $0 |
| 45 to 64 Years | 47 (31.5%) | $175,417 |
| 65+ Years | 81 (54.4%) | $0 |
| Total | 149 (100.0%) | $118,942 |
Poverty in Peters
Income Below Poverty by Sex and Age in Peters
With 20.9% poverty level for males and 4.6% for females among the residents of Peters, 65 to 74 year old males and 65 to 74 year old females are the most vulnerable to poverty, with 25 males (46.3%) and 7 females (14.0%) in their respective age groups living below the poverty level.
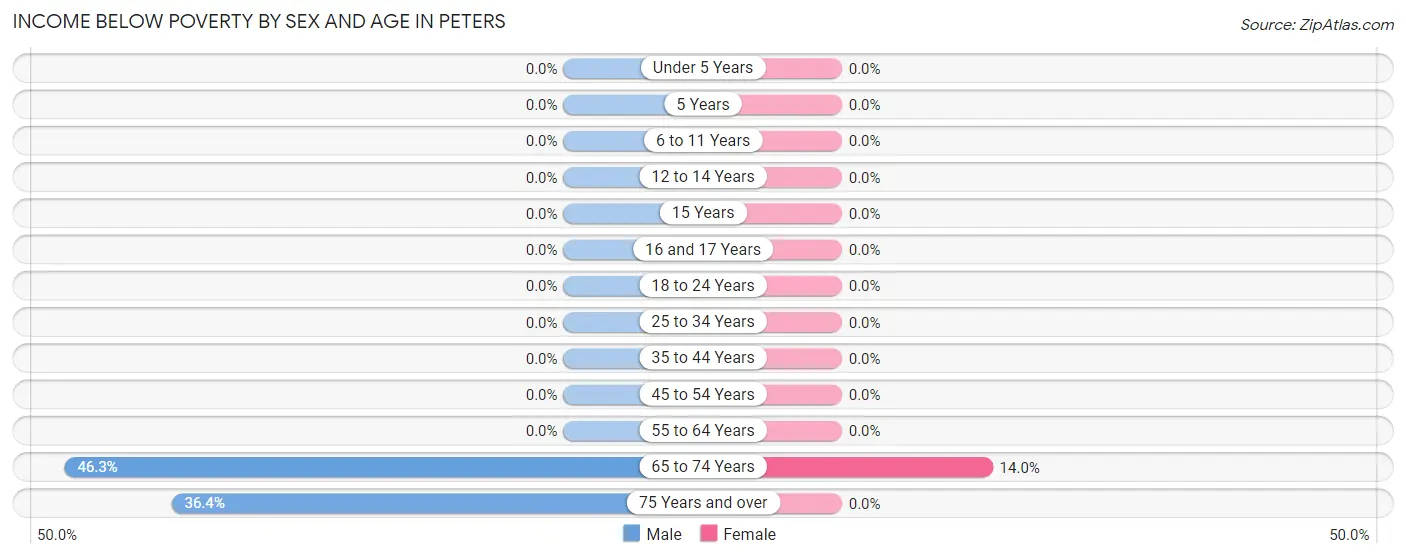
| Age Bracket | Male | Female |
| Under 5 Years | 0 (0.0%) | 0 (0.0%) |
| 5 Years | 0 (0.0%) | 0 (0.0%) |
| 6 to 11 Years | 0 (0.0%) | 0 (0.0%) |
| 12 to 14 Years | 0 (0.0%) | 0 (0.0%) |
| 15 Years | 0 (0.0%) | 0 (0.0%) |
| 16 and 17 Years | 0 (0.0%) | 0 (0.0%) |
| 18 to 24 Years | 0 (0.0%) | 0 (0.0%) |
| 25 to 34 Years | 0 (0.0%) | 0 (0.0%) |
| 35 to 44 Years | 0 (0.0%) | 0 (0.0%) |
| 45 to 54 Years | 0 (0.0%) | 0 (0.0%) |
| 55 to 64 Years | 0 (0.0%) | 0 (0.0%) |
| 65 to 74 Years | 25 (46.3%) | 7 (14.0%) |
| 75 Years and over | 8 (36.4%) | 0 (0.0%) |
| Total | 33 (20.9%) | 7 (4.6%) |
Income Above Poverty by Sex and Age in Peters
According to the poverty statistics in Peters, males aged 12 to 14 years and females aged 6 to 11 years are the age groups that are most secure financially, with 100.0% of males and 100.0% of females in these age groups living above the poverty line.
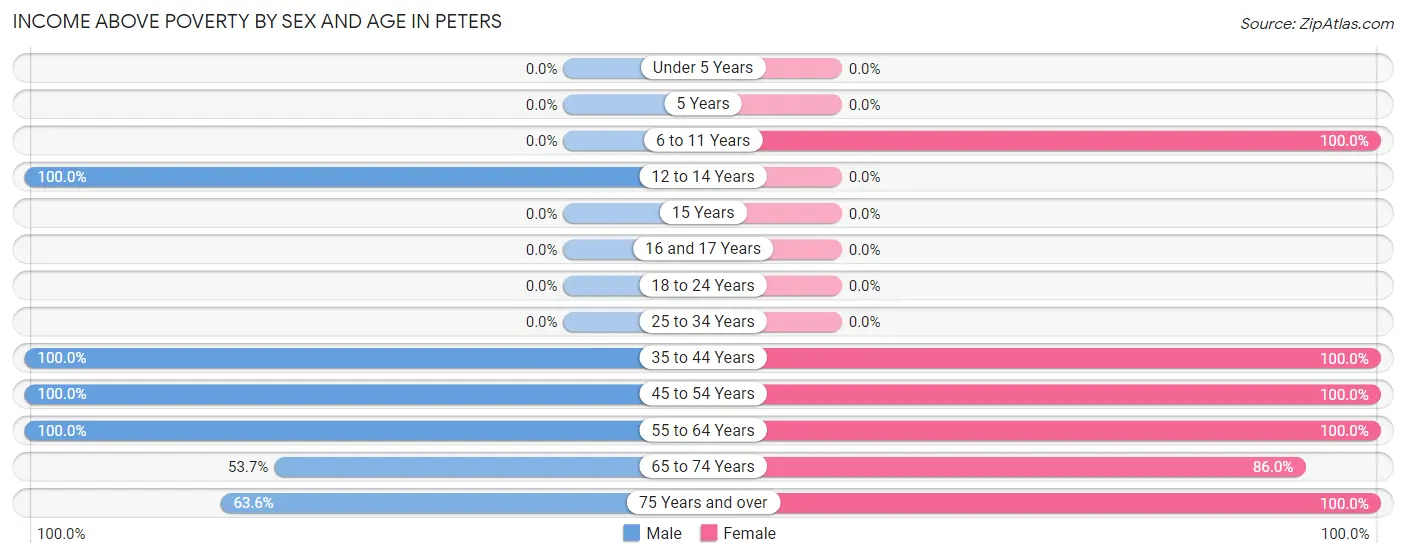
| Age Bracket | Male | Female |
| Under 5 Years | 0 (0.0%) | 0 (0.0%) |
| 5 Years | 0 (0.0%) | 0 (0.0%) |
| 6 to 11 Years | 0 (0.0%) | 8 (100.0%) |
| 12 to 14 Years | 8 (100.0%) | 0 (0.0%) |
| 15 Years | 0 (0.0%) | 0 (0.0%) |
| 16 and 17 Years | 0 (0.0%) | 0 (0.0%) |
| 18 to 24 Years | 0 (0.0%) | 0 (0.0%) |
| 25 to 34 Years | 0 (0.0%) | 0 (0.0%) |
| 35 to 44 Years | 8 (100.0%) | 22 (100.0%) |
| 45 to 54 Years | 15 (100.0%) | 7 (100.0%) |
| 55 to 64 Years | 51 (100.0%) | 49 (100.0%) |
| 65 to 74 Years | 29 (53.7%) | 43 (86.0%) |
| 75 Years and over | 14 (63.6%) | 15 (100.0%) |
| Total | 125 (79.1%) | 144 (95.4%) |
Income Below Poverty Among Married-Couple Families in Peters
The poverty statistics for married-couple families in Peters show that 6.0% or 7 of the total 117 families live below the poverty line. Families with no children have the highest poverty rate of 6.4%, comprising of 7 families. On the other hand, families with 1 or 2 children have the lowest poverty rate of 0.0%, which includes 0 families.
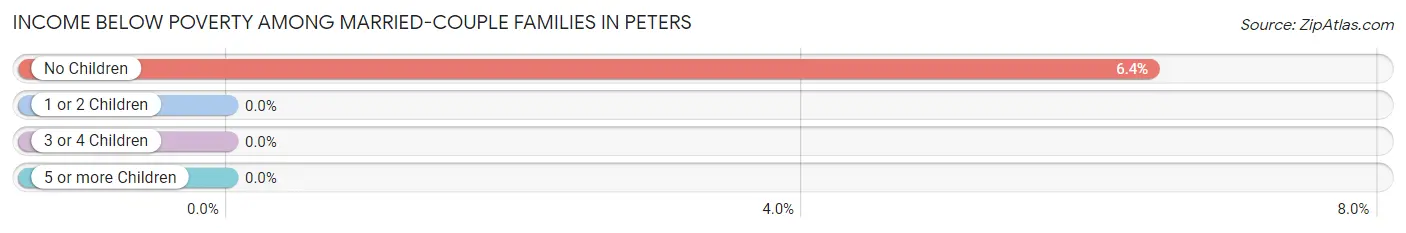
| Children | Above Poverty | Below Poverty |
| No Children | 102 (93.6%) | 7 (6.4%) |
| 1 or 2 Children | 8 (100.0%) | 0 (0.0%) |
| 3 or 4 Children | 0 (0.0%) | 0 (0.0%) |
| 5 or more Children | 0 (0.0%) | 0 (0.0%) |
| Total | 110 (94.0%) | 7 (6.0%) |
Income Below Poverty Among Single-Parent Households in Peters
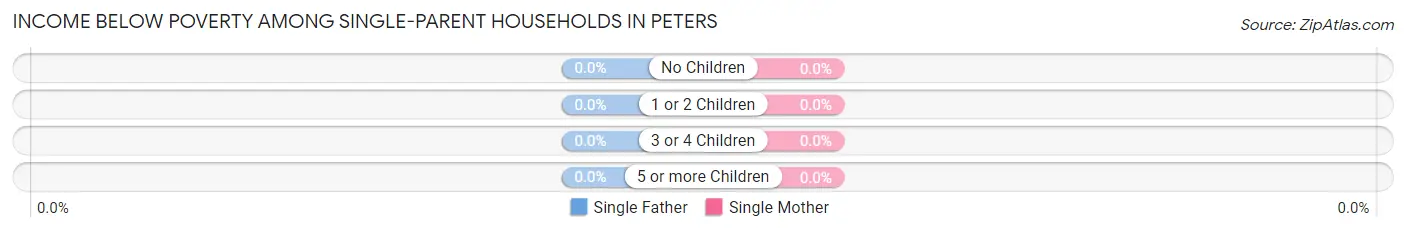
| Children | Single Father | Single Mother |
| No Children | 0 (0.0%) | 0 (0.0%) |
| 1 or 2 Children | 0 (0.0%) | 0 (0.0%) |
| 3 or 4 Children | 0 (0.0%) | 0 (0.0%) |
| 5 or more Children | 0 (0.0%) | 0 (0.0%) |
| Total | 0 (0.0%) | 0 (0.0%) |
Income Below Poverty Among Married-Couple vs Single-Parent Households in Peters
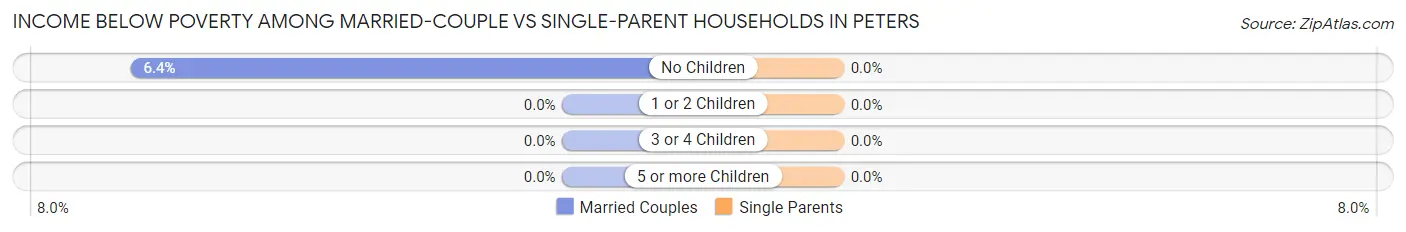
| Children | Married-Couple Families | Single-Parent Households |
| No Children | 7 (6.4%) | 0 (0.0%) |
| 1 or 2 Children | 0 (0.0%) | 0 (0.0%) |
| 3 or 4 Children | 0 (0.0%) | 0 (0.0%) |
| 5 or more Children | 0 (0.0%) | 0 (0.0%) |
| Total | 7 (6.0%) | 0 (0.0%) |
Race in Peters
The most populous races in Peters are White / Caucasian (286 | 92.6%), Hispanic or Latino (24 | 7.8%), and Some other Race (15 | 4.9%).
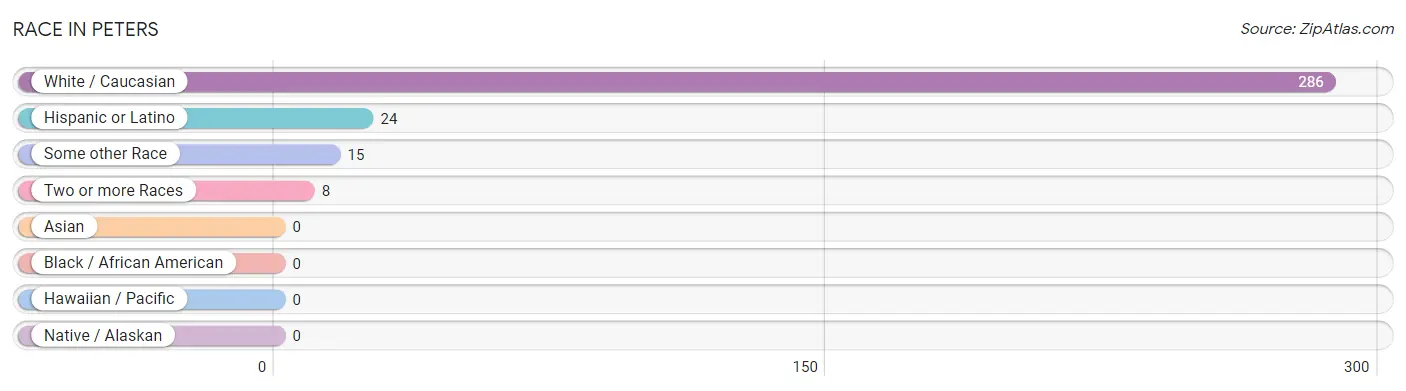
| Race | # Population | % Population |
| Asian | 0 | 0.0% |
| Black / African American | 0 | 0.0% |
| Hawaiian / Pacific | 0 | 0.0% |
| Hispanic or Latino | 24 | 7.8% |
| Native / Alaskan | 0 | 0.0% |
| White / Caucasian | 286 | 92.6% |
| Two or more Races | 8 | 2.6% |
| Some other Race | 15 | 4.9% |
| Total | 309 | 100.0% |
Ancestry in Peters
The most populous ancestries reported in Peters are English (142 | 46.0%), Irish (45 | 14.6%), German (35 | 11.3%), Basque (24 | 7.8%), and Portuguese (19 | 6.1%), together accounting for 85.8% of all Peters residents.
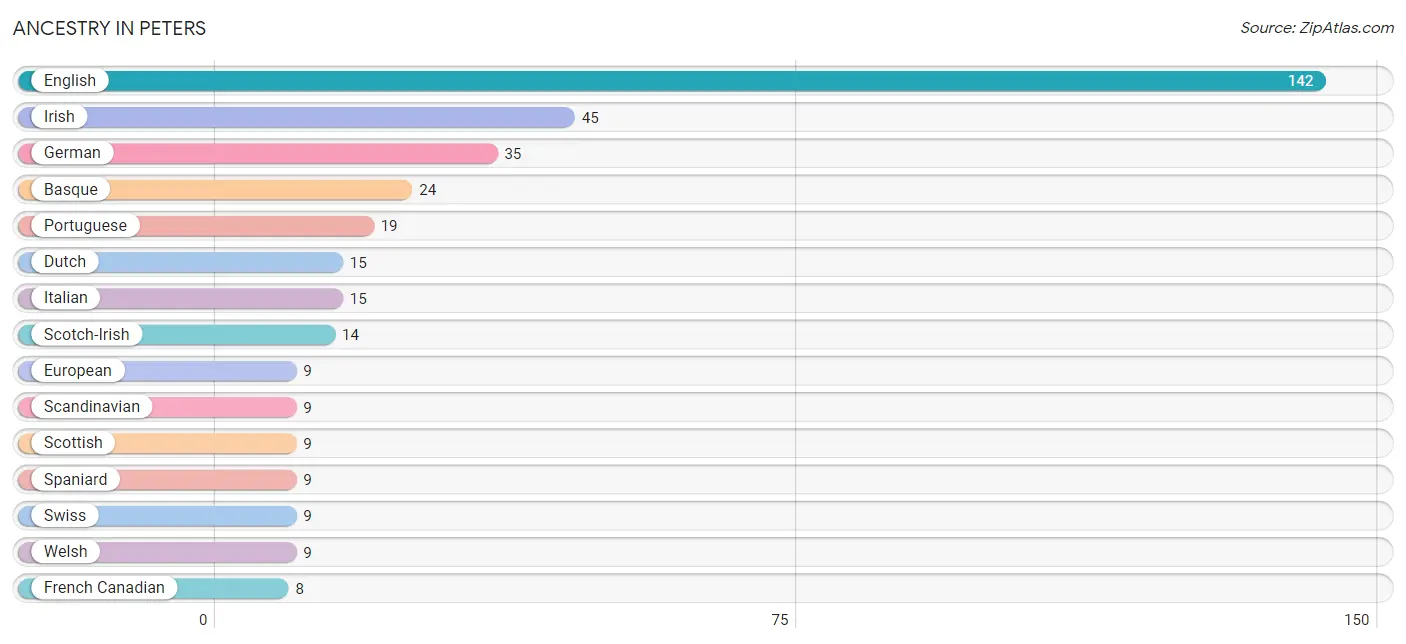
| Ancestry | # Population | % Population |
| American | 7 | 2.3% |
| Basque | 24 | 7.8% |
| Dutch | 15 | 4.9% |
| English | 142 | 46.0% |
| European | 9 | 2.9% |
| French Canadian | 8 | 2.6% |
| German | 35 | 11.3% |
| Irish | 45 | 14.6% |
| Italian | 15 | 4.9% |
| Portuguese | 19 | 6.1% |
| Russian | 7 | 2.3% |
| Scandinavian | 9 | 2.9% |
| Scotch-Irish | 14 | 4.5% |
| Scottish | 9 | 2.9% |
| Spaniard | 9 | 2.9% |
| Swiss | 9 | 2.9% |
| Welsh | 9 | 2.9% | View All 17 Rows |
Immigrants in Peters

| Immigration Origin | # Population | % Population | View All 0 Rows |
Sex and Age in Peters
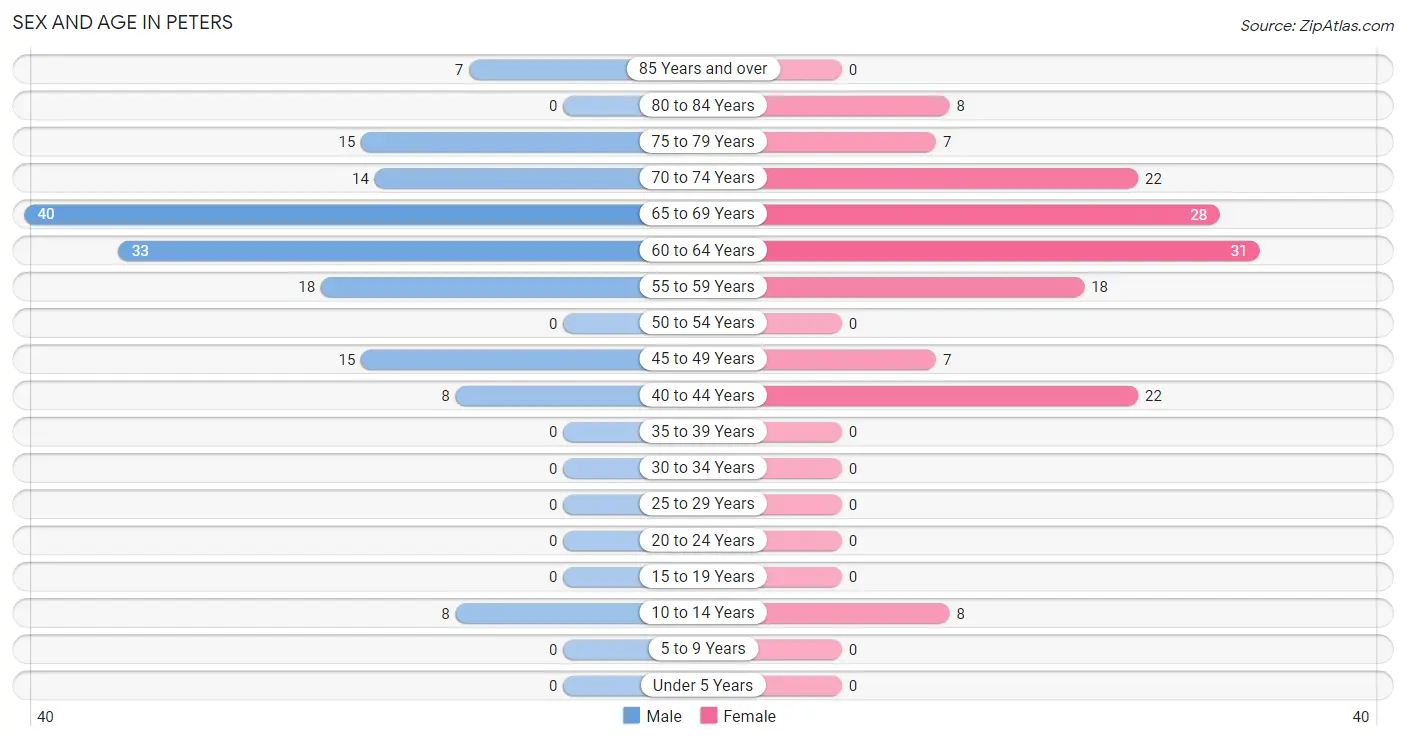
Sex and Age in Peters
The most populous age groups in Peters are 65 to 69 Years (40 | 25.3%) for men and 60 to 64 Years (31 | 20.5%) for women.
| Age Bracket | Male | Female |
| Under 5 Years | 0 (0.0%) | 0 (0.0%) |
| 5 to 9 Years | 0 (0.0%) | 0 (0.0%) |
| 10 to 14 Years | 8 (5.1%) | 8 (5.3%) |
| 15 to 19 Years | 0 (0.0%) | 0 (0.0%) |
| 20 to 24 Years | 0 (0.0%) | 0 (0.0%) |
| 25 to 29 Years | 0 (0.0%) | 0 (0.0%) |
| 30 to 34 Years | 0 (0.0%) | 0 (0.0%) |
| 35 to 39 Years | 0 (0.0%) | 0 (0.0%) |
| 40 to 44 Years | 8 (5.1%) | 22 (14.6%) |
| 45 to 49 Years | 15 (9.5%) | 7 (4.6%) |
| 50 to 54 Years | 0 (0.0%) | 0 (0.0%) |
| 55 to 59 Years | 18 (11.4%) | 18 (11.9%) |
| 60 to 64 Years | 33 (20.9%) | 31 (20.5%) |
| 65 to 69 Years | 40 (25.3%) | 28 (18.5%) |
| 70 to 74 Years | 14 (8.9%) | 22 (14.6%) |
| 75 to 79 Years | 15 (9.5%) | 7 (4.6%) |
| 80 to 84 Years | 0 (0.0%) | 8 (5.3%) |
| 85 Years and over | 7 (4.4%) | 0 (0.0%) |
| Total | 158 (100.0%) | 151 (100.0%) |
Families and Households in Peters
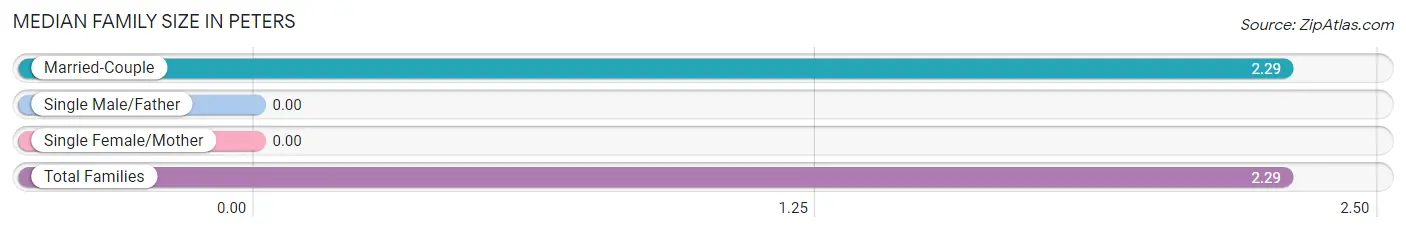
Median Family Size in Peters
| Family Type | # Families | Family Size |
| Married-Couple | 117 (100.0%) | 2.29 |
| Single Male/Father | 0 (0.0%) | - |
| Single Female/Mother | 0 (0.0%) | - |
| Total Families | 117 (100.0%) | 2.29 |
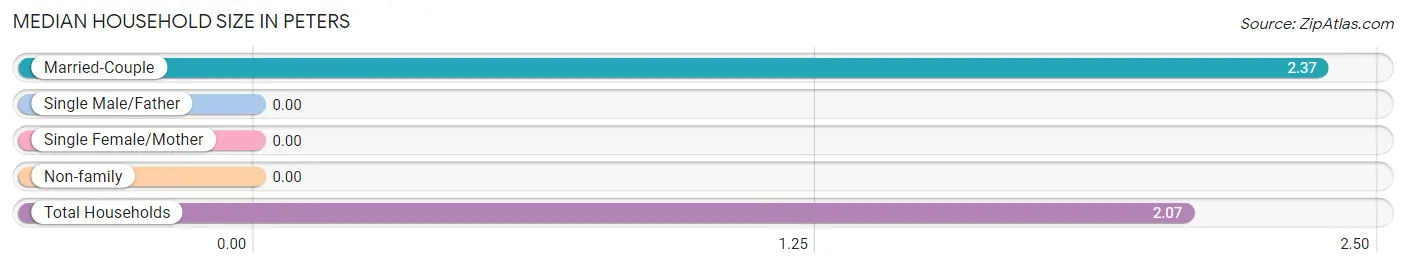
Median Household Size in Peters
| Household Type | # Households | Household Size |
| Married-Couple | 117 (78.5%) | 2.37 |
| Single Male/Father | 0 (0.0%) | - |
| Single Female/Mother | 0 (0.0%) | - |
| Non-family | 32 (21.5%) | - |
| Total Households | 149 (100.0%) | 2.07 |
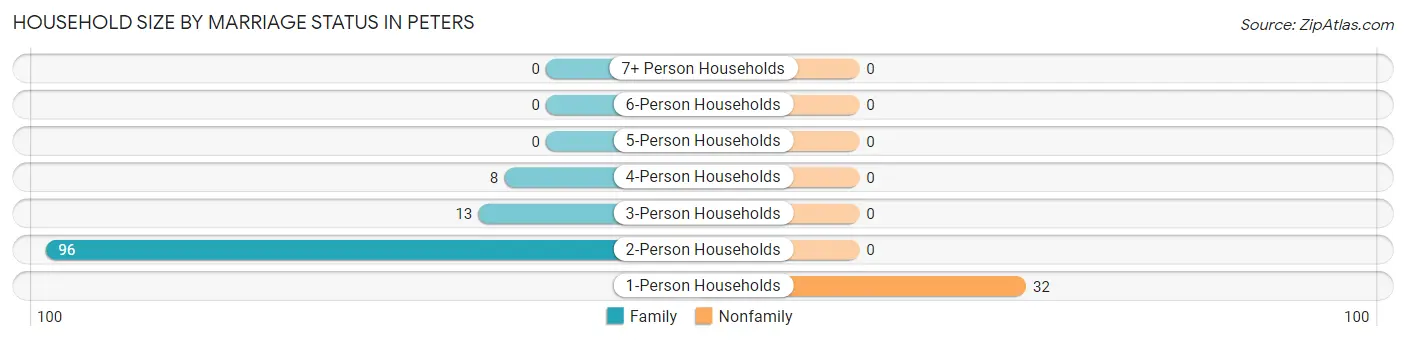
Household Size by Marriage Status in Peters
Out of a total of 149 households in Peters, 117 (78.5%) are family households, while 32 (21.5%) are nonfamily households. The most numerous type of family households are 2-person households, comprising 96, and the most common type of nonfamily households are 1-person households, comprising 32.
| Household Size | Family Households | Nonfamily Households |
| 1-Person Households | - | 32 (21.5%) |
| 2-Person Households | 96 (64.4%) | 0 (0.0%) |
| 3-Person Households | 13 (8.7%) | 0 (0.0%) |
| 4-Person Households | 8 (5.4%) | 0 (0.0%) |
| 5-Person Households | 0 (0.0%) | 0 (0.0%) |
| 6-Person Households | 0 (0.0%) | 0 (0.0%) |
| 7+ Person Households | 0 (0.0%) | 0 (0.0%) |
| Total | 117 (78.5%) | 32 (21.5%) |
Female Fertility in Peters
Fertility by Age in Peters
Average fertility rate in Peters is 241.0 births per 1,000 women. Women in the age bracket of 35 to 50 years have the highest fertility rate with 241.0 births per 1,000 women. Women in the age bracket of 35 to 50 years acount for 100.0% of all women with births.
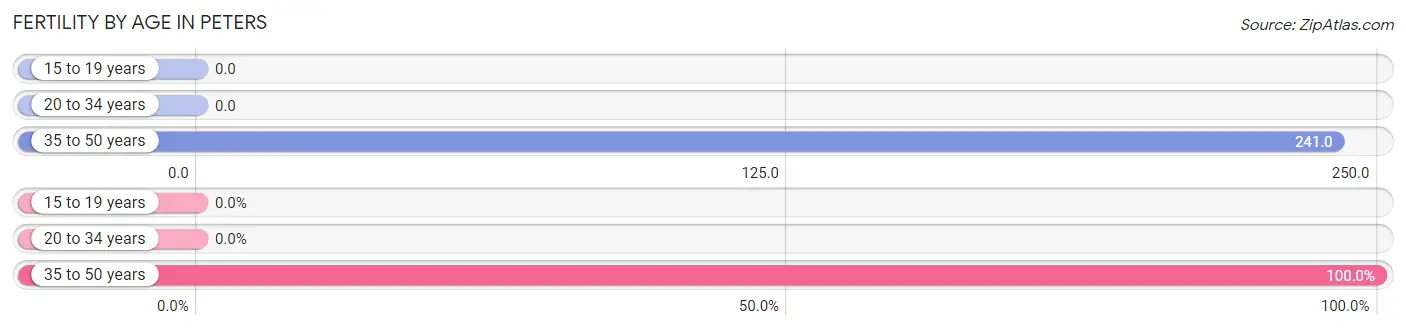
| Age Bracket | Women with Births | Births / 1,000 Women |
| 15 to 19 years | 0 (0.0%) | 0.0 |
| 20 to 34 years | 0 (0.0%) | 0.0 |
| 35 to 50 years | 7 (100.0%) | 241.0 |
| Total | 7 (100.0%) | 241.0 |
Fertility by Age by Marriage Status in Peters
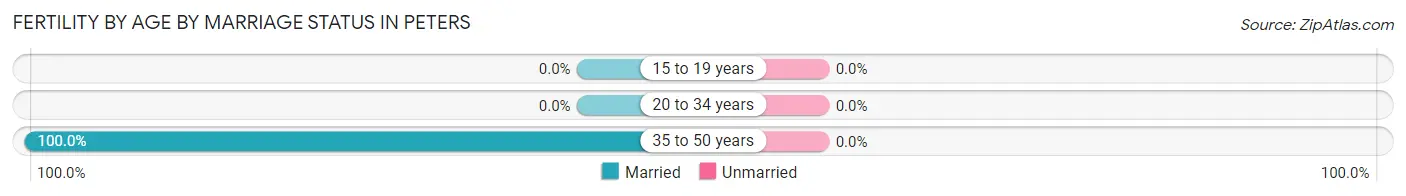
| Age Bracket | Married | Unmarried |
| 15 to 19 years | 0 (0.0%) | 0 (0.0%) |
| 20 to 34 years | 0 (0.0%) | 0 (0.0%) |
| 35 to 50 years | 7 (100.0%) | 0 (0.0%) |
| Total | 7 (100.0%) | 0 (0.0%) |
Fertility by Education in Peters
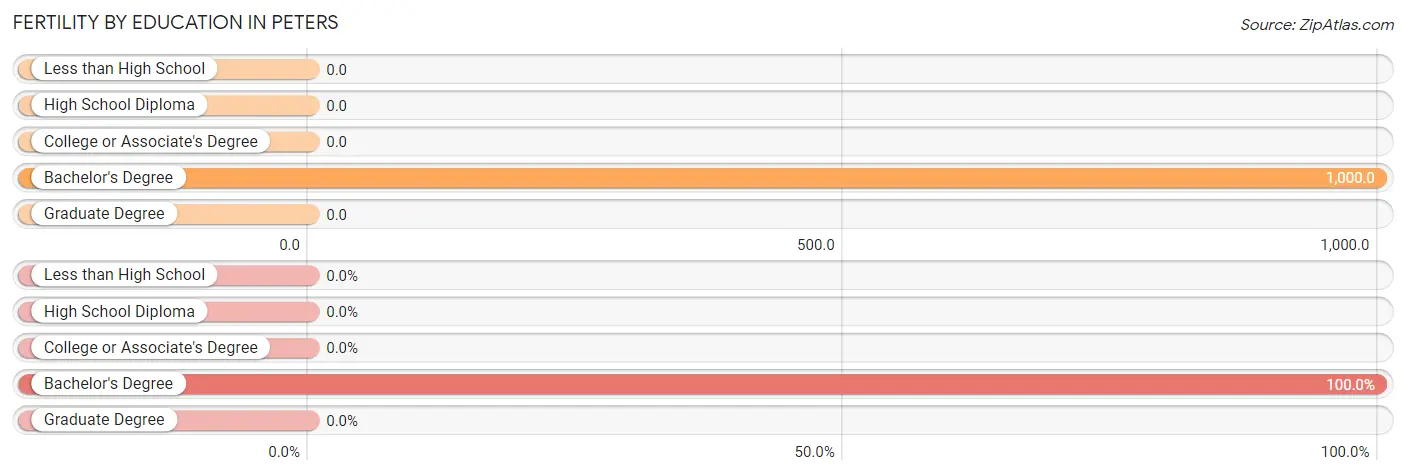
| Educational Attainment | Women with Births | Births / 1,000 Women |
| Less than High School | 0 (0.0%) | 0.0 |
| High School Diploma | 0 (0.0%) | 0.0 |
| College or Associate's Degree | 0 (0.0%) | 0.0 |
| Bachelor's Degree | 7 (100.0%) | 1,000.0 |
| Graduate Degree | 0 (0.0%) | 0.0 |
| Total | 7 (100.0%) | 241.0 |
Fertility by Education by Marriage Status in Peters
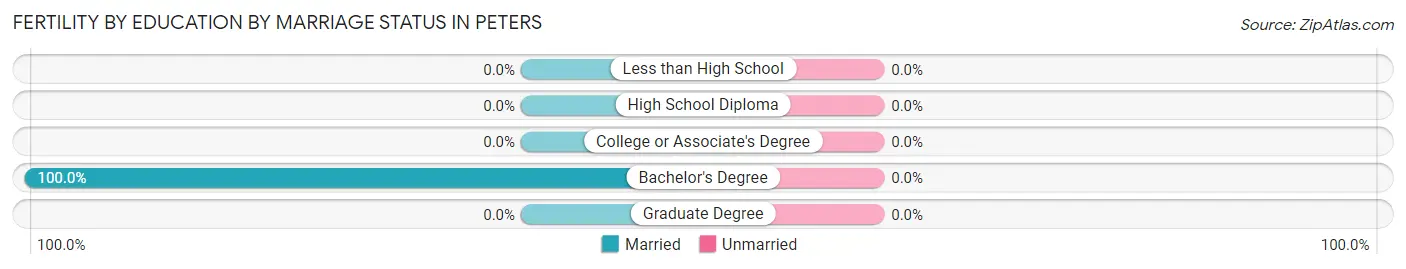
| Educational Attainment | Married | Unmarried |
| Less than High School | 0 (0.0%) | 0 (0.0%) |
| High School Diploma | 0 (0.0%) | 0 (0.0%) |
| College or Associate's Degree | 0 (0.0%) | 0 (0.0%) |
| Bachelor's Degree | 7 (100.0%) | 0 (0.0%) |
| Graduate Degree | 0 (0.0%) | 0 (0.0%) |
| Total | 7 (100.0%) | 0 (0.0%) |
Employment Characteristics in Peters
Employment by Class of Employer in Peters
Among the 113 employed individuals in Peters, private company employees (40 | 35.4%), local government employees (22 | 19.5%), and federal government employees (18 | 15.9%) make up the most common classes of employment.
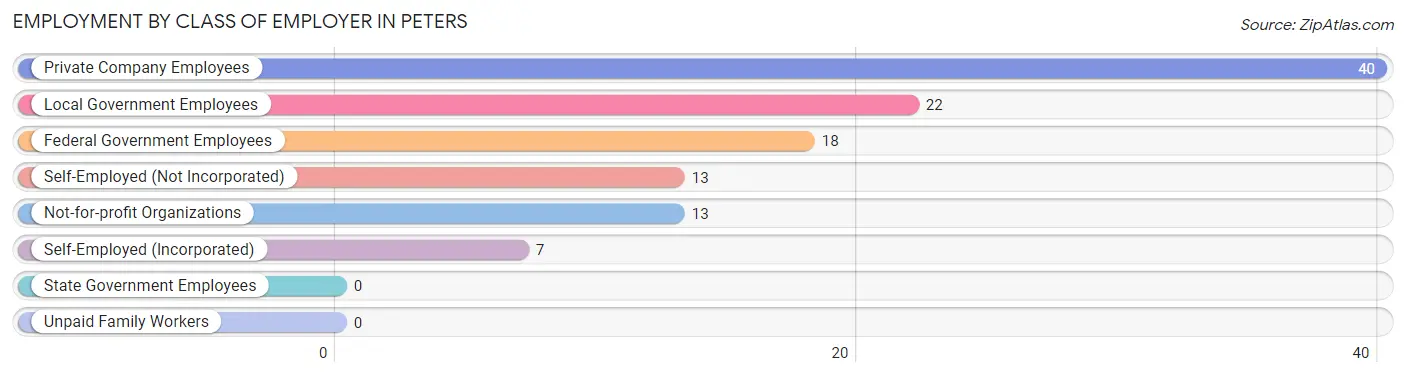
| Employer Class | # Employees | % Employees |
| Private Company Employees | 40 | 35.4% |
| Self-Employed (Incorporated) | 7 | 6.2% |
| Self-Employed (Not Incorporated) | 13 | 11.5% |
| Not-for-profit Organizations | 13 | 11.5% |
| Local Government Employees | 22 | 19.5% |
| State Government Employees | 0 | 0.0% |
| Federal Government Employees | 18 | 15.9% |
| Unpaid Family Workers | 0 | 0.0% |
| Total | 113 | 100.0% |
Employment Status by Age in Peters
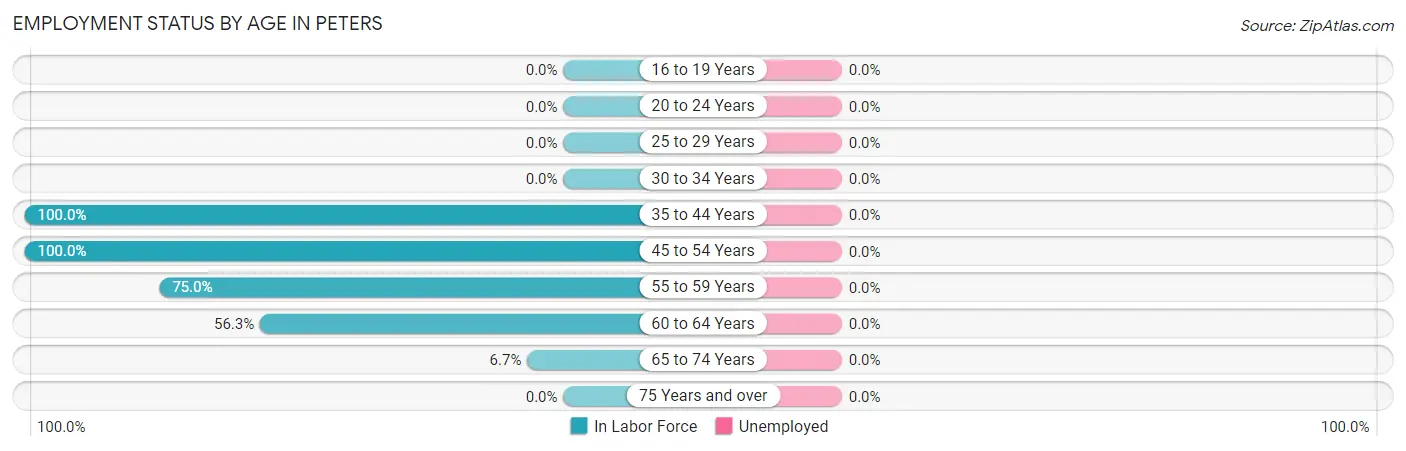
| Age Bracket | In Labor Force | Unemployed |
| 16 to 19 Years | 0 (0.0%) | 0 (0.0%) |
| 20 to 24 Years | 0 (0.0%) | 0 (0.0%) |
| 25 to 29 Years | 0 (0.0%) | 0 (0.0%) |
| 30 to 34 Years | 0 (0.0%) | 0 (0.0%) |
| 35 to 44 Years | 30 (100.0%) | 0 (0.0%) |
| 45 to 54 Years | 22 (100.0%) | 0 (0.0%) |
| 55 to 59 Years | 27 (75.0%) | 0 (0.0%) |
| 60 to 64 Years | 36 (56.3%) | 0 (0.0%) |
| 65 to 74 Years | 7 (6.7%) | 0 (0.0%) |
| 75 Years and over | 0 (0.0%) | 0 (0.0%) |
| Total | 122 (41.6%) | 0 (0.0%) |
Employment Status by Educational Attainment in Peters
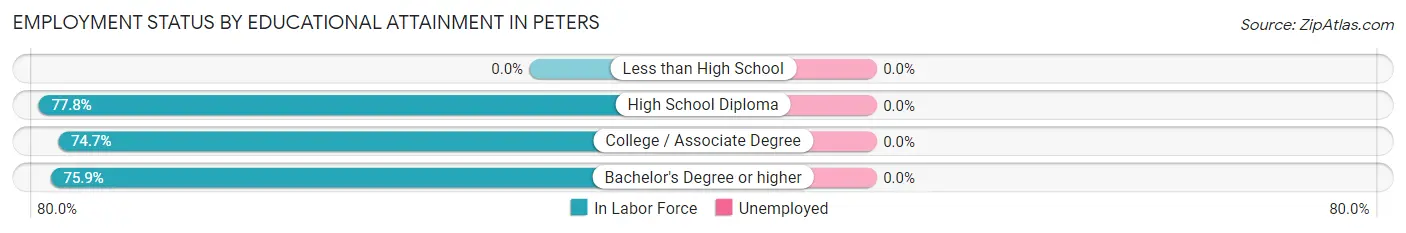
| Educational Attainment | In Labor Force | Unemployed |
| Less than High School | 0 (0.0%) | 0 (0.0%) |
| High School Diploma | 28 (77.8%) | 0 (0.0%) |
| College / Associate Degree | 65 (74.7%) | 0 (0.0%) |
| Bachelor's Degree or higher | 22 (75.9%) | 0 (0.0%) |
| Total | 115 (75.7%) | 0 (0.0%) |
Employment Occupations by Sex in Peters
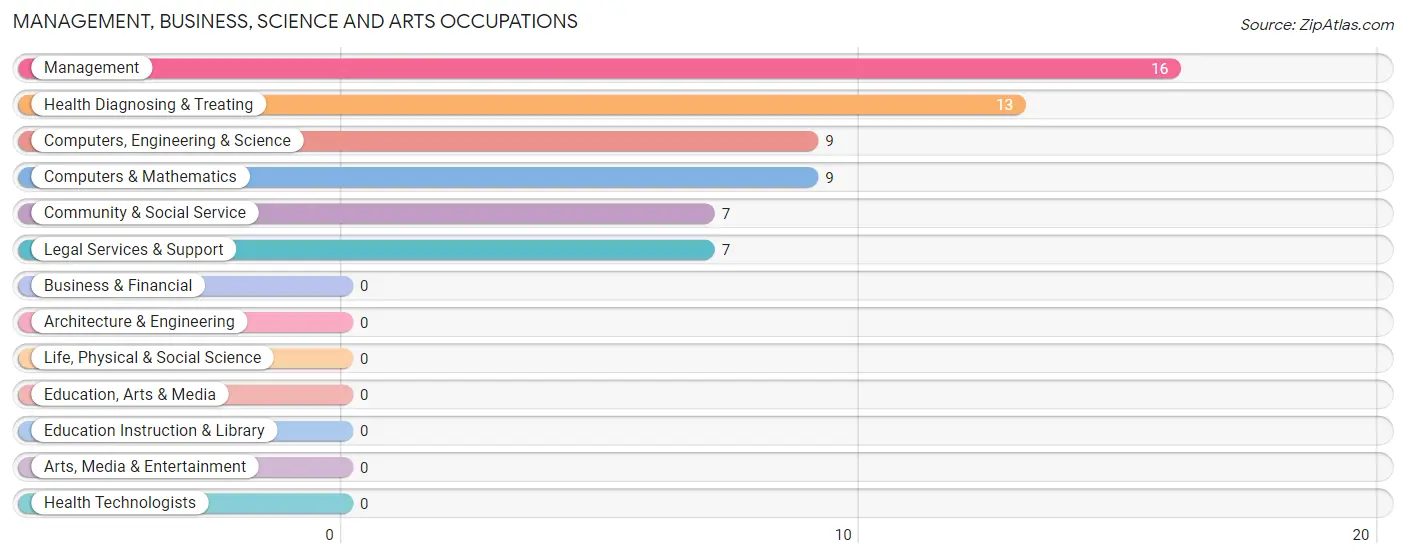
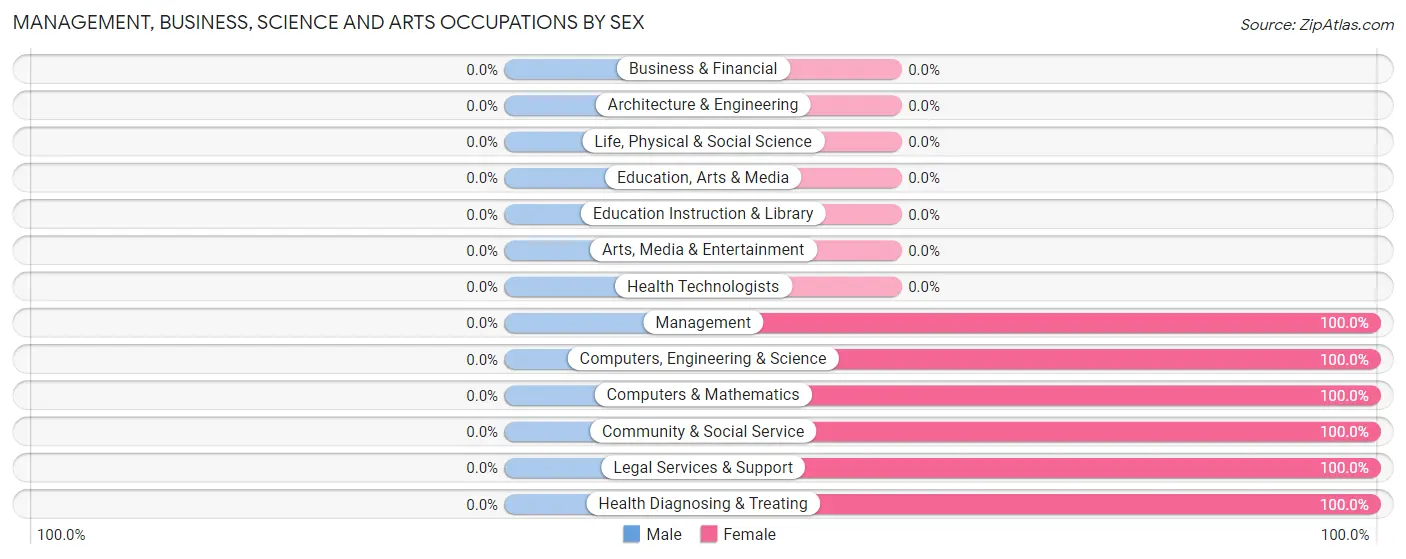
Management, Business, Science and Arts Occupations
The most common Management, Business, Science and Arts occupations in Peters are Management (16 | 13.1%), Health Diagnosing & Treating (13 | 10.7%), Computers, Engineering & Science (9 | 7.4%), Computers & Mathematics (9 | 7.4%), and Community & Social Service (7 | 5.7%).
Management, Business, Science and Arts Occupations by Sex
| Occupation | Male | Female |
| Management | 0 (0.0%) | 16 (100.0%) |
| Business & Financial | 0 (0.0%) | 0 (0.0%) |
| Computers, Engineering & Science | 0 (0.0%) | 9 (100.0%) |
| Computers & Mathematics | 0 (0.0%) | 9 (100.0%) |
| Architecture & Engineering | 0 (0.0%) | 0 (0.0%) |
| Life, Physical & Social Science | 0 (0.0%) | 0 (0.0%) |
| Community & Social Service | 0 (0.0%) | 7 (100.0%) |
| Education, Arts & Media | 0 (0.0%) | 0 (0.0%) |
| Legal Services & Support | 0 (0.0%) | 7 (100.0%) |
| Education Instruction & Library | 0 (0.0%) | 0 (0.0%) |
| Arts, Media & Entertainment | 0 (0.0%) | 0 (0.0%) |
| Health Diagnosing & Treating | 0 (0.0%) | 13 (100.0%) |
| Health Technologists | 0 (0.0%) | 0 (0.0%) |
| Total (Category) | 0 (0.0%) | 45 (100.0%) |
| Total (Overall) | 54 (44.3%) | 68 (55.7%) |
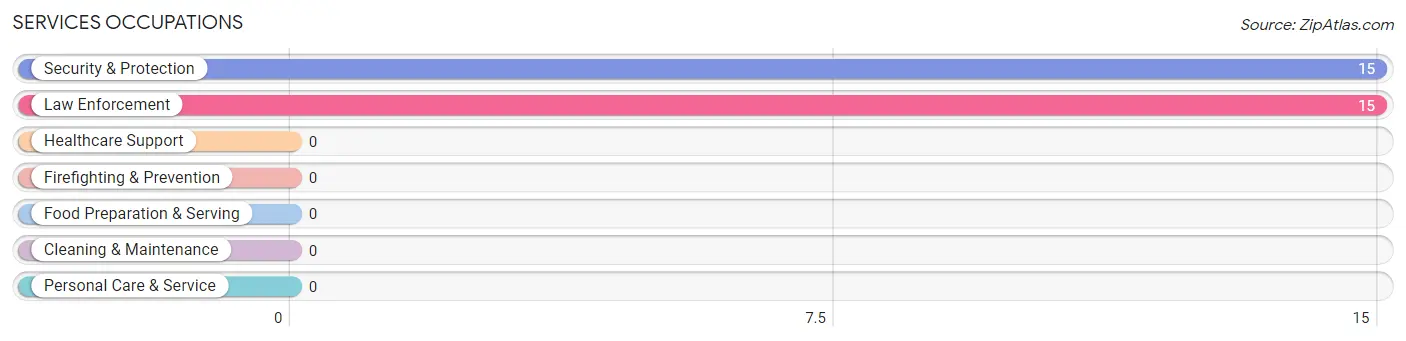
Services Occupations
The most common Services occupations in Peters are Security & Protection (15 | 12.3%), and Law Enforcement (15 | 12.3%).
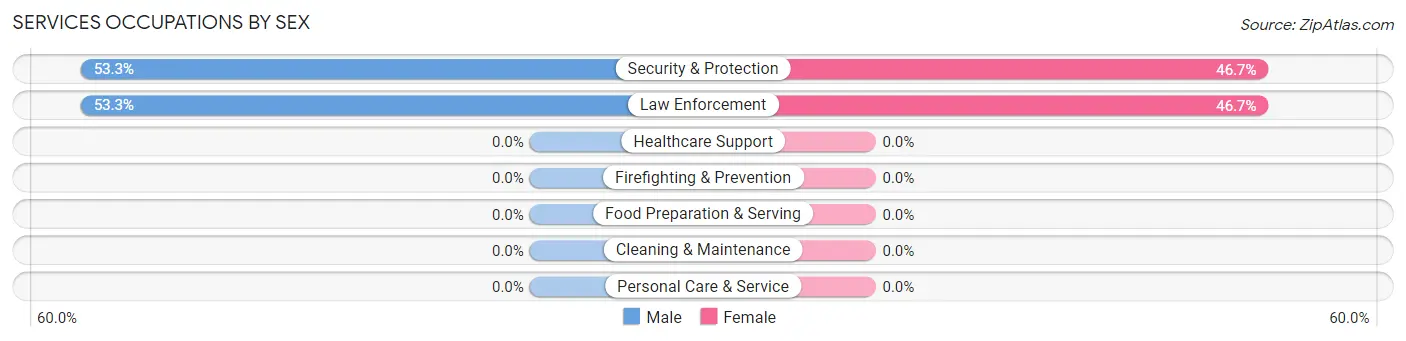
Services Occupations by Sex
Within the Services occupations in Peters, the most male-oriented occupations are Security & Protection (53.3%), and Law Enforcement (53.3%), while the most female-oriented occupations are Security & Protection (46.7%), and Law Enforcement (46.7%).
| Occupation | Male | Female |
| Healthcare Support | 0 (0.0%) | 0 (0.0%) |
| Security & Protection | 8 (53.3%) | 7 (46.7%) |
| Firefighting & Prevention | 0 (0.0%) | 0 (0.0%) |
| Law Enforcement | 8 (53.3%) | 7 (46.7%) |
| Food Preparation & Serving | 0 (0.0%) | 0 (0.0%) |
| Cleaning & Maintenance | 0 (0.0%) | 0 (0.0%) |
| Personal Care & Service | 0 (0.0%) | 0 (0.0%) |
| Total (Category) | 8 (53.3%) | 7 (46.7%) |
| Total (Overall) | 54 (44.3%) | 68 (55.7%) |
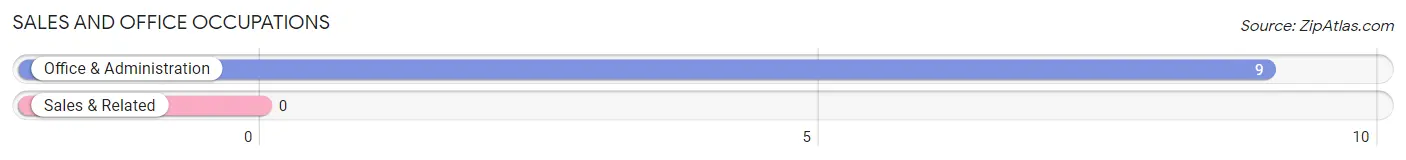
Sales and Office Occupations
The most common Sales and Office occupations in Peters are , and Office & Administration (9 | 7.4%).
Sales and Office Occupations by Sex
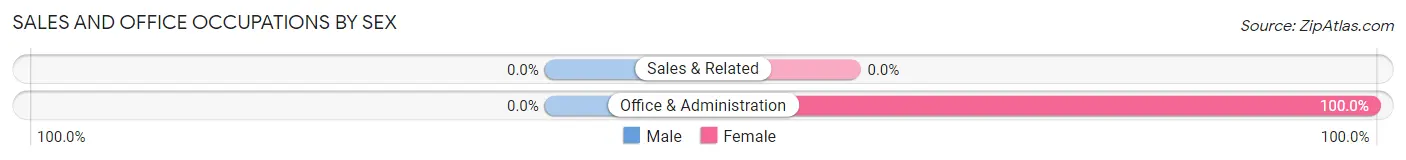
| Occupation | Male | Female |
| Sales & Related | 0 (0.0%) | 0 (0.0%) |
| Office & Administration | 0 (0.0%) | 9 (100.0%) |
| Total (Category) | 0 (0.0%) | 9 (100.0%) |
| Total (Overall) | 54 (44.3%) | 68 (55.7%) |
Natural Resources, Construction and Maintenance Occupations
The most common Natural Resources, Construction and Maintenance occupations in Peters are , and Construction & Extraction (28 | 23.0%).
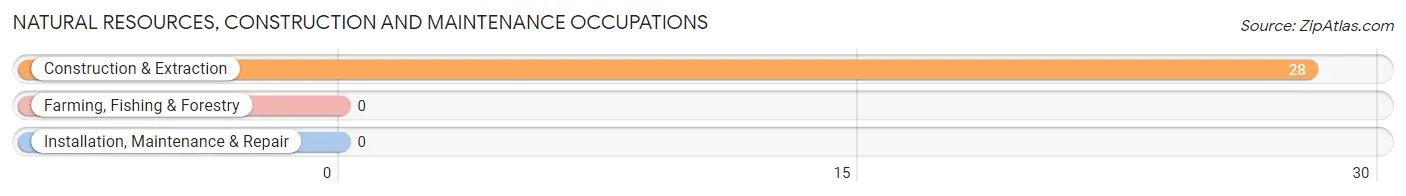
Natural Resources, Construction and Maintenance Occupations by Sex
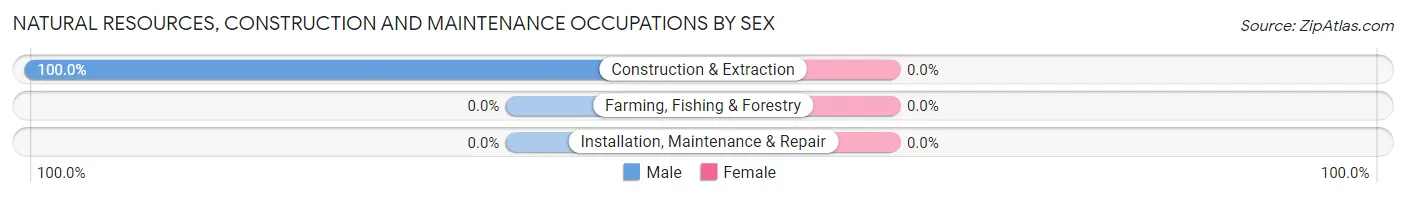
| Occupation | Male | Female |
| Farming, Fishing & Forestry | 0 (0.0%) | 0 (0.0%) |
| Construction & Extraction | 28 (100.0%) | 0 (0.0%) |
| Installation, Maintenance & Repair | 0 (0.0%) | 0 (0.0%) |
| Total (Category) | 28 (100.0%) | 0 (0.0%) |
| Total (Overall) | 54 (44.3%) | 68 (55.7%) |
Production, Transportation and Moving Occupations
The most common Production, Transportation and Moving occupations in Peters are , and Production (25 | 20.5%).
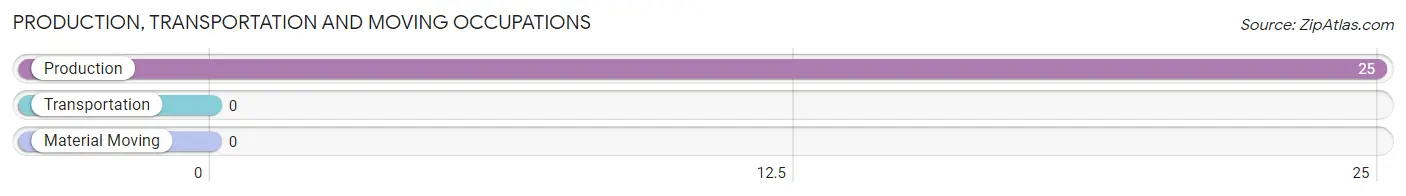
Production, Transportation and Moving Occupations by Sex
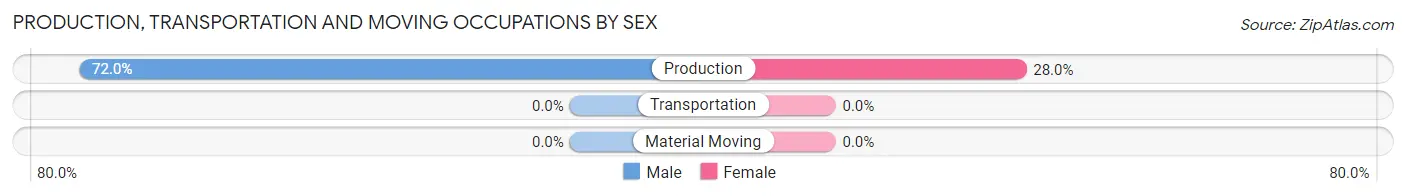
| Occupation | Male | Female |
| Production | 18 (72.0%) | 7 (28.0%) |
| Transportation | 0 (0.0%) | 0 (0.0%) |
| Material Moving | 0 (0.0%) | 0 (0.0%) |
| Total (Category) | 18 (72.0%) | 7 (28.0%) |
| Total (Overall) | 54 (44.3%) | 68 (55.7%) |
Employment Industries by Sex in Peters
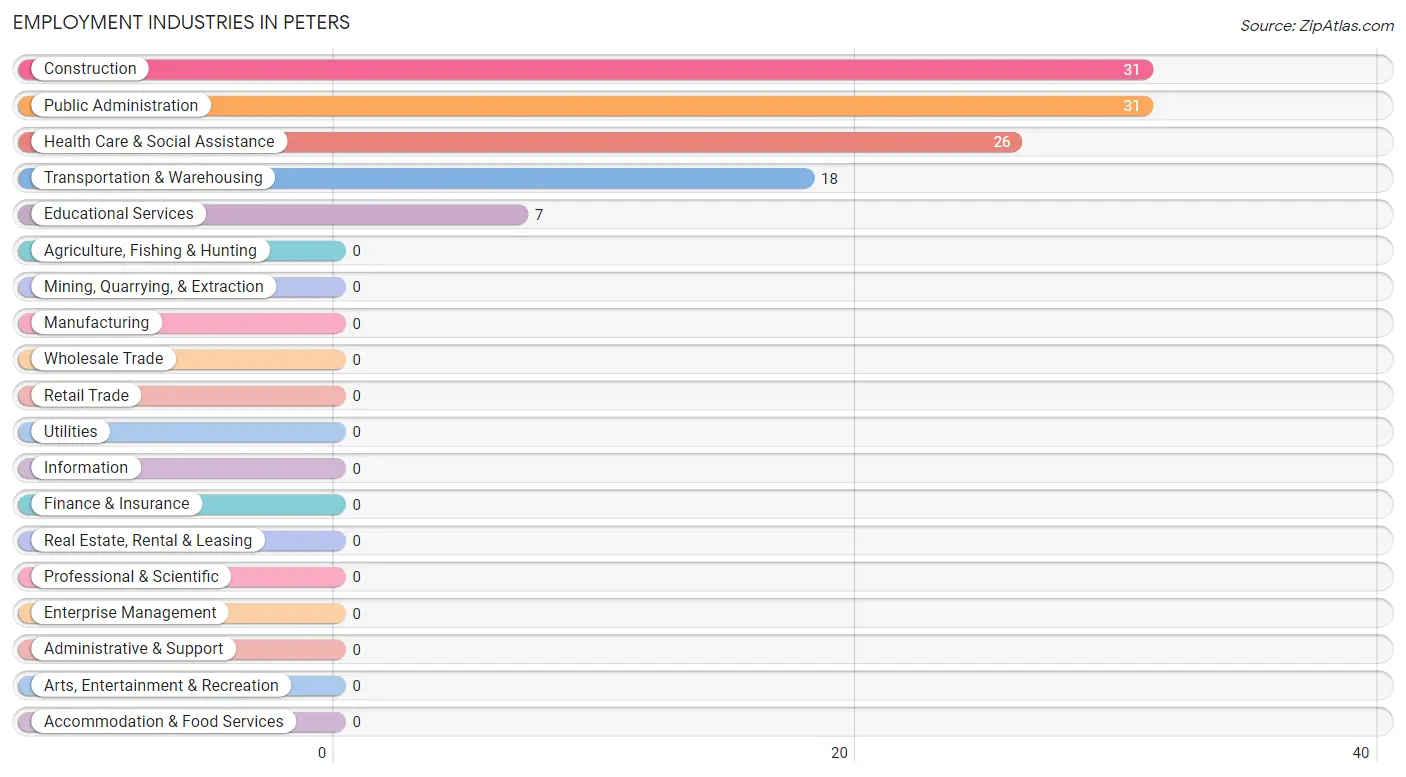
Employment Industries in Peters
The major employment industries in Peters include Construction (31 | 25.4%), Public Administration (31 | 25.4%), Health Care & Social Assistance (26 | 21.3%), Transportation & Warehousing (18 | 14.7%), and Educational Services (7 | 5.7%).
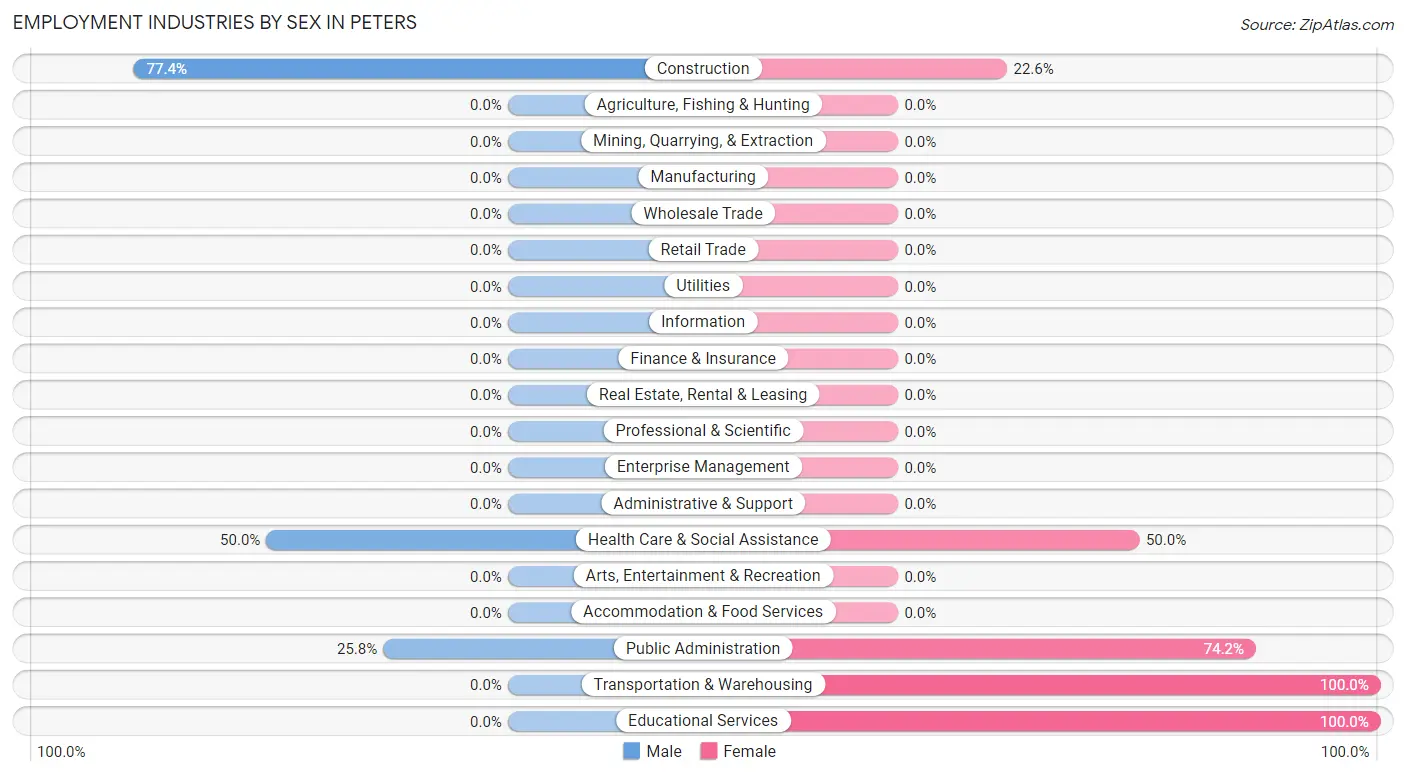
Employment Industries by Sex in Peters
The Peters industries that see more men than women are Construction (77.4%), Health Care & Social Assistance (50.0%), and Public Administration (25.8%), whereas the industries that tend to have a higher number of women are Transportation & Warehousing (100.0%), Educational Services (100.0%), and Public Administration (74.2%).
| Industry | Male | Female |
| Agriculture, Fishing & Hunting | 0 (0.0%) | 0 (0.0%) |
| Mining, Quarrying, & Extraction | 0 (0.0%) | 0 (0.0%) |
| Construction | 24 (77.4%) | 7 (22.6%) |
| Manufacturing | 0 (0.0%) | 0 (0.0%) |
| Wholesale Trade | 0 (0.0%) | 0 (0.0%) |
| Retail Trade | 0 (0.0%) | 0 (0.0%) |
| Transportation & Warehousing | 0 (0.0%) | 18 (100.0%) |
| Utilities | 0 (0.0%) | 0 (0.0%) |
| Information | 0 (0.0%) | 0 (0.0%) |
| Finance & Insurance | 0 (0.0%) | 0 (0.0%) |
| Real Estate, Rental & Leasing | 0 (0.0%) | 0 (0.0%) |
| Professional & Scientific | 0 (0.0%) | 0 (0.0%) |
| Enterprise Management | 0 (0.0%) | 0 (0.0%) |
| Administrative & Support | 0 (0.0%) | 0 (0.0%) |
| Educational Services | 0 (0.0%) | 7 (100.0%) |
| Health Care & Social Assistance | 13 (50.0%) | 13 (50.0%) |
| Arts, Entertainment & Recreation | 0 (0.0%) | 0 (0.0%) |
| Accommodation & Food Services | 0 (0.0%) | 0 (0.0%) |
| Public Administration | 8 (25.8%) | 23 (74.2%) |
| Total | 54 (44.3%) | 68 (55.7%) |
Education in Peters
School Enrollment in Peters
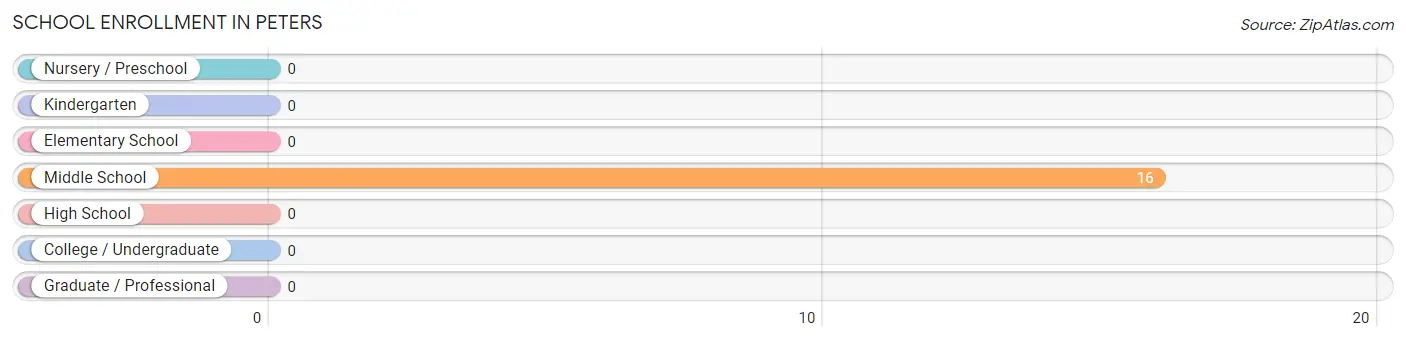
| School Level | # Students | % Students |
| Nursery / Preschool | 0 | 0.0% |
| Kindergarten | 0 | 0.0% |
| Elementary School | 0 | 0.0% |
| Middle School | 16 | 100.0% |
| High School | 0 | 0.0% |
| College / Undergraduate | 0 | 0.0% |
| Graduate / Professional | 0 | 0.0% |
| Total | 16 | 100.0% |
School Enrollment by Age by Funding Source in Peters
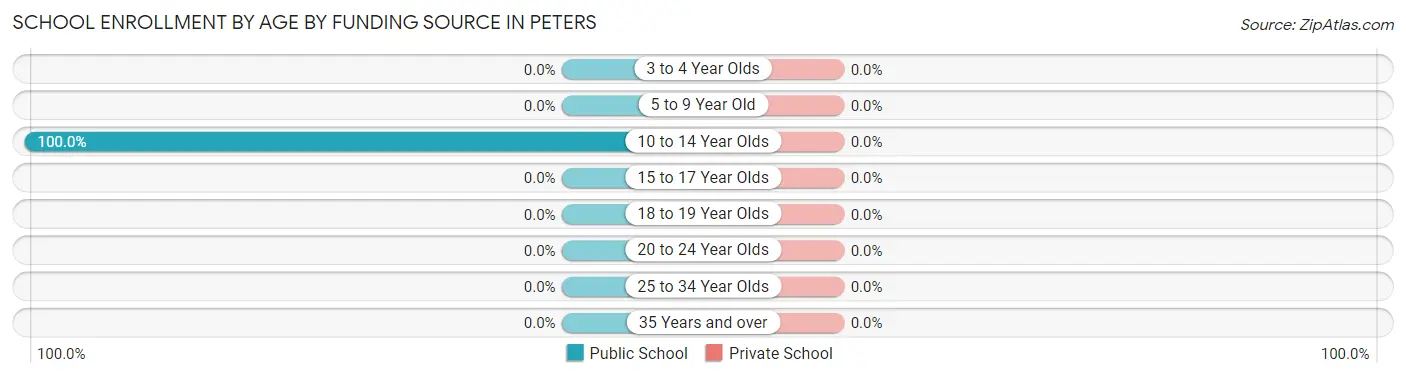
| Age Bracket | Public School | Private School |
| 3 to 4 Year Olds | 0 (0.0%) | 0 (0.0%) |
| 5 to 9 Year Old | 0 (0.0%) | 0 (0.0%) |
| 10 to 14 Year Olds | 16 (100.0%) | 0 (0.0%) |
| 15 to 17 Year Olds | 0 (0.0%) | 0 (0.0%) |
| 18 to 19 Year Olds | 0 (0.0%) | 0 (0.0%) |
| 20 to 24 Year Olds | 0 (0.0%) | 0 (0.0%) |
| 25 to 34 Year Olds | 0 (0.0%) | 0 (0.0%) |
| 35 Years and over | 0 (0.0%) | 0 (0.0%) |
| Total | 16 (100.0%) | 0 (0.0%) |
Educational Attainment by Field of Study in Peters
Arts & humanities (15 | 42.9%), science & technology (7 | 20.0%), business (7 | 20.0%), and bio, nature & agricultural (6 | 17.1%) are the most common fields of study among 35 individuals in Peters who have obtained a bachelor's degree or higher.
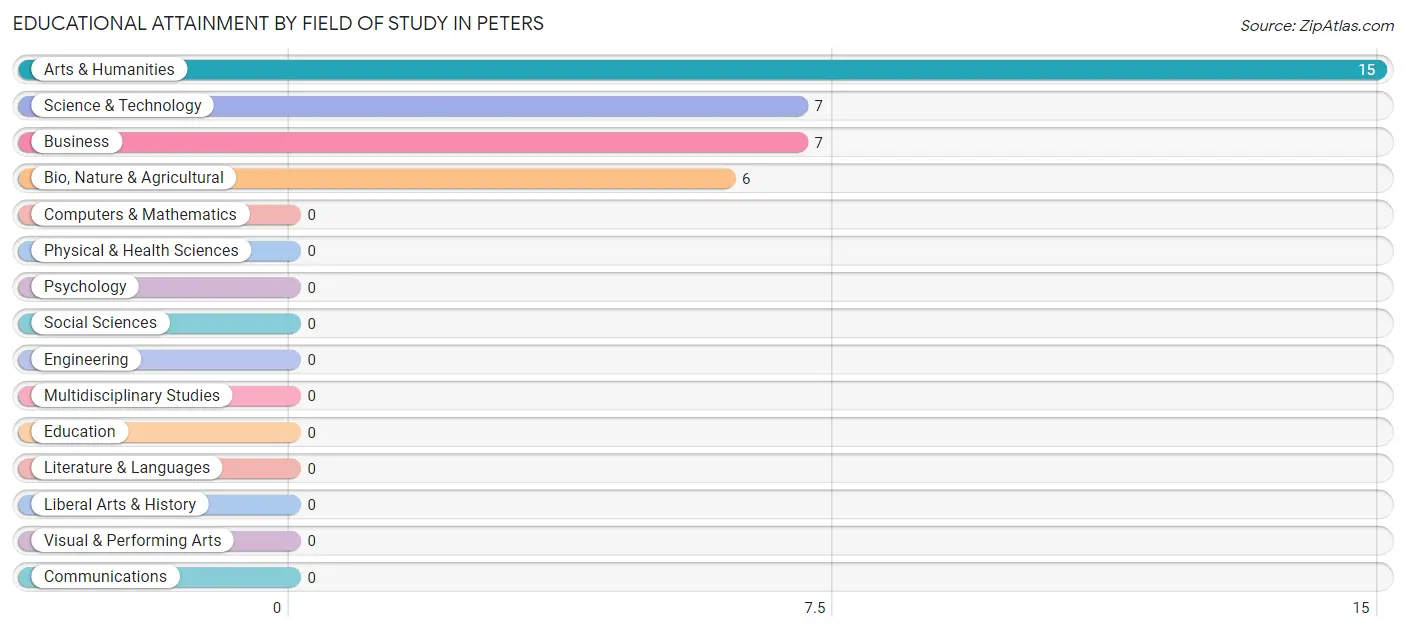
| Field of Study | # Graduates | % Graduates |
| Computers & Mathematics | 0 | 0.0% |
| Bio, Nature & Agricultural | 6 | 17.1% |
| Physical & Health Sciences | 0 | 0.0% |
| Psychology | 0 | 0.0% |
| Social Sciences | 0 | 0.0% |
| Engineering | 0 | 0.0% |
| Multidisciplinary Studies | 0 | 0.0% |
| Science & Technology | 7 | 20.0% |
| Business | 7 | 20.0% |
| Education | 0 | 0.0% |
| Literature & Languages | 0 | 0.0% |
| Liberal Arts & History | 0 | 0.0% |
| Visual & Performing Arts | 0 | 0.0% |
| Communications | 0 | 0.0% |
| Arts & Humanities | 15 | 42.9% |
| Total | 35 | 100.0% |
Transportation & Commute in Peters
Vehicle Availability by Sex in Peters
The most prevalent vehicle ownership categories in Peters are males with 4 vehicles (28, accounting for 51.8%) and females with 4 vehicles (22, making up 47.5%).
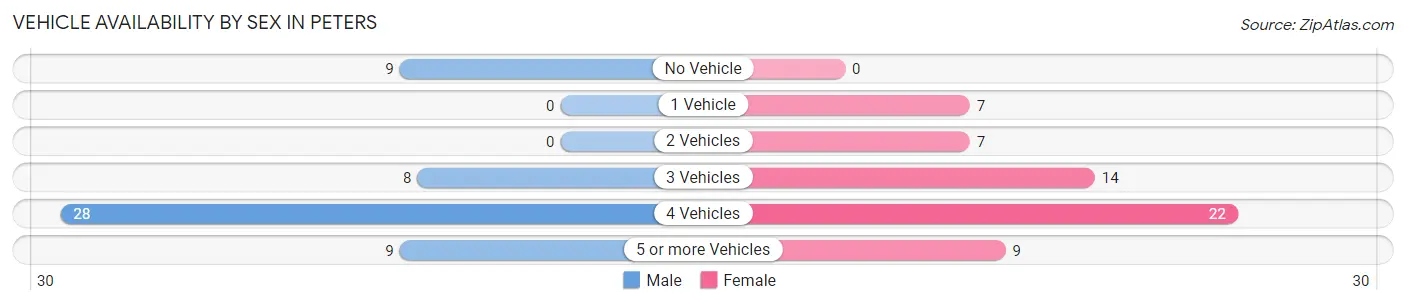
| Vehicles Available | Male | Female |
| No Vehicle | 9 (16.7%) | 0 (0.0%) |
| 1 Vehicle | 0 (0.0%) | 7 (11.9%) |
| 2 Vehicles | 0 (0.0%) | 7 (11.9%) |
| 3 Vehicles | 8 (14.8%) | 14 (23.7%) |
| 4 Vehicles | 28 (51.8%) | 22 (37.3%) |
| 5 or more Vehicles | 9 (16.7%) | 9 (15.2%) |
| Total | 54 (100.0%) | 59 (100.0%) |
Commute Time in Peters
The most frequently occuring commute durations in Peters are 30 to 34 minutes (42 commuters, 37.2%), 25 to 29 minutes (25 commuters, 22.1%), and 20 to 24 minutes (22 commuters, 19.5%).
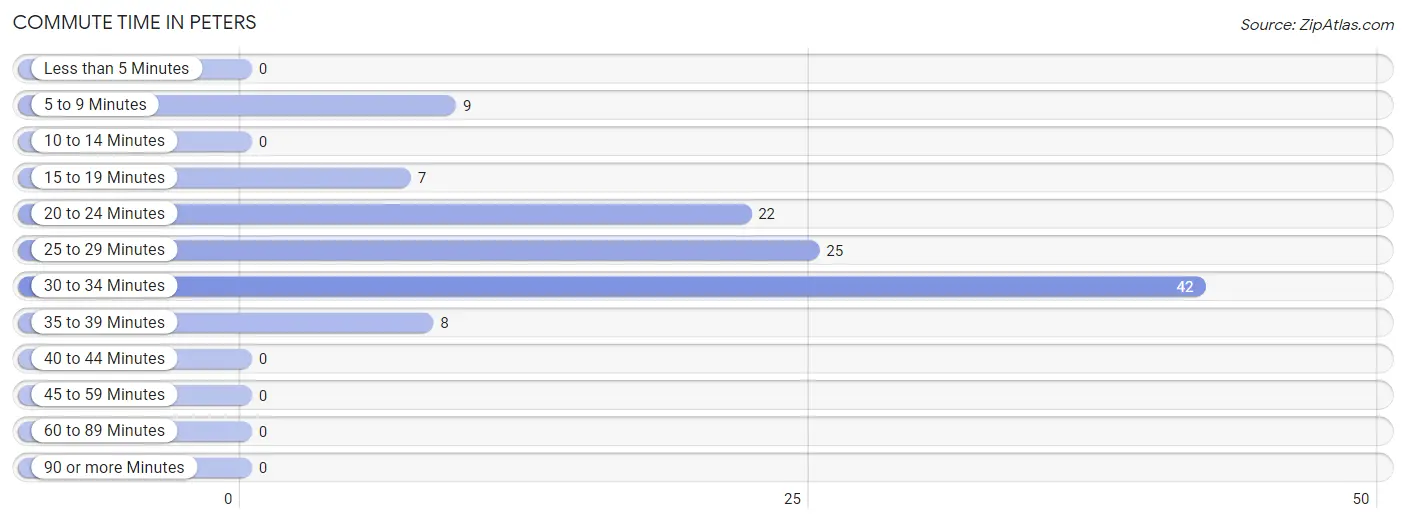
| Commute Time | # Commuters | % Commuters |
| Less than 5 Minutes | 0 | 0.0% |
| 5 to 9 Minutes | 9 | 8.0% |
| 10 to 14 Minutes | 0 | 0.0% |
| 15 to 19 Minutes | 7 | 6.2% |
| 20 to 24 Minutes | 22 | 19.5% |
| 25 to 29 Minutes | 25 | 22.1% |
| 30 to 34 Minutes | 42 | 37.2% |
| 35 to 39 Minutes | 8 | 7.1% |
| 40 to 44 Minutes | 0 | 0.0% |
| 45 to 59 Minutes | 0 | 0.0% |
| 60 to 89 Minutes | 0 | 0.0% |
| 90 or more Minutes | 0 | 0.0% |
Commute Time by Sex in Peters
The most common commute times in Peters are 30 to 34 minutes (22 commuters, 40.7%) for males and 30 to 34 minutes (20 commuters, 33.9%) for females.
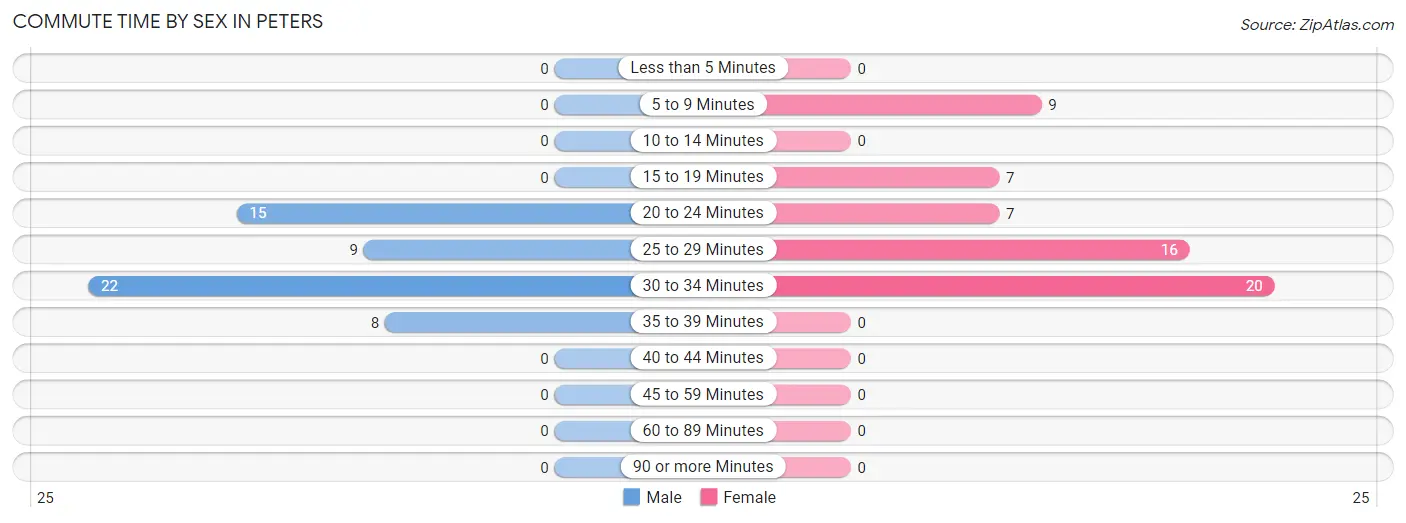
| Commute Time | Male | Female |
| Less than 5 Minutes | 0 (0.0%) | 0 (0.0%) |
| 5 to 9 Minutes | 0 (0.0%) | 9 (15.2%) |
| 10 to 14 Minutes | 0 (0.0%) | 0 (0.0%) |
| 15 to 19 Minutes | 0 (0.0%) | 7 (11.9%) |
| 20 to 24 Minutes | 15 (27.8%) | 7 (11.9%) |
| 25 to 29 Minutes | 9 (16.7%) | 16 (27.1%) |
| 30 to 34 Minutes | 22 (40.7%) | 20 (33.9%) |
| 35 to 39 Minutes | 8 (14.8%) | 0 (0.0%) |
| 40 to 44 Minutes | 0 (0.0%) | 0 (0.0%) |
| 45 to 59 Minutes | 0 (0.0%) | 0 (0.0%) |
| 60 to 89 Minutes | 0 (0.0%) | 0 (0.0%) |
| 90 or more Minutes | 0 (0.0%) | 0 (0.0%) |
Time of Departure to Work by Sex in Peters
The most frequent times of departure to work in Peters are 6:30 AM to 6:59 AM (23, 42.6%) for males and 7:00 AM to 7:29 AM (43, 72.9%) for females.
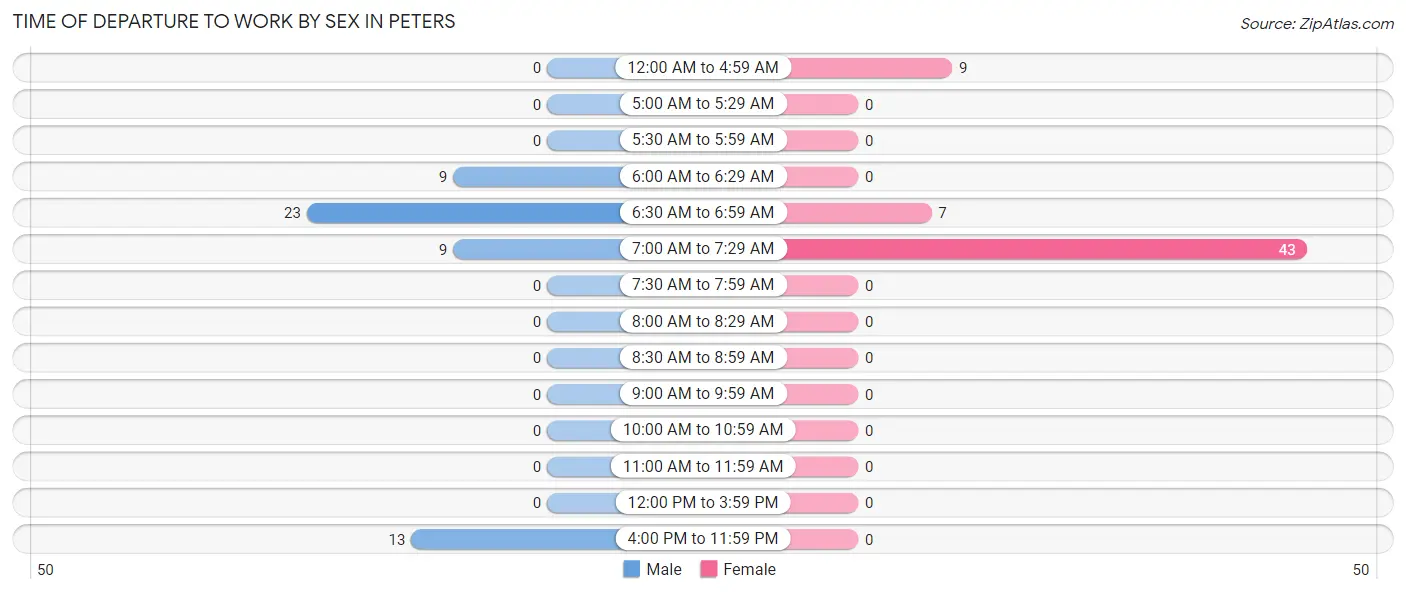
| Time of Departure | Male | Female |
| 12:00 AM to 4:59 AM | 0 (0.0%) | 9 (15.2%) |
| 5:00 AM to 5:29 AM | 0 (0.0%) | 0 (0.0%) |
| 5:30 AM to 5:59 AM | 0 (0.0%) | 0 (0.0%) |
| 6:00 AM to 6:29 AM | 9 (16.7%) | 0 (0.0%) |
| 6:30 AM to 6:59 AM | 23 (42.6%) | 7 (11.9%) |
| 7:00 AM to 7:29 AM | 9 (16.7%) | 43 (72.9%) |
| 7:30 AM to 7:59 AM | 0 (0.0%) | 0 (0.0%) |
| 8:00 AM to 8:29 AM | 0 (0.0%) | 0 (0.0%) |
| 8:30 AM to 8:59 AM | 0 (0.0%) | 0 (0.0%) |
| 9:00 AM to 9:59 AM | 0 (0.0%) | 0 (0.0%) |
| 10:00 AM to 10:59 AM | 0 (0.0%) | 0 (0.0%) |
| 11:00 AM to 11:59 AM | 0 (0.0%) | 0 (0.0%) |
| 12:00 PM to 3:59 PM | 0 (0.0%) | 0 (0.0%) |
| 4:00 PM to 11:59 PM | 13 (24.1%) | 0 (0.0%) |
| Total | 54 (100.0%) | 59 (100.0%) |
Housing Occupancy in Peters
Occupancy by Ownership in Peters
Of the total 149 dwellings in Peters, owner-occupied units account for 140 (94.0%), while renter-occupied units make up 9 (6.0%).
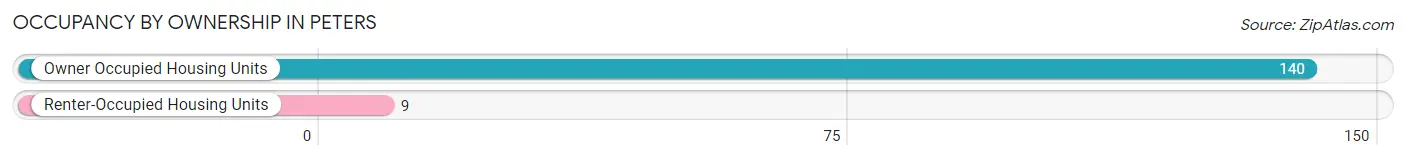
| Occupancy | # Housing Units | % Housing Units |
| Owner Occupied Housing Units | 140 | 94.0% |
| Renter-Occupied Housing Units | 9 | 6.0% |
| Total Occupied Housing Units | 149 | 100.0% |
Occupancy by Household Size in Peters
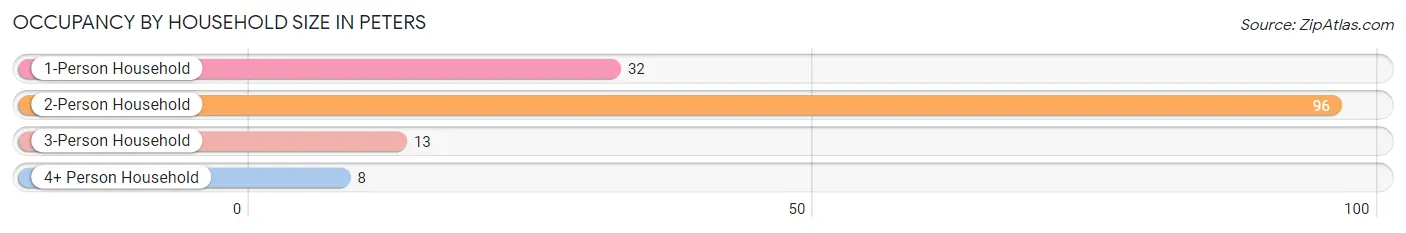
| Household Size | # Housing Units | % Housing Units |
| 1-Person Household | 32 | 21.5% |
| 2-Person Household | 96 | 64.4% |
| 3-Person Household | 13 | 8.7% |
| 4+ Person Household | 8 | 5.4% |
| Total Housing Units | 149 | 100.0% |
Occupancy by Ownership by Household Size in Peters
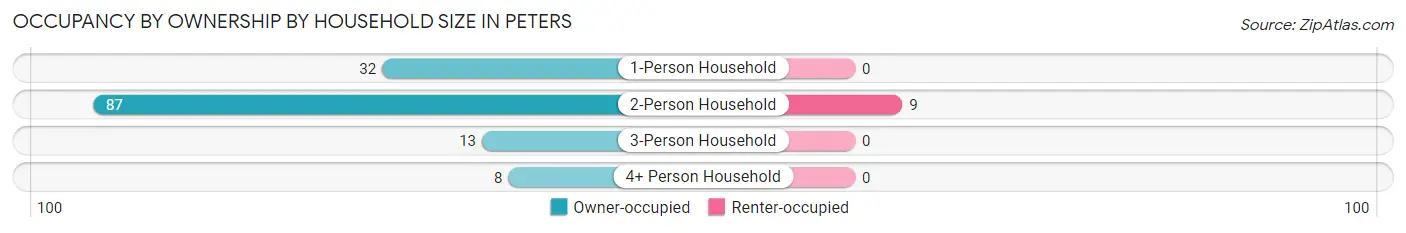
| Household Size | Owner-occupied | Renter-occupied |
| 1-Person Household | 32 (100.0%) | 0 (0.0%) |
| 2-Person Household | 87 (90.6%) | 9 (9.4%) |
| 3-Person Household | 13 (100.0%) | 0 (0.0%) |
| 4+ Person Household | 8 (100.0%) | 0 (0.0%) |
| Total Housing Units | 140 (94.0%) | 9 (6.0%) |
Occupancy by Educational Attainment in Peters
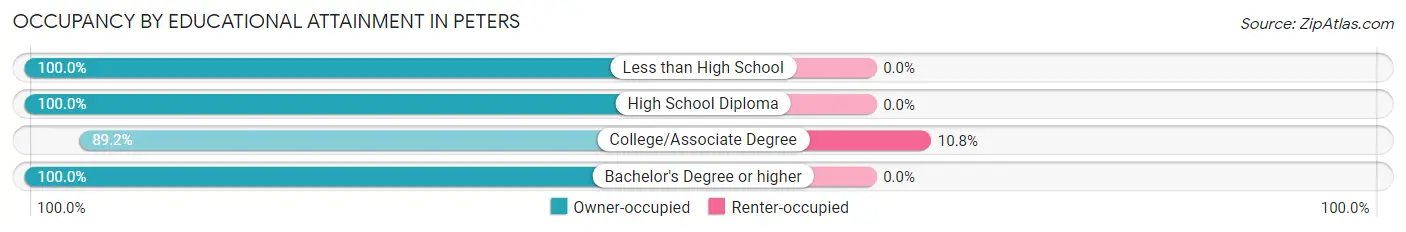
| Household Size | Owner-occupied | Renter-occupied |
| Less than High School | 7 (100.0%) | 0 (0.0%) |
| High School Diploma | 38 (100.0%) | 0 (0.0%) |
| College/Associate Degree | 74 (89.2%) | 9 (10.8%) |
| Bachelor's Degree or higher | 21 (100.0%) | 0 (0.0%) |
Occupancy by Age of Householder in Peters
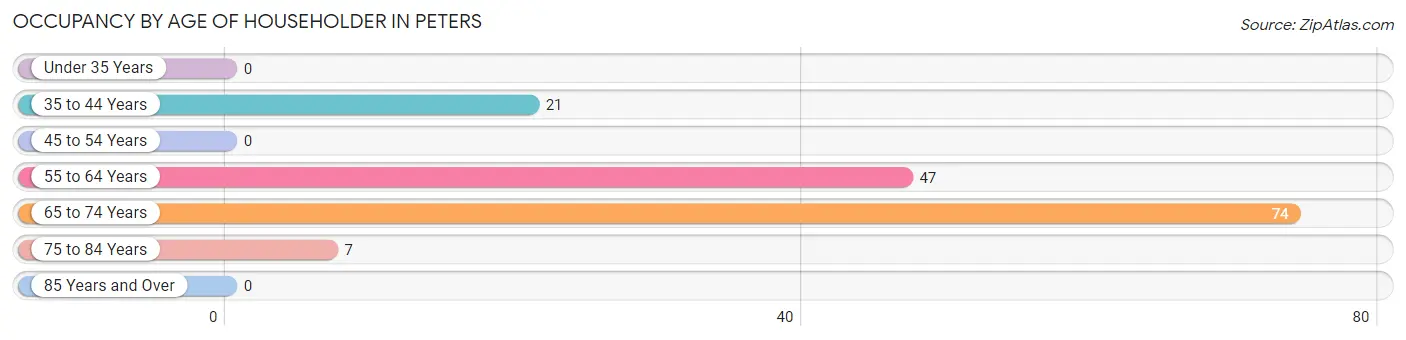
| Age Bracket | # Households | % Households |
| Under 35 Years | 0 | 0.0% |
| 35 to 44 Years | 21 | 14.1% |
| 45 to 54 Years | 0 | 0.0% |
| 55 to 64 Years | 47 | 31.5% |
| 65 to 74 Years | 74 | 49.7% |
| 75 to 84 Years | 7 | 4.7% |
| 85 Years and Over | 0 | 0.0% |
| Total | 149 | 100.0% |
Housing Finances in Peters
Median Income by Occupancy in Peters
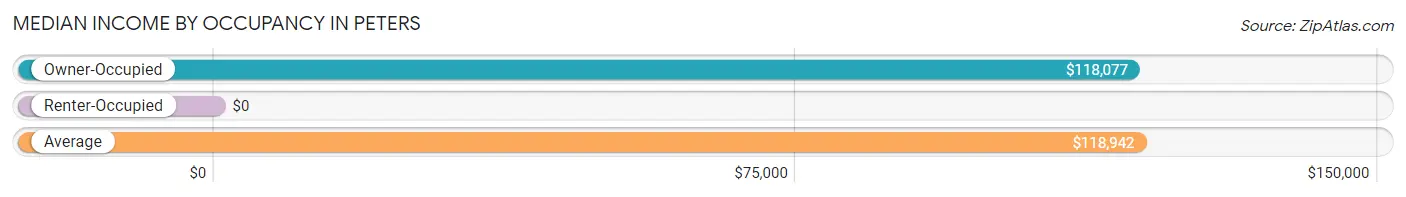
| Occupancy Type | # Households | Median Income |
| Owner-Occupied | 140 (94.0%) | $118,077 |
| Renter-Occupied | 9 (6.0%) | $0 |
| Average | 149 (100.0%) | $118,942 |
Occupancy by Householder Income Bracket in Peters
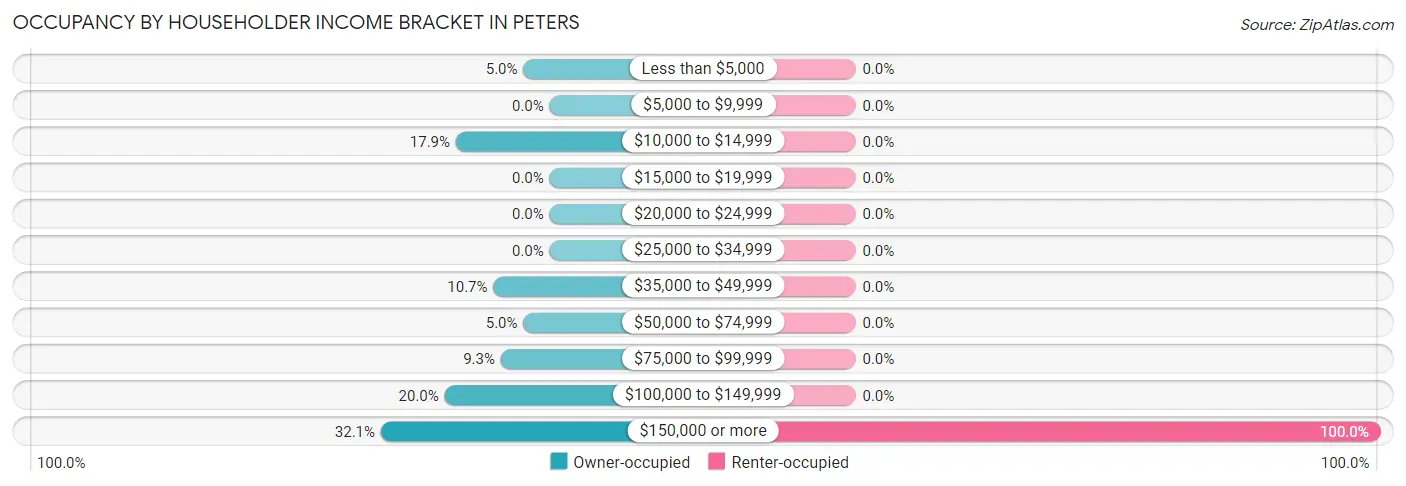
| Income Bracket | Owner-occupied | Renter-occupied |
| Less than $5,000 | 7 (5.0%) | 0 (0.0%) |
| $5,000 to $9,999 | 0 (0.0%) | 0 (0.0%) |
| $10,000 to $14,999 | 25 (17.9%) | 0 (0.0%) |
| $15,000 to $19,999 | 0 (0.0%) | 0 (0.0%) |
| $20,000 to $24,999 | 0 (0.0%) | 0 (0.0%) |
| $25,000 to $34,999 | 0 (0.0%) | 0 (0.0%) |
| $35,000 to $49,999 | 15 (10.7%) | 0 (0.0%) |
| $50,000 to $74,999 | 7 (5.0%) | 0 (0.0%) |
| $75,000 to $99,999 | 13 (9.3%) | 0 (0.0%) |
| $100,000 to $149,999 | 28 (20.0%) | 0 (0.0%) |
| $150,000 or more | 45 (32.1%) | 9 (100.0%) |
| Total | 140 (100.0%) | 9 (100.0%) |
Monthly Housing Cost Tiers in Peters
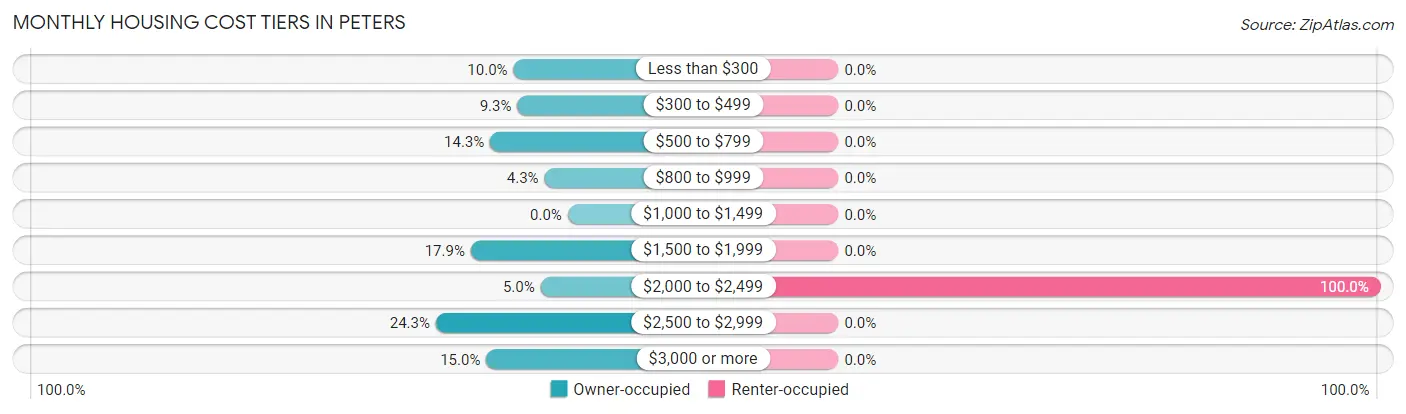
| Monthly Cost | Owner-occupied | Renter-occupied |
| Less than $300 | 14 (10.0%) | 0 (0.0%) |
| $300 to $499 | 13 (9.3%) | 0 (0.0%) |
| $500 to $799 | 20 (14.3%) | 0 (0.0%) |
| $800 to $999 | 6 (4.3%) | 0 (0.0%) |
| $1,000 to $1,499 | 0 (0.0%) | 0 (0.0%) |
| $1,500 to $1,999 | 25 (17.9%) | 0 (0.0%) |
| $2,000 to $2,499 | 7 (5.0%) | 9 (100.0%) |
| $2,500 to $2,999 | 34 (24.3%) | 0 (0.0%) |
| $3,000 or more | 21 (15.0%) | 0 (0.0%) |
| Total | 140 (100.0%) | 9 (100.0%) |
Physical Housing Characteristics in Peters
Housing Structures in Peters
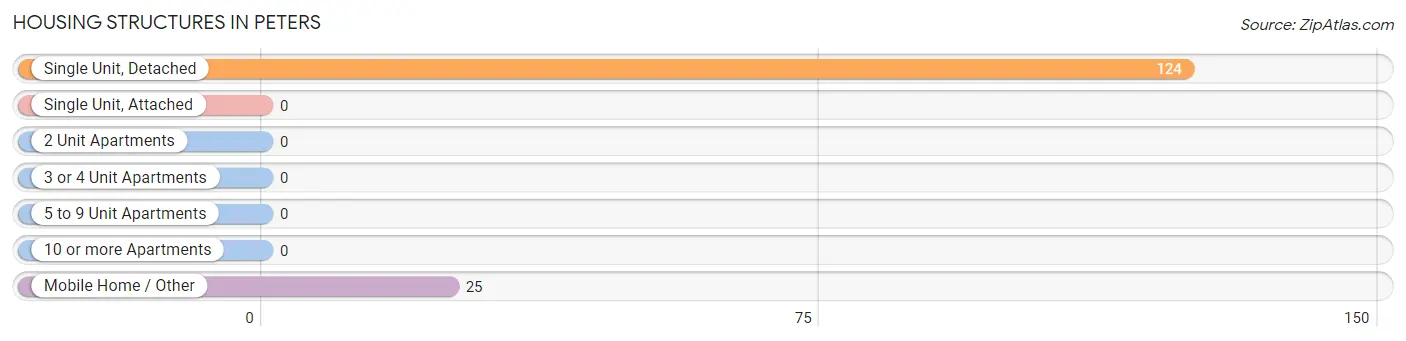
| Structure Type | # Housing Units | % Housing Units |
| Single Unit, Detached | 124 | 83.2% |
| Single Unit, Attached | 0 | 0.0% |
| 2 Unit Apartments | 0 | 0.0% |
| 3 or 4 Unit Apartments | 0 | 0.0% |
| 5 to 9 Unit Apartments | 0 | 0.0% |
| 10 or more Apartments | 0 | 0.0% |
| Mobile Home / Other | 25 | 16.8% |
| Total | 149 | 100.0% |
Housing Structures by Occupancy in Peters
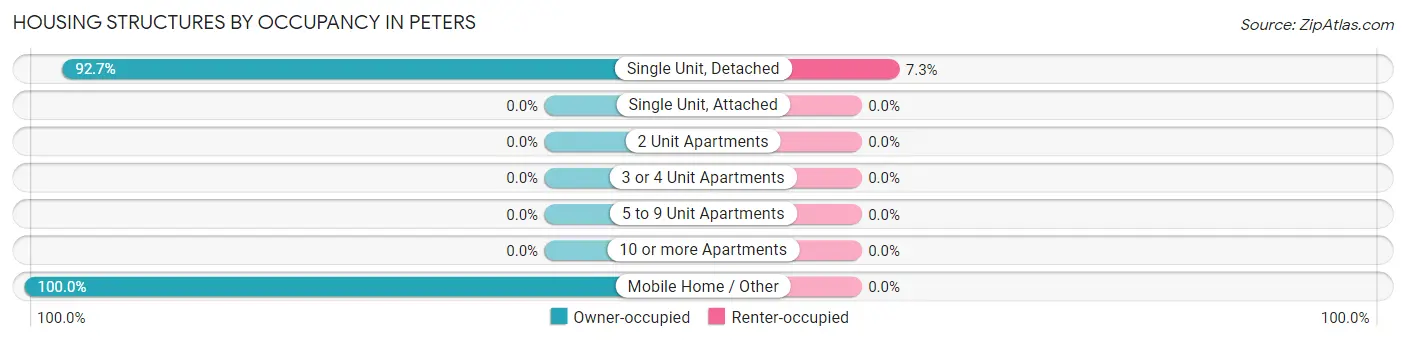
| Structure Type | Owner-occupied | Renter-occupied |
| Single Unit, Detached | 115 (92.7%) | 9 (7.3%) |
| Single Unit, Attached | 0 (0.0%) | 0 (0.0%) |
| 2 Unit Apartments | 0 (0.0%) | 0 (0.0%) |
| 3 or 4 Unit Apartments | 0 (0.0%) | 0 (0.0%) |
| 5 to 9 Unit Apartments | 0 (0.0%) | 0 (0.0%) |
| 10 or more Apartments | 0 (0.0%) | 0 (0.0%) |
| Mobile Home / Other | 25 (100.0%) | 0 (0.0%) |
| Total | 140 (94.0%) | 9 (6.0%) |
Housing Structures by Number of Rooms in Peters
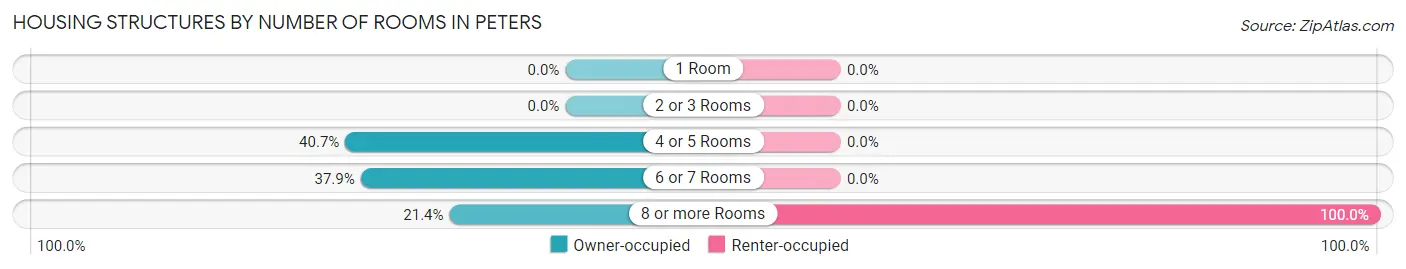
| Number of Rooms | Owner-occupied | Renter-occupied |
| 1 Room | 0 (0.0%) | 0 (0.0%) |
| 2 or 3 Rooms | 0 (0.0%) | 0 (0.0%) |
| 4 or 5 Rooms | 57 (40.7%) | 0 (0.0%) |
| 6 or 7 Rooms | 53 (37.9%) | 0 (0.0%) |
| 8 or more Rooms | 30 (21.4%) | 9 (100.0%) |
| Total | 140 (100.0%) | 9 (100.0%) |
Housing Structure by Heating Type in Peters
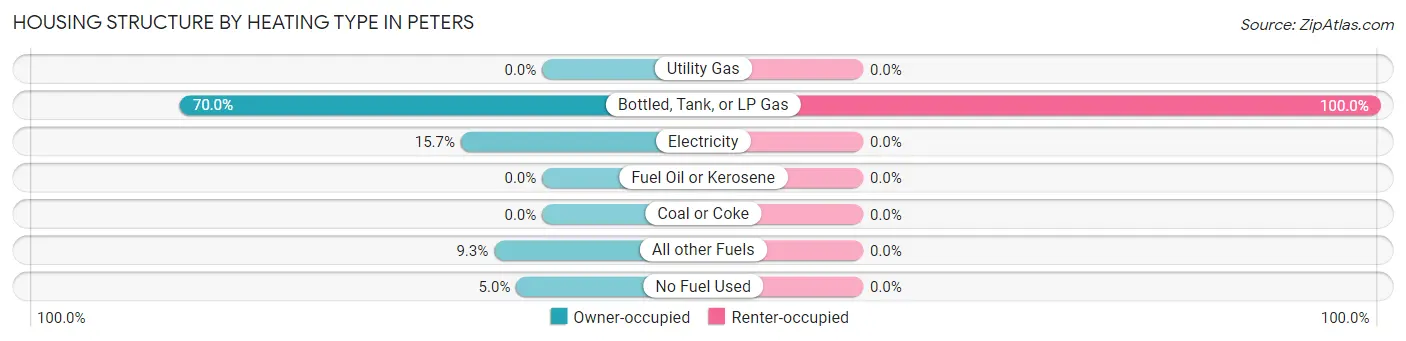
| Heating Type | Owner-occupied | Renter-occupied |
| Utility Gas | 0 (0.0%) | 0 (0.0%) |
| Bottled, Tank, or LP Gas | 98 (70.0%) | 9 (100.0%) |
| Electricity | 22 (15.7%) | 0 (0.0%) |
| Fuel Oil or Kerosene | 0 (0.0%) | 0 (0.0%) |
| Coal or Coke | 0 (0.0%) | 0 (0.0%) |
| All other Fuels | 13 (9.3%) | 0 (0.0%) |
| No Fuel Used | 7 (5.0%) | 0 (0.0%) |
| Total | 140 (100.0%) | 9 (100.0%) |
Household Vehicle Usage in Peters
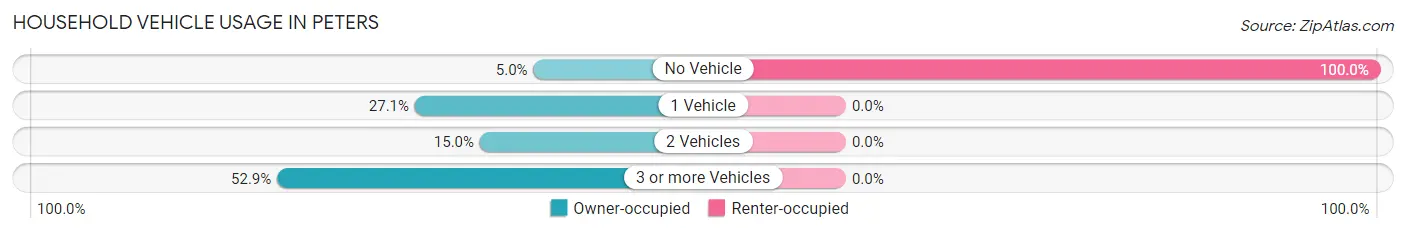
| Vehicles per Household | Owner-occupied | Renter-occupied |
| No Vehicle | 7 (5.0%) | 9 (100.0%) |
| 1 Vehicle | 38 (27.1%) | 0 (0.0%) |
| 2 Vehicles | 21 (15.0%) | 0 (0.0%) |
| 3 or more Vehicles | 74 (52.9%) | 0 (0.0%) |
| Total | 140 (100.0%) | 9 (100.0%) |
Real Estate & Mortgages in Peters
Real Estate and Mortgage Overview in Peters
| Characteristic | Without Mortgage | With Mortgage |
| Housing Units | 87 | 53 |
| Median Property Value | $457,500 | $587,500 |
| Median Household Income | - | - |
| Monthly Housing Costs | - | - |
| Real Estate Taxes | $5,186 | $0 |
Property Value by Mortgage Status in Peters
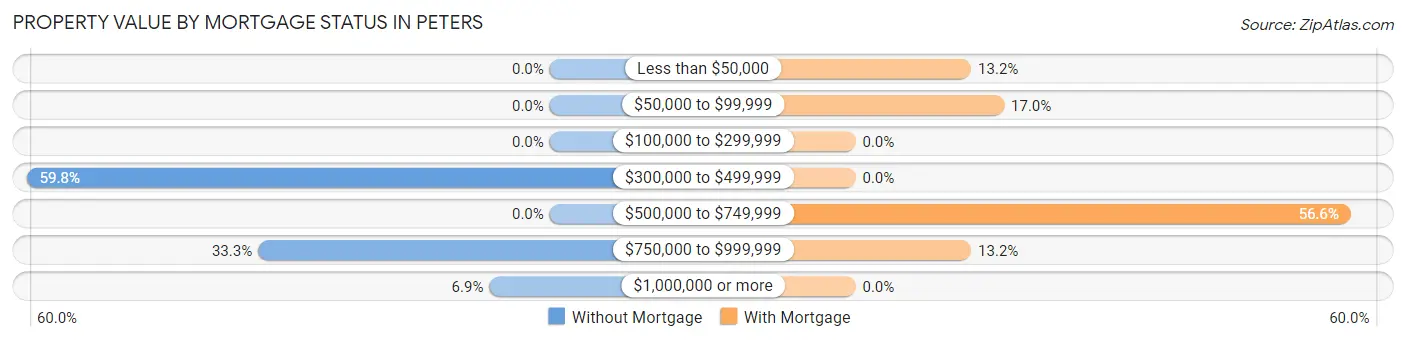
| Property Value | Without Mortgage | With Mortgage |
| Less than $50,000 | 0 (0.0%) | 7 (13.2%) |
| $50,000 to $99,999 | 0 (0.0%) | 9 (17.0%) |
| $100,000 to $299,999 | 0 (0.0%) | 0 (0.0%) |
| $300,000 to $499,999 | 52 (59.8%) | 0 (0.0%) |
| $500,000 to $749,999 | 0 (0.0%) | 30 (56.6%) |
| $750,000 to $999,999 | 29 (33.3%) | 7 (13.2%) |
| $1,000,000 or more | 6 (6.9%) | 0 (0.0%) |
| Total | 87 (100.0%) | 53 (100.0%) |
Household Income by Mortgage Status in Peters
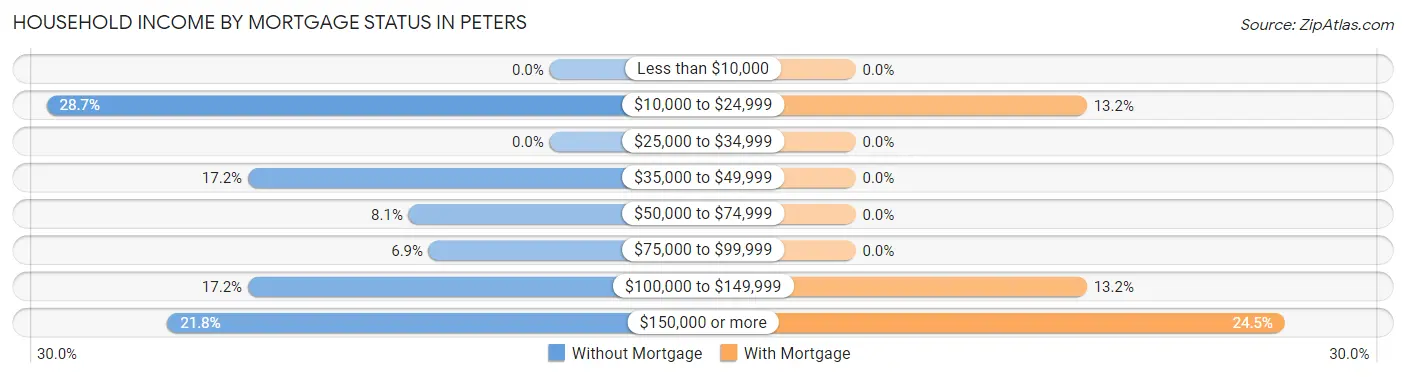
| Household Income | Without Mortgage | With Mortgage |
| Less than $10,000 | 0 (0.0%) | 0 (0.0%) |
| $10,000 to $24,999 | 25 (28.7%) | 7 (13.2%) |
| $25,000 to $34,999 | 0 (0.0%) | 0 (0.0%) |
| $35,000 to $49,999 | 15 (17.2%) | 0 (0.0%) |
| $50,000 to $74,999 | 7 (8.1%) | 0 (0.0%) |
| $75,000 to $99,999 | 6 (6.9%) | 0 (0.0%) |
| $100,000 to $149,999 | 15 (17.2%) | 7 (13.2%) |
| $150,000 or more | 19 (21.8%) | 13 (24.5%) |
| Total | 87 (100.0%) | 53 (100.0%) |
Property Value to Household Income Ratio in Peters
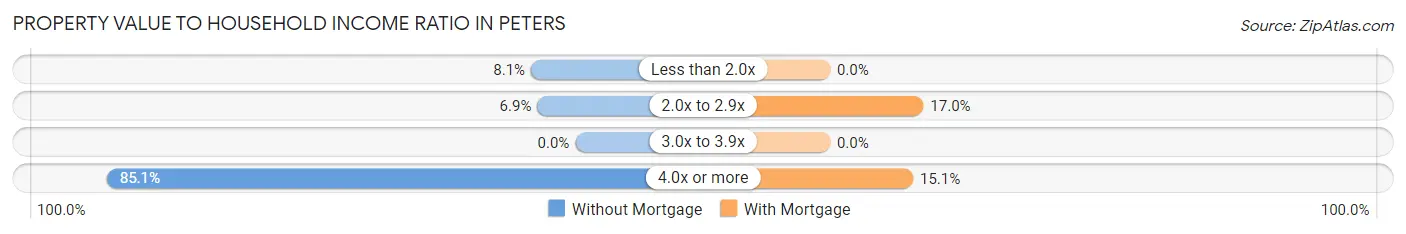
| Value-to-Income Ratio | Without Mortgage | With Mortgage |
| Less than 2.0x | 7 (8.1%) | 0 (0.0%) |
| 2.0x to 2.9x | 6 (6.9%) | 9 (17.0%) |
| 3.0x to 3.9x | 0 (0.0%) | 0 (0.0%) |
| 4.0x or more | 74 (85.1%) | 8 (15.1%) |
| Total | 87 (100.0%) | 53 (100.0%) |
Real Estate Taxes by Mortgage Status in Peters
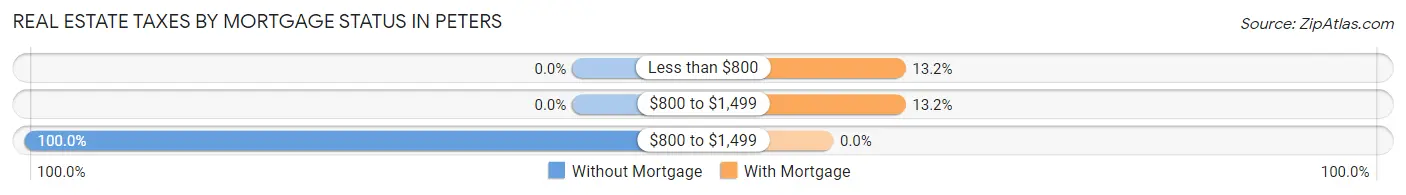
| Property Taxes | Without Mortgage | With Mortgage |
| Less than $800 | 0 (0.0%) | 7 (13.2%) |
| $800 to $1,499 | 0 (0.0%) | 7 (13.2%) |
| $800 to $1,499 | 87 (100.0%) | 0 (0.0%) |
| Total | 87 (100.0%) | 53 (100.0%) |
Health & Disability in Peters
Health Insurance Coverage by Age in Peters
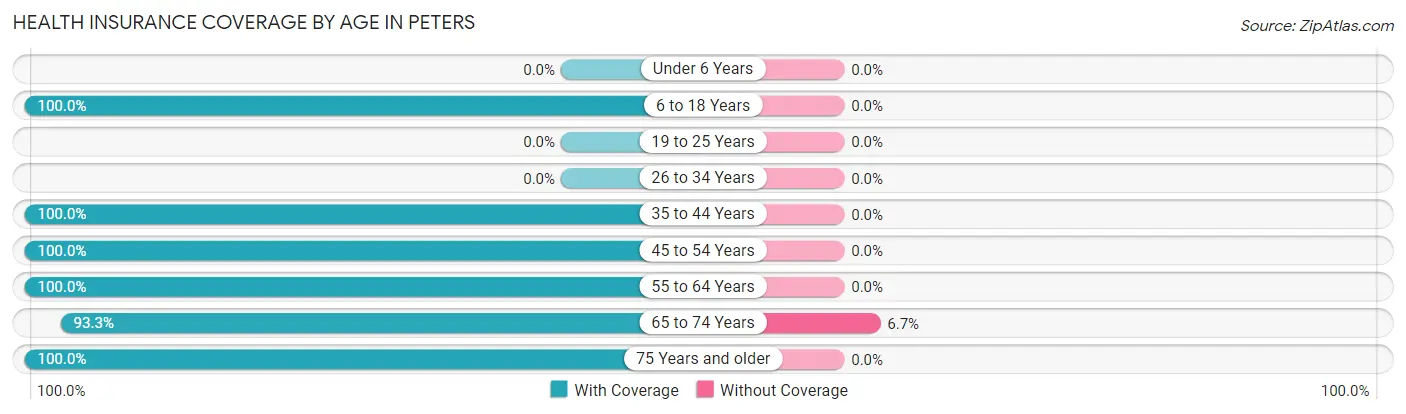
| Age Bracket | With Coverage | Without Coverage |
| Under 6 Years | 0 (0.0%) | 0 (0.0%) |
| 6 to 18 Years | 16 (100.0%) | 0 (0.0%) |
| 19 to 25 Years | 0 (0.0%) | 0 (0.0%) |
| 26 to 34 Years | 0 (0.0%) | 0 (0.0%) |
| 35 to 44 Years | 30 (100.0%) | 0 (0.0%) |
| 45 to 54 Years | 22 (100.0%) | 0 (0.0%) |
| 55 to 64 Years | 100 (100.0%) | 0 (0.0%) |
| 65 to 74 Years | 97 (93.3%) | 7 (6.7%) |
| 75 Years and older | 37 (100.0%) | 0 (0.0%) |
| Total | 302 (97.7%) | 7 (2.3%) |
Health Insurance Coverage by Citizenship Status in Peters
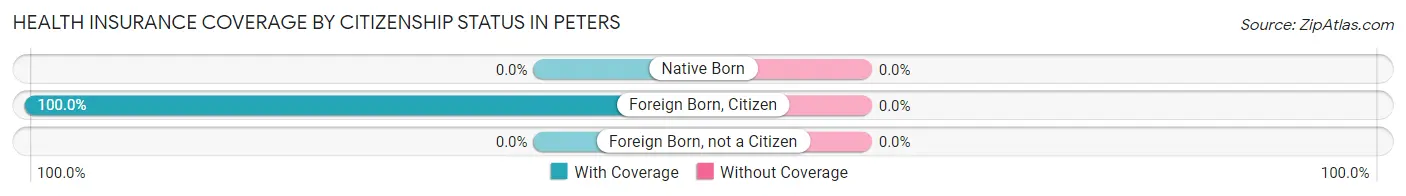
| Citizenship Status | With Coverage | Without Coverage |
| Native Born | 0 (0.0%) | 0 (0.0%) |
| Foreign Born, Citizen | 16 (100.0%) | 0 (0.0%) |
| Foreign Born, not a Citizen | 0 (0.0%) | 0 (0.0%) |
Health Insurance Coverage by Household Income in Peters
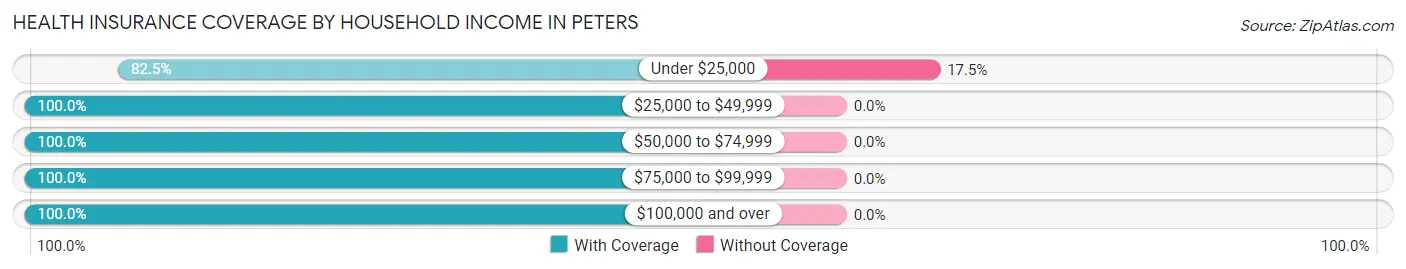
| Household Income | With Coverage | Without Coverage |
| Under $25,000 | 33 (82.5%) | 7 (17.5%) |
| $25,000 to $49,999 | 23 (100.0%) | 0 (0.0%) |
| $50,000 to $74,999 | 14 (100.0%) | 0 (0.0%) |
| $75,000 to $99,999 | 36 (100.0%) | 0 (0.0%) |
| $100,000 and over | 196 (100.0%) | 0 (0.0%) |
Public vs Private Health Insurance Coverage by Age in Peters
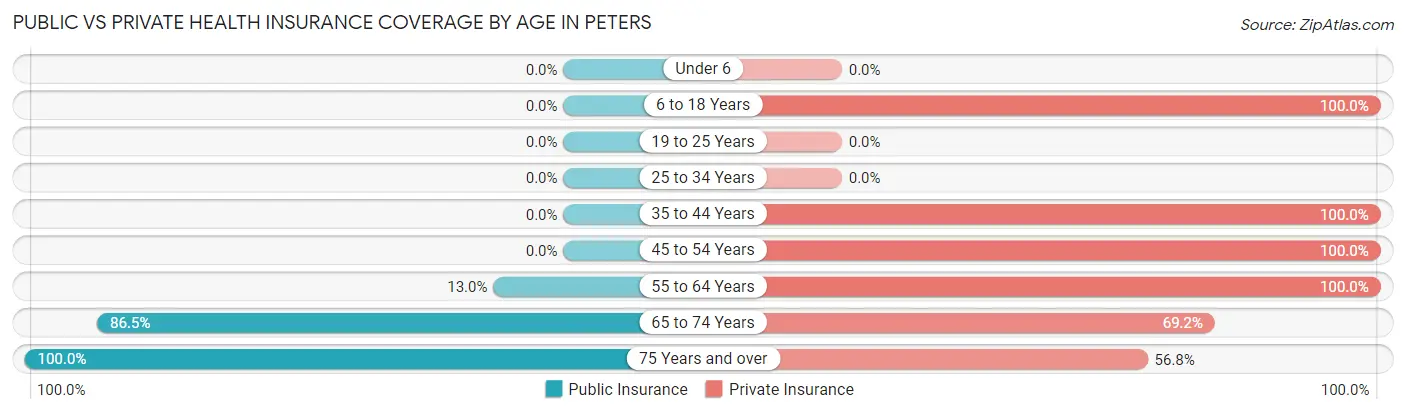
| Age Bracket | Public Insurance | Private Insurance |
| Under 6 | 0 (0.0%) | 0 (0.0%) |
| 6 to 18 Years | 0 (0.0%) | 16 (100.0%) |
| 19 to 25 Years | 0 (0.0%) | 0 (0.0%) |
| 25 to 34 Years | 0 (0.0%) | 0 (0.0%) |
| 35 to 44 Years | 0 (0.0%) | 30 (100.0%) |
| 45 to 54 Years | 0 (0.0%) | 22 (100.0%) |
| 55 to 64 Years | 13 (13.0%) | 100 (100.0%) |
| 65 to 74 Years | 90 (86.5%) | 72 (69.2%) |
| 75 Years and over | 37 (100.0%) | 21 (56.8%) |
| Total | 140 (45.3%) | 261 (84.5%) |
Disability Status by Sex by Age in Peters
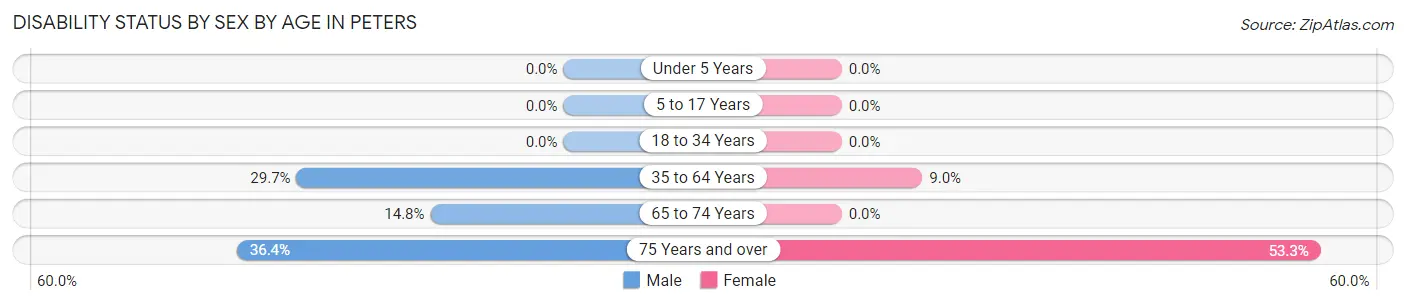
| Age Bracket | Male | Female |
| Under 5 Years | 0 (0.0%) | 0 (0.0%) |
| 5 to 17 Years | 0 (0.0%) | 0 (0.0%) |
| 18 to 34 Years | 0 (0.0%) | 0 (0.0%) |
| 35 to 64 Years | 22 (29.7%) | 7 (9.0%) |
| 65 to 74 Years | 8 (14.8%) | 0 (0.0%) |
| 75 Years and over | 8 (36.4%) | 8 (53.3%) |
Disability Class by Sex by Age in Peters
Disability Class: Hearing Difficulty
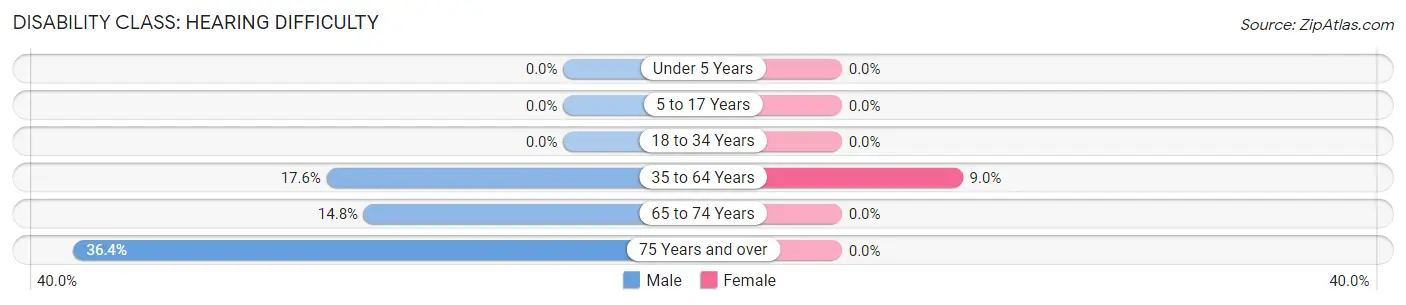
| Age Bracket | Male | Female |
| Under 5 Years | 0 (0.0%) | 0 (0.0%) |
| 5 to 17 Years | 0 (0.0%) | 0 (0.0%) |
| 18 to 34 Years | 0 (0.0%) | 0 (0.0%) |
| 35 to 64 Years | 13 (17.6%) | 7 (9.0%) |
| 65 to 74 Years | 8 (14.8%) | 0 (0.0%) |
| 75 Years and over | 8 (36.4%) | 0 (0.0%) |
Disability Class: Vision Difficulty
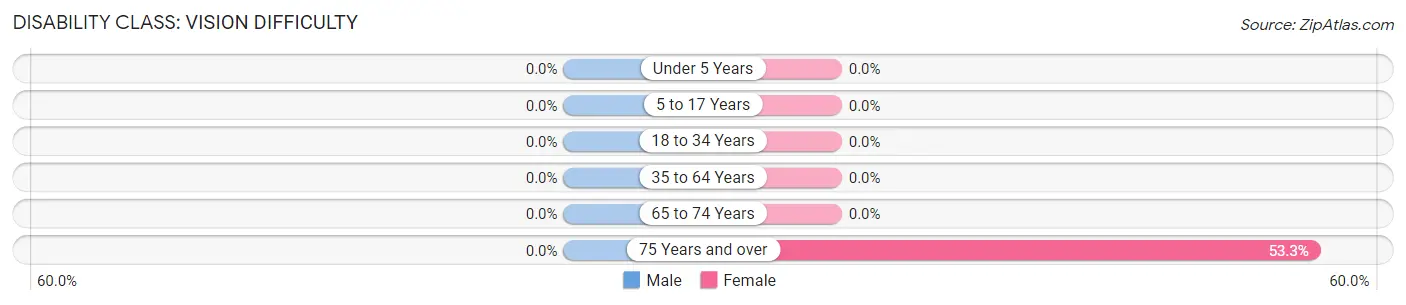
| Age Bracket | Male | Female |
| Under 5 Years | 0 (0.0%) | 0 (0.0%) |
| 5 to 17 Years | 0 (0.0%) | 0 (0.0%) |
| 18 to 34 Years | 0 (0.0%) | 0 (0.0%) |
| 35 to 64 Years | 0 (0.0%) | 0 (0.0%) |
| 65 to 74 Years | 0 (0.0%) | 0 (0.0%) |
| 75 Years and over | 0 (0.0%) | 8 (53.3%) |
Disability Class: Cognitive Difficulty
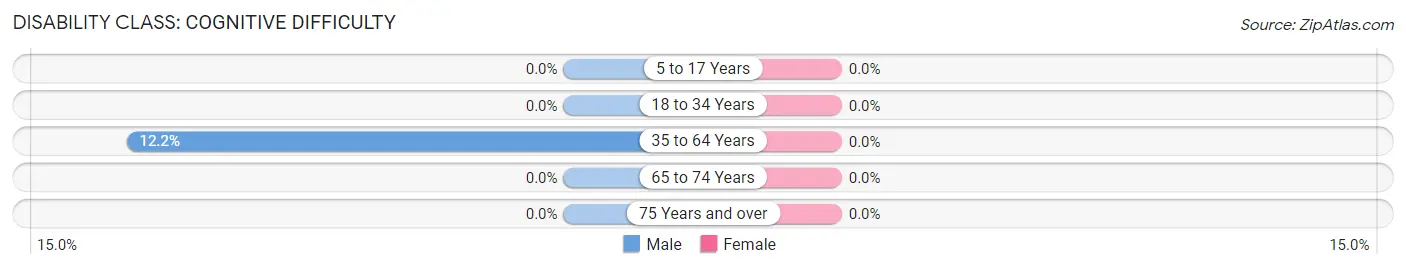
| Age Bracket | Male | Female |
| 5 to 17 Years | 0 (0.0%) | 0 (0.0%) |
| 18 to 34 Years | 0 (0.0%) | 0 (0.0%) |
| 35 to 64 Years | 9 (12.2%) | 0 (0.0%) |
| 65 to 74 Years | 0 (0.0%) | 0 (0.0%) |
| 75 Years and over | 0 (0.0%) | 0 (0.0%) |
Disability Class: Ambulatory Difficulty
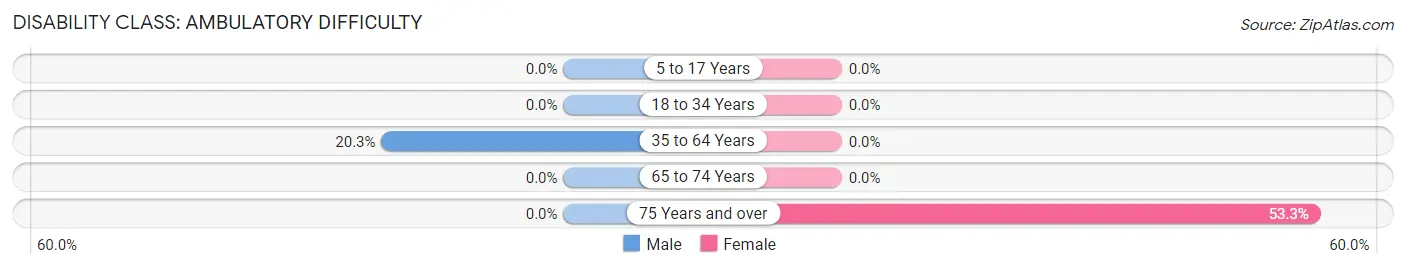
| Age Bracket | Male | Female |
| 5 to 17 Years | 0 (0.0%) | 0 (0.0%) |
| 18 to 34 Years | 0 (0.0%) | 0 (0.0%) |
| 35 to 64 Years | 15 (20.3%) | 0 (0.0%) |
| 65 to 74 Years | 0 (0.0%) | 0 (0.0%) |
| 75 Years and over | 0 (0.0%) | 8 (53.3%) |
Disability Class: Self-Care Difficulty
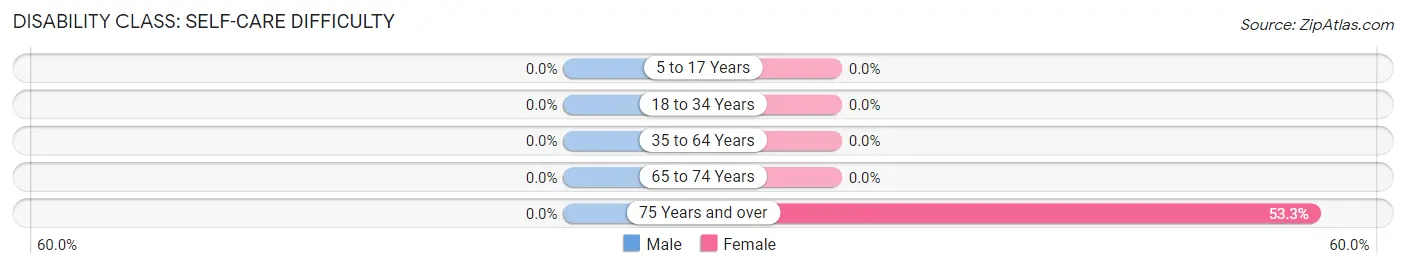
| Age Bracket | Male | Female |
| 5 to 17 Years | 0 (0.0%) | 0 (0.0%) |
| 18 to 34 Years | 0 (0.0%) | 0 (0.0%) |
| 35 to 64 Years | 0 (0.0%) | 0 (0.0%) |
| 65 to 74 Years | 0 (0.0%) | 0 (0.0%) |
| 75 Years and over | 0 (0.0%) | 8 (53.3%) |
Technology Access in Peters
Computing Device Access in Peters
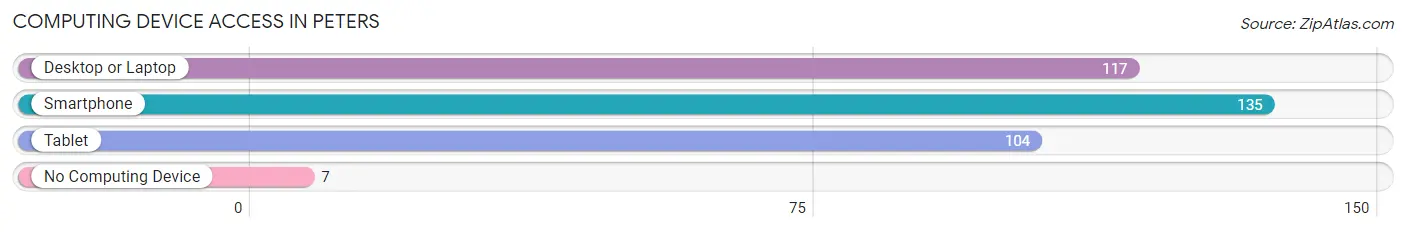
| Device Type | # Households | % Households |
| Desktop or Laptop | 117 | 78.5% |
| Smartphone | 135 | 90.6% |
| Tablet | 104 | 69.8% |
| No Computing Device | 7 | 4.7% |
| Total | 149 | 100.0% |
Internet Access in Peters
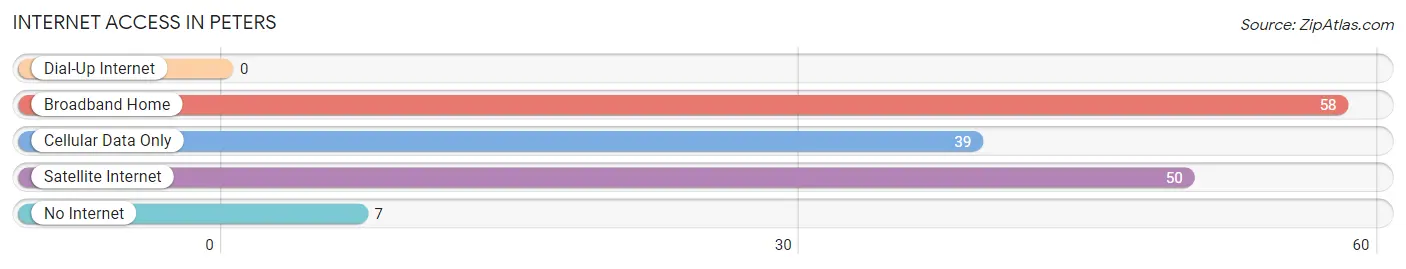
| Internet Type | # Households | % Households |
| Dial-Up Internet | 0 | 0.0% |
| Broadband Home | 58 | 38.9% |
| Cellular Data Only | 39 | 26.2% |
| Satellite Internet | 50 | 33.6% |
| No Internet | 7 | 4.7% |
| Total | 149 | 100.0% |
Peters Summary
Peters, California is a small town located in the San Joaquin Valley of California. It is situated in the foothills of the Sierra Nevada Mountains, about 25 miles east of Fresno. The town has a population of approximately 1,500 people and is part of the Fresno-Madera metropolitan area.
History
Peters, California was founded in 1872 by a group of settlers from the Midwest. The town was named after one of the settlers, John Peters. The settlers were attracted to the area due to its fertile soil and abundant water supply. The town quickly grew and by the early 1900s, it had become a thriving agricultural community.
The town was also home to a number of businesses, including a general store, a blacksmith shop, a hotel, and a saloon. In the 1920s, the town was connected to the rest of the state by the Southern Pacific Railroad. This allowed for the transportation of goods and people to and from the town.
Geography
Peters, California is located in the San Joaquin Valley of California. It is situated in the foothills of the Sierra Nevada Mountains, about 25 miles east of Fresno. The town is surrounded by rolling hills and is located at an elevation of approximately 1,000 feet. The climate in the area is semi-arid, with hot summers and mild winters.
Economy
The economy of Peters, California is largely based on agriculture. The town is home to a number of farms and ranches, which produce a variety of crops, including grapes, almonds, and olives. The town is also home to a number of small businesses, including restaurants, shops, and services.
Demographics
As of the 2010 census, the population of Peters, California was 1,500. The racial makeup of the town was 75.2% White, 0.7% African American, 0.7% Native American, 0.7% Asian, 0.7% Pacific Islander, and 21.3% from other races. The median household income in the town was $37,500.
Peters, California is a small town with a rich history and a vibrant economy. The town is home to a diverse population and is a great place to live and work.
Common Questions
What is Per Capita Income in Peters?
Per Capita income in Peters is $55,264.
What is the Median Family Income in Peters?
Median Family Income in Peters is $143,594.
What is the Median Household income in Peters?
Median Household Income in Peters is $118,942.
What is Income or Wage Gap in Peters?
Income or Wage Gap in Peters is 22.6%.
Women in Peters earn 77.4 cents for every dollar earned by a man.
What is Inequality or Gini Index in Peters?
Inequality or Gini Index in Peters is 0.37.
What is the Total Population of Peters?
Total Population of Peters is 309.
What is the Total Male Population of Peters?
Total Male Population of Peters is 158.
What is the Total Female Population of Peters?
Total Female Population of Peters is 151.
What is the Ratio of Males per 100 Females in Peters?
There are 104.64 Males per 100 Females in Peters.
What is the Ratio of Females per 100 Males in Peters?
There are 95.57 Females per 100 Males in Peters.
What is the Median Population Age in Peters?
Median Population Age in Peters is 63.8 Years.
What is the Average Family Size in Peters
Average Family Size in Peters is 2.3 People.
What is the Average Household Size in Peters
Average Household Size in Peters is 2.1 People.
How Large is the Labor Force in Peters?
There are 122 People in the Labor Forcein in Peters.
What is the Percentage of People in the Labor Force in Peters?
41.6% of People are in the Labor Force in Peters.