Tres Pinos, CA Map & Demographics
Tres Pinos Map
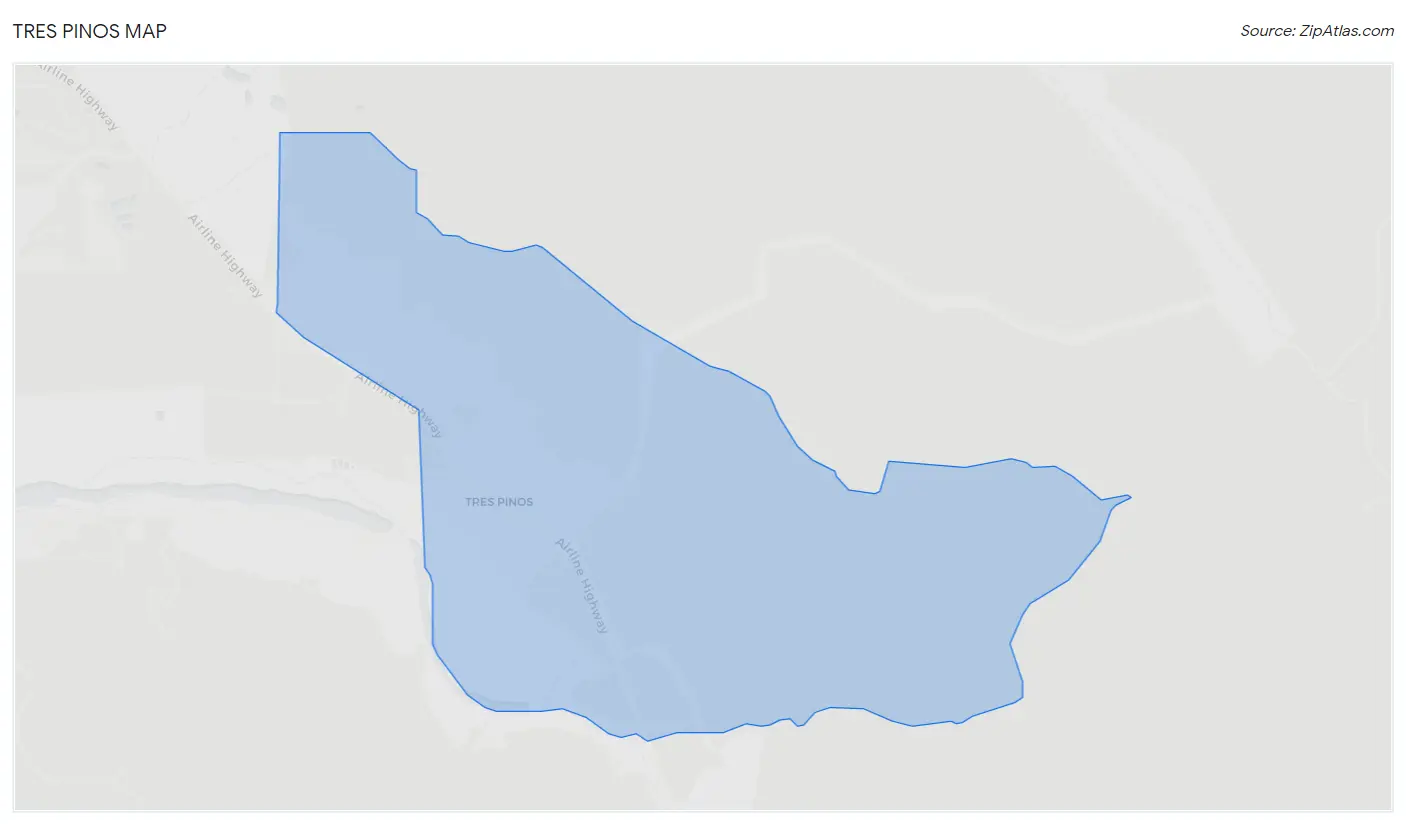
Tres Pinos Overview
$61,299
PER CAPITA INCOME
$224,922
AVG FAMILY INCOME
$222,891
AVG HOUSEHOLD INCOME
57.7%
WAGE / INCOME GAP [ % ]
42.3¢/ $1
WAGE / INCOME GAP [ $ ]
0.35
INEQUALITY / GINI INDEX
1,006
TOTAL POPULATION
521
MALE POPULATION
485
FEMALE POPULATION
107.42
MALES / 100 FEMALES
93.09
FEMALES / 100 MALES
45.0
MEDIAN AGE
3.6
AVG FAMILY SIZE
3.5
AVG HOUSEHOLD SIZE
664
LABOR FORCE [ PEOPLE ]
77.8%
PERCENT IN LABOR FORCE
5.7%
UNEMPLOYMENT RATE
Tres Pinos Zip Codes
Income in Tres Pinos
Income Overview in Tres Pinos
Per Capita Income in Tres Pinos is $61,299, while median incomes of families and households are $224,922 and $222,891 respectively.
| Characteristic | Number | Measure |
| Per Capita Income | 1,006 | $61,299 |
| Median Family Income | 259 | $224,922 |
| Mean Family Income | 259 | $199,981 |
| Median Household Income | 291 | $222,891 |
| Mean Household Income | 291 | $188,736 |
| Income Deficit | 259 | $0 |
| Wage / Income Gap (%) | 1,006 | 57.67% |
| Wage / Income Gap ($) | 1,006 | 42.33¢ per $1 |
| Gini / Inequality Index | 1,006 | 0.35 |
Earnings by Sex in Tres Pinos
Average Earnings in Tres Pinos are $56,414, $67,414 for men and $28,536 for women, a difference of 57.7%.
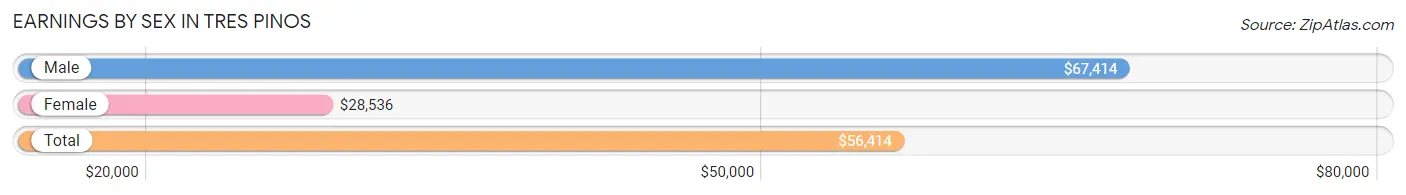
| Sex | Number | Average Earnings |
| Male | 388 (56.5%) | $67,414 |
| Female | 299 (43.5%) | $28,536 |
| Total | 687 (100.0%) | $56,414 |
Earnings by Sex by Income Bracket in Tres Pinos
The most common earnings brackets in Tres Pinos are $100,000+ for men (134 | 34.5%) and $22,500 to $24,999 for women (56 | 18.7%).
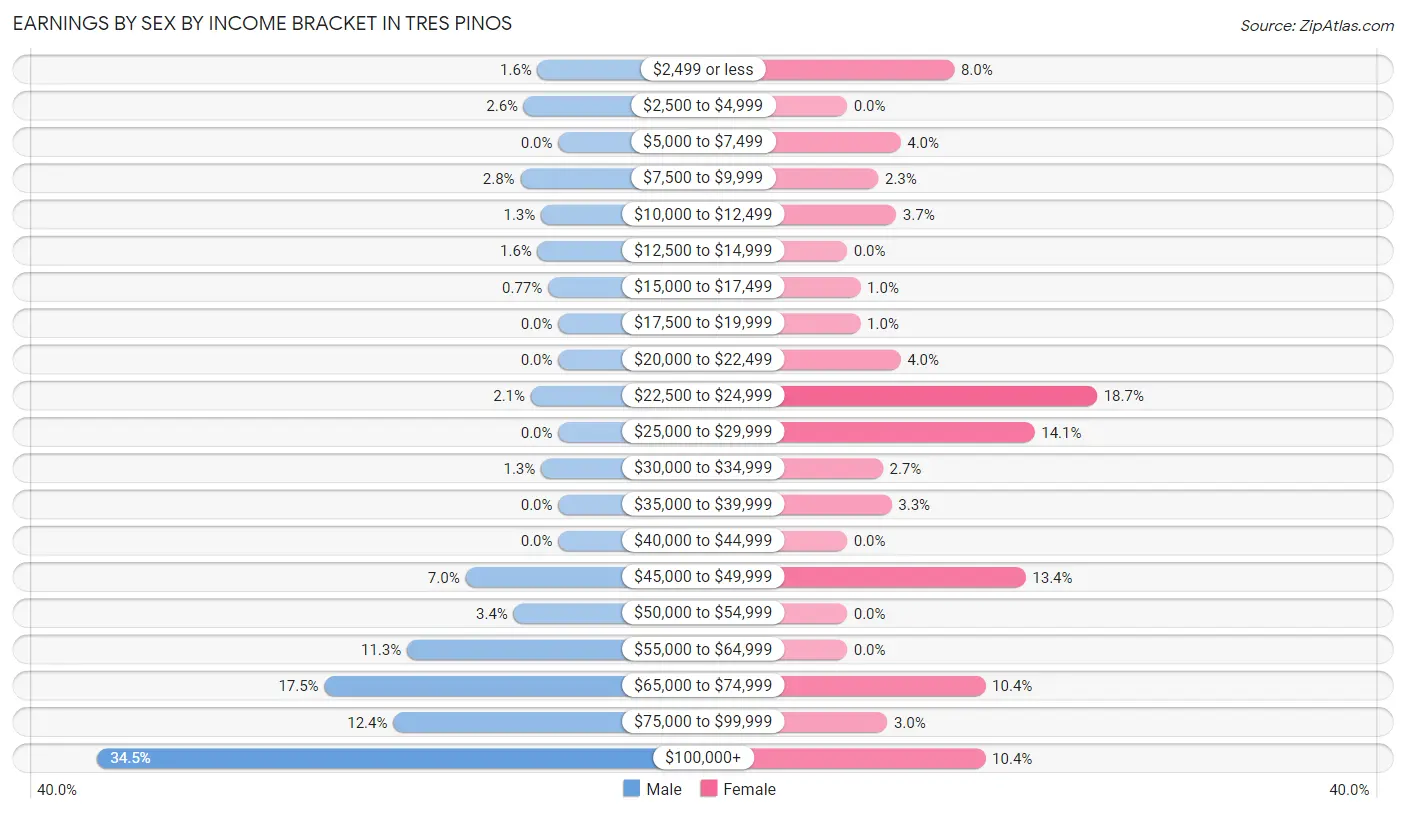
| Income | Male | Female |
| $2,499 or less | 6 (1.5%) | 24 (8.0%) |
| $2,500 to $4,999 | 10 (2.6%) | 0 (0.0%) |
| $5,000 to $7,499 | 0 (0.0%) | 12 (4.0%) |
| $7,500 to $9,999 | 11 (2.8%) | 7 (2.3%) |
| $10,000 to $12,499 | 5 (1.3%) | 11 (3.7%) |
| $12,500 to $14,999 | 6 (1.5%) | 0 (0.0%) |
| $15,000 to $17,499 | 3 (0.8%) | 3 (1.0%) |
| $17,500 to $19,999 | 0 (0.0%) | 3 (1.0%) |
| $20,000 to $22,499 | 0 (0.0%) | 12 (4.0%) |
| $22,500 to $24,999 | 8 (2.1%) | 56 (18.7%) |
| $25,000 to $29,999 | 0 (0.0%) | 42 (14.1%) |
| $30,000 to $34,999 | 5 (1.3%) | 8 (2.7%) |
| $35,000 to $39,999 | 0 (0.0%) | 10 (3.3%) |
| $40,000 to $44,999 | 0 (0.0%) | 0 (0.0%) |
| $45,000 to $49,999 | 27 (7.0%) | 40 (13.4%) |
| $50,000 to $54,999 | 13 (3.4%) | 0 (0.0%) |
| $55,000 to $64,999 | 44 (11.3%) | 0 (0.0%) |
| $65,000 to $74,999 | 68 (17.5%) | 31 (10.4%) |
| $75,000 to $99,999 | 48 (12.4%) | 9 (3.0%) |
| $100,000+ | 134 (34.5%) | 31 (10.4%) |
| Total | 388 (100.0%) | 299 (100.0%) |
Earnings by Sex by Educational Attainment in Tres Pinos
Average earnings in Tres Pinos are $82,887 for men and $28,607 for women, a difference of 65.5%. Men with an educational attainment of less than high school enjoy the highest average annual earnings of $140,882, while those with college or associate's degree education earn the least with $67,004. Women with an educational attainment of high school diploma earn the most with the average annual earnings of $45,458, while those with bachelor's degree education have the smallest earnings of $25,000.
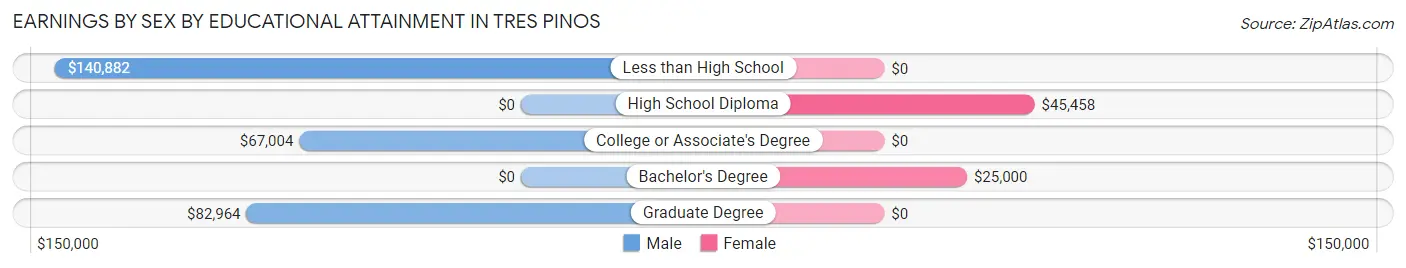
| Educational Attainment | Male Income | Female Income |
| Less than High School | $140,882 | $0 |
| High School Diploma | - | - |
| College or Associate's Degree | $67,004 | $0 |
| Bachelor's Degree | - | - |
| Graduate Degree | $82,964 | $0 |
| Total | $82,887 | $28,607 |
Family Income in Tres Pinos
Family Income Brackets in Tres Pinos
According to the Tres Pinos family income data, there are 148 families falling into the $200,000+ income range, which is the most common income bracket and makes up 57.1% of all families.
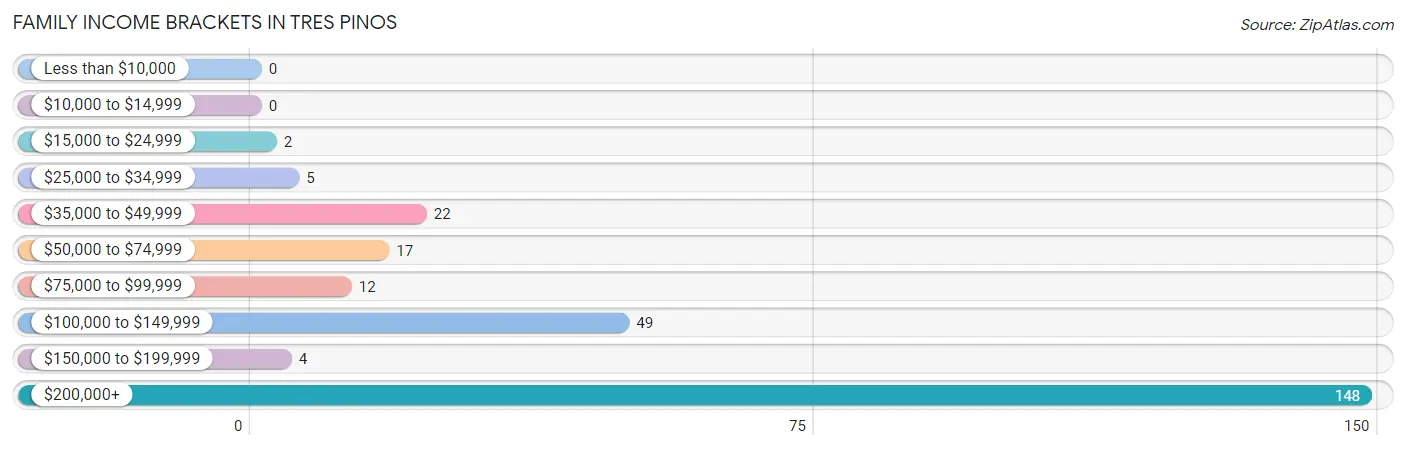
| Income Bracket | # Families | % Families |
| Less than $10,000 | 0 | 0.0% |
| $10,000 to $14,999 | 0 | 0.0% |
| $15,000 to $24,999 | 2 | 0.8% |
| $25,000 to $34,999 | 5 | 1.9% |
| $35,000 to $49,999 | 22 | 8.5% |
| $50,000 to $74,999 | 17 | 6.6% |
| $75,000 to $99,999 | 12 | 4.6% |
| $100,000 to $149,999 | 49 | 18.9% |
| $150,000 to $199,999 | 4 | 1.5% |
| $200,000+ | 148 | 57.1% |
Family Income by Famaliy Size in Tres Pinos
3-person families (44 | 17.0%) account for the highest median family income in Tres Pinos with $250,001 per family, while 3-person families (44 | 17.0%) have the highest median income of $83,334 per family member.
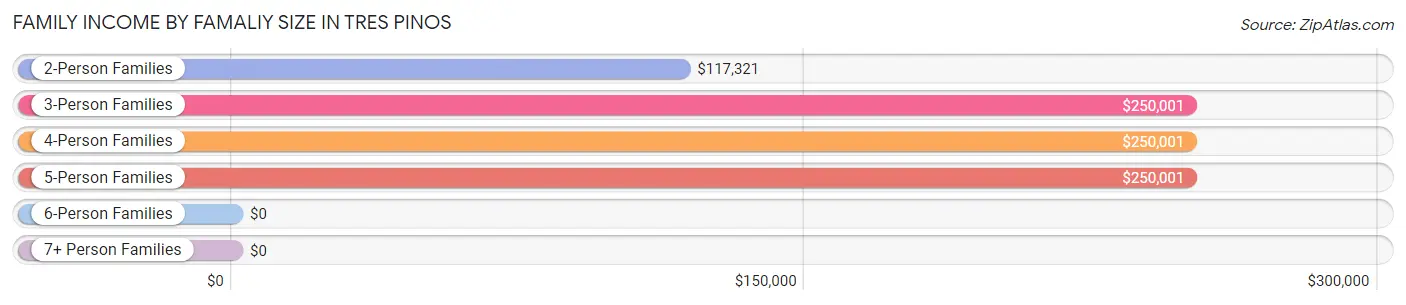
| Income Bracket | # Families | Median Income |
| 2-Person Families | 113 (43.6%) | $117,321 |
| 3-Person Families | 44 (17.0%) | $250,001 |
| 4-Person Families | 41 (15.8%) | $250,001 |
| 5-Person Families | 37 (14.3%) | $250,001 |
| 6-Person Families | 3 (1.2%) | $0 |
| 7+ Person Families | 21 (8.1%) | $0 |
| Total | 259 (100.0%) | $224,922 |
Family Income by Number of Earners in Tres Pinos
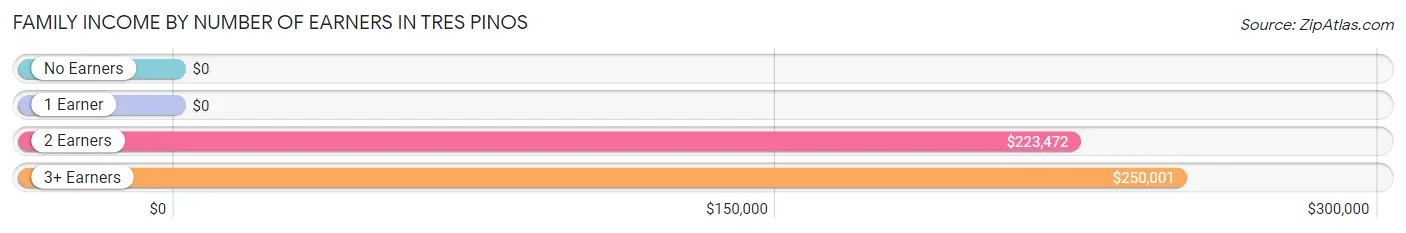
| Number of Earners | # Families | Median Income |
| No Earners | 42 (16.2%) | $0 |
| 1 Earner | 26 (10.0%) | $0 |
| 2 Earners | 103 (39.8%) | $223,472 |
| 3+ Earners | 88 (34.0%) | $250,001 |
| Total | 259 (100.0%) | $224,922 |
Household Income in Tres Pinos
Household Income Brackets in Tres Pinos
With 153 households falling in the category, the $200,000+ income range is the most frequent in Tres Pinos, accounting for 52.6% of all households.
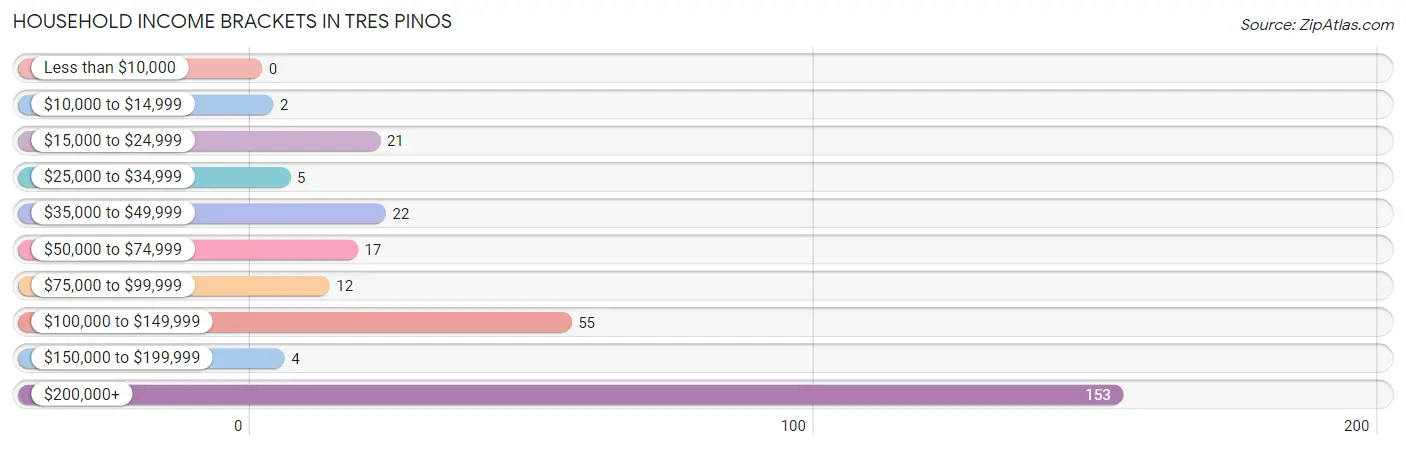
| Income Bracket | # Households | % Households |
| Less than $10,000 | 0 | 0.0% |
| $10,000 to $14,999 | 2 | 0.7% |
| $15,000 to $24,999 | 21 | 7.2% |
| $25,000 to $34,999 | 5 | 1.7% |
| $35,000 to $49,999 | 22 | 7.6% |
| $50,000 to $74,999 | 17 | 5.8% |
| $75,000 to $99,999 | 12 | 4.1% |
| $100,000 to $149,999 | 55 | 18.9% |
| $150,000 to $199,999 | 4 | 1.4% |
| $200,000+ | 153 | 52.6% |
Household Income by Householder Age in Tres Pinos
The median household income in Tres Pinos is $222,891, with the highest median household income of $250,001 found in the 45 to 64 years age bracket for the primary householder. A total of 165 households (56.7%) fall into this category.
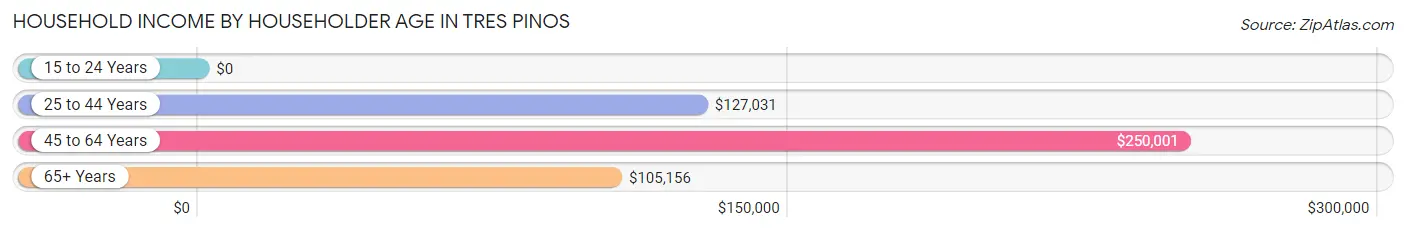
| Income Bracket | # Households | Median Income |
| 15 to 24 Years | 0 (0.0%) | $0 |
| 25 to 44 Years | 25 (8.6%) | $127,031 |
| 45 to 64 Years | 165 (56.7%) | $250,001 |
| 65+ Years | 101 (34.7%) | $105,156 |
| Total | 291 (100.0%) | $222,891 |
Poverty in Tres Pinos
Income Below Poverty by Sex and Age in Tres Pinos
With 1.9% poverty level for males and 3.5% for females among the residents of Tres Pinos, 16 and 17 year old males and 12 to 14 year old females are the most vulnerable to poverty, with 3 males (30.0%) and 4 females (100.0%) in their respective age groups living below the poverty level.
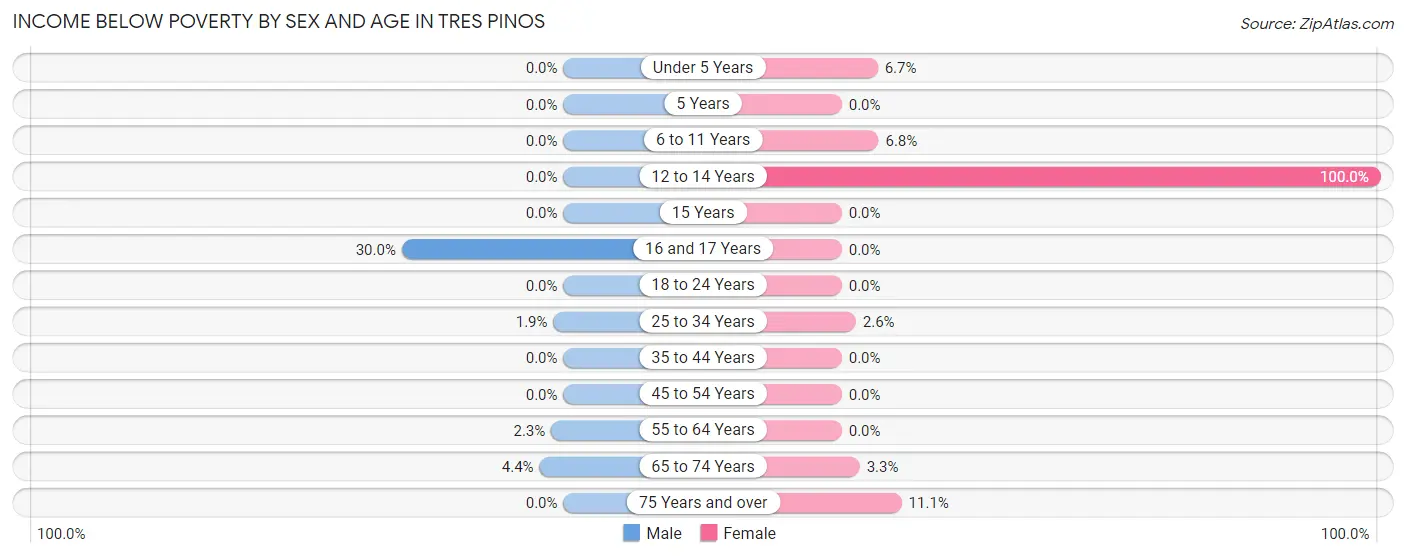
| Age Bracket | Male | Female |
| Under 5 Years | 0 (0.0%) | 2 (6.7%) |
| 5 Years | 0 (0.0%) | 0 (0.0%) |
| 6 to 11 Years | 0 (0.0%) | 3 (6.8%) |
| 12 to 14 Years | 0 (0.0%) | 4 (100.0%) |
| 15 Years | 0 (0.0%) | 0 (0.0%) |
| 16 and 17 Years | 3 (30.0%) | 0 (0.0%) |
| 18 to 24 Years | 0 (0.0%) | 0 (0.0%) |
| 25 to 34 Years | 3 (1.8%) | 3 (2.6%) |
| 35 to 44 Years | 0 (0.0%) | 0 (0.0%) |
| 45 to 54 Years | 0 (0.0%) | 0 (0.0%) |
| 55 to 64 Years | 2 (2.3%) | 0 (0.0%) |
| 65 to 74 Years | 2 (4.4%) | 3 (3.3%) |
| 75 Years and over | 0 (0.0%) | 2 (11.1%) |
| Total | 10 (1.9%) | 17 (3.5%) |
Income Above Poverty by Sex and Age in Tres Pinos
According to the poverty statistics in Tres Pinos, males aged under 5 years and females aged 15 years are the age groups that are most secure financially, with 100.0% of males and 100.0% of females in these age groups living above the poverty line.
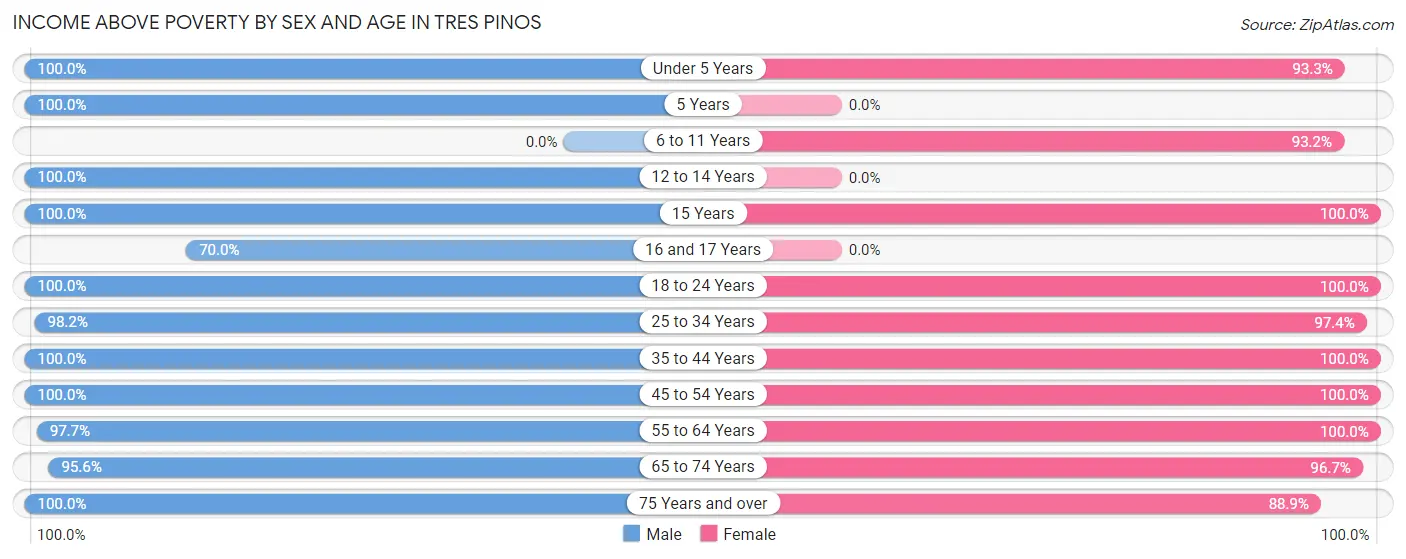
| Age Bracket | Male | Female |
| Under 5 Years | 15 (100.0%) | 28 (93.3%) |
| 5 Years | 15 (100.0%) | 0 (0.0%) |
| 6 to 11 Years | 0 (0.0%) | 41 (93.2%) |
| 12 to 14 Years | 14 (100.0%) | 0 (0.0%) |
| 15 Years | 9 (100.0%) | 21 (100.0%) |
| 16 and 17 Years | 7 (70.0%) | 0 (0.0%) |
| 18 to 24 Years | 47 (100.0%) | 7 (100.0%) |
| 25 to 34 Years | 159 (98.2%) | 112 (97.4%) |
| 35 to 44 Years | 5 (100.0%) | 5 (100.0%) |
| 45 to 54 Years | 70 (100.0%) | 67 (100.0%) |
| 55 to 64 Years | 86 (97.7%) | 84 (100.0%) |
| 65 to 74 Years | 43 (95.6%) | 87 (96.7%) |
| 75 Years and over | 41 (100.0%) | 16 (88.9%) |
| Total | 511 (98.1%) | 468 (96.5%) |
Income Below Poverty Among Married-Couple Families in Tres Pinos
The poverty statistics for married-couple families in Tres Pinos show that 2.0% or 5 of the total 249 families live below the poverty line. Families with 3 or 4 children have the highest poverty rate of 15.0%, comprising of 3 families. On the other hand, families with 1 or 2 children have the lowest poverty rate of 0.0%, which includes 0 families.
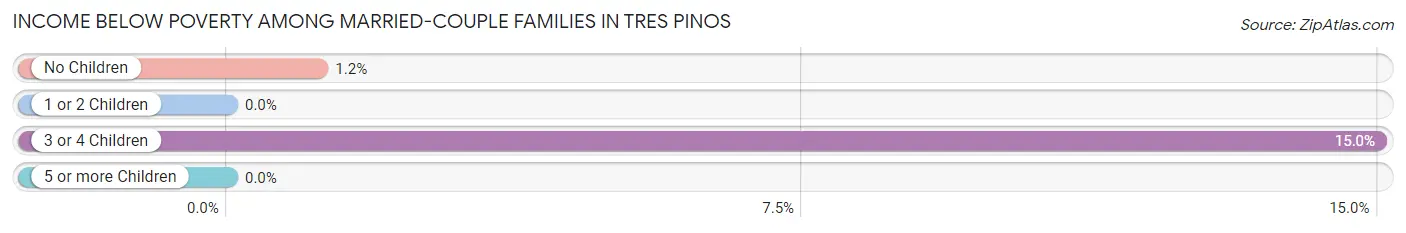
| Children | Above Poverty | Below Poverty |
| No Children | 168 (98.8%) | 2 (1.2%) |
| 1 or 2 Children | 51 (100.0%) | 0 (0.0%) |
| 3 or 4 Children | 17 (85.0%) | 3 (15.0%) |
| 5 or more Children | 8 (100.0%) | 0 (0.0%) |
| Total | 244 (98.0%) | 5 (2.0%) |
Income Below Poverty Among Single-Parent Households in Tres Pinos
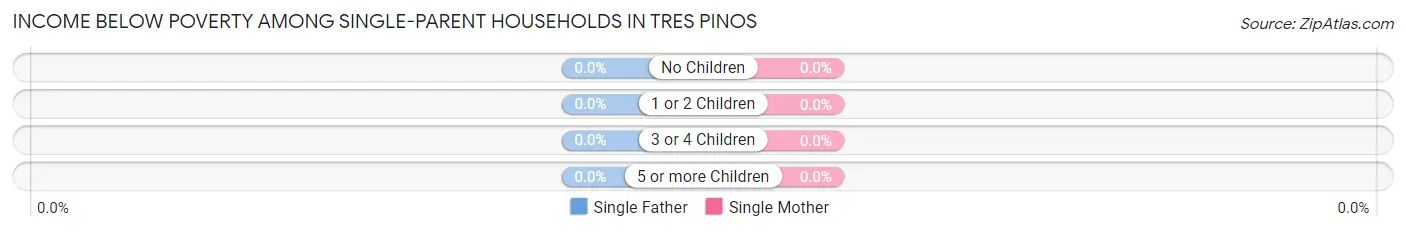
| Children | Single Father | Single Mother |
| No Children | 0 (0.0%) | 0 (0.0%) |
| 1 or 2 Children | 0 (0.0%) | 0 (0.0%) |
| 3 or 4 Children | 0 (0.0%) | 0 (0.0%) |
| 5 or more Children | 0 (0.0%) | 0 (0.0%) |
| Total | 0 (0.0%) | 0 (0.0%) |
Income Below Poverty Among Married-Couple vs Single-Parent Households in Tres Pinos
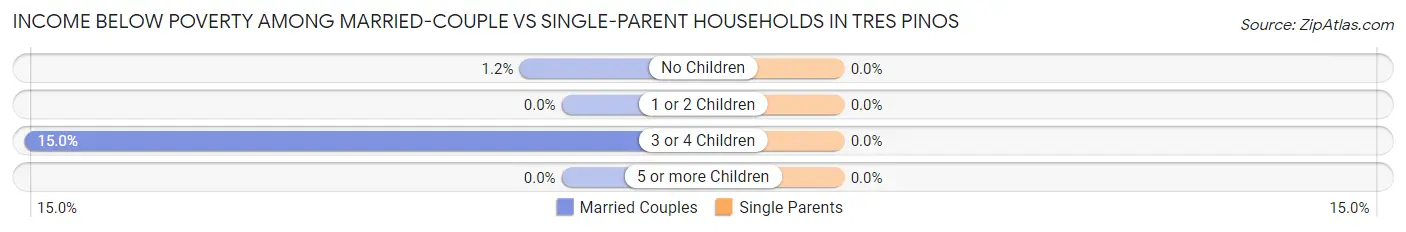
| Children | Married-Couple Families | Single-Parent Households |
| No Children | 2 (1.2%) | 0 (0.0%) |
| 1 or 2 Children | 0 (0.0%) | 0 (0.0%) |
| 3 or 4 Children | 3 (15.0%) | 0 (0.0%) |
| 5 or more Children | 0 (0.0%) | 0 (0.0%) |
| Total | 5 (2.0%) | 0 (0.0%) |
Race in Tres Pinos
The most populous races in Tres Pinos are White / Caucasian (700 | 69.6%), Hispanic or Latino (203 | 20.2%), and Two or more Races (175 | 17.4%).
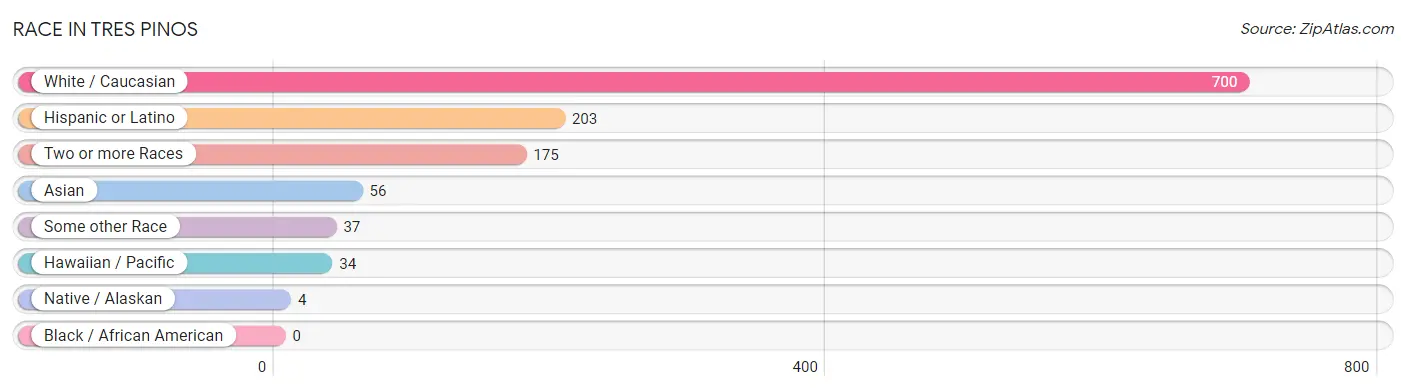
| Race | # Population | % Population |
| Asian | 56 | 5.6% |
| Black / African American | 0 | 0.0% |
| Hawaiian / Pacific | 34 | 3.4% |
| Hispanic or Latino | 203 | 20.2% |
| Native / Alaskan | 4 | 0.4% |
| White / Caucasian | 700 | 69.6% |
| Two or more Races | 175 | 17.4% |
| Some other Race | 37 | 3.7% |
| Total | 1,006 | 100.0% |
Ancestry in Tres Pinos
The most populous ancestries reported in Tres Pinos are English (209 | 20.8%), Mexican (196 | 19.5%), French (143 | 14.2%), Irish (139 | 13.8%), and Bhutanese (134 | 13.3%), together accounting for 81.6% of all Tres Pinos residents.
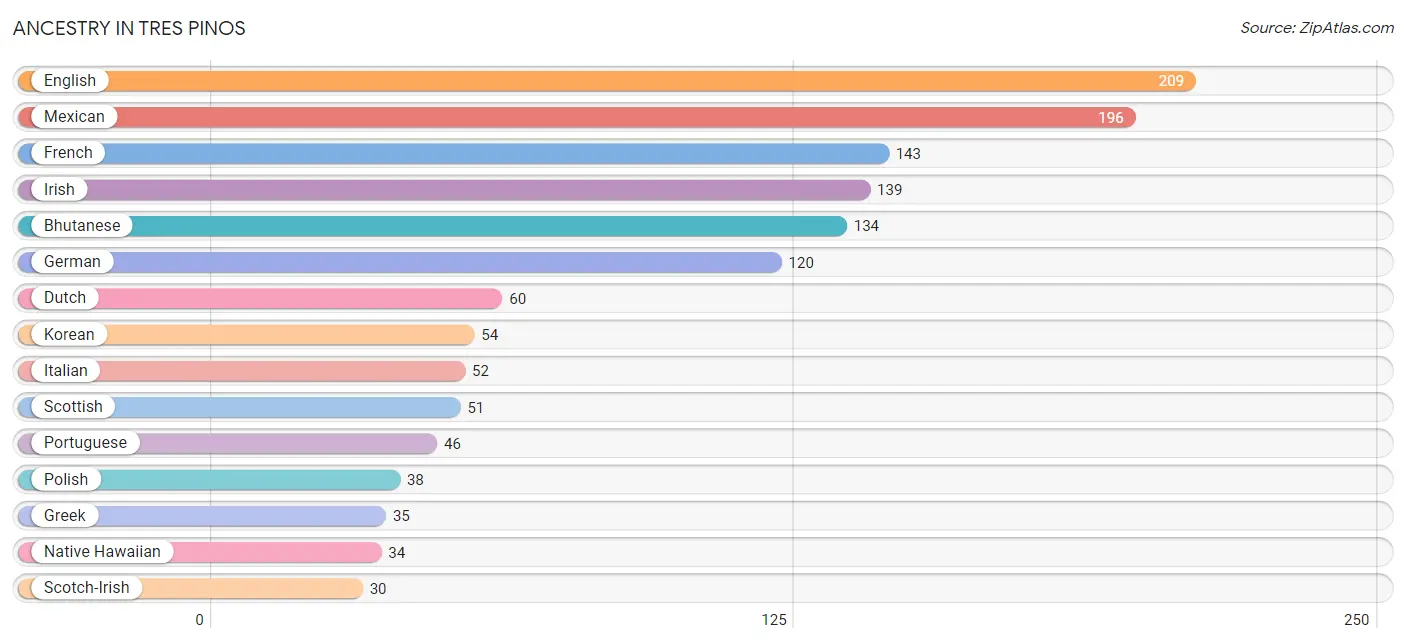
| Ancestry | # Population | % Population |
| American | 11 | 1.1% |
| Apache | 2 | 0.2% |
| Austrian | 6 | 0.6% |
| Basque | 22 | 2.2% |
| Bhutanese | 134 | 13.3% |
| British | 13 | 1.3% |
| Cherokee | 2 | 0.2% |
| Dutch | 60 | 6.0% |
| English | 209 | 20.8% |
| French | 143 | 14.2% |
| German | 120 | 11.9% |
| Greek | 35 | 3.5% |
| Irish | 139 | 13.8% |
| Italian | 52 | 5.2% |
| Korean | 54 | 5.4% |
| Mexican | 196 | 19.5% |
| Mexican American Indian | 4 | 0.4% |
| Native Hawaiian | 34 | 3.4% |
| Norwegian | 7 | 0.7% |
| Polish | 38 | 3.8% |
| Portuguese | 46 | 4.6% |
| Scotch-Irish | 30 | 3.0% |
| Scottish | 51 | 5.1% |
| Spaniard | 7 | 0.7% |
| Swedish | 26 | 2.6% |
| Swiss | 11 | 1.1% |
| Welsh | 2 | 0.2% | View All 27 Rows |
Immigrants in Tres Pinos
The most numerous immigrant groups reported in Tres Pinos came from Europe (52 | 5.2%), Northern Europe (52 | 5.2%), England (35 | 3.5%), Central America (31 | 3.1%), and Latin America (31 | 3.1%), together accounting for 20.0% of all Tres Pinos residents.
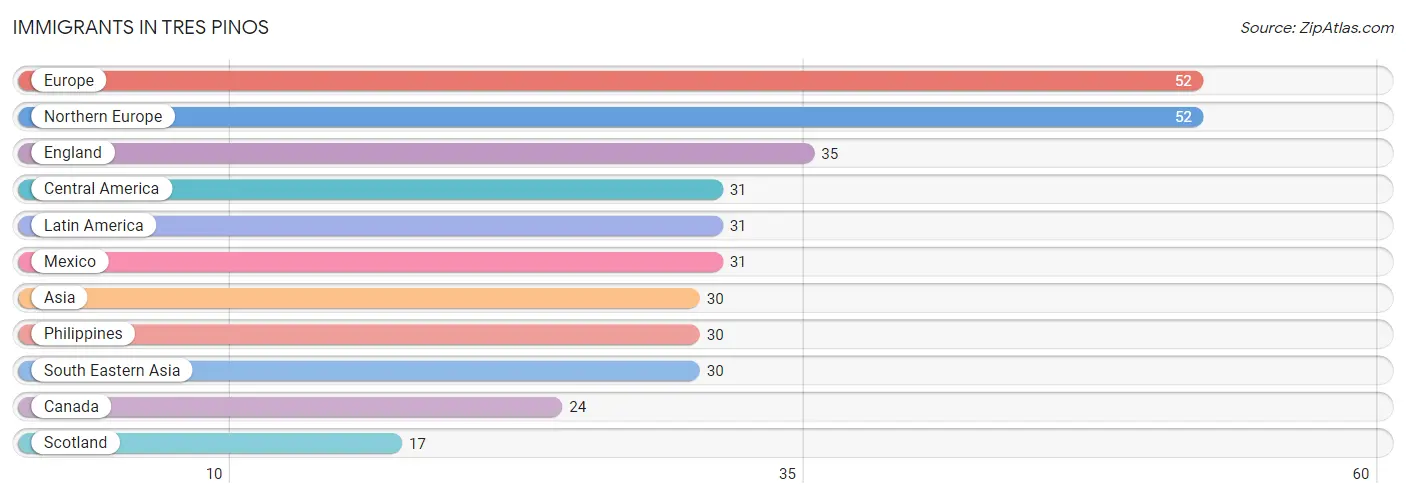
| Immigration Origin | # Population | % Population |
| Asia | 30 | 3.0% |
| Canada | 24 | 2.4% |
| Central America | 31 | 3.1% |
| England | 35 | 3.5% |
| Europe | 52 | 5.2% |
| Latin America | 31 | 3.1% |
| Mexico | 31 | 3.1% |
| Northern Europe | 52 | 5.2% |
| Philippines | 30 | 3.0% |
| Scotland | 17 | 1.7% |
| South Eastern Asia | 30 | 3.0% | View All 11 Rows |
Sex and Age in Tres Pinos
Sex and Age in Tres Pinos
The most populous age groups in Tres Pinos are 25 to 29 Years (93 | 17.8%) for men and 30 to 34 Years (98 | 20.2%) for women.
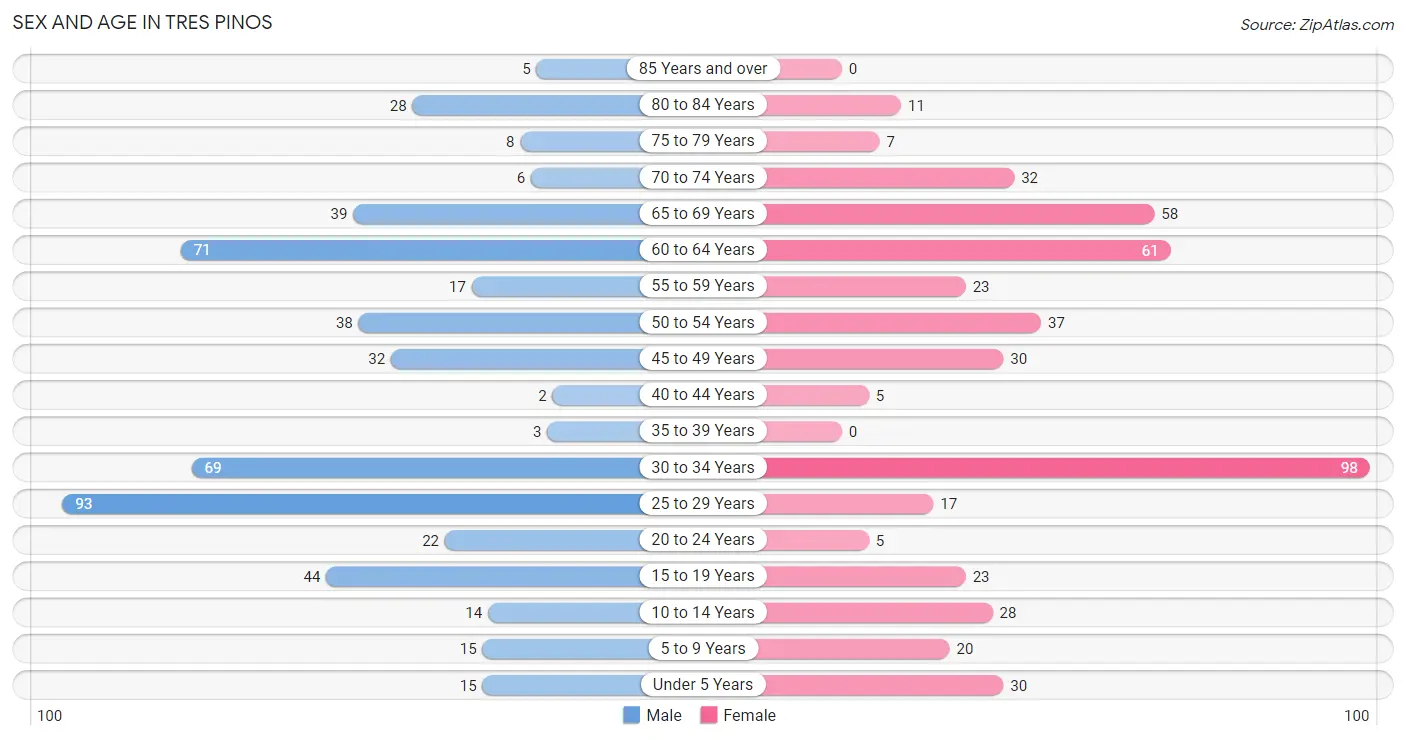
| Age Bracket | Male | Female |
| Under 5 Years | 15 (2.9%) | 30 (6.2%) |
| 5 to 9 Years | 15 (2.9%) | 20 (4.1%) |
| 10 to 14 Years | 14 (2.7%) | 28 (5.8%) |
| 15 to 19 Years | 44 (8.5%) | 23 (4.7%) |
| 20 to 24 Years | 22 (4.2%) | 5 (1.0%) |
| 25 to 29 Years | 93 (17.8%) | 17 (3.5%) |
| 30 to 34 Years | 69 (13.2%) | 98 (20.2%) |
| 35 to 39 Years | 3 (0.6%) | 0 (0.0%) |
| 40 to 44 Years | 2 (0.4%) | 5 (1.0%) |
| 45 to 49 Years | 32 (6.1%) | 30 (6.2%) |
| 50 to 54 Years | 38 (7.3%) | 37 (7.6%) |
| 55 to 59 Years | 17 (3.3%) | 23 (4.7%) |
| 60 to 64 Years | 71 (13.6%) | 61 (12.6%) |
| 65 to 69 Years | 39 (7.5%) | 58 (12.0%) |
| 70 to 74 Years | 6 (1.1%) | 32 (6.6%) |
| 75 to 79 Years | 8 (1.5%) | 7 (1.4%) |
| 80 to 84 Years | 28 (5.4%) | 11 (2.3%) |
| 85 Years and over | 5 (1.0%) | 0 (0.0%) |
| Total | 521 (100.0%) | 485 (100.0%) |
Families and Households in Tres Pinos
Median Family Size in Tres Pinos
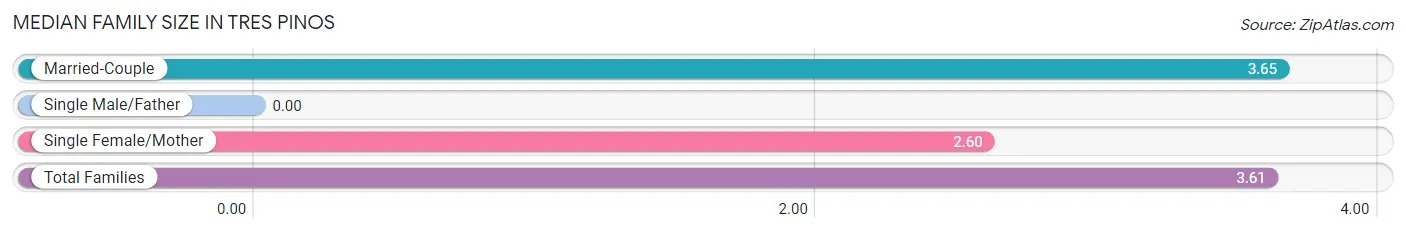
| Family Type | # Families | Family Size |
| Married-Couple | 249 (96.1%) | 3.65 |
| Single Male/Father | 0 (0.0%) | - |
| Single Female/Mother | 10 (3.9%) | 2.60 |
| Total Families | 259 (100.0%) | 3.61 |
Median Household Size in Tres Pinos
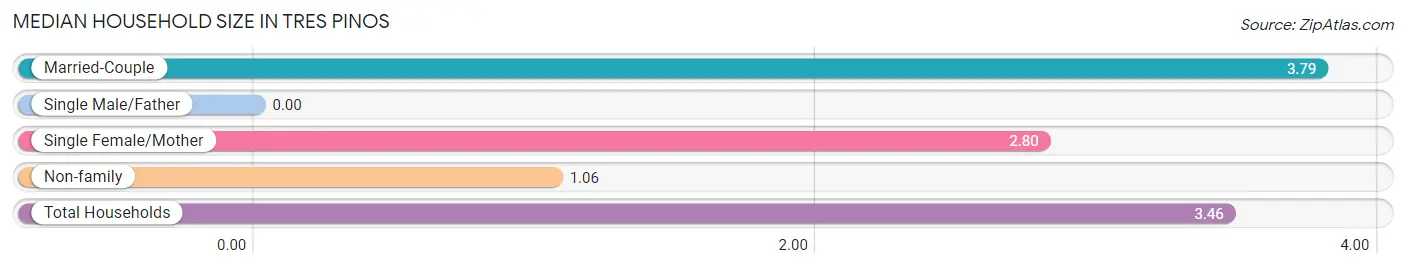
| Household Type | # Households | Household Size |
| Married-Couple | 249 (85.6%) | 3.79 |
| Single Male/Father | 0 (0.0%) | - |
| Single Female/Mother | 10 (3.4%) | 2.80 |
| Non-family | 32 (11.0%) | 1.06 |
| Total Households | 291 (100.0%) | 3.46 |
Household Size by Marriage Status in Tres Pinos
Out of a total of 291 households in Tres Pinos, 259 (89.0%) are family households, while 32 (11.0%) are nonfamily households. The most numerous type of family households are 2-person households, comprising 111, and the most common type of nonfamily households are 1-person households, comprising 30.
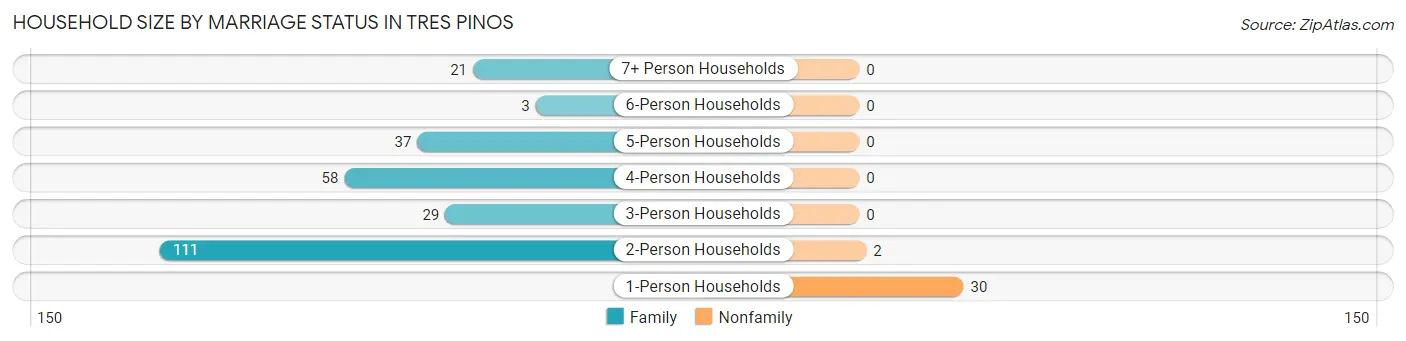
| Household Size | Family Households | Nonfamily Households |
| 1-Person Households | - | 30 (10.3%) |
| 2-Person Households | 111 (38.1%) | 2 (0.7%) |
| 3-Person Households | 29 (10.0%) | 0 (0.0%) |
| 4-Person Households | 58 (19.9%) | 0 (0.0%) |
| 5-Person Households | 37 (12.7%) | 0 (0.0%) |
| 6-Person Households | 3 (1.0%) | 0 (0.0%) |
| 7+ Person Households | 21 (7.2%) | 0 (0.0%) |
| Total | 259 (89.0%) | 32 (11.0%) |
Female Fertility in Tres Pinos
Fertility by Age in Tres Pinos
Average fertility rate in Tres Pinos is 50.0 births per 1,000 women. Women in the age bracket of 20 to 34 years have the highest fertility rate with 75.0 births per 1,000 women. Women in the age bracket of 20 to 34 years acount for 100.0% of all women with births.
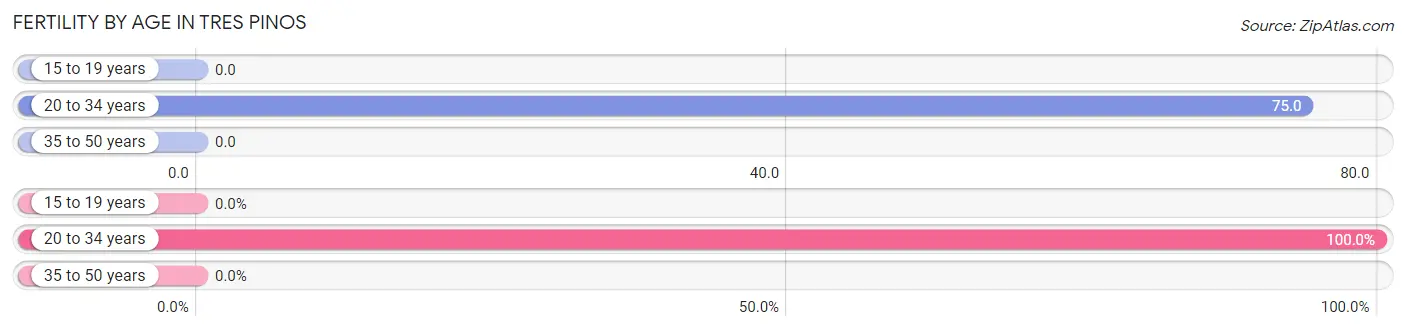
| Age Bracket | Women with Births | Births / 1,000 Women |
| 15 to 19 years | 0 (0.0%) | 0.0 |
| 20 to 34 years | 9 (100.0%) | 75.0 |
| 35 to 50 years | 0 (0.0%) | 0.0 |
| Total | 9 (100.0%) | 50.0 |
Fertility by Age by Marriage Status in Tres Pinos
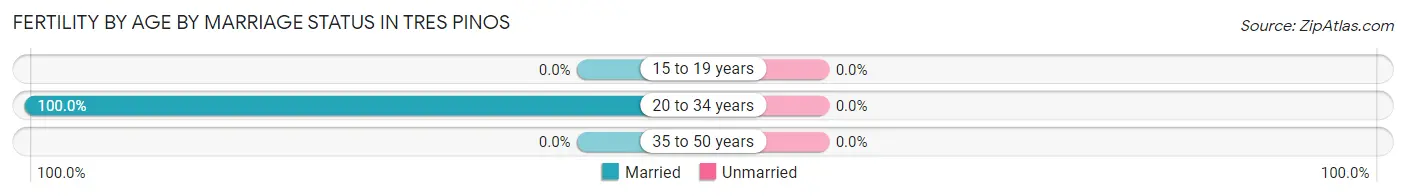
| Age Bracket | Married | Unmarried |
| 15 to 19 years | 0 (0.0%) | 0 (0.0%) |
| 20 to 34 years | 9 (100.0%) | 0 (0.0%) |
| 35 to 50 years | 0 (0.0%) | 0 (0.0%) |
| Total | 9 (100.0%) | 0 (0.0%) |
Fertility by Education in Tres Pinos
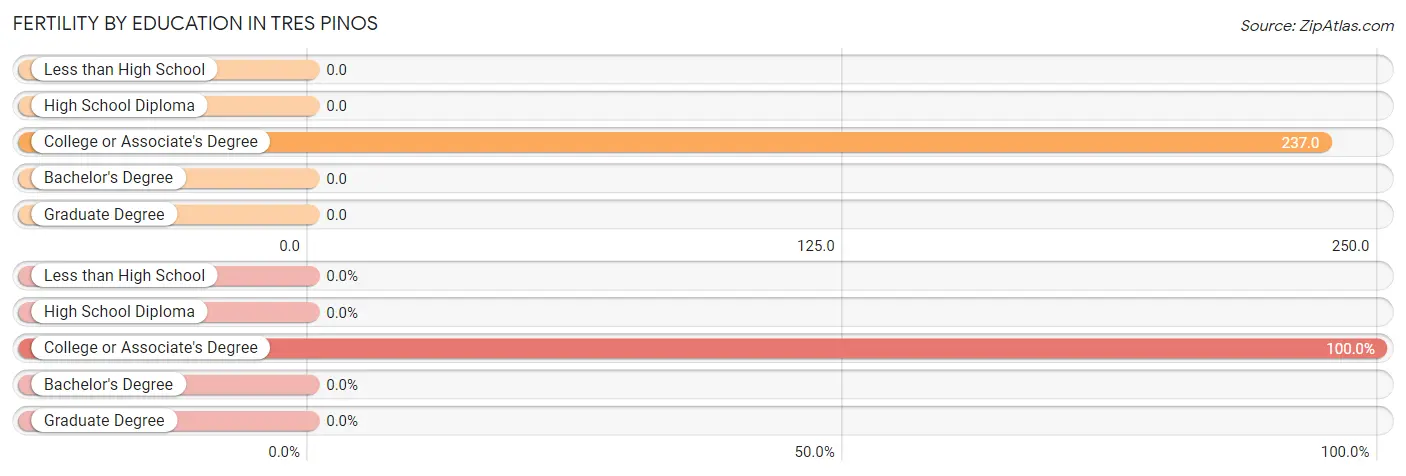
| Educational Attainment | Women with Births | Births / 1,000 Women |
| Less than High School | 0 (0.0%) | 0.0 |
| High School Diploma | 0 (0.0%) | 0.0 |
| College or Associate's Degree | 9 (100.0%) | 237.0 |
| Bachelor's Degree | 0 (0.0%) | 0.0 |
| Graduate Degree | 0 (0.0%) | 0.0 |
| Total | 9 (100.0%) | 50.0 |
Fertility by Education by Marriage Status in Tres Pinos
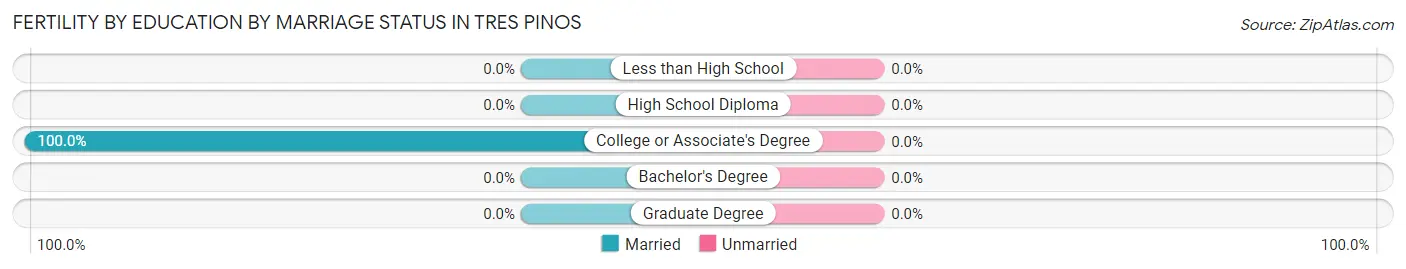
| Educational Attainment | Married | Unmarried |
| Less than High School | 0 (0.0%) | 0 (0.0%) |
| High School Diploma | 0 (0.0%) | 0 (0.0%) |
| College or Associate's Degree | 9 (100.0%) | 0 (0.0%) |
| Bachelor's Degree | 0 (0.0%) | 0 (0.0%) |
| Graduate Degree | 0 (0.0%) | 0 (0.0%) |
| Total | 9 (100.0%) | 0 (0.0%) |
Employment Characteristics in Tres Pinos
Employment by Class of Employer in Tres Pinos
Among the 616 employed individuals in Tres Pinos, private company employees (436 | 70.8%), not-for-profit organizations (54 | 8.8%), and local government employees (54 | 8.8%) make up the most common classes of employment.
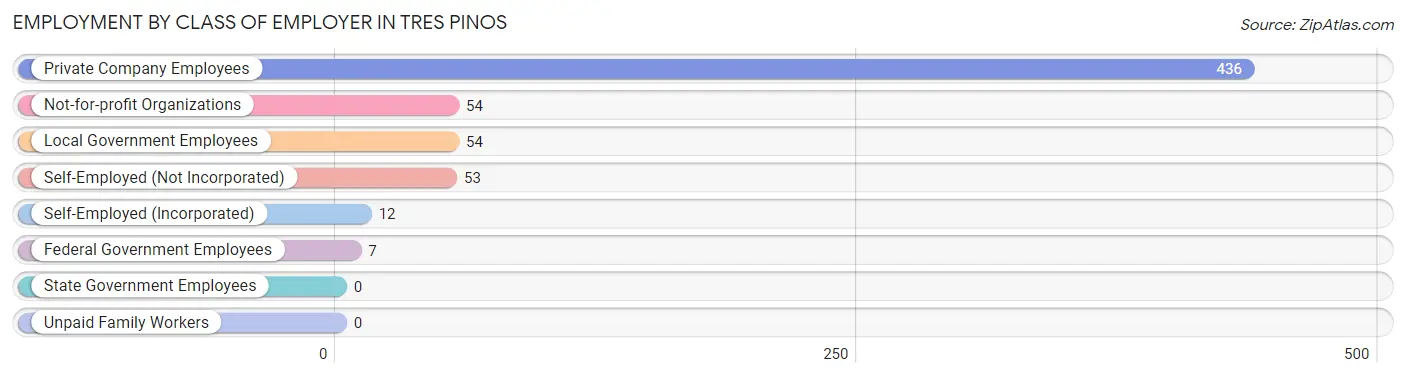
| Employer Class | # Employees | % Employees |
| Private Company Employees | 436 | 70.8% |
| Self-Employed (Incorporated) | 12 | 1.9% |
| Self-Employed (Not Incorporated) | 53 | 8.6% |
| Not-for-profit Organizations | 54 | 8.8% |
| Local Government Employees | 54 | 8.8% |
| State Government Employees | 0 | 0.0% |
| Federal Government Employees | 7 | 1.1% |
| Unpaid Family Workers | 0 | 0.0% |
| Total | 616 | 100.0% |
Employment Status by Age in Tres Pinos
According to the labor force statistics for Tres Pinos, out of the total population over 16 years of age (854), 77.8% or 664 individuals are in the labor force, with 5.7% or 38 of them unemployed. The age group with the highest labor force participation rate is 25 to 29 years, with 100.0% or 110 individuals in the labor force. Within the labor force, the 60 to 64 years age range has the highest percentage of unemployed individuals, with 28.1% or 25 of them being unemployed.
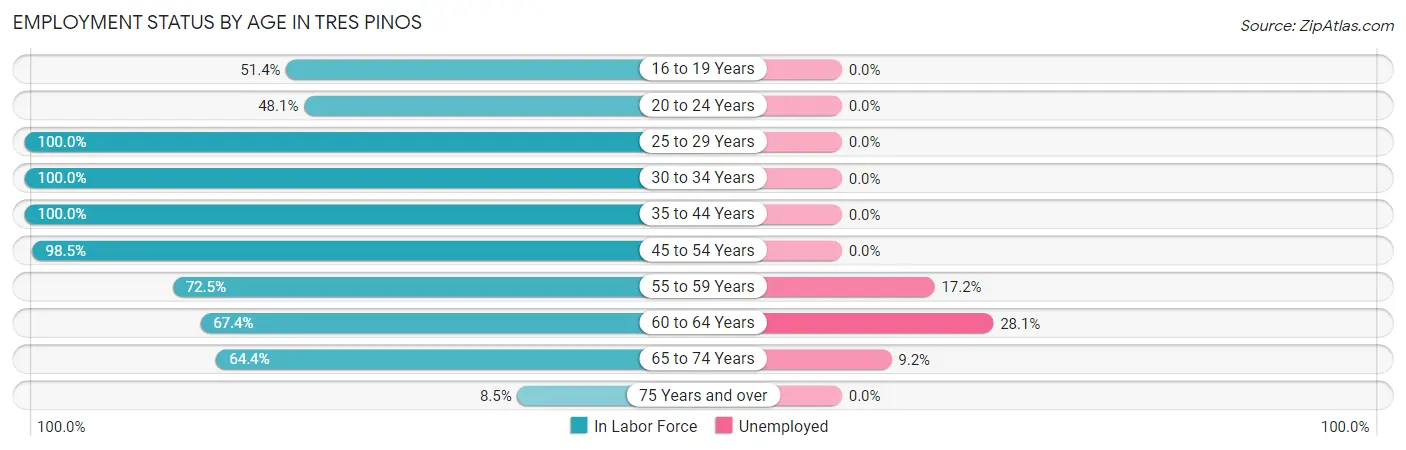
| Age Bracket | In Labor Force | Unemployed |
| 16 to 19 Years | 19 (51.4%) | 0 (0.0%) |
| 20 to 24 Years | 13 (48.1%) | 0 (0.0%) |
| 25 to 29 Years | 110 (100.0%) | 0 (0.0%) |
| 30 to 34 Years | 167 (100.0%) | 0 (0.0%) |
| 35 to 44 Years | 10 (100.0%) | 0 (0.0%) |
| 45 to 54 Years | 135 (98.5%) | 0 (0.0%) |
| 55 to 59 Years | 29 (72.5%) | 5 (17.2%) |
| 60 to 64 Years | 89 (67.4%) | 25 (28.1%) |
| 65 to 74 Years | 87 (64.4%) | 8 (9.2%) |
| 75 Years and over | 5 (8.5%) | 0 (0.0%) |
| Total | 664 (77.8%) | 38 (5.7%) |
Employment Status by Educational Attainment in Tres Pinos
According to labor force statistics for Tres Pinos, 90.6% of individuals (540) out of the total population between 25 and 64 years of age (596) are in the labor force, with 5.6% or 30 of them being unemployed. The group with the highest labor force participation rate are those with the educational attainment of less than high school, with 100.0% or 30 individuals in the labor force. Within the labor force, individuals with less than high school education have the highest percentage of unemployment, with 16.7% or 5 of them being unemployed.
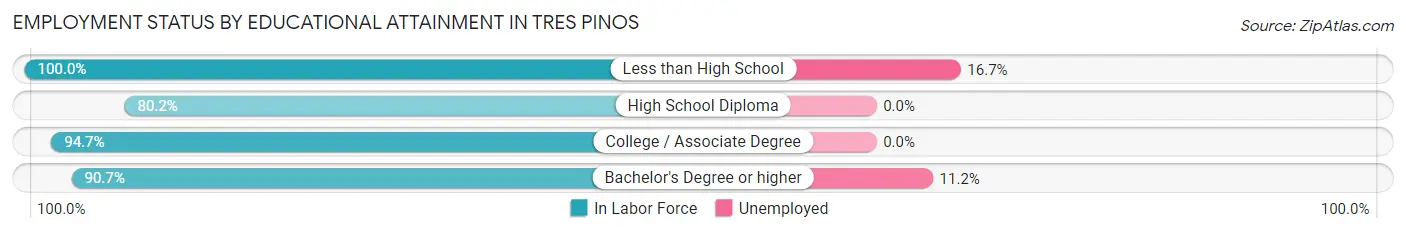
| Educational Attainment | In Labor Force | Unemployed |
| Less than High School | 30 (100.0%) | 5 (16.7%) |
| High School Diploma | 89 (80.2%) | 0 (0.0%) |
| College / Associate Degree | 197 (94.7%) | 0 (0.0%) |
| Bachelor's Degree or higher | 224 (90.7%) | 28 (11.2%) |
| Total | 540 (90.6%) | 33 (5.6%) |
Employment Occupations by Sex in Tres Pinos
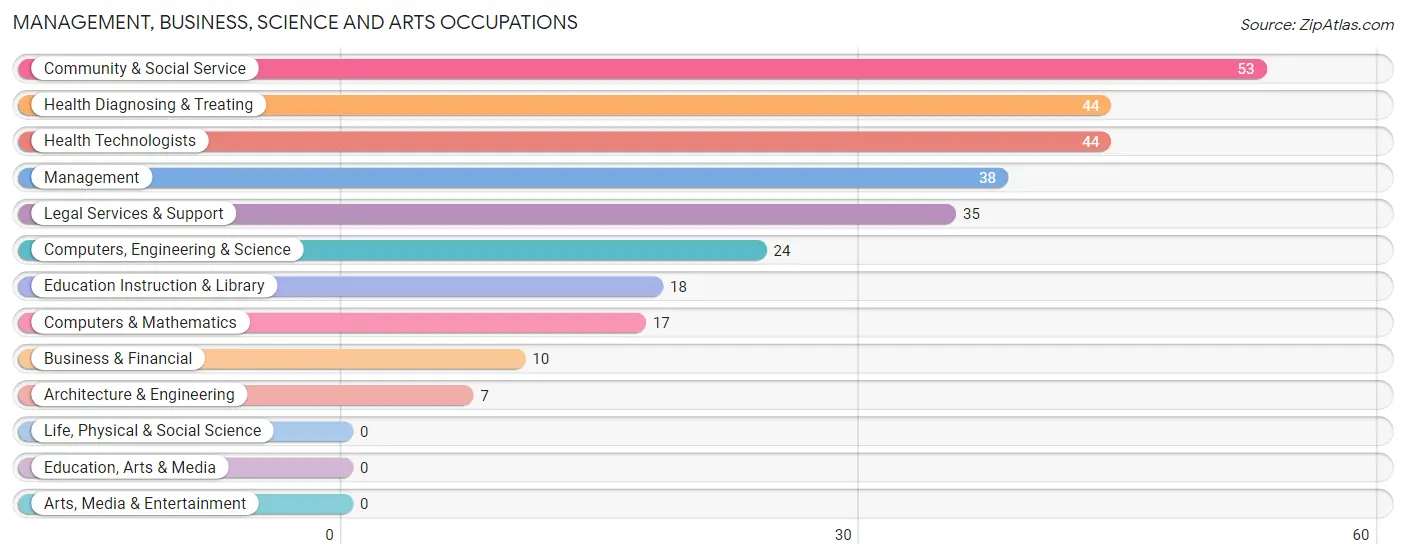
Management, Business, Science and Arts Occupations
The most common Management, Business, Science and Arts occupations in Tres Pinos are Community & Social Service (53 | 8.5%), Health Diagnosing & Treating (44 | 7.0%), Health Technologists (44 | 7.0%), Management (38 | 6.1%), and Legal Services & Support (35 | 5.6%).
Management, Business, Science and Arts Occupations by Sex
Within the Management, Business, Science and Arts occupations in Tres Pinos, the most male-oriented occupations are Computers, Engineering & Science (100.0%), Computers & Mathematics (100.0%), and Architecture & Engineering (100.0%), while the most female-oriented occupations are Education Instruction & Library (100.0%), Management (50.0%), and Community & Social Service (34.0%).
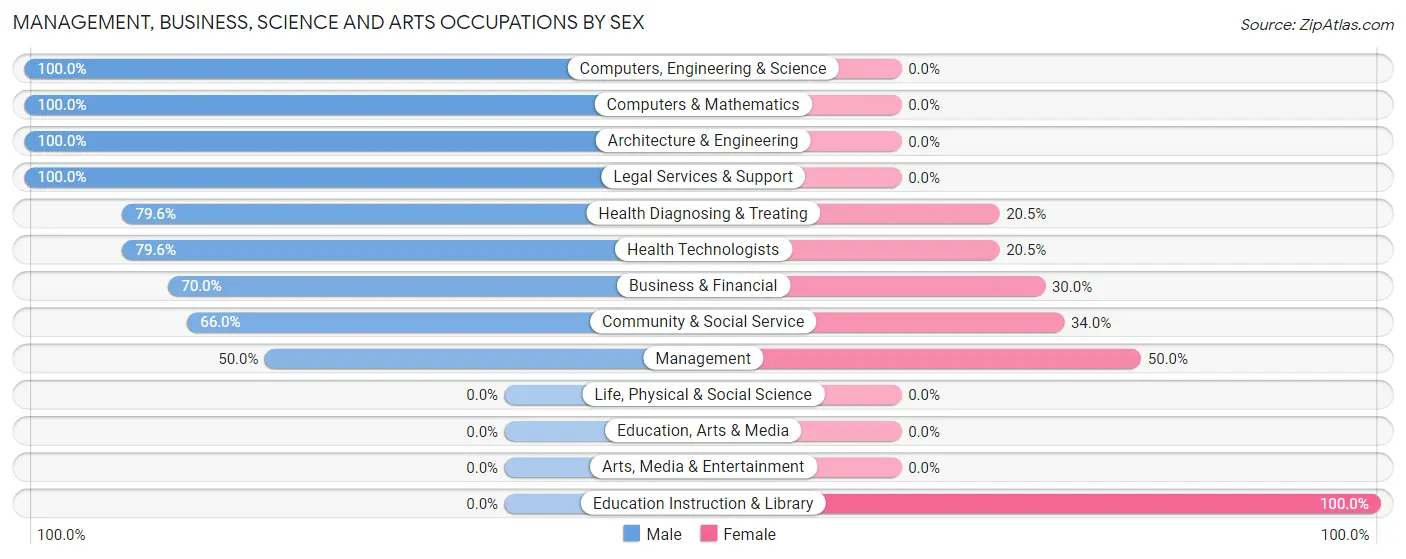
| Occupation | Male | Female |
| Management | 19 (50.0%) | 19 (50.0%) |
| Business & Financial | 7 (70.0%) | 3 (30.0%) |
| Computers, Engineering & Science | 24 (100.0%) | 0 (0.0%) |
| Computers & Mathematics | 17 (100.0%) | 0 (0.0%) |
| Architecture & Engineering | 7 (100.0%) | 0 (0.0%) |
| Life, Physical & Social Science | 0 (0.0%) | 0 (0.0%) |
| Community & Social Service | 35 (66.0%) | 18 (34.0%) |
| Education, Arts & Media | 0 (0.0%) | 0 (0.0%) |
| Legal Services & Support | 35 (100.0%) | 0 (0.0%) |
| Education Instruction & Library | 0 (0.0%) | 18 (100.0%) |
| Arts, Media & Entertainment | 0 (0.0%) | 0 (0.0%) |
| Health Diagnosing & Treating | 35 (79.5%) | 9 (20.4%) |
| Health Technologists | 35 (79.5%) | 9 (20.4%) |
| Total (Category) | 120 (71.0%) | 49 (29.0%) |
| Total (Overall) | 327 (52.2%) | 299 (47.8%) |
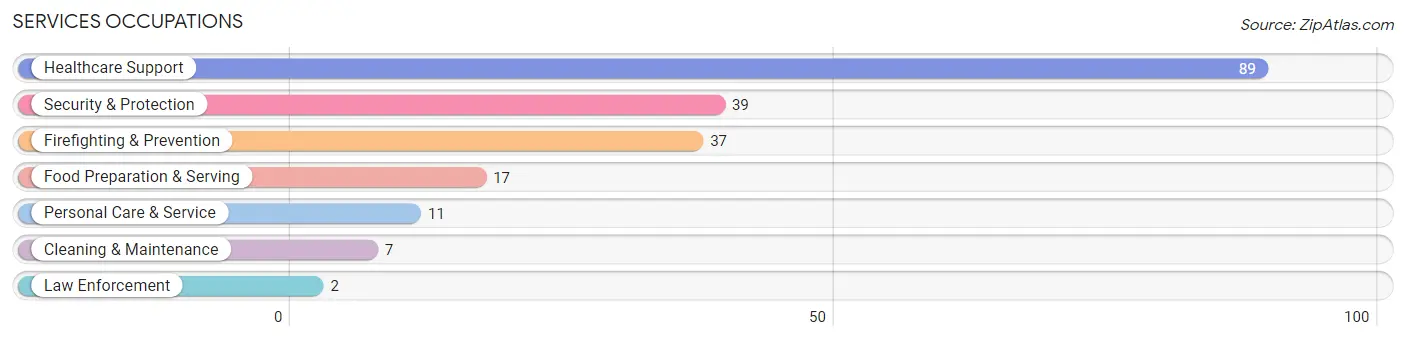
Services Occupations
The most common Services occupations in Tres Pinos are Healthcare Support (89 | 14.2%), Security & Protection (39 | 6.2%), Firefighting & Prevention (37 | 5.9%), Food Preparation & Serving (17 | 2.7%), and Personal Care & Service (11 | 1.8%).
Services Occupations by Sex
Within the Services occupations in Tres Pinos, the most male-oriented occupations are Law Enforcement (100.0%), Security & Protection (79.5%), and Firefighting & Prevention (78.4%), while the most female-oriented occupations are Food Preparation & Serving (100.0%), Cleaning & Maintenance (71.4%), and Personal Care & Service (54.5%).
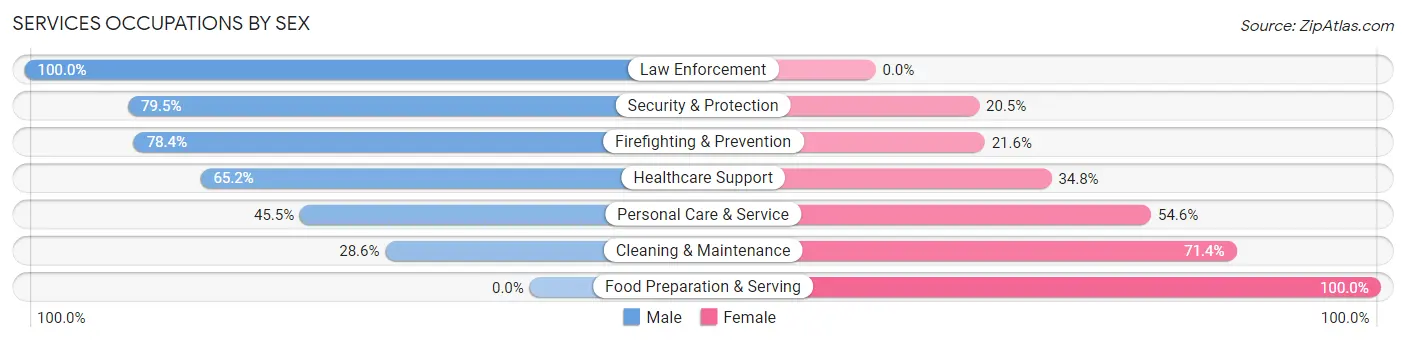
| Occupation | Male | Female |
| Healthcare Support | 58 (65.2%) | 31 (34.8%) |
| Security & Protection | 31 (79.5%) | 8 (20.5%) |
| Firefighting & Prevention | 29 (78.4%) | 8 (21.6%) |
| Law Enforcement | 2 (100.0%) | 0 (0.0%) |
| Food Preparation & Serving | 0 (0.0%) | 17 (100.0%) |
| Cleaning & Maintenance | 2 (28.6%) | 5 (71.4%) |
| Personal Care & Service | 5 (45.5%) | 6 (54.5%) |
| Total (Category) | 96 (58.9%) | 67 (41.1%) |
| Total (Overall) | 327 (52.2%) | 299 (47.8%) |
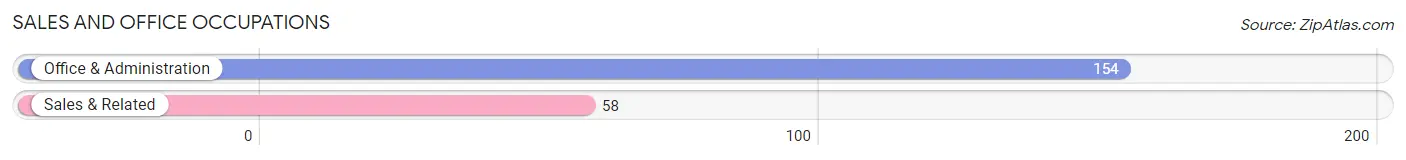
Sales and Office Occupations
The most common Sales and Office occupations in Tres Pinos are Office & Administration (154 | 24.6%), and Sales & Related (58 | 9.3%).
Sales and Office Occupations by Sex
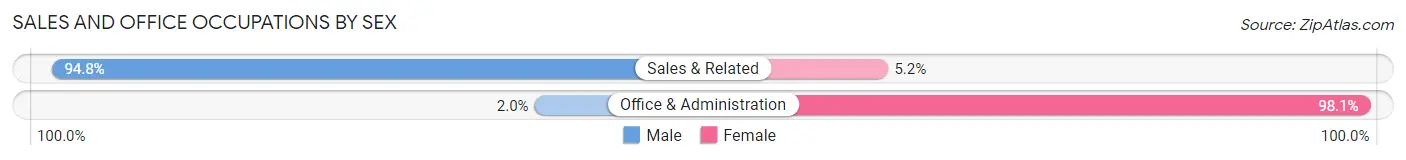
| Occupation | Male | Female |
| Sales & Related | 55 (94.8%) | 3 (5.2%) |
| Office & Administration | 3 (1.9%) | 151 (98.1%) |
| Total (Category) | 58 (27.4%) | 154 (72.6%) |
| Total (Overall) | 327 (52.2%) | 299 (47.8%) |
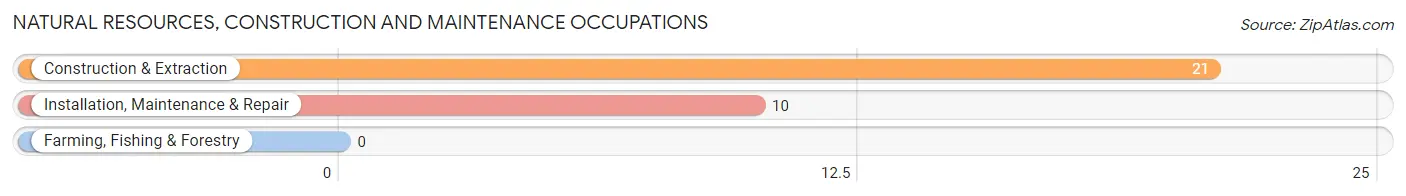
Natural Resources, Construction and Maintenance Occupations
The most common Natural Resources, Construction and Maintenance occupations in Tres Pinos are Construction & Extraction (21 | 3.4%), and Installation, Maintenance & Repair (10 | 1.6%).
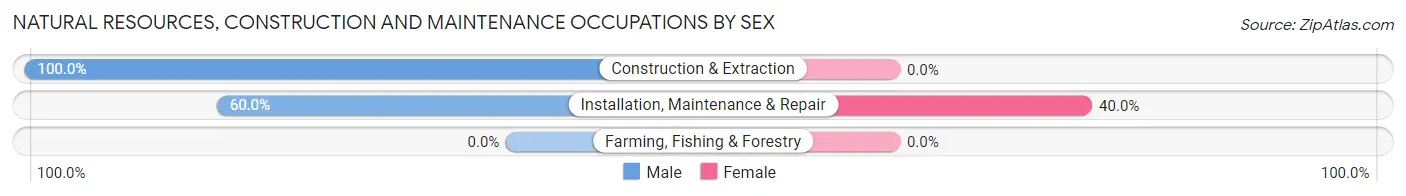
Natural Resources, Construction and Maintenance Occupations by Sex
| Occupation | Male | Female |
| Farming, Fishing & Forestry | 0 (0.0%) | 0 (0.0%) |
| Construction & Extraction | 21 (100.0%) | 0 (0.0%) |
| Installation, Maintenance & Repair | 6 (60.0%) | 4 (40.0%) |
| Total (Category) | 27 (87.1%) | 4 (12.9%) |
| Total (Overall) | 327 (52.2%) | 299 (47.8%) |
Production, Transportation and Moving Occupations
The most common Production, Transportation and Moving occupations in Tres Pinos are Production (38 | 6.1%), and Transportation (13 | 2.1%).
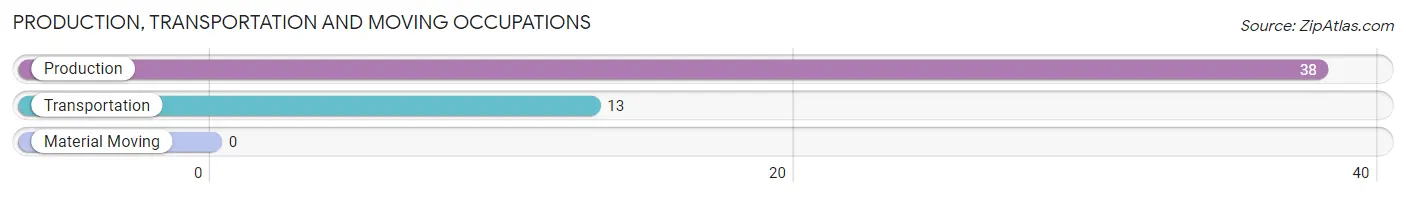
Production, Transportation and Moving Occupations by Sex
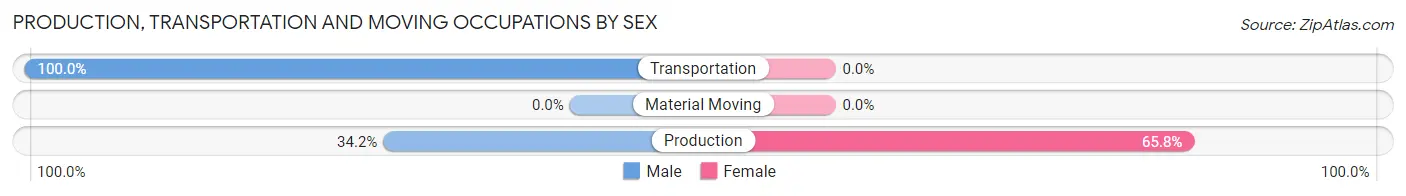
| Occupation | Male | Female |
| Production | 13 (34.2%) | 25 (65.8%) |
| Transportation | 13 (100.0%) | 0 (0.0%) |
| Material Moving | 0 (0.0%) | 0 (0.0%) |
| Total (Category) | 26 (51.0%) | 25 (49.0%) |
| Total (Overall) | 327 (52.2%) | 299 (47.8%) |
Employment Industries by Sex in Tres Pinos
Employment Industries in Tres Pinos
The major employment industries in Tres Pinos include Professional & Scientific (123 | 19.7%), Health Care & Social Assistance (79 | 12.6%), Transportation & Warehousing (67 | 10.7%), Finance & Insurance (60 | 9.6%), and Manufacturing (42 | 6.7%).
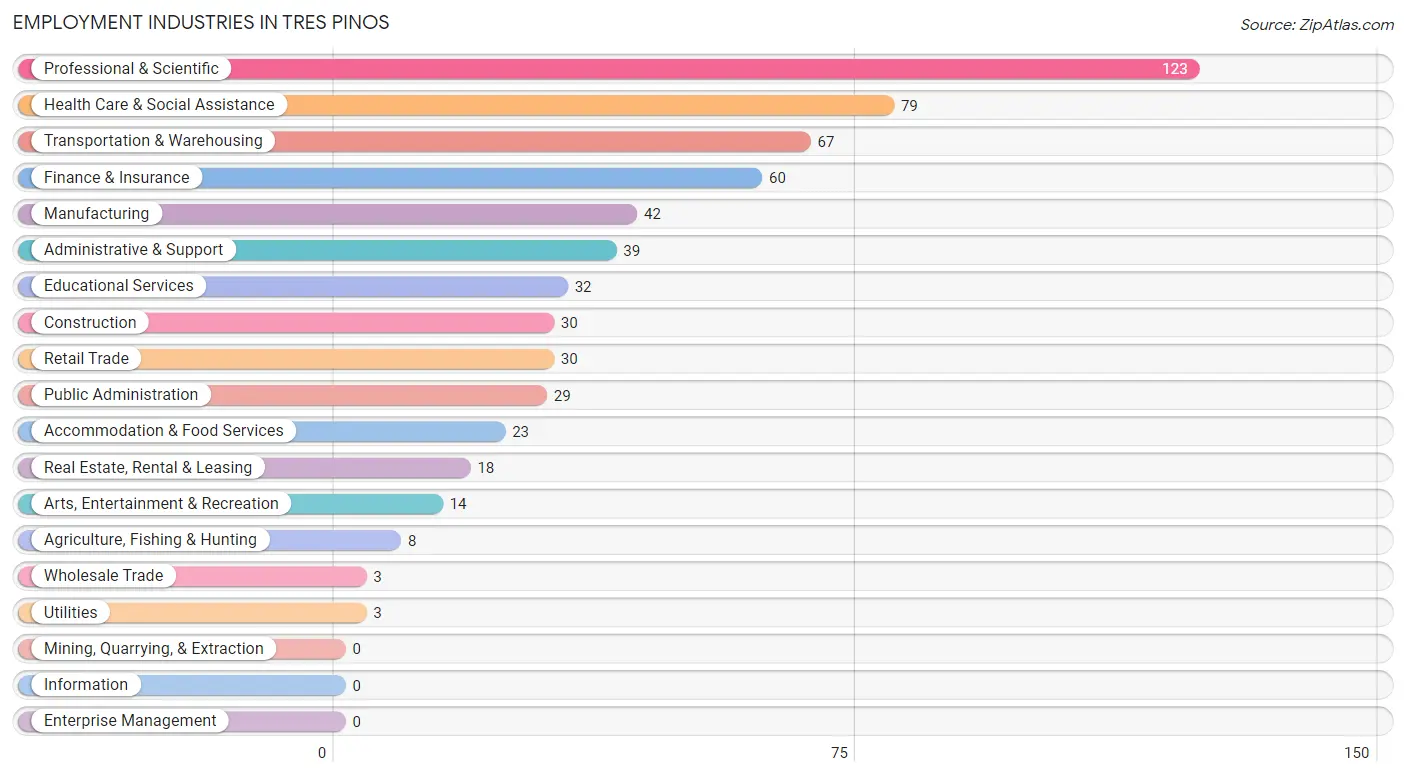
Employment Industries by Sex in Tres Pinos
The Tres Pinos industries that see more men than women are Agriculture, Fishing & Hunting (100.0%), Utilities (100.0%), and Manufacturing (80.9%), whereas the industries that tend to have a higher number of women are Wholesale Trade (100.0%), Educational Services (87.5%), and Transportation & Warehousing (86.6%).
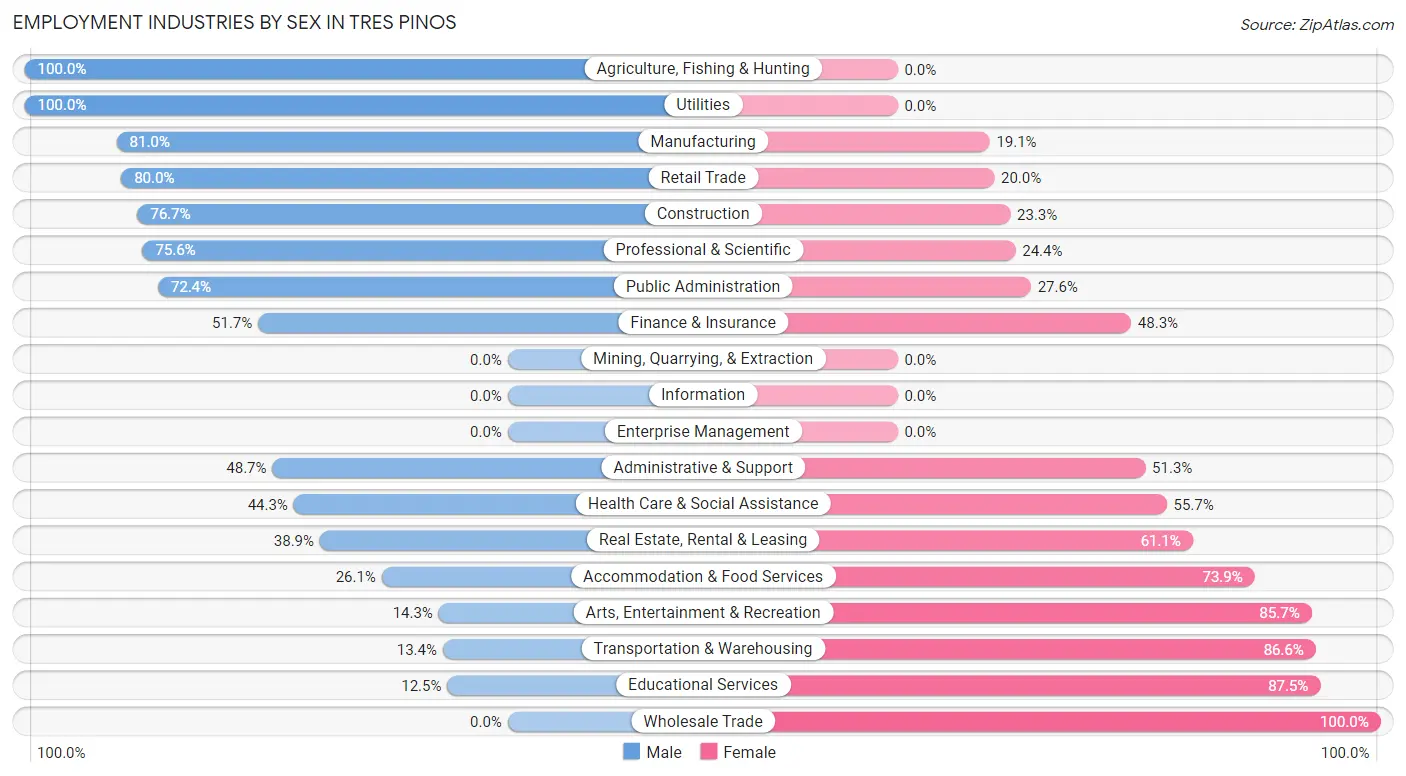
| Industry | Male | Female |
| Agriculture, Fishing & Hunting | 8 (100.0%) | 0 (0.0%) |
| Mining, Quarrying, & Extraction | 0 (0.0%) | 0 (0.0%) |
| Construction | 23 (76.7%) | 7 (23.3%) |
| Manufacturing | 34 (80.9%) | 8 (19.1%) |
| Wholesale Trade | 0 (0.0%) | 3 (100.0%) |
| Retail Trade | 24 (80.0%) | 6 (20.0%) |
| Transportation & Warehousing | 9 (13.4%) | 58 (86.6%) |
| Utilities | 3 (100.0%) | 0 (0.0%) |
| Information | 0 (0.0%) | 0 (0.0%) |
| Finance & Insurance | 31 (51.7%) | 29 (48.3%) |
| Real Estate, Rental & Leasing | 7 (38.9%) | 11 (61.1%) |
| Professional & Scientific | 93 (75.6%) | 30 (24.4%) |
| Enterprise Management | 0 (0.0%) | 0 (0.0%) |
| Administrative & Support | 19 (48.7%) | 20 (51.3%) |
| Educational Services | 4 (12.5%) | 28 (87.5%) |
| Health Care & Social Assistance | 35 (44.3%) | 44 (55.7%) |
| Arts, Entertainment & Recreation | 2 (14.3%) | 12 (85.7%) |
| Accommodation & Food Services | 6 (26.1%) | 17 (73.9%) |
| Public Administration | 21 (72.4%) | 8 (27.6%) |
| Total | 327 (52.2%) | 299 (47.8%) |
Education in Tres Pinos
School Enrollment in Tres Pinos
The most common levels of schooling among the 220 students in Tres Pinos are graduate / professional (76 | 34.5%), high school (55 | 25.0%), and elementary school (30 | 13.6%).
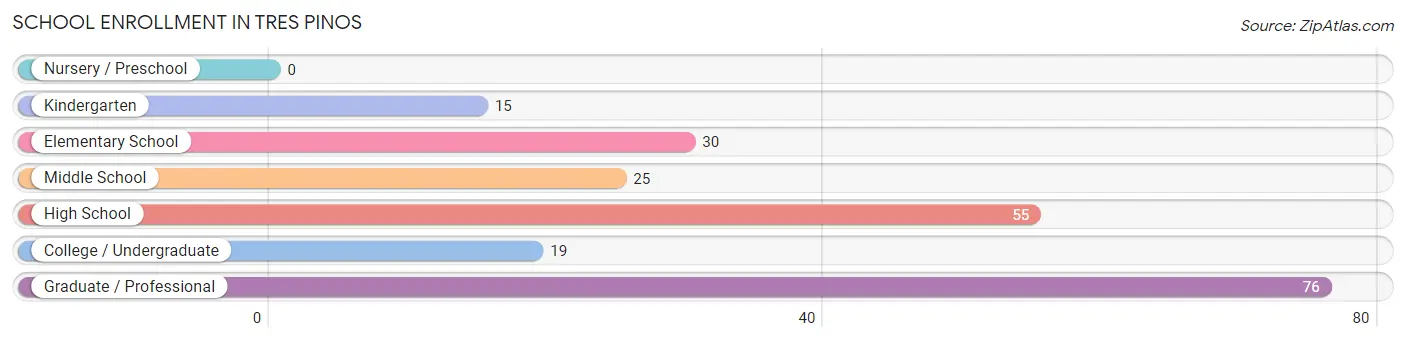
| School Level | # Students | % Students |
| Nursery / Preschool | 0 | 0.0% |
| Kindergarten | 15 | 6.8% |
| Elementary School | 30 | 13.6% |
| Middle School | 25 | 11.4% |
| High School | 55 | 25.0% |
| College / Undergraduate | 19 | 8.6% |
| Graduate / Professional | 76 | 34.5% |
| Total | 220 | 100.0% |
School Enrollment by Age by Funding Source in Tres Pinos
Out of a total of 220 students who are enrolled in schools in Tres Pinos, 33 (15.0%) attend a private institution, while the remaining 187 (85.0%) are enrolled in public schools. The age group of 35 years and over has the highest likelihood of being enrolled in private schools, with 26 (100.0% in the age bracket) enrolled. Conversely, the age group of 5 to 9 year old has the lowest likelihood of being enrolled in a private school, with 35 (100.0% in the age bracket) attending a public institution.
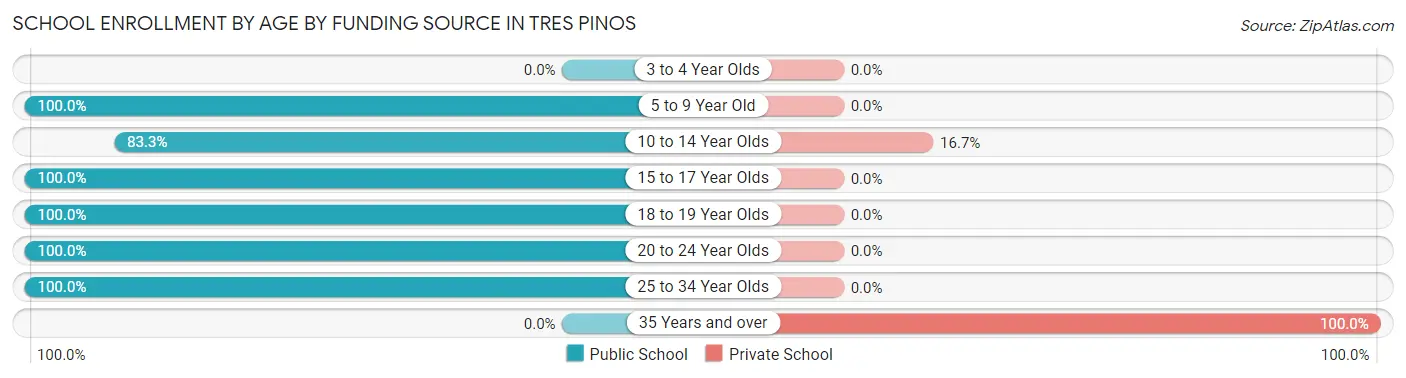
| Age Bracket | Public School | Private School |
| 3 to 4 Year Olds | 0 (0.0%) | 0 (0.0%) |
| 5 to 9 Year Old | 35 (100.0%) | 0 (0.0%) |
| 10 to 14 Year Olds | 35 (83.3%) | 7 (16.7%) |
| 15 to 17 Year Olds | 40 (100.0%) | 0 (0.0%) |
| 18 to 19 Year Olds | 19 (100.0%) | 0 (0.0%) |
| 20 to 24 Year Olds | 8 (100.0%) | 0 (0.0%) |
| 25 to 34 Year Olds | 50 (100.0%) | 0 (0.0%) |
| 35 Years and over | 0 (0.0%) | 26 (100.0%) |
| Total | 187 (85.0%) | 33 (15.0%) |
Educational Attainment by Field of Study in Tres Pinos
Science & technology (62 | 20.7%), bio, nature & agricultural (59 | 19.7%), business (47 | 15.7%), social sciences (41 | 13.7%), and arts & humanities (31 | 10.3%) are the most common fields of study among 300 individuals in Tres Pinos who have obtained a bachelor's degree or higher.
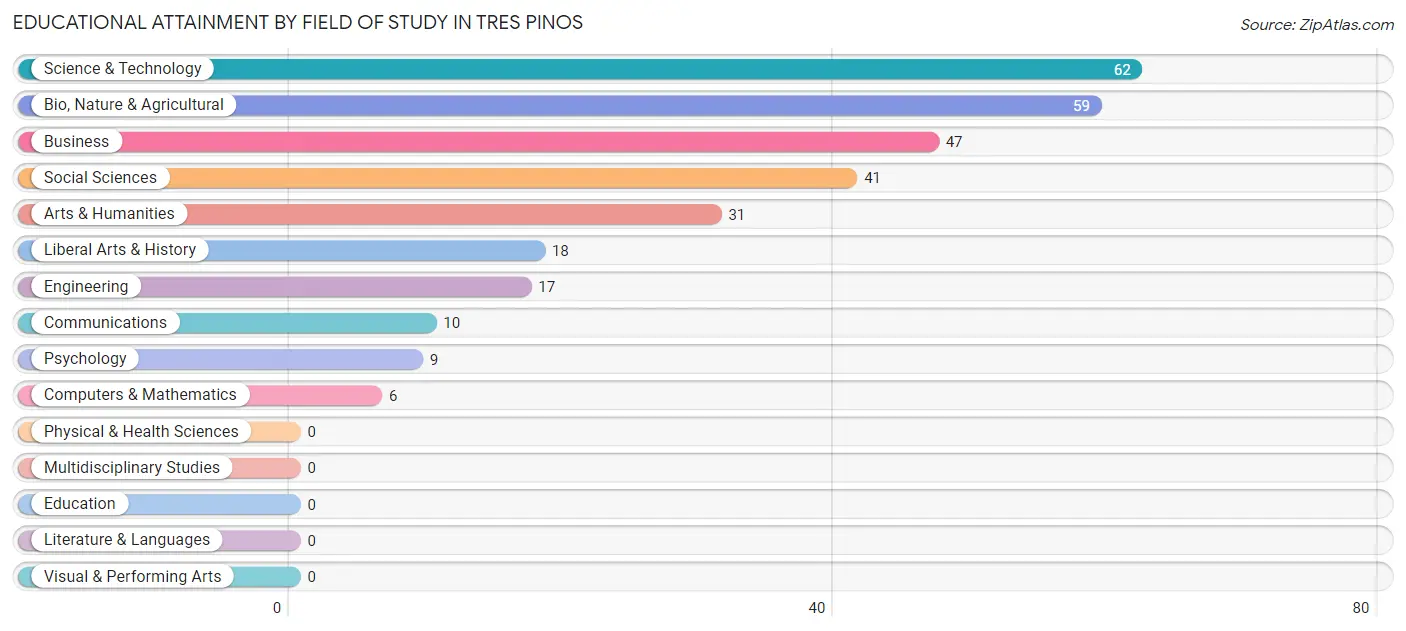
| Field of Study | # Graduates | % Graduates |
| Computers & Mathematics | 6 | 2.0% |
| Bio, Nature & Agricultural | 59 | 19.7% |
| Physical & Health Sciences | 0 | 0.0% |
| Psychology | 9 | 3.0% |
| Social Sciences | 41 | 13.7% |
| Engineering | 17 | 5.7% |
| Multidisciplinary Studies | 0 | 0.0% |
| Science & Technology | 62 | 20.7% |
| Business | 47 | 15.7% |
| Education | 0 | 0.0% |
| Literature & Languages | 0 | 0.0% |
| Liberal Arts & History | 18 | 6.0% |
| Visual & Performing Arts | 0 | 0.0% |
| Communications | 10 | 3.3% |
| Arts & Humanities | 31 | 10.3% |
| Total | 300 | 100.0% |
Transportation & Commute in Tres Pinos
Vehicle Availability by Sex in Tres Pinos
The most prevalent vehicle ownership categories in Tres Pinos are males with 3 vehicles (132, accounting for 40.6%) and females with 3 vehicles (66, making up 45.4%).
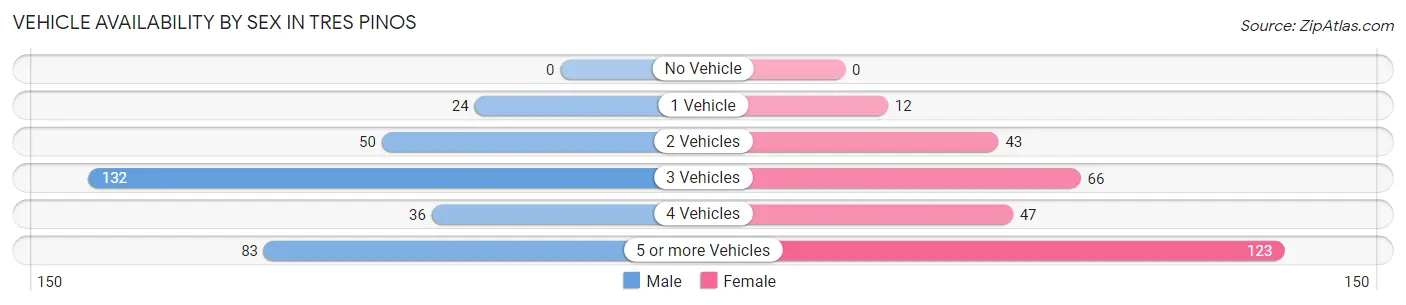
| Vehicles Available | Male | Female |
| No Vehicle | 0 (0.0%) | 0 (0.0%) |
| 1 Vehicle | 24 (7.4%) | 12 (4.1%) |
| 2 Vehicles | 50 (15.4%) | 43 (14.8%) |
| 3 Vehicles | 132 (40.6%) | 66 (22.7%) |
| 4 Vehicles | 36 (11.1%) | 47 (16.2%) |
| 5 or more Vehicles | 83 (25.5%) | 123 (42.3%) |
| Total | 325 (100.0%) | 291 (100.0%) |
Commute Time in Tres Pinos
The most frequently occuring commute durations in Tres Pinos are 20 to 24 minutes (111 commuters, 20.9%), 60 to 89 minutes (100 commuters, 18.8%), and 90 or more minutes (98 commuters, 18.4%).
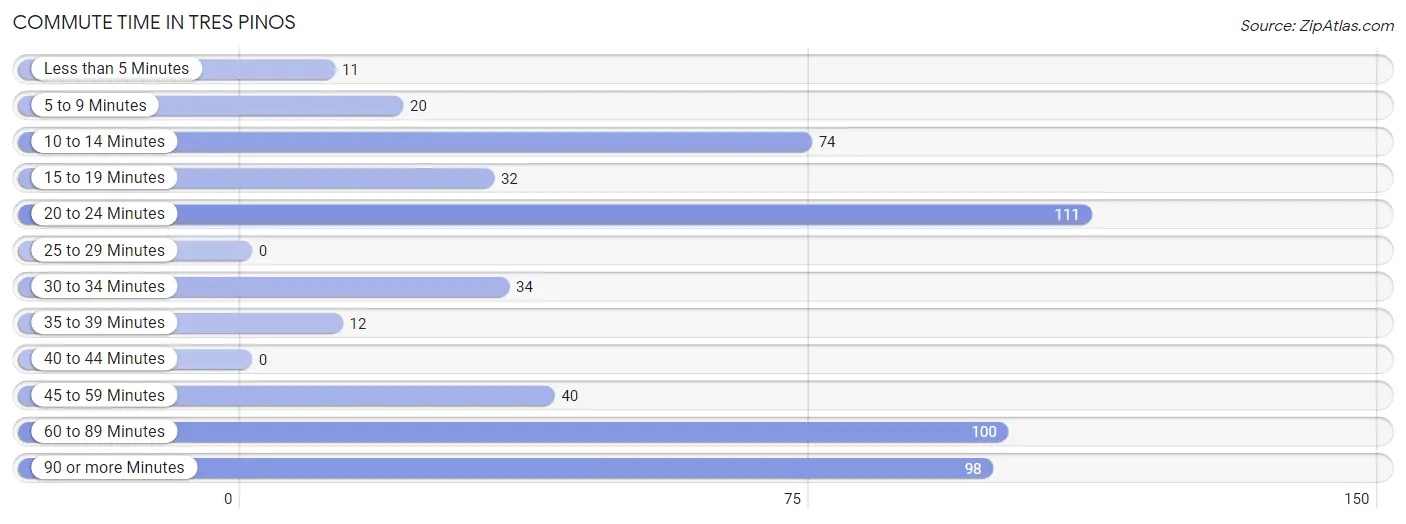
| Commute Time | # Commuters | % Commuters |
| Less than 5 Minutes | 11 | 2.1% |
| 5 to 9 Minutes | 20 | 3.8% |
| 10 to 14 Minutes | 74 | 13.9% |
| 15 to 19 Minutes | 32 | 6.0% |
| 20 to 24 Minutes | 111 | 20.9% |
| 25 to 29 Minutes | 0 | 0.0% |
| 30 to 34 Minutes | 34 | 6.4% |
| 35 to 39 Minutes | 12 | 2.3% |
| 40 to 44 Minutes | 0 | 0.0% |
| 45 to 59 Minutes | 40 | 7.5% |
| 60 to 89 Minutes | 100 | 18.8% |
| 90 or more Minutes | 98 | 18.4% |
Commute Time by Sex in Tres Pinos
The most common commute times in Tres Pinos are 60 to 89 minutes (67 commuters, 24.8%) for males and 20 to 24 minutes (83 commuters, 31.7%) for females.
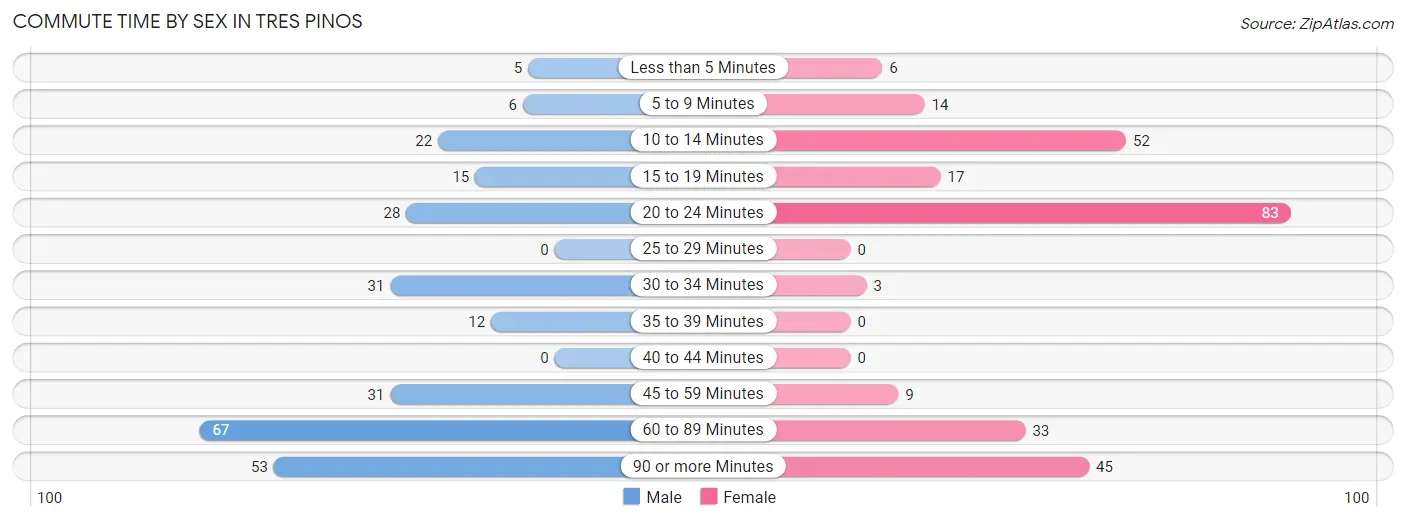
| Commute Time | Male | Female |
| Less than 5 Minutes | 5 (1.8%) | 6 (2.3%) |
| 5 to 9 Minutes | 6 (2.2%) | 14 (5.3%) |
| 10 to 14 Minutes | 22 (8.2%) | 52 (19.9%) |
| 15 to 19 Minutes | 15 (5.6%) | 17 (6.5%) |
| 20 to 24 Minutes | 28 (10.4%) | 83 (31.7%) |
| 25 to 29 Minutes | 0 (0.0%) | 0 (0.0%) |
| 30 to 34 Minutes | 31 (11.5%) | 3 (1.1%) |
| 35 to 39 Minutes | 12 (4.4%) | 0 (0.0%) |
| 40 to 44 Minutes | 0 (0.0%) | 0 (0.0%) |
| 45 to 59 Minutes | 31 (11.5%) | 9 (3.4%) |
| 60 to 89 Minutes | 67 (24.8%) | 33 (12.6%) |
| 90 or more Minutes | 53 (19.6%) | 45 (17.2%) |
Time of Departure to Work by Sex in Tres Pinos
The most frequent times of departure to work in Tres Pinos are 6:30 AM to 6:59 AM (96, 35.6%) for males and 5:30 AM to 5:59 AM (57, 21.8%) for females.
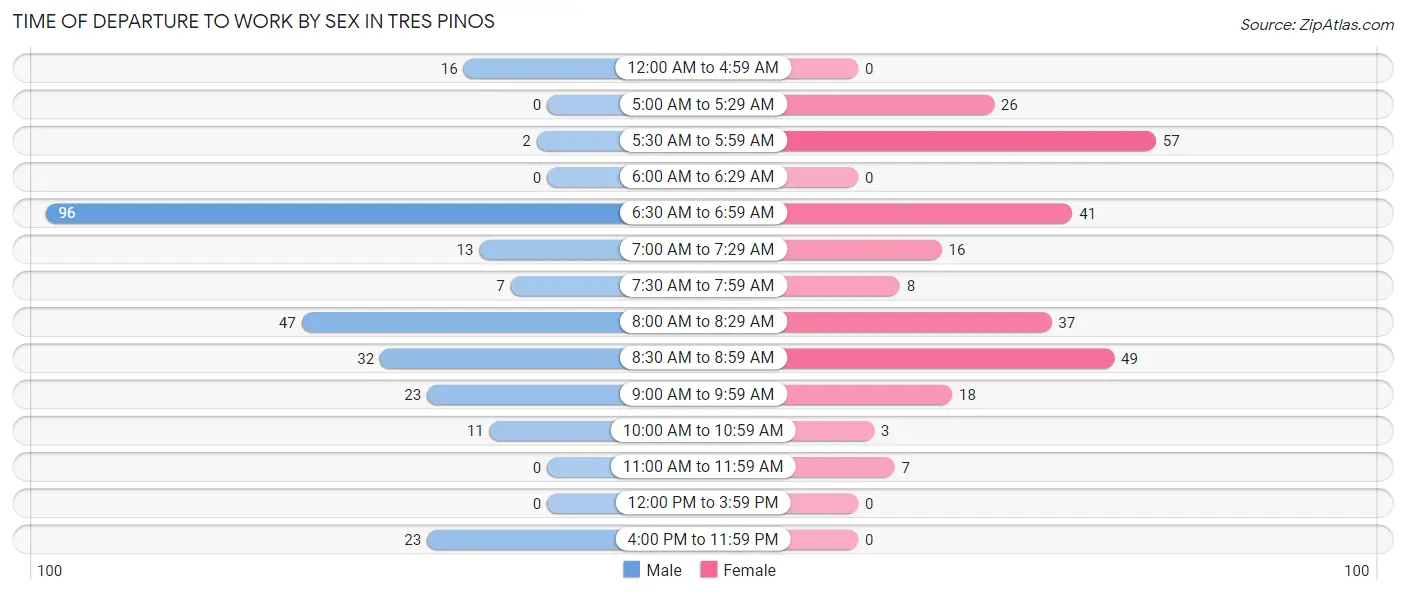
| Time of Departure | Male | Female |
| 12:00 AM to 4:59 AM | 16 (5.9%) | 0 (0.0%) |
| 5:00 AM to 5:29 AM | 0 (0.0%) | 26 (9.9%) |
| 5:30 AM to 5:59 AM | 2 (0.7%) | 57 (21.8%) |
| 6:00 AM to 6:29 AM | 0 (0.0%) | 0 (0.0%) |
| 6:30 AM to 6:59 AM | 96 (35.6%) | 41 (15.7%) |
| 7:00 AM to 7:29 AM | 13 (4.8%) | 16 (6.1%) |
| 7:30 AM to 7:59 AM | 7 (2.6%) | 8 (3.0%) |
| 8:00 AM to 8:29 AM | 47 (17.4%) | 37 (14.1%) |
| 8:30 AM to 8:59 AM | 32 (11.8%) | 49 (18.7%) |
| 9:00 AM to 9:59 AM | 23 (8.5%) | 18 (6.9%) |
| 10:00 AM to 10:59 AM | 11 (4.1%) | 3 (1.1%) |
| 11:00 AM to 11:59 AM | 0 (0.0%) | 7 (2.7%) |
| 12:00 PM to 3:59 PM | 0 (0.0%) | 0 (0.0%) |
| 4:00 PM to 11:59 PM | 23 (8.5%) | 0 (0.0%) |
| Total | 270 (100.0%) | 262 (100.0%) |
Housing Occupancy in Tres Pinos
Occupancy by Ownership in Tres Pinos
Of the total 291 dwellings in Tres Pinos, owner-occupied units account for 270 (92.8%), while renter-occupied units make up 21 (7.2%).
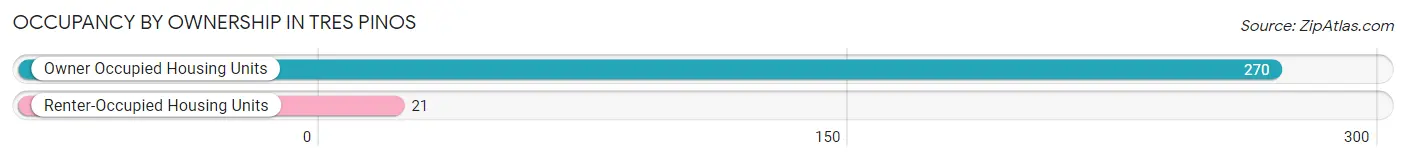
| Occupancy | # Housing Units | % Housing Units |
| Owner Occupied Housing Units | 270 | 92.8% |
| Renter-Occupied Housing Units | 21 | 7.2% |
| Total Occupied Housing Units | 291 | 100.0% |
Occupancy by Household Size in Tres Pinos
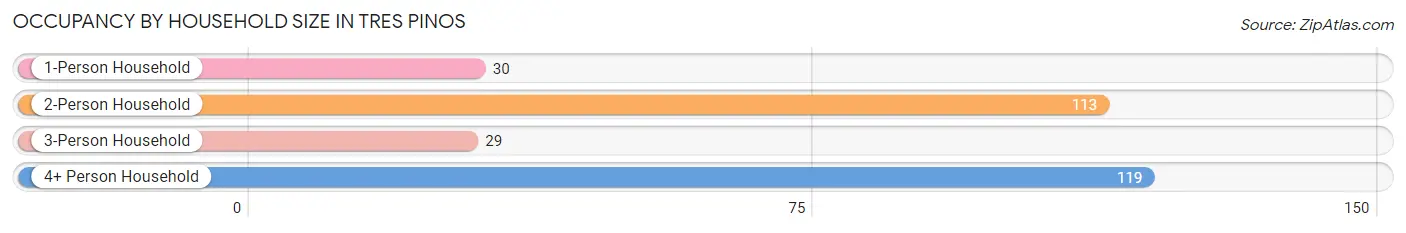
| Household Size | # Housing Units | % Housing Units |
| 1-Person Household | 30 | 10.3% |
| 2-Person Household | 113 | 38.8% |
| 3-Person Household | 29 | 10.0% |
| 4+ Person Household | 119 | 40.9% |
| Total Housing Units | 291 | 100.0% |
Occupancy by Ownership by Household Size in Tres Pinos
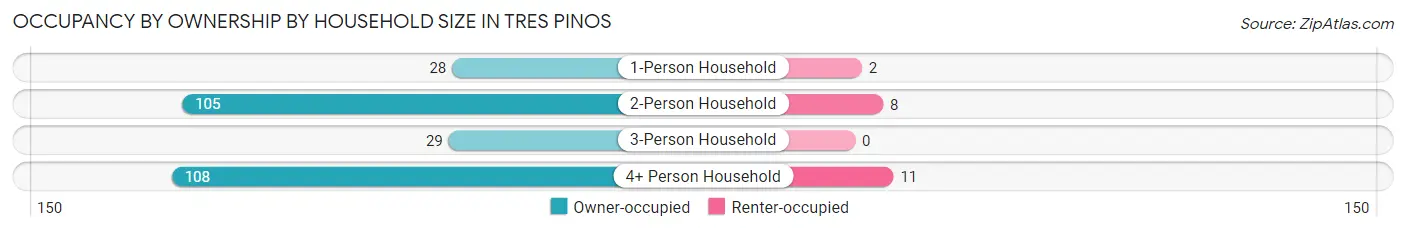
| Household Size | Owner-occupied | Renter-occupied |
| 1-Person Household | 28 (93.3%) | 2 (6.7%) |
| 2-Person Household | 105 (92.9%) | 8 (7.1%) |
| 3-Person Household | 29 (100.0%) | 0 (0.0%) |
| 4+ Person Household | 108 (90.8%) | 11 (9.2%) |
| Total Housing Units | 270 (92.8%) | 21 (7.2%) |
Occupancy by Educational Attainment in Tres Pinos
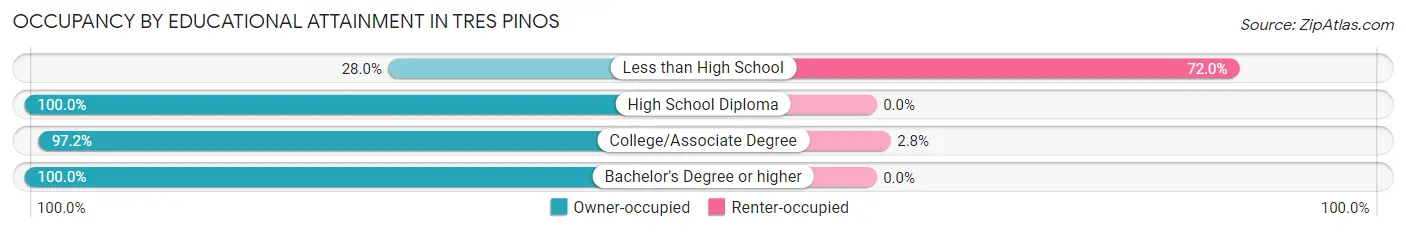
| Household Size | Owner-occupied | Renter-occupied |
| Less than High School | 7 (28.0%) | 18 (72.0%) |
| High School Diploma | 63 (100.0%) | 0 (0.0%) |
| College/Associate Degree | 104 (97.2%) | 3 (2.8%) |
| Bachelor's Degree or higher | 96 (100.0%) | 0 (0.0%) |
Occupancy by Age of Householder in Tres Pinos
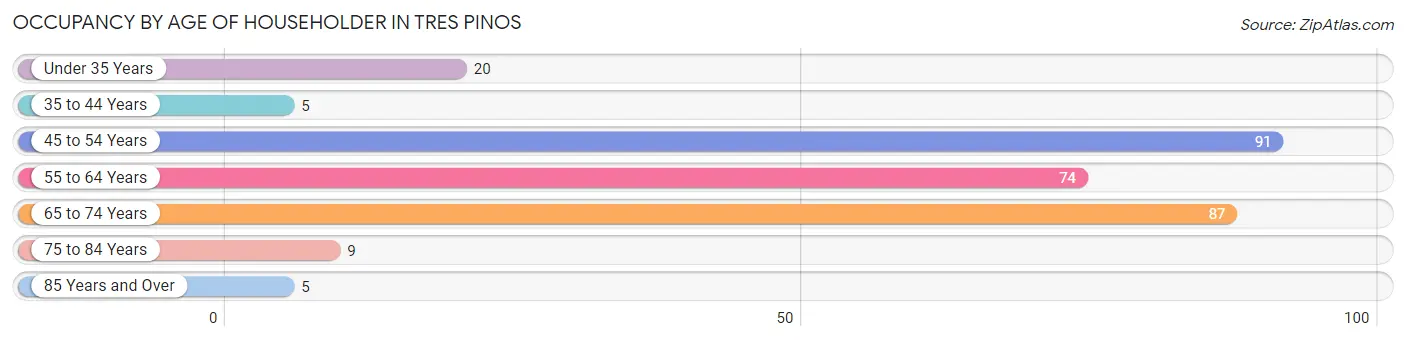
| Age Bracket | # Households | % Households |
| Under 35 Years | 20 | 6.9% |
| 35 to 44 Years | 5 | 1.7% |
| 45 to 54 Years | 91 | 31.3% |
| 55 to 64 Years | 74 | 25.4% |
| 65 to 74 Years | 87 | 29.9% |
| 75 to 84 Years | 9 | 3.1% |
| 85 Years and Over | 5 | 1.7% |
| Total | 291 | 100.0% |
Housing Finances in Tres Pinos
Median Income by Occupancy in Tres Pinos
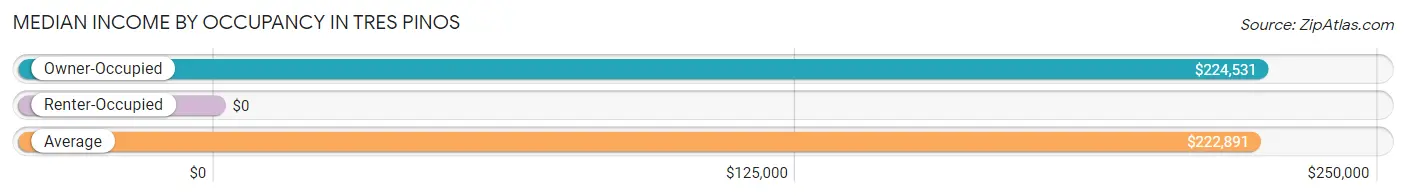
| Occupancy Type | # Households | Median Income |
| Owner-Occupied | 270 (92.8%) | $224,531 |
| Renter-Occupied | 21 (7.2%) | $0 |
| Average | 291 (100.0%) | $222,891 |
Occupancy by Householder Income Bracket in Tres Pinos
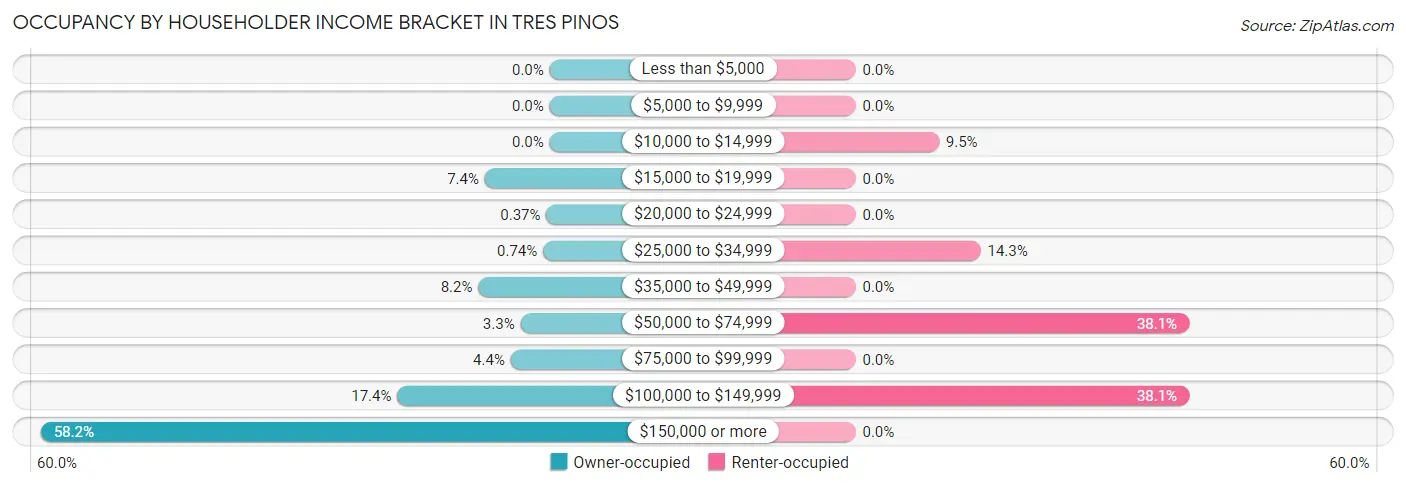
| Income Bracket | Owner-occupied | Renter-occupied |
| Less than $5,000 | 0 (0.0%) | 0 (0.0%) |
| $5,000 to $9,999 | 0 (0.0%) | 0 (0.0%) |
| $10,000 to $14,999 | 0 (0.0%) | 2 (9.5%) |
| $15,000 to $19,999 | 20 (7.4%) | 0 (0.0%) |
| $20,000 to $24,999 | 1 (0.4%) | 0 (0.0%) |
| $25,000 to $34,999 | 2 (0.7%) | 3 (14.3%) |
| $35,000 to $49,999 | 22 (8.2%) | 0 (0.0%) |
| $50,000 to $74,999 | 9 (3.3%) | 8 (38.1%) |
| $75,000 to $99,999 | 12 (4.4%) | 0 (0.0%) |
| $100,000 to $149,999 | 47 (17.4%) | 8 (38.1%) |
| $150,000 or more | 157 (58.2%) | 0 (0.0%) |
| Total | 270 (100.0%) | 21 (100.0%) |
Monthly Housing Cost Tiers in Tres Pinos
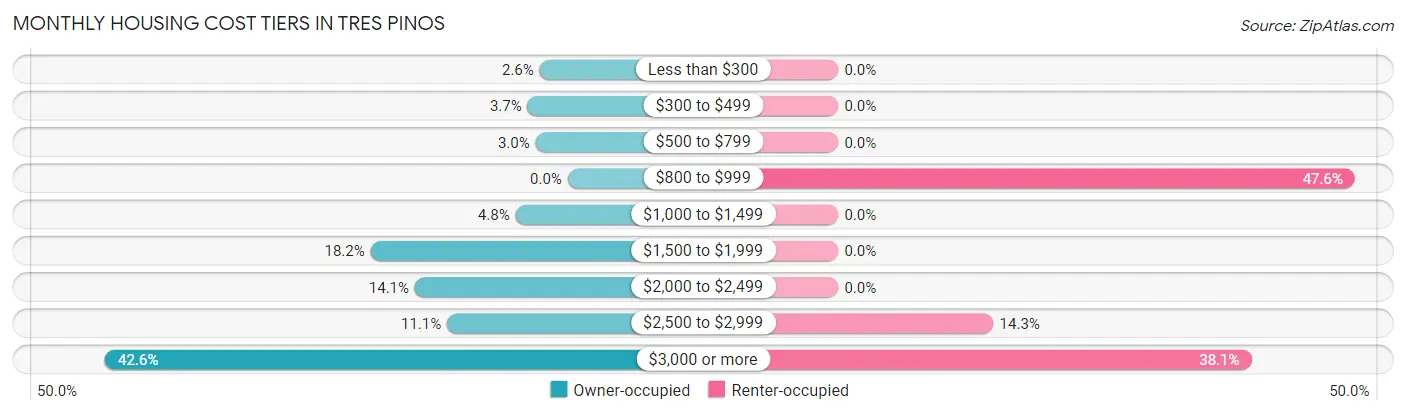
| Monthly Cost | Owner-occupied | Renter-occupied |
| Less than $300 | 7 (2.6%) | 0 (0.0%) |
| $300 to $499 | 10 (3.7%) | 0 (0.0%) |
| $500 to $799 | 8 (3.0%) | 0 (0.0%) |
| $800 to $999 | 0 (0.0%) | 10 (47.6%) |
| $1,000 to $1,499 | 13 (4.8%) | 0 (0.0%) |
| $1,500 to $1,999 | 49 (18.1%) | 0 (0.0%) |
| $2,000 to $2,499 | 38 (14.1%) | 0 (0.0%) |
| $2,500 to $2,999 | 30 (11.1%) | 3 (14.3%) |
| $3,000 or more | 115 (42.6%) | 8 (38.1%) |
| Total | 270 (100.0%) | 21 (100.0%) |
Physical Housing Characteristics in Tres Pinos
Housing Structures in Tres Pinos
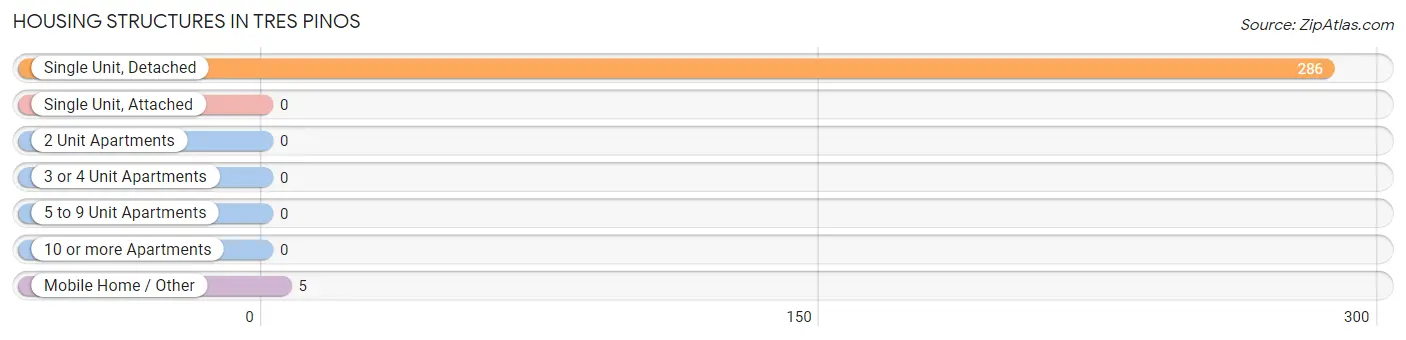
| Structure Type | # Housing Units | % Housing Units |
| Single Unit, Detached | 286 | 98.3% |
| Single Unit, Attached | 0 | 0.0% |
| 2 Unit Apartments | 0 | 0.0% |
| 3 or 4 Unit Apartments | 0 | 0.0% |
| 5 to 9 Unit Apartments | 0 | 0.0% |
| 10 or more Apartments | 0 | 0.0% |
| Mobile Home / Other | 5 | 1.7% |
| Total | 291 | 100.0% |
Housing Structures by Occupancy in Tres Pinos
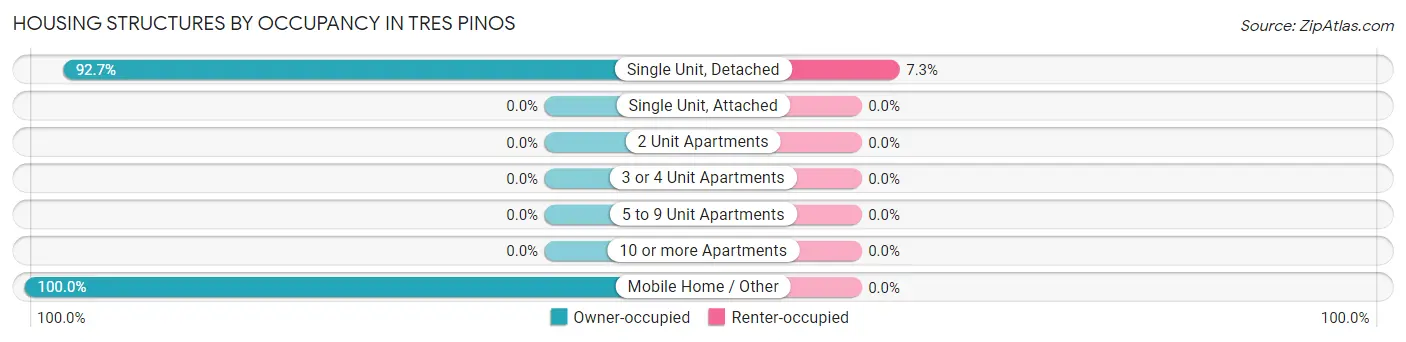
| Structure Type | Owner-occupied | Renter-occupied |
| Single Unit, Detached | 265 (92.7%) | 21 (7.3%) |
| Single Unit, Attached | 0 (0.0%) | 0 (0.0%) |
| 2 Unit Apartments | 0 (0.0%) | 0 (0.0%) |
| 3 or 4 Unit Apartments | 0 (0.0%) | 0 (0.0%) |
| 5 to 9 Unit Apartments | 0 (0.0%) | 0 (0.0%) |
| 10 or more Apartments | 0 (0.0%) | 0 (0.0%) |
| Mobile Home / Other | 5 (100.0%) | 0 (0.0%) |
| Total | 270 (92.8%) | 21 (7.2%) |
Housing Structures by Number of Rooms in Tres Pinos
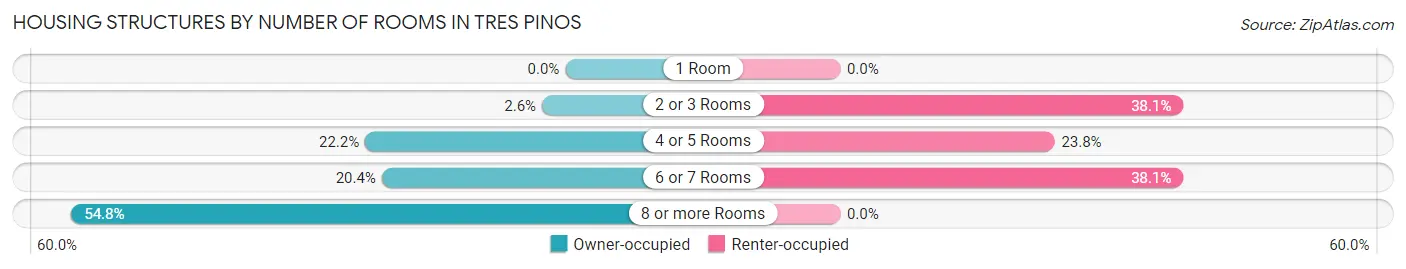
| Number of Rooms | Owner-occupied | Renter-occupied |
| 1 Room | 0 (0.0%) | 0 (0.0%) |
| 2 or 3 Rooms | 7 (2.6%) | 8 (38.1%) |
| 4 or 5 Rooms | 60 (22.2%) | 5 (23.8%) |
| 6 or 7 Rooms | 55 (20.4%) | 8 (38.1%) |
| 8 or more Rooms | 148 (54.8%) | 0 (0.0%) |
| Total | 270 (100.0%) | 21 (100.0%) |
Housing Structure by Heating Type in Tres Pinos
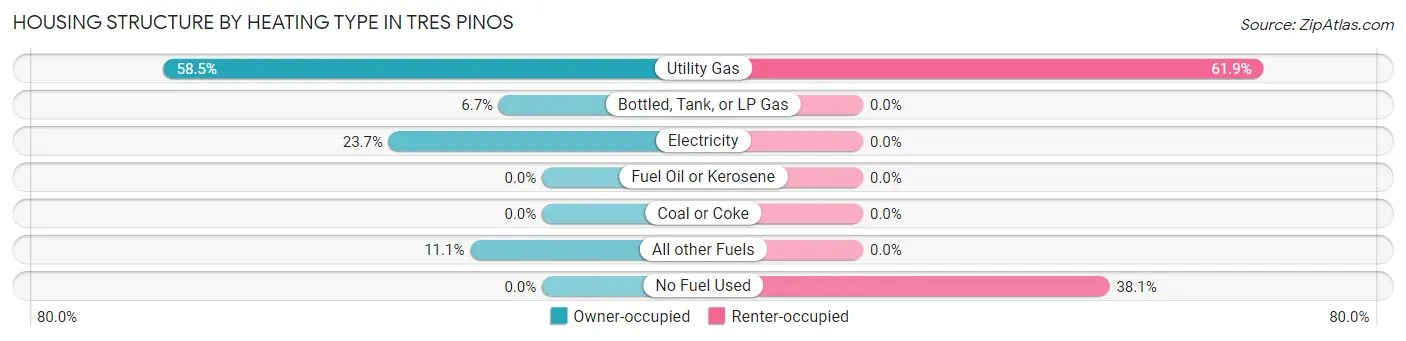
| Heating Type | Owner-occupied | Renter-occupied |
| Utility Gas | 158 (58.5%) | 13 (61.9%) |
| Bottled, Tank, or LP Gas | 18 (6.7%) | 0 (0.0%) |
| Electricity | 64 (23.7%) | 0 (0.0%) |
| Fuel Oil or Kerosene | 0 (0.0%) | 0 (0.0%) |
| Coal or Coke | 0 (0.0%) | 0 (0.0%) |
| All other Fuels | 30 (11.1%) | 0 (0.0%) |
| No Fuel Used | 0 (0.0%) | 8 (38.1%) |
| Total | 270 (100.0%) | 21 (100.0%) |
Household Vehicle Usage in Tres Pinos
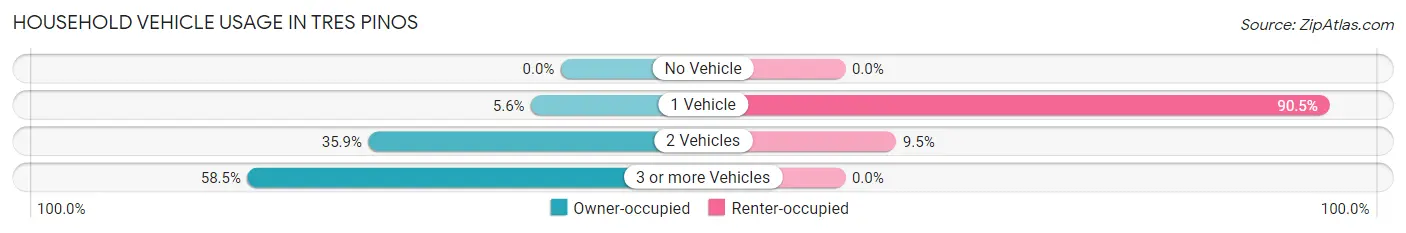
| Vehicles per Household | Owner-occupied | Renter-occupied |
| No Vehicle | 0 (0.0%) | 0 (0.0%) |
| 1 Vehicle | 15 (5.6%) | 19 (90.5%) |
| 2 Vehicles | 97 (35.9%) | 2 (9.5%) |
| 3 or more Vehicles | 158 (58.5%) | 0 (0.0%) |
| Total | 270 (100.0%) | 21 (100.0%) |
Real Estate & Mortgages in Tres Pinos
Real Estate and Mortgage Overview in Tres Pinos
| Characteristic | Without Mortgage | With Mortgage |
| Housing Units | 53 | 217 |
| Median Property Value | $875,000 | $1,079,900 |
| Median Household Income | $145,625 | $140 |
| Monthly Housing Costs | $1,025 | $115 |
| Real Estate Taxes | $6,528 | $0 |
Property Value by Mortgage Status in Tres Pinos
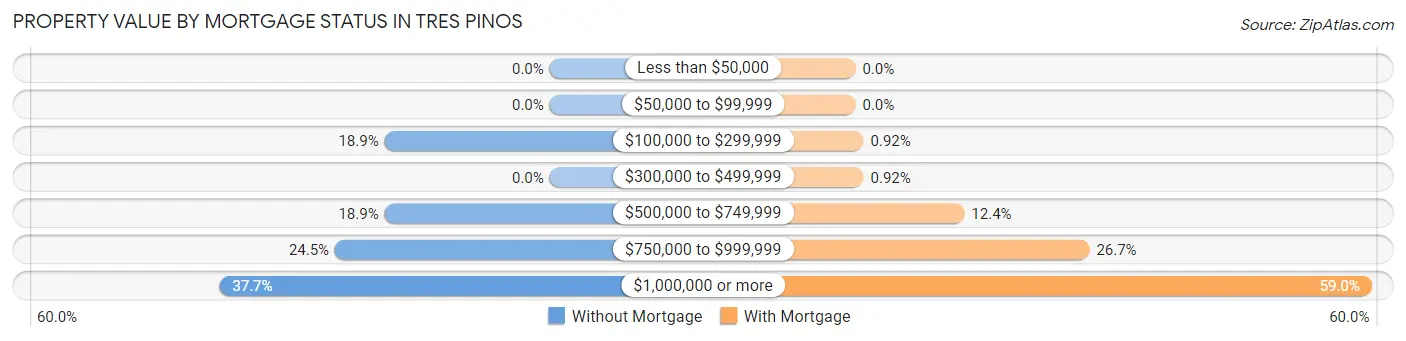
| Property Value | Without Mortgage | With Mortgage |
| Less than $50,000 | 0 (0.0%) | 0 (0.0%) |
| $50,000 to $99,999 | 0 (0.0%) | 0 (0.0%) |
| $100,000 to $299,999 | 10 (18.9%) | 2 (0.9%) |
| $300,000 to $499,999 | 0 (0.0%) | 2 (0.9%) |
| $500,000 to $749,999 | 10 (18.9%) | 27 (12.4%) |
| $750,000 to $999,999 | 13 (24.5%) | 58 (26.7%) |
| $1,000,000 or more | 20 (37.7%) | 128 (59.0%) |
| Total | 53 (100.0%) | 217 (100.0%) |
Household Income by Mortgage Status in Tres Pinos
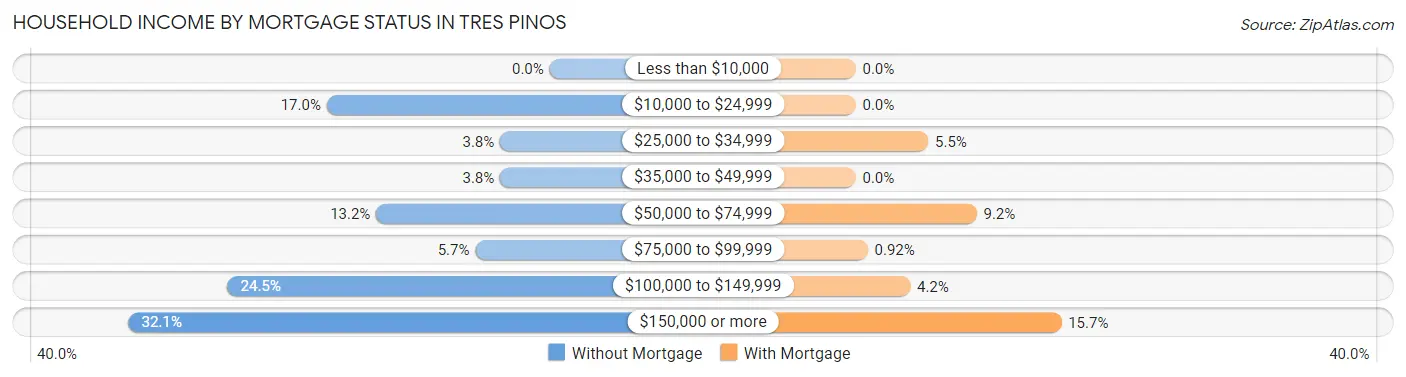
| Household Income | Without Mortgage | With Mortgage |
| Less than $10,000 | 0 (0.0%) | 0 (0.0%) |
| $10,000 to $24,999 | 9 (17.0%) | 0 (0.0%) |
| $25,000 to $34,999 | 2 (3.8%) | 12 (5.5%) |
| $35,000 to $49,999 | 2 (3.8%) | 0 (0.0%) |
| $50,000 to $74,999 | 7 (13.2%) | 20 (9.2%) |
| $75,000 to $99,999 | 3 (5.7%) | 2 (0.9%) |
| $100,000 to $149,999 | 13 (24.5%) | 9 (4.2%) |
| $150,000 or more | 17 (32.1%) | 34 (15.7%) |
| Total | 53 (100.0%) | 217 (100.0%) |
Property Value to Household Income Ratio in Tres Pinos
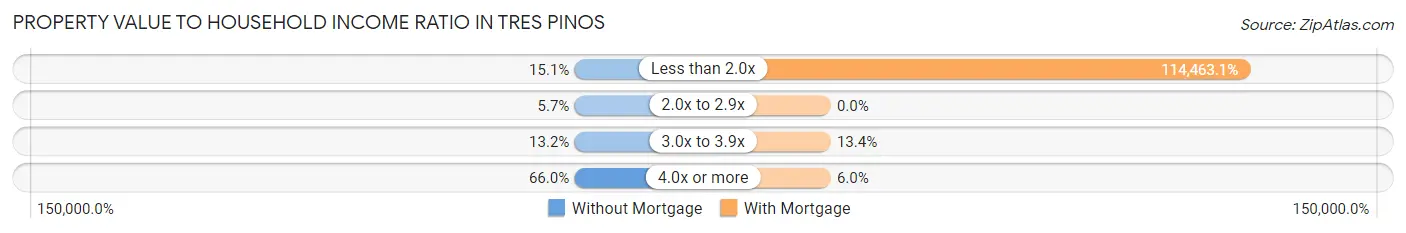
| Value-to-Income Ratio | Without Mortgage | With Mortgage |
| Less than 2.0x | 8 (15.1%) | 248,385 (114,463.1%) |
| 2.0x to 2.9x | 3 (5.7%) | 0 (0.0%) |
| 3.0x to 3.9x | 7 (13.2%) | 29 (13.4%) |
| 4.0x or more | 35 (66.0%) | 13 (6.0%) |
| Total | 53 (100.0%) | 217 (100.0%) |
Real Estate Taxes by Mortgage Status in Tres Pinos
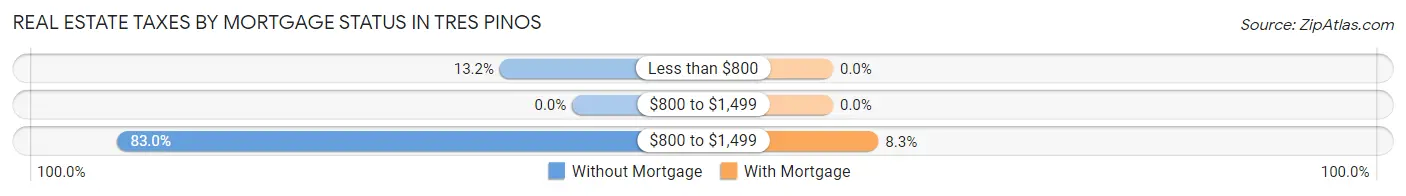
| Property Taxes | Without Mortgage | With Mortgage |
| Less than $800 | 7 (13.2%) | 0 (0.0%) |
| $800 to $1,499 | 0 (0.0%) | 0 (0.0%) |
| $800 to $1,499 | 44 (83.0%) | 18 (8.3%) |
| Total | 53 (100.0%) | 217 (100.0%) |
Health & Disability in Tres Pinos
Health Insurance Coverage by Age in Tres Pinos
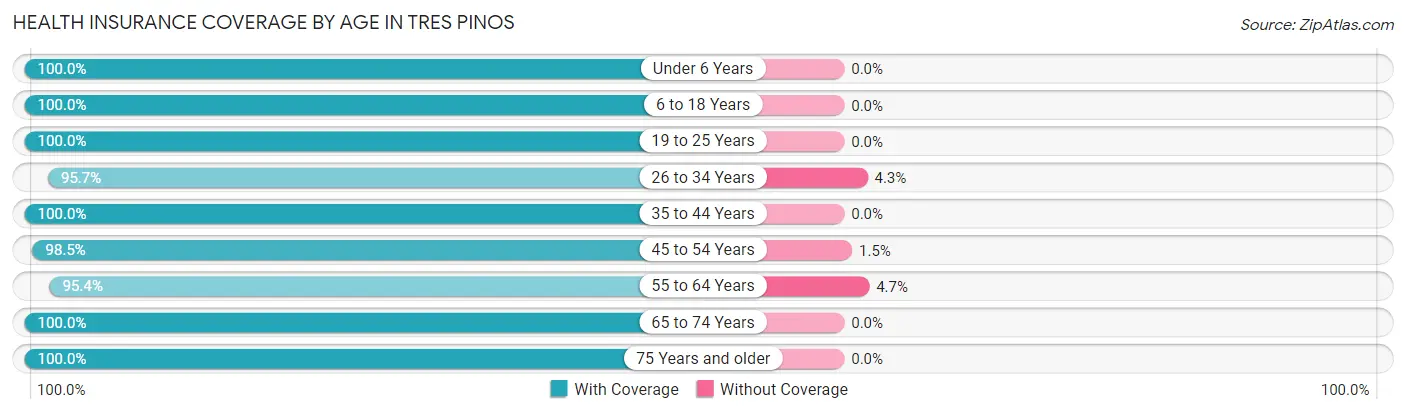
| Age Bracket | With Coverage | Without Coverage |
| Under 6 Years | 60 (100.0%) | 0 (0.0%) |
| 6 to 18 Years | 125 (100.0%) | 0 (0.0%) |
| 19 to 25 Years | 31 (100.0%) | 0 (0.0%) |
| 26 to 34 Years | 265 (95.7%) | 12 (4.3%) |
| 35 to 44 Years | 10 (100.0%) | 0 (0.0%) |
| 45 to 54 Years | 135 (98.5%) | 2 (1.5%) |
| 55 to 64 Years | 164 (95.4%) | 8 (4.6%) |
| 65 to 74 Years | 135 (100.0%) | 0 (0.0%) |
| 75 Years and older | 59 (100.0%) | 0 (0.0%) |
| Total | 984 (97.8%) | 22 (2.2%) |
Health Insurance Coverage by Citizenship Status in Tres Pinos
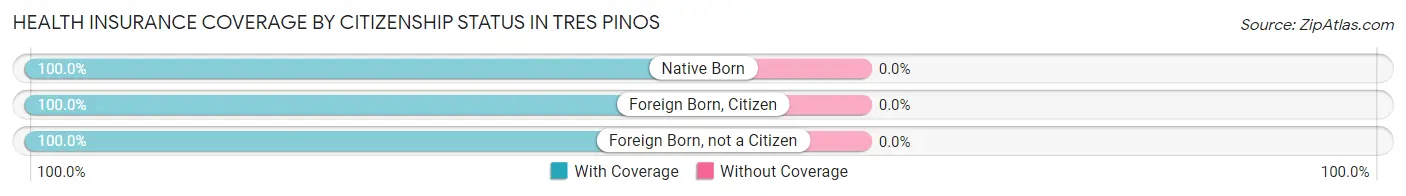
| Citizenship Status | With Coverage | Without Coverage |
| Native Born | 60 (100.0%) | 0 (0.0%) |
| Foreign Born, Citizen | 125 (100.0%) | 0 (0.0%) |
| Foreign Born, not a Citizen | 31 (100.0%) | 0 (0.0%) |
Health Insurance Coverage by Household Income in Tres Pinos
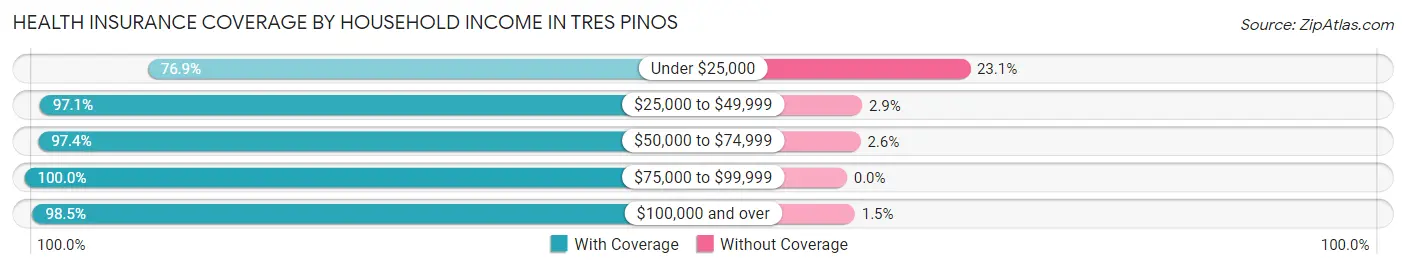
| Household Income | With Coverage | Without Coverage |
| Under $25,000 | 20 (76.9%) | 6 (23.1%) |
| $25,000 to $49,999 | 68 (97.1%) | 2 (2.9%) |
| $50,000 to $74,999 | 76 (97.4%) | 2 (2.6%) |
| $75,000 to $99,999 | 31 (100.0%) | 0 (0.0%) |
| $100,000 and over | 789 (98.5%) | 12 (1.5%) |
Public vs Private Health Insurance Coverage by Age in Tres Pinos
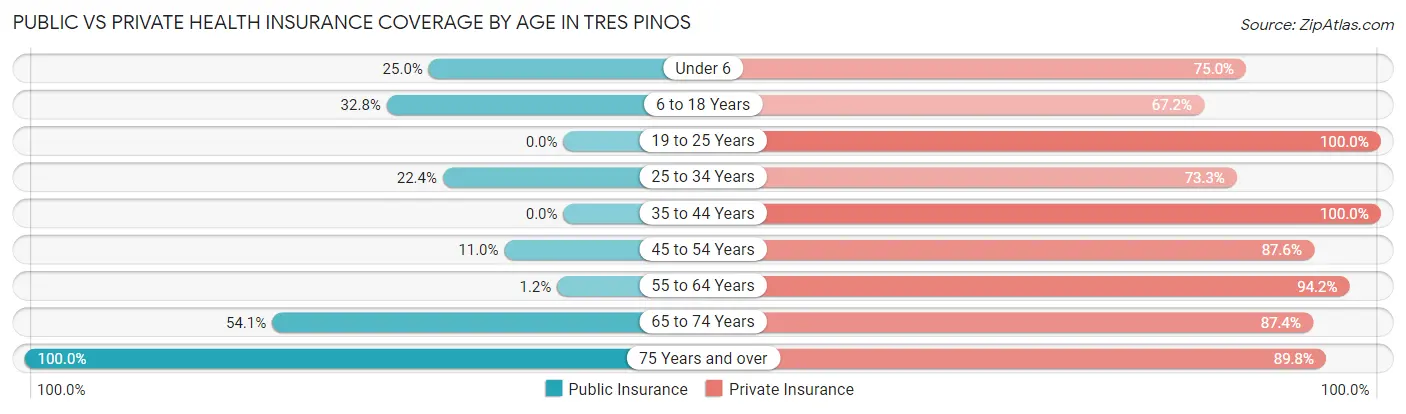
| Age Bracket | Public Insurance | Private Insurance |
| Under 6 | 15 (25.0%) | 45 (75.0%) |
| 6 to 18 Years | 41 (32.8%) | 84 (67.2%) |
| 19 to 25 Years | 0 (0.0%) | 31 (100.0%) |
| 25 to 34 Years | 62 (22.4%) | 203 (73.3%) |
| 35 to 44 Years | 0 (0.0%) | 10 (100.0%) |
| 45 to 54 Years | 15 (11.0%) | 120 (87.6%) |
| 55 to 64 Years | 2 (1.2%) | 162 (94.2%) |
| 65 to 74 Years | 73 (54.1%) | 118 (87.4%) |
| 75 Years and over | 59 (100.0%) | 53 (89.8%) |
| Total | 267 (26.5%) | 826 (82.1%) |
Disability Status by Sex by Age in Tres Pinos
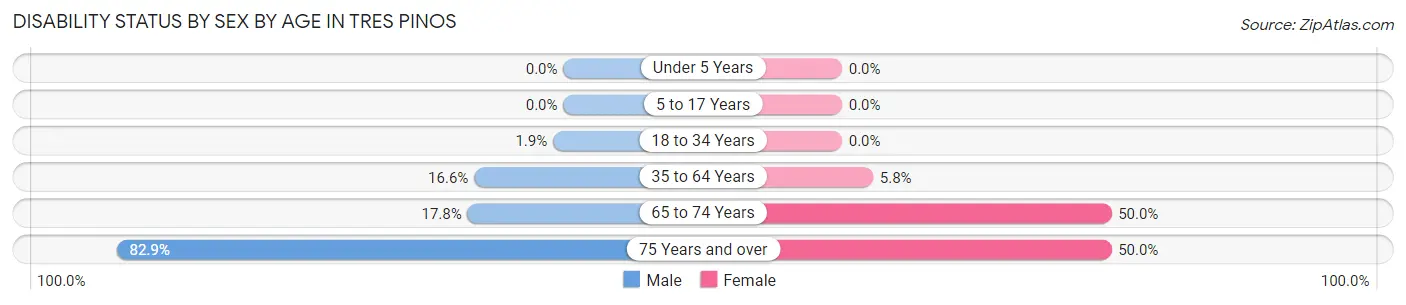
| Age Bracket | Male | Female |
| Under 5 Years | 0 (0.0%) | 0 (0.0%) |
| 5 to 17 Years | 0 (0.0%) | 0 (0.0%) |
| 18 to 34 Years | 4 (1.9%) | 0 (0.0%) |
| 35 to 64 Years | 27 (16.6%) | 9 (5.8%) |
| 65 to 74 Years | 8 (17.8%) | 45 (50.0%) |
| 75 Years and over | 34 (82.9%) | 9 (50.0%) |
Disability Class by Sex by Age in Tres Pinos
Disability Class: Hearing Difficulty
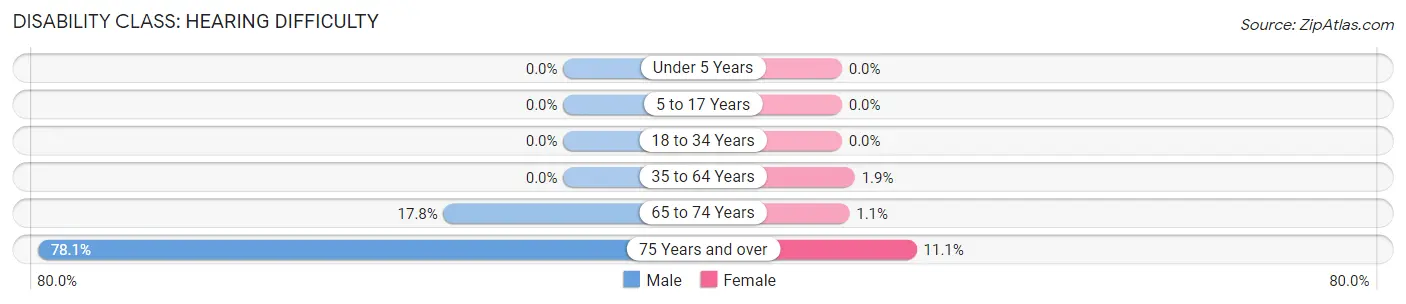
| Age Bracket | Male | Female |
| Under 5 Years | 0 (0.0%) | 0 (0.0%) |
| 5 to 17 Years | 0 (0.0%) | 0 (0.0%) |
| 18 to 34 Years | 0 (0.0%) | 0 (0.0%) |
| 35 to 64 Years | 0 (0.0%) | 3 (1.9%) |
| 65 to 74 Years | 8 (17.8%) | 1 (1.1%) |
| 75 Years and over | 32 (78.0%) | 2 (11.1%) |
Disability Class: Vision Difficulty
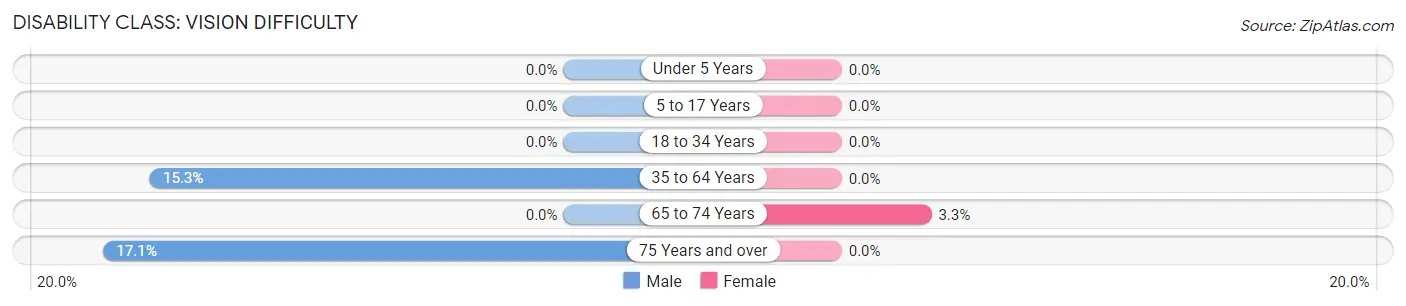
| Age Bracket | Male | Female |
| Under 5 Years | 0 (0.0%) | 0 (0.0%) |
| 5 to 17 Years | 0 (0.0%) | 0 (0.0%) |
| 18 to 34 Years | 0 (0.0%) | 0 (0.0%) |
| 35 to 64 Years | 25 (15.3%) | 0 (0.0%) |
| 65 to 74 Years | 0 (0.0%) | 3 (3.3%) |
| 75 Years and over | 7 (17.1%) | 0 (0.0%) |
Disability Class: Cognitive Difficulty
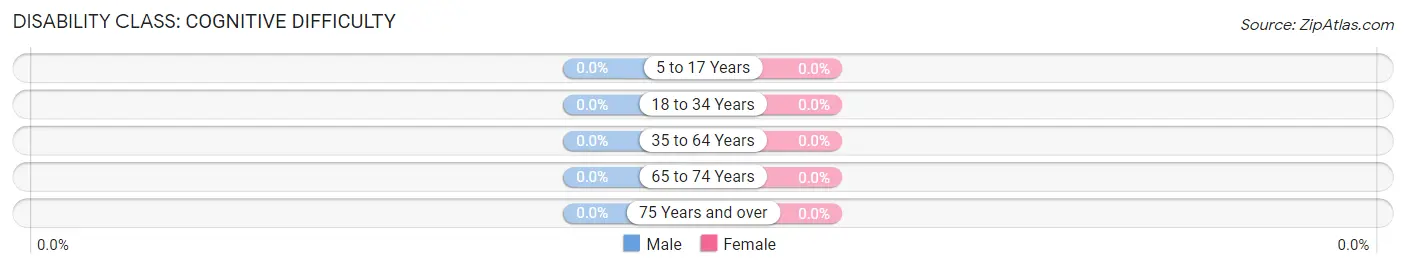
| Age Bracket | Male | Female |
| 5 to 17 Years | 0 (0.0%) | 0 (0.0%) |
| 18 to 34 Years | 0 (0.0%) | 0 (0.0%) |
| 35 to 64 Years | 0 (0.0%) | 0 (0.0%) |
| 65 to 74 Years | 0 (0.0%) | 0 (0.0%) |
| 75 Years and over | 0 (0.0%) | 0 (0.0%) |
Disability Class: Ambulatory Difficulty
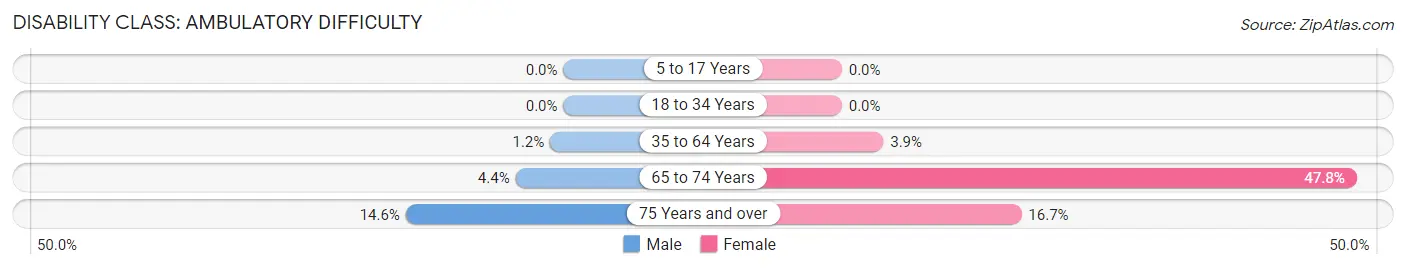
| Age Bracket | Male | Female |
| 5 to 17 Years | 0 (0.0%) | 0 (0.0%) |
| 18 to 34 Years | 0 (0.0%) | 0 (0.0%) |
| 35 to 64 Years | 2 (1.2%) | 6 (3.8%) |
| 65 to 74 Years | 2 (4.4%) | 43 (47.8%) |
| 75 Years and over | 6 (14.6%) | 3 (16.7%) |
Disability Class: Self-Care Difficulty
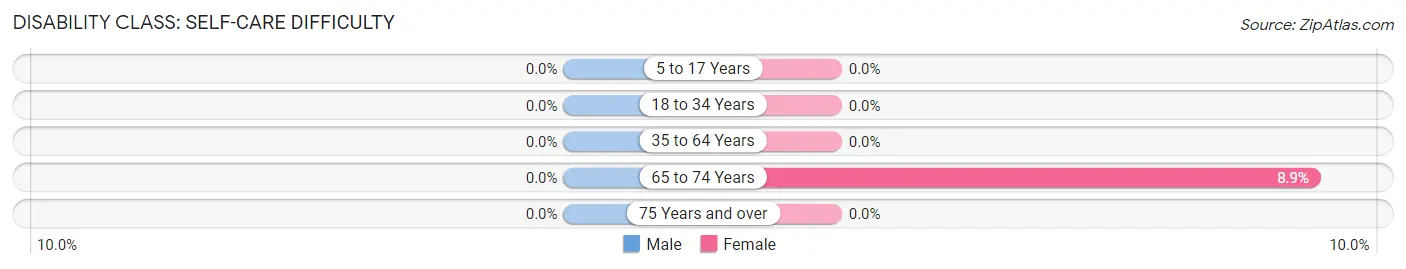
| Age Bracket | Male | Female |
| 5 to 17 Years | 0 (0.0%) | 0 (0.0%) |
| 18 to 34 Years | 0 (0.0%) | 0 (0.0%) |
| 35 to 64 Years | 0 (0.0%) | 0 (0.0%) |
| 65 to 74 Years | 0 (0.0%) | 8 (8.9%) |
| 75 Years and over | 0 (0.0%) | 0 (0.0%) |
Technology Access in Tres Pinos
Computing Device Access in Tres Pinos
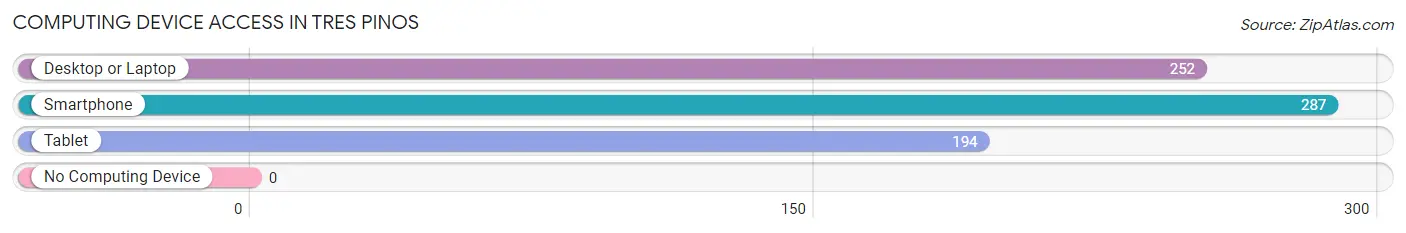
| Device Type | # Households | % Households |
| Desktop or Laptop | 252 | 86.6% |
| Smartphone | 287 | 98.6% |
| Tablet | 194 | 66.7% |
| No Computing Device | 0 | 0.0% |
| Total | 291 | 100.0% |
Internet Access in Tres Pinos
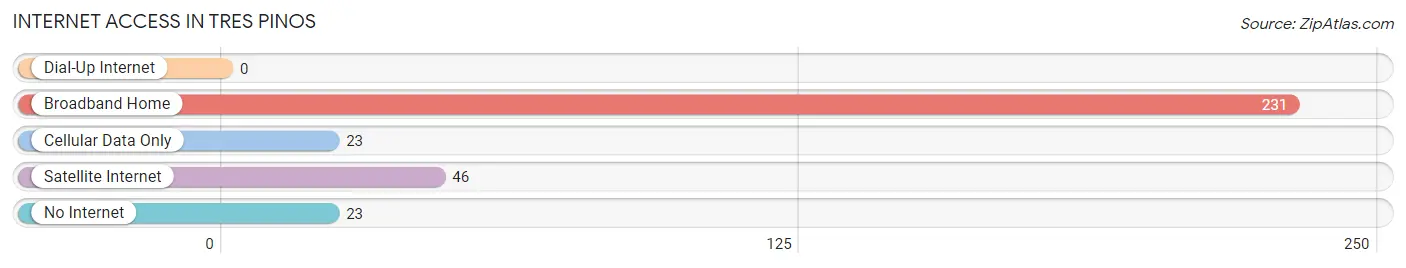
| Internet Type | # Households | % Households |
| Dial-Up Internet | 0 | 0.0% |
| Broadband Home | 231 | 79.4% |
| Cellular Data Only | 23 | 7.9% |
| Satellite Internet | 46 | 15.8% |
| No Internet | 23 | 7.9% |
| Total | 291 | 100.0% |
Tres Pinos Summary
Tres Pinos is a small unincorporated community located in San Benito County, California. It is situated in the foothills of the Gabilan Mountains, approximately 8 miles south of Hollister and 25 miles east of Salinas. The population of Tres Pinos was estimated to be 1,845 in the year 2000.
History
Tres Pinos was originally inhabited by the Ohlone Indians, who lived in the area for thousands of years before the arrival of Europeans. The first Europeans to settle in the area were Spanish missionaries, who established the Mission San Juan Bautista in 1797. The mission was located approximately 10 miles north of Tres Pinos, and the area was used for grazing cattle and horses.
In 1846, the Mexican-American War began and the area was ceded to the United States. In 1848, the Treaty of Guadalupe Hidalgo was signed, officially ending the war and granting California to the United States.
In 1853, the area was granted to William E. P. Hartnell, who established a ranch in the area. The ranch was named Rancho San Benito, and it included the area that is now Tres Pinos. In 1868, Hartnell sold the ranch to John B. Rucker, who established a stagecoach stop in the area. The stagecoach stop was named Tres Pinos, which is Spanish for “three pins”.
In 1874, the Southern Pacific Railroad was built through the area, connecting Tres Pinos to the rest of the state. This allowed for the development of the town, and it soon became a popular stop for travelers.
In 1876, the town was officially incorporated as the Town of Tres Pinos. The town grew steadily over the next few decades, and by the early 1900s it had become a thriving agricultural community.
Geography
Tres Pinos is located in the foothills of the Gabilan Mountains, approximately 8 miles south of Hollister and 25 miles east of Salinas. The town is situated at an elevation of 1,068 feet above sea level.
The climate in Tres Pinos is mild and temperate, with warm summers and cool winters. The average annual temperature is 61°F, and the average annual precipitation is 17.5 inches.
Economy
The economy of Tres Pinos is largely based on agriculture. The town is home to several farms and ranches, which produce a variety of crops including grapes, almonds, walnuts, and olives. The town is also home to several wineries, which produce a variety of wines.
In addition to agriculture, Tres Pinos is home to several small businesses, including restaurants, shops, and services. The town is also home to a few light manufacturing companies, which produce a variety of products.
Demographics
As of the year 2000, the population of Tres Pinos was estimated to be 1,845. The racial makeup of the town was 79.3% White, 0.7% African American, 0.3% Native American, 0.2% Asian, 0.1% Pacific Islander, 16.2% from other races, and 3.4% from two or more races. Hispanic or Latino of any race were 33.2% of the population.
The median household income in Tres Pinos was $41,964, and the median family income was $48,929. The per capita income was $19,845. About 11.2% of families and 14.2% of the population were below the poverty line, including 18.2% of those under age 18 and 8.2% of those age 65 or over.
Common Questions
What is Per Capita Income in Tres Pinos?
Per Capita income in Tres Pinos is $61,299.
What is the Median Family Income in Tres Pinos?
Median Family Income in Tres Pinos is $224,922.
What is the Median Household income in Tres Pinos?
Median Household Income in Tres Pinos is $222,891.
What is Income or Wage Gap in Tres Pinos?
Income or Wage Gap in Tres Pinos is 57.7%.
Women in Tres Pinos earn 42.3 cents for every dollar earned by a man.
What is Inequality or Gini Index in Tres Pinos?
Inequality or Gini Index in Tres Pinos is 0.35.
What is the Total Population of Tres Pinos?
Total Population of Tres Pinos is 1,006.
What is the Total Male Population of Tres Pinos?
Total Male Population of Tres Pinos is 521.
What is the Total Female Population of Tres Pinos?
Total Female Population of Tres Pinos is 485.
What is the Ratio of Males per 100 Females in Tres Pinos?
There are 107.42 Males per 100 Females in Tres Pinos.
What is the Ratio of Females per 100 Males in Tres Pinos?
There are 93.09 Females per 100 Males in Tres Pinos.
What is the Median Population Age in Tres Pinos?
Median Population Age in Tres Pinos is 45.0 Years.
What is the Average Family Size in Tres Pinos
Average Family Size in Tres Pinos is 3.6 People.
What is the Average Household Size in Tres Pinos
Average Household Size in Tres Pinos is 3.5 People.
How Large is the Labor Force in Tres Pinos?
There are 664 People in the Labor Forcein in Tres Pinos.
What is the Percentage of People in the Labor Force in Tres Pinos?
77.8% of People are in the Labor Force in Tres Pinos.
What is the Unemployment Rate in Tres Pinos?
Unemployment Rate in Tres Pinos is 5.7%.