Arnold, CA Map & Demographics
Arnold Map
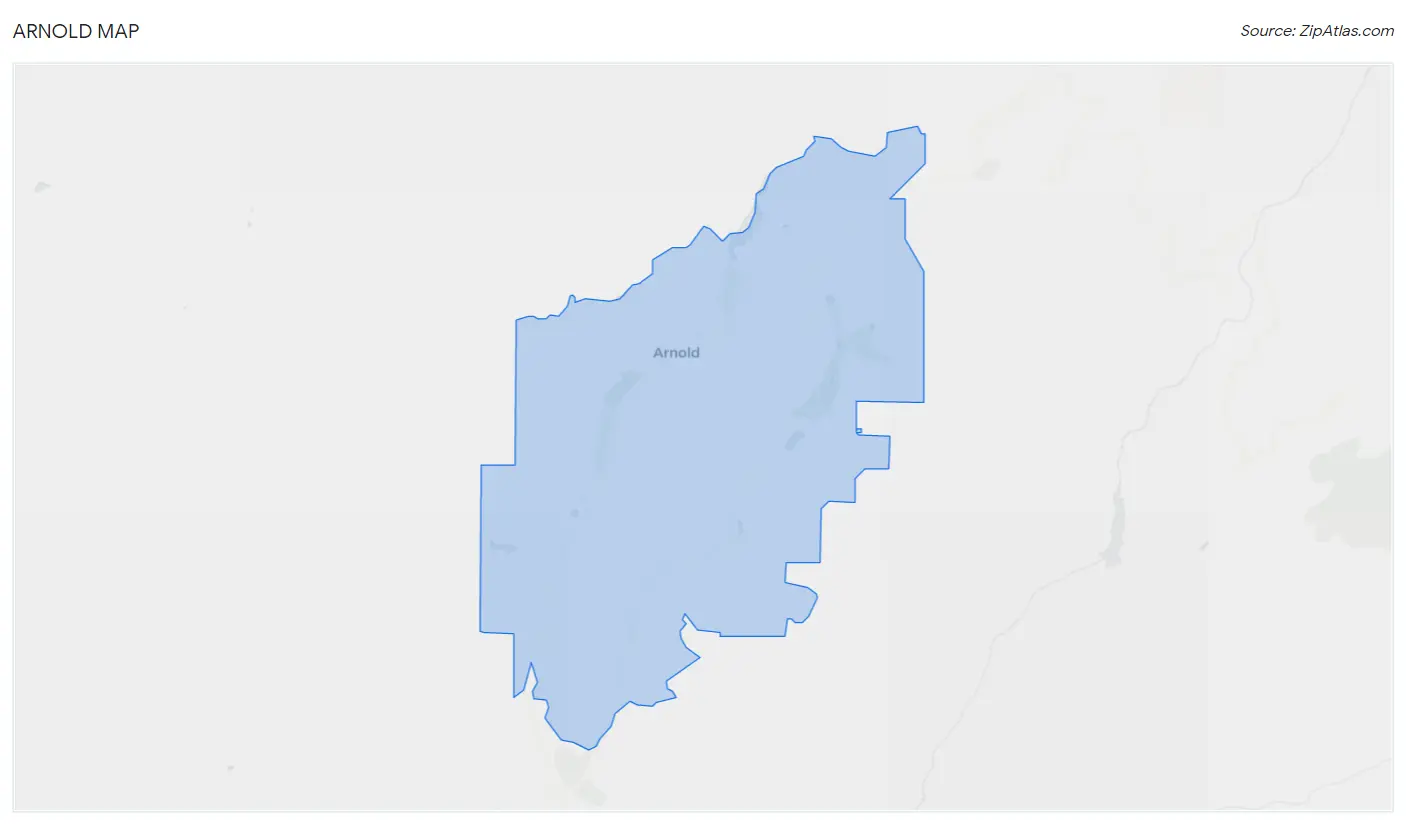
Arnold Overview
$63,386
PER CAPITA INCOME
$107,500
AVG FAMILY INCOME
$93,047
AVG HOUSEHOLD INCOME
15.1%
WAGE / INCOME GAP [ % ]
84.9¢/ $1
WAGE / INCOME GAP [ $ ]
0.49
INEQUALITY / GINI INDEX
1,866
TOTAL POPULATION
948
MALE POPULATION
918
FEMALE POPULATION
103.27
MALES / 100 FEMALES
96.84
FEMALES / 100 MALES
61.8
MEDIAN AGE
2.5
AVG FAMILY SIZE
2.0
AVG HOUSEHOLD SIZE
793
LABOR FORCE [ PEOPLE ]
46.8%
PERCENT IN LABOR FORCE
4.9%
UNEMPLOYMENT RATE
Arnold Zip Codes
Income in Arnold
Income Overview in Arnold
Per Capita Income in Arnold is $63,386, while median incomes of families and households are $107,500 and $93,047 respectively.
| Characteristic | Number | Measure |
| Per Capita Income | 1,866 | $63,386 |
| Median Family Income | 606 | $107,500 |
| Mean Family Income | 606 | $152,086 |
| Median Household Income | 917 | $93,047 |
| Mean Household Income | 917 | $125,544 |
| Income Deficit | 606 | $0 |
| Wage / Income Gap (%) | 1,866 | 15.10% |
| Wage / Income Gap ($) | 1,866 | 84.90¢ per $1 |
| Gini / Inequality Index | 1,866 | 0.49 |
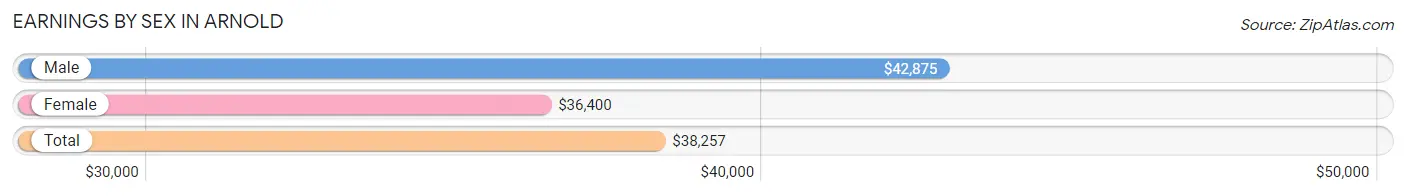
Earnings by Sex in Arnold
Average Earnings in Arnold are $38,257, $42,875 for men and $36,400 for women, a difference of 15.1%.
| Sex | Number | Average Earnings |
| Male | 459 (55.5%) | $42,875 |
| Female | 368 (44.5%) | $36,400 |
| Total | 827 (100.0%) | $38,257 |
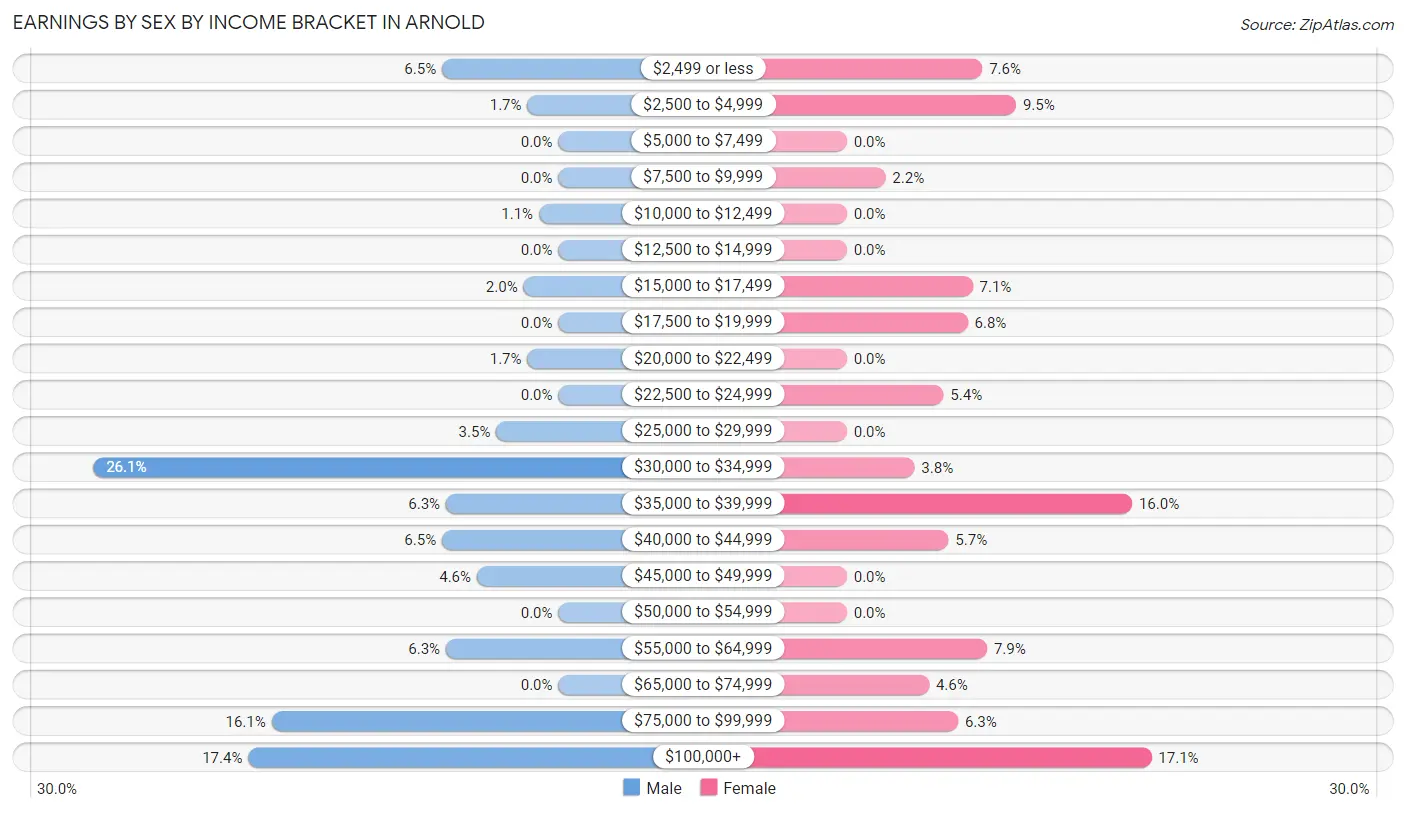
Earnings by Sex by Income Bracket in Arnold
The most common earnings brackets in Arnold are $30,000 to $34,999 for men (120 | 26.1%) and $100,000+ for women (63 | 17.1%).
| Income | Male | Female |
| $2,499 or less | 30 (6.5%) | 28 (7.6%) |
| $2,500 to $4,999 | 8 (1.7%) | 35 (9.5%) |
| $5,000 to $7,499 | 0 (0.0%) | 0 (0.0%) |
| $7,500 to $9,999 | 0 (0.0%) | 8 (2.2%) |
| $10,000 to $12,499 | 5 (1.1%) | 0 (0.0%) |
| $12,500 to $14,999 | 0 (0.0%) | 0 (0.0%) |
| $15,000 to $17,499 | 9 (2.0%) | 26 (7.1%) |
| $17,500 to $19,999 | 0 (0.0%) | 25 (6.8%) |
| $20,000 to $22,499 | 8 (1.7%) | 0 (0.0%) |
| $22,500 to $24,999 | 0 (0.0%) | 20 (5.4%) |
| $25,000 to $29,999 | 16 (3.5%) | 0 (0.0%) |
| $30,000 to $34,999 | 120 (26.1%) | 14 (3.8%) |
| $35,000 to $39,999 | 29 (6.3%) | 59 (16.0%) |
| $40,000 to $44,999 | 30 (6.5%) | 21 (5.7%) |
| $45,000 to $49,999 | 21 (4.6%) | 0 (0.0%) |
| $50,000 to $54,999 | 0 (0.0%) | 0 (0.0%) |
| $55,000 to $64,999 | 29 (6.3%) | 29 (7.9%) |
| $65,000 to $74,999 | 0 (0.0%) | 17 (4.6%) |
| $75,000 to $99,999 | 74 (16.1%) | 23 (6.2%) |
| $100,000+ | 80 (17.4%) | 63 (17.1%) |
| Total | 459 (100.0%) | 368 (100.0%) |
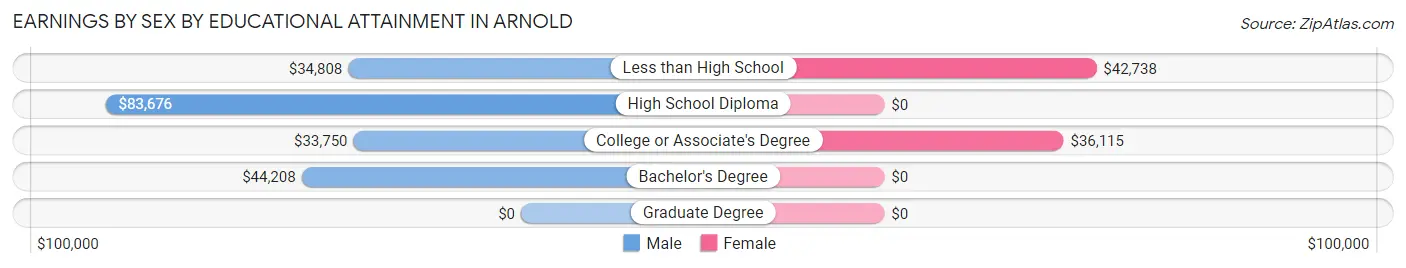
Earnings by Sex by Educational Attainment in Arnold
Average earnings in Arnold are $43,208 for men and $36,723 for women, a difference of 15.0%. Men with an educational attainment of high school diploma enjoy the highest average annual earnings of $83,676, while those with college or associate's degree education earn the least with $33,750. Women with an educational attainment of less than high school earn the most with the average annual earnings of $42,738, while those with college or associate's degree education have the smallest earnings of $36,115.
| Educational Attainment | Male Income | Female Income |
| Less than High School | $34,808 | $42,738 |
| High School Diploma | $83,676 | $0 |
| College or Associate's Degree | $33,750 | $36,115 |
| Bachelor's Degree | $44,208 | $0 |
| Graduate Degree | - | - |
| Total | $43,208 | $36,723 |
Family Income in Arnold
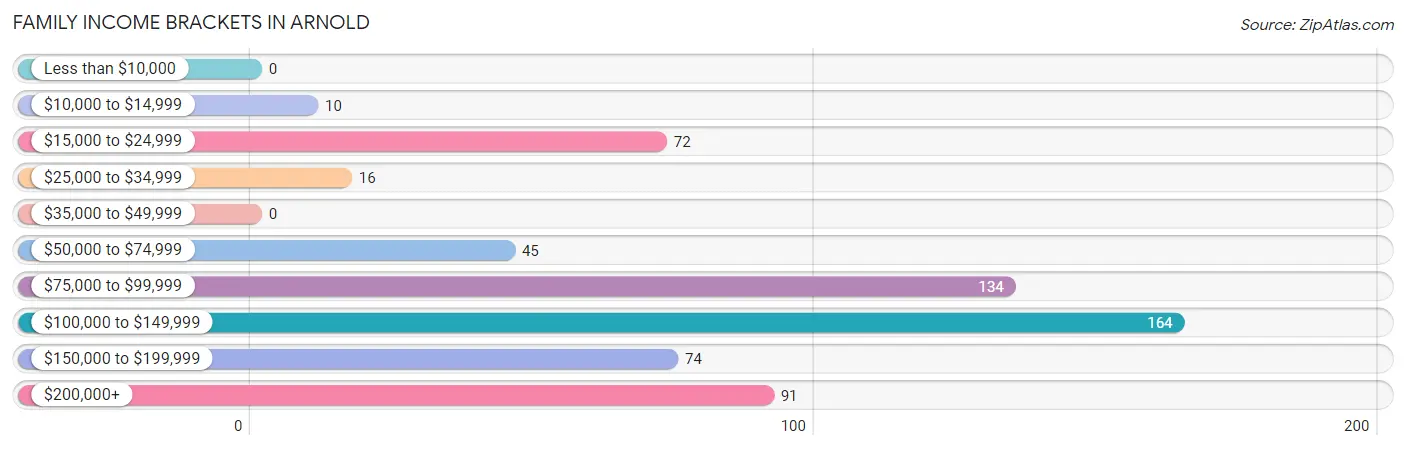
Family Income Brackets in Arnold
According to the Arnold family income data, there are 164 families falling into the $100,000 to $149,999 income range, which is the most common income bracket and makes up 27.1% of all families.
| Income Bracket | # Families | % Families |
| Less than $10,000 | 0 | 0.0% |
| $10,000 to $14,999 | 10 | 1.7% |
| $15,000 to $24,999 | 72 | 11.9% |
| $25,000 to $34,999 | 16 | 2.6% |
| $35,000 to $49,999 | 0 | 0.0% |
| $50,000 to $74,999 | 45 | 7.4% |
| $75,000 to $99,999 | 134 | 22.1% |
| $100,000 to $149,999 | 164 | 27.1% |
| $150,000 to $199,999 | 74 | 12.2% |
| $200,000+ | 91 | 15.0% |
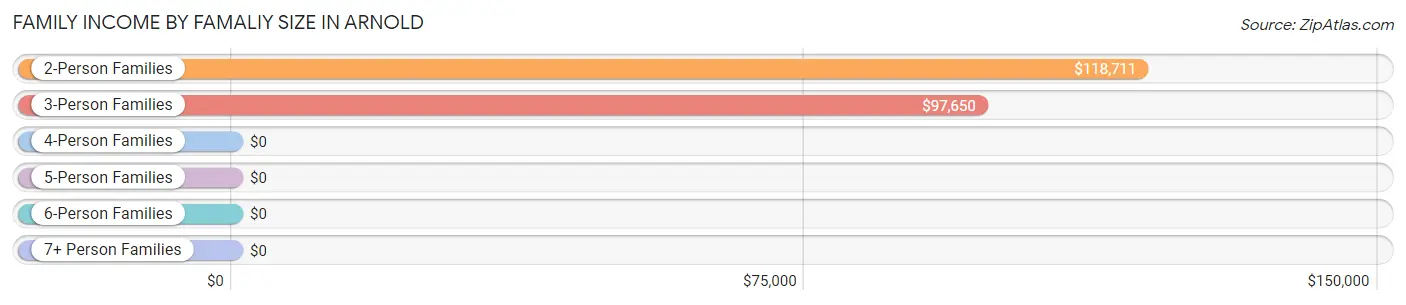
Family Income by Famaliy Size in Arnold
2-person families (517 | 85.3%) account for the highest median family income in Arnold with $118,711 per family, while 2-person families (517 | 85.3%) have the highest median income of $59,356 per family member.
| Income Bracket | # Families | Median Income |
| 2-Person Families | 517 (85.3%) | $118,711 |
| 3-Person Families | 47 (7.8%) | $97,650 |
| 4-Person Families | 8 (1.3%) | $0 |
| 5-Person Families | 34 (5.6%) | $0 |
| 6-Person Families | 0 (0.0%) | $0 |
| 7+ Person Families | 0 (0.0%) | $0 |
| Total | 606 (100.0%) | $107,500 |
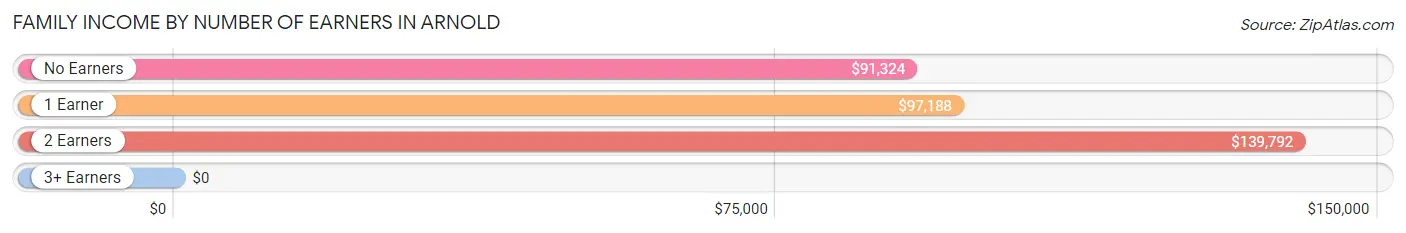
Family Income by Number of Earners in Arnold
| Number of Earners | # Families | Median Income |
| No Earners | 228 (37.6%) | $91,324 |
| 1 Earner | 202 (33.3%) | $97,188 |
| 2 Earners | 151 (24.9%) | $139,792 |
| 3+ Earners | 25 (4.1%) | $0 |
| Total | 606 (100.0%) | $107,500 |
Household Income in Arnold
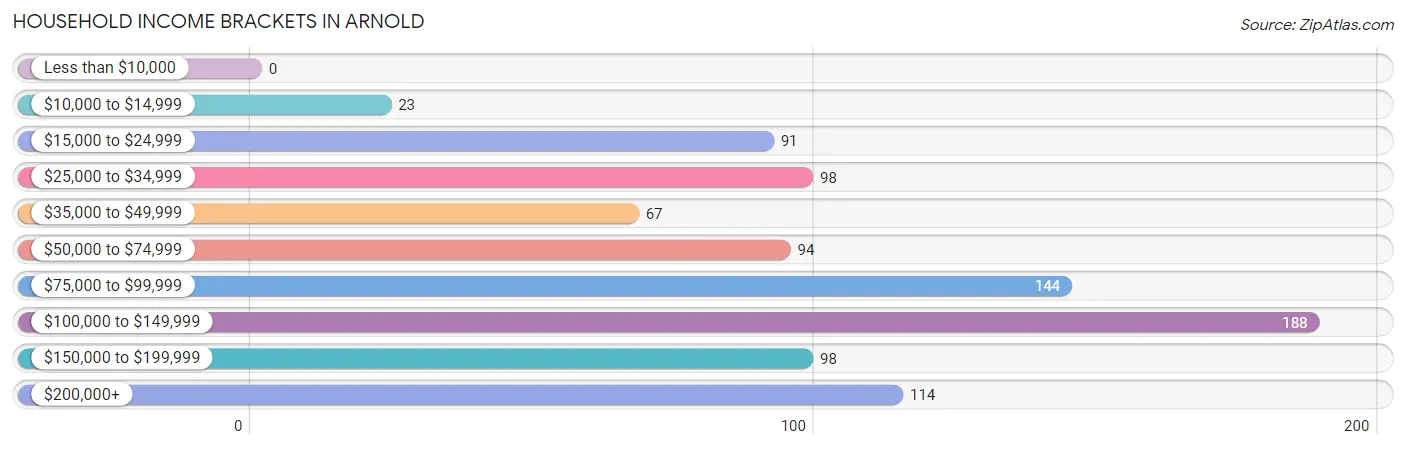
Household Income Brackets in Arnold
With 188 households falling in the category, the $100,000 to $149,999 income range is the most frequent in Arnold, accounting for 20.5% of all households.
| Income Bracket | # Households | % Households |
| Less than $10,000 | 0 | 0.0% |
| $10,000 to $14,999 | 23 | 2.5% |
| $15,000 to $24,999 | 91 | 9.9% |
| $25,000 to $34,999 | 98 | 10.7% |
| $35,000 to $49,999 | 67 | 7.3% |
| $50,000 to $74,999 | 94 | 10.3% |
| $75,000 to $99,999 | 144 | 15.7% |
| $100,000 to $149,999 | 188 | 20.5% |
| $150,000 to $199,999 | 98 | 10.7% |
| $200,000+ | 114 | 12.4% |
Household Income by Householder Age in Arnold
The median household income in Arnold is $93,047, with the highest median household income of $119,688 found in the 45 to 64 years age bracket for the primary householder. A total of 299 households (32.6%) fall into this category. Meanwhile, the 15 to 24 years age bracket for the primary householder has the lowest median household income of $0, with 21 households (2.3%) in this group.
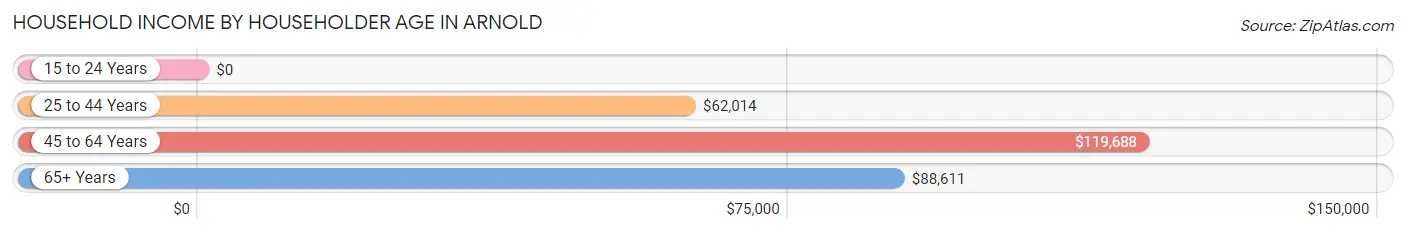
| Income Bracket | # Households | Median Income |
| 15 to 24 Years | 21 (2.3%) | $0 |
| 25 to 44 Years | 115 (12.5%) | $62,014 |
| 45 to 64 Years | 299 (32.6%) | $119,688 |
| 65+ Years | 482 (52.6%) | $88,611 |
| Total | 917 (100.0%) | $93,047 |
Poverty in Arnold
Income Below Poverty by Sex and Age in Arnold
With 3.9% poverty level for males and 7.0% for females among the residents of Arnold, 6 to 11 year old males and 18 to 24 year old females are the most vulnerable to poverty, with 12 males (52.2%) and 8 females (38.1%) in their respective age groups living below the poverty level.
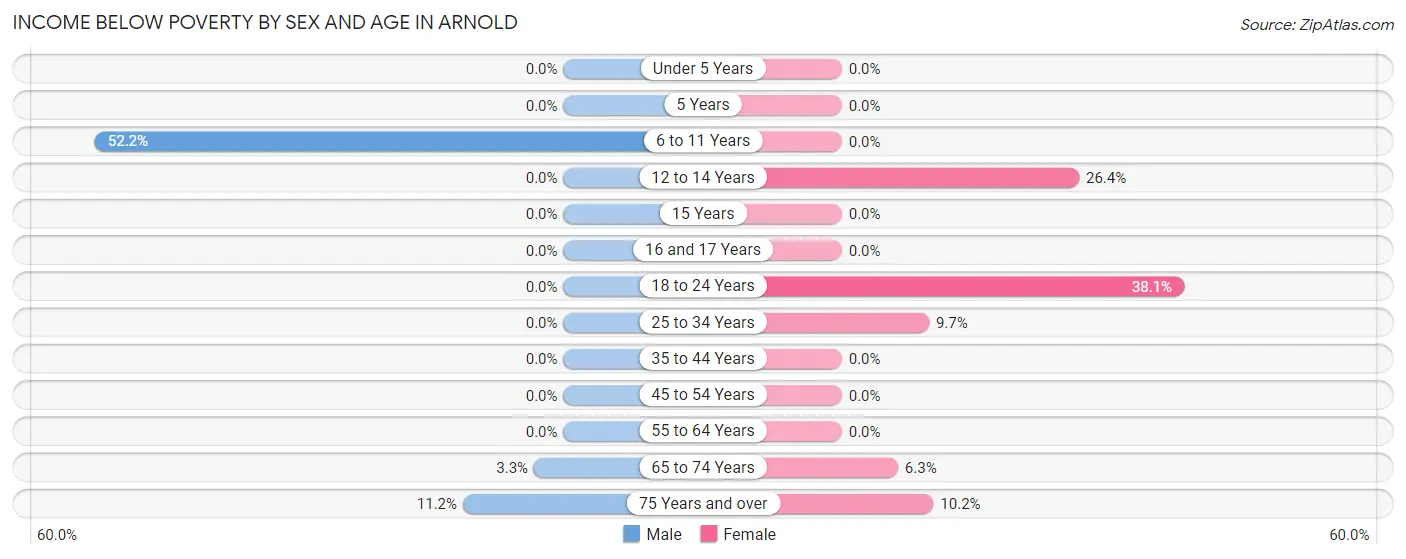
| Age Bracket | Male | Female |
| Under 5 Years | 0 (0.0%) | 0 (0.0%) |
| 5 Years | 0 (0.0%) | 0 (0.0%) |
| 6 to 11 Years | 12 (52.2%) | 0 (0.0%) |
| 12 to 14 Years | 0 (0.0%) | 14 (26.4%) |
| 15 Years | 0 (0.0%) | 0 (0.0%) |
| 16 and 17 Years | 0 (0.0%) | 0 (0.0%) |
| 18 to 24 Years | 0 (0.0%) | 8 (38.1%) |
| 25 to 34 Years | 0 (0.0%) | 10 (9.7%) |
| 35 to 44 Years | 0 (0.0%) | 0 (0.0%) |
| 45 to 54 Years | 0 (0.0%) | 0 (0.0%) |
| 55 to 64 Years | 0 (0.0%) | 0 (0.0%) |
| 65 to 74 Years | 9 (3.3%) | 17 (6.2%) |
| 75 Years and over | 16 (11.2%) | 15 (10.2%) |
| Total | 37 (3.9%) | 64 (7.0%) |
Income Above Poverty by Sex and Age in Arnold
According to the poverty statistics in Arnold, males aged under 5 years and females aged under 5 years are the age groups that are most secure financially, with 100.0% of males and 100.0% of females in these age groups living above the poverty line.
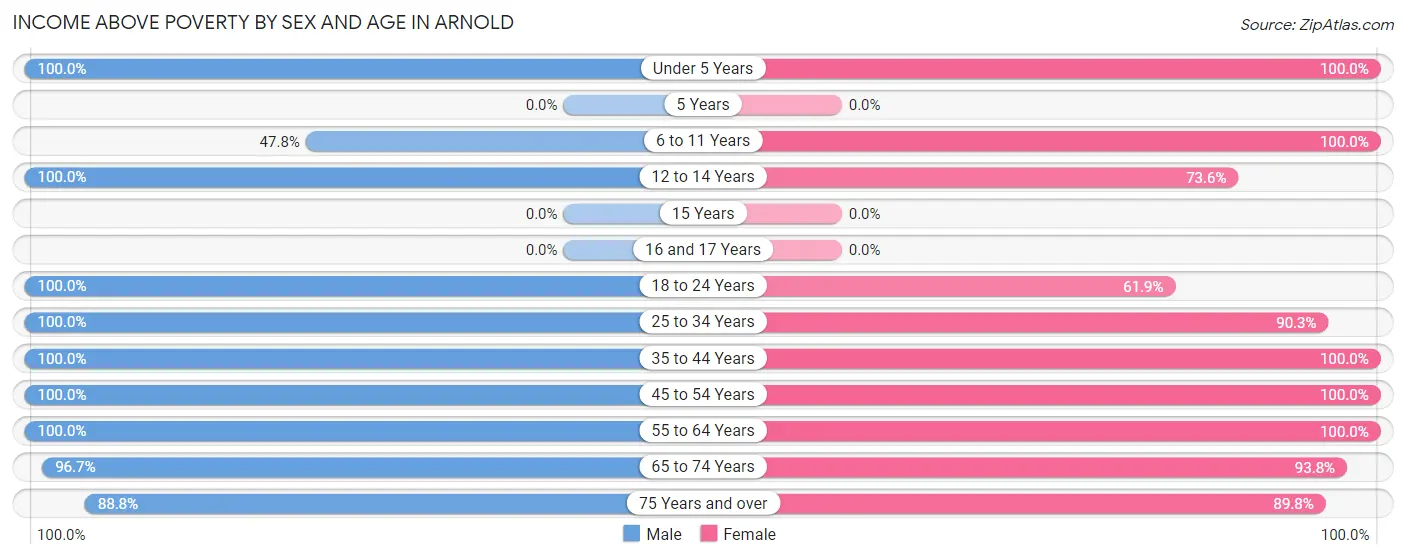
| Age Bracket | Male | Female |
| Under 5 Years | 15 (100.0%) | 11 (100.0%) |
| 5 Years | 0 (0.0%) | 0 (0.0%) |
| 6 to 11 Years | 11 (47.8%) | 60 (100.0%) |
| 12 to 14 Years | 9 (100.0%) | 39 (73.6%) |
| 15 Years | 0 (0.0%) | 0 (0.0%) |
| 16 and 17 Years | 0 (0.0%) | 0 (0.0%) |
| 18 to 24 Years | 8 (100.0%) | 13 (61.9%) |
| 25 to 34 Years | 116 (100.0%) | 93 (90.3%) |
| 35 to 44 Years | 111 (100.0%) | 17 (100.0%) |
| 45 to 54 Years | 50 (100.0%) | 67 (100.0%) |
| 55 to 64 Years | 199 (100.0%) | 167 (100.0%) |
| 65 to 74 Years | 265 (96.7%) | 255 (93.8%) |
| 75 Years and over | 127 (88.8%) | 132 (89.8%) |
| Total | 911 (96.1%) | 854 (93.0%) |
Income Below Poverty Among Married-Couple Families in Arnold
The poverty statistics for married-couple families in Arnold show that 3.1% or 17 of the total 548 families live below the poverty line. Families with no children have the highest poverty rate of 3.3%, comprising of 17 families. On the other hand, families with 1 or 2 children have the lowest poverty rate of 0.0%, which includes 0 families.
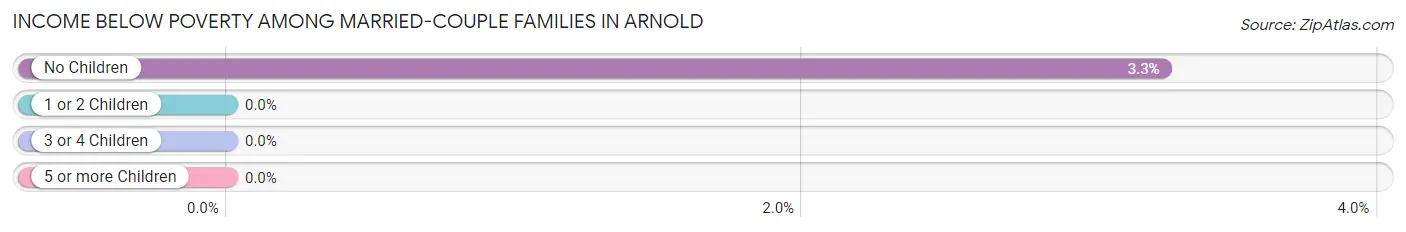
| Children | Above Poverty | Below Poverty |
| No Children | 506 (96.8%) | 17 (3.3%) |
| 1 or 2 Children | 8 (100.0%) | 0 (0.0%) |
| 3 or 4 Children | 17 (100.0%) | 0 (0.0%) |
| 5 or more Children | 0 (0.0%) | 0 (0.0%) |
| Total | 531 (96.9%) | 17 (3.1%) |
Income Below Poverty Among Single-Parent Households in Arnold
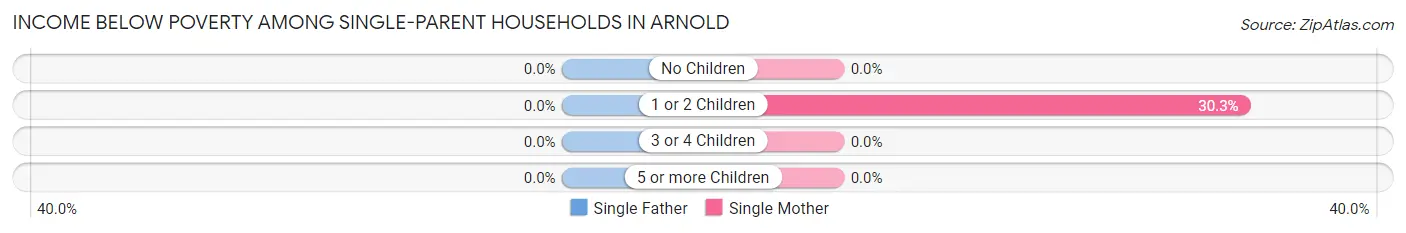
| Children | Single Father | Single Mother |
| No Children | 0 (0.0%) | 0 (0.0%) |
| 1 or 2 Children | 0 (0.0%) | 10 (30.3%) |
| 3 or 4 Children | 0 (0.0%) | 0 (0.0%) |
| 5 or more Children | 0 (0.0%) | 0 (0.0%) |
| Total | 0 (0.0%) | 10 (24.4%) |
Income Below Poverty Among Married-Couple vs Single-Parent Households in Arnold
The poverty data for Arnold shows that 17 of the married-couple family households (3.1%) and 10 of the single-parent households (17.2%) are living below the poverty level. Within the married-couple family households, those with no children have the highest poverty rate, with 17 households (3.3%) falling below the poverty line. Among the single-parent households, those with 1 or 2 children have the highest poverty rate, with 10 household (30.3%) living below poverty.
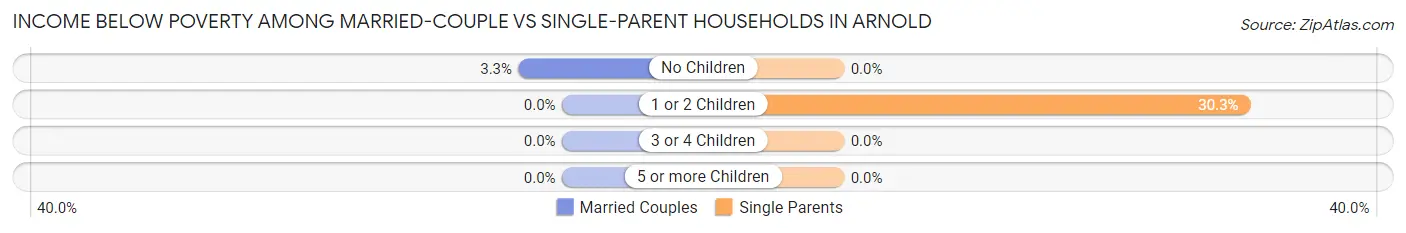
| Children | Married-Couple Families | Single-Parent Households |
| No Children | 17 (3.3%) | 0 (0.0%) |
| 1 or 2 Children | 0 (0.0%) | 10 (30.3%) |
| 3 or 4 Children | 0 (0.0%) | 0 (0.0%) |
| 5 or more Children | 0 (0.0%) | 0 (0.0%) |
| Total | 17 (3.1%) | 10 (17.2%) |
Race in Arnold
The most populous races in Arnold are White / Caucasian (1,709 | 91.6%), Hispanic or Latino (84 | 4.5%), and Native / Alaskan (67 | 3.6%).
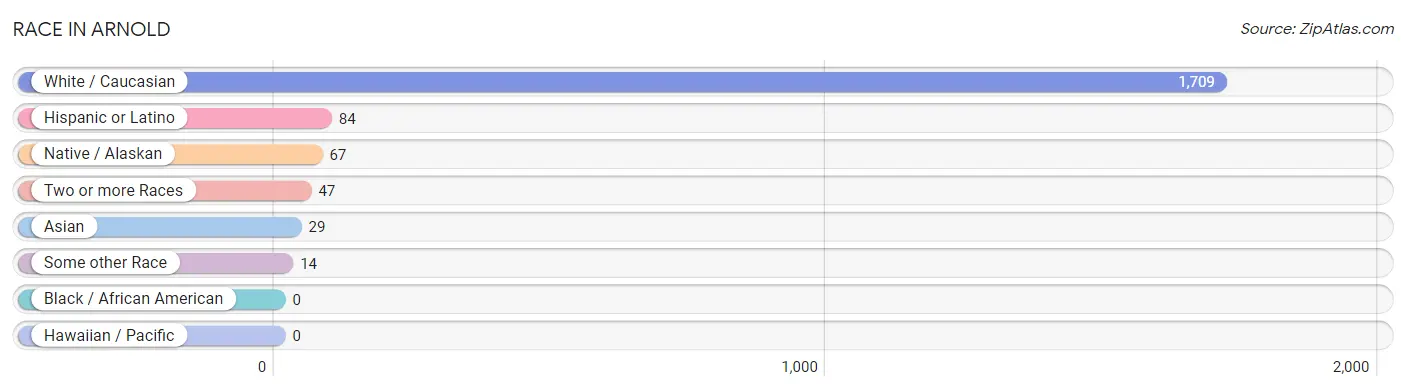
| Race | # Population | % Population |
| Asian | 29 | 1.5% |
| Black / African American | 0 | 0.0% |
| Hawaiian / Pacific | 0 | 0.0% |
| Hispanic or Latino | 84 | 4.5% |
| Native / Alaskan | 67 | 3.6% |
| White / Caucasian | 1,709 | 91.6% |
| Two or more Races | 47 | 2.5% |
| Some other Race | 14 | 0.7% |
| Total | 1,866 | 100.0% |
Ancestry in Arnold
The most populous ancestries reported in Arnold are German (414 | 22.2%), English (338 | 18.1%), Irish (307 | 16.5%), Italian (196 | 10.5%), and Scottish (91 | 4.9%), together accounting for 72.1% of all Arnold residents.
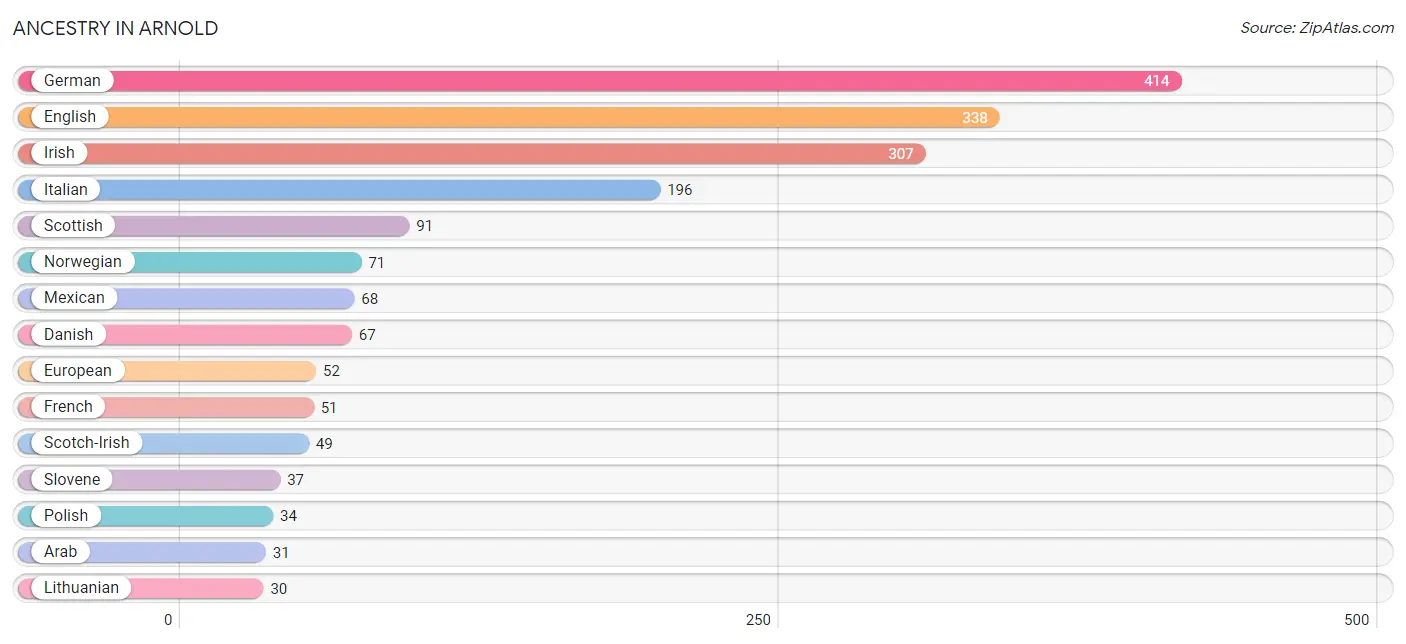
| Ancestry | # Population | % Population |
| Arab | 31 | 1.7% |
| Basque | 24 | 1.3% |
| Croatian | 7 | 0.4% |
| Danish | 67 | 3.6% |
| English | 338 | 18.1% |
| European | 52 | 2.8% |
| Finnish | 16 | 0.9% |
| French | 51 | 2.7% |
| German | 414 | 22.2% |
| Indian (Asian) | 12 | 0.6% |
| Irish | 307 | 16.5% |
| Italian | 196 | 10.5% |
| Korean | 17 | 0.9% |
| Lithuanian | 30 | 1.6% |
| Mexican | 68 | 3.6% |
| Norwegian | 71 | 3.8% |
| Polish | 34 | 1.8% |
| Portuguese | 27 | 1.5% |
| Russian | 24 | 1.3% |
| Scandinavian | 22 | 1.2% |
| Scotch-Irish | 49 | 2.6% |
| Scottish | 91 | 4.9% |
| Slovene | 37 | 2.0% |
| Spaniard | 16 | 0.9% |
| Swedish | 6 | 0.3% |
| Welsh | 27 | 1.5% | View All 26 Rows |
Immigrants in Arnold
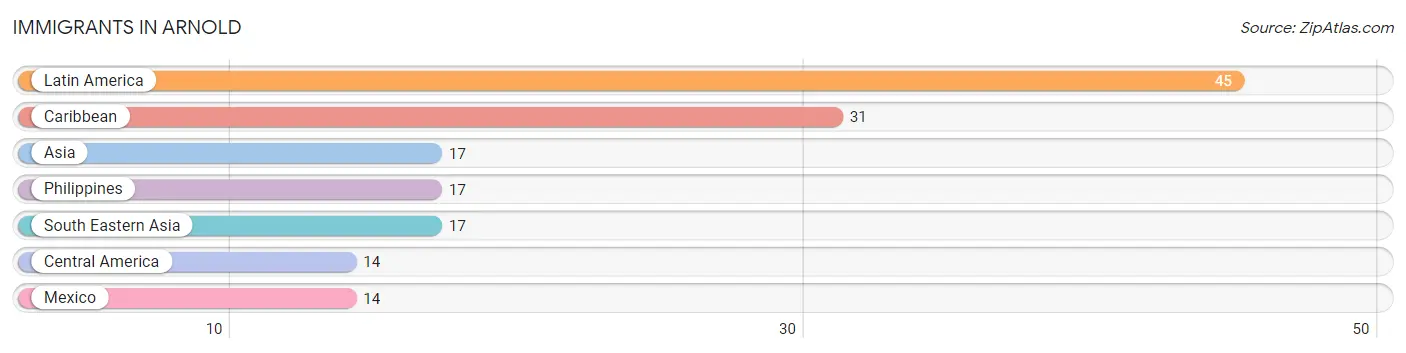
The most numerous immigrant groups reported in Arnold came from Latin America (45 | 2.4%), Caribbean (31 | 1.7%), Asia (17 | 0.9%), Philippines (17 | 0.9%), and South Eastern Asia (17 | 0.9%), together accounting for 6.8% of all Arnold residents.
| Immigration Origin | # Population | % Population |
| Asia | 17 | 0.9% |
| Caribbean | 31 | 1.7% |
| Central America | 14 | 0.7% |
| Latin America | 45 | 2.4% |
| Mexico | 14 | 0.7% |
| Philippines | 17 | 0.9% |
| South Eastern Asia | 17 | 0.9% | View All 7 Rows |
Sex and Age in Arnold
Sex and Age in Arnold
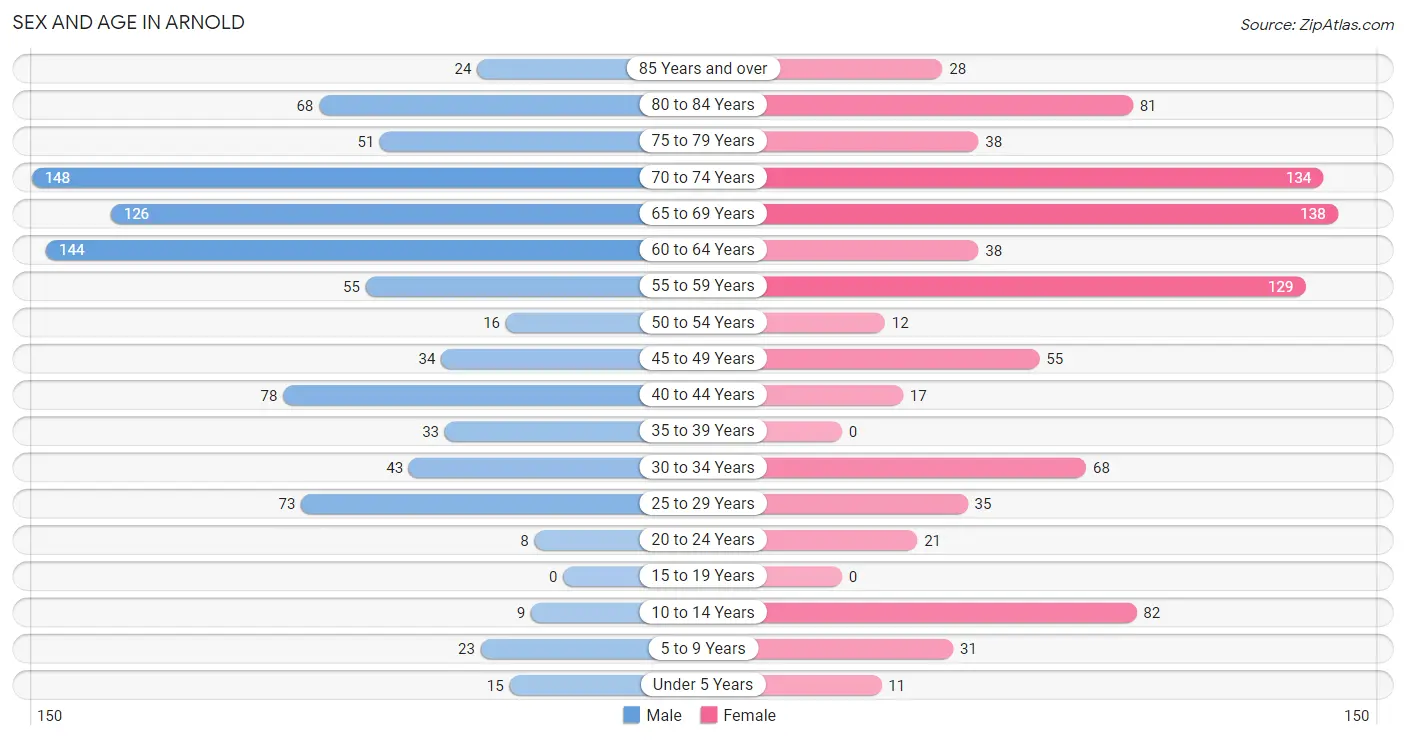
The most populous age groups in Arnold are 70 to 74 Years (148 | 15.6%) for men and 65 to 69 Years (138 | 15.0%) for women.
| Age Bracket | Male | Female |
| Under 5 Years | 15 (1.6%) | 11 (1.2%) |
| 5 to 9 Years | 23 (2.4%) | 31 (3.4%) |
| 10 to 14 Years | 9 (0.9%) | 82 (8.9%) |
| 15 to 19 Years | 0 (0.0%) | 0 (0.0%) |
| 20 to 24 Years | 8 (0.8%) | 21 (2.3%) |
| 25 to 29 Years | 73 (7.7%) | 35 (3.8%) |
| 30 to 34 Years | 43 (4.5%) | 68 (7.4%) |
| 35 to 39 Years | 33 (3.5%) | 0 (0.0%) |
| 40 to 44 Years | 78 (8.2%) | 17 (1.8%) |
| 45 to 49 Years | 34 (3.6%) | 55 (6.0%) |
| 50 to 54 Years | 16 (1.7%) | 12 (1.3%) |
| 55 to 59 Years | 55 (5.8%) | 129 (14.1%) |
| 60 to 64 Years | 144 (15.2%) | 38 (4.1%) |
| 65 to 69 Years | 126 (13.3%) | 138 (15.0%) |
| 70 to 74 Years | 148 (15.6%) | 134 (14.6%) |
| 75 to 79 Years | 51 (5.4%) | 38 (4.1%) |
| 80 to 84 Years | 68 (7.2%) | 81 (8.8%) |
| 85 Years and over | 24 (2.5%) | 28 (3.0%) |
| Total | 948 (100.0%) | 918 (100.0%) |
Families and Households in Arnold
Median Family Size in Arnold
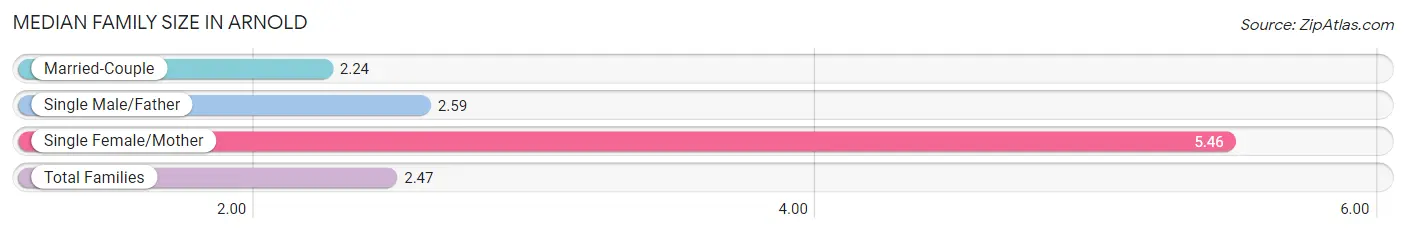
The median family size in Arnold is 2.47 persons per family, with single female/mother families (41 | 6.8%) accounting for the largest median family size of 5.46 persons per family. On the other hand, married-couple families (548 | 90.4%) represent the smallest median family size with 2.24 persons per family.
| Family Type | # Families | Family Size |
| Married-Couple | 548 (90.4%) | 2.24 |
| Single Male/Father | 17 (2.8%) | 2.59 |
| Single Female/Mother | 41 (6.8%) | 5.46 |
| Total Families | 606 (100.0%) | 2.47 |
Median Household Size in Arnold
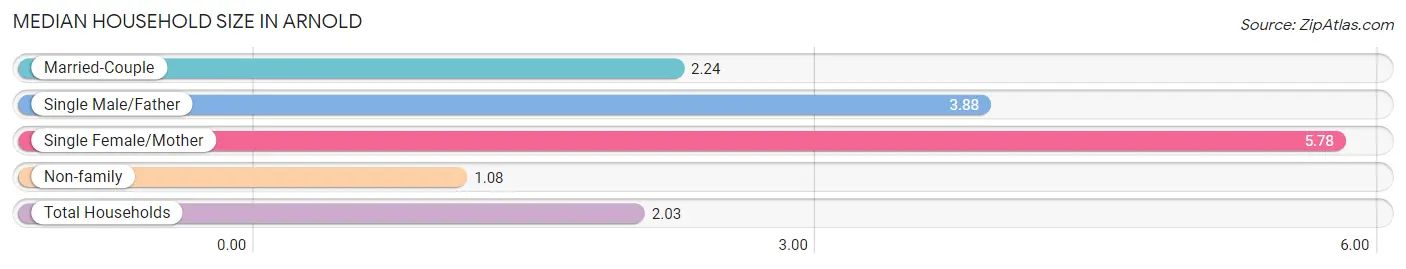
The median household size in Arnold is 2.03 persons per household, with single female/mother households (41 | 4.5%) accounting for the largest median household size of 5.78 persons per household. non-family households (311 | 33.9%) represent the smallest median household size with 1.08 persons per household.
| Household Type | # Households | Household Size |
| Married-Couple | 548 (59.8%) | 2.24 |
| Single Male/Father | 17 (1.8%) | 3.88 |
| Single Female/Mother | 41 (4.5%) | 5.78 |
| Non-family | 311 (33.9%) | 1.08 |
| Total Households | 917 (100.0%) | 2.03 |
Household Size by Marriage Status in Arnold
Out of a total of 917 households in Arnold, 606 (66.1%) are family households, while 311 (33.9%) are nonfamily households. The most numerous type of family households are 2-person households, comprising 500, and the most common type of nonfamily households are 1-person households, comprising 291.
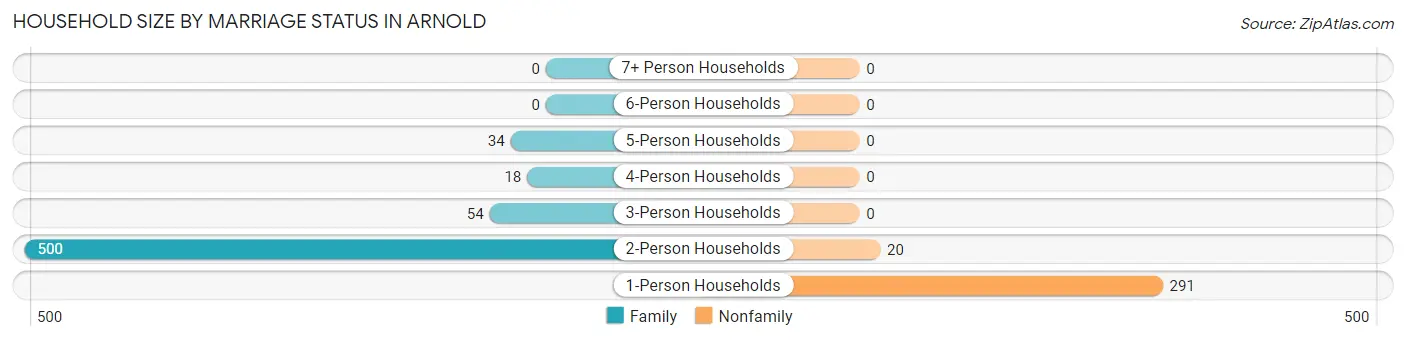
| Household Size | Family Households | Nonfamily Households |
| 1-Person Households | - | 291 (31.7%) |
| 2-Person Households | 500 (54.5%) | 20 (2.2%) |
| 3-Person Households | 54 (5.9%) | 0 (0.0%) |
| 4-Person Households | 18 (2.0%) | 0 (0.0%) |
| 5-Person Households | 34 (3.7%) | 0 (0.0%) |
| 6-Person Households | 0 (0.0%) | 0 (0.0%) |
| 7+ Person Households | 0 (0.0%) | 0 (0.0%) |
| Total | 606 (66.1%) | 311 (33.9%) |
Female Fertility in Arnold
Fertility by Age in Arnold
Average fertility rate in Arnold is 179.0 births per 1,000 women. Women in the age bracket of 20 to 34 years have the highest fertility rate with 282.0 births per 1,000 women. Women in the age bracket of 20 to 34 years acount for 100.0% of all women with births.
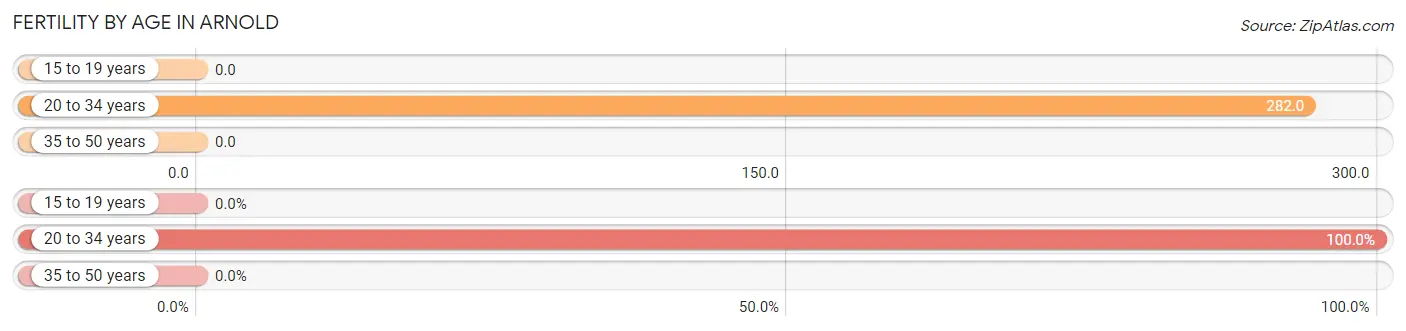
| Age Bracket | Women with Births | Births / 1,000 Women |
| 15 to 19 years | 0 (0.0%) | 0.0 |
| 20 to 34 years | 35 (100.0%) | 282.0 |
| 35 to 50 years | 0 (0.0%) | 0.0 |
| Total | 35 (100.0%) | 179.0 |
Fertility by Age by Marriage Status in Arnold
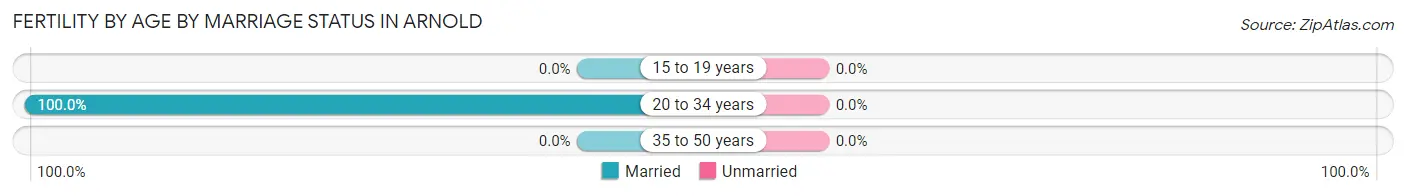
| Age Bracket | Married | Unmarried |
| 15 to 19 years | 0 (0.0%) | 0 (0.0%) |
| 20 to 34 years | 35 (100.0%) | 0 (0.0%) |
| 35 to 50 years | 0 (0.0%) | 0 (0.0%) |
| Total | 35 (100.0%) | 0 (0.0%) |
Fertility by Education in Arnold
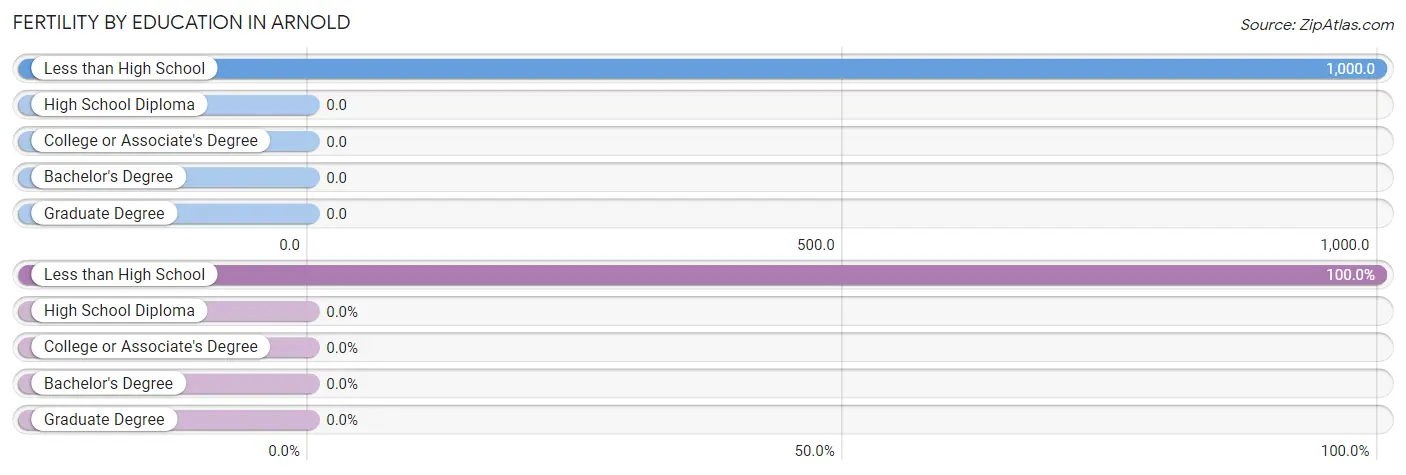
| Educational Attainment | Women with Births | Births / 1,000 Women |
| Less than High School | 35 (100.0%) | 1,000.0 |
| High School Diploma | 0 (0.0%) | 0.0 |
| College or Associate's Degree | 0 (0.0%) | 0.0 |
| Bachelor's Degree | 0 (0.0%) | 0.0 |
| Graduate Degree | 0 (0.0%) | 0.0 |
| Total | 35 (100.0%) | 179.0 |
Fertility by Education by Marriage Status in Arnold
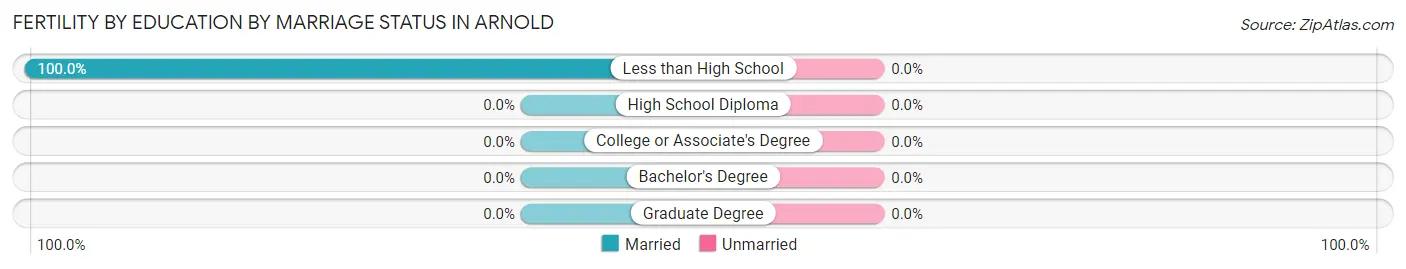
| Educational Attainment | Married | Unmarried |
| Less than High School | 35 (100.0%) | 0 (0.0%) |
| High School Diploma | 0 (0.0%) | 0 (0.0%) |
| College or Associate's Degree | 0 (0.0%) | 0 (0.0%) |
| Bachelor's Degree | 0 (0.0%) | 0 (0.0%) |
| Graduate Degree | 0 (0.0%) | 0 (0.0%) |
| Total | 35 (100.0%) | 0 (0.0%) |
Employment Characteristics in Arnold
Employment by Class of Employer in Arnold
Among the 755 employed individuals in Arnold, private company employees (372 | 49.3%), local government employees (127 | 16.8%), and self-employed (incorporated) (68 | 9.0%) make up the most common classes of employment.
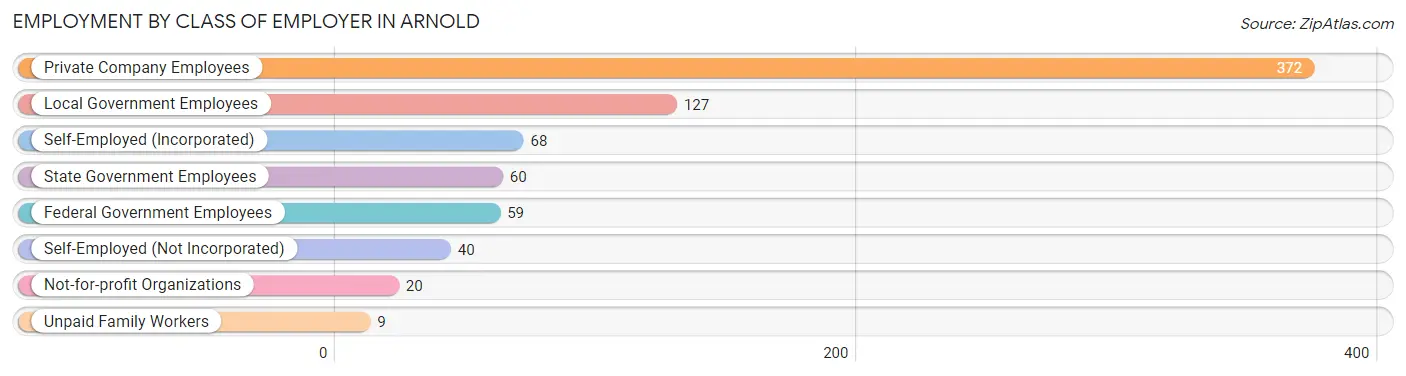
| Employer Class | # Employees | % Employees |
| Private Company Employees | 372 | 49.3% |
| Self-Employed (Incorporated) | 68 | 9.0% |
| Self-Employed (Not Incorporated) | 40 | 5.3% |
| Not-for-profit Organizations | 20 | 2.6% |
| Local Government Employees | 127 | 16.8% |
| State Government Employees | 60 | 8.0% |
| Federal Government Employees | 59 | 7.8% |
| Unpaid Family Workers | 9 | 1.2% |
| Total | 755 | 100.0% |
Employment Status by Age in Arnold
According to the labor force statistics for Arnold, out of the total population over 16 years of age (1,695), 46.8% or 793 individuals are in the labor force, with 4.9% or 39 of them unemployed. The age group with the highest labor force participation rate is 20 to 24 years, with 100.0% or 29 individuals in the labor force. Within the labor force, the 25 to 29 years age range has the highest percentage of unemployed individuals, with 32.9% or 24 of them being unemployed.
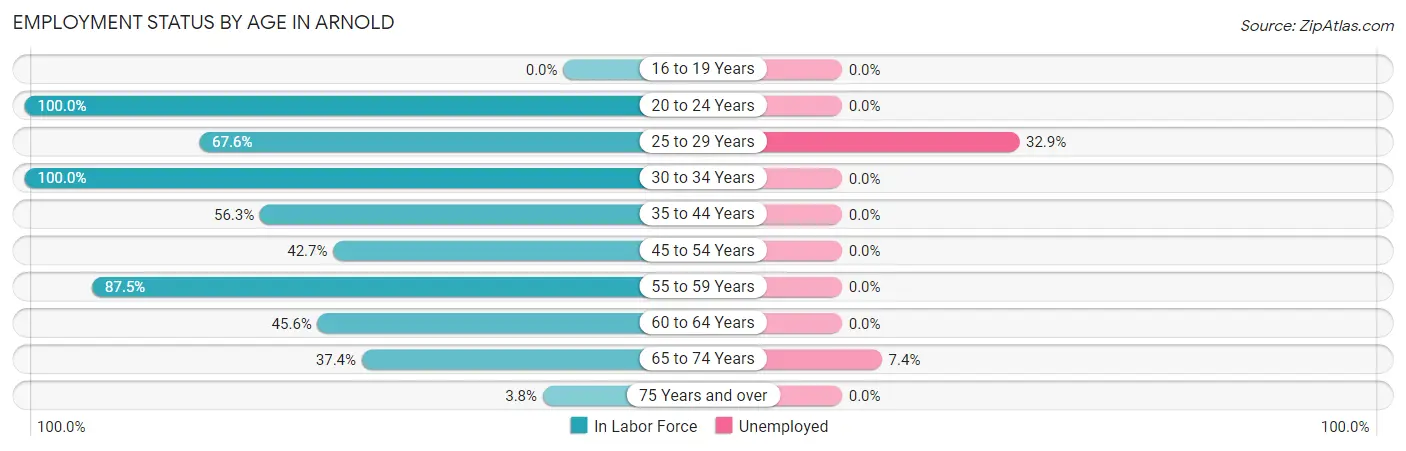
| Age Bracket | In Labor Force | Unemployed |
| 16 to 19 Years | 0 (0.0%) | 0 (0.0%) |
| 20 to 24 Years | 29 (100.0%) | 0 (0.0%) |
| 25 to 29 Years | 73 (67.6%) | 24 (32.9%) |
| 30 to 34 Years | 111 (100.0%) | 0 (0.0%) |
| 35 to 44 Years | 72 (56.3%) | 0 (0.0%) |
| 45 to 54 Years | 50 (42.7%) | 0 (0.0%) |
| 55 to 59 Years | 161 (87.5%) | 0 (0.0%) |
| 60 to 64 Years | 83 (45.6%) | 0 (0.0%) |
| 65 to 74 Years | 204 (37.4%) | 15 (7.4%) |
| 75 Years and over | 11 (3.8%) | 0 (0.0%) |
| Total | 793 (46.8%) | 39 (4.9%) |
Employment Status by Educational Attainment in Arnold
According to labor force statistics for Arnold, 66.3% of individuals (550) out of the total population between 25 and 64 years of age (830) are in the labor force, with 4.4% or 24 of them being unemployed. The group with the highest labor force participation rate are those with the educational attainment of less than high school, with 87.8% or 101 individuals in the labor force. Within the labor force, individuals with college / associate degree education have the highest percentage of unemployment, with 12.1% or 24 of them being unemployed.
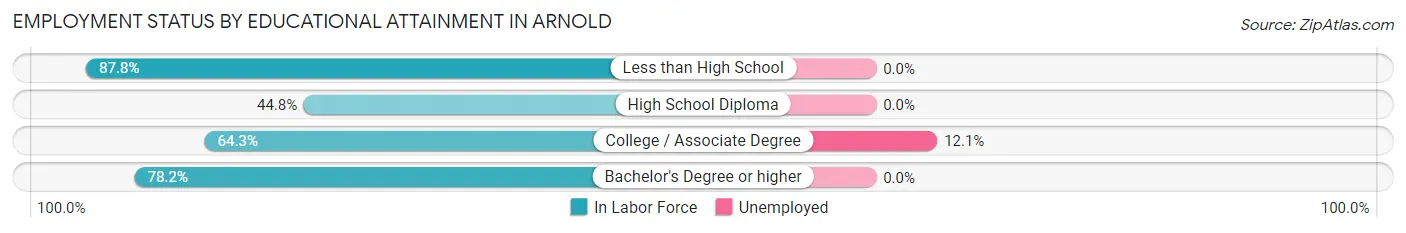
| Educational Attainment | In Labor Force | Unemployed |
| Less than High School | 101 (87.8%) | 0 (0.0%) |
| High School Diploma | 90 (44.8%) | 0 (0.0%) |
| College / Associate Degree | 198 (64.3%) | 37 (12.1%) |
| Bachelor's Degree or higher | 161 (78.2%) | 0 (0.0%) |
| Total | 550 (66.3%) | 37 (4.4%) |
Employment Occupations by Sex in Arnold
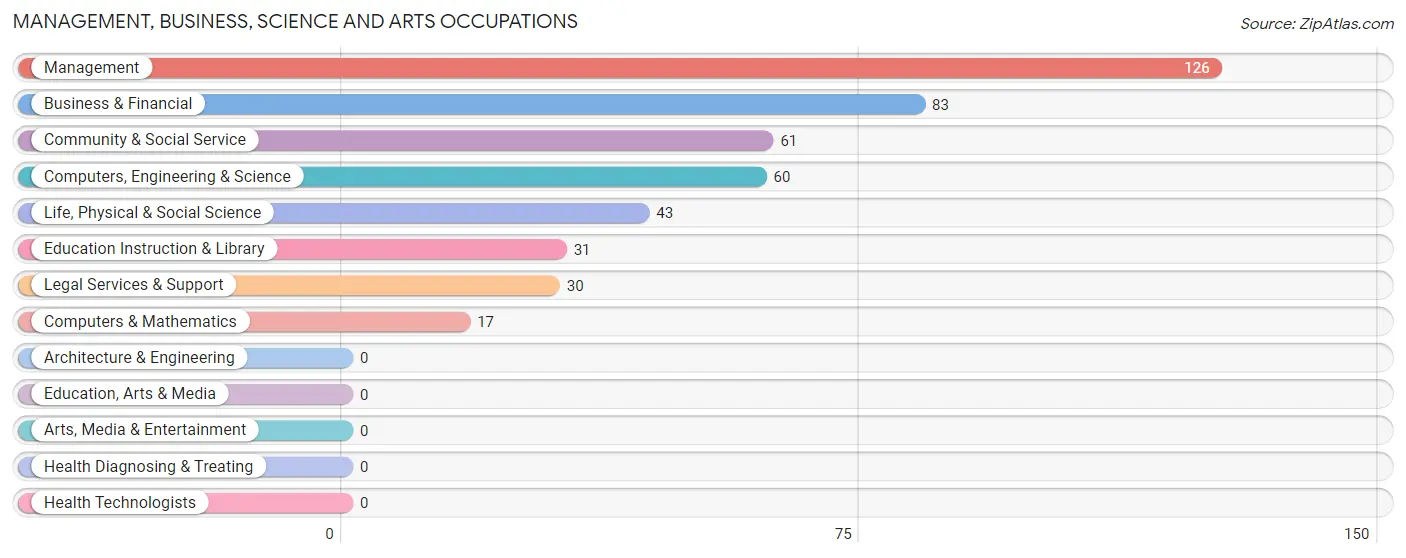
Management, Business, Science and Arts Occupations
The most common Management, Business, Science and Arts occupations in Arnold are Management (126 | 16.7%), Business & Financial (83 | 11.0%), Community & Social Service (61 | 8.1%), Computers, Engineering & Science (60 | 8.0%), and Life, Physical & Social Science (43 | 5.7%).
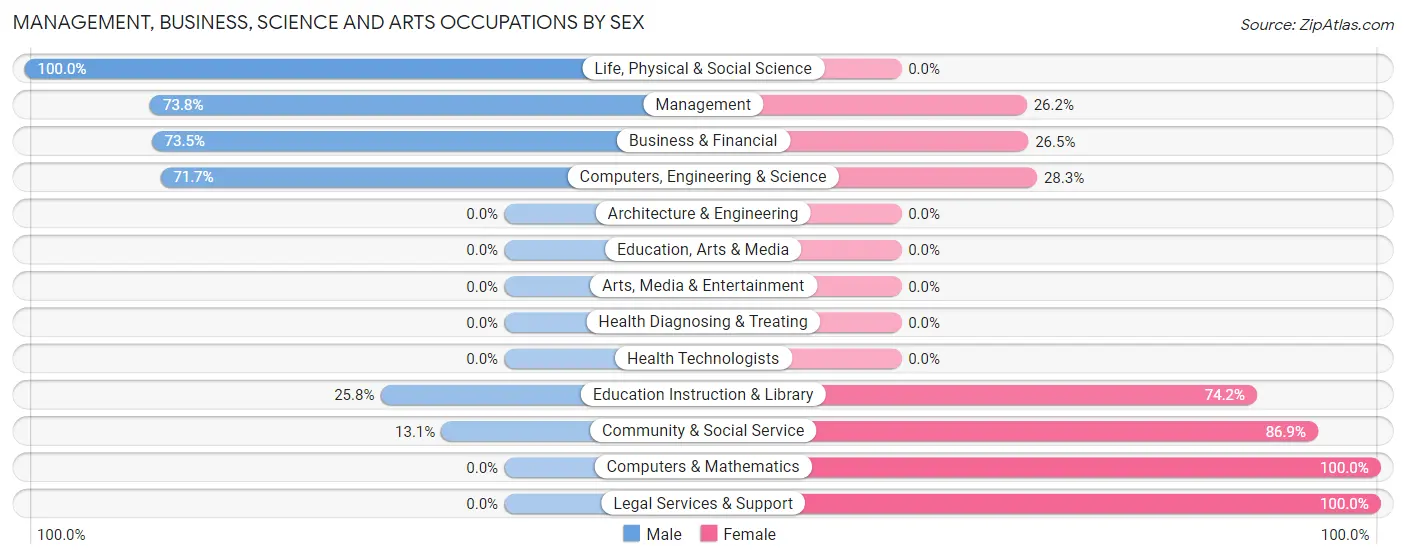
Management, Business, Science and Arts Occupations by Sex
Within the Management, Business, Science and Arts occupations in Arnold, the most male-oriented occupations are Life, Physical & Social Science (100.0%), Management (73.8%), and Business & Financial (73.5%), while the most female-oriented occupations are Computers & Mathematics (100.0%), Legal Services & Support (100.0%), and Community & Social Service (86.9%).
| Occupation | Male | Female |
| Management | 93 (73.8%) | 33 (26.2%) |
| Business & Financial | 61 (73.5%) | 22 (26.5%) |
| Computers, Engineering & Science | 43 (71.7%) | 17 (28.3%) |
| Computers & Mathematics | 0 (0.0%) | 17 (100.0%) |
| Architecture & Engineering | 0 (0.0%) | 0 (0.0%) |
| Life, Physical & Social Science | 43 (100.0%) | 0 (0.0%) |
| Community & Social Service | 8 (13.1%) | 53 (86.9%) |
| Education, Arts & Media | 0 (0.0%) | 0 (0.0%) |
| Legal Services & Support | 0 (0.0%) | 30 (100.0%) |
| Education Instruction & Library | 8 (25.8%) | 23 (74.2%) |
| Arts, Media & Entertainment | 0 (0.0%) | 0 (0.0%) |
| Health Diagnosing & Treating | 0 (0.0%) | 0 (0.0%) |
| Health Technologists | 0 (0.0%) | 0 (0.0%) |
| Total (Category) | 205 (62.1%) | 125 (37.9%) |
| Total (Overall) | 412 (54.6%) | 343 (45.4%) |
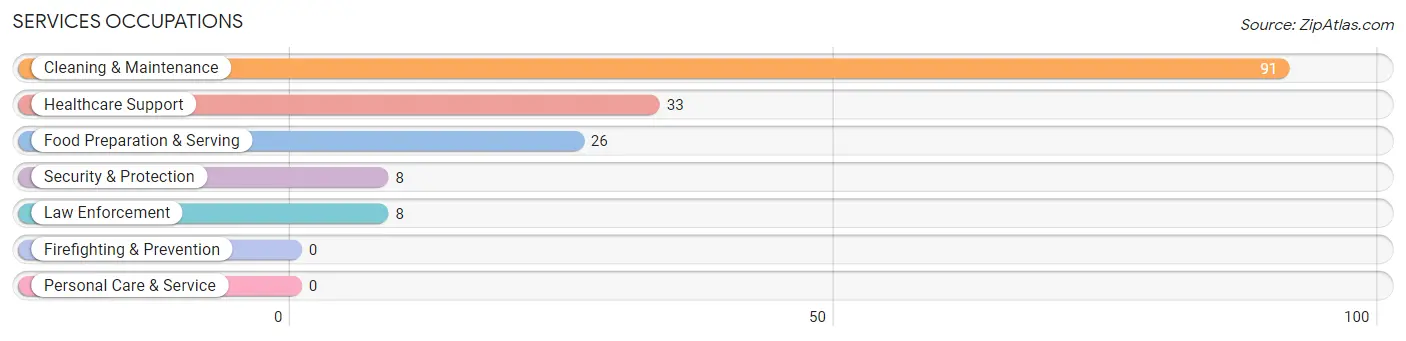
Services Occupations
The most common Services occupations in Arnold are Cleaning & Maintenance (91 | 12.0%), Healthcare Support (33 | 4.4%), Food Preparation & Serving (26 | 3.4%), Security & Protection (8 | 1.1%), and Law Enforcement (8 | 1.1%).
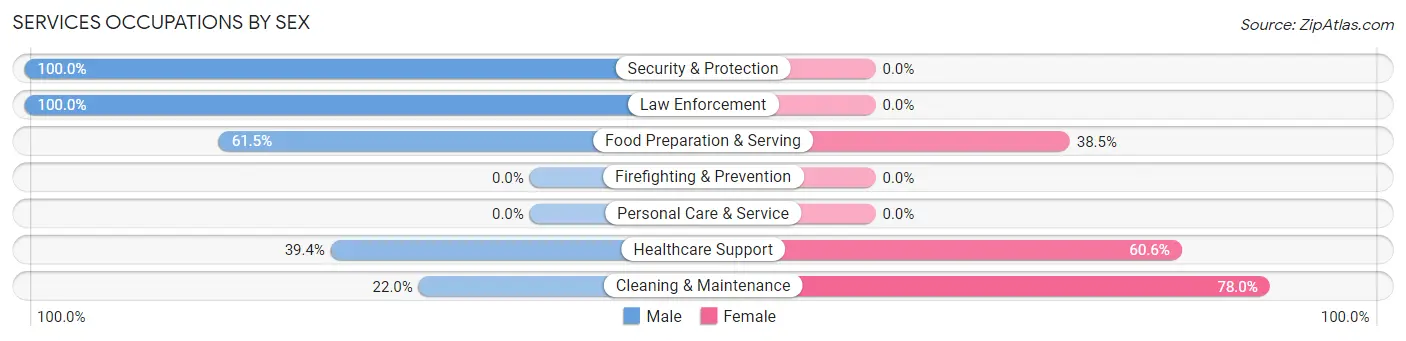
Services Occupations by Sex
Within the Services occupations in Arnold, the most male-oriented occupations are Security & Protection (100.0%), Law Enforcement (100.0%), and Food Preparation & Serving (61.5%), while the most female-oriented occupations are Cleaning & Maintenance (78.0%), Healthcare Support (60.6%), and Food Preparation & Serving (38.5%).
| Occupation | Male | Female |
| Healthcare Support | 13 (39.4%) | 20 (60.6%) |
| Security & Protection | 8 (100.0%) | 0 (0.0%) |
| Firefighting & Prevention | 0 (0.0%) | 0 (0.0%) |
| Law Enforcement | 8 (100.0%) | 0 (0.0%) |
| Food Preparation & Serving | 16 (61.5%) | 10 (38.5%) |
| Cleaning & Maintenance | 20 (22.0%) | 71 (78.0%) |
| Personal Care & Service | 0 (0.0%) | 0 (0.0%) |
| Total (Category) | 57 (36.1%) | 101 (63.9%) |
| Total (Overall) | 412 (54.6%) | 343 (45.4%) |
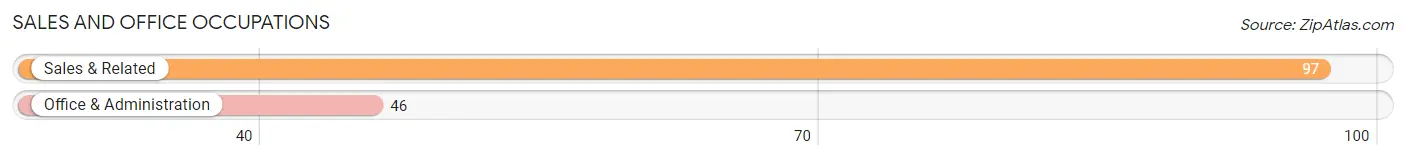
Sales and Office Occupations
The most common Sales and Office occupations in Arnold are Sales & Related (97 | 12.9%), and Office & Administration (46 | 6.1%).
Sales and Office Occupations by Sex
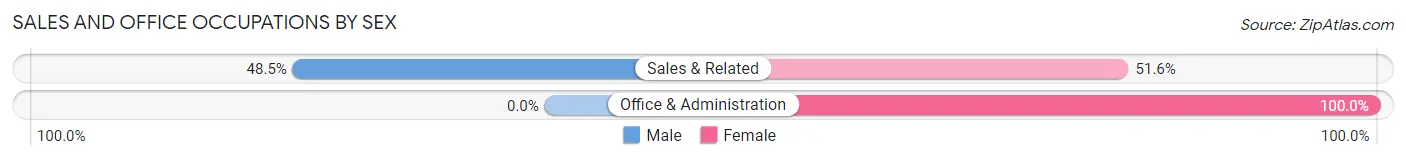
| Occupation | Male | Female |
| Sales & Related | 47 (48.4%) | 50 (51.5%) |
| Office & Administration | 0 (0.0%) | 46 (100.0%) |
| Total (Category) | 47 (32.9%) | 96 (67.1%) |
| Total (Overall) | 412 (54.6%) | 343 (45.4%) |
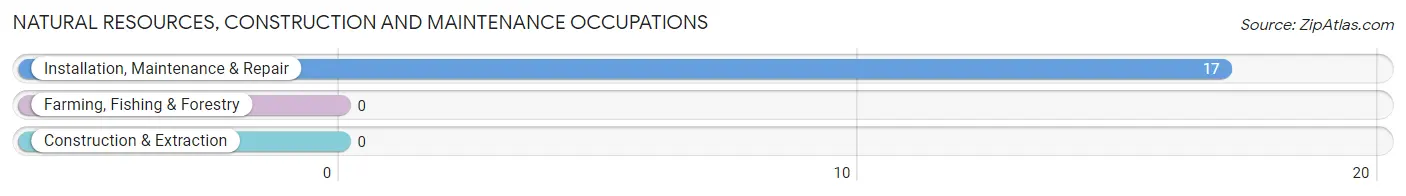
Natural Resources, Construction and Maintenance Occupations
The most common Natural Resources, Construction and Maintenance occupations in Arnold are , and Installation, Maintenance & Repair (17 | 2.2%).
Natural Resources, Construction and Maintenance Occupations by Sex
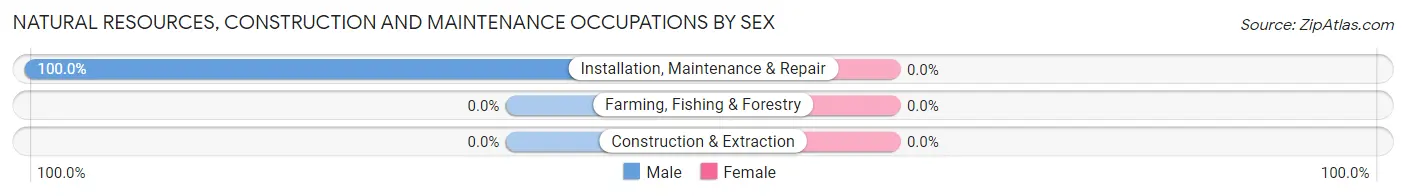
| Occupation | Male | Female |
| Farming, Fishing & Forestry | 0 (0.0%) | 0 (0.0%) |
| Construction & Extraction | 0 (0.0%) | 0 (0.0%) |
| Installation, Maintenance & Repair | 17 (100.0%) | 0 (0.0%) |
| Total (Category) | 17 (100.0%) | 0 (0.0%) |
| Total (Overall) | 412 (54.6%) | 343 (45.4%) |
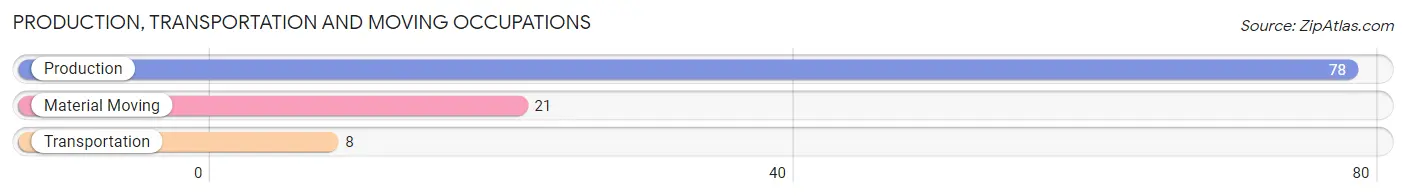
Production, Transportation and Moving Occupations
The most common Production, Transportation and Moving occupations in Arnold are Production (78 | 10.3%), Material Moving (21 | 2.8%), and Transportation (8 | 1.1%).
Production, Transportation and Moving Occupations by Sex
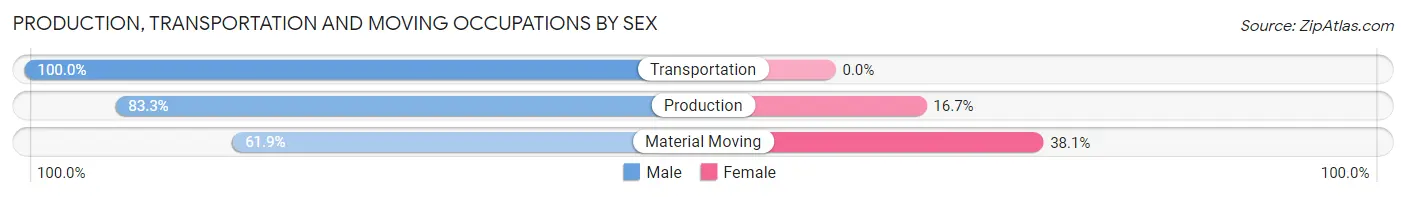
| Occupation | Male | Female |
| Production | 65 (83.3%) | 13 (16.7%) |
| Transportation | 8 (100.0%) | 0 (0.0%) |
| Material Moving | 13 (61.9%) | 8 (38.1%) |
| Total (Category) | 86 (80.4%) | 21 (19.6%) |
| Total (Overall) | 412 (54.6%) | 343 (45.4%) |
Employment Industries by Sex in Arnold
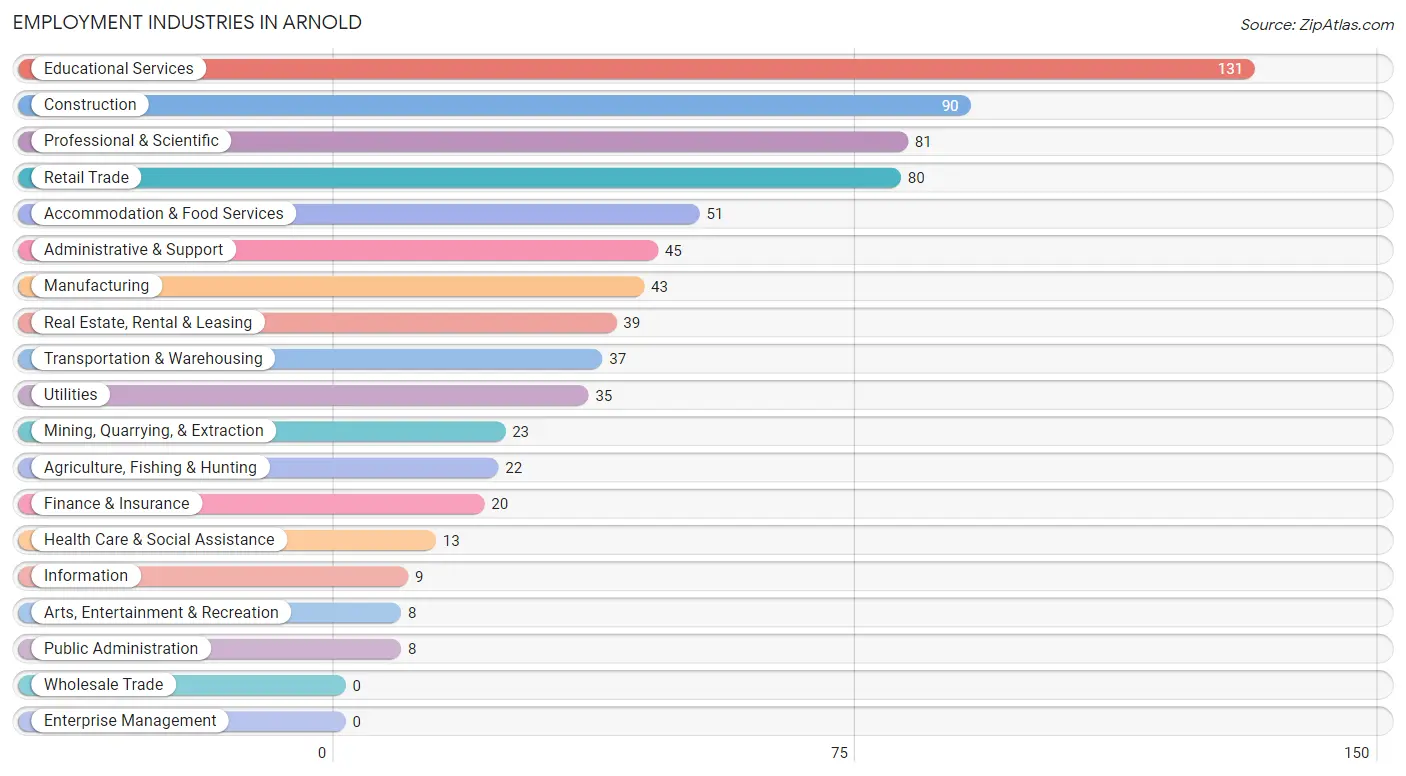
Employment Industries in Arnold
The major employment industries in Arnold include Educational Services (131 | 17.3%), Construction (90 | 11.9%), Professional & Scientific (81 | 10.7%), Retail Trade (80 | 10.6%), and Accommodation & Food Services (51 | 6.8%).
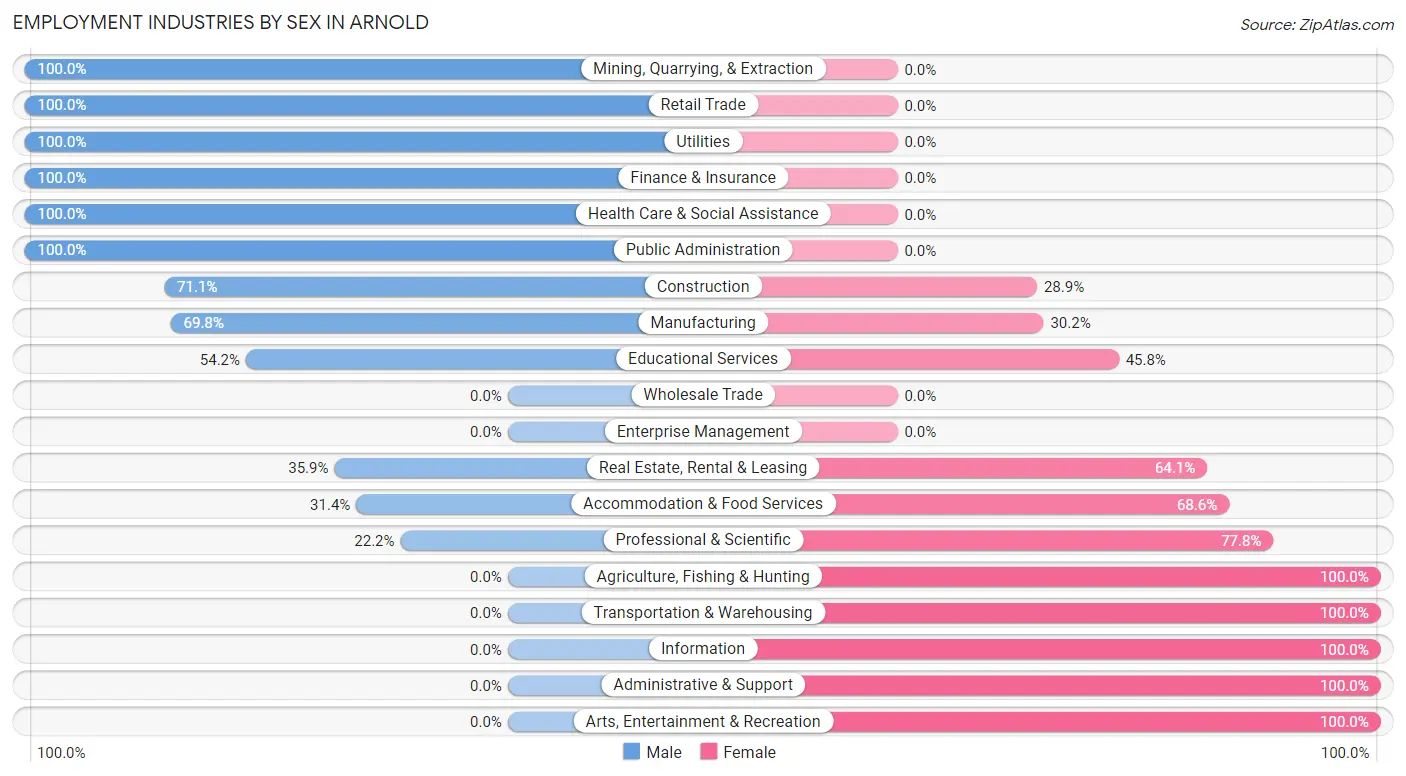
Employment Industries by Sex in Arnold
The Arnold industries that see more men than women are Mining, Quarrying, & Extraction (100.0%), Retail Trade (100.0%), and Utilities (100.0%), whereas the industries that tend to have a higher number of women are Agriculture, Fishing & Hunting (100.0%), Transportation & Warehousing (100.0%), and Information (100.0%).
| Industry | Male | Female |
| Agriculture, Fishing & Hunting | 0 (0.0%) | 22 (100.0%) |
| Mining, Quarrying, & Extraction | 23 (100.0%) | 0 (0.0%) |
| Construction | 64 (71.1%) | 26 (28.9%) |
| Manufacturing | 30 (69.8%) | 13 (30.2%) |
| Wholesale Trade | 0 (0.0%) | 0 (0.0%) |
| Retail Trade | 80 (100.0%) | 0 (0.0%) |
| Transportation & Warehousing | 0 (0.0%) | 37 (100.0%) |
| Utilities | 35 (100.0%) | 0 (0.0%) |
| Information | 0 (0.0%) | 9 (100.0%) |
| Finance & Insurance | 20 (100.0%) | 0 (0.0%) |
| Real Estate, Rental & Leasing | 14 (35.9%) | 25 (64.1%) |
| Professional & Scientific | 18 (22.2%) | 63 (77.8%) |
| Enterprise Management | 0 (0.0%) | 0 (0.0%) |
| Administrative & Support | 0 (0.0%) | 45 (100.0%) |
| Educational Services | 71 (54.2%) | 60 (45.8%) |
| Health Care & Social Assistance | 13 (100.0%) | 0 (0.0%) |
| Arts, Entertainment & Recreation | 0 (0.0%) | 8 (100.0%) |
| Accommodation & Food Services | 16 (31.4%) | 35 (68.6%) |
| Public Administration | 8 (100.0%) | 0 (0.0%) |
| Total | 412 (54.6%) | 343 (45.4%) |
Education in Arnold
School Enrollment in Arnold
The most common levels of schooling among the 145 students in Arnold are elementary school (83 | 57.2%), and middle school (62 | 42.8%).
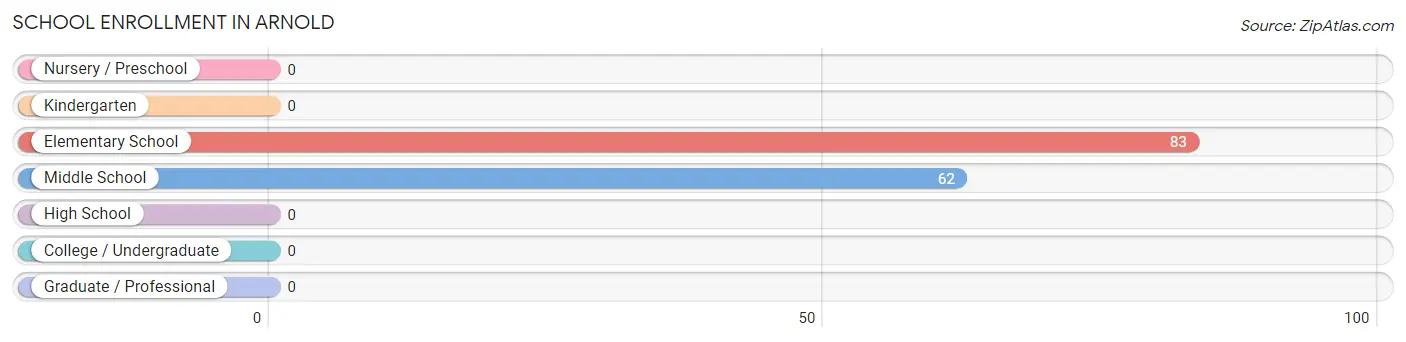
| School Level | # Students | % Students |
| Nursery / Preschool | 0 | 0.0% |
| Kindergarten | 0 | 0.0% |
| Elementary School | 83 | 57.2% |
| Middle School | 62 | 42.8% |
| High School | 0 | 0.0% |
| College / Undergraduate | 0 | 0.0% |
| Graduate / Professional | 0 | 0.0% |
| Total | 145 | 100.0% |
School Enrollment by Age by Funding Source in Arnold
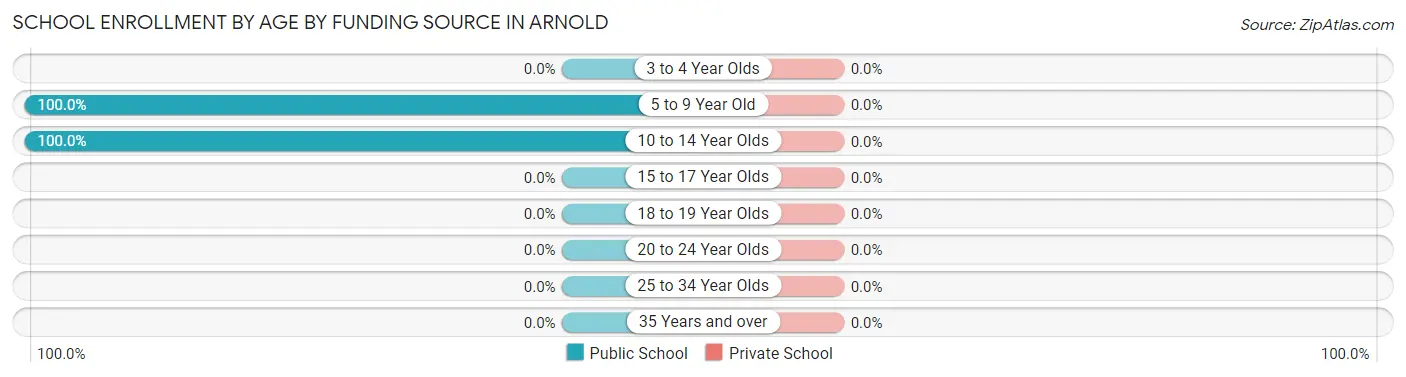
| Age Bracket | Public School | Private School |
| 3 to 4 Year Olds | 0 (0.0%) | 0 (0.0%) |
| 5 to 9 Year Old | 54 (100.0%) | 0 (0.0%) |
| 10 to 14 Year Olds | 91 (100.0%) | 0 (0.0%) |
| 15 to 17 Year Olds | 0 (0.0%) | 0 (0.0%) |
| 18 to 19 Year Olds | 0 (0.0%) | 0 (0.0%) |
| 20 to 24 Year Olds | 0 (0.0%) | 0 (0.0%) |
| 25 to 34 Year Olds | 0 (0.0%) | 0 (0.0%) |
| 35 Years and over | 0 (0.0%) | 0 (0.0%) |
| Total | 145 (100.0%) | 0 (0.0%) |
Educational Attainment by Field of Study in Arnold
Bio, nature & agricultural (111 | 17.1%), education (76 | 11.7%), business (75 | 11.5%), social sciences (67 | 10.3%), and arts & humanities (51 | 7.8%) are the most common fields of study among 651 individuals in Arnold who have obtained a bachelor's degree or higher.
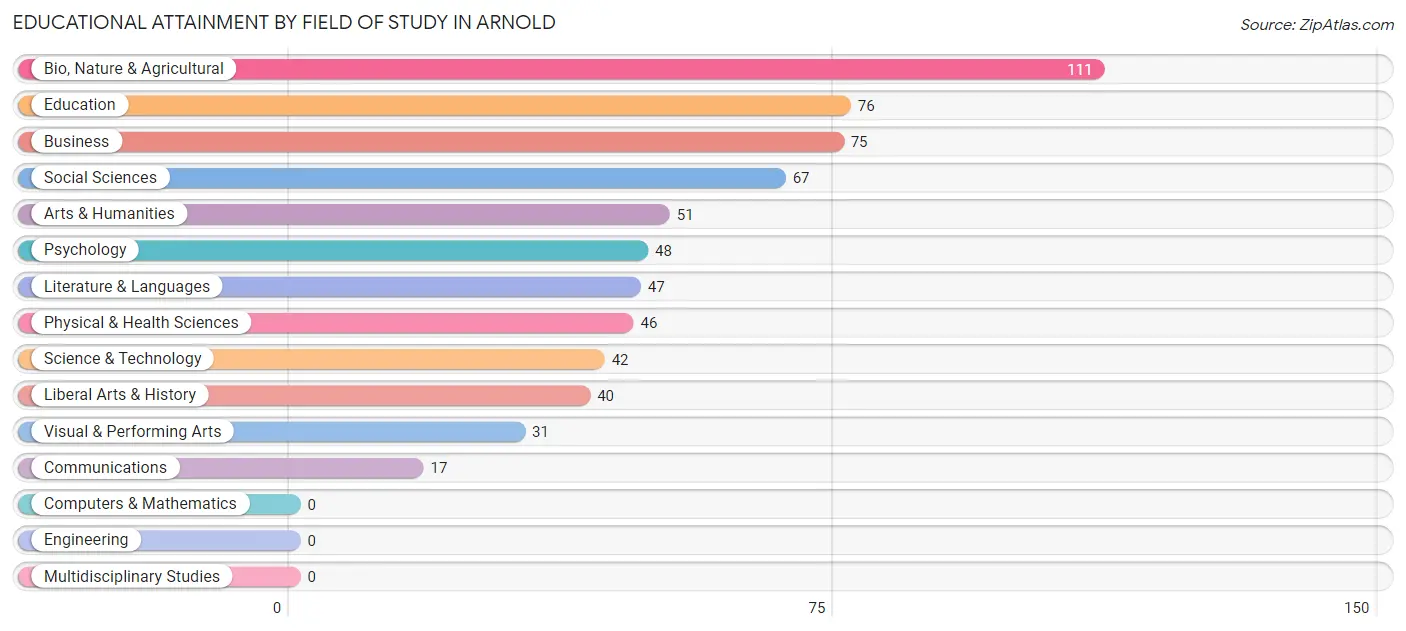
| Field of Study | # Graduates | % Graduates |
| Computers & Mathematics | 0 | 0.0% |
| Bio, Nature & Agricultural | 111 | 17.1% |
| Physical & Health Sciences | 46 | 7.1% |
| Psychology | 48 | 7.4% |
| Social Sciences | 67 | 10.3% |
| Engineering | 0 | 0.0% |
| Multidisciplinary Studies | 0 | 0.0% |
| Science & Technology | 42 | 6.5% |
| Business | 75 | 11.5% |
| Education | 76 | 11.7% |
| Literature & Languages | 47 | 7.2% |
| Liberal Arts & History | 40 | 6.1% |
| Visual & Performing Arts | 31 | 4.8% |
| Communications | 17 | 2.6% |
| Arts & Humanities | 51 | 7.8% |
| Total | 651 | 100.0% |
Transportation & Commute in Arnold
Vehicle Availability by Sex in Arnold
The most prevalent vehicle ownership categories in Arnold are males with 3 vehicles (163, accounting for 39.6%) and females with 3 vehicles (144, making up 47.5%).
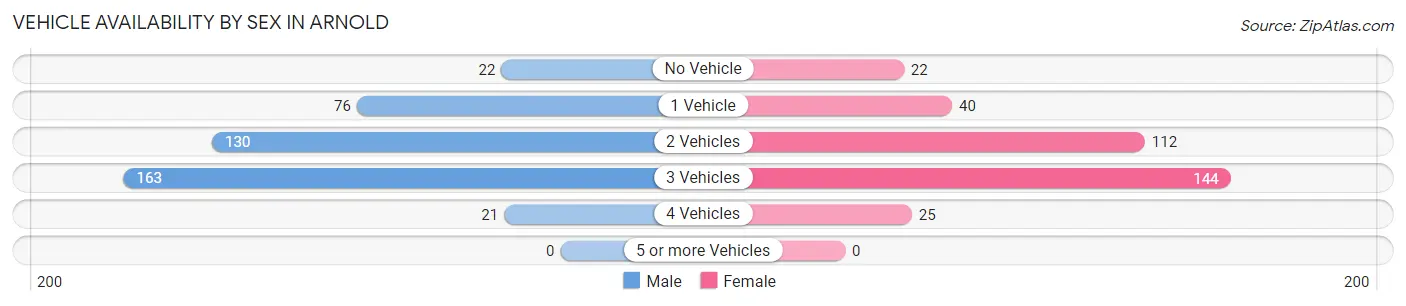
| Vehicles Available | Male | Female |
| No Vehicle | 22 (5.3%) | 22 (6.4%) |
| 1 Vehicle | 76 (18.4%) | 40 (11.7%) |
| 2 Vehicles | 130 (31.6%) | 112 (32.7%) |
| 3 Vehicles | 163 (39.6%) | 144 (42.0%) |
| 4 Vehicles | 21 (5.1%) | 25 (7.3%) |
| 5 or more Vehicles | 0 (0.0%) | 0 (0.0%) |
| Total | 412 (100.0%) | 343 (100.0%) |
Commute Time in Arnold
The most frequently occuring commute durations in Arnold are 5 to 9 minutes (137 commuters, 31.4%), 10 to 14 minutes (73 commuters, 16.7%), and 60 to 89 minutes (52 commuters, 11.9%).
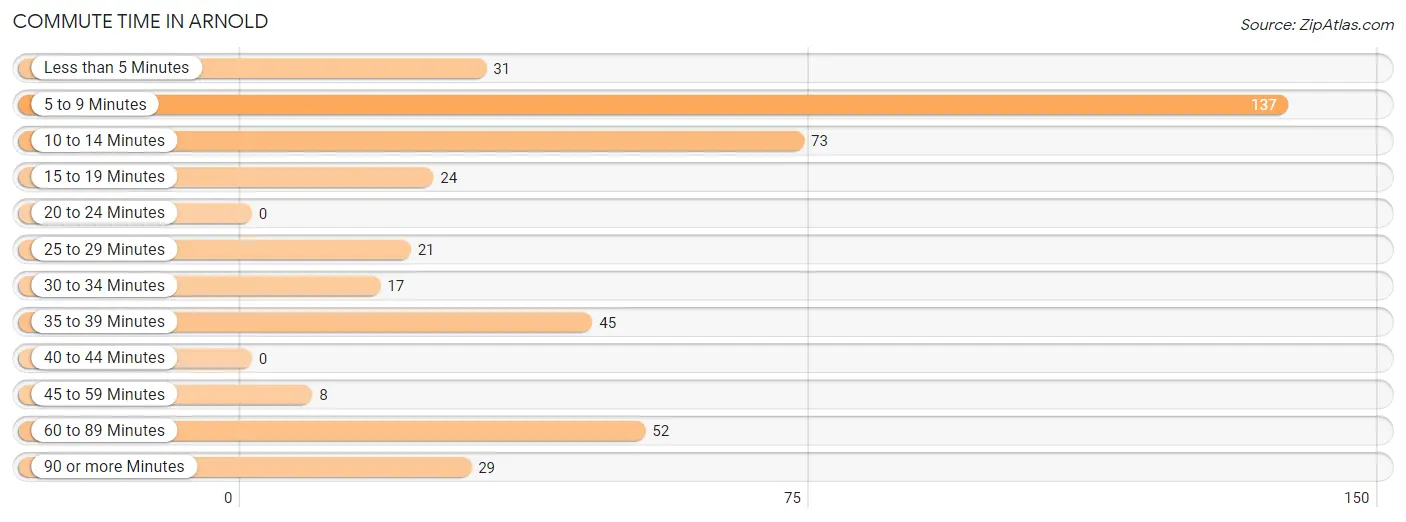
| Commute Time | # Commuters | % Commuters |
| Less than 5 Minutes | 31 | 7.1% |
| 5 to 9 Minutes | 137 | 31.4% |
| 10 to 14 Minutes | 73 | 16.7% |
| 15 to 19 Minutes | 24 | 5.5% |
| 20 to 24 Minutes | 0 | 0.0% |
| 25 to 29 Minutes | 21 | 4.8% |
| 30 to 34 Minutes | 17 | 3.9% |
| 35 to 39 Minutes | 45 | 10.3% |
| 40 to 44 Minutes | 0 | 0.0% |
| 45 to 59 Minutes | 8 | 1.8% |
| 60 to 89 Minutes | 52 | 11.9% |
| 90 or more Minutes | 29 | 6.6% |
Commute Time by Sex in Arnold
The most common commute times in Arnold are 10 to 14 minutes (65 commuters, 26.3%) for males and 5 to 9 minutes (92 commuters, 48.4%) for females.
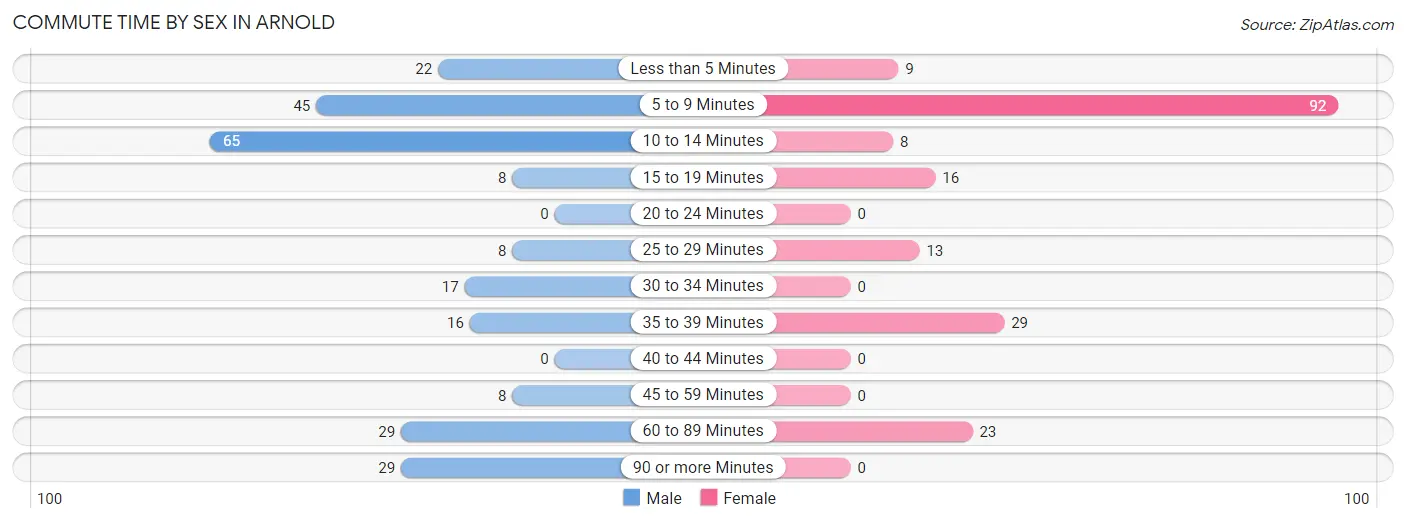
| Commute Time | Male | Female |
| Less than 5 Minutes | 22 (8.9%) | 9 (4.7%) |
| 5 to 9 Minutes | 45 (18.2%) | 92 (48.4%) |
| 10 to 14 Minutes | 65 (26.3%) | 8 (4.2%) |
| 15 to 19 Minutes | 8 (3.2%) | 16 (8.4%) |
| 20 to 24 Minutes | 0 (0.0%) | 0 (0.0%) |
| 25 to 29 Minutes | 8 (3.2%) | 13 (6.8%) |
| 30 to 34 Minutes | 17 (6.9%) | 0 (0.0%) |
| 35 to 39 Minutes | 16 (6.5%) | 29 (15.3%) |
| 40 to 44 Minutes | 0 (0.0%) | 0 (0.0%) |
| 45 to 59 Minutes | 8 (3.2%) | 0 (0.0%) |
| 60 to 89 Minutes | 29 (11.7%) | 23 (12.1%) |
| 90 or more Minutes | 29 (11.7%) | 0 (0.0%) |
Time of Departure to Work by Sex in Arnold
The most frequent times of departure to work in Arnold are 6:30 AM to 6:59 AM (87, 35.2%) for males and 9:00 AM to 9:59 AM (81, 42.6%) for females.
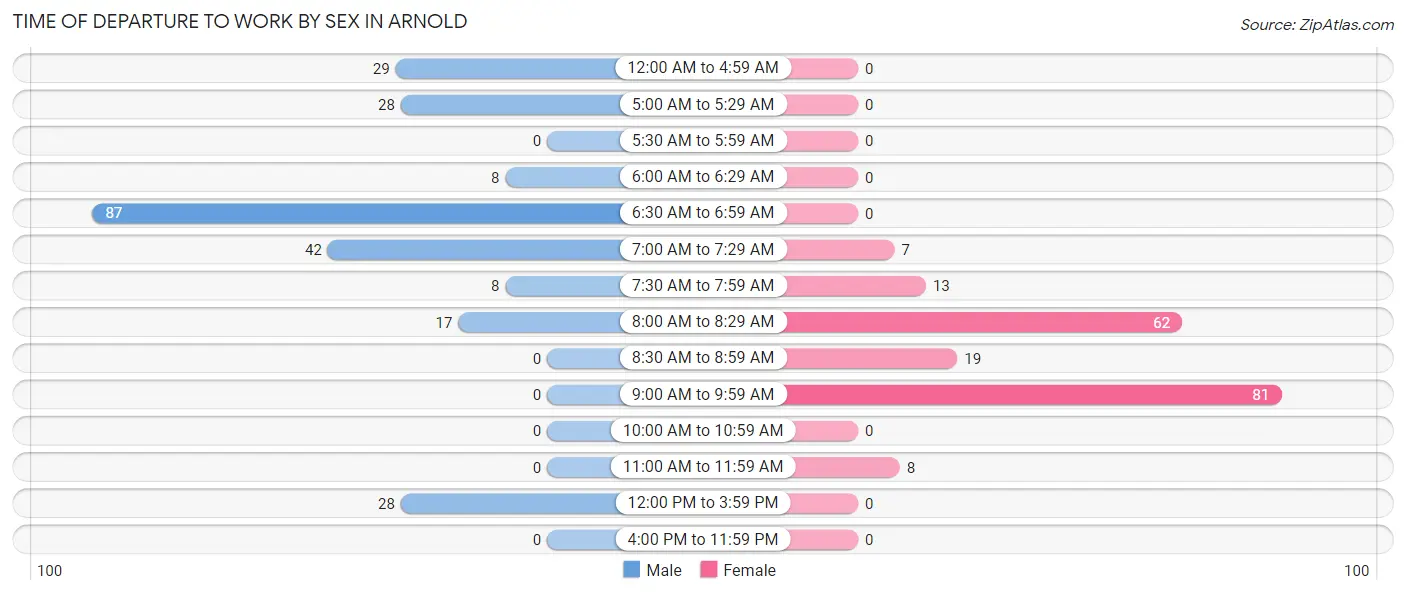
| Time of Departure | Male | Female |
| 12:00 AM to 4:59 AM | 29 (11.7%) | 0 (0.0%) |
| 5:00 AM to 5:29 AM | 28 (11.3%) | 0 (0.0%) |
| 5:30 AM to 5:59 AM | 0 (0.0%) | 0 (0.0%) |
| 6:00 AM to 6:29 AM | 8 (3.2%) | 0 (0.0%) |
| 6:30 AM to 6:59 AM | 87 (35.2%) | 0 (0.0%) |
| 7:00 AM to 7:29 AM | 42 (17.0%) | 7 (3.7%) |
| 7:30 AM to 7:59 AM | 8 (3.2%) | 13 (6.8%) |
| 8:00 AM to 8:29 AM | 17 (6.9%) | 62 (32.6%) |
| 8:30 AM to 8:59 AM | 0 (0.0%) | 19 (10.0%) |
| 9:00 AM to 9:59 AM | 0 (0.0%) | 81 (42.6%) |
| 10:00 AM to 10:59 AM | 0 (0.0%) | 0 (0.0%) |
| 11:00 AM to 11:59 AM | 0 (0.0%) | 8 (4.2%) |
| 12:00 PM to 3:59 PM | 28 (11.3%) | 0 (0.0%) |
| 4:00 PM to 11:59 PM | 0 (0.0%) | 0 (0.0%) |
| Total | 247 (100.0%) | 190 (100.0%) |
Housing Occupancy in Arnold
Occupancy by Ownership in Arnold
Of the total 917 dwellings in Arnold, owner-occupied units account for 800 (87.2%), while renter-occupied units make up 117 (12.8%).
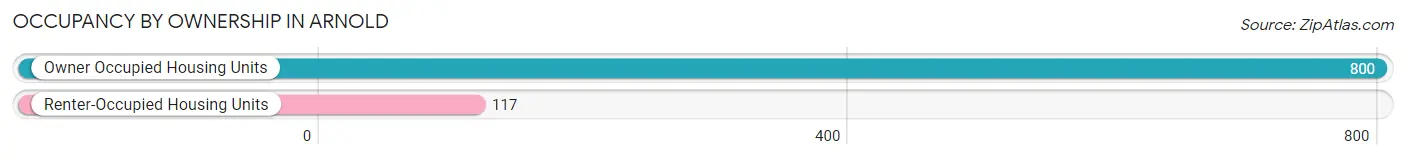
| Occupancy | # Housing Units | % Housing Units |
| Owner Occupied Housing Units | 800 | 87.2% |
| Renter-Occupied Housing Units | 117 | 12.8% |
| Total Occupied Housing Units | 917 | 100.0% |
Occupancy by Household Size in Arnold
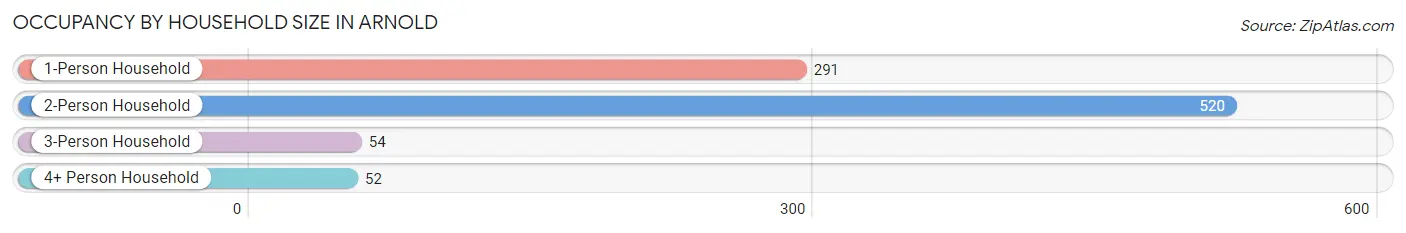
| Household Size | # Housing Units | % Housing Units |
| 1-Person Household | 291 | 31.7% |
| 2-Person Household | 520 | 56.7% |
| 3-Person Household | 54 | 5.9% |
| 4+ Person Household | 52 | 5.7% |
| Total Housing Units | 917 | 100.0% |
Occupancy by Ownership by Household Size in Arnold
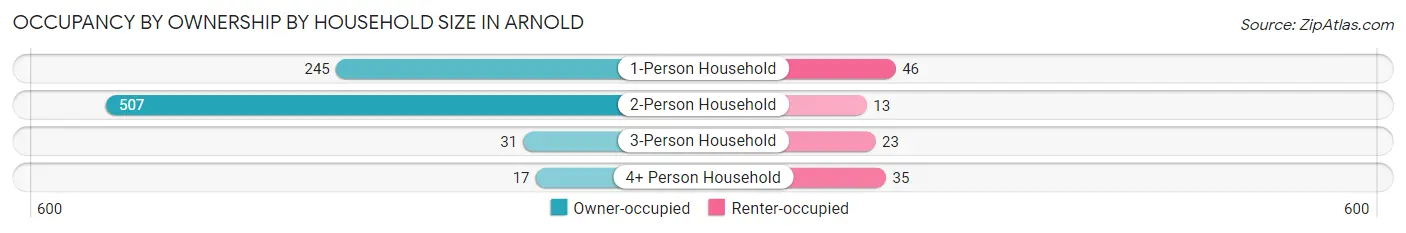
| Household Size | Owner-occupied | Renter-occupied |
| 1-Person Household | 245 (84.2%) | 46 (15.8%) |
| 2-Person Household | 507 (97.5%) | 13 (2.5%) |
| 3-Person Household | 31 (57.4%) | 23 (42.6%) |
| 4+ Person Household | 17 (32.7%) | 35 (67.3%) |
| Total Housing Units | 800 (87.2%) | 117 (12.8%) |
Occupancy by Educational Attainment in Arnold
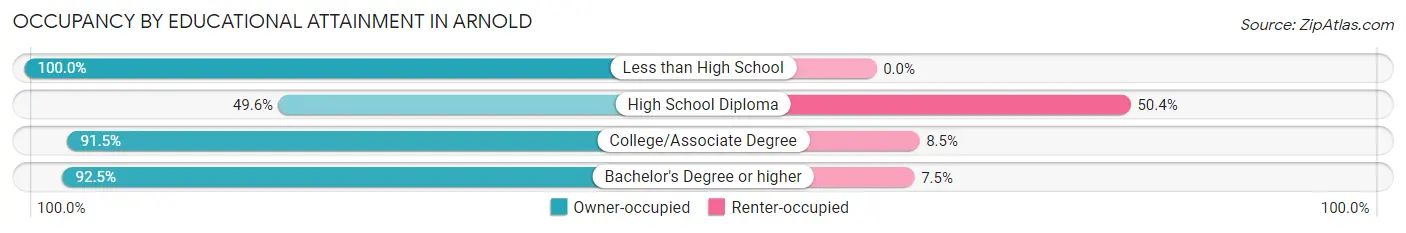
| Household Size | Owner-occupied | Renter-occupied |
| Less than High School | 84 (100.0%) | 0 (0.0%) |
| High School Diploma | 59 (49.6%) | 60 (50.4%) |
| College/Associate Degree | 289 (91.5%) | 27 (8.5%) |
| Bachelor's Degree or higher | 368 (92.5%) | 30 (7.5%) |
Occupancy by Age of Householder in Arnold
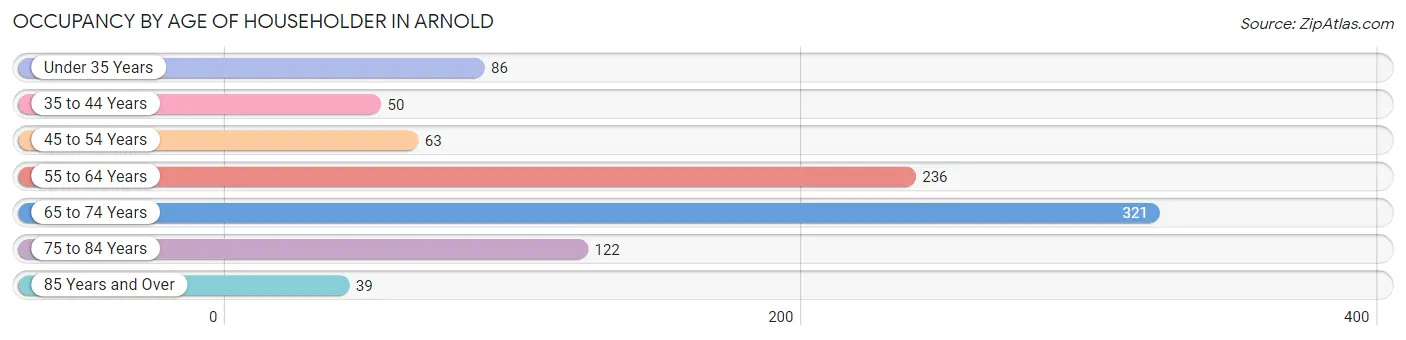
| Age Bracket | # Households | % Households |
| Under 35 Years | 86 | 9.4% |
| 35 to 44 Years | 50 | 5.4% |
| 45 to 54 Years | 63 | 6.9% |
| 55 to 64 Years | 236 | 25.7% |
| 65 to 74 Years | 321 | 35.0% |
| 75 to 84 Years | 122 | 13.3% |
| 85 Years and Over | 39 | 4.3% |
| Total | 917 | 100.0% |
Housing Finances in Arnold
Median Income by Occupancy in Arnold
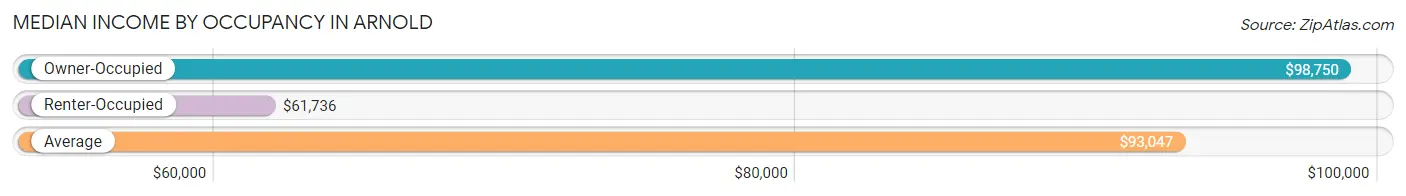
| Occupancy Type | # Households | Median Income |
| Owner-Occupied | 800 (87.2%) | $98,750 |
| Renter-Occupied | 117 (12.8%) | $61,736 |
| Average | 917 (100.0%) | $93,047 |
Occupancy by Householder Income Bracket in Arnold
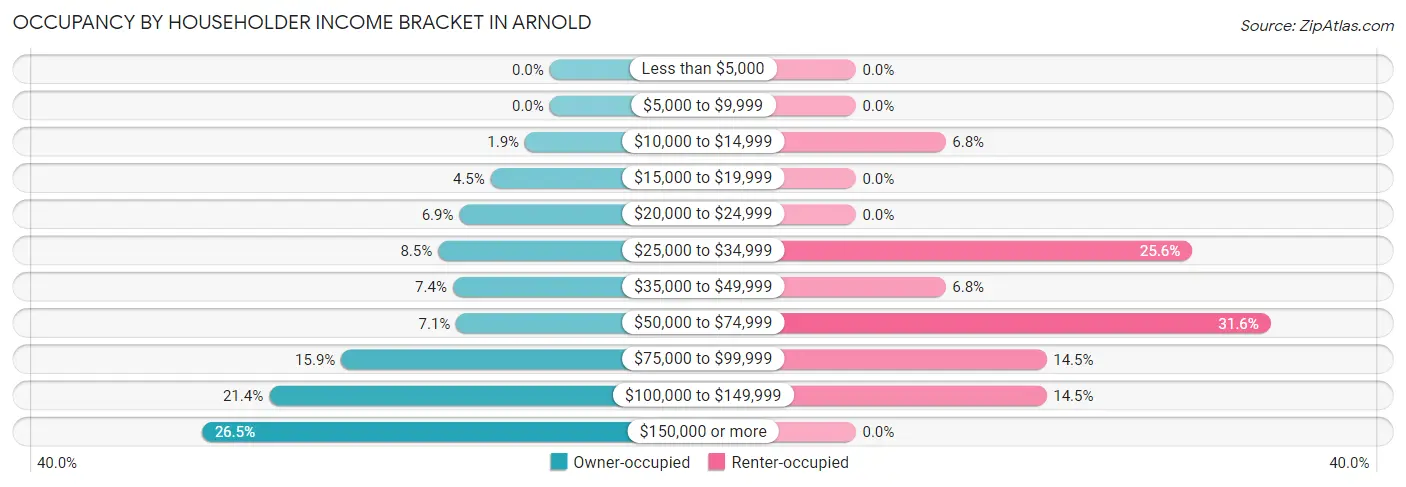
| Income Bracket | Owner-occupied | Renter-occupied |
| Less than $5,000 | 0 (0.0%) | 0 (0.0%) |
| $5,000 to $9,999 | 0 (0.0%) | 0 (0.0%) |
| $10,000 to $14,999 | 15 (1.9%) | 8 (6.8%) |
| $15,000 to $19,999 | 36 (4.5%) | 0 (0.0%) |
| $20,000 to $24,999 | 55 (6.9%) | 0 (0.0%) |
| $25,000 to $34,999 | 68 (8.5%) | 30 (25.6%) |
| $35,000 to $49,999 | 59 (7.4%) | 8 (6.8%) |
| $50,000 to $74,999 | 57 (7.1%) | 37 (31.6%) |
| $75,000 to $99,999 | 127 (15.9%) | 17 (14.5%) |
| $100,000 to $149,999 | 171 (21.4%) | 17 (14.5%) |
| $150,000 or more | 212 (26.5%) | 0 (0.0%) |
| Total | 800 (100.0%) | 117 (100.0%) |
Monthly Housing Cost Tiers in Arnold
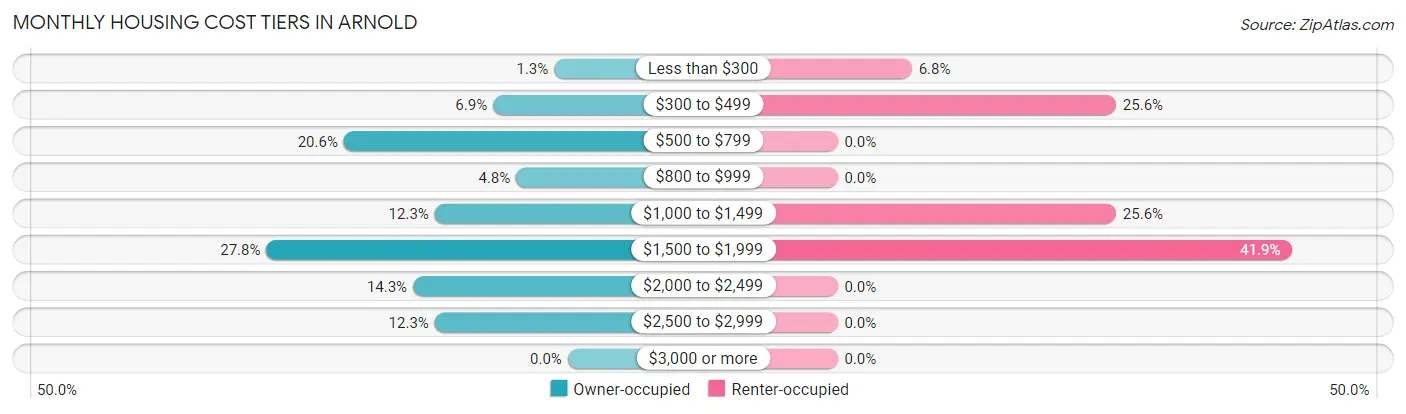
| Monthly Cost | Owner-occupied | Renter-occupied |
| Less than $300 | 10 (1.3%) | 8 (6.8%) |
| $300 to $499 | 55 (6.9%) | 30 (25.6%) |
| $500 to $799 | 165 (20.6%) | 0 (0.0%) |
| $800 to $999 | 38 (4.8%) | 0 (0.0%) |
| $1,000 to $1,499 | 98 (12.2%) | 30 (25.6%) |
| $1,500 to $1,999 | 222 (27.8%) | 49 (41.9%) |
| $2,000 to $2,499 | 114 (14.2%) | 0 (0.0%) |
| $2,500 to $2,999 | 98 (12.2%) | 0 (0.0%) |
| $3,000 or more | 0 (0.0%) | 0 (0.0%) |
| Total | 800 (100.0%) | 117 (100.0%) |
Physical Housing Characteristics in Arnold
Housing Structures in Arnold
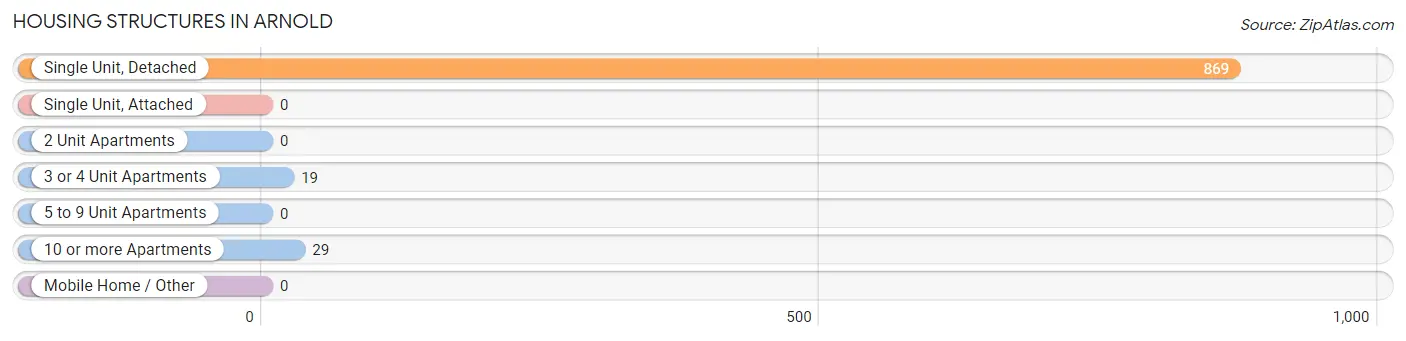
| Structure Type | # Housing Units | % Housing Units |
| Single Unit, Detached | 869 | 94.8% |
| Single Unit, Attached | 0 | 0.0% |
| 2 Unit Apartments | 0 | 0.0% |
| 3 or 4 Unit Apartments | 19 | 2.1% |
| 5 to 9 Unit Apartments | 0 | 0.0% |
| 10 or more Apartments | 29 | 3.2% |
| Mobile Home / Other | 0 | 0.0% |
| Total | 917 | 100.0% |
Housing Structures by Occupancy in Arnold
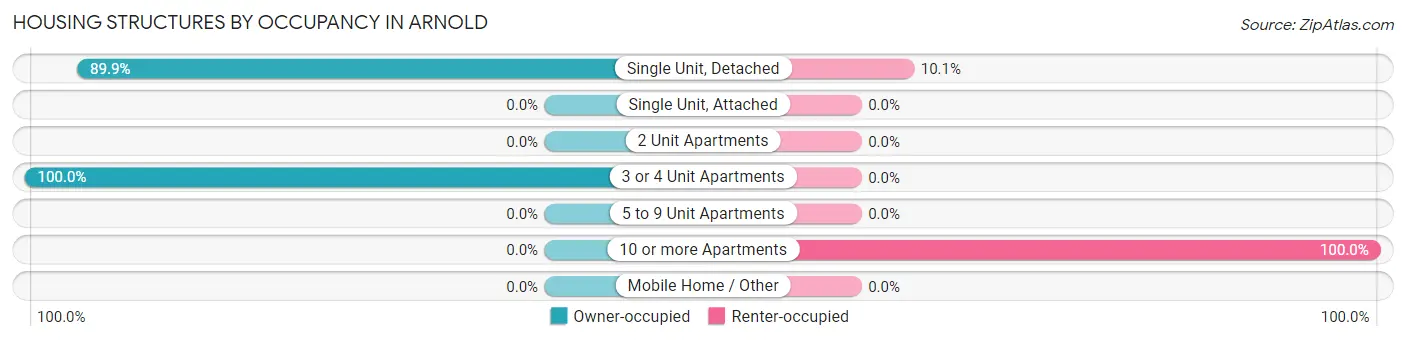
| Structure Type | Owner-occupied | Renter-occupied |
| Single Unit, Detached | 781 (89.9%) | 88 (10.1%) |
| Single Unit, Attached | 0 (0.0%) | 0 (0.0%) |
| 2 Unit Apartments | 0 (0.0%) | 0 (0.0%) |
| 3 or 4 Unit Apartments | 19 (100.0%) | 0 (0.0%) |
| 5 to 9 Unit Apartments | 0 (0.0%) | 0 (0.0%) |
| 10 or more Apartments | 0 (0.0%) | 29 (100.0%) |
| Mobile Home / Other | 0 (0.0%) | 0 (0.0%) |
| Total | 800 (87.2%) | 117 (12.8%) |
Housing Structures by Number of Rooms in Arnold
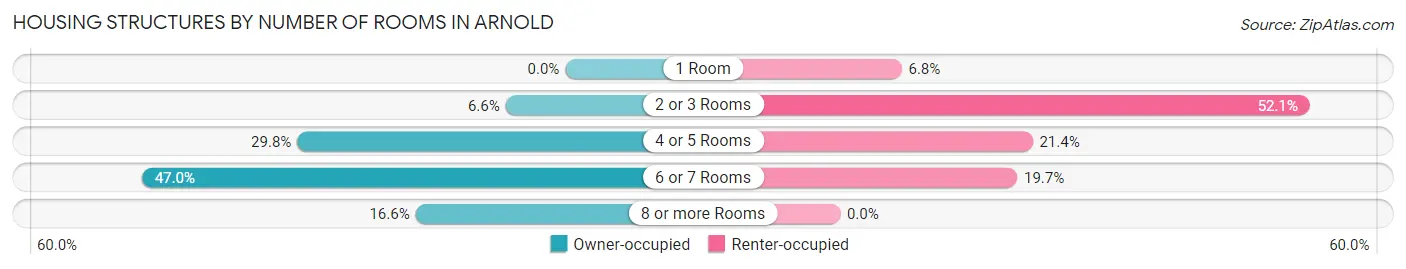
| Number of Rooms | Owner-occupied | Renter-occupied |
| 1 Room | 0 (0.0%) | 8 (6.8%) |
| 2 or 3 Rooms | 53 (6.6%) | 61 (52.1%) |
| 4 or 5 Rooms | 238 (29.7%) | 25 (21.4%) |
| 6 or 7 Rooms | 376 (47.0%) | 23 (19.7%) |
| 8 or more Rooms | 133 (16.6%) | 0 (0.0%) |
| Total | 800 (100.0%) | 117 (100.0%) |
Housing Structure by Heating Type in Arnold
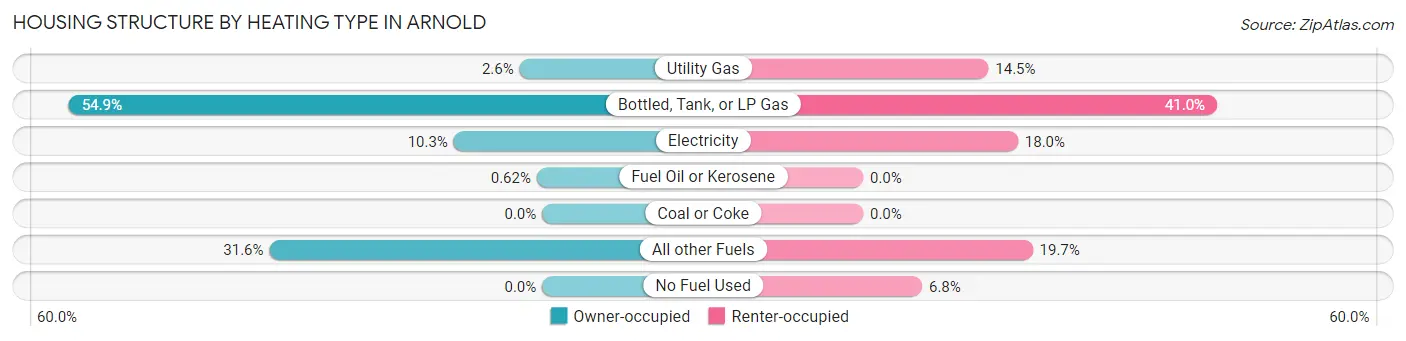
| Heating Type | Owner-occupied | Renter-occupied |
| Utility Gas | 21 (2.6%) | 17 (14.5%) |
| Bottled, Tank, or LP Gas | 439 (54.9%) | 48 (41.0%) |
| Electricity | 82 (10.2%) | 21 (17.9%) |
| Fuel Oil or Kerosene | 5 (0.6%) | 0 (0.0%) |
| Coal or Coke | 0 (0.0%) | 0 (0.0%) |
| All other Fuels | 253 (31.6%) | 23 (19.7%) |
| No Fuel Used | 0 (0.0%) | 8 (6.8%) |
| Total | 800 (100.0%) | 117 (100.0%) |
Household Vehicle Usage in Arnold
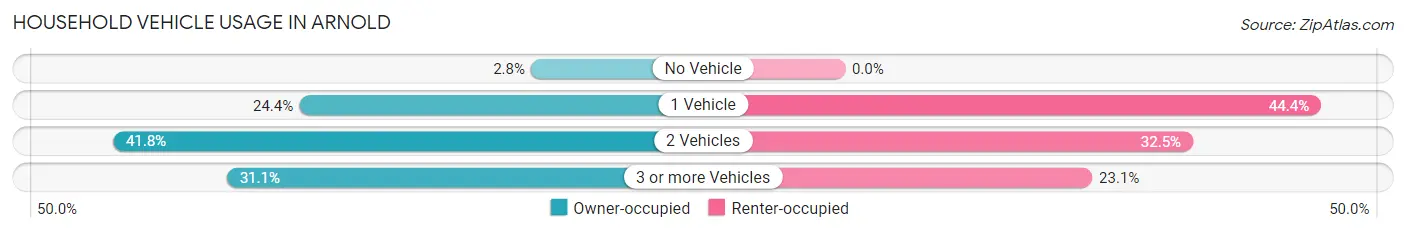
| Vehicles per Household | Owner-occupied | Renter-occupied |
| No Vehicle | 22 (2.8%) | 0 (0.0%) |
| 1 Vehicle | 195 (24.4%) | 52 (44.4%) |
| 2 Vehicles | 334 (41.7%) | 38 (32.5%) |
| 3 or more Vehicles | 249 (31.1%) | 27 (23.1%) |
| Total | 800 (100.0%) | 117 (100.0%) |
Real Estate & Mortgages in Arnold
Real Estate and Mortgage Overview in Arnold
| Characteristic | Without Mortgage | With Mortgage |
| Housing Units | 375 | 425 |
| Median Property Value | $377,000 | $474,300 |
| Median Household Income | $84,837 | $123 |
| Monthly Housing Costs | $694 | $0 |
| Real Estate Taxes | $3,061 | $0 |
Property Value by Mortgage Status in Arnold
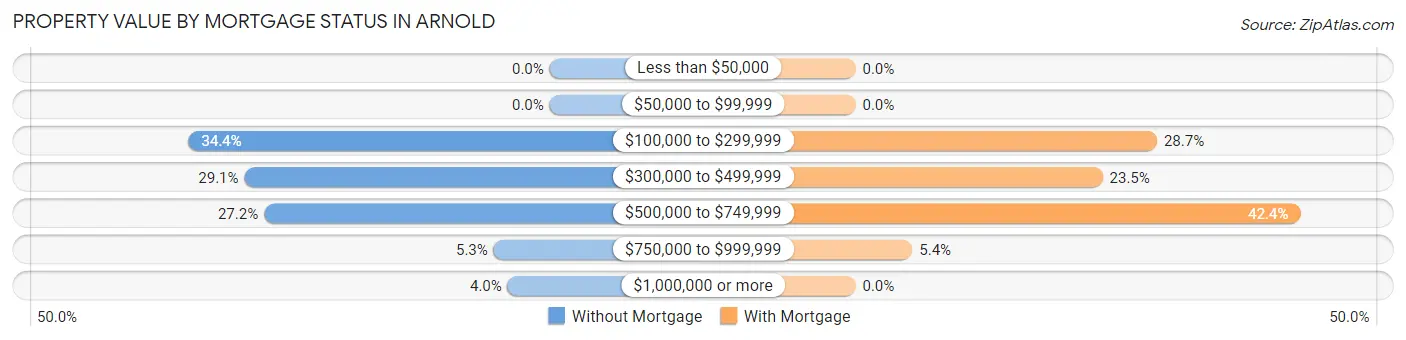
| Property Value | Without Mortgage | With Mortgage |
| Less than $50,000 | 0 (0.0%) | 0 (0.0%) |
| $50,000 to $99,999 | 0 (0.0%) | 0 (0.0%) |
| $100,000 to $299,999 | 129 (34.4%) | 122 (28.7%) |
| $300,000 to $499,999 | 109 (29.1%) | 100 (23.5%) |
| $500,000 to $749,999 | 102 (27.2%) | 180 (42.3%) |
| $750,000 to $999,999 | 20 (5.3%) | 23 (5.4%) |
| $1,000,000 or more | 15 (4.0%) | 0 (0.0%) |
| Total | 375 (100.0%) | 425 (100.0%) |
Household Income by Mortgage Status in Arnold
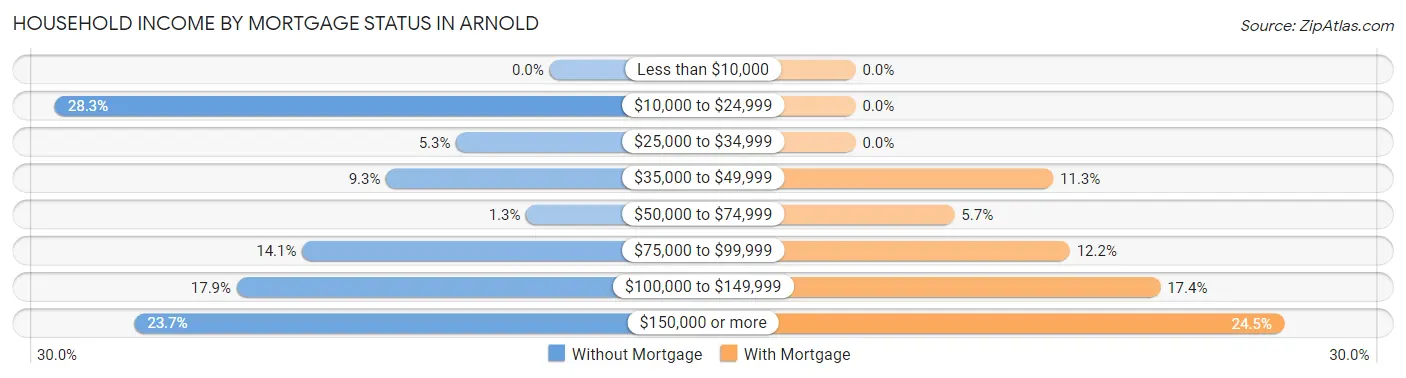
| Household Income | Without Mortgage | With Mortgage |
| Less than $10,000 | 0 (0.0%) | 0 (0.0%) |
| $10,000 to $24,999 | 106 (28.3%) | 0 (0.0%) |
| $25,000 to $34,999 | 20 (5.3%) | 0 (0.0%) |
| $35,000 to $49,999 | 35 (9.3%) | 48 (11.3%) |
| $50,000 to $74,999 | 5 (1.3%) | 24 (5.7%) |
| $75,000 to $99,999 | 53 (14.1%) | 52 (12.2%) |
| $100,000 to $149,999 | 67 (17.9%) | 74 (17.4%) |
| $150,000 or more | 89 (23.7%) | 104 (24.5%) |
| Total | 375 (100.0%) | 425 (100.0%) |
Property Value to Household Income Ratio in Arnold
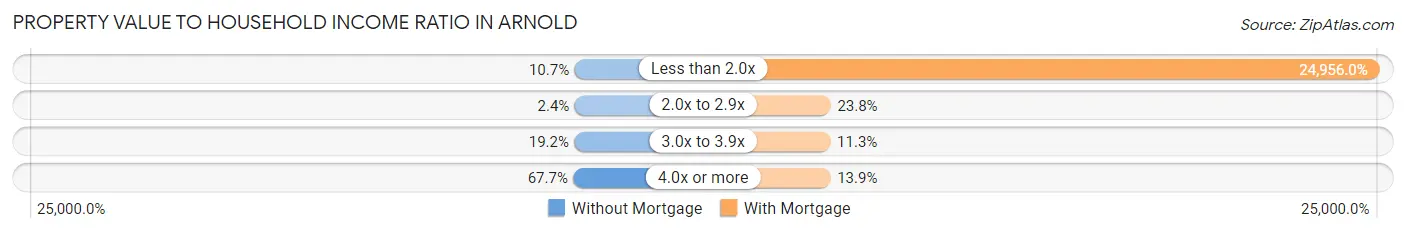
| Value-to-Income Ratio | Without Mortgage | With Mortgage |
| Less than 2.0x | 40 (10.7%) | 106,063 (24,956.0%) |
| 2.0x to 2.9x | 9 (2.4%) | 101 (23.8%) |
| 3.0x to 3.9x | 72 (19.2%) | 48 (11.3%) |
| 4.0x or more | 254 (67.7%) | 59 (13.9%) |
| Total | 375 (100.0%) | 425 (100.0%) |
Real Estate Taxes by Mortgage Status in Arnold
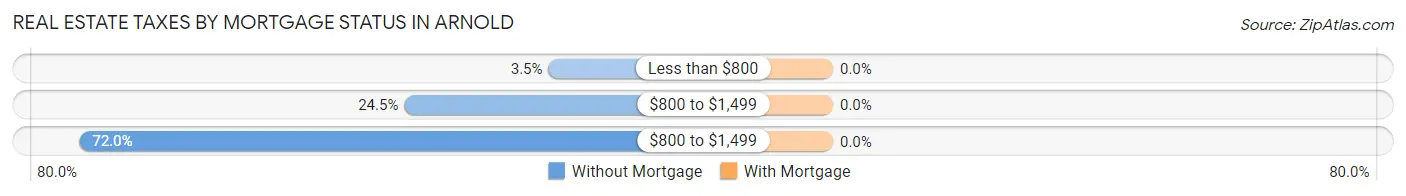
| Property Taxes | Without Mortgage | With Mortgage |
| Less than $800 | 13 (3.5%) | 0 (0.0%) |
| $800 to $1,499 | 92 (24.5%) | 0 (0.0%) |
| $800 to $1,499 | 270 (72.0%) | 0 (0.0%) |
| Total | 375 (100.0%) | 425 (100.0%) |
Health & Disability in Arnold
Health Insurance Coverage by Age in Arnold
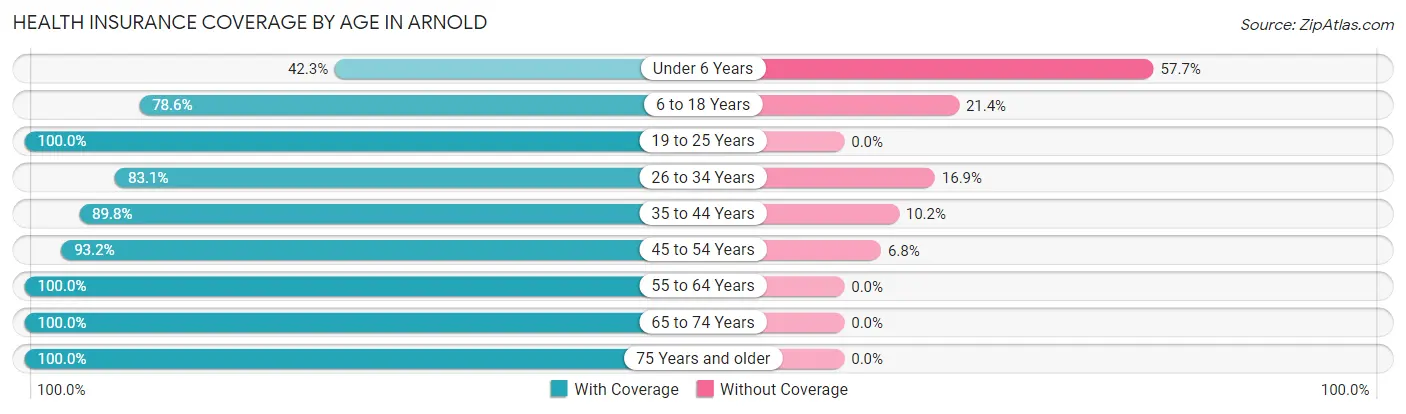
| Age Bracket | With Coverage | Without Coverage |
| Under 6 Years | 11 (42.3%) | 15 (57.7%) |
| 6 to 18 Years | 114 (78.6%) | 31 (21.4%) |
| 19 to 25 Years | 29 (100.0%) | 0 (0.0%) |
| 26 to 34 Years | 182 (83.1%) | 37 (16.9%) |
| 35 to 44 Years | 115 (89.8%) | 13 (10.2%) |
| 45 to 54 Years | 109 (93.2%) | 8 (6.8%) |
| 55 to 64 Years | 366 (100.0%) | 0 (0.0%) |
| 65 to 74 Years | 546 (100.0%) | 0 (0.0%) |
| 75 Years and older | 290 (100.0%) | 0 (0.0%) |
| Total | 1,762 (94.4%) | 104 (5.6%) |
Health Insurance Coverage by Citizenship Status in Arnold
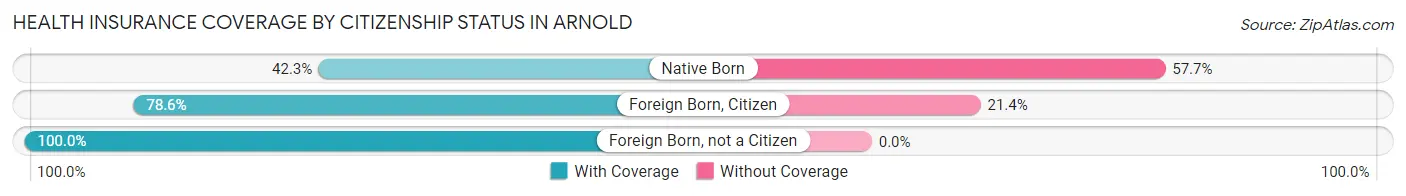
| Citizenship Status | With Coverage | Without Coverage |
| Native Born | 11 (42.3%) | 15 (57.7%) |
| Foreign Born, Citizen | 114 (78.6%) | 31 (21.4%) |
| Foreign Born, not a Citizen | 29 (100.0%) | 0 (0.0%) |
Health Insurance Coverage by Household Income in Arnold
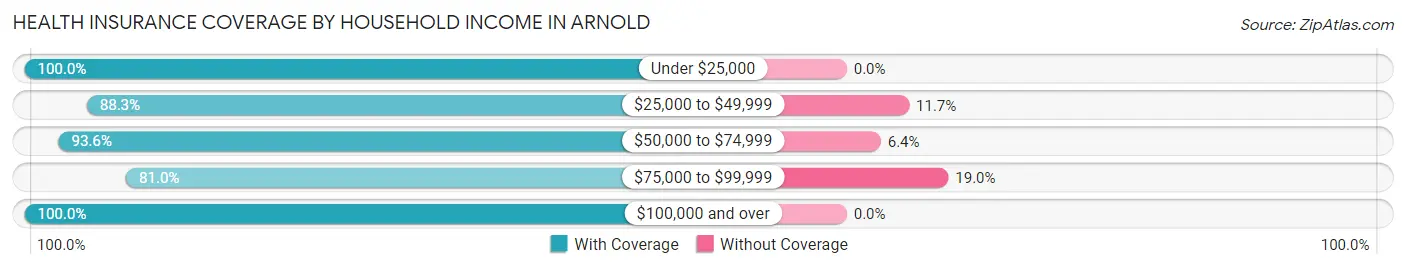
| Household Income | With Coverage | Without Coverage |
| Under $25,000 | 173 (100.0%) | 0 (0.0%) |
| $25,000 to $49,999 | 159 (88.3%) | 21 (11.7%) |
| $50,000 to $74,999 | 235 (93.6%) | 16 (6.4%) |
| $75,000 to $99,999 | 285 (81.0%) | 67 (19.0%) |
| $100,000 and over | 910 (100.0%) | 0 (0.0%) |
Public vs Private Health Insurance Coverage by Age in Arnold
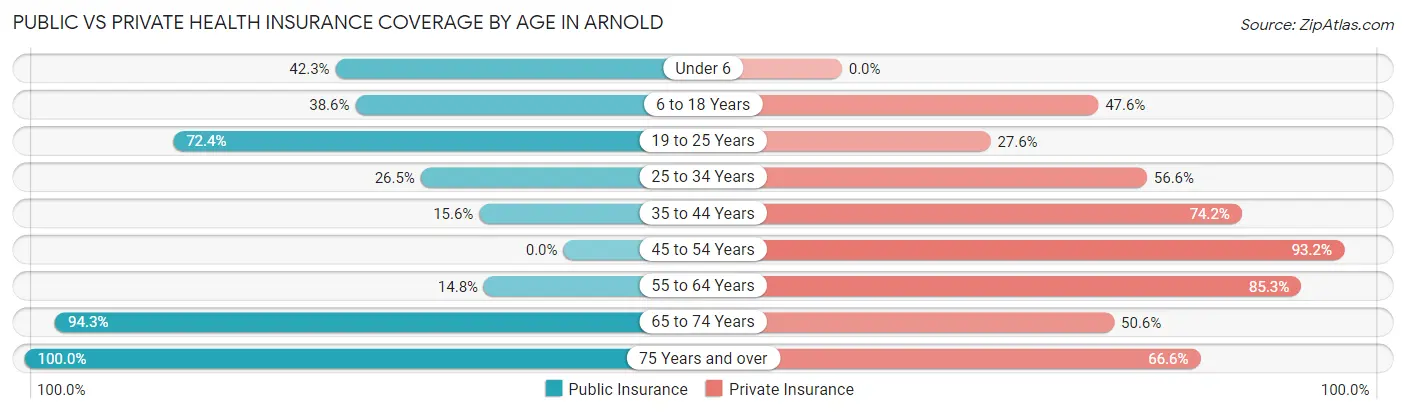
| Age Bracket | Public Insurance | Private Insurance |
| Under 6 | 11 (42.3%) | 0 (0.0%) |
| 6 to 18 Years | 56 (38.6%) | 69 (47.6%) |
| 19 to 25 Years | 21 (72.4%) | 8 (27.6%) |
| 25 to 34 Years | 58 (26.5%) | 124 (56.6%) |
| 35 to 44 Years | 20 (15.6%) | 95 (74.2%) |
| 45 to 54 Years | 0 (0.0%) | 109 (93.2%) |
| 55 to 64 Years | 54 (14.7%) | 312 (85.3%) |
| 65 to 74 Years | 515 (94.3%) | 276 (50.5%) |
| 75 Years and over | 290 (100.0%) | 193 (66.5%) |
| Total | 1,025 (54.9%) | 1,186 (63.6%) |
Disability Status by Sex by Age in Arnold
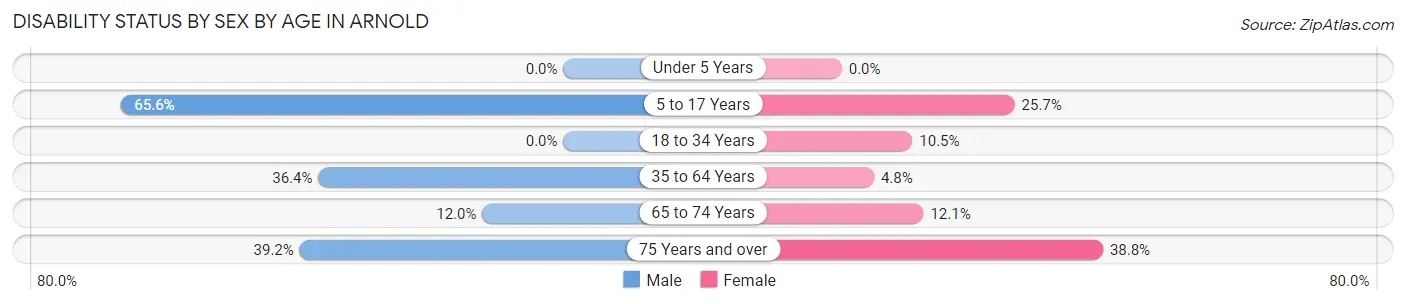
| Age Bracket | Male | Female |
| Under 5 Years | 0 (0.0%) | 0 (0.0%) |
| 5 to 17 Years | 21 (65.6%) | 29 (25.7%) |
| 18 to 34 Years | 0 (0.0%) | 13 (10.5%) |
| 35 to 64 Years | 131 (36.4%) | 12 (4.8%) |
| 65 to 74 Years | 33 (12.0%) | 33 (12.1%) |
| 75 Years and over | 56 (39.2%) | 57 (38.8%) |
Disability Class by Sex by Age in Arnold
Disability Class: Hearing Difficulty
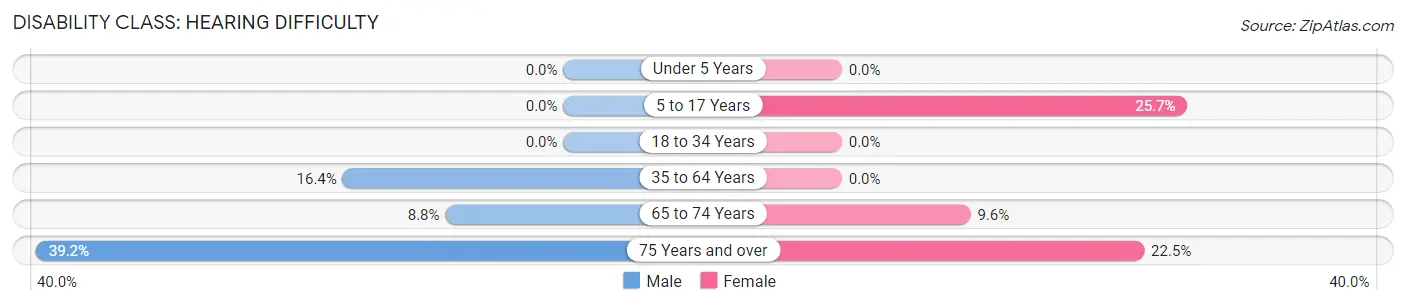
| Age Bracket | Male | Female |
| Under 5 Years | 0 (0.0%) | 0 (0.0%) |
| 5 to 17 Years | 0 (0.0%) | 29 (25.7%) |
| 18 to 34 Years | 0 (0.0%) | 0 (0.0%) |
| 35 to 64 Years | 59 (16.4%) | 0 (0.0%) |
| 65 to 74 Years | 24 (8.8%) | 26 (9.6%) |
| 75 Years and over | 56 (39.2%) | 33 (22.5%) |
Disability Class: Vision Difficulty
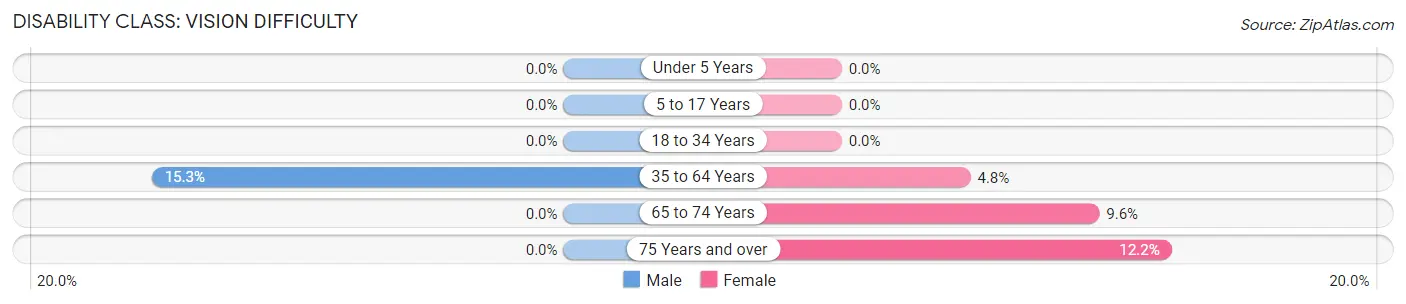
| Age Bracket | Male | Female |
| Under 5 Years | 0 (0.0%) | 0 (0.0%) |
| 5 to 17 Years | 0 (0.0%) | 0 (0.0%) |
| 18 to 34 Years | 0 (0.0%) | 0 (0.0%) |
| 35 to 64 Years | 55 (15.3%) | 12 (4.8%) |
| 65 to 74 Years | 0 (0.0%) | 26 (9.6%) |
| 75 Years and over | 0 (0.0%) | 18 (12.2%) |
Disability Class: Cognitive Difficulty
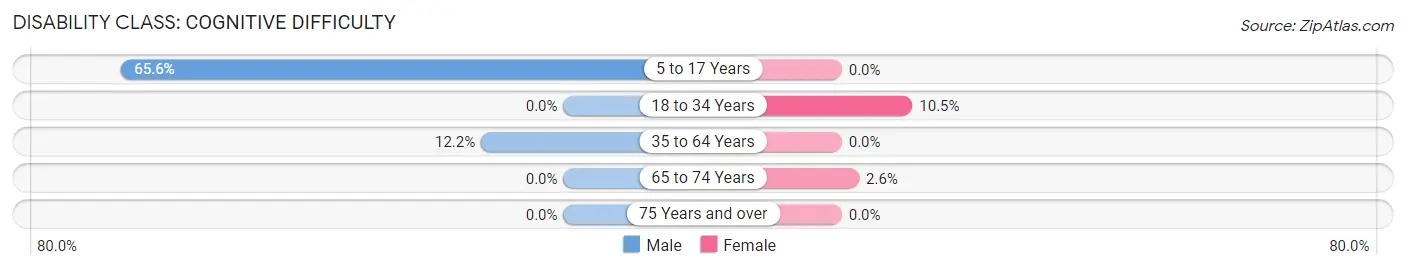
| Age Bracket | Male | Female |
| 5 to 17 Years | 21 (65.6%) | 0 (0.0%) |
| 18 to 34 Years | 0 (0.0%) | 13 (10.5%) |
| 35 to 64 Years | 44 (12.2%) | 0 (0.0%) |
| 65 to 74 Years | 0 (0.0%) | 7 (2.6%) |
| 75 Years and over | 0 (0.0%) | 0 (0.0%) |
Disability Class: Ambulatory Difficulty
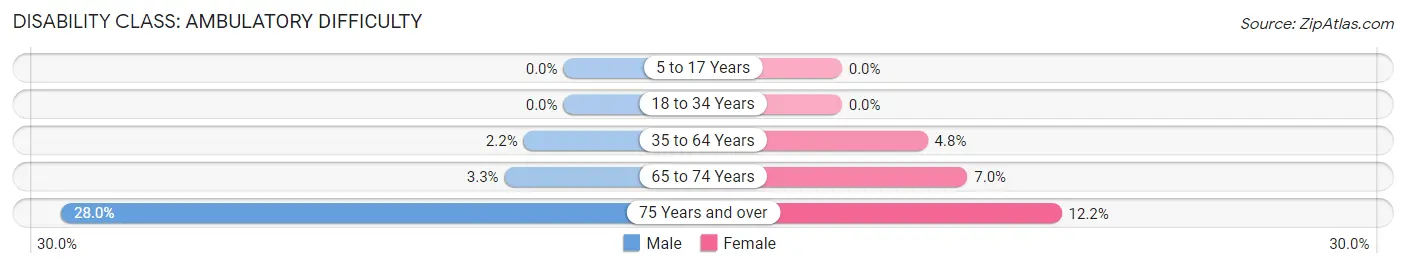
| Age Bracket | Male | Female |
| 5 to 17 Years | 0 (0.0%) | 0 (0.0%) |
| 18 to 34 Years | 0 (0.0%) | 0 (0.0%) |
| 35 to 64 Years | 8 (2.2%) | 12 (4.8%) |
| 65 to 74 Years | 9 (3.3%) | 19 (7.0%) |
| 75 Years and over | 40 (28.0%) | 18 (12.2%) |
Disability Class: Self-Care Difficulty
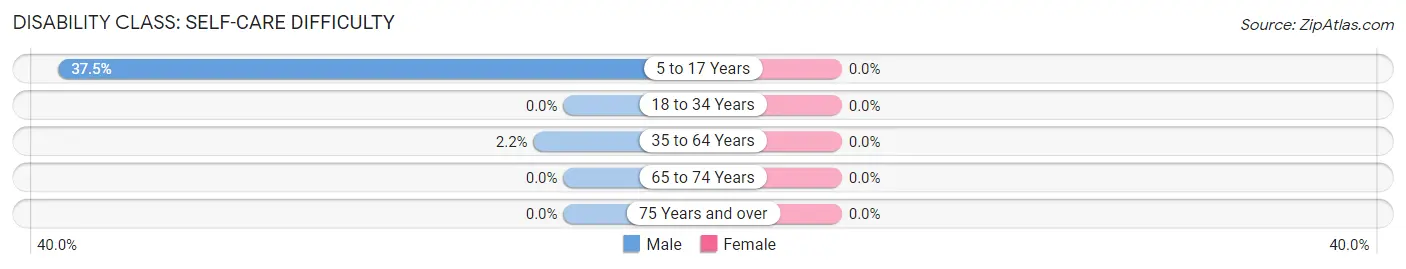
| Age Bracket | Male | Female |
| 5 to 17 Years | 12 (37.5%) | 0 (0.0%) |
| 18 to 34 Years | 0 (0.0%) | 0 (0.0%) |
| 35 to 64 Years | 8 (2.2%) | 0 (0.0%) |
| 65 to 74 Years | 0 (0.0%) | 0 (0.0%) |
| 75 Years and over | 0 (0.0%) | 0 (0.0%) |
Technology Access in Arnold
Computing Device Access in Arnold
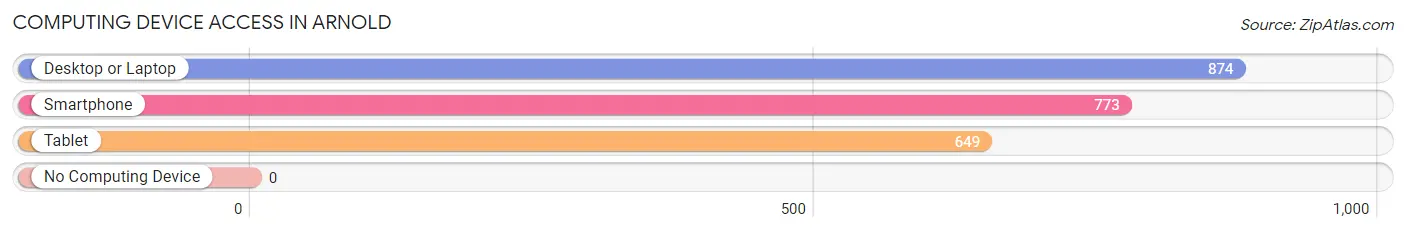
| Device Type | # Households | % Households |
| Desktop or Laptop | 874 | 95.3% |
| Smartphone | 773 | 84.3% |
| Tablet | 649 | 70.8% |
| No Computing Device | 0 | 0.0% |
| Total | 917 | 100.0% |
Internet Access in Arnold
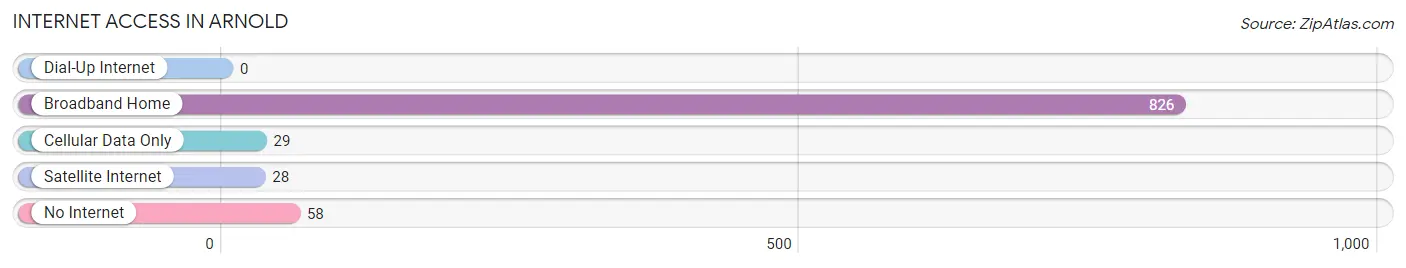
| Internet Type | # Households | % Households |
| Dial-Up Internet | 0 | 0.0% |
| Broadband Home | 826 | 90.1% |
| Cellular Data Only | 29 | 3.2% |
| Satellite Internet | 28 | 3.0% |
| No Internet | 58 | 6.3% |
| Total | 917 | 100.0% |
Arnold Summary
Arnold is a small town located in Calaveras County, California, United States. It is situated in the Sierra Nevada foothills, approximately halfway between the cities of Sacramento and South Lake Tahoe. The town is named after Bob and Bessie Arnold, who founded the town in the late 1800s. Arnold is a popular tourist destination, known for its outdoor recreation opportunities, including hiking, fishing, camping, and skiing.
Geography
Arnold is located in the Sierra Nevada foothills, at an elevation of 2,000 feet (610 m). The town is situated in a valley surrounded by the Mokelumne River to the north, the Stanislaus River to the east, and the Calaveras River to the south. The town is located approximately halfway between the cities of Sacramento and South Lake Tahoe.
The climate in Arnold is mild, with warm summers and cool winters. The average high temperature in the summer is around 85°F (29°C), and the average low temperature in the winter is around 35°F (2°C). The area receives an average of 30 inches (76 cm) of precipitation per year, with most of it falling in the winter months.
Economy
The economy of Arnold is largely based on tourism. The town is a popular destination for outdoor recreation, including hiking, fishing, camping, and skiing. The town is also home to several restaurants, bars, and shops.
The town is also home to several businesses, including a lumber mill, a sawmill, and a furniture factory. The town is also home to a number of small businesses, including a bakery, a grocery store, and a hardware store.
Demographics
As of the 2010 census, the population of Arnold was 1,843. The racial makeup of the town was 91.3% White, 0.7% African American, 0.7% Native American, 0.7% Asian, 0.2% Pacific Islander, 4.2% from other races, and 2.1% from two or more races. Hispanic or Latino of any race were 8.3% of the population.
The median household income in Arnold was $45,000, and the median family income was $50,000. The per capita income for the town was $22,000. About 11.3% of families and 14.2% of the population were below the poverty line, including 18.2% of those under age 18 and 8.3% of those age 65 or over.
Arnold is served by the Calaveras Unified School District. The town is home to one elementary school, one middle school, and one high school. The town is also home to a branch of the Calaveras County Library.
Common Questions
What is Per Capita Income in Arnold?
Per Capita income in Arnold is $63,386.
What is the Median Family Income in Arnold?
Median Family Income in Arnold is $107,500.
What is the Median Household income in Arnold?
Median Household Income in Arnold is $93,047.
What is Income or Wage Gap in Arnold?
Income or Wage Gap in Arnold is 15.1%.
Women in Arnold earn 84.9 cents for every dollar earned by a man.
What is Inequality or Gini Index in Arnold?
Inequality or Gini Index in Arnold is 0.49.
What is the Total Population of Arnold?
Total Population of Arnold is 1,866.
What is the Total Male Population of Arnold?
Total Male Population of Arnold is 948.
What is the Total Female Population of Arnold?
Total Female Population of Arnold is 918.
What is the Ratio of Males per 100 Females in Arnold?
There are 103.27 Males per 100 Females in Arnold.
What is the Ratio of Females per 100 Males in Arnold?
There are 96.84 Females per 100 Males in Arnold.
What is the Median Population Age in Arnold?
Median Population Age in Arnold is 61.8 Years.
What is the Average Family Size in Arnold
Average Family Size in Arnold is 2.5 People.
What is the Average Household Size in Arnold
Average Household Size in Arnold is 2.0 People.
How Large is the Labor Force in Arnold?
There are 793 People in the Labor Forcein in Arnold.
What is the Percentage of People in the Labor Force in Arnold?
46.8% of People are in the Labor Force in Arnold.
What is the Unemployment Rate in Arnold?
Unemployment Rate in Arnold is 4.9%.